Closeout Letter V2.1
9
80 Calvert Street P.O. Box 466 • Annapolis, Maryland 21404-0466 • 410-260-7450 • Fax: 410-974-5221 MRS 711 (MD) or 1-800-735-2258 • TTY 410-260-7157 • [email protected] Peter Franchot Comptroller Andrew Schaufele Director Bureau of Revenue Estimates September 29, 2021 To: Honorable Peter Franchot Honorable Nancy K. Kopp Secretary David R. Brinkley From: Andrew Schaufele Director, Bureau of Revenue Estimates Subject: Fiscal Year 2021 Revenues General Fund (GF) revenues in Fiscal Year (FY) 2021 totaled $20.831 billion, an increase of 11.8% over FY 2020, and 8.9%, or $1.711 billion, above the estimate. Excluding irregular distributions and transfers, revenues increased 9.9% from FY 2020. Key Variances ($ in Millions) Item Dollar Variance $ Variance Rank Percent Variance % Variance Rank Total General Fund 1,711.2 NA 8.9% NA Personal Income Tax 902.8 1 8.4% 10 Sales and Use Tax 396.9 2 8.6% 9 Corporate Income Tax 323.1 3 28.4% 5 The unprecedented federal fiscal stimulus coupled with State measures, in response to the COVID-19 pandemic, had a far greater positive impact on State tax revenues than initially anticipated o Federal legislative action has disbursed $4.7 trillion to-date of an allowed $5.9 trillion – the bulk of these funds are deficit financed o Federal Reserve actions shored up short-term lending markets, but also supported asset markets by purchasing $3.5 trillion in long-term U.S. Treasuries and Mortgage Backed Securities through increases in the money supply Personal Income Tax (PIT) o PIT collections increased 9.4% over FY 2020, driven by: Better than expected results for tax year 2020 (significant money in FY21) Estimated to have grown 7.3% despite record job losses
Transcript of Closeout Letter V2.1

80 Calvert Street P.O. Box 466 • Annapolis, Maryland 21404-0466 • 410-260-7450 • Fax: 410-974-5221 MRS 711 (MD) or 1-800-735-2258 • TTY 410-260-7157 • [email protected]
Peter Franchot Comptroller
Andrew Schaufele Director Bureau of Revenue Estimates
September 29, 2021 To: Honorable Peter Franchot Honorable Nancy K. Kopp Secretary David R. Brinkley From: Andrew Schaufele Director, Bureau of Revenue Estimates Subject: Fiscal Year 2021 Revenues
General Fund (GF) revenues in Fiscal Year (FY) 2021 totaled $20.831 billion, an
increase of 11.8% over FY 2020, and 8.9%, or $1.711 billion, above the estimate. Excluding irregular distributions and transfers, revenues increased 9.9% from FY 2020.
Key Variances ($ in Millions)
Item Dollar
Variance $ Variance
Rank Percent
Variance % Variance
Rank Total General Fund 1,711.2 NA 8.9% NA Personal Income Tax 902.8 1 8.4% 10 Sales and Use Tax 396.9 2 8.6% 9 Corporate Income Tax 323.1 3 28.4% 5
The unprecedented federal fiscal stimulus coupled with State measures, in response to the COVID-19 pandemic, had a far greater positive impact on State tax revenues than initially anticipated
o Federal legislative action has disbursed $4.7 trillion to-date of an allowed $5.9 trillion – the bulk of these funds are deficit financed
o Federal Reserve actions shored up short-term lending markets, but also supported asset markets by purchasing $3.5 trillion in long-term U.S. Treasuries and Mortgage Backed Securities through increases in the money supply
Personal Income Tax (PIT) o PIT collections increased 9.4% over FY 2020, driven by:
Better than expected results for tax year 2020 (significant money in FY21) Estimated to have grown 7.3% despite record job losses

Letter to Honorable Peter Franchot, Nancy K. Kopp, and David R. Brinkley September 29, 2021 Page 2
Indicates that business income and capital gains income were very significant
Wage gains, in the form of bonuses as well as pay raises, seem evident in early calendar year 2021
Sales and Use Tax (SUT) o GF SUT collections increased 7.6% over FY 2020 o SUT revenue dedicated to the Blueprint fund was also significant, totaling $423.3
million o Total SUT gross receipts increased a remarkable 10.1% over FY 2020 o Bolstered by:
Strong income growth during the pandemic in the form of economic activity as well as federal stimulus
Expansions of the SUT base including the taxation of marketplace facilitators and some digital goods
Corporate Income Tax (CIT) o GF CIT collections increased 39.0% over FY 2020 o Corporate profits data indicates a tremendous acceleration in profits growth
following the trough in the second quarter of 2020 o Since the onset of the pandemic, corporations in the aggregate, particularly large
corporations, have been able to increase revenue through federally enhanced consumer spending while simultaneously reducing their expenses
The Big Picture – Ongoing Revenue Impacts after Federal Stimulus
With the conclusion of fiscal year 2021, we find ourselves at a tremendously high level of revenue. This new higher level seems likely to be sustained in the near-term, perhaps in the long-term, albeit likely with some bumps along the way. But, as the old adage says: when something seems too good, it likely is (in economics, we say “there is no free lunch”) – we must remain cautious in light of our current optimism. These are unprecedented times with unprecedented fiscal and monetary policy responses and a deadly virus that is continuously evolving. We have a consumer dominated economy and consumers have been living by a new set of norms, and much like the virus, those norms are likely to change again.
We find ourselves in this position principally due to the unprecedented economic intervention from the federal government. Federal policy embraced deficit spending in order to sustain incomes throughout the pandemic, ensuring that all citizens could still afford the necessities throughout the pandemic – a proper use of debt. The Federal Reserve sustained capital markets with a quantitative easing program similar to those used in the Great Recession. The private sector, emboldened and secured by the federal response, adapted by innovating and retooling so that economic activity could continue, perhaps finding themselves more efficient than previously.
Letter to Honorable Peter Franchot, Nancy K. Kopp, and David R. Brinkley September 29, 2021 Page 3
Another adage – a rising tide lifts all boats – is certainly revealed in this closeout. The federal intervention of more than $8.2 trillion has bolstered incomes and spending across the wealth spectrum. That is money that will continue to circulate throughout the economy. That said, large sums of this money have yet to fully circulate; a lack of spending options coupled with consumer tepidness and income growth have increased savings rates to record highs. Reasonable estimates put the sum of savings since the pandemic’s onset that is above historical levels at an astounding $2.4 trillion. Between the ongoing impacts of the virus and the continued consumer response, we have not yet seen the full COVID-19 economic story play out.
All of this leads to the conclusion that we will have sustained levels of income and spending into the near future. What remains uncertain: (1) the economic impact from heightened levels of federal debt; (2) the sustainability of very high valuations in capital markets; (3) the nature of recent inflation, transitory versus persistent; (4) the next phase of the virus’s natural course; and (5) the unknown unknowns.
Addressing the above risks in order:
1. Economic theory holds that increased federal debt levels will crowd out other forms of productive investment, therefore reducing long-run economic growth rates – I anticipate that this will be built into our long-term forecast
2. The S&P500 has been bolstered by higher expected profits due to the fiscal stimulus as well as improved efficiency. Early in the pandemic, the S&P 500 fell 34% in late March relative to its pre-pandemic high point in February. The index stood at 11% higher than that peak at the end of 2020 and is now 32% higher. To put that in context, the top 500 publicly listed companies are valued a third higher now than they were pre-pandemic. Perhaps these valuations are accurate; to-date most companies have been hitting or exceeding their profit expectations, but it must be noted that capital gains income is now contributing more than a billion dollars to State coffers per year and those revenues are exceptionally volatile and quick to change
3. Recent inflation figures are largely due to transitory factors, namely supply-side constraints, as well as comparisons to abnormally low comparison periods. These factors are likely to continue in the near-term although they are also likely to shift between industries over time. There are signs of increased wage growth, which also feeds into inflation figures. The supply chain constraints are likely to abate as the supply chain heals from the pandemic, but the wage growth will likely continue. Should inflation prove more persistent, the Federal Reserve has the tools to tamp it down, though it would also tamp down

Letter to Honorable Peter Franchot, Nancy K. Kopp, and David R. Brinkley September 29, 2021 Page 4
economic output. At this point, inflation seems on track with the Federal Reserve’s target, but this should still be considered a high-level risk
4. The COVID-19 virus has evolved several times, most notably with the ubiquitous Delta variant. The virus is likely to continue to evolve as it struggles to survive. Our response has proven strong, the vaccines work with great efficacy. However, we do not know the future trajectory and therefore we must keep the virus as a high-level risk
Additionally, it must be noted that throughout this document I discuss positive outcomes in the aggregate. It is aggregate income and spending that drives tax revenue. As we have noted throughout the estimates process, many Marylanders and many Maryland firms have faced significant losses and many continue to experience difficult circumstances.
Personal Income Tax (PIT)
The State collected $11.7 billion from the PIT in FY 2021, an increase of 9.4% from the prior year and $902.8 million more than estimated. The results and variance can be traced to activity from 2020 as well as more current conditions.
Tax year 2020 was a volatile year for income and expectations for economic growth. Early in the tax year, as the reality of the pandemic set in and the economy was largely closed for several months, expectations for income growth were dire. As the federal response was initiated and it became clear that it was effective, prospects improved. Capital markets recovered, even exceeding pre-pandemic levels by the end of the year. The initial job losses – Maryland lost 15% of its jobs in the early months of the pandemic – were largely recovered as private sector industries not directly impacted found ways to continue to conduct business. At the end of the year, Maryland was still short 5% of jobs relative to pre-pandemic. We learned that those jobs tended to be lower wage positions and therefore had a relatively lower impact on revenues.
While the tax year is not yet complete (returns are due October 15th), we feel confident in our estimate that tax year 2020 income tax collections increased 7.3% from tax year 2019; truly remarkable given the start of the year. Much of the variance for the fiscal year is attributable to payments that were received at the end of the fiscal year due to an extended due date (traditionally due by April 15th) – this is often correlated with high capital gains. Additionally, refunds were less than forecast. Refunds were likely reduced due to higher income than taxpayers expected. Taxpayers also took far less in earned income credits than we expected. Federal law permitted taxpayers to use their 2019 sources of earned income to calculate their

Letter to Honorable Peter Franchot, Nancy K. Kopp, and David R. Brinkley September 29, 2021 Page 5 credit value – a large fiscal stimulus for workers that were likely impacted by the pandemic – however, we found that at least half of qualifying taxpayers did not take advantage.
More recently, income tax withholding tied to 2021 activity has accelerated. We have found that taxpayers likely benefited from bonuses paid out in March of 2021 (a common bonus month) and are likely seeing wage gains. Some of these gains are likely inflationary in nature, but this might also prove transitory – there is a supply issue related to skilled work, and to some degree unskilled work. Unlike commodities, wage gains tend to stick, therefore we should expect the inflationary aspects of recent wage gains to carry forward.
Estimated payments growth has been strong so far for tax year 2021 as well. A component of this is the comparison to weak periods; through the first three quarters of 2020 very few taxpayers expected income growth. We are also benefitting from a recent law change that enabled pass-through business entities to remit tax on behalf of their resident members. This should serve to bring more business income tax payments into estimated payments versus extension payments at the April 15th due date.
Sales and Use Tax (SUT)
$4.988 billion in GF revenue was collected by the SUT in FY 2021, 8.6% above the estimate. This corresponds to an increase in revenue of 7.6% from FY 2020, following a decline of 3.7% in FY 2020. Consumption spending held up well over the pandemic primarily due to federal stimulus. Most directly, this took the form of checks sent to individuals. More broadly, government transfers to, or spent on behalf of, Maryland residents grew 21.7% in FY 2021, on top of 23.5% growth in FY 2020. As a result, consumers in the aggregate were able to maintain consumption spending and increase savings. The personal savings rate has been elevated throughout the pandemic, with local peaks around stimulus payments. It recently returned to more normal levels. This means the stock of savings is significantly higher than it was pre-pandemic. Savings are likely to remain elevated over the pandemic, as a reaction to uncertainty and risk, but consumers (again, in the aggregate) have significant savings to draw down and maintain consumption going forward without additional stimulus.

Letter to Honorable Peter Franchot, Nancy K. Kopp, and David R. Brinkley September 29, 2021 Page 6
Over the course of the pandemic, consumers shifted spending in three significant ways: away from recreational or leisure activities and towards necessities such as unprepared food; away from services and towards goods, primarily durable goods; and away from physical stores and towards online retailers. The SUT has exemptions for goods considered to be necessities with the intention of reducing the regressive nature of flat consumption taxes. The SUT also primarily taxes goods and not services, and tax collected from online retailers without a physical presence in Maryland is sent to the Blueprint Fund and not the GF. All else equal, the shift to necessities reduces SUT revenue, the shift to durable goods increases revenue, and the shift to online retailing means more SUT revenue goes to the Blueprint Fund.
Revenue from remote sellers was $523.3 million in FY 2021, with $100.0 million going to the GF and the remainder going to the Blueprint Fund. Absent the taxation of remote sellers, marketplace facilitators, and digital goods, the State would have forgone considerable amounts of revenue during FY 2021.
Letter to Honorable Peter Franchot, Nancy K. Kopp, and David R. Brinkley September 29, 2021 Page 7 Corporate Income Tax (CIT)
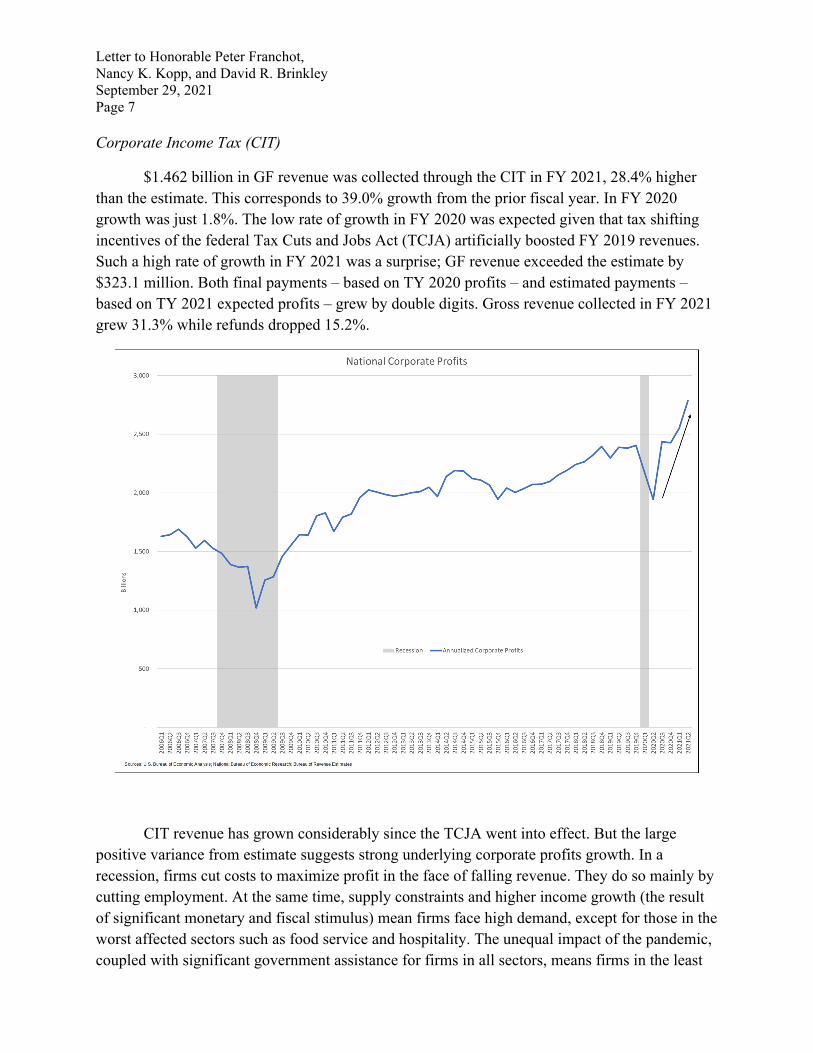
$1.462 billion in GF revenue was collected through the CIT in FY 2021, 28.4% higher than the estimate. This corresponds to 39.0% growth from the prior fiscal year. In FY 2020 growth was just 1.8%. The low rate of growth in FY 2020 was expected given that tax shifting incentives of the federal Tax Cuts and Jobs Act (TCJA) artificially boosted FY 2019 revenues. Such a high rate of growth in FY 2021 was a surprise; GF revenue exceeded the estimate by $323.1 million. Both final payments – based on TY 2020 profits – and estimated payments – based on TY 2021 expected profits – grew by double digits. Gross revenue collected in FY 2021 grew 31.3% while refunds dropped 15.2%.
CIT revenue has grown considerably since the TCJA went into effect. But the large positive variance from estimate suggests strong underlying corporate profits growth. In a recession, firms cut costs to maximize profit in the face of falling revenue. They do so mainly by cutting employment. At the same time, supply constraints and higher income growth (the result of significant monetary and fiscal stimulus) mean firms face high demand, except for those in the worst affected sectors such as food service and hospitality. The unequal impact of the pandemic, coupled with significant government assistance for firms in all sectors, means firms in the least

Letter to Honorable Peter Franchot, Nancy K. Kopp, and David R. Brinkley September 29, 2021 Page 8 affected sectors have done very well. Firms in those sectors, such as professional business services, typically have higher profit margins. Additionally, the International Monetary Fund finds that competition among producers in most industries is declining over time. As competition decreases firms receive more profit by producing less at a higher real price than they would in a more competitive market. This is a structural factor that changes gradually over time but can help explain profits growing faster than aggregate income.

Actual and Estimated General Fund RevenueFiscal Year 2021
Fiscal Year 2021 Fiscal Year 2020 Growth FY 20 - FY 21Difference from Estimate
Actual Estimated 1 $ % Actual $ %INCOME TAXES
Individual 11,704,777,161 10,801,954,768 902,822,393 8.4% 10,698,874,684 1,005,902,476 9.4%
Corporation 1,461,892,592 1,138,780,996 323,111,596 28.4% 1,051,808,219 410,084,373 39.0%
Total 13,166,669,752 11,940,735,764 1,225,933,989 10.3% 11,750,682,903 1,415,986,849 12.1%
SALES AND USE TAXES 4,988,077,776 4,591,207,333 396,870,443 8.6% 4,634,873,635 353,204,141 7.6%
STATE LOTTERY RECEIPTS 631,718,854 626,933,824 4,785,030 0.8% 548,511,872 83,206,982 15.2%
OTHER REVENUESBusiness Franchise Taxes 210,510,209 208,501,929 2,008,280 1.0% 211,258,765 (748,555) -0.4%
Insurance Premium Tax 358,070,541 406,124,022 (48,053,481) -11.8% 395,851,096 (37,780,555) -9.5%
Estate and Inheritance Taxes 240,592,073 177,731,865 62,860,207 35.4% 197,174,594 43,417,478 22.0%
Tobacco Taxes 388,260,529 373,418,522 14,842,007 4.0% 362,911,842 25,348,688 7.0%
Alcoholic Beverages Excises 39,721,900 30,544,963 9,176,937 30.0% 30,208,980 9,512,920 31.5%
District Courts 35,191,437 30,487,514 4,703,923 15.4% 47,675,980 (12,484,543) -26.2%
Clerks of Court 36,096,166 32,283,398 3,812,768 11.8% 29,296,097 6,800,069 23.2%
Hospital Patient Recoveries 64,753,615 49,384,948 15,368,667 31.1% 60,565,828 4,187,788 6.9%
Interest on Investments 12,297,405 8,800,000 3,497,405 39.7% 46,797,602 (34,500,197) -73.7%
Miscellaneous 300,450,570 302,476,544 (2,025,973) -0.7% 318,296,284 (17,845,713) -5.6%
Total 1,685,944,446 1,619,753,705 66,190,740 4.1% 1,700,037,067 (14,092,621) -0.8%
TOTAL CURRENT REVENUES 20,472,410,828 18,778,630,625 1,693,780,202 9.0% 18,634,105,476 1,838,305,352 9.9%
Extraordinary Revenues 2 358,603,137 341,166,648 17,436,489 5.1% - 358,603,137 #N/A
GRAND TOTAL 20,831,013,964 19,119,797,273 1,711,216,691 8.9% 18,634,105,476 2,196,908,488 11.8%
1 The 2021 Legislative Session resulted in an additional $346.9 million in estimated revenues beyond the March 2021 official estimate; this table has been adjusted accordingly
Bureau of Revenue Estimates, September 29, 2021
2 Extraordinary revenues includes: (a) $341,446,827 is the FEMA reimbursement as included in the budget and outlined in the FY 2022 Fiscal Digest (b) $17,156,310 is attributable to a payment to the General Fund from the Maryland Technology Development Corporation (TEDCO)