CLOSED-LOOP MOTOR CONTROL, LIFE-CYCLE ANALYSIS AND ...
18
ECE 4950: Senior Design I CLOSED-LOOP MOTOR CONTROL, LIFE-CYCLE ANALYSIS AND EMPLOYEE TRAINING PROGRAM November 19, 2020 Online Team 4: KAGED Erik Cartledge, Austin Elrod, Griffin Dube, Derrick Souza, Kyle Streseman Executive Summary This project focuses on understanding both the life cycle of an engineer’s education and the life cycle of an engineering project. The following are the goals to be achieved in this project: • Implement closed-loop control and simulate a position control experiment to gain experience. • After simulating, implement the real motor. • Complete a ”Life Cycle Assessment” (LCA) for the project, and gain understanding of what possible environmental or economical affects it may have. • Develop an employee training program tailored to differing archetypes of engineer that may work for the company. • Assess the safety of the project by performing a DFMEA with help from a risk assessment matrix.
Transcript of CLOSED-LOOP MOTOR CONTROL, LIFE-CYCLE ANALYSIS AND ...

ECE 4950: Senior Design I
CLOSED-LOOP MOTOR CONTROL,
LIFE-CYCLE ANALYSIS AND EMPLOYEE
TRAINING PROGRAM
November 19, 2020
Online Team 4: KAGEDErik Cartledge, Austin Elrod, Griffin Dube, Derrick Souza, Kyle Streseman
Executive SummaryThis project focuses on understanding both the life cycle of an engineer’s
education and the life cycle of an engineering project. The following are thegoals to be achieved in this project:
• Implement closed-loop control and simulate a position control experimentto gain experience.
• After simulating, implement the real motor.
• Complete a ”Life Cycle Assessment” (LCA) for the project, and gainunderstanding of what possible environmental or economical affects itmay have.
• Develop an employee training program tailored to differing archetypesof engineer that may work for the company.
• Assess the safety of the project by performing a DFMEA with help froma risk assessment matrix.

1 Engineering Requirements for the Motor Control Subsystem
CustomerRequirement
Engineering Requirements Testing Phase
ClockHandMobility
Clock Hand must have degrees offreedom from the placement on theshaft so that the hand can point toany position on the game when theshaft spins.
Rotate the clock hand 360 degreesand use the two-dimensional coor-dinate plane to test which axis canmove freely.
Motor Loop Con-trolled Subsystem
The motor should have code of itsown to allow private functionality us-ing real time response to the motionstarting from the team’s choice.
Matlab can test separate parts of thegame by sectioning off the code torun once at a time to verify eachsubsystem works correctly indepen-dently.
ShaftMechanization
Upon selection, the mounted armwill turn (clockwise/counterclock-wise is up to the discretion of thesystem designers) and in one smoothmotion come to rest at the centroidof the required color.
Code from Matlab can determinewhether to move positive sequenceor negative sequence. Also notinghow fast the shaft will move untilthe shaft stops at the correct colorfrom the user interface.
Efficient The sticker colors and positions onthe game board will have been pro-cessed using the game state sensorand Matlab image processing.
The sensor should have color de-tection from the camera to makesure the right color was processedthrough the image using guided pa-rameters from the team.
User-Friendly A sticker color will be chosen by theuser in Matlab either from a com-mand prompt, a menu or a GUI con-sisting of at least simple push but-tons or something similar.
The current code will allow the userto pick from the list of colors givenand the collected responses shouldkeep a tab in order of those pickedcolors.
Productivity The quality of the user interface andmounted arm motion (directly corre-lated to motor control) will be usedto judge the implementation.
A clock timer can time how fast themover responds to the code as theuser inputs the parameters to com-pare to real time.
Color ProximityDetection
In the case of multiple stickers of thesame color, the mounted arm mustcome to rest at the closest chosencolored sticker.
A conditional statement will be writ-ten to ensure that in the instancemultiple colors come up that thefirst available color will be pickedfirst based off of its proximity to theshaft.
Game Reset afterTask
Additionally, the system should alsobe able to come back to the referenceposition upon completion of the task.
Once task is completed, system willbe restored to the reference positionand wait for further input.
Table 1: Engineering requirements for Motor Subsystem
2

2 Overview of Hardware-in-the-Loop
Hardware-in-the-Loop (HIL) testing is a method in which a system’s controller is con-nected to a simulated test system, which allows a large amounts of inputs to be testedwithout the need for actual physical tests on the system. A full simulation does notcontain the benefits of real-time IO and control like the HIL simulation does. Also, whenthe engineer is ready to run tests on the actual system, it is simply connected to thecontroller by being swapped out for the simulated system. This allows the designer ofthe system to easily test values such as gains, providing a safe, easy, less time consumingway for a system to be tested and tuned. An additional benefit is safety. With HILtesting, tuning can be taken care of in the simulation. This allows the user to properlytune and reduces the risk of injury or failure when testing the actual system. Furtherbenefits include the speed at which tests can be run. Since changing values in software isnot very time consuming, a larger amount of test cases can be run in a shorter periodof time. These benefits all display the usefulness of HIL. Especially when working withcomplex systems, running tests using simulations can reduce costs and improve safety!
3 Document Hardware
For this project we use the provided game board, and we attach to the center a DFROBOT12V DC Motor 251 RPM with Encoder (FIT0186). The motor pinout is shown in Figure 1.
Figure 1: DC Motor Pinout
The motor is connected to the L293DNEMotor Driver IC and our Arduino as shownin Figure 3. The output from Arduino pins30 and 31 are sent to the IN1 and IN2 pinson the L293DNE and then connected tothe motor +/- pins to drive it. The en-able value comes from Arduino pin 5 anddetermines which direction the motor willturn. Power and ground are connected totheir respective pins and to the 5V powersource and GND on the Arduino respec-tively. Lastly, pins 5 and 6 from the motorare connected to Arduino pins 2 and 3 inorder to provide interrupts when the motor is approaching its desired position, or if itovershoots the target. The diodes included in the circuit help protect our componentsfrom any damage that could potentially be caused by our motor.
This work is all connected to the camera subsystem as shown in Figure 2.
3

Figure 2: Image feed dimensionsFigure 3: Wiring Diagram for Project 3
The resolution of the webcam is 640x480 and with the game board located 14.5 inchesfrom the camera, we have a functional area of 14 inches by 11 inches. This results in thefollowing calculations:
640 px
14 in.= 45
px
in.(1)
480 px
11 in.= 44
px
in.(2)
307, 200 px
14 in.× 11 in.= 1, 994
px
in.2(3)
As Equations (1 - 3) and Figure 5 show, the video captured by the webcam result in1,994 pixels per square inch on the game board. This means that one pixel will represent5.01 × 10−4 square inches in the image. That provides more than sufficient resolution forthe image processing task at hand. However, if our camera resolution were improved, itwould create a much more effective sensor for image processing.
Figure 4: Physical Board Setup
Figure 5: Total Assembly
4
4 Document Software
Our software organization is largely similar to that of project two for image detection.This workflow is ported to the Matlab App Designer in order to provide a GUI for easeof access to users. Additionally, we have added in code necessary to control the simulinkmotor model which moves the motor shaft position to the correct dot location. Thisworkflow is largely shown in Figure 6.
Figure 6: Basic software workflow.
We begin by capturing the background image to be used in background subtractionfor image recognition. Once this is completed, we then allow the user to select colorsfrom four push-buttons (Red, Green, Yellow, Blue) to add to a queue of colors to detect.Upon selecting the ’Run’ button, the software works through image detection as shownin Figure 6, then finally moves the motor arm into position. Upon completion of thetask, our motor will return to it’s original reference position (the 12 o’clock position).
4.1 Description of Software Workflow and Interface with Motor
As mentioned previously, our software follows the basic flow of Figure 5. Once an imageis captured from the video feed, the background is removed, then the remaining image iscleaned through the erosion and dilation process described in Project Two documentation.These cleaned images are used to generate color masks for each of the possible colors.The properties of these color masks are determined the Matlab regionprops() function,and the centroid of each object on the game board is found. This presents one of themost unique problems we face is that of light sensitivity in color detection. This requiresa very precise tuning of color thresholds which we discuss more in Section 5.
Our next step once colors have been detected is to check if the user requested color canbe located in our image. If the answer is no, we return information that the color cannotbe detected to the GUI status page. Otherwise, we interface with the Simulink real-timemodel in order to position the motor arm towards the correct washer location. This is
5

a straightforward computation due to the way we calculate the presence of each color.This computation provides us with the centroid of each color found in a well, so we thencalculate the angle of that well relative to Well 1, with negative degree values moving inthe counter clockwise direction. Our interface with the simulink model is done using theset param() function which allows Matlab functions to set the values of certain blocksin Simulink models. In order to command the motor to a certain position, set param()
is provided with the Commanded angle, and this causes the motor to move into position.Once the position is reached, we pause the script for two seconds in order to confirmthat the location has correctly been reached, before resetting the motor position to itsreference position.
4.2 Determining Motor Gains and Simulation Values
The gain values for our PID controller are shown below in Figure 7. These gains werechosen through iterative selection and tuning using the Simulink motor model, untilthey provided an accurate tuning of our motor arm. This works in conjunction with theportion of the motor model shown in Figure 9, which determines the position in degreeswhich is used as feedback in our system. The gain used here is 360/2797 because thedatasheet for our motor explains that there are 2797 counts per revolution for our motor.
Figure 7: PID controller gains.
Figure 8: Angular position of motor computation.
6
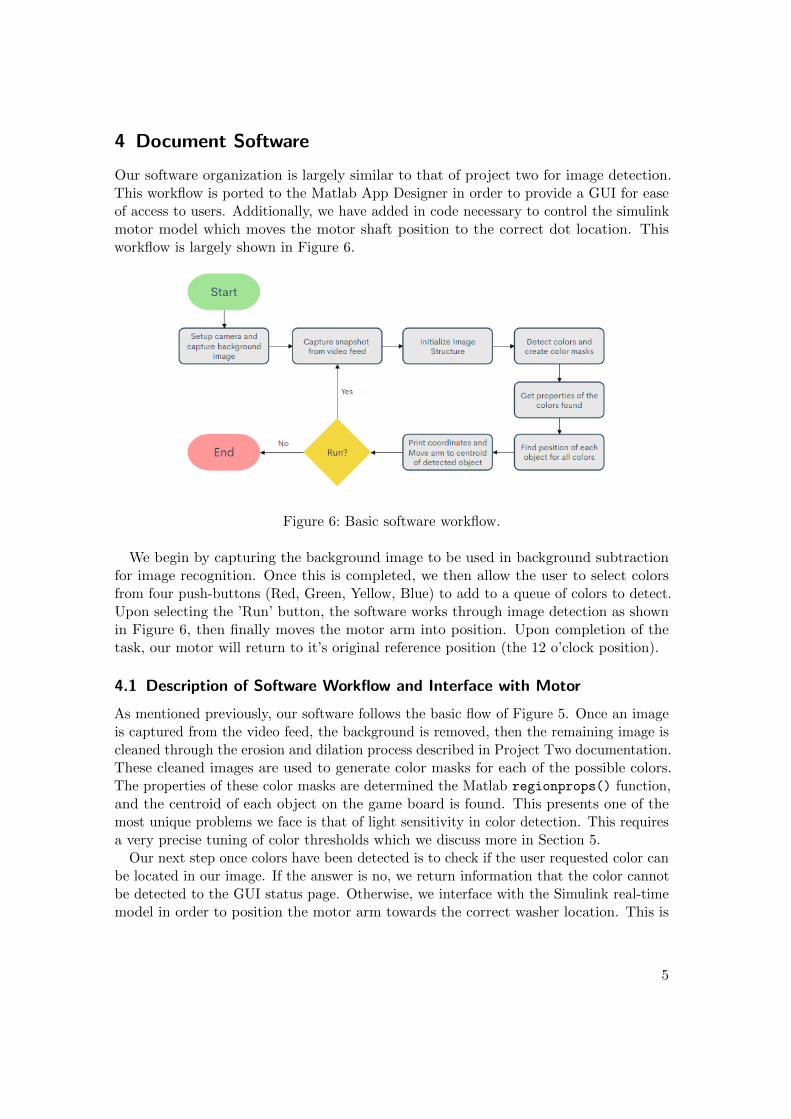
Our Simulink model connected to the Matlab application allows for a clean interfacewhile still providing robust options for the customer. With a Matlab application asopposed to a simple GUI, the programming interface is much cleaner and easier to modify.This includes self documenting code and a simple graphical way to design the look of ourapplication in such a way that automatically updates the interface code. This designchoice also allows us to generate a clean database of code with easy options for packagingour application and porting it to other devices. This ensures that our code will be easilyported to user machines, with all necessary software, and function properly. The simplepackaging and installation process shown in Figure ?? of our code base will be helpful indistribution later on.
Figure 9: Matlab App Designer Packaging menu.
7

5 Document and Evaluate Your User Interface
As mentioned in Section 4, our user interface is very simply combined into our codebase using Matlab’s App Designer and interfaces with the Simulink model using theset param() matlab function. This provides the benefit of quickly adding features to ourGUI if the need presents itself. With that said, the GUI itself has a very straightforwarddesign that provides varying degrees of information about the underlying processes takingplace. Many of the features included are meant to ease use and recover from any issuesthe user may face during operation.
5.1 Startup
Upon startup, the application user is met with a screen asking them to take a snapshot ofthe background. This can be done by dismissing the dialogue box shown in Figure 10 orby selecting the Background button on the GUI itself. This background snapshot willbe used as the reference background for the rest of the operation unless the Backgroundbutton is selected again, updating the background image. This was added as a way tocombat an issue where lighting or background changes extensively and the user needs torecapture their environment without exiting the application.
Figure 10: Startup Messages for Application.
5.2 Color Selection and Running the Application
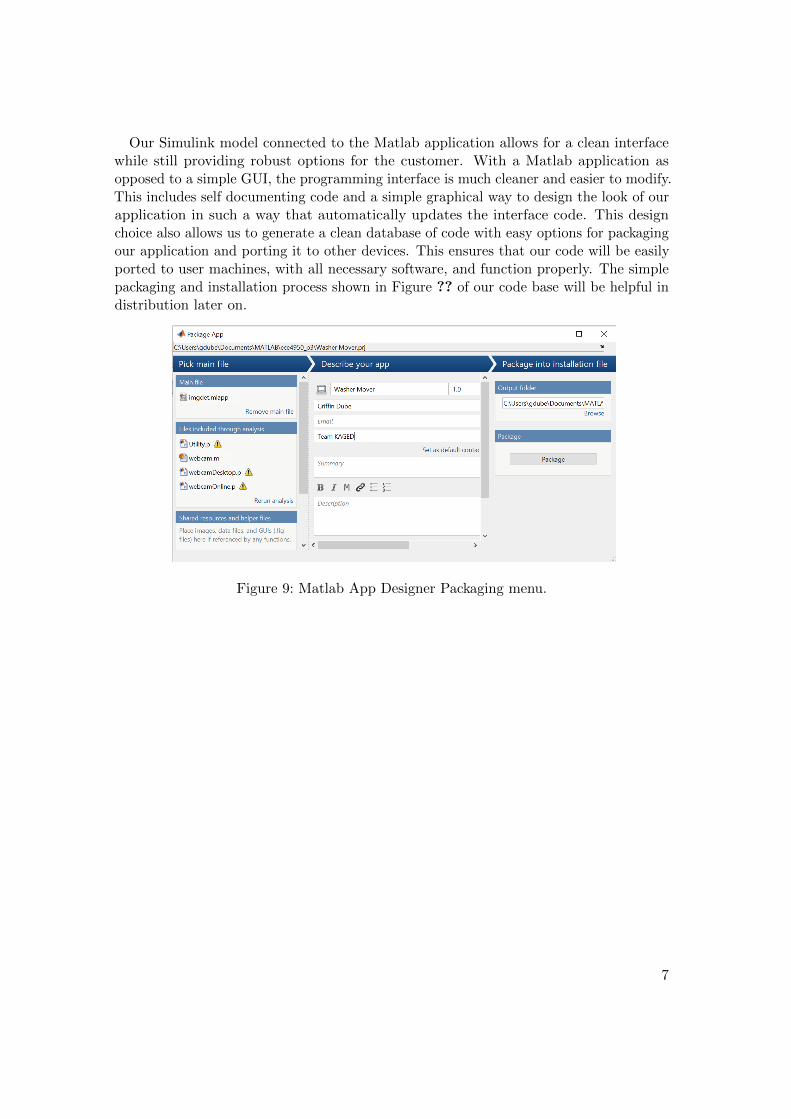
Easy options for color selection, queuing colors and running the application are locatedat the forefront of the design. Color selection push-buttons and a Run push button arealways available on the GUI. The color selection buttons will add colors to the queue,then upon selection of the Run button, they will be located in the image, pointed to bythe motor, and removed from the queue. This main page also shows the cleaned imagedetected from the camera as well as the masks used for detecting each color. These are
8
useful images when the user needs to quickly see how many of each color the system isdetecting. Another ever-present option in the application is the Camera Select dropdown menu which allows the user to select which camera to use as their input source. Thisis also useful when experiencing camera issues and the camera needs to be reinitialized.This main page is shown in Figure 13.
Figure 11: Main view for Application.
5.3 Updating Color Detection Thresholds
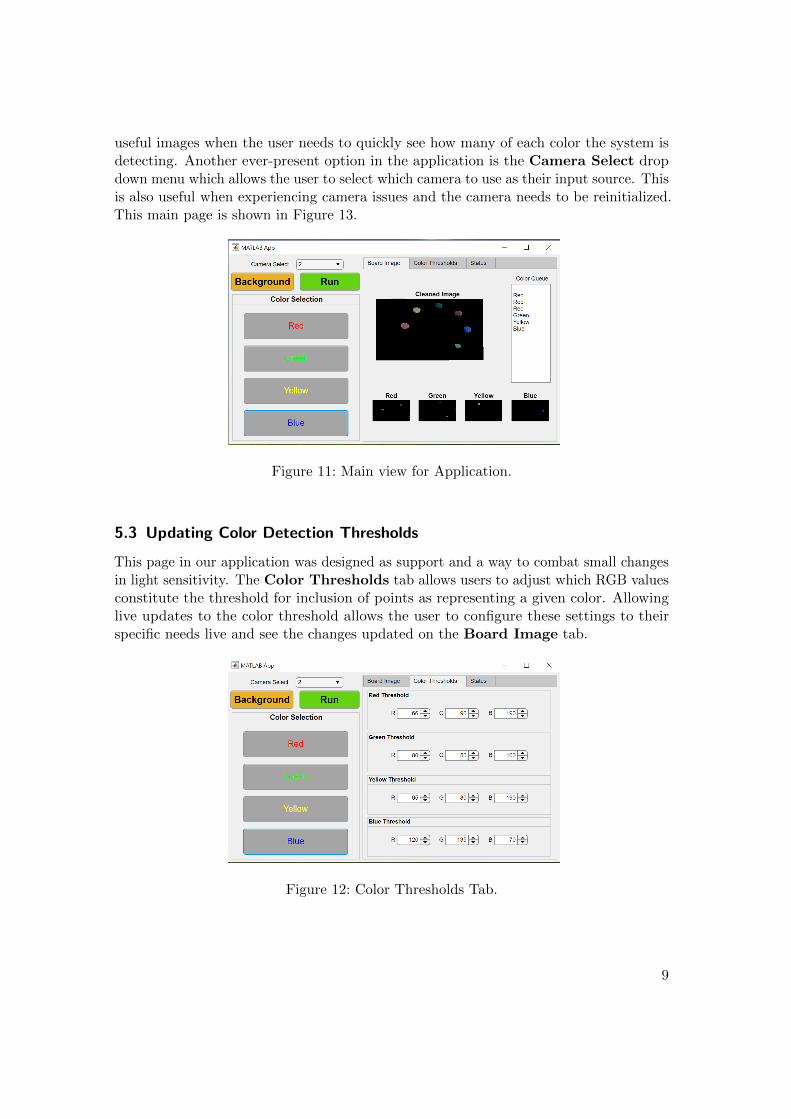
This page in our application was designed as support and a way to combat small changesin light sensitivity. The Color Thresholds tab allows users to adjust which RGB valuesconstitute the threshold for inclusion of points as representing a given color. Allowinglive updates to the color threshold allows the user to configure these settings to theirspecific needs live and see the changes updated on the Board Image tab.
Figure 12: Color Thresholds Tab.
9
5.4 Status View
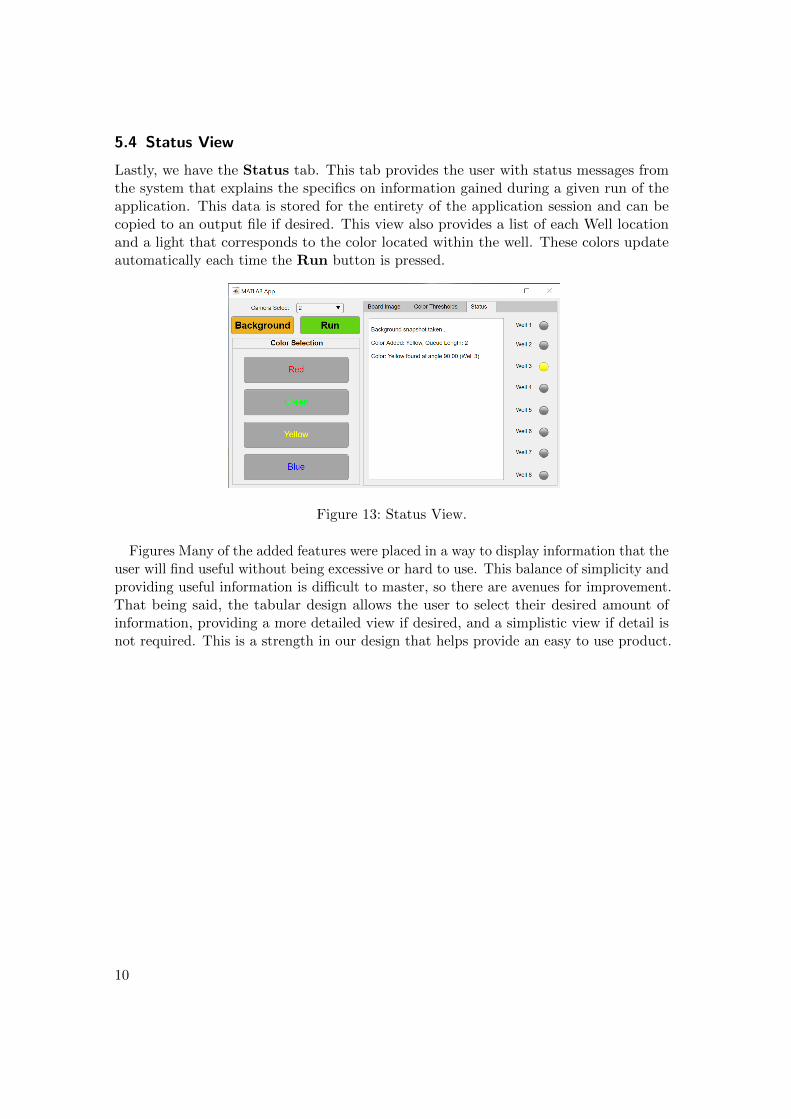
Lastly, we have the Status tab. This tab provides the user with status messages fromthe system that explains the specifics on information gained during a given run of theapplication. This data is stored for the entirety of the application session and can becopied to an output file if desired. This view also provides a list of each Well locationand a light that corresponds to the color located within the well. These colors updateautomatically each time the Run button is pressed.
Figure 13: Status View.
Figures Many of the added features were placed in a way to display information that theuser will find useful without being excessive or hard to use. This balance of simplicity andproviding useful information is difficult to master, so there are avenues for improvement.That being said, the tabular design allows the user to select their desired amount ofinformation, providing a more detailed view if desired, and a simplistic view if detail isnot required. This is a strength in our design that helps provide an easy to use product.
10
6 Life Cycle Analysis
Figure 14: Environmental Performance
Figure 15: Economic Performance
Figure 16: Emissions Performance
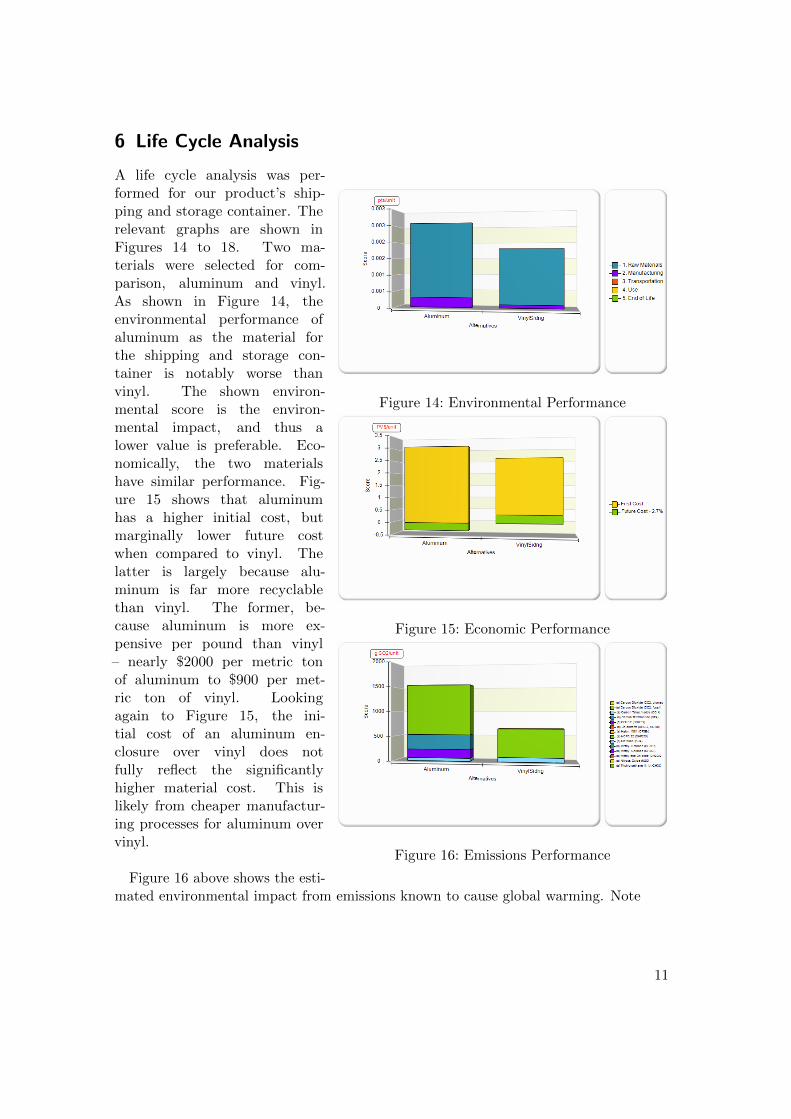
A life cycle analysis was per-formed for our product’s ship-ping and storage container. Therelevant graphs are shown inFigures 14 to 18. Two ma-terials were selected for com-parison, aluminum and vinyl.As shown in Figure 14, theenvironmental performance ofaluminum as the material forthe shipping and storage con-tainer is notably worse thanvinyl. The shown environ-mental score is the environ-mental impact, and thus alower value is preferable. Eco-nomically, the two materialshave similar performance. Fig-ure 15 shows that aluminumhas a higher initial cost, butmarginally lower future costwhen compared to vinyl. Thelatter is largely because alu-minum is far more recyclablethan vinyl. The former, be-cause aluminum is more ex-pensive per pound than vinyl– nearly $2000 per metric tonof aluminum to $900 per met-ric ton of vinyl. Lookingagain to Figure 15, the ini-tial cost of an aluminum en-closure over vinyl does notfully reflect the significantlyhigher material cost. This islikely from cheaper manufactur-ing processes for aluminum overvinyl.
Figure 16 above shows the esti-mated environmental impact from emissions known to cause global warming. Note
11

Figure 17: Fuel Requirements
Figure 18: Overall Performance
again that a lower score is better,as higher values indicate higherenvironmental impact. Emissionsis the largest difference betweenthe two materials. As shown, analuminum enclosure would have afar higher environmental impactthan a vinyl enclosure. Figure17 shows a comparison of fuelrequirements per material. Alu-minum requires a greater amountof fuel energy, while vinyl requiresmore feedstock energy. Over-all, however, the energy requiredis roughly the same. Fuel en-ergy here is the estimated con-sumption of non-renewable fuelsources: crude oil, natural gas,etc. Feedstock energy is anybiomass used for energy produc-tion, such as ethanol producedfrom corn. Vinyl in this respectlooks to be preferable over alu-minum, as it consumes less non-renewable resources in produc-tion.
The overall performance be-tween aluminum and vinyl as a material for our product’s enclosure is significant, as seenin Figure 18. Once again, the environmental segment of this figure shows environmentalimpact, and thus a lower number is better. Aluminum is both more costly and has ahigher environmental impact. It should be noted that, while this is an analysis of theproduct’s shipping and storage enclosure alone, similar analyses can be conducted forany other part of the product.
12

7 Employee Training Program
Table 1 below describes a list of all that the training program entails for the new”technical solutions” engineers, i.e. the newly hired engineers that will be specializingin technical problem solving for the company’s projects. Listed below are the specificrequired activities the engineers will participate in, what the desired benefit the companyhopes to provide the engineers from the respective activities, and the overall (approximate)cost of each.
Activity Benefit cost
Complete the free MatlabTraining program provided onthe Mathworks Matlab On-ramp Website
Refreshes Matlab’s syntax andprovides both video tutorialsand final projects to challengethe engineers’ skills
Free Course
Complete the free SimulinkTraining program provided onthe Mathworks Simulink On-ramp Website
Refreshes Simulink’s syntaxand components, and providesboth video tutorials and finalprojects to challenge the engi-neers’ skills
Free Course
Membership to IEEE Com-puter Society
Yields engineers access to Po-tentials magazine for up-to-date information on currenttechnology trends and globalissues
$60 for Full-Year
Attend CppCon 2021 (or laterbeginning year)
Gather information aboutnewly developed advancedC++ programming tech-niques, and establish con-nections within a reliableprogramming community
Approximately $200 (Whenpaid prior to August 5th ofattending year)
Attned the World Academy ofScience, Engineering and Tech-nology’s International Confer-ence on Computer Organiza-tion, Programming and As-sembly Language in Boston
Learn about professionals’ ex-periences and advances in theworld of Assembly-LanguageProgramming
Round-Trip Flight from SCto Boston MA ˜$400 + Lis-tener Entry Fee ˜$300 + Foodand Housing Expenses (2 days)˜$800 = ˜$1500
Total = ˜$1760
Table 2: Training Plan for ”Technical Solutions” Engineers
13

The following in Table 2 describes the company’s tailored training plan for the new”Technical management” engineers, i.e. the engineers new to the company that will bespecializing in management of technical projects. This training program is designed torefresh and enhance the engineers’ management skills for technical projects.
Activity Benefit Cost
Attend Project ManagementTechniques Training in At-lanta, GA
Have the engineers learn thecore techniques and developleadership skills for managingcompany projects.
Entry Price $700 + Driving,Housing, and Food Expenses(4 days)$1500
Membership to IEEE Com-puter Society
Yields engineers access to Po-tentials magazine for up-to-date information on currenttechnology trends and globalissues
$60 for Full-Year
Attend CppCon 2021 (or laterbeginning year) (Online)
Gather information aboutnewly developed advancesC++ programming tech-niques, and establish con-nections within a reliableprogramming community.
Ticket ˜$200 (When paid priorto August 5th of attendingyear)
Complete Microsoft’s Ex-cel Video Training onMicrosoft.com
Refresh the engineers’ Mi-crosoft Excel skills to make Ex-cel an efficient tool in projectmanagement.
Free Course
Total = ˜$2460
Table 3: Training Plan for ”Technical Management” Engineers
An engineer’s skills on the job are one of the most important factors for handlingsafe and successful company projects. Taking time to reinforce and refine those skillsfor a new job is worth the extra monetary and time cost of assuring such projects areheld to high standards. The company is planning to spend approximately $1500 - $2000on training new employees, and the estimated duration of the training programs is 1.5weeks.
14
8 Safety Analysis
DescriptionofComponent/Subsystem
FailureMode(Hazard)
Symptom Effect Probabilityof Failure
Severityof Effect
Risk Index
PowerSupply
Plug broken/bent
No poweroutput
Mayhaveexposed,energizedmetal
D II IID
Cord frayed/weakened
Cord end-points visi-ble despiteinsulation
Mayhaveexposed,energizedmetal; shortcircuit / firepossible
D II IID
Inputover voltage
Output overvoltage;possibleinternalcircuitfailure
Power spike;plugconnected towrongconnector
E IV IVE
Input Tran-sients whenconnecting
OutputTransients
May causeundesiredoutputvoltagewaveform
E IV IVE
Motor Overheats/workstoo hard
Heat comingfrom motor
Motor maystop/smoke
D III IIID
Game Board Mobility ofGame Board
Speed of ta-ble rotation
Table mayhit the user
D IV IVD
Washers Washersfallingoff board
Speed of ta-ble rotation
May fly outand hit user
D IV IVD
Table 4: DFMEA Table
15
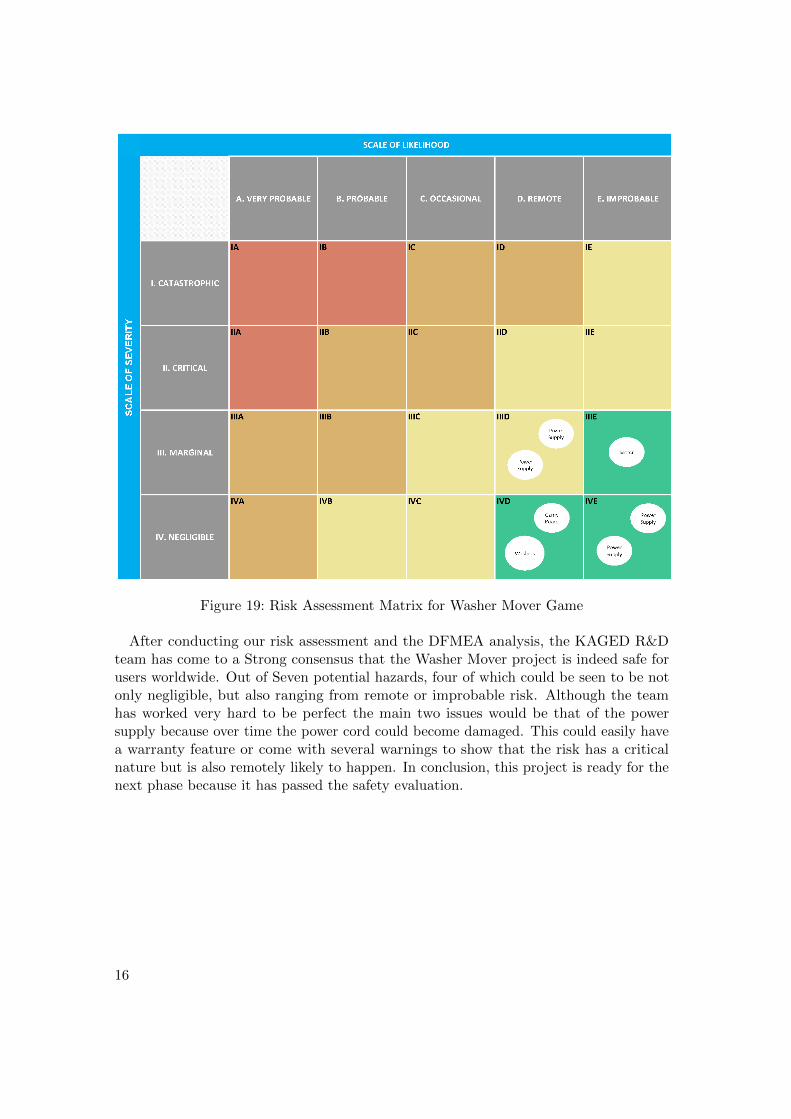
Figure 19: Risk Assessment Matrix for Washer Mover Game
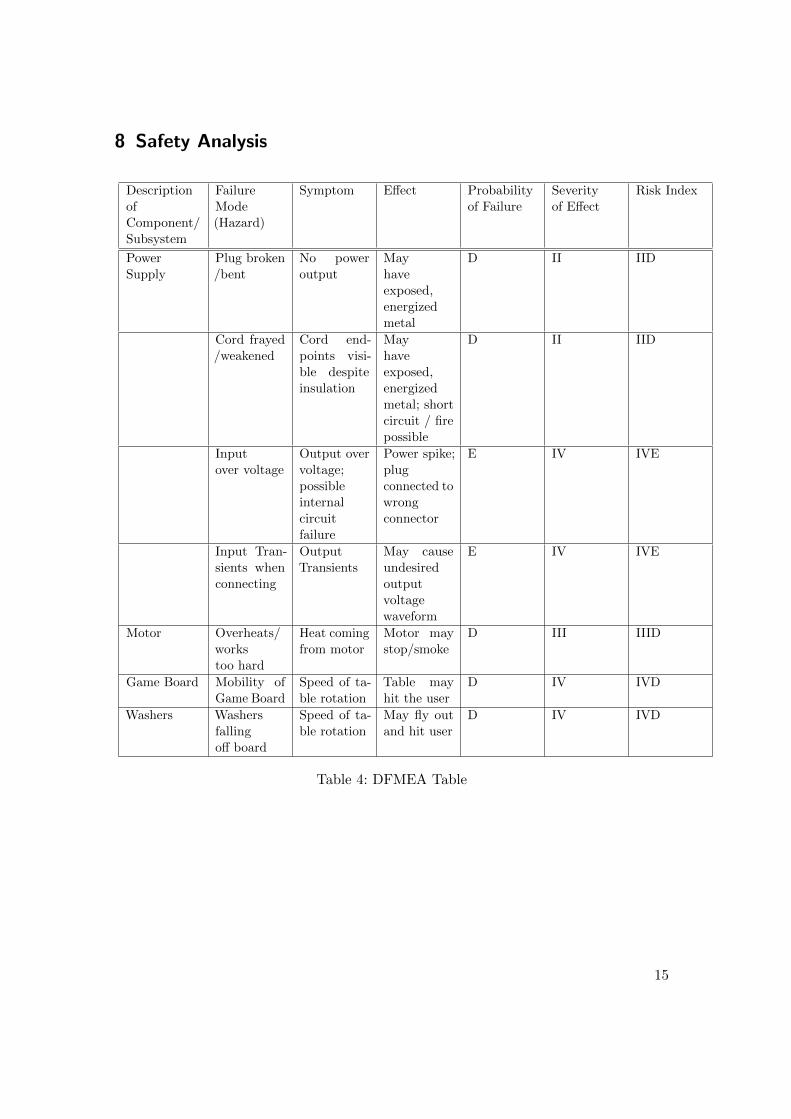
After conducting our risk assessment and the DFMEA analysis, the KAGED R&Dteam has come to a Strong consensus that the Washer Mover project is indeed safe forusers worldwide. Out of Seven potential hazards, four of which could be seen to be notonly negligible, but also ranging from remote or improbable risk. Although the teamhas worked very hard to be perfect the main two issues would be that of the powersupply because over time the power cord could become damaged. This could easily havea warranty feature or come with several warnings to show that the risk has a criticalnature but is also remotely likely to happen. In conclusion, this project is ready for thenext phase because it has passed the safety evaluation.
16
ECE 4950 Project 3 –Closed-Loop Motor Control, Life-Cycle Analysis, and Risk Assessment
Use the guidelines below to complete your report and add at the end of your report. Group Member Last Names:______________________________________________________________
Score Pts Performance Indicators
5 General Format - Professional Looking Document/Preparation (whole document) a) Fonts, margins (11pt, times new roman, single spaced. 1" margins on all sides). b) Spelling and grammar are correct c) Layout of pictures – all figures need numbers and captions and must be referenced in
the text d) Follows the page limitations below. e) References. Use IEEE reference format. f) This grading sheet is included as the final page.
g.1
5 Page 1: Title, Group Name, Group Members, and Date Executive Summary (1 concise, well-written paragraph) Provide an overview of this project. Briefly describe what you did and what you learned.
g.1
10
5
10
10
Subsystem Design Page 2: Engineering Requirements for the Motor Control subsystem (~1 page) Considering only the Stickerboard-Motor subsystem, make a three column table that lists the Customer Requirements in the first column, the resulting Engineering Requirements in the second column and the tests done to verify that the design chosen meets each requirement in the third column. Note that one Customer Requirement could map to multiple Engineering Requirements. Page 3: Overview of Hardware-in-the-Loop (~1/2 page) Describe in your own words what Hardware-in-the-Loop means. What is the difference between a full simulation and a Hardware-in-the-Loop simulation? What are the strengths of HIL? Pages 3-4: Document Hardware (1 page) Describe and show images of the equipment used, connection diagrams, calculation of resolution – pixels per square inch/cm on game board etc. Is the camera an appropriate sensor? Pages 5-7: Document Software (3 pages) Using Flowcharts, state diagrams, data structures etc. describe how the software is implemented. There is no need to include the source code.
c.2
k.3
k.1
k.2

10
10
5
Page 8: Document Simulated Motor Experiments (~1 page) Plot the effect of changing gains using the reference, actual position and error signals. What happens when the proportional, derivative and/or integral gains are changed? Page 9: Document Motor Experiments (~1 page) Plot the effect of changing gains using the reference, actual position and error signals. What happens when the proportional, derivative and/or integral gains are changed? Describe the relationship between these simulated experiments and the HIL experiments. Pages 10-11: Document and Evaluate your User Interface (~2 pages) How does the user interface connect the Camera-As-A-Sensor and the Tohoku motor? What information is provided to the user and why? Document using screenshots and similar images.
b.2
b.1 b.3
j.1
10 Pages 12-13 Life Cycle Analysis (2 pages) You are proposing a design that consumes resources. Follow the “Life Cycle Assessment (LCA) Exercise” for the shipping box for your project to examine the life cycle for this one part of your design. Be sure to interpret the results of the computer program. Complete this section of the report by saying that a similar analysis could be done on the entire project to reduce environmental impact.
c.3
10 Page 14: Employee Training Program i.1 15 Pages 15-16: Safety Analysis
The project must be safe for use by the customer. Perform and Document a DFMEA for your project. Document your analysis using the DFMEA Table and Risk Assessment Matrix shown in the class slides. Show that you have implemented the results of the analysis to make your design and workspace safe – that is document what changes you made to make your system and space safe as a result of the safety analysis. Can you conclude your system is safe?
c.2
- Page 17: Grading Sheet g.1