Closed Loop Enterprise Quality Management - …...complaints, RMAs, FMEAs, and audit documentation...
20
Closed Loop Quality Management Improving Customer Focus from Design to Delivery July 2009 Matthew Littlefield, Mehul Shah
Transcript of Closed Loop Enterprise Quality Management - …...complaints, RMAs, FMEAs, and audit documentation...
Closed Loop Quality Management Improving Customer Focus from Design to Delivery
July 2009
Matthew Littlefield, Mehul Shah

Closed Loop Enterprise Quality Management Page 2
© 2009 Aberdeen Group. Telephone: 617 854 5200
Executive Summary Research Benchmark
Aberdeen’s Research Benchmarks provide an in-depth and comprehensive look into process, procedure, methodologies, and technologies with best practice identification and actionable recommendations
The requirements of quality management systems have evolved significantly over the past several years. Competing pressures to both ensure customer satisfaction and reduce the cost of quality are driving many manufacturers to question both the efficacy and approach of their current system. This report will provide actionable steps for manufacturers to transform their business and begin to create a closed-loop enterprise system that aligns the entire value chain with a single view of quality execution.
Best-in-Class Performance In the following analysis, Aberdeen uses six Key Performance Indicators (KPIs) to identify Best-in-Class performance:
• 89% Overall Equipment Efficiency (OEE)
• 99% on-time and complete shipments
• 2.5 hours response time to non-conforming shipments
• 99% compliance in production
• 14% of Corrective and Preventive Actions (CAPA) are recurring
• 65% reduction in Engineering Change Orders (ECO)
Competitive Maturity Assessment "Quality management within our Adhesives division is a global function. Tools, processes, and methods are managed centrally to secure a unified approach in all of our global plants. Our Adhesives customers can expect the same kind of support and responsiveness regardless of their geographic location, the product, and production location of the product.”
~ Paul Spronck, Director, Global Adhesives Operations and
Logistics Nordson Corporation
Survey results show that the firms enjoying Best-in-Class performance shared several common characteristics:
• Best-in-Class companies are over twice as likely as Laggards to have an executive priority to improve enterprise quality management
• Best-in-Class companies are nearly three-times as likely as Laggards to standardize processes for response to adverse events across the enterprise
• Best-in-Class companies are four-times as likely as Laggards to maintain historical quality data for trending and root cause analysis
Required Actions In addition to the specific recommendations in Chapter Three of this report, to achieve Best-in-Class performance, companies must:
• Create and / or improve the visibility of quality processes across the design, make, and deliver business processes
• Implement both Quality Management Systems (QMS) and Manufacturing Operations Management (MOM) systems at the enterprise wide level
• Establish real-time interoperability between QMS and other enterprise systems, specifically: PLM, MOM, and SCM
www.aberdeen.com Fax: 617 723 7897
Closed Loop Enterprise Quality Management Page 3
© 2009 Aberdeen Group. Telephone: 617 854 5200 www.aberdeen.com Fax: 617 723 7897
Table of Contents Executive Summary....................................................................................................... 2
Best-in-Class Performance..................................................................................... 2 Competitive Maturity Assessment....................................................................... 2 Required Actions...................................................................................................... 2
Chapter One: Benchmarking the Best-in-Class.................................................... 4 Business Context ..................................................................................................... 4 The Maturity Class Framework............................................................................ 5 The Best-in-Class PACE Model ............................................................................ 6 Best-in-Class Strategies........................................................................................... 7
Chapter Two: Benchmarking Requirements for Success................................... 9 Competitive Assessment......................................................................................10 Capabilities and Enablers......................................................................................11
Chapter Three: Required Actions .........................................................................15 Laggard Steps to Success......................................................................................15 Industry Average Steps to Success ....................................................................15 Best-in-Class Steps to Success ............................................................................16
Appendix A: Research Methodology.....................................................................18 Appendix B: Related Aberdeen Research............................................................20
Figures Figure 1: Cost and Customer Satisfaction............................................................... 4 Figure 2: Strategic Actions .......................................................................................... 7 Figure 3: At the Plant Level.......................................................................................13 Figure 4: Real-Time Interoperability with QMS...................................................14 Figure 5: Technology Enabling Functionality .........................................................14
Tables Table 1: Top Performers Earn Best-in-Class Status.............................................. 6 Table 2: The Best-in-Class PACE Framework ....................................................... 7 Table 3: The Competitive Framework...................................................................10 Table 4: The PACE Framework Key ......................................................................19 Table 5: The Competitive Framework Key ..........................................................19 Table 6: The Relationship Between PACE and the Competitive Framework.........................................................................................................................................19

Closed Loop Enterprise Quality Management Page 4
© 2009 Aberdeen Group. Telephone: 617 854 5200
Chapter One: Benchmarking the Best-in-Class
Business Context Fast Facts
Best-in-Class companies realize:
√ 99% on-time and complete shipments
√ 89% OEE
√ 2.5 hour response time to non-conforming shipments
The impact quality can have on corporate performance is often misunderstood and underestimated by manufacturing organizations. If we examine the design-make-deliver processes, there are a number of workflows where the incorporation of enterprise quality management processes would yield tangible benefits. This research is aimed at identifying how Best-in-Class manufacturers are effectively ensuring quality throughout these processes.
Enterprise quality management is an architectural approach to optimizing quality business processes that is gaining traction among Best-in-Class manufacturers. In order for manufacturing enterprises to successfully reduce the cost of quality and incorporate closed-loop quality processes into established workflows; product and process traceability, non-conformances, corrective and preventive actions, engineering change orders, customer complaints, RMAs, FMEAs, and audit documentation must all be managed in real-time across all levels of the enterprise.
Top Market Pressures Driving a Focus on Quality The top pressures driving manufacturers to focus on enterprise quality management initiatives are the need to ensure customer satisfaction and the need to reduce the cost of quality. Both of these pressures were at the top of the list in last year's study and both were selected by a majority of survey respondents this year, making it clear that these issues resonate in any economic climate.
Figure 1: Cost and Customer Satisfaction
18%
20%
23%
57%
60%
0% 10% 20% 30% 40% 50% 60% 70%
Manage risk due to adverse events
Improve New Product Introductionperformance
Adhere with government regulatoryrequirements
Reduce the 'cost of quality'
Ensure consumer satisfaction
Percentage of Respondents, n=103
All Respondents18%
20%
23%
57%
60%
0% 10% 20% 30% 40% 50% 60% 70%
Manage risk due to adverse events
Improve New Product Introductionperformance
Adhere with government regulatoryrequirements
Reduce the 'cost of quality'
Ensure consumer satisfaction
Percentage of Respondents, n=103
All Respondents18%
20%
23%
57%
60%
0% 10% 20% 30% 40% 50% 60% 70%
Manage risk due to adverse events
Improve New Product Introductionperformance
Adhere with government regulatoryrequirements
Reduce the 'cost of quality'
Ensure consumer satisfaction
Percentage of Respondents, n=103
All Respondents18%
20%
23%
57%
60%
0% 10% 20% 30% 40% 50% 60% 70%
Manage risk due to adverse events
Improve New Product Introductionperformance
Adhere with government regulatoryrequirements
Reduce the 'cost of quality'
Ensure consumer satisfaction
Percentage of Respondents, n=103
All Respondents
Source: Aberdeen Group, July 2009
www.aberdeen.com Fax: 617 723 7897
Closed Loop Enterprise Quality Management Page 5
© 2009 Aberdeen Group. Telephone: 617 854 5200
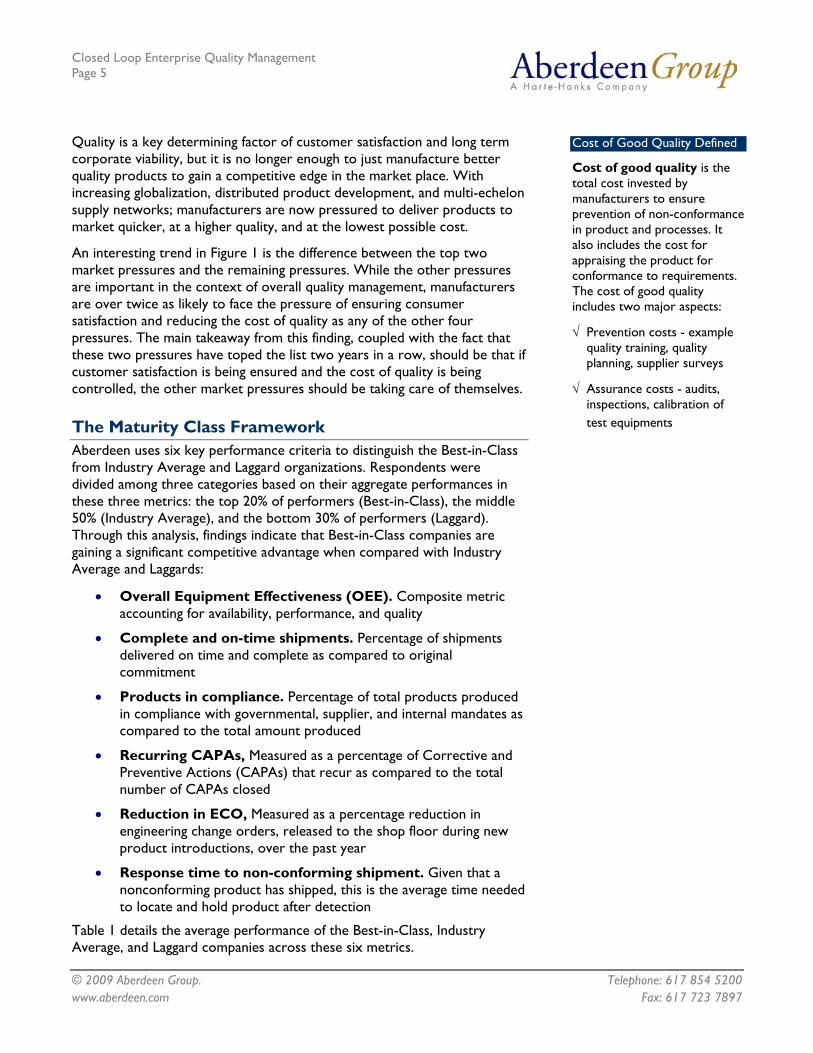
Cost of Good Quality Defined
Cost of good quality is the total cost invested by manufacturers to ensure prevention of non-conformance in product and processes. It also includes the cost for appraising the product for conformance to requirements. The cost of good quality includes two major aspects:
√ Prevention costs - example quality training, quality planning, supplier surveys
√ Assurance costs - audits, inspections, calibration of test equipments
Quality is a key determining factor of customer satisfaction and long term corporate viability, but it is no longer enough to just manufacture better quality products to gain a competitive edge in the market place. With increasing globalization, distributed product development, and multi-echelon supply networks; manufacturers are now pressured to deliver products to market quicker, at a higher quality, and at the lowest possible cost.
An interesting trend in Figure 1 is the difference between the top two market pressures and the remaining pressures. While the other pressures are important in the context of overall quality management, manufacturers are over twice as likely to face the pressure of ensuring consumer satisfaction and reducing the cost of quality as any of the other four pressures. The main takeaway from this finding, coupled with the fact that these two pressures have toped the list two years in a row, should be that if customer satisfaction is being ensured and the cost of quality is being controlled, the other market pressures should be taking care of themselves.
The Maturity Class Framework Aberdeen uses six key performance criteria to distinguish the Best-in-Class from Industry Average and Laggard organizations. Respondents were divided among three categories based on their aggregate performances in these three metrics: the top 20% of performers (Best-in-Class), the middle 50% (Industry Average), and the bottom 30% of performers (Laggard). Through this analysis, findings indicate that Best-in-Class companies are gaining a significant competitive advantage when compared with Industry Average and Laggards:
• Overall Equipment Effectiveness (OEE). Composite metric accounting for availability, performance, and quality
• Complete and on-time shipments. Percentage of shipments delivered on time and complete as compared to original commitment
• Products in compliance. Percentage of total products produced in compliance with governmental, supplier, and internal mandates as compared to the total amount produced
• Recurring CAPAs, Measured as a percentage of Corrective and Preventive Actions (CAPAs) that recur as compared to the total number of CAPAs closed
• Reduction in ECO, Measured as a percentage reduction in engineering change orders, released to the shop floor during new product introductions, over the past year
• Response time to non-conforming shipment. Given that a nonconforming product has shipped, this is the average time needed to locate and hold product after detection
Table 1 details the average performance of the Best-in-Class, Industry Average, and Laggard companies across these six metrics.
www.aberdeen.com Fax: 617 723 7897

Closed Loop Enterprise Quality Management Page 6
© 2009 Aberdeen Group. Telephone: 617 854 5200
Table 1: Top Performers Earn Best-in-Class Status Cost of Poor Quality Defined
Cost of poor quality is the cost resulting from products or services not conforming to requirements or customer / user needs. As per the above definition, cost of poor quality includes two major aspects:
√ Internal failure - example scrap, rework, re-inspection
√ External failure - product recall, customer returns, warranty claim
Definition of Maturity Class Mean Class Performance
Best-in-Class: Top 20%
of aggregate performance scorers
89% OEE 99% on-time and complete shipments 2.5 hour response time to non-conforming shipments 99% products in compliance 14% recurring CAPA 65% reduction in ECO
Industry Average: Middle 50% of aggregate
performance scorers
81% OEE 93% on-time and complete shipments 9.4 hour response time to non-conforming shipments 93% compliance 40% recurring CAPA 37% reduction in ECO
Laggard: Bottom 30% of aggregate
performance scorers
62% OEE 77% on-time and complete shipments 42 hour response time to non-conforming shipments 86% compliance 86% recurring CAPA 31% reduction in ECO
Source: Aberdeen Group, July 2009
The six metrics above clearly indicate the ability of Best-in-Class companies to manufacture products and subsequently get them to market quicker, at a higher quality, and at the lowest possible cost - all while streamlining operations across the design, make, and deliver process. The rest of the report will highlight the capabilities that are critical for Best-in-Class companies to realize high performance.
The Best-in-Class PACE Model Manufacturing higher quality products with lower cost of quality requires manufacturers to implement and execute a combination of strategic actions, organizational capabilities, and enabling technologies that can be summarized as shown in Table 2.
www.aberdeen.com Fax: 617 723 7897

Closed Loop Enterprise Quality Management Page 7
© 2009 Aberdeen Group. Telephone: 617 854 5200
Table 2: The Best-in-Class PACE Framework
Pressures Actions Capabilities Enablers Ensure consumer satisfaction Need to reduce the "cost of quality"
Improve visibility and control into quality processes across manufacturing operations and supplier networks Improve communication and collaboration across engineering, procurement, manufacturing, and distribution
Standardized processes for responding to adverse events across the enterprise Cross functional continuous improvement teams are focused on improving enterprise quality processes Executive priority to improve quality management across the enterprise Automated data collection from across manufacturing operations Real-time visibility quality performance across the global manufacturing network Scorecard and standardized reporting for normalizing quality performance across operations
QMS and MOM systems are deployed at the enterprise level PLM, ERP, MOM, SCM interoperate with QMS Dashboards Automated work-flows - BPM FMEA Traceability and genealogy Alarm and alert management Supplier quality management Statistical process control Audit documentation NC/CAPA Customer complaints
Source: Aberdeen Group, July 2009
Best-in-Class Strategies The top strategic action, as was the case with market pressures, has remained the same since last year. The market at large is still most concerned with improving the visibility and control of quality processes. Such a strategy is one that is familiar to many manufacturing organizations and has been deployed through the context of continuous improvement teams in many different settings. In fact, visibility and control are two capabilities that are critical to the improvement of any processes.
Figure 2: Strategic Actions
20%
27%
30%
40%
56%
0% 20% 40% 60%
Improve the quality performance of criticalsuppliers
Minimize scrap, rework, returns and servicecosts
“Build in” product and process traceability
Improve communication and collaborationacross the organization
Improve visibility and control into qualityprocesses
Percentage of Respondents, n=103
All Respondents20%
27%
30%
40%
56%
0% 20% 40% 60%
Improve the quality performance of criticalsuppliers
Minimize scrap, rework, returns and servicecosts
“Build in” product and process traceability
Improve communication and collaborationacross the organization
Improve visibility and control into qualityprocesses
Percentage of Respondents, n=103
All Respondents
Source: Aberdeen Group, July 2009
www.aberdeen.com Fax: 617 723 7897

Closed Loop Enterprise Quality Management Page 8
© 2009 Aberdeen Group. Telephone: 617 854 5200
The real surprise this year, in regards to strategic actions, is the movement of improving collaboration across the enterprise. This strategy actually moved from fourth to second, leapfrogging both traceability and minimizing scrap. Such a move could be signaling a maturation of the market in regards to the understanding of quality processes and that quality truly is more than scrap, rework, or recalls; that it takes the combined effort of the entire value chain to make substantive improvements to quality execution.
Aberdeen Insights — Strategy
Collaboration can be a challenging but worthwhile undertaking. The question is where the focus of this collaboration be placed to exact the most positive impact to the business and ultimately corporate performance. Previous Aberdeen research has shown, and current research will confirm, that the focus should be placed at the intersection points of the design-make-deliver business processes. To create a competitive advantage in today's market place, it is critical for organizations to successfully innovate. This means that companies must be able to deliver new products to market on time, of high quality, and on volume. But, none of these objectives can be singularly delivered by the product design, manufacturing, or supply chain organizations. In fact, the degree to which these organizations successfully collaborate and address adverse events goes a long way to determining the achievement of time, quality, and volume metrics. In the next chapter we will focus on how technology is enabling Best-in-Class organizations to collaborate across these business processes from a quality perspective.
“Our company is focusing on enterprise quality management to improve product quality in the eye of the consumer. We are investing heavily in consumer quality surveys, people, and technology to improve our focus on product quality across the value chain, from the point of raw materials to the final point of consumption. To date we have used technology to improve time management and standardize the scheduling of mandatory product and process analyses and assessments ensuring the governance of work practices. We also use SPC to trend, analyze, and identify poor performing areas across the enterprise.”
~ Kevin Akaloo, Corporate QA Manager
The South African Breweries Limited
www.aberdeen.com Fax: 617 723 7897

Closed Loop Enterprise Quality Management Page 9
© 2009 Aberdeen Group. Telephone: 617 854 5200
Chapter Two: Benchmarking Requirements for Success
The success of enterprise quality management initiatives depends heavily on where in the maturity class framework an enterprise falls (Table 1). Maturity affects how an enterprise should leverage supporting technologies and other business capabilities, and in turn, goes a long way to translating the strategies presented in Chapter One to improve finished product quality and customer satisfaction.
Case Study — Cummins Inc.
Cummins Inc. is an integrated manufacturer that designs, manufactures, distributes and services engines and related technologies, including fuel systems, controls, air handling, filtration, emission solutions, and electrical power generation systems. Headquartered in Columbus, Indiana (USA), Cummins serves customers in more than 160 countries through its network of 550 company-owned and independent distributor facilities and more than 5,000 dealer locations. In 2007, Cummins reported a net income of $739 million on sales of $13.05 billion.
Cummins has been using an Enterprise Quality Management System (QMS) for over 10 years. One of the main reasons they implemented QMS was to move from manual quality processes to an automatic process through the adoption of a common technology platform across all manufacturing plants. The implementation started out on a plant by plant basis initially with 32 plants, but QMS is now implemented at more than 100 facilities and is used company-wide across all business units.
The primary benefit of this enterprise-wide adoption was standardization of processes. All the employees, no matter where they are located around the world, now have access to standard reports and are able to improve communication and collaboration through the use of a single quality management platform.
Cummins is utilizing all the integrated modules in the quality management system, namely the quality, environmental and health, and safety modules. In addition to the integrated modules within the quality management system, Cummins has also integrated QMS with other enterprise applications such as ERP, and a variety of technologies used in purchasing, manufacturing, and controls. This integration is crucial as it gives Cummins the ability to track materials purchased and received, non-conformances, and supplier corrective actions, giving them better control of product quality within and outside of the manufacturing plant. Cummins has also set up NC / CAPA for suppliers, integrated with the quality management system, through a secure website where both suppliers and employees can track and respond to non-conformance at any stage.
continued
Fast Facts
Best-in-Class companies are:
√ Twice as likely as Laggards to have the quality metrics linked to operational metrics
√ Are almost three-times more likely than Laggard manufacturers to standardize processes to respond to adverse events across the enterprise
√ Four-times more likely than Laggard manufacturers to maintain and manage quality data in a data historian application
www.aberdeen.com Fax: 617 723 7897
Closed Loop Enterprise Quality Management Page 10
© 2009 Aberdeen Group. Telephone: 617 854 5200 www.aberdeen.com Fax: 617 723 7897
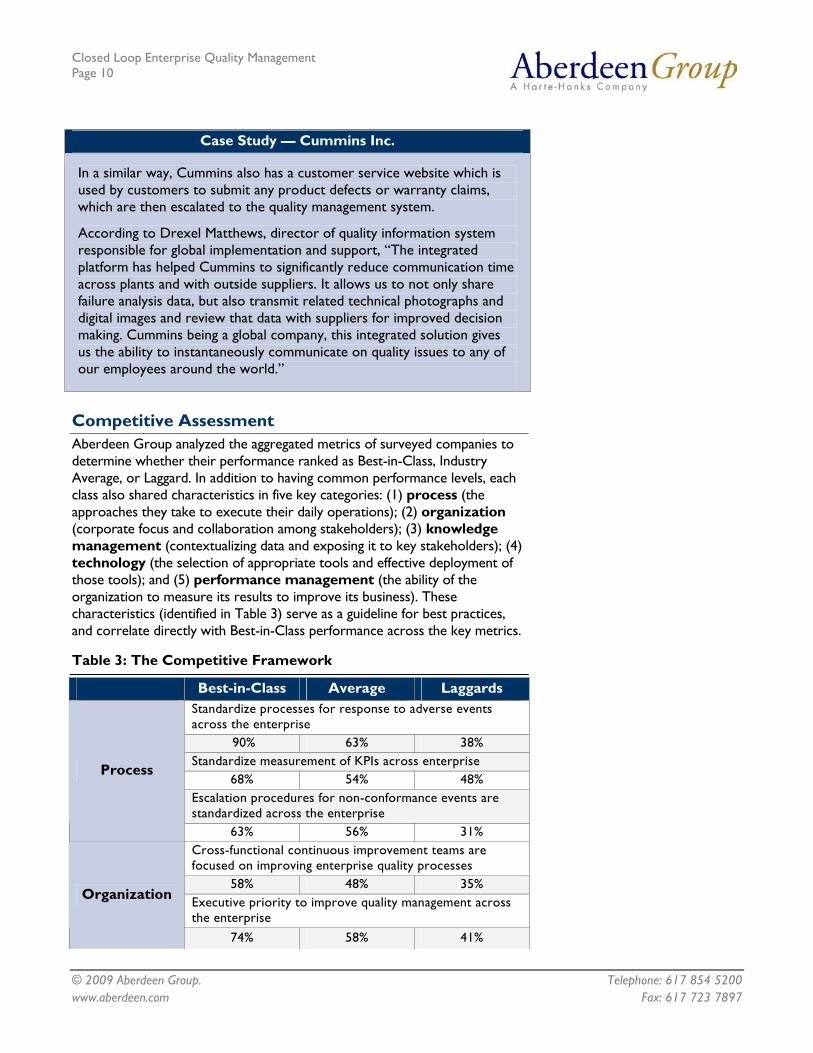
Competitive Assessment Aberdeen Group analyzed the aggregated metrics of surveyed companies to determine whether their performance ranked as Best-in-Class, Industry Average, or Laggard. In addition to having common performance levels, each class also shared characteristics in five key categories: (1) process (the approaches they take to execute their daily operations); (2) organization (corporate focus and collaboration among stakeholders); (3) knowledge management (contextualizing data and exposing it to key stakeholders); (4) technology (the selection of appropriate tools and effective deployment of those tools); and (5) performance management (the ability of the organization to measure its results to improve its business). These characteristics (identified in Table 3) serve as a guideline for best practices, and correlate directly with Best-in-Class performance across the key metrics.
Table 3: The Competitive Framework
Best-in-Class Average Laggards Standardize processes for response to adverse events across the enterprise
90% 63% 38% Standardize measurement of KPIs across enterprise
68% 54% 48% Escalation procedures for non-conformance events are standardized across the enterprise
Process
63% 56% 31% Cross-functional continuous improvement teams are focused on improving enterprise quality processes
58% 48% 35% Executive priority to improve quality management across the enterprise
Organization
74% 58% 41%
Case Study — Cummins Inc.
In a similar way, Cummins also has a customer service website which is used by customers to submit any product defects or warranty claims, which are then escalated to the quality management system.
According to Drexel Matthews, director of quality information system responsible for global implementation and support, “The integrated platform has helped Cummins to significantly reduce communication time across plants and with outside suppliers. It allows us to not only share failure analysis data, but also transmit related technical photographs and digital images and review that data with suppliers for improved decision making. Cummins being a global company, this integrated solution gives us the ability to instantaneously communicate on quality issues to any of our employees around the world.”

Closed Loop Enterprise Quality Management Page 11
© 2009 Aberdeen Group. Telephone: 617 854 5200
Best-in-Class Average Laggards Adverse events are escalated to appropriate decision makers
90% 83% 69%
Quality data is maintained and managed in a data historian application
Knowledge
74% 58% 17%
eQMS technology currently in use:
Technology
63% traceability 58% statistical process control 53% change control management
38% traceability 33% statistical process control 40% change control management
38% traceability 28% statistical process control 35% change control management
Scorecard and standardized reporting for normalizing quality performance across operation
47% 40% 14%
Quality metrics linked to operational metrics Performance
63% 60% 35%
Source: Aberdeen Group, July 2009
Capabilities and Enablers Based on the findings of the Competitive Framework and interviews with end users, Aberdeen’s analysis reveals that Best-in-Class manufacturers significantly differ in how they manage their operations across a broad range of business capabilities and technology enablers.
Process
"As part of the quarterly management review meetings, we review the cost of non-conformances ($ / unit) and identify ways to reduce costs.”
~ Robert Pintavalle, Manager, Quality, Taylor Made
Environment
Best-in-Class manufacturers are more than two-times as likely as Laggard manufacturers to standardize processes to respond to adverse events. Best-in-Class manufacturers have clear procedures established in case of a non-conforming incident, which gives all the employees a clear understanding of the steps that need to be taken once an adverse event has occurred. This includes escalating adverse events to appropriate decision makers depending on the type and the severity of the incident, and the actions that need to be initiated during such scenarios. This is one of the critical capabilities enabling Best-in-Class manufacturers to respond to non-conforming shipments in 2.5 hours as compared to 42 hours for Laggard manufacturers. Once these processes are standardized, all the stakeholders are aware of their responsibilities and are able to act intelligently and in a timely fashion.
Organization One of the ways to enable standardization of quality processes across the enterprise is to have a strong executive vision and then buy-in from
www.aberdeen.com Fax: 617 723 7897
Closed Loop Enterprise Quality Management Page 12
© 2009 Aberdeen Group. Telephone: 617 854 5200
stakeholders at different levels of the organization. Best-in-Class and Industry Average manufacturers are both more likely than Laggard organizations to have established continuous improvement teams focusing on improving quality processes. This is an important capability to enable the success of the second most prevalent strategic action: improving collaboration across the enterprise. However, having continuous improvement teams alone does not differentiate Best-in-Class performance. Best-in-Class manufacturers are enabling the success of continuous improvement teams by establishing executive priority to improve quality management processes across the enterprise. Again Best-in-Class manufacturers are 28% and 80% more likely than Industry Average and Laggards, respectively, to have executive sponsorship of their quality processes.
The key to success is to have senior executive sponsorship as well as cross functional teams to streamline quality processes. Aligning the organization in such a way is crucial because it allows manufacturers to control the quality of the product not only within the four walls of the plant, but also extending across the value chain.
Knowledge Management The knowledge management capabilities highlight the ability of Best-in-Class manufacturers to have real-time access to quality data and utilize this knowledge to enable decision making. To ensure this happens, Best-in-Class manufacturers are more likely to ensure adverse events are escalated to appropriate decision makers for a timely response. Best-in-Class manufacturers are then using real-time data to perform root cause analysis to understand the source and the cause of the adverse event. This further enables manufacturers to utilize the outcome of the root cause analysis to prevent future failures. The Best-in-Class have invested resources in establishing both predictive and responsive capabilities to manage the quality of the products across the enterprise.
Finally, many Best-in-Class organizations have realized that the numbers of closed CAPAs (or the speed at which CAPAs are closed) are not good metrics for improving long term quality execution. What the Best-in-Class are now focusing on is closing high value CAPAs first; those with the highest risk profile. This ensures that the quality issues that deserve the majority of attention receive it, which in the long run reduces the number of CAPAs that reoccur because the true root cause was never found and the overall risk profile of the organization is reduced. This process has ensured that Best-in-Class companies only have 14% recurring CAPA as compared to 82% recurring CAPA for Laggard companies.
"Quality is paramount in an industry like ours, where troops’ lives are at risk. Now we have total visibility into Work-In-Process on the shop floor. We have a complete genealogy of parts and serialization of lots, all accessible within the Manufacturing and Quality portal, helping to drive down the cost of quality."
~ Tony DeGregorio, CIO,
Textron Systems
Performance Management On the performance management side, Best-in-Class manufacturers are more likely to have established an executive level score card for performance benchmarking across the organization. This can help to enable one of the key strategic actions described in Chapter One, improving
www.aberdeen.com Fax: 617 723 7897
Closed Loop Enterprise Quality Management Page 13
© 2009 Aberdeen Group. Telephone: 617 854 5200
visibility and control of quality processes across the enterprise. In conjunction with score-carding, the Best-in-Class are also more likely to have created the analytics that allow for quality metrics to be translated into corporate performance. This means that many Best-in-Class companies understand how scrap rates impact the cost of goods sold, or how supplier quality performance impact complete and on time shipments.
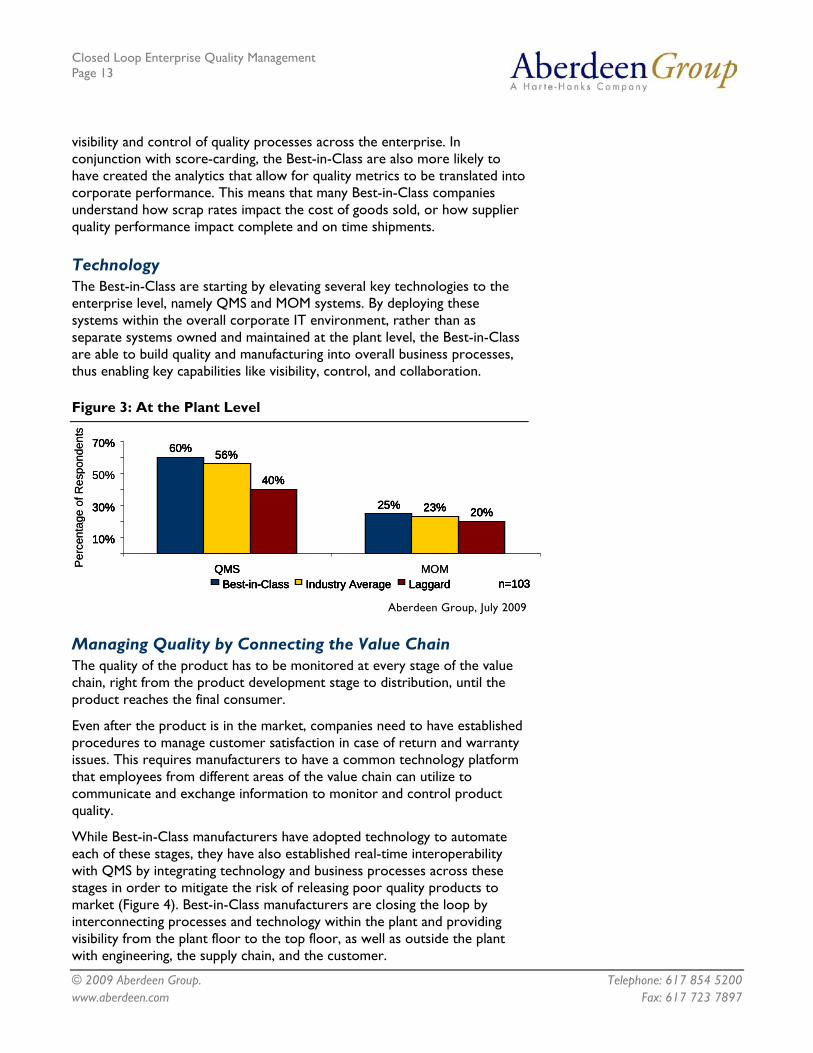
Technology The Best-in-Class are starting by elevating several key technologies to the enterprise level, namely QMS and MOM systems. By deploying these systems within the overall corporate IT environment, rather than as separate systems owned and maintained at the plant level, the Best-in-Class are able to build quality and manufacturing into overall business processes, thus enabling key capabilities like visibility, control, and collaboration.
Figure 3: At the Plant Level
60%
25%
56%
23%
40%
20%
10%
30%
50%
70%
QMSPer
cent
age
of R
espo
nden
ts
Best-in-Class Industry Average Laggard n=103
60%
25%
56%
23%
40%
20%
10%
30%
70%
QMS MOMBest-in-Class Industry Average Laggard n=103
60%
25%
56%
23%
40%
20%
10%
30%
50%
70%
QMSPer
cent
age
of R
espo
nden
ts
Best-in-Class Industry Average Laggard n=103
60%
25%
56%
23%
40%
20%
10%
30%
70%
QMS MOMBest-in-Class Industry Average Laggard n=103
Aberdeen Group, July 2009
Managing Quality by Connecting the Value Chain The quality of the product has to be monitored at every stage of the value chain, right from the product development stage to distribution, until the product reaches the final consumer.
Even after the product is in the market, companies need to have established procedures to manage customer satisfaction in case of return and warranty issues. This requires manufacturers to have a common technology platform that employees from different areas of the value chain can utilize to communicate and exchange information to monitor and control product quality.
While Best-in-Class manufacturers have adopted technology to automate each of these stages, they have also established real-time interoperability with QMS by integrating technology and business processes across these stages in order to mitigate the risk of releasing poor quality products to market (Figure 4). Best-in-Class manufacturers are closing the loop by interconnecting processes and technology within the plant and providing visibility from the plant floor to the top floor, as well as outside the plant with engineering, the supply chain, and the customer.
www.aberdeen.com Fax: 617 723 7897

Closed Loop Enterprise Quality Management Page 14
© 2009 Aberdeen Group. Telephone: 617 854 5200
Figure 4: Real-Time Interoperability with QMS
ERP (EnterpriseResourcePlanning)
SCM (SupplyChain
Management)
CRM (CustomerRelationshipManagement)
MES / MOM PLM (ProductLifecycle
Management)
Per
cent
age
of R
espo
nden
ts
Best-in-Class Industry Average Laggard n=103
73%67% 63%
50% 50%44%
50% 50%
31%
50%
33%
20%
33%
20%
0%0%
20%
40%
60%
80%
0%
20%
40%
60%
80%
ERP (EnterpriseResourcePlanning)
SCM (SupplyChain
Management)
CRM (CustomerRelationshipManagement)
MES / MOM PLM (ProductLifecycle
Management)
Best-in-Class Industry Average Laggard n=103
ERP (EnterpriseResourcePlanning)
SCM (SupplyChain
Management)
CRM (CustomerRelationshipManagement)
MES / MOM PLM (ProductLifecycle
Management)
Per
cent
age
of R
espo
nden
ts
Best-in-Class Industry Average Laggard n=103
73%67% 63%
50% 50%44%
50% 50%
31%
50%
33%
20%
33%
20%
0%0%
20%
40%
60%
80%
0%
20%
40%
60%
80%
ERP (EnterpriseResourcePlanning)
SCM (SupplyChain
Management)
CRM (CustomerRelationshipManagement)
MES / MOM PLM (ProductLifecycle
Management)
Best-in-Class Industry Average Laggard n=103 Source: Aberdeen Group, July 2009
Technology Enablers "Traceability, SPC, document control, and calibration have all helped reduce lead time, minimize mistakes, improve control and reduce variability."
~ Manager, Quality Large Paper Company
In addition to benchmarking the technology adoption rates for manufacturers operating at different performance levels, Aberdeen also analyzes the adoption of specific technology modules that differentiate Best-in-Class performance.
Figure 5: Technology Enabling Functionality
7%
14%
14%
24%
10%
27%
27%
38%
21%
37%
37%
53%
0% 10% 20% 30% 40% 50% 60%
APQP
Supplier Quality Management
Dashboards
NC/CAPA
Percentage of Respondents, n=103
LaggardIndustry AverageBest-in-Class
7%
14%
14%
24%
10%
27%
27%
38%
21%
37%
37%
53%
0% 10% 20% 30% 40% 50% 60%
APQP
Supplier Quality Management
Dashboards
NC/CAPA
Percentage of Respondents, n=103
LaggardIndustry AverageBest-in-Class
7%
14%
14%
24%
10%
27%
27%
38%
21%
37%
37%
53%
0% 10% 20% 30% 40% 50% 60%
APQP
Supplier Quality Management
Dashboards
NC/CAPA
Percentage of Respondents, n=103
LaggardIndustry AverageBest-in-Class
7%
14%
14%
24%
10%
27%
27%
38%
21%
37%
37%
53%
0% 10% 20% 30% 40% 50% 60%
APQP
Supplier Quality Management
Dashboards
NC/CAPA
Percentage of Respondents, n=103
LaggardIndustry AverageBest-in-Class
Source: Aberdeen Group, July 2009
The technology enablers shown in Figure 5 align directly to the capabilities discussed in Table 3. Best-in-Class manufacturers are more likely to utilize technology for document management, traceability, dashboards, and Advanced Product and Quality Planning (APQP). These technologies enable manufacturers to gain real-time role-based visibility into the quality process across manufacturing operations. Best-in-Class manufacturers are also more likely to adopt SPC and Non Conformance / Corrective and Preventive Action (NC / CAPA) to perform root cause analysis for an adverse event and to provide predictive analytics based on captured quality data.
www.aberdeen.com Fax: 617 723 7897

Closed Loop Enterprise Quality Management Page 15
© 2009 Aberdeen Group. Telephone: 617 854 5200
Chapter Three: Required Actions
Fast Facts
√ Create and / or improve visibility of quality processes across the design make and deliver business processes
√ Implement both QMS and MOM systems at the enterprise-wide level
√ Establish real-time interoperability between QMS and other enterprise systems, specifically: PLM, MOM, and SCM
Whether a company is trying to move its performance in enterprise quality management from Laggard to Industry Average, or Industry Average to Best-in-Class, the following actions will help spur the necessary performance improvements:
Laggard Steps to Success • Standardize processes for responding to adverse events
across the enterprise. Best-in-Class manufacturers are more than two-times as likely as Laggard companies to adopt such a capability, which is the first step to viewing quality as an enterprise level issue rather than a plant level issue.
• Establish senior executive focus on quality management. This will enable Laggard manufacturers to secure resources from senior management to streamline quality operations across the enterprise. It will also lend legitimacy to continuous improvement team efforts in the area of enterprise quality management.
• Establish strategies to improve visibility and control into quality processes across manufacturing operations and the supply chain. It is not possible to improve the quality of a product if it is not visible or measured. The first step to successful quality management program for Laggard manufacturers is to gain that visibility to effectively manage product quality, through the adoption of a quality management system.
Industry Average Steps to Success • Implement quality management systems at an enterprise-
wide level. Far too many organizations performing at the Industry Average level are still deploying quality systems at the plant level (46%). As manufacturers start to manage the quality of the product across the value chain, enterprise-wide adoption of QMS will provide a common platform to interoperate with other enterprise applications, share best practices, and increase responsiveness in case of an adverse event.
• Establish cross-functional continuous improvement teams that focus on improving enterprise quality processes. While Industry Average manufacturers are over 40% more likely than Laggards to gain executive sponsorship, these manufacturers need to bolster collaboration with production, engineering, suppliers, and procurement by establishing cross-functional teams that cross the boundaries of a traditional plant.
• Invest in technology to automate SPC and NC / CAPA capabilities. Best-in-Class manufacturers are investing in specific quality modules that are helping to perform at an elevated level.
www.aberdeen.com Fax: 617 723 7897

Closed Loop Enterprise Quality Management Page 16
© 2009 Aberdeen Group. Telephone: 617 854 5200 www.aberdeen.com Fax: 617 723 7897
Automating SPC and NC / CAPA enables manufacturers to monitor quality data in real-time, send alerts in case of non-conformance, and help manufacturers initiate corrective and preventive action to reduce losses due to a non-conformance.
• Use real-time data to perform root cause analysis for adverse events. Currently, only a third of Industry Average manufacturers are utilizing real-time information to perform root cause analysis for adverse events. The outcome of root cause analysis is critical to prevent future failure and can result in reduction of overall cost of quality.
Best-in-Class Steps to Success • Invest in technology across the value chain and establish
real-time interoperability between these technology solutions. Best-in-Class manufacturers need to adopt technology to automate different aspects of value chain, including product development (PLM), production (MOM), and supply chain planning and distribution (SCM). These technologies need to have real-time interoperability, thus providing Best-in-Class manufacturers with the ability to have complete control over the role quality management plays in these processes.
• Improve real-time visibility into supplier quality performance. While Best-in-Class manufacturers are leading in the ability to gain real-time visibility into supplier performance when compared to all other companies, less than half of Best-in-Class manufacturers currently have such visibility into suppliers. It is critical for Best-in-Class manufacturers to gain visibility into suppliers by integrating supply chain management with quality management solutions, to remain at the top performance level and to control product quality outside the plant.
• Take a risk based approach to the use of CAPA and other quality management tools. To truly ensure sustainable improvements to quality execution it is important to take a risk based approach. What the Best-in-Class are now focusing on is closing high value CAPAs, those with the highest risk profile, first. This ensures that the quality issues that should deserve the majority of attention do and that lasting results are enjoyed.

Closed Loop Enterprise Quality Management Page 17
© 2009 Aberdeen Group. Telephone: 617 854 5200 www.aberdeen.com Fax: 617 723 7897
Aberdeen Insights — Technology
Best-in-Class manufacturers are automating these capabilities by implementing QMS at an enterprise-wide level and establishing real-time interoperability with PLM, MOM, and SCM technology. However, transforming the enterprise in a way that enables the execution of this vision often requires transitioning from a disconnected set of quality and business processes to an automated and uniform set of integrated workflows.
By successfully adopting all the aforementioned capabilities, Best-in-Class manufacturers are able to realize 89% OEE, 99% on-time and complete shipments, 2.5 hours response time to non-conforming shipments, 99% compliance in production, 14% of corrective and preventive actions are recurring, and a 65% reduction in engineering change orders. Manufacturers planning to realize such a performance benefit should effectively adopt all the capabilities mentioned in this research project based on their respective maturity stage.
Closed Loop Enterprise Quality Management Page 18
© 2009 Aberdeen Group. Telephone: 617 854 5200
Appendix A: Research Methodology
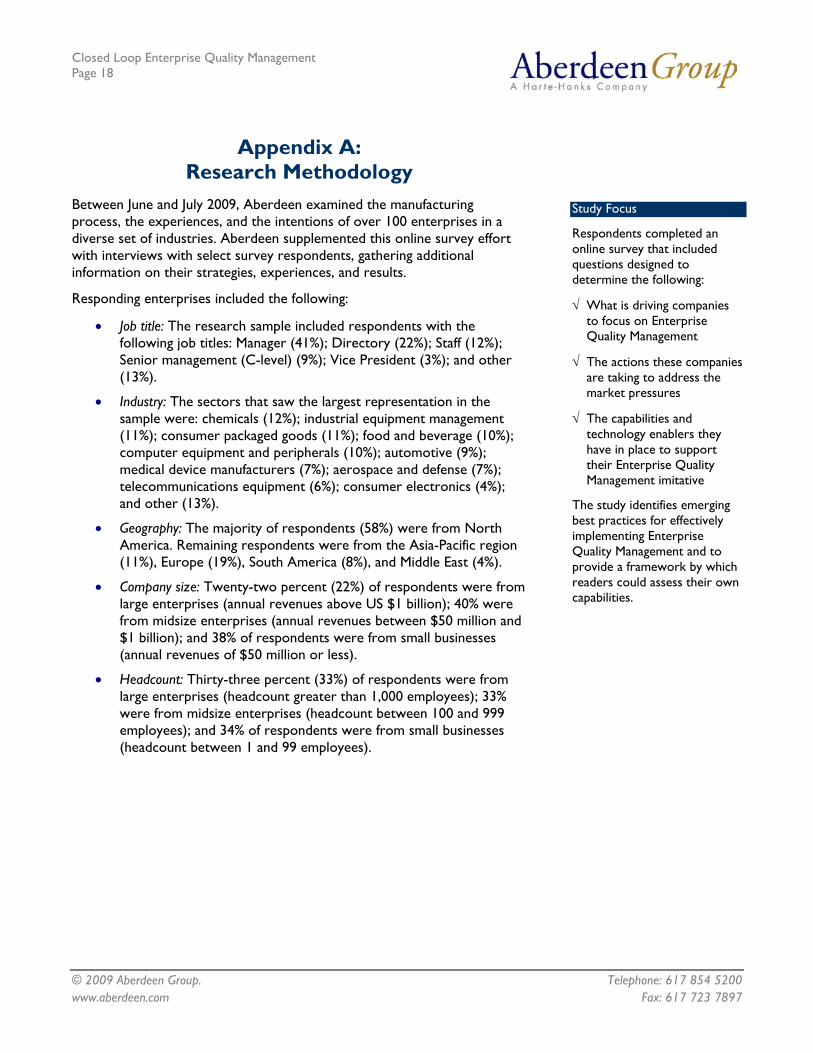
Between June and July 2009, Aberdeen examined the manufacturing process, the experiences, and the intentions of over 100 enterprises in a diverse set of industries. Aberdeen supplemented this online survey effort with interviews with select survey respondents, gathering additional information on their strategies, experiences, and results.
Study Focus
Responding [retail] executivcompleted an online survey that included questionsdesigned to determine th
es
e
following:
√ FID is il
operations and the financial
The degree to which Rdeployed in their reta
implications of the technology
√ The structure and ing effectiveness of exist
RFID implementations
Current and planned useRFID to aid operationa
√ of l and
promotional activities
√ The benefits, if any, that habeen derived from RFIinitiatives
The study aimed to identify emerging be
ve D
st practices for [RFID] usage in [retail], and to rovide a framework by which p
Study Focus
Respondents completed an online survey that included questions designed to determine the following:
√ What is driving companies to focus on Enterprise Quality Management
√ The actions these companies are taking to address the market pressures
√ The capabilities and technology enablers they have in place to support their Enterprise Quality Management imitative
The study identifies emerging best practices for effectively implementing Enterprise Quality Management and to provide a framework by which readers could assess their own capabilities.
Responding enterprises included the following:
• Job title: The research sample included respondents with the following job titles: Manager (41%); Directory (22%); Staff (12%); Senior management (C-level) (9%); Vice President (3%); and other (13%).
• Industry: The sectors that saw the largest representation in the sample were: chemicals (12%); industrial equipment management (11%); consumer packaged goods (11%); food and beverage (10%); computer equipment and peripherals (10%); automotive (9%); medical device manufacturers (7%); aerospace and defense (7%); telecommunications equipment (6%); consumer electronics (4%); and other (13%).
• Geography: The majority of respondents (58%) were from North America. Remaining respondents were from the Asia-Pacific region (11%), Europe (19%), South America (8%), and Middle East (4%).
• Company size: Twenty-two percent (22%) of respondents were from large enterprises (annual revenues above US $1 billion); 40% were from midsize enterprises (annual revenues between $50 million and $1 billion); and 38% of respondents were from small businesses (annual revenues of $50 million or less).
• Headcount: Thirty-three percent (33%) of respondents were from large enterprises (headcount greater than 1,000 employees); 33% were from midsize enterprises (headcount between 100 and 999 employees); and 34% of respondents were from small businesses (headcount between 1 and 99 employees).
www.aberdeen.com Fax: 617 723 7897
Closed Loop Enterprise Quality Management Page 19
© 2009 Aberdeen Group. Telephone: 617 854 5200
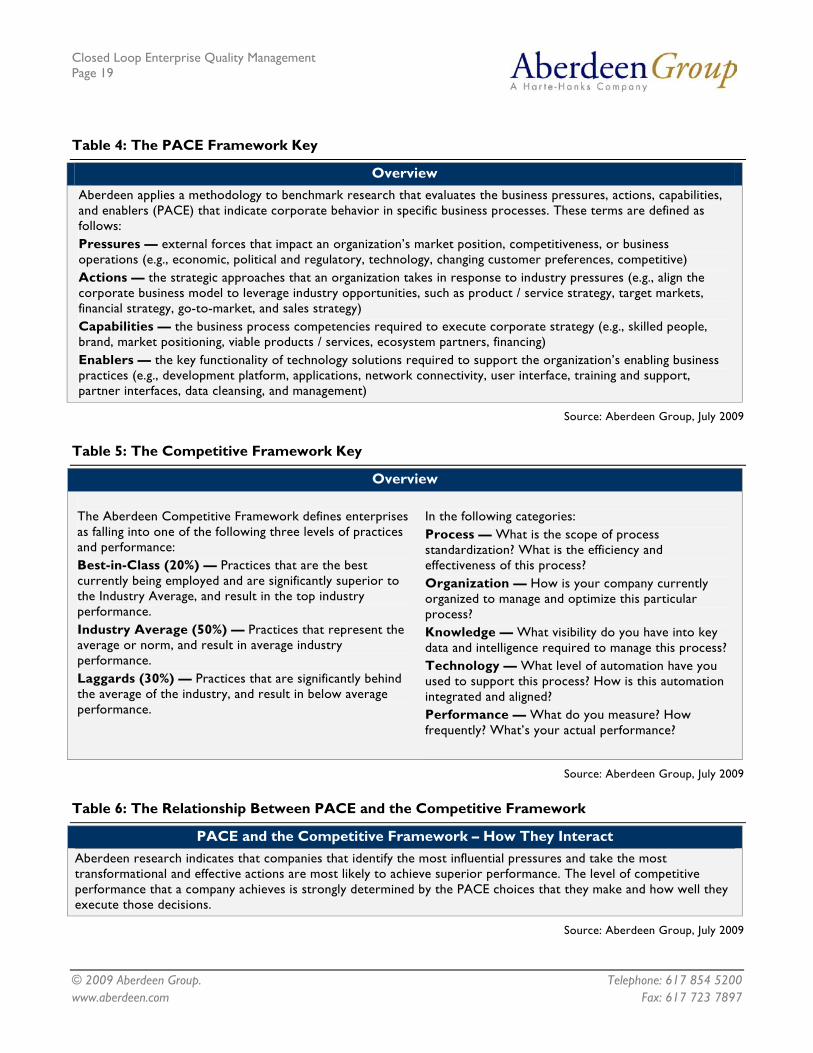
Table 4: The PACE Framework Key
Overview Aberdeen applies a methodology to benchmark research that evaluates the business pressures, actions, capabilities, and enablers (PACE) that indicate corporate behavior in specific business processes. These terms are defined as follows: Pressures — external forces that impact an organization’s market position, competitiveness, or business operations (e.g., economic, political and regulatory, technology, changing customer preferences, competitive) Actions — the strategic approaches that an organization takes in response to industry pressures (e.g., align the corporate business model to leverage industry opportunities, such as product / service strategy, target markets, financial strategy, go-to-market, and sales strategy) Capabilities — the business process competencies required to execute corporate strategy (e.g., skilled people, brand, market positioning, viable products / services, ecosystem partners, financing) Enablers — the key functionality of technology solutions required to support the organization’s enabling business practices (e.g., development platform, applications, network connectivity, user interface, training and support, partner interfaces, data cleansing, and management)
Source: Aberdeen Group, July 2009
Table 5: The Competitive Framework Key
Overview The Aberdeen Competitive Framework defines enterprises as falling into one of the following three levels of practices and performance: Best-in-Class (20%) — Practices that are the best currently being employed and are significantly superior to the Industry Average, and result in the top industry performance. Industry Average (50%) — Practices that represent the average or norm, and result in average industry performance. Laggards (30%) — Practices that are significantly behind the average of the industry, and result in below average performance.
In the following categories: Process — What is the scope of process standardization? What is the efficiency and effectiveness of this process? Organization — How is your company currently organized to manage and optimize this particular process? Knowledge — What visibility do you have into key data and intelligence required to manage this process? Technology — What level of automation have you used to support this process? How is this automation integrated and aligned? Performance — What do you measure? How frequently? What’s your actual performance?
Source: Aberdeen Group, July 2009
Table 6: The Relationship Between PACE and the Competitive Framework
PACE and the Competitive Framework – How They Interact Aberdeen research indicates that companies that identify the most influential pressures and take the most transformational and effective actions are most likely to achieve superior performance. The level of competitive performance that a company achieves is strongly determined by the PACE choices that they make and how well they execute those decisions.
Source: Aberdeen Group, July 2009
www.aberdeen.com Fax: 617 723 7897
Closed Loop Enterprise Quality Management Page 20
© 2009 Aberdeen Group. Telephone: 617 854 5200 www.aberdeen.com Fax: 617 723 7897
Appendix B: Related Aberdeen Research
Related Aberdeen research that forms a companion or reference to this report includes:
• The Cost of Quality: Defining the Value of Enterprise Quality Management; August 2008
• Global Manufacturing Operations Management; August 2008
• Manufacturing Operations Management: The Next Generation of Manufacturing System; January 2008
• Compliance and Traceability in Manufacturing; December 2007
• The Cost of Quality: Benchmarking Enterprise Quality Management; July 2007
Information on these and any other Aberdeen publications can be found at www.aberdeen.com.
Author(s): Matthew Littlefield, Sr. Research Analyst, Manufacturing, ([email protected])
Mehul Shah, Research Analyst, Manufacturing ([email protected])
Since 1988, Aberdeen's research has been helping corporations worldwide become Best-in-Class. Having benchmarked the performance of more than 644,000 companies, Aberdeen is uniquely positioned to provide organizations with the facts that matter — the facts that enable companies to get ahead and drive results. That's why our research is relied on by more than 2.2 million readers in over 40 countries, 90% of the Fortune 1,000, and 93% of the Technology 500.
As a Harte-Hanks Company, Aberdeen plays a key role of putting content in context for the global direct and targeted marketing company. Aberdeen's analytical and independent view of the "customer optimization" process of Harte-Hanks (Information – Opportunity – Insight – Engagement – Interaction) extends the client value and accentuates the strategic role Harte-Hanks brings to the market. For additional information, visit Aberdeen http://www.aberdeen.com or call (617) 723-7890, or to learn more about Harte-Hanks, call (800) 456-9748 or go to http://www.harte-hanks.com.
This document is the result of primary research performed by Aberdeen Group. Aberdeen Group's methodologies provide for objective fact-based research and represent the best analysis available at the time of publication. Unless otherwise noted, the entire contents of this publication are copyrighted by Aberdeen Group, Inc. and may not be reproduced, distributed, archived, or transmitted in any form or by any means without prior written consent by Aberdeen Group, Inc. 05062009a