Cloning, expression, purification and characterization of ... Boesen.pdf · enzymets regulering og...
188
General rights Copyright and moral rights for the publications made accessible in the public portal are retained by the authors and/or other copyright owners and it is a condition of accessing publications that users recognise and abide by the legal requirements associated with these rights. Users may download and print one copy of any publication from the public portal for the purpose of private study or research. You may not further distribute the material or use it for any profit-making activity or commercial gain You may freely distribute the URL identifying the publication in the public portal If you believe that this document breaches copyright please contact us providing details, and we will remove access to the work immediately and investigate your claim. Downloaded from orbit.dtu.dk on: Aug 24, 2019 Cloning, expression, purification and characterization of tryptophan hydroxylase variants Boesen, Jane Publication date: 2010 Document Version Publisher's PDF, also known as Version of record Link back to DTU Orbit Citation (APA): Boesen, J. (2010). Cloning, expression, purification and characterization of tryptophan hydroxylase variants. DTU Chemistry.
Transcript of Cloning, expression, purification and characterization of ... Boesen.pdf · enzymets regulering og...

General rights Copyright and moral rights for the publications made accessible in the public portal are retained by the authors and/or other copyright owners and it is a condition of accessing publications that users recognise and abide by the legal requirements associated with these rights.
Users may download and print one copy of any publication from the public portal for the purpose of private study or research.
You may not further distribute the material or use it for any profit-making activity or commercial gain
You may freely distribute the URL identifying the publication in the public portal If you believe that this document breaches copyright please contact us providing details, and we will remove access to the work immediately and investigate your claim.
Downloaded from orbit.dtu.dk on: Aug 24, 2019
Cloning, expression, purification and characterization of tryptophan hydroxylasevariants
Boesen, Jane
Publication date:2010
Document VersionPublisher's PDF, also known as Version of record
Link back to DTU Orbit
Citation (APA):Boesen, J. (2010). Cloning, expression, purification and characterization of tryptophan hydroxylase variants.DTU Chemistry.

Cloning, expression, purification and characterization of tryptophan
hydroxylase variants
Jane Boesen
Metalloprotein Chemistry and Engineering Group Department of Chemistry
Technical University of Denmark June 2010


I
Cloning, expression, purification and characterization of tryptophan hydroxylase
variants
Ph.D. project by
Jane Boesen
Supervisor:
Hans Erik Mølager Christensen
Metalloprotein Chemistry and Engineering Group
Department of Chemistry
Technical University of Denmark
2010
Front cover figure: Structure of the catalytic domain of human tryptophan hydroxylase isoform 1


III
Preface and acknowledgement
This Ph.D. project, entitled “Cloning, expression, purification and characterization of tryptophan
hydroxylase variants”, was performed in the Metalloprotein Chemistry and Engineering Group,
Department of Chemistry, Technical University of Denmark (DTU). The Ph.D. scholarship was
founded by DTU. The project was supervised by Associate Professor Hans E. M. Christensen.
First of all I would like to thank my supervisor Associate Professor Hans E. M. Christensen for his
help and guidance during this project. Also thanks to the Technical University of Denmark who
provided me with financial means to complete this project. I would also like to thanks members
of the research group here at DTU who helped me in my work: Ph.D. student Lærke T. Haahr,
Ph.D. student Trine V. Vendelboe, Laboratory Technicians Lise-Lotte Jespersen, Martin H.
Pedersen and Stefanie Boy, Ph.D. student Maja Martic and other members of the group for
providing a pleasant atmosphere. Also thanks to Ph.D. Michael S. Windahl for his previous work
on tryptophan hydroxylase.
I would also like to thank Professor Carol V. Robinson, for letting me do the mass spectrometric
characterization in her mass spectrometry group, Department of Chemistry, University of
Cambridge, UK. I would especially like to thank Dr. Elisabetta Boeri Erba for her great advice and
enthusiasm in this project. I would also like to thanks Dr. Min Zou and the other members of the
group. Financial support for my stay in UK was provided by Otto Mønsteds Foundation (13.000
kr) and the Danish Chemical Society (5000 kr). I would like to thank both of these foundations for
supporting my work.
Finally, I would like to thank Associate Professor Ole Kristensen, Department of Medicinal
Chemistry, Faculty of Pharmaceutical Sciences, University of Copenhagen for helping me with the
crystallization part (data collection, structure solution and refinement) and Associate Professor
Lars Hellgreen, Department of Systems Biology, Technical University of Denmark for letting me
use their ultracentrifuge.
____________________________
Jane Boesen
Kgs. Lyngby, June 2010


V
Abstract
Tryptophan hydroxylase (TPH) catalyzes the first and rate-limiting step in the biosynthesis of the
neurotransmitter and hormone serotonin (5-hydroxytryptamine). Serotonin is involved in many
physiological functions, such as appetite and sleep rhythm, as well as a wide range of psychiatric
disorders such as depression and obsessive-compulsive disorder (OCD). Characterization of TPH
and elucidation of the enzymes regulation and catalytic mechanism is therefore vital to our
understanding of the serotonin balance.
This study concerns variants of both human TPH isoform 1 (hTPH1) and human TPH isoform 2
(hTPH2). The main goal was to purify full-length hTPH1. Based on earlier results, hTPH1 was
purified using detergent in the purification methods. After incubation of the hTPH1 sample with
0.1 % of n-dodecyl-β-D-maltopyranoside (DDM) the protein binds to the anion exchange column
and elutes over a large area in the anion exchange, indicating that the protein still exists in
different oligomer forms. This was also observed in the gel filtration. Variants of both hTPH1 and
hTPH2 containing the regulatory domain or parts of it were constructed and tested for expression
in Escherichia coli as well as solubility. It was observed that changes in the amino acid sequence
of the regulatory domain by point mutations or truncations in the N-terminal had a huge impact
on the solubility of the protein and caused the protein to be insoluble.
The regulatory domain of human TPH1 (rhTPH1), and two fusion proteins of rhTPH1 fused to the
green fluorescent protein (GFP) in the C-terminal and the glutathione S-transferase (GST) in the
N-terminal, respectively, were expressed in a soluble form. The purification trials of the variants
containing the regulatory domain showed that a high salt concentration was necessary to
stabilize the variant. The GST-rhTPH1 variant could be purified using affinity chromatography
followed by gel filtration with high purity and a yield of 40 mg/l culture. The purified GST-rhTPH1
exists as a dimer in solution due to dimerization of GST. The GST could be cleaved successfully
from the fusion protein using Factor Xa and rhTPH1 was successfully purified from GST after
cleavage.
Characterization was performed on the three hTPH variants: The catalytic domain of both hTPH1
(chTPH1) and hTPH2 (chTPH2) as well as the catalytic and tetramerization domain of hTPH2
(cthTPH2). The kinetic parameters of chTPH1 was determined and compared with parameters of
Abstract
VI
chTPH2. Large differences were observed between the two isoforms and tryptophan inhibition
was observed for chTPH1 but not for chTPH2.
Mass spectrometric analysis of chTPH1 shows that the sample contains two species: chTPH1 and
another species, which could not be seen during purification or electrophoresis of the chTPH1
sample. Additionally, chTPH1 shows to be fully loaded with iron, whereas chTPH2 showed to be
heterogeneous with respect to Fe. chTPH2 binds both tryptophan and tetrahydrobiopterin
individually. Also characterization of cthTPH2 by tandem mass spectrometry shows that the
variant is a tetramer.
Crystallization of chTPH1 was achieved both without substrate and with bound substrate
(tryptophan and pterin) but resulted in very small crystals. A data set of the variant without
bound substrate was collected to 4 Å and the structure was solved by molecular replacement.
The structure was refined to an Rfree of 33.5 % and the overall structure is compared to the overall
structure of the catalytic domain of hTPH1 co-crystallized with BH2. A structural change in the
residues 125 to 130 is observed. This is the first structure of chTPH1 without any substrates or
inhibitors.
VII
Dansk resumé
Tryptophanhydroxylase (TPH) katalyserer det første og hastighedsbestemmende trin i
biosyntesen af serotonin (5-hydroxytryptamin). Serotonin er involveret i mange fysiologiske
funktioner, såsom appetit og søvnrytme, samt en lang række af psykiske sygdomme, som
depression og obsessiv-kompulsiv lidelse (OCD). Karakterisering af TPH og bestemmelse af
enzymets regulering og katalytiske mekanisme er derfor vigtig for forståelsen af serotonin.
I dette projekt er varianter af human TPH isoform 1 (hTPH1) and human TPH isoform 2 (hTPH2)
blevet studeret. Det overordnede mål var at oprense fuldlængde hTPH1. På baggrund af tidligere
resultater blev hTPH1 oprenset med anvendelse af detergent i oprensningsmetoden. Efter
inkubering af hTPH1 prøven med 0.1 % of n-dodecyl-β-D-maltopyranosid (DDM) kan proteinet
binde til anionbytterkolonnen. Den del af hTPH1 som binder til kolonnen eluerer over et stort
område i anionbytningen, hvilket understreger at protein stadig findes på forskellige oligomere
former. Dette ses også i gelfiltreringen. Varianter af både hTPH1 og hTPH2 indeholdende det
regulatoriske domæne eller dele af dette blev fremstillet og testet for udtrykkelse i Escherichia
coli samt opløselighed. Fra disse resultater blev det observeret at en ændring af aminosyre-
sekvensen i det regulatoriske domæne, enten i form af punktmutation eller ved trunkering i den
N-terminale ende, gør at proteinet er uopløseligt.
Det regulatoriske domæne af human TPH1 (rhTPH1) samt to fusionsproteiner af rhTPH1
fusioneret til henholdsvis det grønt-fluorescerende-protein (GFP) i den C-terminale ende og
glutathione S-transferase (GST) i den N-terminale ende blev udtrykt i opløselig form. Fra
oprensningsforsøg blev det observeret at en høj salt-koncentration er nødvendig for stabilisering
af proteinet. GST-rhTPH1 varianten blev oprenset ved anvendelse af affinitetskromatografi
efterfulgt af gelfiltrering til høj renhed og et udbytte på 40 mg/l kultur. Den oprensede GST-
rhTPH1 variant eksisterer som en dimer i opløsning på grund af dimerisering af GST. GST blev
succesfuldt kløvet fra fusionsproteinet med Faktor Xa og rhTPH1 adskilt fra GST efter kløvning.
Dette studie omhandler også karakterisering af tre hTPH varianter; Det katalytiske domæne af
både hTPH1 (chTPH1) og hTPH2 (chTPH2) samt det katalytiske og tetrameriseringsdomænet af
hTPH2 (cthTPH2). De kinetiske parametre for chTPH1 blev bestemt og sammenlignet med
værdier for chTPH2. Der ses en stor forskel mellem de to isoformer og substratinhibering af
tryptophan observeres for chTPH1, men ikke for chTPH2.
Dansk resumé
VIII
Massespektrometrisk analyse af chTPH1 viste at prøven indeholder to proteiner: chTPH1 samt et
andet protein, som ikke kunne observeres i hverken oprensningen af proteinet eller ved
elektroforese. Yderligere ses chTPH1 at være mættet med Fe, mens chTPH2 er heterogen med
hensyn til Fe. chTPH2 binder tryptophan og tetrahydrobiopterin. Tandem-massespektrometrisk
karakterisering af cthTPH2 viser at varianten er en tetramer.
Krystallisationsforsøg af chTPH1 blev udført til bestemmelse af krystallisationsbetingelser for
chTPH1 med og uden ligander. Krystallionsbetingelserne blev fundet, men resulterede i meget
små krystaller. Der blev opsamlet et datasæt til 4 Å af chTPH1 uden ligander og strukturen blev
løst. Strukturen blev forfinet og sammenlignet med strukturen af det katalytiske domæne af
hTPH1 krystalliseret med BH2. En strukturændring ses fra aminosyrerest 125 til 130. Dette er den
første struktur af chTPH1 uden tilstedeværelsen af substrater eller inhibitorer.

IX
List of abbreviations
AAAH Aromatic amino acid hydroxylase
ACN Acetonitrile
Amp Ampicillin
BH4 (6R)-5,6,7,8-tetrahydro-L-biopterin
BH2 (6R)-7,8-dihydro-L-bioterin
Cam Chloramphenicol
CID Collision-induced-dissociation
CIP Calf intestinal phosphatase
CMC Critical micelle concentration
exCMC Experimental critical micelle concentration
CRM Charged residue model
CV Column volume
DC Direct current
DDM n-dodecyl-β-D-maltopyranoside
DP Declustering potential
DoF Degrees of freedom
DOPA 3,4-dihydroxyphenylalanine
E. coli Escherichia coli
EDTA Ethylenediamine tetraacetate
ESI Electrospray ionization
FP Focusing potential
GST Glutathione S-transferase
GFP Green fluorescent protein
frGFP Green fluorescent protein folding reporter
HEPES 4-(2-hydroxyethyl)-piperazine-1-ethanesulfonic acid
IEM Ion evaporation model
IPTG Isopropyl-β-D-thiogalactopyranoside
Kan Kanamycin sulfate
LAF Laminar air flow
LB Luria Bertani
n/a Non applicable

List of abbreviations
X
MALDI Matrix-assisted laser desorption ionization
MBP Maltose-binding protein
MCP Microchannel plate
m/z Mass-to-charge
MS Mass spectrometry
nanoESI Nanoelectrospray ionization
NIH National Institutes of Health
OCD Obsessive compulsive disorder
OD600 Optical density at 600 nm
PAH Phenylalanine hydroxylase
hPAH Human phenylalanine hydroxylase
PCR Polymerase chain reaction
PEG Polyethylene glycol
PTM Photomultiplicator tube
RF Radio frequency
SDS-Page Sodium dodecyl sulfate polyamide gel electrophoresis
SS Sum of squares
TPH Tryptophan hydroxylase
TPH1 Tryptophan hydroxylase isoform 1
TPH2 Tryptophan hydroxylase isoform 2
hTPH1 Human tryptophan hydroxylase isoform 1
hTPH2 Human tryptophan hydroxylase isoform 2
ggTPH Gallus gallus (chicken) TPH
cTPH Catalytic domain of TPH
rTPH Regulatory domain of TPH
tTPH Tetramerization domain of TPH
TH Tyrosine hydroxylase
hTH4 Human tyrosine hydroxylase isoform 4
TIR Translation initiation region
TOF Time-of-flight
Tris Tris(hydroxymethyl)-aminomethane

XI
Contents
1 Introduction ....................................................................................................................... 1
1.1 Outline of the thesis ............................................................................................................... 2
2 Tryptophan hydroxylase ..................................................................................................... 3
2.1 The aromatic amino acid hydroxylases .................................................................................. 3
2.2 The two isoforms of tryptophan hydroxylase ........................................................................ 4
2.3 Structure of tryptophan hydroxylase ..................................................................................... 4
2.3.1 Sequence alignment of the aromatic amino acid hydroxylases ................................. 5
2.3.2 Three-dimensional structures of the catalytic domain ............................................... 7
2.3.2.1 Coordination of iron ..................................................................................... 9
2.3.3 The regulatory domain ............................................................................................... 9
2.3.3.1 The regulatory domain of TPH ..................................................................... 9
2.3.4 The tetramerization domain ..................................................................................... 10
2.4 The enzymatic mechanism ................................................................................................... 11
2.4.1 Formation of hydroxylating intermediate and oxygen activation ............................ 11
2.4.2 Mechanism of hydroxylation .................................................................................... 12
2.4.3 Regeneration of tetrahydrobiopterin ....................................................................... 12
2.4.4 Order of substrate binding........................................................................................ 13
2.5 Serotonin and its related disorders ...................................................................................... 13
3 Project background ........................................................................................................... 15
3.1 Experimental strategies ........................................................................................................ 15
4 Purification of full-length hTPH1 using detergent ............................................................... 17
4.1 Purification using detergent ................................................................................................. 17
4.1.1 Solubilization and isolation using detergent............................................................. 17

Contents
XII
4.1.1.1 Release of hTPH1 using detergent ............................................................. 18
4.2 Experimental procedures ..................................................................................................... 18
4.2.1 Materials ................................................................................................................... 18
4.2.2 Expression ................................................................................................................. 18
4.2.3 Release of membrane-associated hTPH1 ................................................................. 19
4.2.3.1 Preparation of raw extract ......................................................................... 19
4.2.3.2 Ultracentrifugation ..................................................................................... 19
4.2.3.3 Ultracentrifugation using different detergent concentrations .................. 19
4.2.4 Purification of membrane-associated hTPH1 ........................................................... 20
4.2.4.1 Purification tests ......................................................................................... 20
4.2.4.2 Anion exchange with DDM at the CMC ...................................................... 20
4.2.4.3 Gel filtration ............................................................................................... 21
4.2.5 Determination of the critical micelle concentration ................................................. 21
4.2.6 Activity measurements ............................................................................................. 22
4.2.7 SDS-page and Western blotting analysis .................................................................. 22
4.2.8 Protein identification by mass spectrometry ............................................................ 22
4.3 Results .................................................................................................................................. 23
4.3.1 Release of membrane-associated TPH1 ................................................................... 23
4.3.1.1 Ultracentrifugation ..................................................................................... 23
4.3.1.2 Ultracentrifugation using different detergent concentrations .................. 24
4.3.1.3 Summary..................................................................................................... 25
4.3.2 Purification of membrane-associated hTPH1 ........................................................... 25
4.3.2.1 Purification test .......................................................................................... 25
4.3.2.2 Anion exchange with DDM at the exCMC .................................................. 27
4.3.2.3 Gel filtration ............................................................................................... 30
4.3.3 Protein identification ................................................................................................ 30
4.3.4 Summary and overall discussion ............................................................................... 31
4.4 Conclusion ............................................................................................................................ 32
5 Construction of E. coli strains for expression of hTPH variants ........................................... 33
5.1 Strategies used for construction of expression strains ........................................................ 33
5.2 Construction of hTPH1 strains .............................................................................................. 34
5.2.1 Production of gene of interest .................................................................................. 34
5.2.1.1 Gene design ................................................................................................ 34

Contents
XIII
5.2.1.2 Gene amplification ..................................................................................... 35
5.2.2 Construction of expression vectors .......................................................................... 36
5.2.2.1 pET-expression vector system .................................................................... 36
5.2.2.2 Construction of hTPH1 pET-expression vectors ......................................... 36
5.2.3 Construction of expression strains ........................................................................... 36
5.3 Construction of fusion tag expression strains ...................................................................... 36
5.3.1 GFP fusion tag ........................................................................................................... 37
5.3.1.1 Waldo-GFP expression vector .................................................................... 37
5.3.1.2 Construction of the rhTPH1-frGFP expression strain ................................. 37
5.3.1.3 Constructions of mutation in the 3,4-hydrophobic face of rhTPH1 ........... 38
5.3.2 GST fusion tag ........................................................................................................... 39
5.3.2.1 pGEX-5X-1 fusion vector system ................................................................ 39
5.3.2.2 Construction of the GST-rhTPH1 expression strain .................................... 39
5.4 Construction of hTPH2 expression strains ........................................................................... 39
5.4.1 Gene design .............................................................................................................. 39
5.4.2 Constructions of hTPH2 expression strains .............................................................. 41
5.5 Experimental procedures ..................................................................................................... 41
5.5.1 Materials and chemicals ........................................................................................... 41
5.5.2 Production of genes .................................................................................................. 41
5.5.2.1 Primer design for amplification with PCR .................................................. 41
5.5.2.2 Primer design for PCR-based site-directed mutagenesis ........................... 42
5.5.2.3 PCR amplification and PCR-based site-directed mutagenesis ................... 42
5.5.2.4 Preparation of agarose gels ....................................................................... 43
5.5.2.5 Separation of DNA by preparative gel electrophoresis.............................. 44
5.5.2.6 Purification of DNA from agarose gels ....................................................... 44
5.5.2.7 Cloning of PCR-products into the PCR-Script cloning vector ..................... 44
5.5.2.8 Transformation of cloning vector into E. coli DH5α cells ........................... 44
5.5.2.9 Propagation of cells and glycerol stocks .................................................... 44
5.5.2.10 Plasmid purification .................................................................................. 44
5.5.2.11 Restriction enzyme analysis and gel electrophoresis ............................... 45
5.5.2.12 Sequencing ............................................................................................... 45
5.5.3 Construction of expression vectors .......................................................................... 46

Contents
XIV
5.5.3.1 Restriction enzyme digestion ..................................................................... 46
5.5.3.2 Separation af DNA fragments ..................................................................... 46
5.5.3.3 Ligation and transformation into E. coli DH5α cells ................................... 46
5.5.3.4 Analysis of ligation product ........................................................................ 46
5.5.4 Construction of expression strains ............................................................................ 47
5.6 Summary of results ............................................................................................................... 47
5.6.1 Production of hTPH gene variants ............................................................................ 47
5.6.2 Construction of expression vectors .......................................................................... 48
5.6.3 Construction of expression strains ............................................................................ 49
5.7 Summary and conclusion ..................................................................................................... 49
6 Expression and solubility test ............................................................................................ 51
6.1 Experimental procedures ..................................................................................................... 51
6.1.1 Materials and chemicals ........................................................................................... 51
6.1.2 Expression and solubility test .................................................................................... 51
6.1.2.1 Test expression and solubility test ............................................................. 51
6.1.2.2 Solubility test on large scale expression..................................................... 52
6.1.2.3 SDS-Page analysis ....................................................................................... 53
6.2 Results and discussion .......................................................................................................... 53
6.2.1 hTPH1 variants .......................................................................................................... 53
6.2.1.1 rhTPH1 ........................................................................................................ 53
6.2.1.2 rchTPH1 ...................................................................................................... 54
6.2.1.3 cthTPH1 ...................................................................................................... 54
6.2.1.4 Summary and overall discussion ................................................................ 55
6.2.2 rhTPH1-frGFP variants ............................................................................................... 56
6.2.2.1 rhTPH1-frGFP .............................................................................................. 56
6.2.2.2 Mutation in the 3,4-hydrophobic repeat in rhTPH1................................... 57
6.2.2.3 Summary..................................................................................................... 59
6.2.3 GST-rhTPH1 ............................................................................................................... 59
6.2.4 hTPH2 variants .......................................................................................................... 60
6.3 Summary and conclusion ..................................................................................................... 61
7 Purification of rhTPH1 variants ......................................................................................... 63
7.1 Introduction to the variants ................................................................................................. 63
7.2 Experimental procedures ..................................................................................................... 64

Contents
XV
7.2.1 Materials ................................................................................................................... 64
7.2.2 Expression ................................................................................................................. 64
7.2.3 Preparation of raw extract ........................................................................................ 65
7.2.3.1 Preparation of rhTPH1 and rhTPH1-frGFP ................................................. 65
7.2.3.2 Preparation of GST-rhTPH1 ........................................................................ 65
7.2.4 Purification of rhTPH1 ............................................................................................... 65
7.2.4.1 Anion exchange .......................................................................................... 65
7.2.4.2 Gel filtration ............................................................................................... 65
7.2.5 Purification of rhTPH1-frGFP .................................................................................... 66
7.2.5.1 Anion exchange .......................................................................................... 66
7.2.5.2 Stabilization by salt .................................................................................... 66
7.2.6 Purification of GST-rhTPH1 ....................................................................................... 66
7.2.6.1 GST affinity purification.............................................................................. 66
7.2.6.2 Gel filtration ............................................................................................... 67
7.2.6.3 Cleavage with Factor Xa ............................................................................. 67
7.2.6.4 Affinity removal of GST tag ........................................................................ 67
7.2.6.5 Mass spectrometric analysis on the LCT premier ...................................... 68
7.2.7 SDS-Page analysis and protein identification by MS ................................................ 68
7.3 Results and discussion .......................................................................................................... 68
7.3.1 Purification of rhTPH1 ............................................................................................... 68
7.3.1.1 Anion exchange .......................................................................................... 68
7.3.1.2 Gel filtration ............................................................................................... 70
7.3.1.3 Summary and overall discussion ................................................................ 71
7.3.2 Purification of rTPH1-frGFP fusion ............................................................................ 71
7.3.2.1 Anion exchange .......................................................................................... 71
7.3.2.2 Stabilization by salt .................................................................................... 73
7.3.2.3 Summary and overall discussion ................................................................ 75
7.3.3 Purification of GST-rhTPH1 ....................................................................................... 75
7.3.3.1 Summary .................................................................................................... 80
7.3.4 Overall summary and discussion .............................................................................. 80
7.3.5 Future directions ....................................................................................................... 81
7.4 Conclusion ............................................................................................................................ 81

Contents
XVI
8 Enzymatic characterization of the catalytic domain of hTPH1............................................. 83
8.1 Enzyme kinetic ...................................................................................................................... 83
8.1.1 Michaelis-Menten equation ...................................................................................... 83
8.1.1.1 Substrate inhibition .................................................................................... 84
8.1.2 Terreactant reaction ................................................................................................. 84
8.1.2.1 Determining the kinetic parameters for terreactant enzymes .................. 84
8.2 Tryptophan hydroxylase assay ............................................................................................. 85
8.2.1 Standard curves for 5-hydroxytryptophan................................................................ 86
8.3 Experimental procedures ..................................................................................................... 86
8.3.1 Materials ................................................................................................................... 86
8.3.2 Expression and purification of chTPH1 ..................................................................... 86
8.3.3 The tryptophan hydroxylase assay............................................................................ 87
8.3.3.1 Instrument and instrument settings .......................................................... 87
8.3.3.2 Preparation of chTPH1 samples ................................................................. 88
8.3.3.3 Composition of the assay solution ............................................................. 88
8.3.3.4 Calibration of the oxygen electrode and controlling the O2 flow .............. 89
8.3.3.5 Procedure for measuring the initial rate of 5-hydroxytryptophan formation
............................................................................................................ 89
8.3.3.6 Activity measurements of chTPH1 ............................................................. 90
8.3.3.7 Data acquisition .......................................................................................... 90
8.4 Results .................................................................................................................................. 90
8.4.1 Expression and purification ....................................................................................... 90
8.4.2 The kinetic parameters of chTPH1 ............................................................................ 91
8.5 Discussion ............................................................................................................................. 93
8.5.1 Expression and purification ....................................................................................... 93
8.5.2 Activity measurements of cTPH1 .............................................................................. 93
8.5.2.1 Mass spectrometric observations .............................................................. 94
8.6 Conclusion ............................................................................................................................ 94
9 Mass spectrometric analysis of hTPH variants ................................................................... 95
9.1 Mass spectrometry ............................................................................................................... 95
9.1.1 Electrospray ionization .............................................................................................. 95
9.1.1.1 Mechanism of Electrospray ionization ....................................................... 96
9.1.1.2 Nano electrospray ...................................................................................... 98

Contents
XVII
9.1.1.3 Electrospray spectra and mass determination .......................................... 99
9.1.1.4 Electrospray of non-covalent complexes ................................................. 101
9.1.2 Mass analyzers ........................................................................................................ 103
9.1.2.1 Quadrupole .............................................................................................. 103
9.1.2.2 TOF analyzer ............................................................................................. 104
9.1.3 Tandem mass spectrometry on large protein complexes ...................................... 105
9.1.4 Instrumentation ...................................................................................................... 105
9.2 Experimental procedures ................................................................................................... 106
9.2.1 Materials and chemicals ......................................................................................... 106
9.2.2 Sample preparation ................................................................................................ 107
9.2.3 Preparation of needles ........................................................................................... 107
9.2.4 MS and tandem MS measurements ....................................................................... 108
9.2.4.1 Determination of the apo-protein monomer mass ................................. 108
9.2.4.2 Mass spectrometry of intact hTPH ........................................................... 108
9.2.4.3 Ligand binding .......................................................................................... 108
9.2.4.4 Oligomerization ........................................................................................ 108
9.2.4.5 Data acquisition ........................................................................................ 109
9.3 Results and discussion ........................................................................................................ 110
9.3.1 chTPH1 .................................................................................................................... 110
9.3.1.1 Determination of the experimental monomer mass of apo-chTPH1 ...... 110
9.3.1.2 Mass spectrometry of intact chTPH1 ....................................................... 113
9.3.1.3 Iron binding .............................................................................................. 115
9.3.1.4 Summary and overall discussion .............................................................. 116
9.3.2 chTPH2 .................................................................................................................... 117
9.3.2.1 Determination of the experimental monomer mass of apo-chTPH2 ...... 117
9.3.2.2 Mass spectrometry of intact chTPH2 ....................................................... 117
9.3.2.3 Iron binding .............................................................................................. 120
9.3.2.4 Substrate/ligand binding .......................................................................... 121
9.3.2.5 Summary .................................................................................................. 122
9.3.3 cthTPH2 ................................................................................................................... 124
9.3.3.1 Determination of the experimental monomer mass of apo-cthTPH2 ..... 124
9.3.3.2 Determination of the oligomeric state by tandem MS ............................ 125

Contents
XVIII
9.3.3.3 Fe binding ................................................................................................. 127
9.3.3.4 Summary................................................................................................... 128
9.4 Conclusion .......................................................................................................................... 128
10 Crystallization of chTPH1 ................................................................................................ 129
10.1 Crystallization of proteins .......................................................................................... 129
10.1.1 The vapor diffusion methods .................................................................................. 130
10.1.2 Factors influencing crystal growth .......................................................................... 131
10.1.2.1 Precipitating agents ................................................................................ 131
10.1.2.2 pH and temperature ............................................................................... 132
10.2 Experimental procedures ........................................................................................... 132
10.2.1 Materials ................................................................................................................. 132
10.2.2 Preparation of sample ............................................................................................. 132
10.2.3 Crystallization trials using crystal screens ............................................................... 132
10.2.4 Crystallization trials using cggTPH1 conditions ...................................................... 133
10.2.5 Optimization trials ................................................................................................... 133
10.2.5.1 Optimization screen 1 ............................................................................. 133
10.2.5.2 Optimization screen 2 ............................................................................. 133
10.2.5.3 Optimization screen 3 ............................................................................. 133
10.2.6 Data collection ........................................................................................................ 133
10.2.7 Data processing, structure solution and refinement .............................................. 134
10.3 Results and discussion ................................................................................................ 134
10.3.1 Crystallization trials ................................................................................................. 134
10.3.1.1 Data collection on crystallization trials ................................................... 134
10.3.1.2 Data processing, structure solution and refinement .............................. 135
10.3.1.3 Summary ................................................................................................. 136
10.3.2 Optimization trials ................................................................................................... 136
10.3.3 Overall structure of chTPH1 .................................................................................... 137
10.3.4 Future experiments ................................................................................................. 138
10.4 Conclusion .................................................................................................................. 139
11 Overall conclusion .......................................................................................................... 141
12 Bibliography ................................................................................................................... 143
Appendix................................................................................................................................157
A.1 Primer sequences...........................................................................................................157

Contents
XIX
A.2 Standard curves of 5-hydroxytryptophan......................................................................159
A.3 Crystallization screens....................................................................................................161


1
1 Introduction
Tryptophan hydroxylase (TPH) is an iron containing enzyme that catalyzes the hydroxylation of
tryptophan to 5-hydroxytryptophan. This is the first and rate-limiting step in the biosynthesis of
serotonin [1], and the initial step in the biosynthesis of the hormone melatonin [2], as shown in
figure 1.1.
Figure 1.1. The biosynthesis of 5-hydroxytryptophan, serotonin and melatonin. Tryptophan hydroxylase
catalyzes the rate-limiting step in the biosynthesis of serotonin.
Serotonin is involved in a many physiological functions such as appetite and regulation of body
temperature [3] as well as a wide range of psychiatric disorders such as depression and
obsessive-compulsive disorders (OCD) [1]. These psychiatric disorders have a massive impact on
the patients suffering from them and they account for large direct and indirect social expenses of
which in Denmark alone corresponds to approximately 30 billion Danish kroner a year [4].
Therefore, knowledge of serotonin and its implication has lead to a huge interest in TPH and the
enzyme has been studied for several years. Despite the great interest, the knowledge on TPH is
limited and many issues such as the three-dimensional structure of the full-length TPH and
determination of the exact catalytic mechanism remains to be determined.

Introduction
2
There are two isoforms of human TPH: Human TPH isoform 1 (hTPH1), which is expressed mainly
in the peripheral part of the body and human TPH isoform 2 (hTPH2), which is expressed in the
central nervous system. Both isoforms consist of three domains: A regulatory domain (r), a
catalytic domain (c) and a tetramerization domain (t) [1,2]. The Metalloprotein Chemistry and
Engineering Group has worked with TPH for several years and the initial work was done with a
truncated version of Gallus gallus (chicken) TPH1 (ggTPH1) [5]. Methods for expression and
purification were developed [6,7,8,9,10,11,12] and lead to a structural determination of cggTPH1
[13]. Different strains for expression of truncated variants of hTPH have also been constructed in
the group and purification methods for purifying these have been developed [6,7,9]. During my
master project I worked on construction, expression and purification of both the full-length and
the catalytic domain of hTPH1 (chTPH1) [14]. Methods for expression and purification of chTPH1
were successfully developed and therefore, it was chosen to continue with characterization of
this variant. The purification of the full-length hTPH1 was unsuccessful and because neither the
full-length nor a variant containing the regulatory domain of TPH had been characterized
thoroughly it was also decided to work on this.
The initial goal was to purify full-length hTPH1 but due to difficulties with purification observed
both in this project and in my master project; variants of hTPH containing the regulatory domain
or parts of it were constructed. This was done to elucidate the properties of the different
domains of hTPH, especially the regulatory domain, in order to understand the behavior of full-
length hTPH. Characterization of truncated variants of hTPH was also done.
1.1 Outline of the thesis In chapter 2 an introduction to TPH is given as well as the important functions and the related
disorders of serotonin. Chapter 3 presents the project background and describes the
experimental strategies that my Ph.D. project is based on. Chapter 4 presents the results from
the purification of full-length hTPH1. Chapter 5 describes the strategies for construction of
various hTPH expression strains with the expression and solubility results of these variants given
in chapter 6. Chapter 7 presents the results from the purification of rhTPH1 variants. In chapter 8
the assay used for determination of the chTPH1 kinetic parameters is described as well as the
results obtained and discussion of these. Chapter 9 presents theory of mass spectrometry of non-
covalent protein complexes. Because this is a new technique used in the group a detailed
description of the theory is given. Also, mass spectrometric characterization of three hTPH
variants is presented and discussed. Chapter 10 gives a short introduction to crystallization of
proteins and crystallization of chTPH1. Chapter 11 is the final chapter and serves to summarize
the work done in this project.

3
2 Tryptophan hydroxylase
In this chapter an introduction to tryptophan hydroxylase (TPH, EC 1.14.16.4) is given and the
most important properties of and knowledge on TPH are summarized. Also, serotonin is
introduced together with the disorders related to its function and the important role of TPH in
these disorders. Information on the two other members of the aromatic amino acid hydroxylase
(AAAH) family, phenylalanine hydroxylase (PAH) and tyrosine hydroxylase (TH), is also presented
because they are closely related to TPH and are characterized to a much greater extent.
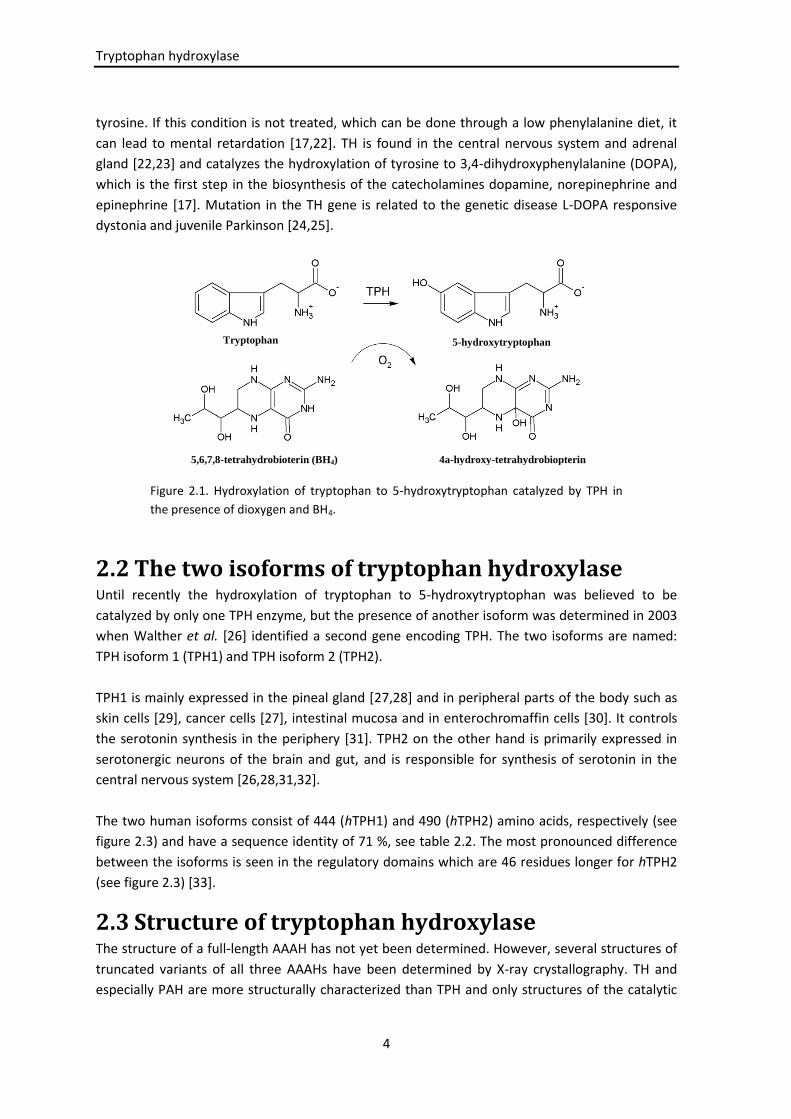
2.1 The aromatic amino acid hydroxylases TPH, also known as tryptophan 5-monooxygenase, is a non-heme iron-containing enzyme which
catalyzes the hydroxylation of tryptophan to 5-hydroxy-tryptophan in the presence of Fe(II),
dioxygen and 5,6,7,8-tetrahydrobiopterin (BH4) [15], as seen in figure 2.1. This is the first and
rate-limiting step in the biosynthesis of serotonin [15].
Together with PAH and TH, TPH forms the family of AAAHs [16,17]. All three enzymes are non-
heme iron monooxygenases which require BH4 for hydroxylation of their respective aromatic
amino acid and show substantial similarities in structure and catalytic mechanism [16]. The
eukaryotic enzymes all forms homotetramers and each monomer of between 444 and 528 amino
acid residues consists of three distinct domains; The N-terminal regulatory domain (100-190
residues), the catalytic domain (approximately 315 residues) and the C-terminal tetramerization
domain (approximately 25-40 residues) [15,18,19,20].
PAH is found in the liver [21] and catalyzes the hydroxylation of phenylalanine to tyrosine which
is the rate-limiting step in the catabolism of phenylalanine [22]. Deficiency in PAH results in the
disease phenylketonuria, where phenylalanine is converted to phenylpuryvate instead of
Tryptophan hydroxylase
4
tyrosine. If this condition is not treated, which can be done through a low phenylalanine diet, it
can lead to mental retardation [17,22]. TH is found in the central nervous system and adrenal
gland [22,23] and catalyzes the hydroxylation of tyrosine to 3,4-dihydroxyphenylalanine (DOPA),
which is the first step in the biosynthesis of the catecholamines dopamine, norepinephrine and
epinephrine [17]. Mutation in the TH gene is related to the genetic disease L-DOPA responsive
dystonia and juvenile Parkinson [24,25].
Figure 2.1. Hydroxylation of tryptophan to 5-hydroxytryptophan catalyzed by TPH in
the presence of dioxygen and BH4.
2.2 The two isoforms of tryptophan hydroxylase Until recently the hydroxylation of tryptophan to 5-hydroxytryptophan was believed to be
catalyzed by only one TPH enzyme, but the presence of another isoform was determined in 2003
when Walther et al. [26] identified a second gene encoding TPH. The two isoforms are named:
TPH isoform 1 (TPH1) and TPH isoform 2 (TPH2).
TPH1 is mainly expressed in the pineal gland [27,28] and in peripheral parts of the body such as
skin cells [29], cancer cells [27], intestinal mucosa and in enterochromaffin cells [30]. It controls
the serotonin synthesis in the periphery [31]. TPH2 on the other hand is primarily expressed in
serotonergic neurons of the brain and gut, and is responsible for synthesis of serotonin in the
central nervous system [26,28,31,32].
The two human isoforms consist of 444 (hTPH1) and 490 (hTPH2) amino acids, respectively (see
figure 2.3) and have a sequence identity of 71 %, see table 2.2. The most pronounced difference
between the isoforms is seen in the regulatory domains which are 46 residues longer for hTPH2
(see figure 2.3) [33].
2.3 Structure of tryptophan hydroxylase The structure of a full-length AAAH has not yet been determined. However, several structures of
truncated variants of all three AAAHs have been determined by X-ray crystallography. TH and
especially PAH are more structurally characterized than TPH and only structures of the catalytic
Tryptophan 5-hydroxytryptophan
5,6,7,8-tetrahydrobioterin (BH4) 4a-hydroxy-tetrahydrobiopterin

Tryptophan hydroxylase
5
domain of TPH have been solved. Therefore, knowledge of TPH is mostly built on studies of the
other two AAAHs. In this section the main features in the structures of the AAAHs are described.
2.3.1 Sequence alignment of the aromatic amino acid hydroxylases The structure of the AAAHs consists of three domains, as mentioned in section 2.1. The domains
of hTPH1 and hTPH2 are divided according to figure 2.2 and the nomenclature of the domains is
given in table 2.1.
Figure 2.2. The division of the three domains of human TPH1 (hTPH1) and human TPH2 (hTPH2).
Table 2.1. Nomenclature of the three domains of TPH.
Abbreviation Explanation
rTPH The regulatory domain of TPH
cTPH The catalytic domain of TPH
tTPH The tetramerization domain of TPH
All three AAAHs have a high sequence identity of approximately 50 %, as seen from the alignment
of hTPH1, hTPH2, human PAH (hPAH) and human TH isoform 4 (hTH4) shown in figure 2.3 and
given in table 2.2. It is especially in the catalytic domain the sequence identity is high with 60-65
% between the AAAHs and 81 % between the two TPH isoform, whereas the regulatory domains
are more different both in length and amino acid sequence.
Table 2.2. Sequence identity of human TPH1 (hTPH1),
human TPH2 (hTPH2), human PAH (hPAH) and human TH
isoform 4 (hTH4). The sequence identity was determined
by the program Vektor NTI Advance 11 [34].
hTPH2 hPAH hTH4
hTPH1 71 % 56 % 49 %
hTPH2 54 % 46 %
hPAH 50 %

Tryptophan hydroxylase
6
1 60
hTPH1 (1) ------------------------------------------------------------
hTPH2 (1) -------------------------------------------------MQPAMMMFSSK
hPAH (1) ------------------------------------------------------------
hTH4 (1) MPTPDATTPQAKGFRRAVSELDAKQAEAIMVRGQGAPGPSLTGSPWPGTAAPAASYTPTP
61 120
hTPH1 (1) ------------------------------MIEDNKENK-----DHSLERGRASLIFS-L
hTPH2 (12) YWARRGFSLDSAVPEEHQLLGSSTLNKPNSGKNDDKGNKGSSKREAATESGKTAVVFS-L
hPAH (1) ------------------MSTAVLENPGLGRKLSDFGQETSYIEDNCNQNGAISLIFS-L
hTH4 (61) RSPRFIGRRQSLIEDARKEREAAVAAAAAAVPSEPGDPLEAVAFEEKEGKAVLNLLFSPR
121 180
hTPH1 (25) KNEVGGLIKALKIFQEKHVNLLHIESRKSKRR---NSEFEIFVDCDINRE-QLNDIFHLL
hTPH2 (71) KNEVGGLVKALRLFQEKRVNMVHIESRKSRRR---SSEVEIFVDCECGKT-EFNELIQLL
hPAH (42) KEEVGALAKVLRLFEENDVNLTHIESRPSRLK---KDEYEFFTHLDKRSLPALTNIIKIL
hTH4 (121) ATKPSALSRAVKVFETFEAKIHHLETRPAQRPRAGGPHLEYFVRLEVRRG-DLAALLSGV
181 240
hTPH1 (81) KSHTNVLSVNLPDNFTLKEDGMETVPWFPKKISDLDHCANRVLMYGSELDADHPGFKDNV
hTPH2 (127) KFQTTIVTLNPPENIWTEEEELEDVPWFPRKISELDKCSHRVLMYGSELDADHPGFKDNV
hPAH (99) RHDIGATVHELS-----RDKKKDTVPWFPRTIQELDRFANQILSYGAELDADHPGFKDPV
hTH4 (180) RQVSEDVRSPAG----------PKVPWFPRKVSELDKCHHLVTKFDPDLDLDHPGFSDQV
241 300
hTPH1 (141) YRKRRKYFADLAMNYKHGDPIPKVEFTEEEIKTWGTVFQELNKLYPTHACREYLKNLPLL
hTPH2 (187) YRQRRKYFVDVAMGYKYGQPIPRVEYTEEETKTWGVVFRELSKLYPTHACREYLKNFPLL
hPAH (154) YRARRKQFADIAYNYRHGQPIPRVEYMEEEKKTWGTVFKTLKSLYKTHACYEYNHIFPLL
hTH4 (230) YRQRRKLIAEIAFQYRHGDPIPRVEYTAEEIATWKEVYTTLKGLYATHACGEHLEAFALL
301 360
hTPH1 (201) SKYCGYREDNIPQLEDVSNFLKERTGFSIRPVAGYLSPRDFLSGLAFRVFHCTQYVRHSS
hTPH2 (247) TKYCGYREDNVPQLEDVSMFLKERSGFTVRPVAGYLSPRDFLAGLAYRVFHCTQYIRHGS
hPAH (214) EKYCGFHEDNIPQLEDVSQFLQTCTGFRLRPVAGLLSSRDFLGGLAFRVFHCTQYIRHGS
hTH4 (290) ERFSGYREDNIPQLEDVSRFLKERTGFQLRPVAGLLSARDFLASLAFRVFQCTQYIRHAS
361 420
hTPH1 (261) DPFYTPEPDTCHELLGHVPLLAEPSFAQFSQEIGLASLGASEEAVQKLATCYFFTVEFGL
hTPH2 (307) DPLYTPEPDTCHELLGHVPLLADPKFAQFSQEIGLASLGASDEDVQKLATCYFFTIEFGL
hPAH (274) KPMYTPEPDICHELLGHVPLFSDRSFAQFSQEIGLASLGAPDEYIEKLATIYWFTVEFGL
hTH4 (350) SPMHSPEPDCCHELLGHVPMLADRTFAQFSQDIGLASLGASDEEIEKLSTLSWFTVEFGL
421 480
hTPH1 (321) CKQDGQLRVFGAGLLSSISELKHALSGHAKVKPFDPKITCKQECLITTFQDVYFVSESFE
hTPH2 (367) CKQEGQLRAYGAGLLSSIGELKHALSDKACVKAFDPKTTCLQECLITTFQEAYFVSESFE
hPAH (334) CKQGDSIKAYGAGLLSSFGELQYCLSEKPKLLPLELEKTAIQNYTVTEFQPLYYVAESFN
hTH4 (410) CKQNGEVKAYGAGLLSSYGELLHCLSEEPEIRAFDPEAAAVQPYQDQTYQSVYFVSESFS
481 540
hTPH1 (381) DAKEKMREFTKTIKRPFGVKYNPYTRSIQILKDTKSITSAMNELQHDLDVVSDALAKVSR
hTPH2 (427) EAKEKMRDFAKSITRPFSVYFNPYTQSIEILKDTRSIENVVQDLRSDLNTVCDALNKMNQ
hPAH (394) DAKEKVRNFAATIPRPFSVRYDPYTQRIEVLDNTQQLKILADSINSEIGILCSALQKIK-
hTH4 (470) DAKDKLRSYASRIQRPFSVKFDPYTLAIDVLDSPQAVRRSLEGVQDELDTLAHALSAIG-
541
hTPH1 (441) KPSI444 amino acids
hTPH2 (487) YLGI490 amino acids
hPAH (453) ----452 amino acids
hTH4 (529) ----528 amino acids
Figure 2.3. Amino acid sequence alignment of human TPH1 (hTPH1), human TPH2 (hTPH2), human PAH
(hPAH) and human TH isoform 4 (hTH4). The sequences are obtained from the ExPaSy server [35] with
the primary accession numbers P17752 (hTPH1), Q8IWU9 (hTPH2), P00439 (hPAH) and P07101 (hTH4).
The alignment was done using Vektor NTI Advance 11 [34]. Green background indicates conserved
residues in all sequences and yellow background indicates conserved residues in some of the sequences.
The domain boundaries as used in this project are marked by black vertical lines.
Catalytic domain
Tetramerization domain
Regulatory domain

Tryptophan hydroxylase
7
2.3.2 Three-dimensional structures of the catalytic domain Only structures of the catalytic domain of TPH1 (cTPH1) have been determined, and in 2002 the
first crystal structure of chTPH1 with Fe(III) and 7,8-dihydrobipterin (BH2), a competitive inhibitor
and analog to BH4, was determined by Wang et al. to 1.7 Å resolution [36]. The overall structure,
shown in figure 2.4A (PDB entry 1MLW), is very similar to the structure of the catalytic domain of
PAH (PDB entry 1PAH) and TH (PDB entry 1TOH) [36]. The active site of chTPH1, shown in figure
2.4B, consists of a 9 Å deep and 10 Å wide cavity where iron is located and octahedrally
coordinated to His272, His277 and Glu317 (hTPH1 numbering) and three water molecules [36].
The coordination of iron by two histidines and one glutamate is also seen for PAH and TH [37,38],
and is known as the facial triad [39,40]. The BH2 bound in the active site is sandwiched between
Tyr235 and Phe241 and forms hydrogen bonds to Glu273 and Leu236. Furthermore, BH2 is
hydrogen bonded through bridging water molecules to Glu273 and Glu317 [36].
A) B)
Figure 2.4. A) The overall structure of the catalytic domain of hTPH1 (PDB entry 1MLW) with bound ferric iron and 7,8-dihydrobiopterin (BH2). B) The active site with the iron shown in green coordinated to His272, His277, Glu317 and three water molecules which are shown in red. The BH2 cofactor is shown as a ball-and-stick model with carbon atoms in purple, oxygen atoms in red, and nitrogen atoms in blue. The interaction between BH2 and chTPH1 is indicated with dashed lines [36]. Reproduced with permission from the American Chemical Society.
The second structure of TPH is cggTPH1 with bound Fe(III), tryptophan and imidazole, and was
the first structure of any AAAH with its natural amino acid substrate. It was determined by
Windahl et al. in 2007 to 1.9 Å resolution and published in 2008 [13]. The iron is described as
being distorted trigonal bipyramidal with coordination to His273, His278, Glu318 (ggTPH1
numbering) and an imidazole, as shown in figure 2.5. No water molecules are coordinated to the
iron and the coordination by glutamate to iron is partially bidentate [13]. The tryptophan
substrate is bound close to the iron in a binding pocket with the hydrophobic part lined by
residues Tyr236, Thr266, Pro267, Glu268, Pro269, His273, Phe314, Phe319 and Ile367. The polar
interactions of the tryptophan are with Thr266, Ile367, and Ser337 and a salt bridge to Arg258.
Tryptophan hydroxylase
8
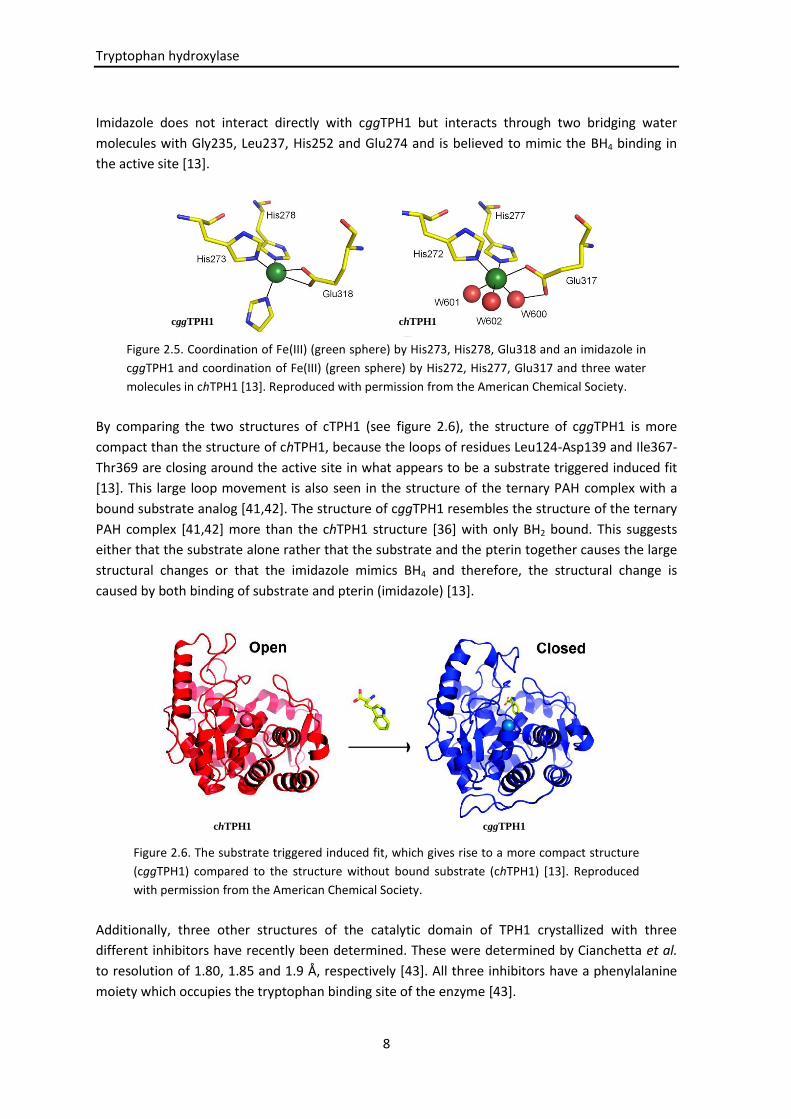
Imidazole does not interact directly with cggTPH1 but interacts through two bridging water
molecules with Gly235, Leu237, His252 and Glu274 and is believed to mimic the BH4 binding in
the active site [13].
Figure 2.5. Coordination of Fe(III) (green sphere) by His273, His278, Glu318 and an imidazole in
cggTPH1 and coordination of Fe(III) (green sphere) by His272, His277, Glu317 and three water
molecules in chTPH1 [13]. Reproduced with permission from the American Chemical Society.
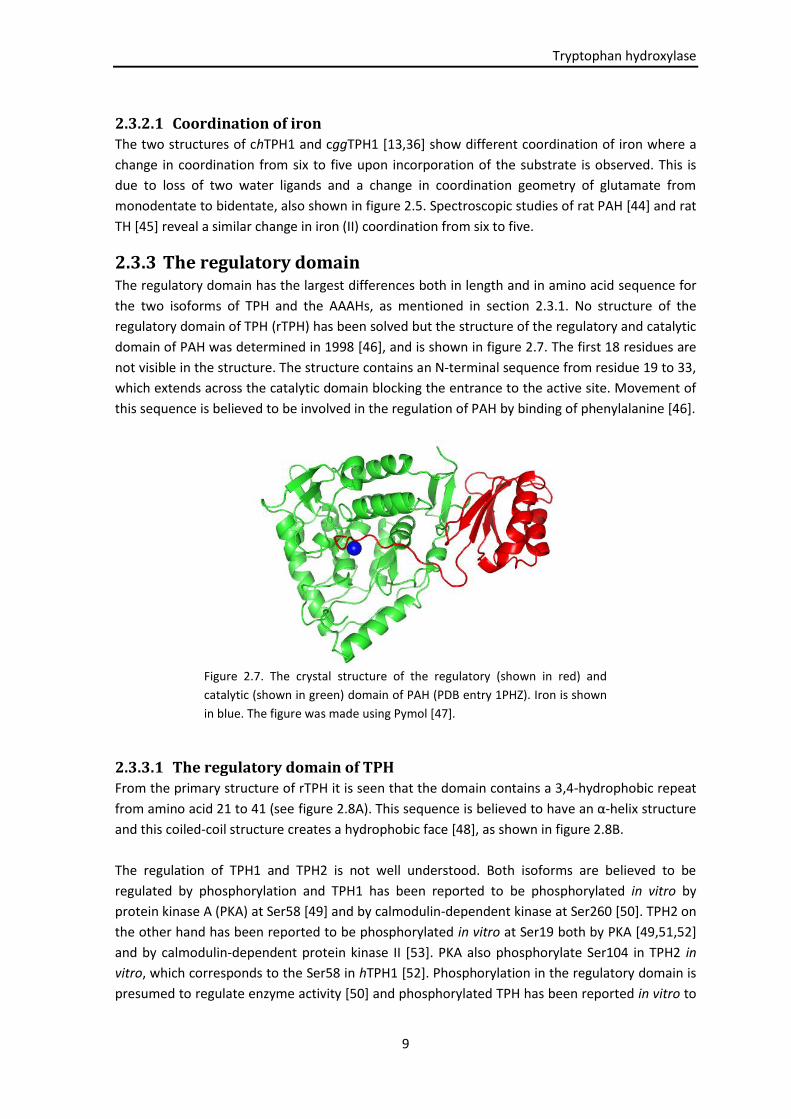
By comparing the two structures of cTPH1 (see figure 2.6), the structure of cggTPH1 is more
compact than the structure of chTPH1, because the loops of residues Leu124-Asp139 and Ile367-
Thr369 are closing around the active site in what appears to be a substrate triggered induced fit
[13]. This large loop movement is also seen in the structure of the ternary PAH complex with a
bound substrate analog [41,42]. The structure of cggTPH1 resembles the structure of the ternary
PAH complex [41,42] more than the chTPH1 structure [36] with only BH2 bound. This suggests
either that the substrate alone rather that the substrate and the pterin together causes the large
structural changes or that the imidazole mimics BH4 and therefore, the structural change is
caused by both binding of substrate and pterin (imidazole) [13].
Figure 2.6. The substrate triggered induced fit, which gives rise to a more compact structure
(cggTPH1) compared to the structure without bound substrate (chTPH1) [13]. Reproduced
with permission from the American Chemical Society.
Additionally, three other structures of the catalytic domain of TPH1 crystallized with three
different inhibitors have recently been determined. These were determined by Cianchetta et al.
to resolution of 1.80, 1.85 and 1.9 Å, respectively [43]. All three inhibitors have a phenylalanine
moiety which occupies the tryptophan binding site of the enzyme [43].
cggTPH1 chTPH1
cggTPH1 chTPH1
Tryptophan hydroxylase
9
2.3.2.1 Coordination of iron
The two structures of chTPH1 and cggTPH1 [13,36] show different coordination of iron where a
change in coordination from six to five upon incorporation of the substrate is observed. This is
due to loss of two water ligands and a change in coordination geometry of glutamate from
monodentate to bidentate, also shown in figure 2.5. Spectroscopic studies of rat PAH [44] and rat
TH [45] reveal a similar change in iron (II) coordination from six to five.
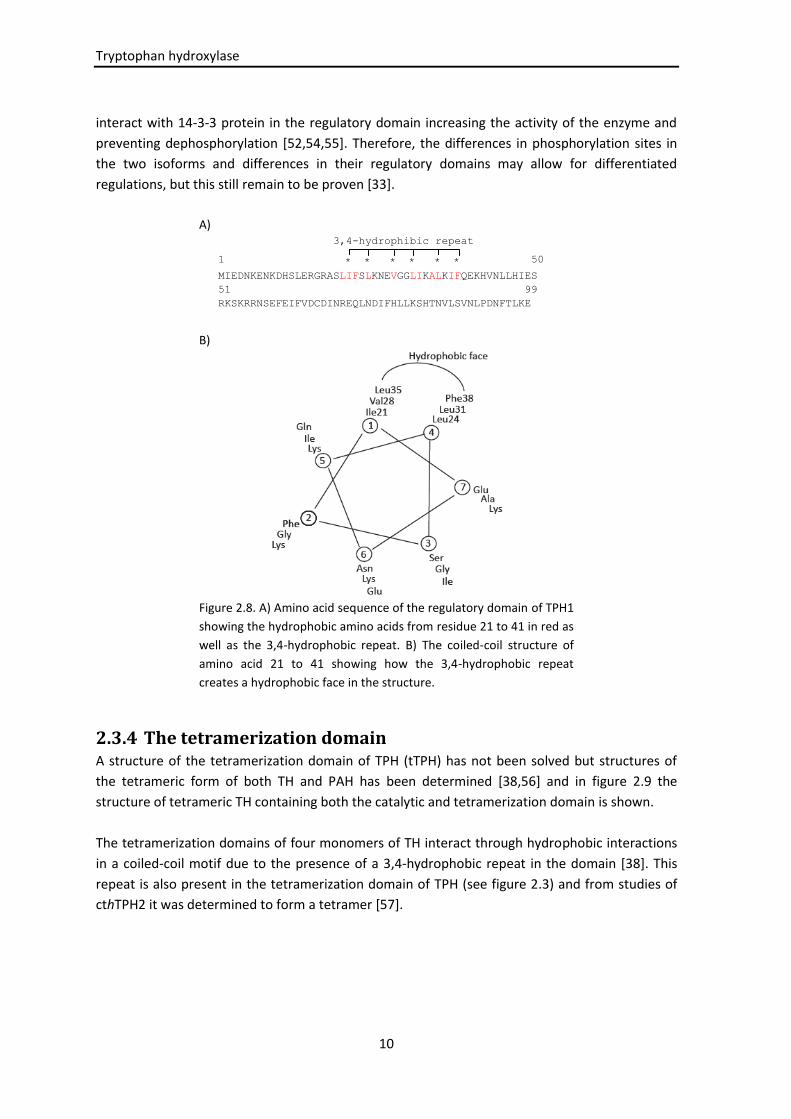
2.3.3 The regulatory domain The regulatory domain has the largest differences both in length and in amino acid sequence for
the two isoforms of TPH and the AAAHs, as mentioned in section 2.3.1. No structure of the
regulatory domain of TPH (rTPH) has been solved but the structure of the regulatory and catalytic
domain of PAH was determined in 1998 [46], and is shown in figure 2.7. The first 18 residues are
not visible in the structure. The structure contains an N-terminal sequence from residue 19 to 33,
which extends across the catalytic domain blocking the entrance to the active site. Movement of
this sequence is believed to be involved in the regulation of PAH by binding of phenylalanine [46].
Figure 2.7. The crystal structure of the regulatory (shown in red) and
catalytic (shown in green) domain of PAH (PDB entry 1PHZ). Iron is shown
in blue. The figure was made using Pymol [47].
2.3.3.1 The regulatory domain of TPH
From the primary structure of rTPH it is seen that the domain contains a 3,4-hydrophobic repeat
from amino acid 21 to 41 (see figure 2.8A). This sequence is believed to have an α-helix structure
and this coiled-coil structure creates a hydrophobic face [48], as shown in figure 2.8B.
The regulation of TPH1 and TPH2 is not well understood. Both isoforms are believed to be
regulated by phosphorylation and TPH1 has been reported to be phosphorylated in vitro by
protein kinase A (PKA) at Ser58 [49] and by calmodulin-dependent kinase at Ser260 [50]. TPH2 on
the other hand has been reported to be phosphorylated in vitro at Ser19 both by PKA [49,51,52]
and by calmodulin-dependent protein kinase II [53]. PKA also phosphorylate Ser104 in TPH2 in
vitro, which corresponds to the Ser58 in hTPH1 [52]. Phosphorylation in the regulatory domain is
presumed to regulate enzyme activity [50] and phosphorylated TPH has been reported in vitro to
Tryptophan hydroxylase
10
interact with 14-3-3 protein in the regulatory domain increasing the activity of the enzyme and
preventing dephosphorylation [52,54,55]. Therefore, the differences in phosphorylation sites in
the two isoforms and differences in their regulatory domains may allow for differentiated
regulations, but this still remain to be proven [33].
A) 3,4-hydrophibic repeat
1 * * * * * * 50
MIEDNKENKDHSLERGRASLIFSLKNEVGGLIKALKIFQEKHVNLLHIES
51 99
RKSKRRNSEFEIFVDCDINREQLNDIFHLLKSHTNVLSVNLPDNFTLKE
B)
Figure 2.8. A) Amino acid sequence of the regulatory domain of TPH1
showing the hydrophobic amino acids from residue 21 to 41 in red as
well as the 3,4-hydrophobic repeat. B) The coiled-coil structure of
amino acid 21 to 41 showing how the 3,4-hydrophobic repeat
creates a hydrophobic face in the structure.
2.3.4 The tetramerization domain A structure of the tetramerization domain of TPH (tTPH) has not been solved but structures of
the tetrameric form of both TH and PAH has been determined [38,56] and in figure 2.9 the
structure of tetrameric TH containing both the catalytic and tetramerization domain is shown.
The tetramerization domains of four monomers of TH interact through hydrophobic interactions
in a coiled-coil motif due to the presence of a 3,4-hydrophobic repeat in the domain [38]. This
repeat is also present in the tetramerization domain of TPH (see figure 2.3) and from studies of
cthTPH2 it was determined to form a tetramer [57].

Tryptophan hydroxylase
11
Figure 2.9. The crystal structure of the catalytic and tetramerization domains of tetrameric
TH (PDB entry 1TOH) [38]. The coiled-coil motif is seen in the center of the structure. The
figure was made using Pymol [47].
2.4 The enzymatic mechanism Due to TPH’s instability in vitro, studies on the catalytic mechanism are limited. Because of high
sequence homology and structural similarity between the catalytic domains of the AAAHs it is
believed that they share a common catalytic mechanism [15,58], thus results obtained from TH
and PAH as well as TPH are described in this section.
The active form of iron in AAAHs is ferrous iron, Fe(II) [59], and the hydroxylation of the aromatic
amino acid is coupled to a two electron oxidation of BH4 by using molecular oxygen as
oxygendonor for both hydroxylation of the amino acid and BH4 [15,60]. The mechanism can be
divided into two partial reactions: The formation of the hydroxylating intermediate, believed to
be Fe(IV)=O, and oxygen transfer to the aromatic amino acid which corresponds to the
hydroxylation of the aromatic amino acid [15].
2.4.1 Formation of hydroxylating intermediate and oxygen
activation Different hydroxylating intermediates have been proposed, but theoretical investigations have
shown that a ferryl oxo species (Fe(IV)=O) is a likely candidate [61,62,63], and recently evidence
for a high-spin Fe(IV) intermediate, presumably Fe(IV)=O, was found for TH using Mössbauer
spectroscopy [64]. Additionally, this ferryl oxo species is expected to be an intermediate in
several mononuclear iron enzymes having facial triad coordination [62,65]. How the Fe(IV)=O is
formed is not known, but is believed to be formed from cleavage of the O-O bond in Fe-
peroxybiopterin [15]. The formation of this Fe-peroxybioterin is consistent with theoretical

Tryptophan hydroxylase
12
studies [61] and the distance between iron and the reactive carbon atom (C4a) of pterin is
compatible with a peroxy bridge in the crystal structure of the ternary complex of PAH [15,42].
The proposed mechanism is illustrated in figure 2.10.
Disagreements exist on whether or not O2 forms a peroxo species with Fe or BH4. Theoretical
investigations have suggested that Fe(II), upon binding of O2, is converted into a peroxo-iron-
complex which then attacks the C4a of BH4 forming Fe(II)-peroxybioterin [61,62]. From the two
structures of the catalytic domain of TPH1, described in section 2.3.2 (chTPH1 and cggTPH1), a
shift in iron coordination from six to five gives a free coordination site for oxygen which indicates
that oxygen forms a peroxo species with Fe. However, spectroscopic and kinetic studies on PAH
mutants suggest that O2 first reacts with pterin to form a peroxy-pterin [66].
Figure 2.10. Proposed mechanism for formation of the hydroxylating intermediate, Fe(IV)=O.
2.4.2 Mechanism of hydroxylation The first step in the hydroxylation of the aromatic amino acid is believed to be an electrophilic
attack of the Fe(IV)=O on the aromatic C atom making an arenium cation intermediate [15], as
shown in figure 2.11. Formation of the cationic intermediate is consistent with observation of a
NIH-shift from carbon 5 to 4 upon hydroxylation of the aromatic amino acid which is observed for
all three AAAHs [67,68,69,70]. Kinetic isotope effect studies on TPH also support this mechanism
[71,72].
2.4.3 Regeneration of tetrahydrobiopterin BH4 is synthesized in the body and functions as a substrate in the catalytic mechanism of TPH, as
shown in figure 2.10. During formation of the intermediate, Fe(IV)=O, BH4 is oxidized to 4a-
hydroxy-BH4, also called BH4-carbinolamin, and released by the enzyme. In vivo 4a-hydroxy-BH4 is
then regenerated by dehydration and reduction by the enzymes pterin-4a-carbinolamin
dehydratase and dihydropterin reductase. This regeneration of BH4 is important for continuous
supply of reduced substrate to the catalytic mechanism [73]. In vitro 4a-hydroxy-BH4
spontaneously decomposes to quinonoid-7,8-dihydro-L-bioterin (q-BH2) [74].

Tryptophan hydroxylase
13
Figure 2.11. Mechanism of the hydroxylation of tryptophan to 5-hydroxytryptophan.
2.4.4 Order of substrate binding Studies on the catalytic mechanism and the order of substrate binding have been done for all
three AAAHs by steady-state kinetics. From these results it is suggested that all substrates are
bound in the active site before any reaction can occur, but disagreement in the binding order and
whether or not it is partially or fully ordered is observed in these studies [6,18,75,76].
From the structures of chTPH1 with bound BH2 and cggTPH1 with bound tryptophan and
imidazole, described in section 2.3.2, a change from six- to five-coordinate iron site is seen upon
binding of tryptophan and imidazole. This change gives an open site for O2, which is also
supported by structure determination of human PAH with bound BH2 and a substrate analog
[41,42]. Spectroscopic studies of the active site of rat PAH [44] and rat TH [45] shows the same
five-coordination geometry of iron with a bidentate glutamate. Additionally, a large
conformational change is observed in substrate analog and BH2 binding in PAH and upon binding
of tryptophan in cggTPH1 (see figure 2.6). This structural change is likely to reduce the affinity of
iron for water, thus yielding an open coordinate site [13]. From the structures of AAAHs with
bound BH2 and spectroscopic studies, it is seen that binding of pterin alone does not change the
conformation of the active site nor change the iron-coordination geometry but upon binding of
both the aromatic amino acid and pterin a change is observed [13,36,44,45]. Due to these
observations, it is now believed that the mechanism is a substrate triggered induced fit
mechanism where the enzyme-iron-tryptophan-BH4 complex reacts with dioxygen.
2.5 Serotonin and its related disorders 5-hydroxytryptamine, better known as serotonin, is a hormone and neurotransmitter and it is
synthesized in several tissues such as the enterochromaffin cells in the intestine (periphery) and
in the serotonergic neurons in the brain and gut [3,77,78].
The peripheral and the central serotonergic system which are regulated by hTPH1 and hTPH2,
respectively, are coupled to different physiological functions in the body such as cardiac function

Tryptophan hydroxylase
14
[79], body temperature regulation and appetite [3]. In the pineal gland serotonin serves as a
precursor of the hormone melatonin, which is involved in circadian rhythm control [80].
Serotonin is implicated in a wide range of disorders. In the peripheral part of the body it is
believed to be involved in ulcerative colitis and irritable bowel syndrome [81] and recently,
interest has been turned toward designing inhibitors for TPH1 in the gastrointestinal tract which
could be used in the treatment of these disorders [82]. In the central serotonergic system
serotonin plays a role in psychiatric disorders such as depression, obsessive–compulsive disorder
(OCD), anxiety and schizophrenia [83]. These disorders are caused by dysfunctions of the
serotonergic system and major depression is believed to be due to deficiency of available
serotonin in the brain [84]. Therefore, the central serotonergic system is a major target in the
treatment of these disorders. Different treatment strategies such as the use of selective
serotonin re-uptake inhibitors, which increases the extracellular concentration of serotonin in the
synapse, and the use of monoamine oxidase inhibitors to prevent degradation of serotonin in the
synapse have been tried [85,86]. The problem with these antidepressant drug therapies is the
variability among patients in treatment response as well as the many side effects [86].

15
3 Project background
TPH catalyzes the rate-limiting step in the biosynthesis of serotonin and the possibility to
specifically influence TPH instead of serotonin, constitute a promising new target for treatment of
for example depression and OCD (mentioned in section 2.5). In order to fully understand the
functions of the two serotonergic systems and to elucidate the possibility of isoform-specific
inhibitors it is necessary to understand the biochemistry of both hTPH1 and hTPH2. Knowledge of
the three-dimensional structure of the enzymes as well as their regulatory and catalytic
mechanisms may lead to identification of compounds that regulates the activity of TPH. Also,
knowledge of the differences between the two isoforms, especially in their regulatory domains,
can give information regarding the design of drugs or compounds that could individually target to
either the central or the peripheral serotonergic system.
It is therefore of great importance to characterize TPH and determine the catalytic properties of
the isoforms as well as to understand the regulation of the enzymes. The main goal of this project
is to purify full-length TPH in a soluble and stable form in order to characterize the enzyme. The
experimental strategies used in this project are described in the next section. The expression and
purification methods are mainly based on results obtained in my master project and these are
therefore summarized first.
3.1 Experimental strategies The most dominant host organism for expression of recombinant TPH is Escherichia coli (E. coli)
[6] which is also the organism used in the Metalloprotein Chemistry and Engineering Group. In
my master project a method for expression of soluble and active recombinant chTPH1 and hTPH1
was developed. It was also observed that the solubility of hTPH1 decreased with decreasing pH
and therefore a pH value of 8.5 should be used (pI value of hTPH1 is 6.8) [14]. For purification of

Project background
16
hTPH variants a simple and fast method has been developed in the Metalloprotein Chemistry and
Engineering Group. The purification procedure consists of two steps: An anion exchange followed
by a gel filtration from which a high yield of >20 mg protein can be purified in only 6-8 hours to a
purity suitable for crystallization [6,7,12]. This method was used in my master project for the
purification of both chTPH1 and hTPH1 where chTPH1 was successfully purified to high purity.
hTPH1 on the other hand was more difficult to purify and it did not bind to any of the ion
exchange columns applied. It was concluded that this was most probably due to interactions of
hTPH1 with other components present in the raw extract such as membrane fragments or DNA
[14].
Due to the problems observed during purification of hTPH1 in my master project another
purification method needed to be developed. Different methods for purification of full-length
TPH have been published, but in general it is difficult to verify the quality of the results obtained
from the purifications due to lack of experimental evidence and short described procedures
without any explanation of the steps involved. For example Liu et al. [87] purified human full-
length TPH1 and TPH2 using pterin-based affinity chromatography. From the article no results or
no detailed explanation on how the proteins are purified are given. It is therefore very difficult to
be convinced that they purified full-length TPH. McKinney et al. [88] purified different TPH fusion
proteins by affinity tag chromatography, and concluded that the fusion proteins had a strong
tendency to aggregate and precipitate during purification. Kowlessur and Kaufman [89] on the
other hand published a strategy for purifying TPH using pterin-agarose columns where they
describe the experimental procedures and show the purified product from the different steps on
a SDS-Page. They obtain a very pure and active product. This purification method was tried in the
Metalloprotein Chemistry and Engineering Group, but with no success [90]. This could be due to
the fact that pterin is attached to the column material at nitrogen 5 (N5) [91], see figure 3.1,
which, according to structural analysis, is involved in the interaction between TPH and pterin, as
described in chapter 2. Additionally, the pterin ring is bound in the active site and sandwiched
between Tyr235 and Phe241. Due to this it is speculated that binding of N5 in the pterin ring to
the column material would make it difficult for TPH to interact with pterin. This is also consistent
with the fact that this method has shown not to be a success in the group. Another method is
therefore applied for purifying full-length hTPH1 without the use of pterin-based affinity
chromatography. This method is based on the use of detergent to eliminate the association with
other compounds thereby decreasing the size of hTPH1 (further described in chapter 4).
Figure 3.1. Numbering of the atoms in the pterin ring.
Additionally, as expression and purification methods for chTPH1 [14], chTPH2 and cthTPH2 [6,57]
already have been developed prior to my Ph.D. project, characterization of these variants were
also performed and is described in chapter 8, 9 and 10.
1
4
2
3 4a 5
6
7 8 8a

17
4 Purification of full-length hTPH1 using detergent
The full-length hTPH1 (named hTPH1 in this chapter) is difficult to purify and in my master project
[14] purification trials showed that hTPH1 does not bind to either cation or anion exchange
columns in the pH range 4-10, but that the hTPH1 present in the flow-through was enzymatic
active. It is speculated that hTPH1 associates to other components, such as membrane fragments
or DNA, present in the raw extract which causes the size of the hTPH1-complex to be higher than
the columns exclusion limit (3 x 10⁷ Da). These associations with hTPH1 could be at the 3,4-
hydrophobic repeat present in both the regulatory and tetramerization domains (see chapter 2).
A method to overcome this problem is to add detergent to the protein solution and thereby
reduce the hydrophobic associations between hTPH1 and other components, thus decreasing the
size of the variant and allowing hTPH1 to be purified. The theoretical pI value of hTPH is 6.8.
In this chapter the use of detergent in the purification strategy is introduced followed by
description of the experimental procedures as well as a result and discussion section.
4.1 Purification using detergent
4.1.1 Solubilization and isolation using detergent Detergents are, among other things, used as solubilizing agents for membrane proteins.
Membrane proteins are embedded by lipids, which interact with the hydrophobic surfaces of the
proteins. By addition of detergents, the hydrophobic surface of the protein is shielded, thereby
preventing the protein from interacting with the membrane causing the membrane protein to be
solubilized and extracted from the membrane [92]. The solubilization is a three stage process that

Purification of hTPH1
18
depends on the detergent-protein ratio. At low concentration of detergent, the detergent
monomers slowly penetrate into the membrane. By increasing the concentration of detergent
the membrane bilayer is disrupted and gives rise to lipid-protein-detergent mixed micelles. By
further increase in detergent concentration heterogeneous complexes of detergent, lipid and
protein begin to form resulting in mixed micelles of lipid/detergent and protein/detergent
[93,94]. One problem in solubilization of membrane proteins is that too high concentration of
detergent can cause the protein to lose its activity. Therefore, there is a balance between
sufficient solubilization and preservation of the activity [92,93,94].
Using this strategy for membrane-associated proteins, proteins can be released by penetration of
the detergent into the complex and thereby disruption of the association. The concentration of
detergent used in solubilization is typically guided by the critical micelle concentration (CMC) of
the detergent. Two CMC’s need to be distinguished: The theoretical CMC and the effective CMC.
The theoretical CMC is the one determined in pure water, whereas the effective CMC is the one
obtained under the actual experimental conditions and depends on lipids, proteins, pH and salts.
4.1.1.1 Release of hTPH1 using detergent
Addition of detergent to the hTPH1 sample could possibly prevent some of the associations of
hTPH1 with other molecules in the raw extract such as membrane fragments or DNA. This would
then decrease the size of hTPH1 causing it to bind to the ion exchange column.
The detergent used in this project is n-dodecyl-β-D-maltopyranoside (DDM). It is a commonly
used non-ionic detergent [92,93] which is mild and only breaks lipid-lipid and lipid-protein
interactions. Therefore, it could be possible to isolate the protein in its biologically active form
[95]. Another advantage of using non-ionic detergents in ion exchange purification is that the
detergent itself does not bind to the columns.
4.2 Experimental procedures
4.2.1 Materials DDM was obtained from Anatrace and (6R)-5,6,7,8-tetrahydro-L-bioterin dihydrochloride (BH4)
was from Schircks Laboratories. Luria Bertani (LB) media and all other chemicals were obtained
from Sigma-Aldrich. The chemicals were of analytical grade. All solutions were prepared using
18.2 MΩ cm water from a Milli-Q synthesis A10 Q-Gard system (Millipore). All work with bacteria
was carried out in a sterile environment. Materials were handled in a laminar air flow (LAF) bench
and sterilization of growth media, antibiotics and water were done by autoclaving or filter
sterilization.
4.2.2 Expression Cells from a frozen glycerol stock containing E. coli BL21(DE3)pLysS expressing hTPH1 (HC1100)
were streaked into single colonies on a LB agar plate containing 30 µg/ml kanamycin sulfate
(30kan) and 34 µg/ml chloramphenicol (34cam). The plate was incubated overnight at 37oC. A
single colony was inoculated in 50 ml LB/30kan/34cam media in a 250 ml shake flask and

Purification of hTPH1
19
incubated at 37oC and 250 rpm for approximately 4 hours until an optical density at 600 nm
(OD600) of 0.6-1.0 was reached. The cells were transferred to a 50 ml polypropylene tube and
sedimented by centrifugation at +4oC and 3000 x g for 10 min. The cells were resuspended in 50
ml fresh LB/30kan/34cam media and 6.5 ml of the resuspended cells were used to inoculate 650
ml LB/30kan/34cam media in a 2 L shake flask. The cultures were incubated at 30oC and 250 rpm.
After approximately 3½ hour the temperature was lowered to 20oC. When OD600 of 0.4-0.6 was
attained the expression of hTPH1 was induced by adding isopropyl-β-D-thiogalactopyranoside
(IPTG) to a final concentration of 0.1 mM. After induction at 20oC and 250 rpm for 18 hours, the
cells were harvested by centrifugation at +4oC and 3000 x g for 15 min. The cells were
resuspended in ice cold 20 mM Tris/H2SO4 pH 8.5, transferred to 50 ml polypropylene tubes and
centrifuged again at +4oC and 3000 x g for 15 min. The supernatant was discarded and the cells
stored at -80oC until further use.
4.2.3 Release of membrane-associated hTPH1
4.2.3.1 Preparation of raw extract
Cells from one 650 ml culture (HC1100) were resuspended in 20 mM Tris/H2SO4 pH 8.5 to a total
volume of 40 ml and lysed on ice by sonication for 3 x 30 sec. The cell extract were centrifuged in
high-speed centrifuge tubes at 18,000 x g and +4oC for 20 min. The supernatant was recovered
and centrifuged again as above. Then the supernatant (S) was collected and filtered through a
0.45 μm GHP Acrodisc GF syringe filter.
4.2.3.2 Ultracentrifugation
The strategy for ultracentrifugation is described in [96] and is used to determine whether or not
hTPH1 can be solubilized from its associated molecules. 20 ml of the supernatant (S) from section
4.2.3.1 was centrifuged at 150,000 x g and +4oC for 45 min. The high speed supernatant (S1.u) was
discarded and the pellet (P1.u) was resuspended in the same volume of 20 mM Tris/H2SO4 pH 8.5.
The protein concentration in the resuspended pellet was estimated by spectrophotometric
measurements in the UV region taking into account nucleic acids as described in [97]. The
resuspension was centrifuged again as above. The new supernatant (S2.u) was discarded and the
pellet (P2.u) resuspended in 20 mM Tris/H2SO4 pH 8.5 to a concentration of approximately 3 mg
protein/ml. DDM was added to a final concentration of 1 % (w/v) to 5 ml of this resuspension and
the protein solubilized by incubating the suspension for 1 hour at +4oC under mild agitation
(SDDM). Non-solubilized material (Mnon) was removed from solubilized protein (Ms) by
centrifugation at 150,000 x g and +4oC for 45 min or 90 min, respectively. Samples for activity
measurements (section 4.2.6) and SDS-Page analysis (section 4.2.7) were collected from the
supernatants S, S1.u, S2.u, SDDM and Ms and from the resuspended pellets P1.u, P2.u and Mnon. In table
4.1 the definitions of the collected samples are given.
4.2.3.3 Ultracentrifugation using different detergent concentrations
To see if it was possible to lower the concentration of DDM while keeping the solubilizing effect
of the detergent the sample was incubated with different concentrations of DDM. Centrifugation
was done as described in section 4.2.3.2, where final concentrations of 1 %, 0.2 % or 0.05 % (w/v)

Purification of hTPH1
20
DDM were added. The centrifugation time used was 45 min. Samples were analyzed by SDS-Page
(see section 4.2.7).
Table 4.1. Definition of the collected samples from the ultracentrifugation of hTPH1.
Sample Definition
S Supernatant before ultracentrifugation
S1.u Supernatant after 1. Ultracentrifugation
P1.u Resuspended pellet after 1. Ultracentrifugation
S2.u Supernatant after 2. ultracentrifugation
P2.u Resuspended pellet after 2. ultracentrifugation (3 mg protein/ml)
SDDM DDM extraction of protein (protein suspension incubated with DDM)
MS DDM solubilized proteins
Mnon Non-solubilized fraction
4.2.4 Purification of membrane-associated hTPH1 Once it was established that DDM has a solubilizing effect an alternative strategy was employed
since ultracentrifugation is not easy to “scale up”. In this strategy the flow-through from the
anion exchange column containing the active membrane-associated hTPH1 is used. hTPH1 was
then released by incubation with DDM followed by purification of the DDM protein extraction.
4.2.4.1 Purification tests
Cells from one 650 ml culture, containing hTPH1, were prepared as described in section 4.2.3.1.
The filtered supernatant was loaded onto a Q Sepharose Fast Flow 16/10 column, which was
equilibrated in 20 mM Tris/H2SO4 pH 8.5. During loading the flow-through was collected and
pooled and DDM was added to a final concentration of 0.05 %. The sample was divided in two
portions and incubated for 1½ hour and overnight, respectively at +4oC under mild agitation.
After incubation the solution was filtered through a 0.45 µm filter and loaded onto the Q
Sepharose Fast Flow 16/10 column, which was equilibrated in 20 mM Tris/H2SO4 pH 8.5, 0.02 %
DDM. A linear gradient of 0-20 % of 20 mM Tris/NaOH, 0.8M (NH4)2SO4 pH 8.5, 0.02 % DDM
(buffer B) over 6 CV followed by a linear gradient of 20-100 % of buffer B over 2 CV was applied
to the column. From the supernatant loaded onto the column, the flow-through and each peak in
the chromatogram samples were analyzed by SDS-Page (see section 4.2.7).
4.2.4.2 Anion exchange with DDM at the CMC
Cells from three times 650 ml cultures, containing hTPH1, were prepared as described in section
4.2.3.1. The filtered supernatant was loaded onto a Q Sepharose High Performance 26/10
column, which where equilibrated with 20 mM Tris/H2SO4 pH 8.5. During loading the flow-
through was collected and pooled.

Purification of hTPH1
21
DDM was added to a concentration corresponding to the experimental CMC (exCMC). The exCMC
was determined as described in section 4.2.5. The solution was incubated at +4oC overnight
under mild agitation. After incubation the solution was filtered through a 0.45 µm filter and
purified as described in section 4.2.4.1 but on a Q Sepharose High Performance 26/10 column
with the stepwise gradient given in table 4.2 and with a concentration of DDM in the buffer
system corresponding to the exCMC. From each peak in the chromatogram, the supernatant
loaded onto the column and the flow-through samples were analyzed by SDS-Page and western
blotting (see section 4.2.7).
Table 4.2. Stepwise gradient used in the anion exchange of hTPH1
on a Q Sepharose HP 26/10 column.
Buffer B Column volume Fraction volume
0-5% 0 n/a
5-14% 2 3 ml
14-35% 0 n/a
35-35% 2 3 ml
35-100% 2 Not collected
4.2.4.3 Gel filtration
Fractions containing hTPH1 from the anion exchange (section 4.2.4.2) was collected and pooled.
(NH4)2SO4 was added to a final concentration of 200 mM from a 20 mM Tris/NaOH, 2M (NH4)2SO4
pH 8.5 stock solution. The solution was then concentrated by ultrafiltration in an Amicon stirred
pressure cell with an Ultracel PL-3 membrane. After concentration the sample was filtered
through a 0.45 µm filter and loaded onto a HiLoad Superdex 200 26/60 prep grade column. Prior
to use the column was equilibrated with 20 mM Tris/NaOH, 200 mM (NH4)2SO4 pH 8.5, 0.1 %
DDM. Samples were taken from the supernatant loaded onto the column and from each peak in
the chromatogram and analyzed by SDS-Page (see section 4.2.7).
4.2.5 Determination of the critical micelle concentration The exCMC was determined as described by J. H. Kleinschmidt, M. C. Wiener and L. K. Tamm [98]
where the maximum absorption of Coomassie Brilliant Blue R-250 shift from 555 nm in the
absence to 595 nm in the presence of detergent micelles. The only difference from [98] is that
the concentration of Coomassie Blue was lowered from 10 mM to 2 mM due to too high
absorbance. A solution of 2 mM Coomassie blue in 5 mM borax buffer was used. As blank the
same buffer without Coomassie blue was used (blank buffer). Different DDM concentrations
were added to the flow-through from the first anion exchange (section 4.2.4.2) and two 1 ml
samples of each DDM concentration were prepared. One with 10 µl of the blank buffer and one
with 10 µl of the borax buffer containing Coomassie blue. The absorption spectrum was
measured in the range 500-700 nm in order to detect the Coomassie blue shift for each
concentration. This was done until a shift in maximum absorption was observed indicating that
the concentration of DDM was at the exCMC.

Purification of hTPH1
22
4.2.6 Activity measurements Samples of 400 µl collected during ultracentrifugation of hTPH1 (section 4.2.3.2) were tested for
activity. The activity measurements were done as described in section 8.3.3 using 70 µM
tryptophan, 300 µM BH4 and 500 µM O2. Because the samples were only tested for activity the
oxygen level in the samples were not controlled and the concentration of hTPH1 was not
determined. Additionally, the measured values are given in intensity/min.
4.2.7 SDS-page and Western blotting analysis Tris-HCl gels from Bio-Rad were used and 7.5 % were chosen for optimal separation region
corresponding to the size of hTPH1. The gels were prepared as described in the standard protocol
from Bio-Rad [99]. The marker contained 0.5 μl protein-standard (161-0304) and 19.5 μl water.
All samples were mixed with 5 μl sample buffer and heated in a water-bath at 80oC for 10 min.
The samples were loaded into the wells and the proteins were separated at 100 V for
approximately 90 min with running buffer. After electrophoresis the gels were transferred to a
fixing solution and soaked for 30 min. Afterwards they were stained for 1 hour in a staining
solution, followed by overnight de-staining. The composition of the buffers and solutions are
given in table 4.3.
Table 4.3. Composition of the buffers and solutions used for SDS-Page analysis.
Buffer Composition
Running buffer 3.0 g Tris base, 14.4 g glycine and 5 ml 20 % SDS diluted to 1 L water
Sample buffer 2.0 ml water, 2.0 ml 1.0 M Tris/HCl pH 6.8, 4.0 ml 100 % glycerol, 2.0 ml 10 %
SDS, 4 mg Coomassie Blue G-250
Before use 28 μl β-mercaptoethanol was mixed with 190 μl of sample buffer
Fixation solution 500 ml water, 400 ml 96% ethanol, 100 ml glacial acetic acid
Staining solution 900 ml water, 100 ml glacial acetic acid, 0.25g Coomassie blue G-250
De-staining solution 900 ml water, 100 ml glacial acetic acid
Western blotting analysis was done using PVDF membranes and chemicals (Immun-blot kit 170-
6461) from Bio-Rad. The primary antibody was the murine monoclonal PH8 antibody against TPH,
TH and PAH which binds to hTPH1 at amino acid 125-142 [100], from Chemicon, Victoria,
Australia. 50 µl of the PH8 antibody was added to 5 ml 20 mM Tris, 500 mM NaCl, 0.05 % (vol/vol)
Tween-20, 1 % (w/vol) gelatine, pH 7.5. The secondary antibody was goat anti-mouse alkaline
phosphatase (GAM-AP). 3.3 µl GAM-AP was added to 10 ml 20 mM Tris, 500 mM NaCl, 0.05 %
(vol/vol) Tween-20, 1 % (w/vol) gelatine, pH 7.5. The blotting and the colour development were
done as described in the instruction manual for the Immun-blot kit [101].
4.2.8 Protein identification by mass spectrometry Samples collected during purification of hTPH1 were identified by removing bands from the SDS-
Page gels and digesting the proteins in the gel pieces with trypsin. The analysis of the tryptic
digested peptides was done by tandem mass spectrometry and the protein was identified and
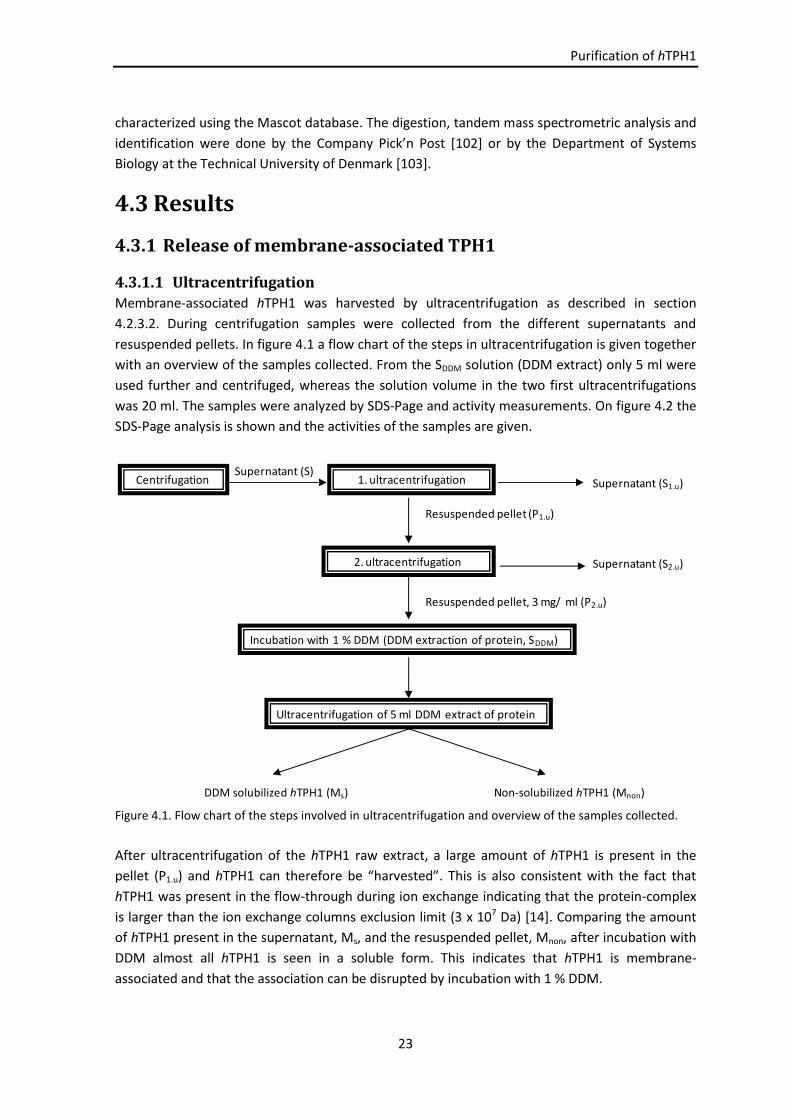
Purification of hTPH1
23
characterized using the Mascot database. The digestion, tandem mass spectrometric analysis and
identification were done by the Company Pick’n Post *102] or by the Department of Systems
Biology at the Technical University of Denmark [103].
4.3 Results
4.3.1 Release of membrane-associated TPH1
4.3.1.1 Ultracentrifugation
Membrane-associated hTPH1 was harvested by ultracentrifugation as described in section
4.2.3.2. During centrifugation samples were collected from the different supernatants and
resuspended pellets. In figure 4.1 a flow chart of the steps in ultracentrifugation is given together
with an overview of the samples collected. From the SDDM solution (DDM extract) only 5 ml were
used further and centrifuged, whereas the solution volume in the two first ultracentrifugations
was 20 ml. The samples were analyzed by SDS-Page and activity measurements. On figure 4.2 the
SDS-Page analysis is shown and the activities of the samples are given.
Figure 4.1. Flow chart of the steps involved in ultracentrifugation and overview of the samples collected.
After ultracentrifugation of the hTPH1 raw extract, a large amount of hTPH1 is present in the
pellet (P1.u) and hTPH1 can therefore be “harvested”. This is also consistent with the fact that
hTPH1 was present in the flow-through during ion exchange indicating that the protein-complex
is larger than the ion exchange columns exclusion limit (3 x 10⁷ Da) [14]. Comparing the amount
of hTPH1 present in the supernatant, Ms, and the resuspended pellet, Mnon, after incubation with
DDM almost all hTPH1 is seen in a soluble form. This indicates that hTPH1 is membrane-
associated and that the association can be disrupted by incubation with 1 % DDM.
CentrifugationSupernatant (S)
1. ultracentrifugation Supernatant (S1.u)
Resuspended pellet (P1.u)
2. ultracentrifugation
Resuspended pellet, 3 mg/ ml (P2.u)
Supernatant (S2.u)
Incubation with 1 % DDM (DDM extraction of protein, SDDM)
Ultracentrifugation of 5 ml DDM extract of protein
DDM solubilized hTPH1 (Ms) Non-solubilized hTPH1 (Mnon)
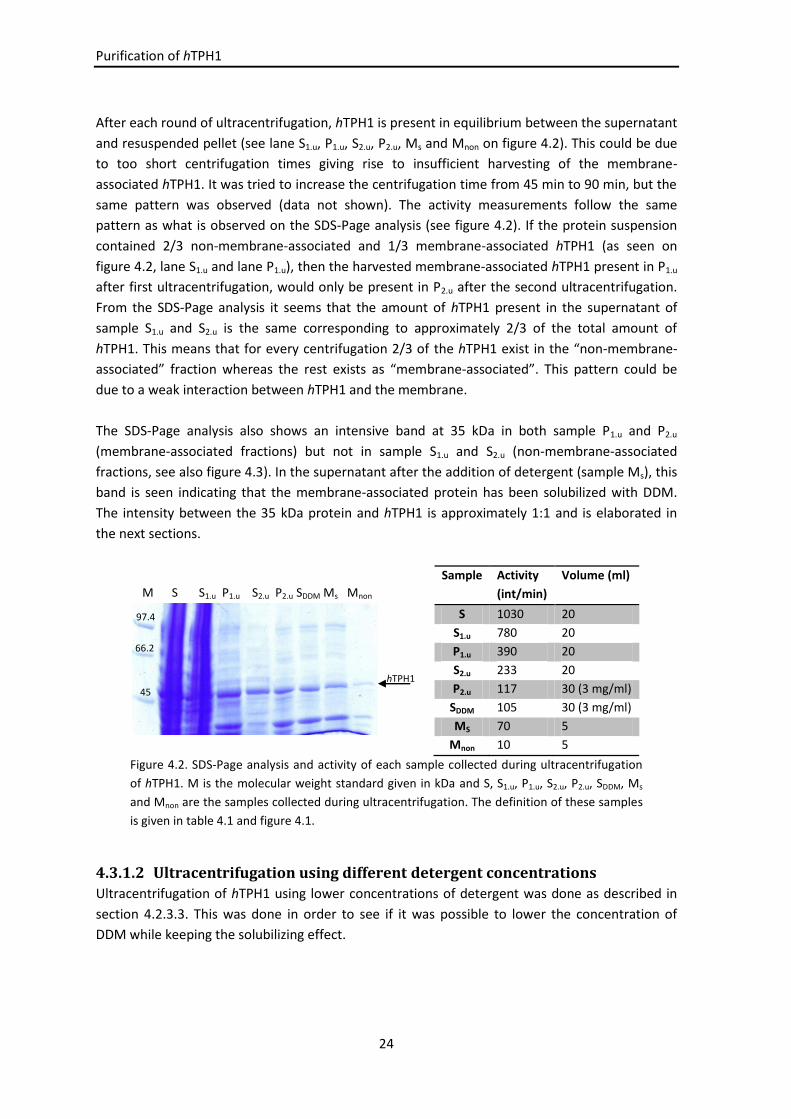
Purification of hTPH1
24
After each round of ultracentrifugation, hTPH1 is present in equilibrium between the supernatant
and resuspended pellet (see lane S1.u, P1.u, S2.u, P2.u, Ms and Mnon on figure 4.2). This could be due
to too short centrifugation times giving rise to insufficient harvesting of the membrane-
associated hTPH1. It was tried to increase the centrifugation time from 45 min to 90 min, but the
same pattern was observed (data not shown). The activity measurements follow the same
pattern as what is observed on the SDS-Page analysis (see figure 4.2). If the protein suspension
contained 2/3 non-membrane-associated and 1/3 membrane-associated hTPH1 (as seen on
figure 4.2, lane S1.u and lane P1.u), then the harvested membrane-associated hTPH1 present in P1.u
after first ultracentrifugation, would only be present in P2.u after the second ultracentrifugation.
From the SDS-Page analysis it seems that the amount of hTPH1 present in the supernatant of
sample S1.u and S2.u is the same corresponding to approximately 2/3 of the total amount of
hTPH1. This means that for every centrifugation 2/3 of the hTPH1 exist in the “non-membrane-
associated” fraction whereas the rest exists as “membrane-associated”. This pattern could be
due to a weak interaction between hTPH1 and the membrane.
The SDS-Page analysis also shows an intensive band at 35 kDa in both sample P1.u and P2.u
(membrane-associated fractions) but not in sample S1.u and S2.u (non-membrane-associated
fractions, see also figure 4.3). In the supernatant after the addition of detergent (sample Ms), this
band is seen indicating that the membrane-associated protein has been solubilized with DDM.
The intensity between the 35 kDa protein and hTPH1 is approximately 1:1 and is elaborated in
the next sections.
M S S1.u P1.u S2.u P2.u SDDM Ms Mnon
Sample Activity
(int/min)
Volume (ml)
S 1030 20
S1.u 780 20
P1.u 390 20
S2.u 233 20
P2.u 117 30 (3 mg/ml)
SDDM 105 30 (3 mg/ml)
MS 70 5
Mnon 10 5
Figure 4.2. SDS-Page analysis and activity of each sample collected during ultracentrifugation
of hTPH1. M is the molecular weight standard given in kDa and S, S1.u, P1.u, S2.u, P2.u, SDDM, Ms
and Mnon are the samples collected during ultracentrifugation. The definition of these samples
is given in table 4.1 and figure 4.1.
4.3.1.2 Ultracentrifugation using different detergent concentrations
Ultracentrifugation of hTPH1 using lower concentrations of detergent was done as described in
section 4.2.3.3. This was done in order to see if it was possible to lower the concentration of
DDM while keeping the solubilizing effect.
hTPH1
45
66.2
97.4

Purification of hTPH1
25
On figure 4.3 the SDS-Page analysis of the samples collected during ultracentrifugation at
different DDM concentration is shown. hTPH1 is observed in every sample and again
approximately 2/3 of the hTPH1 is present in the supernatant (sample S1.u and S2.u). It is also seen
that lowering the DDM concentration does not affect the amount of solubilized hTPH1 (SDDM, MS
and Mnon). These results could indicate that there is equilibrium between solubilized hTPH1 and
the membrane-associated hTPH1. The only difference is the intensity of the 35 kDa protein which
increases with increasing concentration of DDM. A more “clean” sample of hTPH1 is therefore
obtained at low DDM concentrations. Therefore, it was chosen to use a concentration of 0.05 %
in a solution with 3 mg protein/ml.
5ul 20 ul__ 1% DDM 0.2 % DDM 0.05 % DDM__
M S S1.u P1.u S2.u M SDDM Ms Mnon SDDM Ms Mnon M SDDM Ms Mnon
Figure 4.3. SDS-Page analysis of sample S to Mnon collected during ultracentrifugation. M is the molecular
weight standard given in kDa and S, S1.u, P1.u, S2.u, P2.u, SDDM, Ms and Mnon are the samples collected during
ultracentrifugation. The definition of these samples is given in figure 4.1 and in table 4.1.
4.3.1.3 Summary
Ultracentrifugation was done to determine whether hTPH1 could be solubilized from its
associated molecules and approximate the amount of DDM required to solubilize hTPH1 from its
membrane-associated components. From the results obtained during ultracentrifugation of the
hTPH1 sample it was observed that the hTPH1 membrane-associated complex could be
“harvested” and solubilized using detergent and that 0.05 % DDM would be a good concentration
to go further with.
4.3.2 Purification of membrane-associated hTPH1 Ultracentrifugation requires low working sample volumes and is therefore not a sensible strategy
for large sample volumes. Therefore an alternative strategy was employed using the flow-
through from the anion exchange column containing the membrane-associated hTPH1. hTPH1
was then isolated by incubation with DDM followed by purification of the DDM protein
extraction, as described in the following section.
4.3.2.1 Purification test
The supernatant prepared as described in section 4.2.3.1 was loaded onto a Q Sepharose Fast
Flow 16/10 column and hTPH1 was passed through the column as described in section 4.2.4.1.
The flow-through was collected, DDM was added to a final concentration of 0.05 % and the
sample was incubated for 1½ hour or overnight, as described in section 4.2.4.1. After incubation
45 45 45
66.2 66.2 66.2
97.4 97.4 97.4
hTPH1 hTPH1

Purification of hTPH1
26
the protein solution was purified on an anion exchange column. During purification samples were
collected and analyzed by SDS-Page. In figure 4.4 the chromatograms from the second anion
exchange of each sample are shown together with the SDS-Page analysis of the samples.
A) 0.05 % DDM for 1½ hour
P1 P2 P3 P4
M S Ft B1 B10 B11 C8 C12 D2 D12
B) 0.05 % DDM and overnight
P1 P2 P3 _ P4
M S Ft A10 B6 B8 C4 C8 D9
Figure 4.4. Chromatogram and SDS-Page analysis of the anion exchange of the DDM solubilized hTPH1
using 0.05 % DDM and different incubation times where A) is incubation for 1½ hour and B) is
incubation overnight. The red curve is absorbance at 280 nm, the brown curve is the conductivity in
mS/cm, the green curve is the concentration of buffer B in %. Fractions are shown with red lines. M is
the molecular weight standard given in kDa, S is the supernatant loaded onto the column, Ft is the
flow-through and A10, B1, B6, B8, B10, B11, C4, C8, D2, D9 and D12 are fractions collected during
purification.
The chromatograms from both purifications are very alike with the observation of four peaks:
Two major ones (P1 and P2), a broad peak (P3) and a smaller one (P4). On the SDS-Page analysis a
band with the same size as hTPH1 (51 kDa) is seen in the fractions corresponding to the last three
peaks (P2, P3 and P4), showing that hTPH1 might bind to the column. The presence of hTPH1 in
the last peak is most likely due to a poor resolution between P3 and P4 and by decreasing the
slope of the gradient a better resolution between P3 and P4 can be achieved.
UV2_280nm Cond Conc Fractions
0
100
200
300
400
mAU
0
20
40
60
80
%B
0
20
40
60
80
100
mS/cm
100 150 200 250 ml
A3 A5 A7 A9 A11 B1 B3 B5 B7 B9 B11 C1 C3 C5 C7 C9 C11 D1 D3 D5 D7 D9 D11 E1 E3 E5 E7 E9 Waste
UV2_280nm UV3_416nm Cond Conc Fractions
0
100
200
300
400
mAU
0
20
40
60
80
mAU
0
20
40
60
80
100
mS/cm
0
20
40
60
80
%B
100 150 200 250 ml
F1A1 A3 A5 A7 A9 A11 B1 B3 B5 B7 B9 B11 C1 C3 C5 C7 C9 C11 D1 D3 D5 D7 D9 D11 E1 E3 E5 Waste
P1
P1
P2
P2
P3
P3
P4
P4
97.4
66.2
45 hTPH1
97.4
66.2
45
hTPH1

Purification of hTPH1
27
The main differences between the two chromatograms are the absorbance ratio between P1, P2
and P3. The absorbance of P1 is much higher for the anion exchange of the sample incubated
with DDM overnight (figure 4.4B), compared to the other two. From the SDS-Page analysis no
band is observed and the absorbance is most probably due to DNA. Additionally, the absorbance
ratio between P2 and P3 (P2/P3) is much higher for the anion exchange of the sample incubated
with 0.05 % DDM overnight. From the SDS-Pages the intensity of hTPH1 in P2 and P3 is the same
indicating that for example DNA could be present in the sample giving rise to this higher
absorbance. From the SDS-Page-analysis the hTPH1 sample is much cleaner in P2 compared to
P3. Also the 35 kDa protein mentioned in section 4.3.1 is present in P3.
Comparing the amount of hTPH1 present in the supernatant loaded onto the column with the
amount seen in the flow-through from the two purifications there is still some hTPH1 present in
the flow-through, but with a lower amount observed for the sample incubated overnight (has a
higher supernatant/flow-through ratio). It was therefore chosen to use overnight incubation with
DDM. To increase the yield of solubilized hTPH1, thus decreasing the amount of hTPH1 in the
flow-through a higher concentration of DDM could be the answer.
From these results it is observed that hTPH1 could be released from the hTPH1-complex by DDM
and that the released hTPH1 binds to the column. It was therefore chosen to optimize the
purification method in order to increase the yield of purified hTPH1.
4.3.2.2 Anion exchange with DDM at the exCMC
To optimize the yield of purified hTPH1, cells from 3 times 650 ml cultures were prepared as
described in section 4.2.3.1 and the purification was performed on a Q Sepharose High
Performance 26/10 column. To obtain a higher amount of solubilized hTPH1, thus increasing the
amount of hTPH1 binding to the column the concentration of DDM was increased until the
exCMC of DDM was reached. This was done to ensure, that the amount of DDM was high enough
to get all membrane-associated hTPH1 solubilized (see section 4.1). The concentration of DDM in
the anion exchange buffer system was also changed so the concentration corresponded to the
exCMC of DDM in the sample that was used. The gradient was changed to a stepwise gradient in
order to decrease the elution volume of P3.
hTPH1 was purified as described in section 4.2.4.2. The flow-through from the first anion
exchange was collected and the exCMC of DDM was determined. This was done by using
Coomassie Blue as described in section 4.2.5. In figure 4.5 the UV-Vis spectra of the exCMC assay
are shown. From the series of spectra a shift in absorbance from 555 nm to 595 nm is seen at a
DDM concentration of 0.1 % and above, indicating the presence of detergent micelles. It was
therefore chosen to add DDM to a total concentration of 0.1 % to the flow-through.
After incubation the flow-through was loaded onto an anion exchange and eluted as described in
section 4.2.4.2. The chromatogram from the anion exchange is shown in figure 4.6. Again three
peaks with absorbance at 280 nm are seen in the chromatogram eluting at 5 mS/cm, 13 mS/cm
and 30 mS/cm, respectively. Samples from the supernatant loaded onto the column, the flow-

Purification of hTPH1
28
through and from each peak (fraction B6, C3, C4, C5 E4) were analyzed by SDS-Page and western
blotting shown in figure 4.7 and 4.8, respectively. A sample from P5 (absorbance at 416 nm) was
also collected and analyzed.
Figure 4.5. UV-Vis spectra of the flow-through with different concentrations of DDM. A
shift in absorbance is seen at concentrations of DDM at 0.1 % and above.
Comparing the chromatogram in figure 4.6 with the chromatogram in figure 4.4B they are very
similar, but a better resolution between P2 and P3 is seen due to a change in gradient. A higher
absorbance intensity is also seen for P2 in figure 4.6 which is due to a higher amount of proteins
and DNA (increased amount of cell culture).
Comparing the amount of hTPH1 in the supernatant with the amount in the flow-through almost
all hTPH1 binds to the column which indicates that at higher concentration of DDM more hTPH1
is solubilized from the hTPH1-complex. Combining the results from the SDS-Page analysis and
western blotting analysis with the chromatogram, hTPH1 is observed both in P2 and P5 with the
same intensity but the absorbance of P2 is much higher than the absorbance of P5. Therefore,
the absorbance in P2 is most probably due to DNA or a protein smaller than the separation region
of the SDS-Page, which was also observed in the purification test (see section 4.3.2.1).
Additionally, the band corresponding to the size of hTPH1 in P3 on the SDS-Page analysis does not
show a band on the western blot and is therefore not hTPH1. The 35 kDa protein is present in P3.
The ratio between hTPH1 and the 35 kDa protein are approximately 1:1 in the supernatant. The
hTPH1 present in the flow-through is also in a 1:1 ratio with this protein. It could therefore be
speculated that hTPH1 associates with this protein and in the presence of DDM they dissociates
and bind to the column due to decrease in size. From the results of the anion exchange and SDS-
Page analysis it is seen that they are separated.
From these results it can be concluded that by incubating the hTPH1-complex with 0.1 % DDM,
hTPH1 can be released and for the first time it is able to bind to the anion exchange column. The
bound hTPH1 showed to elute in several peaks (over a large area) which could indicate that
hTPH1 still exists in different oligomer forms just smaller in size. Despite this and because a huge
0
0.5
1
500 550 600 650
Ab
sorb
ance
Wavelength
0.5 % DDM
0.1 % DDM
0.05 % DDM
0.02 % DDM
0.01 % DDM
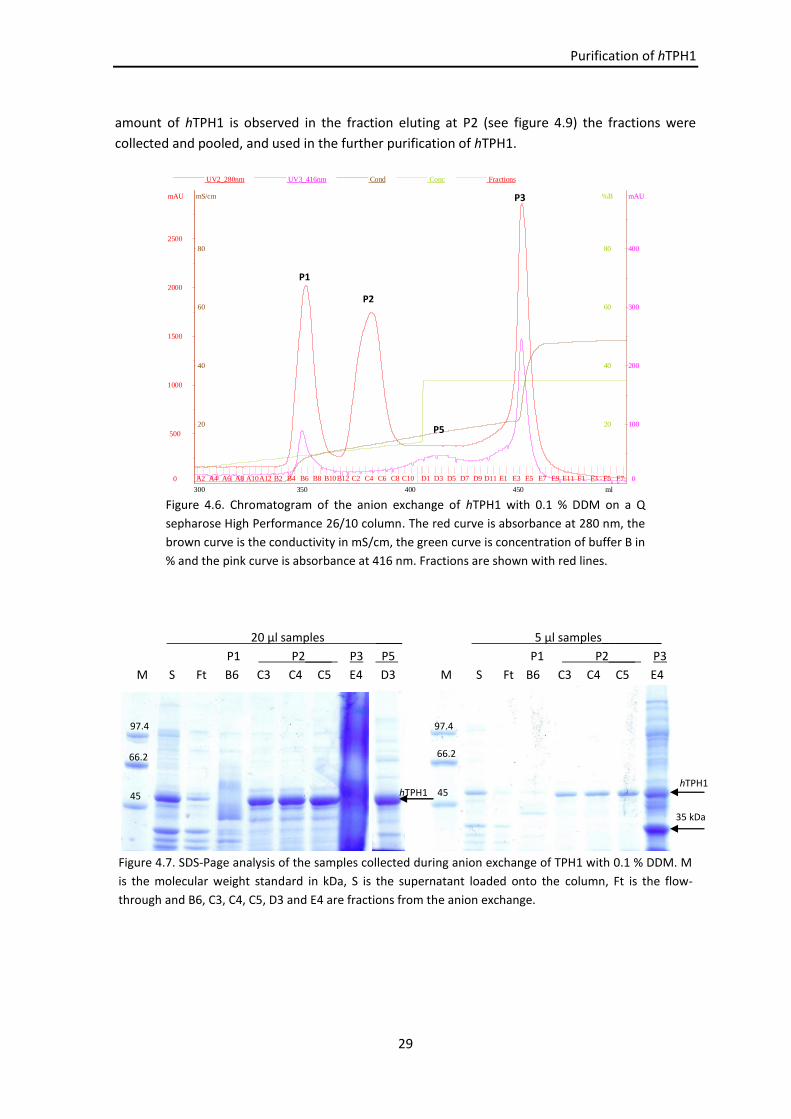
Purification of hTPH1
29
amount of hTPH1 is observed in the fraction eluting at P2 (see figure 4.9) the fractions were
collected and pooled, and used in the further purification of hTPH1.
Figure 4.6. Chromatogram of the anion exchange of hTPH1 with 0.1 % DDM on a Q
sepharose High Performance 26/10 column. The red curve is absorbance at 280 nm, the
brown curve is the conductivity in mS/cm, the green curve is concentration of buffer B in
% and the pink curve is absorbance at 416 nm. Fractions are shown with red lines.
20 µl samples ____ 5 µl samples_________
P1 P2____ P3 P5 P1 P2____ P3
M S Ft B6 C3 C4 C5 E4 D3 M S Ft B6 C3 C4 C5 E4
Figure 4.7. SDS-Page analysis of the samples collected during anion exchange of TPH1 with 0.1 % DDM. M
is the molecular weight standard in kDa, S is the supernatant loaded onto the column, Ft is the flow-
through and B6, C3, C4, C5, D3 and E4 are fractions from the anion exchange.
UV2_280nm UV3_416nm Cond Conc Fractions
0
500
1000
1500
2000
2500
mAU
0
100
200
300
400
mAU
0
20
40
60
80
mS/cm
0
20
40
60
80
%B
300 350 400 450 ml
A2 A4 A6 A8 A10A12 B2 B4 B6 B8 B10B12 C2 C4 C6 C8 C10 D1 D3 D5 D7 D9 D11 E1 E3 E5 E7 E9 E11 F1 F3 F5 F7
97.4 97.4
66.2 66.2
45 45 hTPH1 hTPH1
35 kDa
P1
P2
P3
P5

Purification of hTPH1
30
P1 P2 P3 P5
S Ft B5 B7 C4 E4 P2 M D3 M
Figure 4.8. Western blotting analysis of samples collected during anion
exchange of hTPH1 with 0.1 % DDM. M is the molecular weight standard
given in kDa, S is the supernatant loaded onto the column, Ft is the flow-
through and B5, B6, C4, D3 and E4 are fractions from the anion exchange. P2
is a sample from all fractions from peak 2 (P2) in the anion exchange.
4.3.2.3 Gel filtration
The fraction B12-C8 (P2) from the anion exchange were collected and pooled, ammonium sulfate
was added to a total concentration of 200 mM and the solution concentrated to approximately 9
ml. The protein solution was loaded onto a Superdex200 26/60 column as described in section
4.2.4.3 and the chromatogram from the purification is shown in figure 4.9. Samples from each
peak were analyzed by SDS-Page and western blotting and the analysis is shown in figure 4.10.
From the gel filtration two peaks are seen: One at 140 ml and one at 158 ml. From the SDS-Page a
band corresponding to the size of hTPH1 is seen in all fractions but with a higher amount in the
first peak. From the western blotting analysis it can be concluded that these bands correspond to
hTPH1. It can therefore be concluded that the size of the hTPH1-complex has been decreased by
DDM and that the size is within the gel filtration column separation region (1 x 10⁴ – 6 x 10⁵ Da).
hTPH1 does not elute in the void volume. From a calibration curve constructed for this column
[57] the elution volumes correspond to a size of 280 kDa and 154 kDa, respectively. It can
therefore be concluded that hTPH1 can be purified in two oligomer forms (monomer 51 kDa).
These oligomer forms could either be by formation of a 5mer or a 3mer or by association to other
molecules. From the bottom of the SDS-Page a blue line is observed which is most probably due
to the presence of smaller molecules which cannot be separated on the gel used (7.5 %).
4.3.3 Protein identification The bands from the SDS-Page analysis corresponding to hTPH1 from the anion exchange (fraction
C4 and D3) and from the gel filtration (fraction B5 and B12) were subjected to protein
identification by mass spectrometry (described in section 4.2.8). The identification confirmed that
the protein was hTPH1. Additionally, the band corresponding to the 35 kDa was also analyzed and
it showed to be an outer membrane protein F (OmpF) from E. coli with a molecular weight of
39330 Da. The OmpF is a membrane protein and therefore, it also gets solubilized by DDM
followed by binding to the column.
hTPH1 64
64
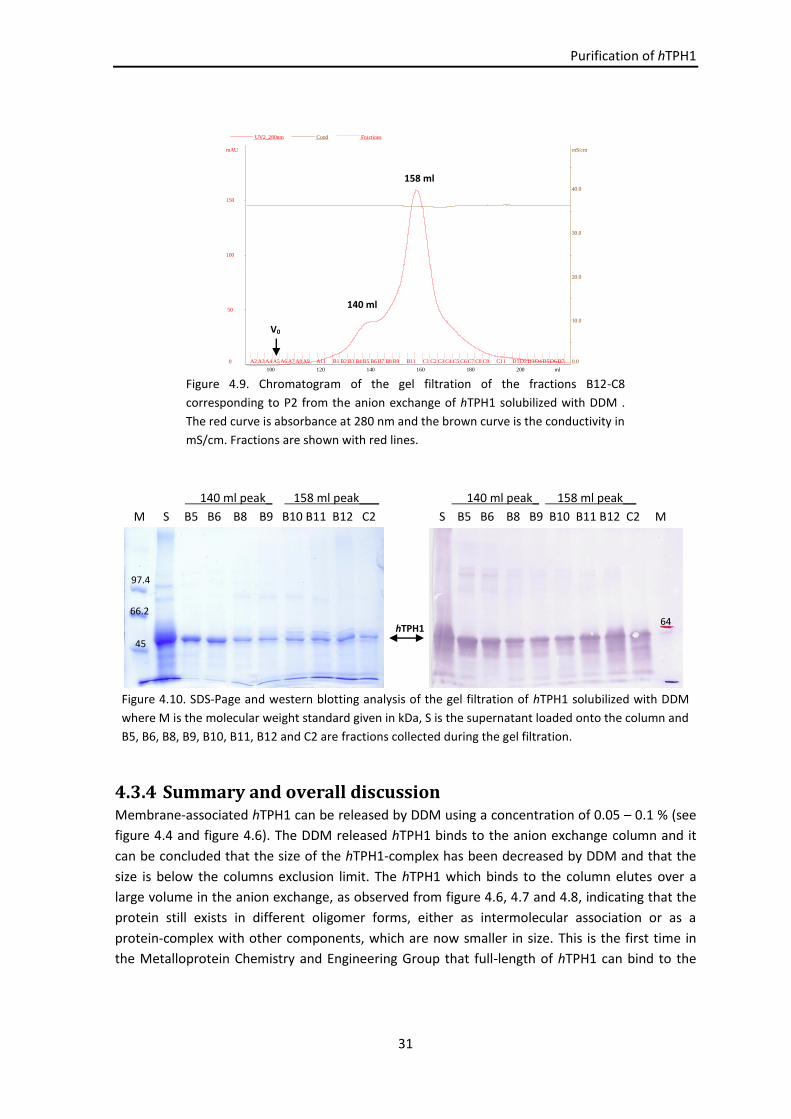
Purification of hTPH1
31
Figure 4.9. Chromatogram of the gel filtration of the fractions B12-C8
corresponding to P2 from the anion exchange of hTPH1 solubilized with DDM .
The red curve is absorbance at 280 nm and the brown curve is the conductivity in
mS/cm. Fractions are shown with red lines.
140 ml peak_ 158 ml peak___ 140 ml peak_ 158 ml peak__
M S B5 B6 B8 B9 B10 B11 B12 C2 S B5 B6 B8 B9 B10 B11 B12 C2 M
Figure 4.10. SDS-Page and western blotting analysis of the gel filtration of hTPH1 solubilized with DDM
where M is the molecular weight standard given in kDa, S is the supernatant loaded onto the column and
B5, B6, B8, B9, B10, B11, B12 and C2 are fractions collected during the gel filtration.
4.3.4 Summary and overall discussion Membrane-associated hTPH1 can be released by DDM using a concentration of 0.05 – 0.1 % (see
figure 4.4 and figure 4.6). The DDM released hTPH1 binds to the anion exchange column and it
can be concluded that the size of the hTPH1-complex has been decreased by DDM and that the
size is below the columns exclusion limit. The hTPH1 which binds to the column elutes over a
large volume in the anion exchange, as observed from figure 4.6, 4.7 and 4.8, indicating that the
protein still exists in different oligomer forms, either as intermolecular association or as a
protein-complex with other components, which are now smaller in size. This is the first time in
the Metalloprotein Chemistry and Engineering Group that full-length of hTPH1 can bind to the
UV2_280nm Cond Fractions
0
50
100
150
mAU
0.0
10.0
20.0
30.0
40.0
mS/cm
100 120 140 160 180 200 ml
A2 A3A4 A5 A6 A7 A8 A9 A11 B1 B2 B3 B4 B5 B6 B7 B8 B9 B11 C1 C2 C3 C4 C5 C6 C7 C8 C9 C11 D1D2D3D4D5D6D7
140 ml
158 ml
V0
hTPH1
45
66.2
97.4
64

Purification of hTPH1
32
anion exchange column applied. The hTPH1 sample, from the anion exchange that was loaded
onto the gel filtration column, also showed to exists in two oligomer forms.
Additionally, from the anion exchange an OmpF protein is present in P3. This membrane protein
is also observed to be isolated by ultracentrifugation and solubilized by DDM. The ratio between
this and hTPH1 in the supernatant before loading on the anion exchange column is approximately
1:1. Due to this and the elution pattern of hTPH1 in the anion exchange it could be speculated
that hTPH1 associates with this protein. This also point towards that hTPH1 can be solubilized and
purified using DDM and that the protein stabilizes hTPH1 in solution by association. When the
association is interrupted hTPH1 elutes in the anion exchange over a large volume.
From these results it can be concluded that the effect of DDM is most probably to stabilize the
protein so the interaction of hTPH1 with other components is decreased. However, it is still
difficult to understand the behavior of hTPH1 during purification. From expression and solubility
test done on chTPH2, cthTPH2 and hTPH2, respectively [6,57,104] it was observed that the
presence of the regulatory domain caused the protein to be insoluble. Because of this and the
fact that chTPH1, chTPH2 and cthTPH2 can be purified the problems of purifying hTPH1 was
speculated to be due to the regulatory domain. Therefore in order to understand the behavior of
hTPH1, a “divide-and-conquer” strategy was applied. Variants of both hTPH1 and hTPH2
containing the regulatory domain or parts of it were constructed as described in chapter 5 and 6.
4.4 Conclusion hTPH1 has been released from its membrane-associations by DDM. After incubation hTPH1 can
successfully bind to the anion exchange column indicating that the size of the protein has been
decreased. This is the first time the full-length of hTPH1 binds to an anion exchange column. The
bound hTPH1 elutes over a large volume which is most probably due to oligomerization of the
protein which is also observed in the gel filtration. It can be concluded that DDM stabilizes the
protein and eliminates the interaction to other molecules. This is the first simple procedure that
has been developed for purification of hTPH1. However, it still needs some optimization
regarding stability and elution of the protein in one oligomeric form.

33
5 Construction of E. coli strains for expression of hTPH variants
hTPH is very difficult to work with due to insolubility and precipitation, and the behavior of full-
length hTPH1 during purification, as described in chapter 4, is still not understood. Therefore, to
better examine the properties of hTPH a “divide-and-conquer” strategy has been applied where
both isoforms were truncated to fewer domains or shorter sequences. Expression strains were
constructed for expression of these variants. The expression strategy was not fully established
from the beginning of this project but has evolved and changed on the way based on the results
obtained from both expression and purification of the constructed variants (see chapter 6 and 7).
In this chapter a detailed description of the strategy used for construction of the expression
strains using E. coli as an expression host is presented, together with experimental procedures
and a summary of the results.
5.1 Strategies used for construction of expression
strains Construction of an expression strain can be divided into three parts: Production of the gene of
interest, construction of the expression vector containing the gene of interest and construction of
the expression strain for expression of the gene of interest.
The gene of interest is produced by polymerase chain reaction (PCR) amplification using a
template and a set of primers designed specifically for the gene. When the gene fragment has
been amplified by PCR it is cloned into the PCR-Script cloning vector and transferred into E. coli
DH5α cells. The gene is then removed from the cloning vector, ligated into an expression vector

Construction of hTPH strains
34
and propagated by transformation of the vector into DH5α cells. The expression vector is then
transferred into E. coli BL21(DE3) cells and an expression strain has been constructed. In figure
5.1 a schematic presentation of the steps involved is given.
Part 1 – Production of gene of interest
Part 2 – Construction of expression vector
Part 3 – Construction of expression strains
Figure 5.1. A schematic presentation of the steps involved in construction of genes, expression vectors
and expression strains.
5.2 Construction of hTPH1 strains
5.2.1 Production of gene of interest
5.2.1.1 Gene design
The sequences of the different constructs were chosen from alignment of the amino acid
sequence of full-length hTPH1 with cggTPH1 and chTPH2 both produced in the Metalloprotein
Chemistry and Engineering Group. In figure 5.2 this alignment is shown. From the alignment the
sequence of the regulatory domain (r) was chosen from amino acid 1 to 99 corresponding to bp 1
to 297, the catalytic domain (c) from amino acid 100 to 413 corresponding to bp 298 to 1239, and
the tetramerization domain (t) from amino acid 414 to 444 corresponding to bp 1240 to 1332.
Cloning into PCR-Script
cloning vector Amplification of gene by PCR
Transformation of cloning
vector into DH5α cells Sequencing
Glycerol stocks
Transformation of expression vector into DH5α cells
Cloning of gene into an
expression vector Sequencing
Glycerol stock Transformation of expression vector
into BL21(DE3) cells
Glycerol stock

Construction of hTPH strains
35
5.2.1.2 Gene amplification
The codon optimized full-length hTPH1 gene sequence for expression in E. coli and inserted in a
pUC57 cloning vector was obtained from Genscript Corporation, USA. The gene was flanked with
two unique restriction enzyme sites, NdeI in the N-terminal and XhoI in the C-terminal and
termed hTPH1/NdeI/XhoI. The Met-codon (ATG), required for translation initiation, is part of the
NdeI site (CATATG) and a stop codon (TAA) was placed directly before the XhoI site.
Each gene was produced by PCR amplification with the full-length hTPH1 gene as template and a
specific set of primers given in table A1.1, appendix A.1. After amplification of each gene they
were cloned into the PCR-script cloning vector (Stratagene), propagated and the gene fragments
were sequenced by Eurofins MWG Operon, Germany.
1 65
hTPH1 (1) MIEDNKENKDHSLERGRASLIFSLKNEVGGLIKALKIFQEKHVNLLHIESRKSKRRNSEFEIFVD
cggTPH1 (1) -----------------------------------------------------------------
chTPH2 (1) -----------------------------------------------------------------
66 130
hTPH1 (66) CDINREQLNDIFHLLKSHTNVLSVNLPDNFTLKEDGMETVPWFPKKISDLDHCANRVLMYGSELD
cggTPH1 (1) ----------------------------------GDMENIPWYPKKISDLDKCANRVLMYGSDLD
chTPH2 (1) -----------------------------------ELEDVPWFPRKISELDKCSHRVLMYGSELD
131 195
hTPH1 (131) ADHPGFKDNVYRKRRKYFADLAMNYKHGDPIPKVEFTEEEIKTWGTVFQELNKLYPTHACREYLK
cggTPH1 (32) ADHPGFKDNVYRKRRKYFADLAMNYKHGDPIPEIEFTEEEIKTWGTVYRELNKLYPTHACREYLK
chTPH2 (31) ADHPGFKDNVYRQRRKYFVDVAMGYKYGQPIPRVEYTEEETKTWGVVFRELSKLYPTHACREYLK
196 260
hTPH1 (196) NLPLLSKYCGYREDNIPQLEDVSNFLKERTGFSIRPVAGYLSPRDFLSGLAFRVFHCTQYVRHSS
cggTPH1 (97) NLPLLTKYCGYREDNIPQLEDVSRFLKERTGFTIRPVAGYLSPRDFLAGLAFRVFHCTQYVRHSS
chTPH2 (96) NFPLLTKYCGYREDNVPQLEDVSMFLKERSGFTVRPVAGYLSPRDFLAGLAYRVFHCTQYIRHGS
261 325
hTPH1 (261) DPFYTPEPDTCHELLGHVPLLAEPSFAQFSQEIGLASLGASEEAVQKLATCYFFTVEFGLCKQDG
cggTPH1 (162) DPLYTPEPDTCHELLGHVPLLAEPSFAQFSQEIGLASLGASDEAVQKLATCYFFTVEFGLCKQEG
chTPH2 (161) DPLYTPEPDTCHELLGHVPLLADPKFAQFSQEIGLASLGASDEDVQKLATCYFFTIEFGLCKQEG
326 390
hTPH1 (326) QLRVFGAGLLSSISELKHALSGHAKVKPFDPKITCKQECLITTFQDVYFVSESFEDAKEKMREFT
cggTPH1 (227) QLRVYGAGLLSSISELKHSLSGSAKVKPFDPKVTCKQECLITTFQEVYFVSESFEEAKEKMREFA
chTPH2 (226) QLRAYGAGLLSSIGELKHALSDKACVKAFDPKTTCLQECLITTFQEAYFVSESFEEAKEKMRDFA
391 444
hTPH1 (391) KTIKRPFGVKYNPYTRSIQILKDTKSITSAMNELQHDLDVVSDALAKVSRKPSI
cggTPH1 (292) KTIKRPFGVKYNPYTQSVQILKD-------------------------------
chTPH2 (291) KSITRPFSVYFNPYTQSIEILKD-------------------------------
Figure 5.2. Alignment of full-length human TPH1 (hTPH1) with gallus gallus cTPH1 (cggTPH1) and
human cTPH2 (chTPH2). The program Vector NTI Advance 10 from Invitrogen was used for alignment
[34]. Green background indicates conserved residues in all sequences and yellow background
indicates conserved residues in two of the sequences. The domain boundaries as used in this project
are marked by black vertical lines.
Catalytic domain
Tetramerization domain
Regulatory domain

Construction of hTPH strains
36
5.2.2 Construction of expression vectors
5.2.2.1 pET-expression vector system
The pET-expression vector system developed by Studier et al. [105,106] was used in this project.
This system was chosen due to its tightly regulated promoter as well as the ability to express
target proteins of up to 50 % of the total cell protein. The system uses a highly specific T7 RNA
polymerase that expresses target genes under the control of T7 transcription and translation
signals. It typically contains a T7lac promoter consisting of a lac operator sequence downstream
of the T7 promoter and a lacI gene coding for a lac repressor which blocks the T7 promoter, thus
blocking transcription of the gene of interest under non-inducible conditions. The promoter is an
IPTG inducible T7 promoter [107].
5.2.2.2 Construction of hTPH1 pET-expression vectors
The produced hTPH1/NdeI/XhoI gene fragments (section 5.2.1.2) were removed from the cloning
vectors and ligated into a pET-expression vector (pET26b) between the NdeI and XhoI sites in the
cloning region. A pET26-expression vector for expression of a hTPH1 variant was constructed.
5.2.3 Construction of expression strains The constructed expression vectors (section 5.2.2.2) were transferred into E. coli BL21(DE3)
expression host strains. These host strains are DE3 lysogens and the genome contains coding
regions for T7 RNA polymerase, a lacI gene and a lacUV5 promoter with a lac operator sequence.
T7 RNA polymerase is transcribed from the host genome when E. coli RNA polymerase binds to
the lacUV5 promoter sequence and thereby initiate transcription. With the absence of inducer
the transcription, of both T7 RNA polymerase and the gene of interest, is blocked by binding of
the lac repressor to the lac operator sequence, also mentioned in section 5.2.2.1. T7 RNA
polymerase and the gene of interest are therefore tightly regulated by the lac operator so no
basal expression of target protein is present in the absence of inducer [105,106].
5.3 Construction of fusion tag expression strains The fusion tag strategy offers several advantages such as increased expression levels, correct
folding, thus enhanced solubility and simple purification procedures. Different kinds of fusion
tags exist and the most often used are the solubility-enhancing tags that increase the recovery of
functional proteins and the affinity tags that reduce the number of purification steps [108].
Purification of hTPH variants containing the regulatory domain showed to be more difficult than
first expected as described both in chapter 4 and 7. To better understand the property of hTPH
and to achieve a soluble and purified variant containing the regulatory domain of hTPH,
strategies using the green fluorescent protein (GFP) or glutathione S-transferase (GST) as fusion
tags were applied as described in section 5.3.1 and 5.3.2. The GFP was used to visualize the
rhTPH1 variant during expression and purification (see chapter 6 and 7), whereas GST is used
because of stabilization of rhTPH1 by salt in the raw extract, as described in chapter 7.

Construction of hTPH strains
37
5.3.1 GFP fusion tag TPH is a colorless enzyme and by fusion of the GFP folding reporter (frGFP) to TPH, it is possible
to use frGFP as a visual marker for both gene expression and purification [109,110,111]. The
frGFP is a modified soluble variant that folds well in E. coli and contains six mutations compared
to the wild type GFP (wtGFP) from Aequorea victoria. One mutation (Q80R) is due to a PCR error
[109], 3 mutations increase the fluorescence signal of the protein (F99S, M153T, V163A) [109],
one mutation is a red-shifted mutation (S65T) [110] and the final mutation is a folding mutation
which increases the amount of soluble protein (F64L) [110,111].
To visualize the folding of a protein the frGFP is fused to the C-terminal of the target protein. By a
correct folding of the target protein, frGFP will be folded correctly and only by correct folding of
frGFP the protein will be fluorescent (colored green) [111,112]. The fluorescence of GFP can
therefore be used to estimate the yield of correctly folded upstream protein.
Due to this visualization effect it was chosen to fuse the frGFP to the C-terminal of rhTPH1 for
two reasons. Firstly, because it was difficult to follow the purification of rhTPH1 due to an
extinction coefficient of zero at 280 nm and because western blotting analysis is impossible since
no antibody against rTPH exists and secondly, to determine the expression level as well as the
yield of correctly folded mutants of rhTPH1.
5.3.1.1 Waldo-GFP expression vector
The pWaldo-GFP vector used in this project was kindly provided by Jan-Willem de Gier [112]. It is
a pET28(a+) expression vector containing the BgIII/XhoI fragment of pET21(a+). The DNA
sequence for the recombinant tobacco etch virus (TEV) protease cleavage site (protease
recognition site: ENLYFQ/G (/: cleavage site)) followed by the DNA sequence of the frGFP gene is
inserted in the BamHI/HindIII site of the vector [111,113], as shown in figure 5.3. The pET-
expression vector system is described in section 5.2.2.
Figure 5.3. Overview of the pWaldo-GFPd expression vector that shows the translation initiation region
(TIR), the TEV protease cleavage site and the frGFP sequence [113, supplementary figure 1]. Reproduced
with permission from the Nature Publishing Group.
5.3.1.2 Construction of the rhTPH1-frGFP expression strain
The rhTPH1 gene was constructed with a NdeI site in the N-terminal and a BamHI site in the C-
terminal due to cloning into the NdeI/BamHI site of the pWaldo-GFPd vector. The gene is
produced by PCR amplification with the full-length hTPH1 gene as template and a specific set of
primers given in table A1.2, appendix A1. After amplification the gene was cloned into the PCR-
script cloning vector, propagated and the PCR-product was analyzed by DNA sequencing. The

Construction of hTPH strains
38
produced rhTPH1/NdeI/BamHI gene fragment was removed from the cloning vector and ligated
into the NdeI/BamHI site of the pWaldo-GFPd expression vector. The constructed vector was
then transferred into E. coli BL21(DE3) cells.
As a positive control the frGFP protein is expressed alone to compare the intensity of the
fluorescence of fusion protein with the intensity of correctly folded frGFP. The frGFP expression
vector contains an additional nucleotide between the NdeI and BamHI (see figure 5.3), which
does not have any influence when the frGFP is used as a fusion partner, due to insertion of the
gene of interest in the vectors NdeI and BamHI restrictions sites. This is only relevant when frGFP
itself is used as positive control. This nucleotide was removed by PCR-based site-directed
mutagenesis.
5.3.1.3 Constructions of mutation in the 3,4-hydrophobic face of rhTPH1
As described in chapter 4 it is difficult to purify full-length hTPH. From previous purification of
hTPH1 done in my master project [14] it was concluded that hTPH1 interacts with other
molecules such as membrane fragments or lipid molecules through hydrophobic interaction. This
results in formation of large oligomers that could not bind to the applied columns. From
purification of hTPH1 using DDM the hTPH1 protein elutes in several fractions indicating that the
protein still exists in different oligomer forms. This is also observed from purification of rhTPH1
(see chapter 7).
The secondary structure of the regulatory domain of TPH is predicted to make an α-helix
structure and due to a 3,4-hydrophobic repeat placed from amino acid 21 to 41 in hTPH1 a
coiled-coil structure in the regulatory domain is possibly creating a hydrophobic face, as
mentioned in section 2.3.3. If this hydrophobic face is located at the outer surface of the native
protein the protein can oligomerize either by intermolecular associations or by interaction to
other hydrophobic molecules. By mutation in the hydrophobic face these interactions could be
decreased, and therefore formation of different oligomers could be eliminated causing the
protein to be present in hopefully one oligomer form. Mutations in this repeat is therefore
performed to see which, if any, of the amino acids in the hydrophobic face that are involved in
oligomer formation as well as to elucidate the function of this repeat.
Three different mutants are constructed each containing two mutations. The hydrophobic amino
acids are changed to arginine to create more charges. The following mutants of rhTPH1 were
constructed: L24R and V28R (L24R/V28R-rhTPH1), L31R and L35R (L31R/L35R-rhTPH1) and finally
V28R and L31R (V28R/L31R-rhTPH1). The mutants were constructed as described for the hTPH
variants in section 5.2, but the production of genes was done by PCR-based site-directed
mutagenesis with the rhTPH1/NdeI/BamHI gene fragment inserted in the PCR-script vector
(section 5.3.1.2) as template and a specific set of primers containing the desired base changes to
generate the different mutations. The primer sets are given in table A1.2, appendix A1. In the
PCR-based site-directed mutagenesis the whole plasmid containing the gene of interest is used as
template. The mutant gene was removed from the cloning vector, inserted into the pWaldo-GFPd
vector and the expression vector was then transferred into E. coli BL21(DE3) expression strains.

Construction of hTPH strains
39
The fluorescence intensity of the three mutants was compared to the rhTPH1-frGFP from section
5.3.1.1 to see whether or not these mutations had any influence on the folding and solubility of
the enzyme.
5.3.2 GST fusion tag During purification of rhTPH1 it was observed that a high content of salt in the raw extract
stabilized the rhTPH1 (see chapter 7). Therefore, it was decided to construct a variant which can
be purified with a high content of salt. This was done by using GST as an affinity tag. The vector
used is a pGEX-5X-1 vector.
5.3.2.1 pGEX-5X-1 fusion vector system
The pGEX fusion vector system contains the GST gene from Schistosoma japonicum [114]. The
target gene is cloned into the multiple cloning site positioned downstream from the GST gene.
Expression of the fusion protein is under control of a tac promoter, which is induced by IPTG
[115]. The pGEX-5X-1 also encodes the recognition region for the site-specific protease Factor Xa
located between the GST domain and the multiple cloning site. Proteins can therefore be
separated from GST by cleavage with Factor Xa [116,115]. In figure 5.4 a schematic
representation of the multiple cloning site of pGEX-5X-1 is given.
_______________ SmaI XhoI__
Ile Glu Gly Arg Gly Ile Pro Glu Phe Pro Gly Arg Leu Glu Arg Pro His Arg Asp ***
ATC GAA GGT CGT GGG ATC CCC GAA TTC CCG GGT CGA CTC GAG CGG CCG CAT CGT GAC TGA
TAG CTT CCA GCA CCC TAG GGG CTT AAG GGC CCA GCT GAG CTC GCC GGC GTA GCA CTG ACT
BamHI EcoRI SalI NotI
Figure 5.4. Multiple cloning site of the pGEX-5X-1 vector [116].
5.3.2.2 Construction of the GST-rhTPH1 expression strain
rhTPH1 was fused to the C-terminal of GST by cloning the rhTPH1 gene into the BamHI/XhoI site
in the multiple cloning site. The gene was therefore flanked with a BamHI site in the N-terminal
and a stop codon followed by a XhoI site in the C-terminal. The use of the BamHI site gives rise to
an extra nucleotide between the Factor Xa recognition site and the BamHI which alters the
reading frame, also shown in figure 5.4. For correction two additional nucleotides, CC, is inserted
between the BamHI site and the rhTPH1 gene. These additional nucleotides give the following
codons after Factor Xa; GGG ATC CCC encoding for Gly, Ile and Pro. The expression strain for
expression of the fusion protein GST-rhTPH1 is constructed as described in section 5.2, where the
gene is first constructed using PCR amplification, a specific set of primers (given in table A1.3,
appendix A1) and hTPH1 as template.
5.4 Construction of hTPH2 expression strains
5.4.1 Gene design In the Metalloprotein Chemistry and Engineering Group both chTPH2 and cthTPH2 have been
expressed and purified with high purity, but the full-length variant of hTPH2 has almost
Factor Xa

Construction of hTPH strains
40
exclusively been expressed in an insoluble form [6,57,104]. Considering this, the regulatory
domain must play a certain role in the proteins solubility and from structure prediction done by
Michael S. Windahl [6] it is seen that a region from amino acid 42-55 in the regulatory domain is
predicted disordered and may give problems with solubility, purification and characterization.
Due to this, an expression strain expressing a variant of hTPH2 lacking the first 58 amino acids
was constructed (hTPH259-490).
By alignment of the sequence of full-length hTPH1 and hTPH2, given in figure 5.5, it is seen that
hTPH2 also contains a 3,4-hydrophobic repeat in the regulatory domain from amino acid 67 to 84.
Due to this a construct lacking the 3,4-hydrophobic repeat was constructed. The construct was
chosen to begin at amino acid 90 due to higher content of adenine in the gene sequence resulting
in a higher content of adenine in translation initiation region (TIR) [117,118,119]. This A/U
enrichment presumably decreases the possibility of secondary structure formation in mRNA
facilitating the entry of the ribosome to enhance translation initiation and subsequent high-level
protein expression [117,119]. The construct was termed hTPH290-490.
The reason why these construct were made with hTPH2 and not hTPH1 was due to already
developed purification methods for both chTPH2 and cthTPH2 [6,57].
1 50
hTPH1 (1) -----------------------------------------MIEDNKENK
hTPH2 (1) MQPAMMMFSSKYWARRGFSLDSAVPEEHQLLGSSTLNKPNSGKNDDKGNK
51 100
hTPH1 (10) -----DHSLERGRASLIFSLKNEVGGLIKALKIFQEKHVNLLHIESRKSK
hTPH2 (51) GSSKREAATESGKTAVVFSLKNEVGGLVKALRLFQEKRVNMVHIESRKSR
101 150
hTPH1 (55) RRNSEFEIFVDCDINREQLNDIFHLLKSHTNVLSVNLPDNFTLKEDGMET
hTPH2 (101) RRSSEVEIFVDCECGKTEFNELIQLLKFQTTIVTLNPPENIWTEEEELED
151 200
hTPH1 (105) VPWFPKKISDLDHCANRVLMYGSELDADHPGFKDNVYRKRRKYFADLAMN
hTPH2 (151) VPWFPRKISELDKCSHRVLMYGSELDADHPGFKDNVYRQRRKYFVDVAMG
201 250
hTPH1 (155) YKHGDPIPKVEFTEEEIKTWGTVFQELNKLYPTHACREYLKNLPLLSKYC
hTPH2 (201) YKYGQPIPRVEYTEEETKTWGVVFRELSKLYPTHACREYLKNFPLLTKYC
251 300
hTPH1 (205) GYREDNIPQLEDVSNFLKERTGFSIRPVAGYLSPRDFLSGLAFRVFHCTQ
hTPH2 (251) GYREDNVPQLEDVSMFLKERSGFTVRPVAGYLSPRDFLAGLAYRVFHCTQ
301 350
hTPH1 (255) YVRHSSDPFYTPEPDTCHELLGHVPLLAEPSFAQFSQEIGLASLGASEEA
hTPH2 (301) YIRHGSDPLYTPEPDTCHELLGHVPLLADPKFAQFSQEIGLASLGASDED
351 400
hTPH1 (305) VQKLATCYFFTVEFGLCKQDGQLRVFGAGLLSSISELKHALSGHAKVKPF
hTPH2 (351) VQKLATCYFFTIEFGLCKQEGQLRAYGAGLLSSIGELKHALSDKACVKAF
401 450
hTPH1 (355) DPKITCKQECLITTFQDVYFVSESFEDAKEKMREFTKTIKRPFGVKYNPY
hTPH2 (401) DPKTTCLQECLITTFQEAYFVSESFEEAKEKMRDFAKSITRPFSVYFNPY
451 490
hTPH1 (405) TRSIQILKDTKSITSAMNELQHDLDVVSDALAKVSRKPSI
hTPH2 (451) TQSIEILKDTRSIENVVQDLRSDLNTVCDALNKMNQYLGI
Figure 5.5. Amino acid sequence for the two isoforms of tryptophan hydroxylase, hTPH1 and
hTPH2. The program Vector NTI Advance 10 from Invitrogen was used for alignment [34]. Green
background indicates conserved residues in all sequences. The amino acid residues highlighted
in red are the residues involved in the 3,4-hydrophobic repeat.
3,4-hydrophibic repeat
* * * * * *

Construction of hTPH strains
41
5.4.2 Constructions of hTPH2 expression strains The two variants: One without the first 58 amino acids (hTPH259-490) and one which lacks the 3,4-
hydrophobic repeat (TPH290-490) were constructed as described in section 5.2.1. Each gene was
produced by PCR amplification with the full-length hTPH2 gene as template and a set of primers
specific for each gene (given in table A1.3, appendix A1). Because the hTPH2 gene contains a
unique DraI site in the gene sequence, the gene fragments were constructed with an NdeI site in
the N-terminal and a DraI site in the C-terminal for ligation into the pET expression vector. After
amplification of each gene they were cloned into the PCR-script cloning vector, propagated and
the PCR-product sequenced by Eurofins MWG Operon, Germany. The produced hTPH2/NdeI/DraI
gene fragments were removed from the cloning vector and ligated into the pET26b expression
vector using the NdeI site in the vectors cloning region and the DraI site in the hTPH2 sequence. A
pET26-hTPH259-490 and pET26-hTPH290-490 expression vectors were constructed and transferred
into E. coli BL21(DE3) expression strains for expression of hTPH259-490 or hTPH290-490, respectively.
5.5 Experimental procedures This section describes the experimental procedures used for construction of the hTPH expression
strains, described in section 5.2, 5.3 and 5.4. Most of the procedures are described in general
with important issues highlighted for the specific hTPH gene variants. Protocols, alike or with
minor adjustment from the standard protocol of the supplier, are not given in full but only
referred to.
5.5.1 Materials and chemicals All work with bacteria was carried out in a sterile environment. Materials were handled under a
LAF bench and sterilization of growth media, antibiotics and water were done by autoclaving or
filter sterilization. All solutions were prepared with 18.2 MΩ cm water from a Milli-Q synthesis
A10 Q-Gard system (Millipore).
5.5.2 Production of genes The TPH gene variants were produced by amplification using PCR or by PCR-based site-directed
mutagenesis. In the following sections the experimental procedures for production of the gene
variants are described.
5.5.2.1 Primer design for amplification with PCR
For each gene a specific set of primers were designed. Each primer set was constructed according
to the strategies described in section 5.2 (hTPH1 gene variants), section 5.3 (rhTPH1-frGFP gene
and GST-rhTPH1 gene) and section 5.4 (hTPH2 gene variants) where the forward primer
contained a NdeI or a BamHI site and the reverse primer contained a stop codon followed by a
XhoI site or a BamHI site without the upstream stop codon (only the rhTPH1-GFP). The annealing
part of each primer was chosen according to equation 5.1 with an annealing temperature of
either 53oC or 55oC. The full-length hTPH1 gene or full-length hTPH2 gene, ordered from
Genscript Corporation with a sequence optimized for expression in E. coli, were used as
templates.

Construction of hTPH strains
42
Tannealing = [2oC (#Adenine + #Thymine) + 4oC (#Guanine + #Cytosine)] – 5oC (5.1)
In table A1.1 to A1.3 in appendix A1 the sequences of the primer sets are given. They were all
obtained from TAG Copenhagen A/S with four A’s in the 5’-end to avoid loss of effective primer
sequence during PCR because of exonuclease activity.
5.5.2.2 Primer design for PCR-based site-directed mutagenesis
The mutations in the 3,4-hydrophobic repeat of rhTPH1, described in section 5.3.1.3, were
produced by PCR based site-directed mutagenesis. A set of primer for each mutant was designed,
where each primer set consisted of two mutations surrounded by annealing sequences. In table
A1.2, appendix A1 the sequences of the primer sets are given. They were all ordered from TAG
Copenhagen A/S.
5.5.2.3 PCR amplification and PCR-based site-directed mutagenesis
The PCR reactions were carried out with the primer sets given in table 5.1. A Platinum Pfx DNA
polymerase kit from Invitrogen was used for both the PCR amplification and the PCR-based site-
directed mutagenesis.
For the PCR amplification reactions the following reagents were mixed in the given order. Water
to a final volume of 50 μl, 1x Pfx amplication buffer, 0.3 mM dNTP, 1 mM MgSO4 and 1 unit
Platinum ®Pfx plus 0.5 μl of template (miniprep DNA) and 0.3 μM of each primer. The PCR
amplifications were executed on a Perkin Elmer GeneAmp PCR system 2400 and programmed as
described in table 5.1. The extension time was determined according to 1 minute per 1 kbp. After
PCR amplification the PCR-product is separated from the template by preparative gel
electrophoresis as described in section 5.5.2.4 and 5.5.2.5 and cloned into the PCR-script vector
(section 5.5.2.7) before transformation into E. coli DH5α cells.
Table 5.1. PCR amplification parameters.
Variant Primer set Template Cycles Denaturation Annealing Extension
cthTPH1/NdeI/XhoI
~1100 bp
HCP596
HCP655
hTPH1 25 94oC for 15
sec
55oC for
30 sec
68oC for 1
min
rhTPH1/NdeI/XhoI
~300 bp
HCP641
HCP643
hTPH1 25 94oC for 15
sec
53oC for
30 sec
68oC for
30 sec
rchTPH1/NdeI/XhoI
~1200 bp
HCP641
HCP593
hTPH1 25 94oC for 15
sec
55oC for
30 sec
68oC for 1
min
rhTPH1/NdeI/BamHI
(frGFP fusion) ~300 bp
HCP641
HCP642
hTPH1 25 94oC for 15
sec
53oC for
30 sec
68oC for
30 sec
rhTPH1-BamHI/XhoI
(GST-fusion) ~300 bp
HCP702
HCP643
hTPH1 25 94oC for 15
sec
53oC for
30 sec
68oC for
30 sec
hTPH259-490/NdeI/XhoI
~1300 bp
HCP631
HCP632
hTPH2 25 94oC for 15
sec
55oC for
30 sec
68oC for 1
min
hTPH290-490/NdeI/XhoI
~1200 bp
HCP632
HCP697
hTPH2 25 94oC for 15
sec
55oC for
30 sec
68oC for 1
min

Construction of hTPH strains
43
For the PCR-based site-directed mutagenesis reactions the following reagents were mixed in the
given order. Water to a final volume of 50 μl, 1x Pfx amplication buffer, 1 μl of template, 0.3 μM
of each primer (see table 5.2), 0.2 mM dNTP mix, 1 mM MgSO4 and 1.0 μl Pfx polymerase. The
program settings were: Denaturation at 94oC for 30 sec, annealing at 55oC for 30 sec and
extension at 68oC for 7 min for a total of 25 cycles. The extension time was determined according
to the size of the plasmid template. After mutagenesis 1 μl of the DpnI restriction enzyme (U/μl)
were added to each reaction and they were incubated for 1 hour at 37oC to digest the parental
methylated dsDNA (the template). The products were directly transferred to E. coli DH5α cells as
described in section 5.5.2.8.
Table 5.2. Primer set for the site-directed
mutagenesis reactions of each of the three
rhTPH1 mutant genes.
Variant Primer set
L24R/V28R-rhTPH1-frGFP HCP683
HCP684
L31R/L35R-rhTPH1-rGFP HCP685
HCP686
V28R/L31R-rhTPH1-frGFP HCP687
HCP688
5.5.2.4 Preparation of agarose gels
Agarose gel electrophoresis is used to separate linear DNA fragments according to size. The gels
were prepared depending on the size of the fragments. An amount of agarose powder
determined from table 5.3 was weighed in a 100 ml PYREX conical flask and mixed with 25 ml TBE
buffer (10.8 g Tris, 5.5 g boric acid and 0.93 g EDTA in 1L of water). The mixture was heated in a
microwave oven until the gel was completely melted and dissolved. The gel solution was cooled
to 50-60oC and 0.2 μl 10 mg/ml ethidium bromide (EtBr) was added using an aerosol-resistant
pipet tip. Afterwards the gel solution was poured to a casting tray, where an appropriate comb
was chosen depending on which kind of electrophoresis that was being used (analytical - 10 wells
12 μl, or preparative - 2 wells of 24 μl and 120 μl, respectively). The gel was solidified and moved
to a running vessel containing electrophoresis buffer (TBE buffer with 12.5 μl EtBr pr. liter).
Table 5.3. Amount of agarose powder used in preparation of gels.
Size of DNA fragment Recommended % for gel Per gel (per 25ml TBE)
> 4000bp 0.8 % 0.20 g
800-4000bp 1.0 % 0.25 g
400-800bp 1.2 % 0.30 g
< 400bp 1.5 % 0.37 g

Construction of hTPH strains
44
5.5.2.5 Separation of DNA by preparative gel electrophoresis
The PCR product from section 5.5.2.3 was separated from the template using preparative gel
electrophoresis. The gel was prepared as described in section 5.5.2.4. 1/5 volume of loading dye
(0.25 % bromphenol blue, 30 % glycerol and 50 mM EDTA) was added to the PCR sample. For
preparation of the marker 1 μl 1 kbp DNA standard, 4 μl loading dye and 19 μl of sterilized MQ
water were used. Marker and sample were loaded in the wells and the gels subjected to
electrophoresis at 100 V constant voltages for approximately 30 min. The DNA was visualized
using UV light and the band removed with a scalpel. The mass of the gel slice was determined.
5.5.2.6 Purification of DNA from agarose gels
After separation of the DNA fragments and isolation of the desired gel slice (section 5.5.2.5), the
DNA fragments were extracted and purified from the agarose gel. This was performed with Gel
AdvancedTM Gel Extraction Miniprep System from Viogene [120] and the standard protocol from
the kit was followed with the exception that the sample was eluted using 30 μl of MQ water.
5.5.2.7 Cloning of PCR-products into the PCR-Script cloning vector
The gel purified PCR-products (section 5.5.2.6) was inserted into the PCR-Script cloning vector
with the PCR ScriptTM Amp Cloning kit from Stratagene [121].
5.5.2.8 Transformation of cloning vector into E. coli DH5α cells
After ligation of the PCR product into the PCR-script cloning vector (section 5.5.2.7) or after
digestion with DpnI (section 5.5.2.3) the vector products were transferred into plasmid
propagating cells. Max efficiency competent E. coli DH5α cells from Invitrogen were thawed on
ice and 100 μl was transferred to a cooled 15 ml polypropylene tube. 1 μl plasmid solution was
mixed with the cells and the solution was kept on ice for 30 min. The tube was transferred to a
water-bath at 42oC for precisely 45 sec followed by 2 min on ice. 450 μl LB media without
antibiotic was added.
5.5.2.9 Propagation of cells and glycerol stocks
Cells from the transformation (section 5.5.2.8) were streaked on two LB agar plates containing
100 μg/ml ampicillin (100amp): One with 55 μl (1/10) and one with 440 μl (8/10) of the culture.
The plates were incubated overnight at 37oC. From the plates a single colony was transferred to a
15 ml polypropylene tube containing 3 ml LB/100amp media. The cultures were incubated
overnight at 37oC and 250 rpm.
From each 3 ml culture a glycerol stock was made. 500 μl of the culture was mixed with 116 μl 80
% glycerol in an Eppendorf tube and stored at -80oC.
5.5.2.10 Plasmid purification
The plasmid from the remaining 2.5 ml of overnight culture was isolated with a GenEluteTM
Plasmid MiniPrep kit from Sigma-Aldrich [122]. Water was used for elution.

Construction of hTPH strains
45
5.5.2.11 Restriction enzyme analysis and gel electrophoresis
The gene products were analyzed, and estimation of size was done using analytical restriction
enzyme analysis and gel electrophoresis. The purified plasmids (section 5.5.2.10) were digested
with a set of restriction enzymes depending on the variant being analyzed. In table 5.4 the
enzymes used for each variant are given. In an Eppendorf tube 8.4 μl of purified plasmid, 1.0 μl
of NEBuffer, chosen for optimal digestion condition [123], and 0.3 μl of each enzyme was added,
mixed and incubated for 2 hours at 37oC. The digested DNA was analyzed by analytical gel
electrophoresis. The gels were prepared as described in section 5.5.1.4. 2 μl of loading dye was
mixed with the 10 μl sample from the digestion. The electrophoresis was performed as described
in section 5.5.1.5.
Table 5.4. hTPH variant, enzymes and NEBuffer used for restriction
enzyme analysis.
hTPH gene variant Enzymes NEBuffer
cthTPH1/NdeI / XhoI NdeI / XhoI 4
rhTPH1/NdeI/XhoI NdeI / XhoI 4
rchTPH1/NdeI/XhoI NdeI / XhoI 4
rhTPH1/NdeI/BamHI (frGFP fusion) NdeI / BamHI BamHI
L24R/V28R-rhTPH1-frGFP NdeI / BamHI BamHI
L31R/L35R-rhTPH1-frGFP NdeI / BamHI BamHI
V28R/L31R-rhTPH1-frGFP NdeI / BamHI BamHI
rhTPH1/BamHI/XhoI (GST fusion) BamHI / XhoI BamHI
hTPH259-490/NdeI/DraI NdeI / DraI 4
hTPH290-490/NdeI/DraI NdeI / DraI 4
5.5.2.12 Sequencing
The plasmid containing the desired DNA fragments was sequenced. The concentration of purified
plasmid was determined by spectrophotometry at 260 nm and the required sample volume for
sequence analysis was calculated from the simplified equation 5.2.
(5.2)
The estimated volume was diluted to 50 µl with MQ water, mixed with a mixture of 165 µl 96 %
ethanol and 5 µl 3 M Na-acetate pH 4.6 and left at room temperature for 15 min. The plasmids
were then pelleted by centrifugation for 20 min at 13,000 rpm and the supernatant discarded.
The plasmid sediment was washed with 250 µl freshly made 70 % ethanol and the solution was
centrifugated for 5 min at 13,000 rpm. This was done three times. The plasmid was then left to
dry for more than 30 min at room temperature.
Due to the large size of some of the genes (more than 900 bp), these were sequenced from both
ends. The primers used for sequencing were T7 and T3. The primers were designed and
synthesized by the MWG-Biotech AG Sequencing service, which also performed the sequencing.
Construction of hTPH strains
46
5.5.3 Construction of expression vectors After production of the gene of interest (section 5.5.2) an expression vector containing this gene
was constructed. This was done by ligation of the gene into the expression vector. The
experimental procedures involved are described in the following sections.
5.5.3.1 Restriction enzyme digestion
In order to ligate the expression vector with the gene insert from the PCR-script vector (section
5.5.2), both vectors were digested with the same restriction enzymes, given in table 5.4. Before
digestion E. coli DH5α strains containing the cloning vector with the gene of interest were
streaked on LB/100amp agar plates. The expression vector, see table 5.5, was either streaked on
LB/30kan agar plates or LB/100amp agar plates. The plates were incubated overnight at 37oC.
One colony from each plate was inoculated in 3 ml LB media with appropriate antibiotic in a 15
ml polypropylene tube. The 3 ml cultures were then incubated overnight at 37oC and 250 rpm
and the plasmids were purified as described in section 5.5.2.11.
After plasmid purification 84 μl purified plasmid sample, 10 μl appropriate NEBuffer and 3 μl of
each enzyme were incubated for 4 hours at 37oC. In table 5.4 the restriction enzyme and
NEBuffer are given for each variant. The digested expression vectors (pET vector, pwaldo-dGFP
and pGEX-5X-1) were incubated for another hour after addition of 1 μl Calf intestinal
phosphatase (CIP) to prevent inter- or self ligation.
5.5.3.2 Separation af DNA fragments
The digested DNA fragments were separated using preparative gel electrophoresis as described
in section 5.5.2.4 and 5.5.2.5. The correct bands on the gel indicating insert or vector were cut
out and the DNA fragments were purified as described in section 5.5.2.6.
5.5.3.3 Ligation and transformation into E. coli DH5α cells
Ligation of the vector and insert was done using a Ligate-ITTM Rapid kit from USB Corporation
[124] and carried out according to their standard protocol. After ligation the products were
transferred into E. coli DH5α cells as described in section 5.5.2.8 and if the expression vectors
contained a kanamycin resistance gene these cultures were incubated for 1 hour at 37oC and 250
rpm after addition of LB media without antibiotic. After transformation the cells were plated and
propagated as described in section 5.5.2.9. From each 3 ml culture, glycerol stocks were prepared
as described in section 5.5.2.9.
5.5.3.4 Analysis of ligation product
The plasmid from the remaining 2.5 ml of each overnight culture was isolated as described in
section 5.5.2.10 and the ligation product was analyzed by restriction enzyme analysis and gel
electrophoresis as described in section 5.5.2.11. The plasmid containing the wanted DNA
fragment was sequenced as described in section 5.5.2.12.

Construction of hTPH strains
47
Table 5.5. Expression vector and antibiotic for each hTPH variant.
Expression vector Antibiotic
cthTPH1/NdeI / XhoI pET26 30kan
rhTPH1/NdeI/XhoI pET26 30kan
rchTPH1/NdeI/XhoI pET26 30kan
rhTPH1/NdeI/BamHI (frGFP fusion) pWaldo-GFPd 30kan
L24R/V28R-rhTPH1-frGFP pWaldo-GFPd 30kan
L31R/L35R-rhTPH1-frGFP pWaldo-GFPd 30kan
V28R/L31R-rhTPH1-frGFP pWaldo-GFPd 30kan
rhTPH1/BamHI/XhoI (GST fusion) pGEX-5X-1 100amp
hTPH259-490/NdeI/DraI pET26 30kan
hTPH290-490/NdeI/DraI pET26 30kan
5.5.4 Construction of expression strains Constructions of expression strains were carried out by transformation of the constructed
expression vectors (section 5.5.3) into E. coli BL21(DE3) expression cells. 100 μl of CaCl2
competent cells were thawed on ice and transferred to a 15 ml polypropylene tube. 1 μl of
purified plasmid (section 5.5.3.1) was mixed with the cells and the solution was kept on ice for 20
min. The tube was transferred to a water-bath at 37oC for precisely 45 sec followed by 2 min on
ice. 450 μl LB media without antibiotic was added and the culture was incubated for one hour at
37oC and 250 rpm. The cells were propagated as described in section 5.5.2.9 with 30kan or
100amp as selective marker, and glycerol stocks were prepared as described in section 5.5.2.9.
5.6 Summary of results The strategies and theoretical background for development of hTPH variants are given in section
5.2 to 5.4. In the following sections a summary of the results from construction of the expression
strains for expression of hTPH variants are presented.
5.6.1 Production of hTPH gene variants All hTPH gene variants were produced by either PCR amplification or PCR-based site-directed
mutagenesis as described in section 5.5.2.3 using the primer sets given in table A1.1, A1.2 and
A1.3 in appendix A1 and the full-length hTPH1 gene, full-length hTPH2 gene or the rhTPH1-PCR-
script vector as template, depending on the variant. This gives rise to products with either a NdeI
or a BamHI restriction site in the N-terminal and a stop codon followed by a XhoI site or a BamHI
site in the C-terminal, as given in table 5.6. The experimental steps in the production of the gene
variants is shown in figure 5.1 and described in section 5.5.2. In table 5.6 the stock number for
each produced gene is given as well as the type of PCR, template used in the PCR reaction and
the restriction enzyme sites in the N-terminal and C-terminal.

Construction of hTPH strains
48
Table 5.6. Gene with type of PCR, template used in the PCR reaction, the restriction enzyme sites in the
N-terminal and C-terminal, the size of the gene and glycerol stock numbers.
Gene Type of PCR Template N-terminal C-terminal Size
(bp)
Stock
number
cthTPH1/NdeI / XhoI PCR
amplification
TPH1 NdeI Stop codon
+ XhoI
300 HC1717
rhTPH1/NdeI/XhoI PCR
amplification
TPH1 NdeI Stop codon
+ XhoI
1200 HC1966
rchTPH1/NdeI/XhoI PCR
amplification
TPH1 NdeI Stop codon
+ XhoI
HC1938
rhTPH1/NdeI/BamHI
(frGFP fusion)
PCR
amplification
TPH1 NdeI BamHI 300 HC1710
L24R/V28R-rhTPH1-GFP PCR-based
site-directed
mutagenesis
rTPH1-
PCR script
vector
NdeI BamHI 300 HC2288
L31R/L35R-rhTPH1-GFP PCR-based
site-directed
mutagenesis
rTPH1-
PCR script
vector
NdeI BamHI 300 HC2330
V28R/L31R-rhTPH1-GFP PCR-based
site-directed
mutagenesis
rTPH1-
PCR script
vector
NdeI BamHI 300 HC2298
rhTPH1/BamHI/XhoI
(GST fusion)
PCR
amplification
TPH1 BamHI Stop codon
+ XhoI
300 HC2467
hTPH259-490/NdeI/DraI PCR
amplification
TPH2 NdeI DraI 1300 HC1588
hTPH290-490/NdeI/DraI PCR
amplification
TPH2 NdeI DraI 1200 HC2446
5.6.2 Construction of expression vectors The expression vectors for production of the hTPH variants were constructed by insertion of the
genes from section 5.6.1 into the pET26+, the pWaldo-dGFP or the pGEX-5X-1 expression vector.
This was done as given in figure 5.1 and described in section 5.5.3.
In table 5.7 the stock number of each constructed expression vector containing the gene of
interest is given as well as the antibiotic marker and restriction enzymes.

Construction of hTPH strains
49
Table 5.7. Glycerol stock numbers with description of vector, gene fragment and antibiotic marker.
Gene Expression
vector
Restriction
enzymes
Stock
number
Antibiotic
marker
cthTPH1/NdeI / XhoI pET26 NdeI / XhoI HC1803 30kan
rhTPH1/NdeI/XhoI pET26 NdeI / XhoI HC1983 30kan
rchTPH1/NdeI/XhoI pET26 NdeI / XhoI HC1949 30kan
rhTPH1/NdeI/BamHI (GFP fusion) pWaldo-dGFP NdeI / BamHI HC1747 30kan
L24R/V28R-rhTPH1-GFP pWaldo-dGFP NdeI / BamHI HC2241 30kan
L31R/L35R-rhTPH1-GFP pWaldo-dGFP NdeI / BamHI HC2353 30kan
V28R/L31R-rhTPH1-GFP pWaldo-dGFP NdeI / BamHI HC2338 30kan
rhTPH1/BamHI/XhoI (GST fusion) pGEX-5X-1 BamHI / XhoI HC2472 100amp
hTPH259-490/NdeI/DraI pET26 NdeI / DraI HC1640 30kan
hTPH290-490/NdeI/DraI pET26 NdeI / DraI HC2454 30kan
5.6.3 Construction of expression strains By transformation of the produced expression vectors from section 5.6.2 into E. coli BL21(DE3)
cells, as described in section 5.5.4, expression strains for expression of rhTPH1, rchTPH1,
cthTPH1, rhTPH1-GFP, L24R/V28R-rhTPH1-GFP, L31R/L35R-rhTPH1-GFP, V28R/L31R-rhTPH1-GFP,
GST-rhTPH1, hTPH259-490 and hTPH290-490, respectively were achieved. After propagation of the
BL21(DE3) cells glycerol stocks were produced. These are numbered according to table 5.8.
Table 5.8. Glycerol stock numbers with description of vector, gene fragment and antibiotic marker.
Gene product Expression vector Stock number Antibiotic marker
cthTPH1/NdeI / XhoI pET26 HC1869 30kan
rhTPH1/NdeI/XhoI pET26 HC1986 30kan
rchTPH1/NdeI/XhoI pET26 HC1964 30kan
rhTPH1/NdeI/BamHI (frGFP fusion) pWaldo-dGFP HC1785 30kan
L24R/V28R-rhTPH1-frGFP pWaldo-dGFP HC2346 30kan
L31R/L35R-rhTPH1-frGFP pWaldo-dGFP HC2373 30kan
V28R/L31R-rhTPH1-frGFP pWaldo-dGFP HC2344 30kan
rhTPH1/BamHI/XhoI (GST fusion) pGEX-5X-1 HC2477 100amp
hTPH259-490/NdeI/DraI pET26 HC1659 30kan
hTPH290-490/NdeI/DraI pET26 HC2462 30kan
5.7 Summary and conclusion Construction of the hTPH expression strains for expression of the 10 hTPH variants was
successfully accomplished. These strains are tested for expression and solubility as described in
chapter 6.
Table 5.9 summarizes all constructed cloning and expression strains with the latter highlighted in
red.

Construction of hTPH strains
50
Table 5.9. Summary of all constructed cloning and expression strains with the latter highlighted
in red.
Gene Cloning and expression
vectors
Glycerol
stock
number
E. coli host cells Antibiotic
marker
rhTPH1 PCR-script-rhTPH1 HC1717 DH5α 100amp
pET26-rhTPH1 HC1803 DH5α 100amp
pET26-rhTPH1 HC1869 BL21(DE3) 30kan
rchTPH1 PCR-script-rchTPH1 HC1966 DH5α 100amp
pET26-rchTPH1 HC1983 DH5α 100amp
pET26-rcTPH1 HC1986 BL21(DE3) 30kan
cthTPH1 PCR-script-ctTPH1 HC1938 DH5α 100amp
pET-ctTPH1 HC1949 DH5α 100amp
pET26-ctTPH1 HC1964 BL21(DE3) 30kan
rhTPH1-frGFP PCR-script-rTPH1 HC1710 DH5α 100amp
pWaldo-rTPH1-GFP HC1747 DH5α 100amp
pWaldo-rTPH1-GFP HC1785 BL21(DE3) 30kan
L24R/V28R-
rhTPH1-GFP
PCR-script-m1-rTPH1 HC2288 DH5α 100amp
pWaldo-m1-rTPH1-GFP HC2241 DH5α 100amp
pWaldo-m1-rTPH1-GFP HC2346 BL21(DE3) 30kan
L31R/L35R-
rhTPH1-GFP
PCR-script-m2-rTPH1 HC2330 DH5α 100amp
pWaldo-m2-rTPH1-GFP HC2353 DH5α 100amp
pWaldo-m2-rTPH1-GFP HC2373 BL21(DE3) 30kan
V28R/L31R-
rhTPH1-GFP
PCR-script-m3-rTPH1 HC2298 DH5α 100amp
pWaldo-m3-rTPH1-GFP HC2338 DH5α 100amp
pWaldo-m3-rTPH1-GFP HC2344 BL21(DE3) 30kan
GST-rhTPH1 PCR-script-rTPH1 HC2467 DH5α 100amp
pGEX-5X-1-GST-rTPH1 HC2472 DH5α 100amp
pGEX-5X-1-GST-rTPH1 HC2477 BL21(DE3) 100amp
hTPH259-490 PCR-script-TPH259-490 HC1588 DH5α 100amp
pET26-TPH259-490 HC1640 DH5α 100amp
pET26-TPH259-490 HC1659 BL21(DE3) 30kan
hTPH290-490 PCR-script-TPH290-490 HC2446 DH5α 100amp
pET26-TPH290-490 HC2454 DH5α 100amp
pET26-TPH290-490 HC2462 BL21(DE3) 30kan

51
6 Expression and solubility test
Expression and solubility test are conducted in order to analyze the expression level as a function
of time as well as the solubility of each hTPH variant constructed in chapter 5. This chapter
describes the experimental procedures for expression and solubility test of the hTPH expression
strains, followed by a result and discussion section.
6.1 Experimental procedures Most of the procedures are described in general with important points highlighted for the
specific hTPH gene variants. Protocols, alike or with only minor adjustment from the standard
protocols obtained from the supplier, are not given in full but only referred to.
6.1.1 Materials and chemicals All work with bacteria was carried out in a sterile environment. Materials were handled under a
LAF bench and sterilization of growth media, antibiotics and water were done by autoclaving or
filter sterilization. All solutions were prepared with 18.2 MΩ cm water from a Milli-Q synthesis
A10 Q-Gard system (Millipore).
6.1.2 Expression and solubility test
6.1.2.1 Test expression and solubility test
The constructed expression strains were tested for expression of the recombinant protein at both
30oC and 20oC. The cells were streaked on agar plates with appropriate antibiotic and incubated
overnight at 37oC. A single colony was transferred to a 250 ml flask with 50 ml LB media with
appropriate antibiotic (given in table 6.1) and incubated with shaking at 250 rpm and 30oC. After
approximately 3½ hour the temperature, for the cultures to be induced at 20oC, was set to 20oC.

Purification of rhTPH1 variants
52
When the OD600 was between 0.4 and 0.6, 25 μl 200 mM IPTG was added to a final concentration
of 0.1 mM. To estimate the expression level as a function of time samples were collected prior to
induction (50 μl samples) and during induction (25 μl samples). The samples were centrifuged at
13,000 rpm for 1 min, the supernatant removed and the pellet was kept at -20oC until further
analysis (described in section 6.1.2.3). After overnight induction the cells were harvested by
centrifugation at +4oC and 3000 x g for 15 min. The cells were resuspended in appropriate ice
cold buffer, transferred to 50 ml polypropylene tubes and centrifuged at +4oC and 3000 x g for 15
min. The supernatant was discarded. The cells were resuspended in 40 ml buffer and sonicated 3
x 30 sec on ice using a labsonic ultrasonic homogenizer (Satorius AG). The cell extract was
centrifuged for 20 min at 18,000 x g and +4oC. The supernatant and pellet were separated and
the pellet was resuspended in 40 ml buffer. 20 μl samples were taken from the cell extract,
supernatant and resuspended pellet and kept at -20oC for SDS-Page analysis.
6.1.2.2 Solubility test on large scale expression
After test expression and solubility test on small scale cultures and determination of induction
time and temperature (section 6.1.2.1) the solubility was tested on large scale cultures (650 ml).
The same volume of buffer (40 ml) was used in the sonication process for both small scale and
large scale cultures. Therefore, large scale solubility test was performed to see if there was any
change in solubility when the ratio between the amount of cells and buffer volume was
increased.
From a frozen glycerol stock containing E. coli BL21(DE3) cells expressing the hTPH variants were
streaked into single colonies on agar plates with appropriate antibiotic and incubated overnight
at 37oC. A single colony was transferred to a 250 ml flask with 50 ml LB media with appropriate
antibiotic and incubated at 37oC and 250 rpm for approximately 4 hours until an OD600 of 0.6-1.0
was reached. The cells were transferred to a 50 ml polypropylene tube and sedimented by
centrifugation at +4oC and 3000 x g for 10 min. The cells were resuspended in 50 ml fresh LB
media with appropriate antibiotic and 6.5 ml of the resuspended cells were used to inoculate 650
ml LB media with appropriate antibiotic in a 2 L shake flask. The cultures were incubated at 30oC
and 250 rpm. After approximately 3½ hour the temperature was lowered to 20oC for the cultures
to be induced at 20oC. In table 6.1 the induction temperature and induction time for each strain
are given. When OD600 was between 0.4-0.6 the expression was induced by adding IPTG to a final
concentration of 0.1 mM. After induction the cells were harvested by centrifugation at +4oC and
3000 x g for 15 min. The cells were resuspended in ice cold appropriate buffer, transferred to 50
ml polypropylene tubes and centrifuged again at 4oC and 3000 x g for 15 min. The supernatant
was discarded and the cells stored at -80oC until further use.
Cells from a 650 ml culture was thawed on ice and resuspended in 40 ml buffer. The cells were
sonicated 3 x 30 sec on ice. The cell extract was centrifuged for 20 min at 18,000 x g and 4oC. The
supernatant and pellet were separated and the pellet was resuspended in 40 ml buffer. 20 μl
samples were taken from the cell extract, supernatant and resuspended pellet and kept at -20 oC
for SDS-Page analysis.

Purification of rhTPH1 variants
53
Table 6.1. Stock number, induction temperature and induction time for each hTPH variant.
Variant Stock
number
Antibiotic
marker
Induction
temperature
Induction
time
hTPH1 HC1083 30kan 20oC 18 hours
rchTPH1 HC1986 30kan 20oC 18 hours
rhTPH1 HC1869 30kan 20oC 18 hours
chTPH1 HC1962 30kan 30oC 4 hours
cthTPH1 HC1964 30kan 30oC 4 hours
rhTPH1-frGFP HC1785 30kan 20oC 18 hours
L24R/V28R-rhTPH1-frGFP HC2346 30kan 20oC 18 hours
L31R/L35R-rhTPH1-frGFP HC2373 30kan 20oC 18 hours
V28R/L31R-rhTPH1-frGFP HC2344 30kan 20oC 18 hours
GST-rhTPH1 HC2477 100amp 20oC 18 hours
hTPH259-490 HC1659 30kan 20oC 18 hours
hTPH290-490 HC2462 30kan 20oC 18 hours
6.1.2.3 SDS-Page analysis
The collected samples from section 6.1.2.1 and section 6.1.2.2 were analyzed by SDS-Page. Tris-
HCl gels from Bio-Rad were used and 7.5 %, 12 % or 18 % were chosen for optimal separation
region corresponding to the size of the protein of interest. The analysis was done as described in
section 4.2.7.
6.2 Results and discussion Each of the 10 expression strains described in chapter 5 was tested for expression of target
protein and the expression level was analyzed as a function of time. The solubility of each variant
was also tested. This was done as described in section 6.2.1. The results obtained are described in
the following sections.
6.2.1 hTPH1 variants The three expression strains, HC1869, HC1986 and HC1964 constructed as described in chapter 5
were tested for expression of rhTPH1, rchTPh1 and cthTPH1, respectively and the solubility from
small scale cultures examined in 20 mM Tris/H2SO4 pH 8.5. A pH value of 8.5 was chosen due to
the theoretical pI value of the three variants of 7.15, 6.64 and 6.78, respectively, and because
full-length has shown to be more soluble at high pH and because chTPH1 is purified at this pH
[14]. The expression and solubility test was done as described in section 6.1.2.1.
6.2.1.1 rhTPH1
The SDS-Page analysis of the expression level of rhTPH1 (11 kDa) is shown as a function of time at
20oC and 30oC in figure 6.1 as well as the result from solubility test from small scale cultures (50
ml). From the increased intensity of the marked band corresponding to the size of rhTPH1 (11
kDa) in figure 6.1 it is seen that rhTPH1 can be expressed with almost the same expression level
at 30oC and at 20oC. Furthermore, the intensity of the bands has reached a stabile level after 19
hours for expression at 20oC and after 4 hours for expression at 30oC. By comparing the solubility
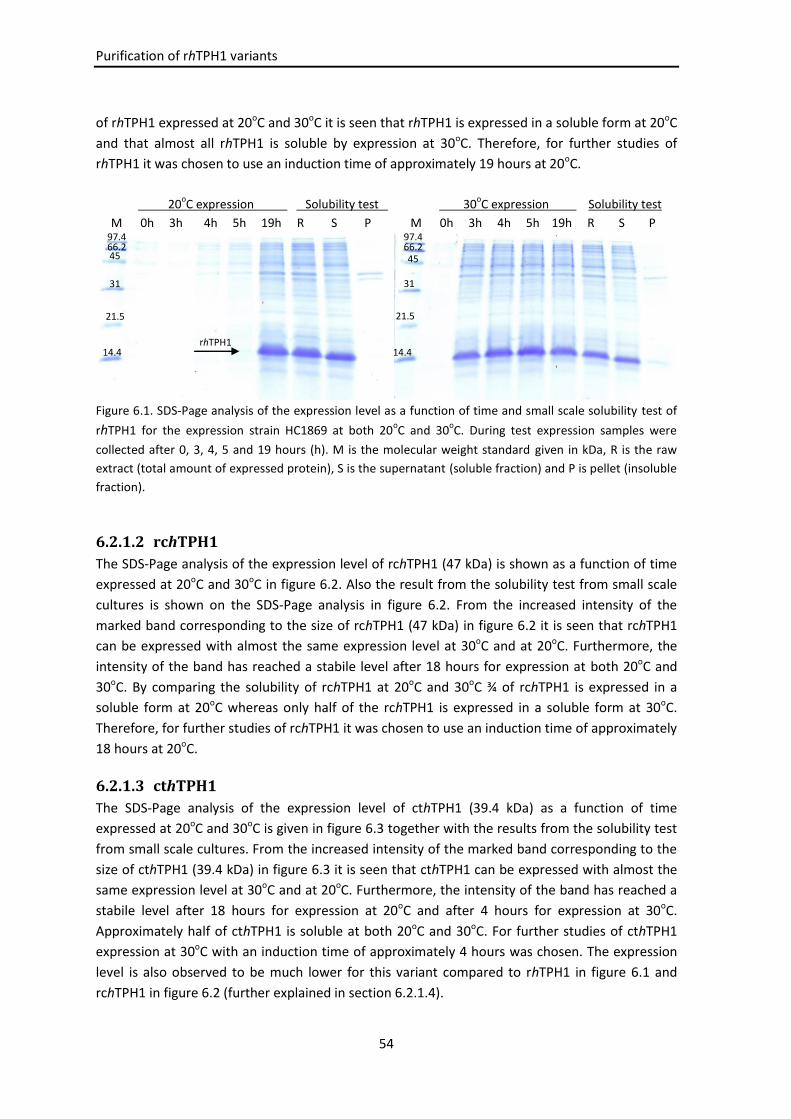
Purification of rhTPH1 variants
54
of rhTPH1 expressed at 20oC and 30oC it is seen that rhTPH1 is expressed in a soluble form at 20oC
and that almost all rhTPH1 is soluble by expression at 30oC. Therefore, for further studies of
rhTPH1 it was chosen to use an induction time of approximately 19 hours at 20oC.
20oC expression Solubility test 30
oC expression Solubility test
M 0h 3h 4h 5h 19h R S P M 0h 3h 4h 5h 19h R S P
Figure 6.1. SDS-Page analysis of the expression level as a function of time and small scale solubility test of
rhTPH1 for the expression strain HC1869 at both 20oC and 30
oC. During test expression samples were
collected after 0, 3, 4, 5 and 19 hours (h). M is the molecular weight standard given in kDa, R is the raw
extract (total amount of expressed protein), S is the supernatant (soluble fraction) and P is pellet (insoluble
fraction).
6.2.1.2 rchTPH1
The SDS-Page analysis of the expression level of rchTPH1 (47 kDa) is shown as a function of time
expressed at 20oC and 30oC in figure 6.2. Also the result from the solubility test from small scale
cultures is shown on the SDS-Page analysis in figure 6.2. From the increased intensity of the
marked band corresponding to the size of rchTPH1 (47 kDa) in figure 6.2 it is seen that rchTPH1
can be expressed with almost the same expression level at 30oC and at 20oC. Furthermore, the
intensity of the band has reached a stabile level after 18 hours for expression at both 20oC and
30oC. By comparing the solubility of rchTPH1 at 20oC and 30oC ¾ of rchTPH1 is expressed in a
soluble form at 20oC whereas only half of the rchTPH1 is expressed in a soluble form at 30oC.
Therefore, for further studies of rchTPH1 it was chosen to use an induction time of approximately
18 hours at 20oC.
6.2.1.3 cthTPH1
The SDS-Page analysis of the expression level of cthTPH1 (39.4 kDa) as a function of time
expressed at 20oC and 30oC is given in figure 6.3 together with the results from the solubility test
from small scale cultures. From the increased intensity of the marked band corresponding to the
size of cthTPH1 (39.4 kDa) in figure 6.3 it is seen that cthTPH1 can be expressed with almost the
same expression level at 30oC and at 20oC. Furthermore, the intensity of the band has reached a
stabile level after 18 hours for expression at 20oC and after 4 hours for expression at 30oC.
Approximately half of cthTPH1 is soluble at both 20oC and 30oC. For further studies of cthTPH1
expression at 30oC with an induction time of approximately 4 hours was chosen. The expression
level is also observed to be much lower for this variant compared to rhTPH1 in figure 6.1 and
rchTPH1 in figure 6.2 (further explained in section 6.2.1.4).
97.4 66.2 45
31
21.5
14.4 rhTPH1
14.4
21.5
31
45 66.2 97.4

Purification of rhTPH1 variants
55
20oC expression Solubility test 30
oC expression Solubility test
M 0h 3h 4h 5h 18h R S P M 0h 3h 4h 5h 18h R S P
Figure 6.2. SDS-Page analysis of the expression level as a function of time and small scale solubility test of
rchTPH1 for the expression strain HC1986 at both 20oC and 30
oC. During test expression of the strain
samples were collected after 0, 3, 4, 5 and 18 hours (h). M is the molecular weight standard given in kDa, R
is the raw extract (total amount of expressed protein), S is the supernatant (soluble fraction) and P is pellet
(insoluble fraction).
20oC expression Solubility test 30
oC expression Solubility test
M 0h 3h 4h 5h 18h R S P M 0h 3h 4h 5h 18h R S P
Figure 6.3. SDS-Page analysis of the expression level as a function of time and small scale solubility of
cthTPH1 for the expression strain HC1964 at both 20oC and 30
oC. During test expression of the strain
samples were collected after 0, 3, 4, 5 and 18 hours (h). M is the molecular weight standard given in kDa, R
is the raw extract (total amount of expressed protein), S is the supernatant (soluble fraction) and P is pellet
(insoluble fraction).
6.2.1.4 Summary and overall discussion
All three variants can be expressed in a soluble form. Solubility test on large scale cultures did not
show any change in solubility (data not shown). Comparing the three variants constructed in this
project a higher expression level is seen for the three variants containing the regulatory domain.
By comparing the total amount of expressed protein (R) it is seen that the two variants containing
the regulatory domain all expresses more protein than cthTPH1 (as mentioned in section 6.2.1.3).
This pattern is also observed between full-length hTPH1 and chTPH1 [14]. All five genes are
cloned in a pET26 expression vector as NdeI/XhoI fragments and expressed using E. coli
BL21(DE3) expression strains. The difference in expression level could be due to differences in the
AT content in the TIR of the variants [117,118,119]. Comparing the first 12 nucleotides in the
regulatory domain with the first 12 in the catalytic domain it is seen that the regulatory domain
has 8 A and T’s whereas the catalytic domain only has 6, see table 6.2. This could mean that an
66.2
97.4
45
97.4
66.2
45
cthTPH1
31 31
45 45
rchTPH1
66.2 66.2
97.4 97.4
21.5 21.5
14.4 14.4

Purification of rhTPH1 variants
56
increased amount of A and T in the first 12 nucleotides of both chTPH1 and cthTPH1 can increase
the expression level of chTPH1 and cthTPH1. It was tried to increase the AT content in chTPH1 by
changing the first nine nucleotides to the same nucleotides that exist in the N-terminal of hTPH1.
This project was a part of our laboratory technician Kathrine’s project *125]. I planned the
strategy and helped her with the construction of the three strains. It indeed showed an increase
in the expression level (data not shown) [125].
Table 6.2. The first 12 nucleotides from the TIR, the amount of expressed protein and
the A/T content for each of the five hTPH1 variants
Variant First 12 bases Amount of expressed protein AT content
rhTPH1
rchTPH1
hTPH1
ATT GAA GAC AAC
++++
8
chTPH1
cthTPH1
GAT GGC ATG GAA
+
6
The amount of soluble protein increases from rchTPH1 to rhTPH1. This pattern could be due to
the interaction with other molecules, which increases the size of the protein and thereby
decreasing the solubility, also given in table 6.3. In order to understand the behavior of the
regulatory domain and because the rhTPH1 showed to be more soluble it was chosen to continue
with this variant for further purifications attempt (see chapter 7).
Table 6.3. List of the three variants of hTPH1 with the
amount of expressed and soluble protein.
Variant Expressed protein Solubility
rchTPH1 ++++ ++
rhTPH1 ++++ ++++
cthTPH1 + ++
6.2.2 rhTPH1-frGFP variants
6.2.2.1 rhTPH1-frGFP
In order to understand the behavior of rhTPH1 during purification (see chapter 7) it was chosen
to construct a fusion protein of rhTPH1 fused to frGFP as explained in chapter 5. This was done
because it was difficult to follow rhTPH1 during purification. The rhTPH1-frGFP expression strain
(HC1785) was tested for expression as a function of time and the solubility was tested on small
scale cultures as described in section 6.1.2.1. The result is shown on the SDS-Page analysis in
figure 6.4. From the increased intensity of the marked band (rhTPH1-frGFP – 41 kDa) it is seen
that rhTPH1-frGFP can be expressed at a higher level at 30oC than at 20oC. Furthermore, the
intensity of the band has reached a stabile level after 19 hours for expression at 20oC and after 4
hours for expression at 30oC. Comparing the solubility of rhTPH1-frGFP at 20oC and 30oC it is seen
that approximately 75 % of rhTPH1-frGFP is soluble when expressed at 20oC and that almost all
rTPH1-frGFP is insoluble when expressed at 30oC. The high amount of insoluble rhTPH1fr-GFP at

Purification of rhTPH1 variants
57
30oC is mainly due to frGFP and not rhTPH1, as seen in figure 6.5 and 6.1, where the expression
level as a function of time and the solubility of frGFP and rhTPH1 is shown. Therefore, for further
studies of rhTPH1-GFP expression at 20oC is used with an induction time of approximately 19
hours.
20oC expression Solubility test 30
oC expression Solubility test
M 0h 1h 4h 5h 20h R S P M 0h 1h 4h 5h 20h R S P
Figure 6.4. SDS-Page analysis of the expression level as a function of time and small scale solubility test of
rhTPH1-frGFP for the expression strains HC1785 at both 20oC and 30
oC. During test expression of the strain
samples were collected after 0, 3, 4, 5 and 20 hours (h). M is the molecular weight standard given in kDa, R
is the raw extract (total amount of expressed protein), S is the supernatant (soluble fraction) and P is pellet
(insoluble fraction).
30oC expression Solubility test
M 0t 1t 4t 5t 20t R S P
Figure 6.5. SDS-Page analysis of the expression level as a function of
time and small scale solubility test of frGFP at 30oC. During test
expression of the strain samples were collected after 0, 1, 4, 5 and 20
hours (h). M is the molecular weight standard given in kDa, R is the raw
extract (total amount of expressed protein), S is the supernatant
(soluble fraction) and P is pellet (insoluble fraction).
6.2.2.2 Mutation in the 3,4-hydrophobic repeat in rhTPH1
Purification of rhTPH1-GFP (chapter 7) shows a broad elution pattern in the anion exchange,
which is also observed in the purification of hTPH1 (see chapter 4). This can be a result of
hydrophobic interaction of the 3,4-hydrophibic face with other hydrophobic molecules in
different oligomer forms as mentioned in chapter 5 and discussed in my master project [14]. By
mutations in the hydrophobic face these interactions could be decreased and therefore
frGFP
rhTPH1-frGFP
97.4 97.4
66.2
45
31
21.5
66.2
45
31
21.5
31
45
21.5
66.2 97.4

Purification of rhTPH1 variants
58
formation of large oligomer forms could to some extent be eliminated. The mutants are
constructed in order to “disrupt” the hydrophobic surface and to see which, if any, of the amino
acids that are involved in the hydrophobic interactions. The hydrophobic residues are mutated to
the positive residue arginine.
Three different expression strains for expression of mutants of rhTPH1-frGFP were constructed,
each containing two mutations in the hydrophobic repeat. The three expression strains HC2346,
HC2373 and HC2344 were tested for expression of L24R/V28R-rhTPH1-frGFP, L31R/L35R-rhTPH1-
frGFP and V28R/L31R-rhTPH1-frGFP, respectively as a function of time (data not shown). The
optimal induction time were determined to approximately 19 hours at 20oC. The expression level
and the solubility from large scale expression in 20 mM Tris/H2SO4 pH 8.5 were tested as
described in section 6.1.2.2 for each mutant and compared with rhTPH1-frGFP. The SDS-Page
analysis is shown in figure 6.6 and on the pictures shown in figure 6.7.
By comparing the total amount of expressed protein (R) it is seen that all four variants expresses
the same amount of protein, but by comparing the raw extract (R) with the supernatant (S) and
pellet (P) the three mutant of rhTPH1-frGFP shows that all the expressed protein is insoluble.
From figure 6.7 it is also seen that the intensity of the green fluorescence of L24R/V28R-rhTPH1-
frGFP, L31R/L35R-rhTPH1-frGFP and V28R/L31R-rhTPH1-frGFP is less intensive than rhTPH1-
frGFP. By incorrectly folding of the target protein frGFP is not correctly folded and thereby it
cannot be fluorescent (described in section 5.3.1). From these results it can be concluded that the
mutants are not folded correctly and it shows that the 3,4-hydrophobic domain of rhTPH1 must
be important for correct folding of the full-length protein. No further work is done with the
mutants.
rhTPH1-frGFP L24R/V28R L31R/L35R V28R /L31R
R S P M M R S P R S P R S P
Figure 6.6. SDS-Page analysis of the expression level and solubility of rhTPH1-frGFP (HC1785), L24R/V28R-
rhTPH1-frGFP (HC2346), L31R/L35R-rhTPH1-frGFP (HC2373) and V28R/L31R-rhTPH1-frGFP (HC2344) at
20oC from large scale expression. M is the molecular weight standard given in kDa, R is the raw extract
(total amount of expressed protein), S is the supernatant (soluble fraction) and P is pellet (insoluble
fraction).
rhTPH1-frGFP m-rhTPH1-frGFP
21.5
31
45
66.2 97.4 97.4
66.2
45
31
21.5
14.4 14.4

Purification of rhTPH1 variants
59
Raw extract Supernatant Pellet
1 2 3 4 1 2 3 4 1 2 3 4
Figure 6.7. Expression test showing the intensity in the raw extract (R), supernatant (S)
and resuspended pellet (P) of the four rhTPH1-GFP variants, where 1 is rhTPH1-frGFP,
2 is L24R/V28R-rhTPH1-frGFP, 3 is L31R/L35R-rhTPH1-frGFP and 4 is V28R/L31R-
rhTPH1-frGFP.
6.2.2.3 Summary
rhTPH1 was fused to frGFP in order to visualize the protein during purification. The variant could
be expressed in a soluble form and with the soluble form colored green indicating that the
protein was correctly folded, see chapter 5.1.3. Three mutants of the regulatory domain were
constructed and fused to frGFP. They could be expressed but in an insoluble form. From the
intensity of the color it is observed that these variants are not correctly folded. Therefore only
the rhTPH1-frGFP without mutation is used for further work in this project.
6.2.3 GST-rhTPH1 Anion exchange of rhTPH1 and rhTPH1-GFP showed that the variants binds throughout the
column and elutes over a large volume indicating that they exist in different forms either by
intersubunit interactions or interactions with other compounds present in the raw extract (see
chapter 7). Based on this result it was decided to construct a variant which can be purified with a
high content of salt in the first purification step. It was chosen to construct a fusion protein of
rhTPH1 fused to GST in the N-terminal end, as described in section 5.1.4.
The expression strain HC2477 (chapter 5) was tested for expression of GST-rhTPH1 as described
in section 6.2.1.2 at 20oC. The result is shown on the SDS-Page analysis on figure 6.8 where the
expression level of GST-rhTPH1 (37 kDa) is shown as a function of time. From the increased
intensity of the marked band on figure 6.8 it is seen that GST-rhTPH1 is expressed. Furthermore,
the intensity of the band reaches a stabile level after 18 to 19 hours. A band corresponding to the
size of 26 kDa is also seen on the SDS-Page analysis with an increased intensity over time, but has
not been identified. It corresponds to the size of GST (26 kDa). The solubility from large scale
cultures was also tested as described in section 6.2.1.2 using 1xPBS, 300 mM (NH4)2SO4 pH 8.0
and shown in figure 6.8. It is seen that almost all of the GST-rhTPH1 fusion protein is expressed in
a soluble form.

Purification of rhTPH1 variants
60
20oC expression Solubility test_
Small scale Large scale___
M 0h 3h 4h 5h 18h 19h R P M S
Figure 6.8. SDS-Page analysis of the expression level as a function of time and small scale
solubility of GST-rhTPH1 for the expression strain HC2477 at 20oC. During test expression of
the strain samples were collected after 0, 3, 4, 5 and 18 or 19 hours (h). M is the molecular
weight standard given in kDa, R is the raw extract (total amount of expressed protein), S is
the supernatant (soluble fraction) and P is pellet (insoluble fraction). 20 µl was loaded from
the expression test, whereas 5 µl was loaded from the solubility test.
6.2.4 hTPH2 variants Two different expression strains were constructed for expression of hTPH259-490 (HC1659) and
hTPH290-490 (HC2462), as described in chapter 5, and tested for expression as described in section
6.2.1.2. From small scale expression it was concluded that optimal expression conditions were
20oC for approximately 19 hours (data not shown).
The expression level and the solubility of both variants from large scale expression were
examined, as described in section 6.2.1.2, and compared with hTPH2 (56 kDa) and cthTPH2 (39.8
kDa). cthTPH2 and hTPH2 were expressed at 20oC for approximately 19 hours. The solubility of
hTPH259-490 (49.7 kDa) and hTPH290-490 (46.3 kDa) were examined in 20 mM BisTris/H2SO4 pH 7.2
and 20 mM Tris/H2SO4 pH 8.5 and compared with the solubility of cthTPH2 and hTPH2 in 20 mM
BisTris/H2SO4 pH 7.2. The solubility was tested at two different pH values because both chTPH2
and cthTPH2 is purified at pH 7.2, whereas chTPH1 is purified in the anion exchange at pH 8.5.
The theoretical pI value is 5.68 for hTPH259-490 and 5.39 for hTPH290-490.
Results of the solubility test are shown in figure 6.9. By comparing the amount of soluble protein
of each hTPH2 variant it is seen that 50 % of cthTPH2 is expressed in a soluble form, whereas
almost all of the other three variants are expressed in an insoluble form. This means that the
residues from 90 to 146 (part of the regulatory domain, se figure 2.2) is important for the
solubility of the variants. It could therefore be interesting to construct variants of hTPH2 which is
truncated different places in the regulatory domain from residue 90 to 146 in order to determine
which residues that causes the change of the protein from being insoluble to soluble.
GST-rhTPH1
Not identified
21.5
31
45
66.2
97.4
21.5
31
45
66.2
97.4
14.4

Purification of rhTPH1 variants
61
No further work is done with these two variants.
cthTPH2 hTPH259-490 hTPH290-490 _ hTPH2
pH 7.2 7.2 8.5 7.2 8.5 7.2____
R S P M R S P R S P R S P R S P M R S P
Figure 6.9. SDS-Page analysis of the expression level and solubility of hTPH259-490 (HC1659), hTPH290-490
(HC2462), hTPH2 and cthTPH2 at 20oC for approximately 19 hours from large scale expression. The
solubility was examined at pH 7.2 for chTPH2 and hTPH2 and at 7.2 and 8.5 for hTPH259-490 (HC1659),
hTPH290-490 (HC2462). M is the molecular weight standard given in kDa, R is the raw extract (total amount
of expressed protein), S is the supernatant (soluble fraction) and P is pellet (insoluble fraction).
6.3 Summary and conclusion All hTPH variants constructed in chapter 5 were tested for expression and solubility and all
variant could be expressed at both 20oC and 30oC. The rhTPH1, rchTPH1, cthTPH1, rhTPH1-GFP an
GST-rhTPH1 could be expressed in a soluble form whereas the three mutants of rhTPH1 and the
two hTPH2 variants could not be expressed in a soluble form. These results showed that point
mutations in the regulatory domain as well as truncations in the N-terminal have a negative
influence on the solubility. It was chosen not to continue with these 5 insoluble variants.
For the further work in this project and to understand the behavior of the regulatory domain the
three variants; rhTPH1, rhTPH1-frGFP and GST-rhTPH1 are used and the purification of these are
described in chapter 7. In table 6.4 the variants used further in this project is given including their
stock number, expression temperature and induction time as well as antibiotic selective marker.
Table 6.4. The three variants which is used further for purification (chapter 7) including
their stock number, expression temperature and induction time as well as antibiotic
marker.
Variant Stock
number
Expression
temperature
Induction
time
Antibiotic
rhTPH1 HC1869 20oC 19 hours 30 kan
rhTPH1-frGFP HC1785 20oC 19 hours 30 kan
GST-rhTPH1 HC2477 20oC 19 hours 100 Amp
45 45
31 31
66.2 66.2 97.4 97.4
21.5 21.5
14.4 14.4


63
7 Purification of rhTPH1 variants
To understand the properties of hTPH1, a “divide-and-conquer” strategy was applied and
different truncated variants of hTPH were constructed. The variants were exposed to solubility
test and from these results it was chosen to use the regulatory domain of hTPH1 (rhTPH1) for
further investigations due to its high solubility of the variant and because elucidating the
properties of this domain could help understanding full-length TPH.
The purification strategy has evolved throughout this project based on results obtained. In this
chapter the strategies behind purification of rhTPH1 are presented as well as the experimental
procedures followed by a result and discussion section.
7.1 Introduction to the variants The purification trials of rhTPH1 were based on the purification strategy of chTPH1 developed in
my master project [14]. It is a two step procedure consisting of an anion exchange followed by gel
filtration.
Three different constructs of the regulatory domain are used: The rhTPH1 variant as well as two
fusions proteins, rhTPH1-frGFP and GST-rhTPH1, respectively. These were constructed as
described in chapter 5 and tested for expression and solubility as described in chapter 6. Table
7.1 lists the molecular mass, theoretical pI value and extinction coefficients for each variant.
rhTPH does not contain tryptophan or tyrosine residues and therefore the extinction coefficient
at 280 nm is zero (see table 7.1). Despite this, comparing the absorbance at 280 nm and 236 nm
(peptide backbone) it is expected to be possible to follow the elution of rhTPH1.
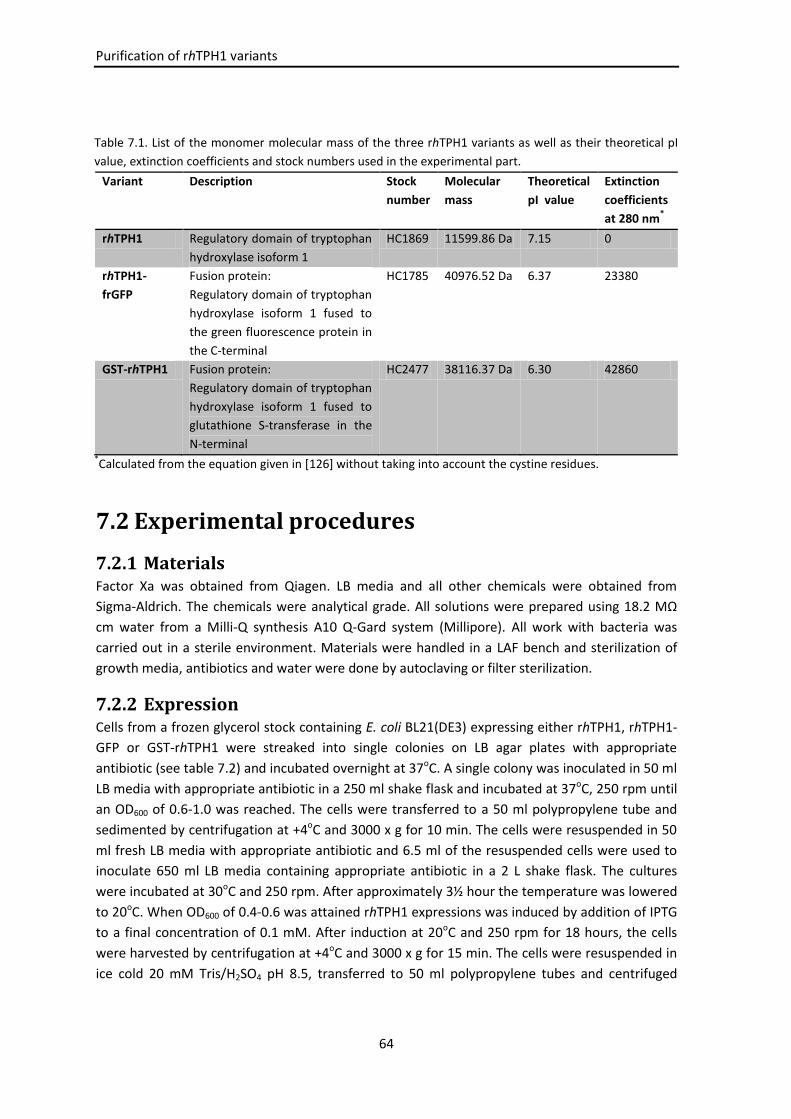
Purification of rhTPH1 variants
64
Table 7.1. List of the monomer molecular mass of the three rhTPH1 variants as well as their theoretical pI
value, extinction coefficients and stock numbers used in the experimental part.
Variant Description Stock
number
Molecular
mass
Theoretical
pI value
Extinction
coefficients
at 280 nm*
rhTPH1 Regulatory domain of tryptophan
hydroxylase isoform 1
HC1869 11599.86 Da 7.15 0
rhTPH1-
frGFP
Fusion protein:
Regulatory domain of tryptophan
hydroxylase isoform 1 fused to
the green fluorescence protein in
the C-terminal
HC1785 40976.52 Da 6.37 23380
GST-rhTPH1 Fusion protein:
Regulatory domain of tryptophan
hydroxylase isoform 1 fused to
glutathione S-transferase in the
N-terminal
HC2477 38116.37 Da 6.30 42860
*Calculated from the equation given in [126] without taking into account the cystine residues.
7.2 Experimental procedures
7.2.1 Materials Factor Xa was obtained from Qiagen. LB media and all other chemicals were obtained from
Sigma-Aldrich. The chemicals were analytical grade. All solutions were prepared using 18.2 MΩ
cm water from a Milli-Q synthesis A10 Q-Gard system (Millipore). All work with bacteria was
carried out in a sterile environment. Materials were handled in a LAF bench and sterilization of
growth media, antibiotics and water were done by autoclaving or filter sterilization.
7.2.2 Expression Cells from a frozen glycerol stock containing E. coli BL21(DE3) expressing either rhTPH1, rhTPH1-
GFP or GST-rhTPH1 were streaked into single colonies on LB agar plates with appropriate
antibiotic (see table 7.2) and incubated overnight at 37oC. A single colony was inoculated in 50 ml
LB media with appropriate antibiotic in a 250 ml shake flask and incubated at 37oC, 250 rpm until
an OD600 of 0.6-1.0 was reached. The cells were transferred to a 50 ml polypropylene tube and
sedimented by centrifugation at +4oC and 3000 x g for 10 min. The cells were resuspended in 50
ml fresh LB media with appropriate antibiotic and 6.5 ml of the resuspended cells were used to
inoculate 650 ml LB media containing appropriate antibiotic in a 2 L shake flask. The cultures
were incubated at 30oC and 250 rpm. After approximately 3½ hour the temperature was lowered
to 20oC. When OD600 of 0.4-0.6 was attained rhTPH1 expressions was induced by addition of IPTG
to a final concentration of 0.1 mM. After induction at 20oC and 250 rpm for 18 hours, the cells
were harvested by centrifugation at +4oC and 3000 x g for 15 min. The cells were resuspended in
ice cold 20 mM Tris/H2SO4 pH 8.5, transferred to 50 ml polypropylene tubes and centrifuged

Purification of rhTPH1 variants
65
again at +4oC and 3000 x g for 15 min. The supernatant was discarded and the cells stored at -
80oC until further use.
In table 7.2 the induction temperature and time as well as appropriate antibiotic for each strain
are given.
Table 7.2. Expression condition for each of the three rhTPH1 variants.
Strain Induction time Induction temperature Antibiotic
rhTPH1 18 hours 20oC 30 kan
rhTPH1-frGFP 18 hours 20oC 30 kan
GST-rhTPH1 18 hours 20oC 100 amp
7.2.3 Preparation of raw extract
7.2.3.1 Preparation of rhTPH1 and rhTPH1-frGFP
Cells from a 650 ml culture containing either rhTPH1 or rhTPH1-frGFP (section 7.2.2) were
resuspended in 20 mM Tris/H2SO4 pH 8.5 (buffer A) to a total volume of 40 ml and lysed on ice by
sonication for 3 x 30 sec. The cell extract was centrifuged in a high-speed centrifuge tube at
18000 x g and +4oC for 20 min. The supernatant was recovered and centrifuged again as above.
The supernatant was collected and filtered through a 0.45 μm filter and diluted to conductivity
less than 1 mS/cm.
7.2.3.2 Preparation of GST-rhTPH1
Cells from a 650 ml culture containing GST-rhTPH1 (section 7.2.2) were resuspended in 1xPBS,
300 mM (NH4)2SO4 pH 8.0 (buffer A) to a total volume of 40 ml and lysed on ice by sonication for
3 x 30 sec. The cell extract was centrifuged in a high-speed centrifuge tube at 18000 x g and +4oC
for 20 min. The supernatant was recovered and centrifuged again as above. After the second
centrifugation the supernatant was collected and filtered through a 0.45 μm.
7.2.4 Purification of rhTPH1
7.2.4.1 Anion exchange
Cells from a 650 ml culture were prepared as described in section 7.2.3.1. The filtered and diluted
supernatant was loaded onto a Q Sepharose High Performance 16/10 column, which was
equilibrated in 20 mM Tris/H2SO4 pH 8.5. A linear gradient of 0-10 % of 20 mM Tris/NaOH, 0.8 M
(NH4)2SO4 pH 8.5 (buffer B) over 12 CV followed by a linear gradient of 20-100 % of buffer B over
2 CV was applied to the column. From the supernatant loaded onto the column, the flow-through
and each top in the chromatogram samples were analyzed by SDS-Page.
7.2.4.2 Gel filtration
Fractions from the anion exchange containing rhTPH1 was collected and pooled. 2 M (NH4)2SO4
was added to a final concentration of 100 mM and the solution was concentrated by
ultrafiltration on an Amicon stirred pressure cell with an Ultracel PL-3 membrane to
approximately 5 ml. The concentrated sample was then filtered through a 0.45 μm filter and

Purification of rhTPH1 variants
66
loaded onto a HiLoad Superdex75 16/60 prep grade column. From the supernatant loaded onto
the column and each peak in the chromatogram samples were analyzed by SDS-Page.
The approximately size of rhTPH1 was determined from the calibration curve constructed for the
the HiLoad Superdex75 16/60 prep grade. 5 proteins of known sizes (Ribonuclease A,
Chymotrypsinogen, Ovalalbumin, Albumin, Blue Dextran 2000) from the Gel Filtration Calibration
Kit, Low Molecular Weight from Amersham Biosciences [127] were used for calibration. The
result is a linear trend line of the gel-phase distribution coefficient, Kav, as a function of the
logarithm of the molecular weight. Kav is defined as given in equation 7.1,
(7.1)
where Ve is the elution volume, Vo is the void volume and Vc is the geometric column volume. The
calibration equation is given in equation 7.2, with a void volume of 44 ml and a total geometric
column volume of 120 ml.
(7.2)
7.2.5 Purification of rhTPH1-frGFP
7.2.5.1 Anion exchange
Cells from a 650 ml culture containing rhTPH1-frGFP were prepared as described in section
7.2.3.1. The filtered and diluted supernatant was loaded onto a Q Sepharose High Performance
16/10 column, which was equilibrated in 20 mM Tris/H2SO4 pH 8.5 (buffer A). A linear gradient of
0-10 % of 20 mM Tris/NaOH, 0.8 M (NH4)2SO4 pH 8.5 (buffer B) over 12 CV followed by a linear
gradient of 20-100 % of buffer B over 2 CV was applied to the column. From the supernatant
loaded onto the column, the flow-through and each peak in the chromatogram samples were
analyzed by SDS-Page.
7.2.5.2 Stabilization by salt
To determine the stabilization effect by salt cells from a 650 ml culture containing rhTPH1-frGFP
were prepared as described in section 7.2.3.1 using 40 ml 20 mM Tris/NaOH, 200 mM (NH4)2SO4
pH 8.5 as buffer but without dilution of the supernatant. 5 ml of the filtered supernatant was
directly loaded onto a HiLoad Superdex75 16/60 prep grade column which was equilibrated with
the buffer. From the supernatant loaded onto the column and each peak in the chromatogram
samples were analyzed by SDS-Page.
7.2.6 Purification of GST-rhTPH1
7.2.6.1 GST affinity purification
Cells from a 650 ml culture containing GST-rhTPH1 were prepared as described in section 7.2.3.2
using 40 ml 20 mM 1xPBS, 300 mM (NH4)2SO4 pH 8.0 as binding buffer (buffer A). The filtered

Purification of rhTPH1 variants
67
supernatant was loaded onto a 20 ml GSTPrep FF 16/10 which was equilibrated in buffer A. The
sample was eluted using 100 % of 50 mM Tris/H2SO4, 300 mM (NH4)2SO4, pH 8.0, 10 mM reduced
glutathione (buffer B). Buffer B was freshly prepared due to the reduced glutathione. Samples
from the supernatant, flow-through and from each peak in the chromatogram were analyzed by
SDS-Page.
7.2.6.2 Gel filtration
Fractions from section 7.2.6.1 containing GST-rhTPH1 were collected and pooled. The sample was
filtered through a 0.45 μm filter and loaded onto a HiLoad Superdex200 26/60 prep grade column
which was equilibrated in 20 mM Tris/H2SO4, 300 mM (NH4)2SO4 pH 8.0. From the supernatant
loaded onto the column and each peak in the chromatogram samples were analyzed by SDS-
Page.
7.2.6.3 Cleavage with Factor Xa
Fractions from the gel filtration (section 7.2.6.2) containing GST-rhTPH1 was collected and
pooled. The sample was analyzed using mass spectrometric analysis as described in section
7.2.6.4. The concentration of the sample was determined by UV-Vis spectrophotometry at 280
nm. The extinction coefficient is given in table 7.1. Four 1 ml solutions of the GST-rhTPH1 fusion
protein were prepared with 2.5 unit/50 µg GST-rhTPH1, 1.5 unit/50 µg GST-rhTPH1, 0.7 unit/50
µg GST-rhTPH1 and 0.3 unit/50 µg GST-rhTPH1, respectively. 200 mM CaCl2 was also added to
each sample to a concentration of 5 mM. The samples were incubated at room temperature
overnight and samples were collected after 2 hours (2h), 4 hours (4h), 6 hours (6h) and 21 hours
(21h). The samples were analyzed by SDS-Page.
The sample which was not subjected to cleavage by Factor Xa was frozen in aliquots of 200 µl
using liquid nitrogen and stored at -80oC.
7.2.6.4 Affinity removal of GST tag
The rhTPH1 is isolated from the cleavad GST by affinity removal of the GST tag. This is done using
a 1 ml GSTrap Fast Flow column and a peristaltic pump P-1 from Pharmacia. The column was
equilibrated with buffer A. After loading of the sample, the column was washed with 5 CV of
buffer A and eluted with 5 CV of buffer B taking into account the volume of the tubes
(approximately 1.5 ml). Samples were collected during loading, wash and elution and the fraction
sizes are given in table 7.3.
Table 7.3. Fraction name and volume of fraction collected during
purification of GST-rhTPH1 on a small 1 ml GSTrap Fast Flow column.
Fraction name Volume
Load Ft1 1.5 ml
Ft2 1.0 ml
Ft3 0.5 ml
Wash W1, W2, W3, W4 1.5 ml
Elution E1, E2, E3, E4 1.5 ml

Purification of rhTPH1 variants
68
7.2.6.5 Mass spectrometric analysis on the LCT premier
The fractions collected and pooled from the gel filtration (section 7.2.6.3) were buffer exchanged
into 600 mM CH3COONH4/NH3 pH 8.5. This was done using Biospin devices (Bio-Rad). The
columns were washed 4 times with 500 µl MQ water followed by two times with 500 µl 600 mM
CH3COONH4 pH 8.5. 100 µl of purified GST-rhTPH1 was loaded onto the column and centrifuged.
The flow-through was again loaded onto another column and centrifuged. The sample was
diluted to approximately 2-4 µM and 3-5 µl of sample was immediately loaded into a nano-spray
capillary from Proxeon and introduced to the mass spectrometer.
The spectrum was recorded in positive ion mode using a LCT premier instrument equipped with a
nano electrospray ionization (nanoESI) source, under conditions optimized for the transmission of
high-mass non-covalent complexes, as described in chapter 9. The following instrumental
parameters were used: Capillary voltage up to 1.8 kV and ion guide voltage 100-130 V. The
instrument was calibrated externally by using a solution of cesium iodide (100 mg/ml) in 50 % iso-
propanol.
7.2.7 SDS-Page analysis and protein identification by MS For SDS-Page analysis of the samples collected during purification 18 % or 12 % Tris-HCl gels from
Bio-Rad were used depending on the size of the variants being analyzed. The gels were prepared
and the electrophoresis was done as described in section 4.2.7.
The protein identification of samples collected during purification of rhTPH1 variants was done as
described in section 4.2.8.
7.3 Results and discussion
7.3.1 Purification of rhTPH1
7.3.1.1 Anion exchange
The soluble fraction of rhTPH1 from one 650 ml cell culture was loaded onto a Q Sepharose High
Performance column as described in section 7.2.4.1. As mentioned in section 7.1, rhTPH1 does
not contain any tryptophan or tyrosine residues and therefore the elution of rhTPH1 is followed
at 236 nm (peptide backbone) and compared with the absorbance at 280 nm.
In figure 7.1 the chromatogram of the anion exchange is shown. Five major peaks (P1, P2, P3, P4,
P5) and some smaller ones (P6, P7 and P8) are seen. From each peak as well as from the
supernatant and the flow-through samples were analyzed by SDS-Page. The analysis is shown in
figure 7.2. From the SDS-Page it is observed, by comparing the amount of rhTPH1 (11.6 kDa) in
the supernatant (S) with the amount present in the flow-through (Ft), that approximately 80-90 %
of rhTPH1 binds to the column. Combining the results from the SDS-Page with the chromatogram
it is seen that rhTPH1 elutes in each collected fraction indicating that rhTPH1 exists in different
oligomer forms. The regulatory domain consists of a 3,4-hydrophobic repeat, which most
probably creates a hydrophobic face. Formations of these oligomer forms could therefore be due

Purification of rhTPH1 variants
69
to interaction between rhTPH1 and other hydrophobic molecules or due to intermolecular
association, as mentioned in chapter 2 and 5.
Additionally, by comparing the absorbance at 236 nm and at 280 nm no major differences
between these two curves are observed, which would have been expected if rhTPH1 was eluting
in one peak. Therefore, the absorbance at 236 nm must also be due to the presence of other
peptides in all peaks. The band from fraction C3 were subjected to protein identification by mass
spectrometry (described in section 4.2.8). The identification confirmed that the protein was
rhTPH1.
Figure 7.1. Chromatogram from the anion exchange of rhTPH1 on a HiLoad Q Sepharose High Performance
16/10 column. The red curve is the absorbance at 280 nm, the blue curve is absorbance at 236 nm, the
brown curve is the conductivity in mS/cm and the green curve is concentration of buffer B in %. Fractions
are shown with red lines on the x-axis.
P1 P2 P3 P4_ _ P5 P6 P7 M S Ft B1 B3 B7 B9 B12 C1 C3 M C9 C11 D2 D3 D4 D10 F6
Figure 7.2. SDS-Page analysis of samples collected during purification of rhTPH1 on a HiLoad Q Sepharose
HP 16/10 column. S is the supernatant loaded onto the column and peak number and fraction number
refers to the chromatogram in figure 7.1. M is the molecular weight standard given in kDa. The red box
indicates the band that was subjected to protein identification by mass spectrometry.
Cond Conc Fractions UV2_280nm@02,SHFT UV1_236nm@01,SHFT
0
100
200
300
400
mAU
0.0
5.0
10.0
15.0
mS/cm
0
100
200
300
400
500
mAU
0.0
5.0
10.0
15.0
%B
150 200 250 300 ml
A4 A6 A8 A10 A12 B2 B4 B6 B8 B10 B12 C2 C4 C6 C8 C10 C12 D2 D4 D6 D8 D10 D12 E2 E4 E6 E8 E10 E12 F2 F4 F6 F8 F10 F12
P1
P2
P6 P7
P3
P4
P5
rhTPH1
14.4 14.4
21.5 21.5
31 31

Purification of rhTPH1 variants
70
7.3.1.2 Gel filtration
Even though rhTPH1 eluted in all collected fractions in the anion exchange, a gel filtration was
carried out. Fractions containing rhTPH1 were therefore collected, divided into three samples
according to their purities (P3 (C1-C2), P4 (C9-C10) and P5 (D2-D4), respectively) and loaded onto
a Superdex75 16/60 as described in section 7.2.4.2. The chromatograms from the three
purifications are combined and shown in figure 7.3. Only one peak is observed for all three
purifications at approximately 70 ml and samples from this as well as from the supernatant were
collected and analyzed by SDS-Page. The analysis is given in figure 7.4.
Combining the results from the SDS-Page with the chromatogram it is seen that rhTPH1 elutes in
the peak at around 70 ml. From the calibration equation (see section 7.2.4.2) of the column this
elution volume corresponds to approximately 34 kDa, indicating that rhTPH1 exists as a trimer.
No absorbance at 280 nm is seen in the chromatogram, which could indicate that the sample is
pure and only contains rhTPH1. This is also seen from the SDS-Page analysis.
Despite the elution behavior of rhTPH1 in the anion exchange the protein elutes in a nice
chromatographic peak in the gel filtration. The differences between these two purifications are
the concentration of salt, which is much higher in the gel filtration (100 mM (NH4)2SO4). It is
therefore speculated that a high salt concentration stabilizes the protein. It could also mean that
the hypothetical rhTPH1-association complex disassociates during gel filtration.
Figure 7.3. Chromatogram from the three gel filtrations on a Superdex75 16/60 column of fractions
collected during anion exchange of rhTPH1 (figure 7.1). The fractions were divided in three parts;
fraction C1-C2 (P3), fraction C9-C10 (P4) and fraction D2-D4 (P5). The blue, brown and orange curves
are the absorbance at 214 nm, the red curves is the absorbance at 280 nm, the horizontal curves are
the conductivity in mS/cm. Fractions are shown with red lines on the x-axis.
UV1_214nm UV2_280nm Cond Fractions UV1_214nm UV1_214nm
0
20
40
60
80
mAU
0
100
200
300
400
mAU
0
100
200
300
400
mAU
0.0
5.0
10.0
15.0
20.0
25.0
mS/cm
40.0 50.0 60.0 70.0 80.0 90.0 ml
1 2 3 4 5 6 7 8 9 10 11 12 13 14 15 16 17 18 19 20
Blue curve Abs214 nm - P3 (C1-C2) Brown curve Abs214 nm - P4 (C9-C10) Orange curve Abs214 nm - P5 (D2-D4)

Purification of rhTPH1 variants
71
P3 (C1-C2) P4 (C9-C10) P5 (D2-D4) S 9 10 11 12 18 M S 8 10 11 12 17 M M S 5 8 10 11 12
Figure 7.4. SDS-Page analysis of the three gel filtrations of fractions collected during anion exchange of
rhTPH1. The fractions were divided into three parts; fraction C1-C2 (P3), fraction C9-C10 (P4) and
fraction D2-D4 (P5). S is the supernatant loaded onto the column and 5, 8, 9, 10, 11, 12, 17 and 18
refers to fractions collected during gel filtration. M is the molecular weight standard given in kDa.
7.3.1.3 Summary and overall discussion
Approximately 80 % of the soluble rhTPH1 binds to the anion exchange column. The rhTPH1 that
binds elutes in all collected fractions, which could be due to oligomerization of the protein by
intermolecular interaction or due to association to other components. The fractions containing
the highest amount of rhTPH were collected and purified on the gel filtration column. rhTPH1
eluted in one chromatographic peak, which is speculated to be due to the higher salt
concentration in the gel filtration (100 mM (NH4)2SO4). It could also be due to dissociation of the
rhTPH1-complex during gel filtration.
Comparing the purification of rhTPH1 with hTPH1 the elution pattern of the variants is very
similar. The difference between the two variants is the size, where rhTPH1 is much smaller and is
therefore able to bind to the anion exchange column, despite the fact that it exists in different
oligomer forms. The hTPH1-complex needs to be decreased by detergent in order to get it to bind
to the anion exchange column (see chapter 4). This also indicates that the regulatory domain is
responsible for this behavior during purification.
From these results it is seen that the elution of rhTPH1 is not as straight forward to follow as first
expected and the elution behavior of rhTPH1 is very difficult to understand. In order to optimize
the purification the behavior of the protein should be elucidated. Therefore, in order to visualize
the protein during purification and make the elution of the protein easier to follow, frGFP is fused
to the C-terminal of rhTPH1 as described in chapter 5. The purification is described in next
section.
7.3.2 Purification of rTPH1-frGFP fusion As mentioned in section 7.3.1.3, rhTPH1 was fused to the N-terminal of frGFP. This is done in
order to visualize the protein during purification.
7.3.2.1 Anion exchange
rhTPH1-frGFP was purified on a Q Sepharose HP 16/10 column as described in section 7.2.5.1.
During purification pictures were taking to visualize the elution pattern of rhTPH1-frGFP on the
anion exchange column. The chromatogram of the ion exchange is shown on figure 7.5. Several
14.4 14.4 rhTPH1 rhTPH1

Purification of rhTPH1 variants
72
peaks are seen and samples from the supernatant, flow-through and from each peak in the
chromatogram were analyzed by SDS-Page and shown on figure 7.6.
Figure 7.5. Chromatogram from the anion exchange of rhTPH1-frGFP using glycerol on a HiLoad Q
Sepharose High Performance 16/10 column. The blue curve is absorbance at 236 nm, the red curve is the
absorbance at 280 nm, the pink curve is the absorbance at 416 nm, the brown curve is the conductivity in
mS/cm and the green curve is concentration of buffer B. Fractions are shown with red lines on the x-axis.
Pictures taking during purification are also shown.
P1 P2 P3 P4 P5 P6 P7 P8 P9
M S X4 B1 B4 B6 B10 C1 C7 C9 M D3 D11 F4 F8 G1 G2 G3 G6 H6
Figure 7.6. SDS-Page analysis of samples collected during anion exchange of rhTPH1-frGFP. S is the
supernatant loaded onto the column and peak numbers and fraction numbers refers to the chromatogram
in figure 7.5. M is the molecular weight standard given in kDa.
UV1_236nm UV2_280nm UV3_416nm Cond Conc Fractions
0
500
1000
1500
2000
2500
mAU
0
20
40
60
80
100
120
140
mAU
0
20
40
60
80
mS/cm
0
20
40
60
80
%B
150 200 250 300 350 400 ml
X6 A2 A5 A8 A11 B2 B5 B8 B11 C2 C5 C8 C11 D2 D5 D8 D11 E2 E5 E8 E11 F2F4F6F8 F11 G2 G5 G8 G12 H3 H6 H9 H12 Waste
P1 P2
P3
P5
P6 P4 P7
P8
P9
rhTPH1-GFP
14.4 14.4
21.5 21.5
31
45 45
31
66.2 66.2
97.4 97.4

Purification of rhTPH1 variants
73
Combining the SDS-Page with the chromatogram it is seen that rhTPH1-frGFP elutes over a large
volume with the highest intensity in fraction G1 (P8). From pictures taken during purification (see
figure 7.5) rhTPH1-frGFP is bound throughout the column volume indicating that the fusion
protein exists in different oligomers or associated forms. This is consistent with the results from
the purification of rhTPH1 (see section 7.3.1).
Comparing the chromatograms from the purification of rhTPH1 with rhTPH1-frGFP they are very
alike. The only differences are the maximum absorption of P8, which is much higher at both 280
nm and 236 nm. Absorbance at 416 nm is also observed at P8. This absorbance peak is due to
GFP [109] and therefore corresponds to the presence of rhTPH1-frGFP (see on the SDS-Page
analysis). The elution pattern of rhTPH1-frGFP is the same as for the previous purification of
rhTPH1, but due to a higher negative charge, rhTPH1-frGFP elutes later in the chromatogram than
rhTPH1. The high absorbance and amount of rhTPH1-frGFP present in P9 corresponds to a high
increase in the conductivity due to change in the slope of the linear gradient. If the slope was the
same during the whole purification the amount of rhTPH1-frGFP would have been spread over a
large volume with a decreased concentration.
7.3.2.2 Stabilization by salt
From anion exchange of both rhTPH1 and rhTPH1-frGFP the variants elute in different oligomer
forms and from gel filtration of samples collected during anion exchange the rhTPH1 variant
elutes in a nice chromatographic peak with the size of a trimer. It is speculated that salt stabilizes
the protein.
Therefore, to see whether or not salt stabilize and eliminate oligomerization of the regulatory
domain, the rhTPH1-frGFP variant was loaded directly onto the Superdex75 column as described
in section 7.2.5.2 where 5 ml of the prepared raw extract with 200 mM (NH4)2SO4 was loaded. In
figure 7.7 the chromatogram from the purification is shown. The chromatogram shows three
peaks: One corresponding to the void volume, Vo, one eluting at 53 ml (P1) and one eluting at 67
ml (P2). From the supernatant loaded onto the column and from the three peaks, samples were
analyzed by SDS-Page and shown on figure 7.8. In figure 7.7 a picture of these fractions are given.
Combining the results from the SDS-Page analysis with the chromatogram it is seen that rhTPH1-
frGFP (41 kDa) exists in P1 with an elution volume of 53 ml corresponding to a size of 76.2 kDa
determined using the calibration equation (see section 7.2.4.2) indicating that rhTPH1 exists as a
dimer. The dimerization of the fusion protein could either be due to rhTPH1 or frGFP, but since
GFP has shown to crystallize as a dimer, the dimerization is most probably due to frGFP [128].
Comparing the chromatogram in figure 7.3 with the chromatogram in figure 7.7 the rhTPH1
elutes as a trimer, whereas rhTPH1-frGFP elutes as a dimer. The differences between these two
purifications is that a salt concentration of 200 mM (NH4)2SO4 is present at the beginning of the
purification of rhTPH1-frGFP, whereas salt is first added to the rhTPH1 sample after anion
exchange to a concentration of 100 mM. Therefore, the presence of salt already in the

Purification of rhTPH1 variants
74
preparation of the raw extract stabilizes the protein causing it to elute in a nice chromatographic
peak.
Figure 7.7. Chromatogram from the gel filtration on a Superdex75 16/60 column of rhTPH1-GFP using
gel filtration as the first step. The red curve is the absorbance at 280 nm, the pink curve is the
absorbance at 416 nm and the brown curve is the conductivity in mS/cm. Fractions are shown with red
lines on the x-axis. A picture of the sample collected during purification is also shown.
5 µl 20 µl_________
Vo P1 P2__
M S A2 A3 A6 A7 A8 A11 A12
Figure 7.8. SDS-Page analysis of the samples
collected during gel filtration of rhTPH1-GFP. S is
the supernatant and peak numbers and fraction
numbers refers to the chromatogram in figure 7.7.
M is the molecular weight standard given in kDa.
UV2_280nm UV3_416nm Cond Fractions
0
500
1000
1500
2000
2500
3000
3500
mAU
0.0
10.0
20.0
30.0
40.0
mS/cm
0
20
40
60
80
mAU
30.0 40.0 50.0 60.0 70.0 80.0 90.0 100.0 ml
F2 A1 A2 A3 A4 A5 A6 A7 A8 A9 A10 A11 A12 B1 B2 B3 B4 B5 B6 B7 B8 B9 B10 B11 B12 C1
rhTPH1-GFP
P1
Vo
P2
P2 P1 Vo
14.4
21.5
31
45
66.2

Purification of rhTPH1 variants
75
7.3.2.3 Summary and overall discussion
From the purification of rhTPH1-frGFP the elution pattern of rhTPH1 is visualized by the green
fluorescence from the frGFP and from the pictures taking during anion exchange of rhTPH1-frGFP
it is seen that the variant binds throughout the column volume (see figure 7.5). In the anion
exchange the variant exists in different oligomer forms giving rise to different overall net charges
and elution at different conductivities. Formations of these oligomer forms could be due to
intermolecular interactions or associations with other components present in the sample. The
regulatory domain consists of a 3,4-hydrophobic repeat, which most probably creates a
hydrophobic face and if this hydrophobic face is located at the outer surface of the native protein
hydrophobic interaction between rhTPH1 and other hydrophobic molecules could be possible, as
described in chapter 5. In order to see if the extent of these associations could be decreased
three variants of rhTPH1 with different mutations in the hydrophobic face were constructed, as
described in chapter 5. From expression and solubility test (chapter 6) it was concluded that
changing the hydrophobic residues to positively charged residues causes the protein to be folded
incorrectly in an insoluble form. Hence, the hydrophobic face is important for correctly folding of
the protein.
Loading the supernatant directly onto a gel filtration column as the first step with a salt
concentration of 200 mM (NH4)2SO4 causes the protein to elute in one single chromatographic
peak indication that salt stabilizes the protein. This is consistent with the gel filtration of rhTPH1
described in section 7.3.1 and from studies on cggTPH1 [12]. Therefore, stabilizing rhTPH1 by
high salt concentration is needed in both the preparation of the raw extract and during
purification. High salt concentrations are usually used to increase the hydrophobic interactions
between proteins causing them to aggregate, but if the protein has very hydrophilic areas at the
surface the salt could stabilize these by electrostatic stabilization.
To scale up the purification, gel filtration as the first purification step is not the answer due to
small volume capacities; therefore, rhTPH1 was fused to GST in order to have high salt
concentration in the buffer system from the beginning of the purification.
7.3.3 Purification of GST-rhTPH1 It was chosen to use 300 mM (NH4)2SO4 to make sure that there was enough salt present to
stabilize the protein. The GST-rhTPH1 fusion protein was purified on a GSTPrep column as
described in section 7.2.6.1. The chromatogram of the purification is shown on figure 7.9. As
expected one peak is seen (P1) and samples from the supernatant, flow-through and P1 were
analyzed by SDS-Page and shown in figure 7.10.
From the SDS-Page approximately 80 % of GST-rhTPH1 is in the soluble fraction (S) and
comparing this amount with the amount in the flow-through (Ft) approximately 75 % binds to the
column.

Purification of rhTPH1 variants
76
Figure 7.9. Chromatogram of the purification of GST-rhTPH1 on a GSTPrep 16/10 column. The blue curve is
absorbance at 236 nm, the red curve is the absorbance at 280 nm and the green curve is concentration of
buffer B. Fractions are shown with red lines on the x-axis.
5 µl 5 µl 10 µl____________
P1_____________
R P M S Ft A7 A8 A9 A10 A11
Figure 7.10. SDS-Page analysis of the solubility and purification of GST-
rhTPH1 on a GSTPrep column. R is the raw extract, P is the resuspended
pellet, S is the supernatant, Ft is the flow-through and peak number
and fraction numbers refers to the chromatogram in figure 7.9. M is the
molecular weight standard given in kDa.
The eluted fractions (fraction A7-A11) were collected, pooled and loaded onto the gel filtration
column as described in section 7.2.6.2. The chromatogram of the gel filtration is shown on figure
UV1_236nm UV2_280nm Conc Fractions
0
1000
2000
3000
4000
mAU
0
1000
2000
3000
4000
mAU
0
20
40
60
80
%B
0 50 100 150 200 ml
F2 X1 X2 X3 X4 X5 X6 X7 F2 A4A6A8 A11 B2 B4 B6 B8 B11 C2 C4 C6 C8 C11 D2Waste
P1
GST-rhTPH1
31
45
66.2
21.5

Purification of rhTPH1 variants
77
7.11. Three peaks are seen; one corresponding to the void volume, Vo, and two eluting at
approximately 160 ml (P1) and 184 ml (P2), respectively. Samples from the supernatant loaded
onto the column and from each peak were analyzed by SDS-Page and shown on figure 7.12.
From the analysis, GST-rhTPH1 exists in both P1 and P2, but the amount in P1 is most probably
due to a poor resolution of P1 and P2. GST-rhTPH1 elutes in P2 at 184 ml which corresponds to a
size of 65 kDa, indicating that the fusion protein is a dimer (monomer is 38 kDa, dimer is 76 kDa).
The dimerization is most probably due to GST [129]. Fraction 45 to 55 were collected and pooled
and the concentration was determined to 1.2 mg/ml (approximately 40 mg/l culture). The sample
was analyzed by mass spectrometric analysis on a LCT Premier as described in section 7.2.6.5. The
m/z spectrum is shown on figure 7.13. From the spectrum a protein with the mass of 76241.9±1
Da is identified which corresponds to a dimer of GST-rhTPH1 (2 x 38116.37 Da).
Figure 7.11. Chromatogram of the gel filtration on a Superdex200 26/60 column of samples collected and
pooled from the GST purification of GST-rhTPH1. The blue curve is absorbance at 236 nm, the red curve is
the absorbance at 280 nm and the brown curve is the conductivity in mS/cm. Fractions are shown with red
lines on the x-axis.
GST was cleaved of the fusion protein by Factor Xa using different concentrations of protease as
described in section 7.2.6.3. Samples were analyzed on SDS-Page analysis and shown on figure
7.14. From the analysis it is seen that the fusion protein can be cleaved given rise to bands
corresponding to the size of GST and rhTPH1, respectively. It is also seen that the higher the
concentration of Factor Xa the faster the fusion protein is cleaved. All the GST is cleaved after 21
UV1_236nm UV2_280nm Cond Fractions
0
200
400
600
800
mAU
0
100
200
300
400
500
mAU
0
20
40
60
80
mS/cm
100 150 200 250 ml
123456789 111315171921232527293133353739414345474951535557596163656769717375777981838587899193 Waste
Vo
P1
P2

Purification of rhTPH1 variants
78
hours at all four concentrations of Faktor Xa. A drawback of having to high concentration of
Factor Xa is nonspecific cleavage of the protein, also mentioned by the manufacture [130]. This
nonspecific cleavage is also seen in this case, where a band with a lower molecular size than
rhTPH1 is present with increased intensity at higher concentration of Factor Xa. From sequence
alignment shown in figure 7.15 of rhTPH1 and the recognition site of Factor Xa a four amino acid
site in rhTPH1 almost corresponds to the recognition site of Factor Xa with the exception of one
amino acid. It could be thought that Factor Xa would cleave at this site given rise to two
truncated sequences of rhTPH1. Because the site is in the middle of the rhTPH1 sequence only
one band corresponding to the truncated rhTPH1 is seen on the SDS-Page, which is also the case.
For further use, 0.3 unit/50 µg of Factor Xa overnight due to lowest amount of degradation of
rhTPH1 should be used (or less).
5 µl 10 µl___________
P1 P2__________
M S 9 36 45 47 49 51 53 55
Figure 7.12. SDS-Page analysis of GST-rhTPH1 purified on a Superdex200 26/60
column. S is the supernatant and peak number and fraction numbers refers to the
chromatogram in figure 7.11. M is the molecular weight standard given in kDa.
Figure 7.13. Mass spectrum of 2-4 µM of the gel filtrated GST-rhTPH1 analyzed
on a LCT premier as described in section 7.2.6.4.
3500 4000 4500 5000 5500
0
20
40
60
80
100
+16
+19
+18 +17
Inte
nsity %
m/z
76241.94±1.01 kDa
GST-rhTPH1
21.5
31
45

Purification of rhTPH1 variants
79
The 1 ml sample with 0.3 unit/50 µg of Factor Xa was loaded onto a 1 ml GST column as
described in section 7.2.6.4. Samples of the supernatant, flow-through and elution were analyzed
by SDS-Page and shown in figure 7.16. From the SDS-Page rhTPH1 is seen in the flow-through as
expected due to cleavage of the GST affinity tag. GST is seen in the elution fractions.
0.3 unit/50 µg 0.7 unit/50 µg 1.5 unit/50 µg 2.5 unit/50 µg__
M 2h 4h 6h 21h 2h 4h 6h 21h M 2h 4h 6h 21h 2h 4h 6h 21h
Figure 7.14. SDS-Page analysis of the cleavage of the GST-rhTPH1 fusion using Factor Xa at different
concentrations. M is the molecular weight standard given in kDa. Samples were taken after incubation with
protease after 2 hours (2h), 4 hours (4h), 6 hours (6h) and 21 hours (21h).
1 60
rhTPH1 (1) MIEDNKENKDHSLERGRASLIFSLKNEVGGLIKALKIFQEKHVNLLHIESRKSKRRNSEF
Faktor XA (1) -----------------------------------------------IEGR---------
3C protease (1) -----------------------------------------------LEVLFQGP-----
Consensus (1) IE R
61 99
rhTPH1 (61) EIFVDCDINREQLNDIFHLLKSHTNVLSVNLPDNFTLKE
Faktor XA (5) ---------------------------------------
3C protease (9) ---------------------------------------
Consensus (61)
Figure 7.15. Protein sequence alignment of rhTPH1 and the recognition site of Factor Xa and the 3C
protease. The alignment was done using the program Vector NTI advance 11 from Invitrogen [34].
Load Wash _ Elution___
M S Ft1 Ft2 Ft3 W1 W2 W3 W4 E1 E2 E3 E4 M
Figure 7.16. SDS-Page analysis of purification of rhTPH1 on a GSTrap column
after cleavage of the fusion protein by Factor Xa. M is the molecular weight
standard given in kDa, S is the supernatant and Ft1, Ft2, Ft3, W1, W2, W3, W4,
E1, E2, E3 and E4 are fractions collected during affinity tag removal of GST.
GST-rhTPH1
GST
rTPH1
Truncated rhTPH1
GST
rhTPH1
Truncated rhTPH1
21.5 21.5
14.4 14.4
31 31
45 45
31 31
21.5 21.5
14.4 14.4

Purification of rhTPH1 variants
80
7.3.3.1 Summary
rhTPH1 can be purified as a GST-rhTPH1 fusion protein in 300 mM (NH4)2SO4. The fusion protein
elutes as a dimer most probably due to dimerization of GST. After cleavage of GST the protein
does not bind to the GST column. rhTPH1 can be purified by the strategy given in figure 7.17. It is
a simple purification strategy consisting of three purification steps and a cleavage step. The
purification can be done within two days.
Figure 7.17. Purification steps in the purification of rhTPH1.
7.3.4 Overall summary and discussion Methods for expression of rhTPH1 in a soluble form (chapter 5 and 6) and purification of rhTPH1
have been developed and documented. From the purification attempts of the three rhTPH1
variants described in section 7.3.1 to 7.3.3 it is seen that the presence of (NH4)2SO4 in the
preparation of the raw extract stabilizes the variant and decreases the extent of oligomerization
from being trimer (without presence of salt in the raw extract) to dimer as described in section
7.3.3. This stabilization effect by salt could be due to the presence of hydrophilic areas in the
protein which is stabilized by the salt. Comparing these results with the purification results of
Preparation of raw extract 1 x PBS, 300 mM (NH4)2SO4/NaOH pH 8.0
GST-rhTPH1 purification Column: GSTPrep Fast Flow 16/10
Binding buffer: 1 x PBS, 300 mM (NH4)2SO4/NaOH pH 8.0 Elution buffer: 50 mM Tris/NaOH , 300 mM (NH4)2SO4, pH 8.0, 10 mM reduced glutathione
Gel filtration Column: HiLoad Superdex 200 26/60
Buffer: 20 mM Tris/H2SO4, 300 mM (NH4)2SO4 pH 8.0
Factor Xa cleavage 0.3 unit/50 µg GST-rTPH1 overnight
Affinity removal of GST tag Column: GSTPrep Fast Flow 16/10
Loading of the cleaved rhTPH1 and washed out using 1 x PBS, 300 mM (NH4)2SO4/NaOH pH 8.0

Purification of rhTPH1 variants
81
cggTPH1 it is observed that the catalytic domain is stable without the presence of salt in the raw
extract but requires salt during purification [12], whereas the regulatory domain needs salt from
the beginning.
The high salt purification strategy developed for rhTPH1 might be the key to purification of full-
length hTPH1.
7.3.5 Future directions Mass spectrometry results of the cleavage product of rhTPH1 should be performed in order to
determine the oligomerization of rhTPH1. Additionally, it could be of interest to use a fusion
protein, which does not form a dimer itself in order to determine the oligomerization of rhTPH1.
Due to non-specific cleavage by Factor Xa, the 3C protease [131] should be used instead. From
the sequence alignment, shown in figure 7.15, rhTPH1 does not contain a sequence
corresponding to the sequence of the recognition site of the 3C protease. An additional
advantage of using the 3C protease is that it is also purified as a GST fusion protein meaning that
by purification on a GST column the protease will bind to the column as well. It is therefore
possible to cleave the GST-rhTPH1 while bound to the GST column [131].
The results obtained from purification of rhTPH1 with salt, should be implemented in the
purification strategy of hTPH1. However, using GST as an affinity tag for oligomeric proteins is a
problem due to its dimerization [129]. Therefore, hTPH1 should be fused to another affinity tag
such as maltose-binding protein (MBP) and both detergent and salt should be used during
purification.
7.4 Conclusion rhTPH1 has successfully been purified using a high content of salt in preparation of the raw
extract and during purification in order to stabilize the variant. Due to the stabilization effect of
salt the rhTPH1 was fused to GST in order to have salt throughout the purification. The GST
affinity tag was successfully removed by cleavage with Factor Xa and the rhTPH1 was isolated on
a GST column after cleavage in high purity. This is the first time that a variant of TPH containing
the regulatory domain has been documental purified. This strategy is hopefully the key to
purification of full-length hTPH1.


83
8 Enzymatic characterization of the catalytic domain of hTPH1
Enzymatic characterization includes determination of the kinetic parameters (Vmax, Km and Ki) and
knowledge of these parameters makes it possible to compare and differentiate isoenzymes from
different tissues or organisms [132]. In order to understand the reaction and enzymatic
properties of hTPH and to elucidate the possibility of isoform-specific inhibitors, the kinetic
parameters of chTPH1 is determined and compared with the kinetic parameters of chTPH2
determined by Michael S. Windahl [6]. In this chapter an introduction to enzyme kinetic is
presented and followed by a description of the TPH assay used to determine the kinetic
parameters of chTPH1. This is followed by the experimental procedures and a result and
discussion section.
8.1 Enzyme kinetic
8.1.1 Michaelis-Menten equation The initial rate of a mono substrate enzyme reaction is related to the substrate concentration by
the Michaelis-Menten equation given in equation 8.1,
(8.1)
where the initial rate, νi, is given as a function of the substrate concentration, [S]. From this
equation the kinetic parameters; the maximal rate of reaction, Vmax, and the Michaelis constant,
Km, can be determined [132,133,134]. The derivation of the equation relies on the assumptions

Enzymatic characterization
84
that the reaction is under pseudo-steady-state conditions (the concentration of the enzyme-
substrate complex is constant), that the enzyme-substrate complex does not deplete the
concentration of free substrate, that the reverse reaction is negligible and that the total enzyme
concentration does not change over time [132,134]. To ensure these assumptions, the measured
initial velocity should be linear with time (steady-state assumption) and the velocity should be
linearly proportional to the enzyme concentration (enzyme does not deplete substrate
concentration assumption) [132].
8.1.1.1 Substrate inhibition
Substrate inhibition is often seen at high concentration of substrate where they often act as
dead-end inhibitors. Normally this kind of inhibition does not occur at physiological substrate
concentrations and therefore, it gives information about the upper limit of substrate
concentration in vivo [135]. When a substrate acts as a dead-end inhibitor the initial rate as a
function of the substrate concentration does no longer follow equation 8.1. Instead equation 8.2
is applied, where Ki is the inhibition constant for the inhibitory substrate.
(8.2)
8.1.2 Terreactant reaction TPH is a terreactant enzyme which catalyzes the ter-bi-reaction of tryptophan, BH4 and O2 to give
5-hydroxytryptophan and 4a-hydroxy-BH4, as described in chapter 2. For terreactant enzymes the
kinetic mechanism is more complex due to binding of substrates in different ways and
determination of the kinetic parameters is therefore not as straightforward. By using the
Michaelis-Menten equation for a mono substrate reaction the parameters can be determined in
a simpler manner, by changing the concentration of one substrate while saturating the enzyme
with the other two substrates ([S] > 100 KM). Even though one substrate is maintained at a
constant, below-saturating concentration, the relationship of the initial rate and the substrate
concentration can follow equation 8.1, but only if the enzyme-substrate complex is under steady-
state conditions (i.e. the [ES] is constant and the [S] does not change significantly) [132,136].
8.1.2.1 Determining the kinetic parameters for terreactant enzymes
There are distinguished between two values of the kinetic parameters: The true and the apparent
values. The true Vmax is the maximum reaction rate of the enzyme when saturated with all
substrates and the true KM is the substrate concentration at the true Vmax/2. In practice it might
be difficult to saturate the enzyme ([S] > 100KM) with all substrates and often the apparent Km
and Vmax values are determined instead [132]. The apparent Km and Vmax values are often
dependable on the concentration of the fixed substrates and it is therefore difficult to compare
values determined at different concentrations of the fixed substrates below saturation.
Comparison of kinetic parameters also requires that they are obtained under identical conditions
e.g. ionic strength, pH and temperature [132].

Enzymatic characterization
85
Determination of the kinetic parameters can be done by fitting the Michaelis-Menten equation to
measured values of the initial rates, νi, at different substrate concentrations. For terreactant
reactions the initial rate is determined at substrate concentrations of the varied substrate while
maintaining the other substrates concentrations fixed. Different methods for fitting data sets to
the Michaelis-Menten equation can be used, such as the linear double reciprocal Lineweaver-
Burk plot (1/ν against 1/s) where the equation is rearranged to give straight-line relationships.
The problem with linear transformations is that the errors in each data set are weighted
differently, and therefore they should not be used to determine the Km and Vmax. The most
accurate way is to fit the Michaelis-Menten equation to the data using non-linear regression
[132].
8.2 Tryptophan hydroxylase assay The assay used in determination of the kinetic parameters of chTPH1 is a non-coupled continuous
fluorimetric assay developed by G. R. Moran and P. F. Fitzpatrick, where production of 5-
hydroxytryptophan is monitored [137]. The assay is further optimized in the Metalloprotein
Chemistry and Engineering Group by M. Storgaard [138] and A. Munch [8]. The assay is based on
different spectral properties of tryptophan and 5-hydroxytryptophan as shown in figure 8.1. By
using an excitation wavelength of 300 nm, excitation of 5-hydroxytryptophan is almost exclusive.
Emission is measured at 330 nm where 5-hydroxytryptophan has high emission intensity [137].
Figure 8.1. Absorbance and emission spectra of tryptophan and 5-hydroxy-
tryptophan [137]. Reproduced with permission from Elsevier.
Besides the three substrates (tryptophan, BH4 and O2), (NH4)2SO4, dithiothreitol (DTT), catalase,
(NH4)2Fe(SO4)2 and Hepes buffer are also added to the assay. The addition of (NH4)2Fe(SO4)2 and
(NH4)2SO4 is due to TPH’s requirement of ferrous iron for activity and stabilization of the enzyme
by ammonium sulfate. DTT is added to prevent autooxidation of BH4 [137] and to maintain the
iron on a reduced form. Catalase is added to consume any hydrogen peroxide formed upon
autooxidation. The Hepes buffer is used to maintain the assay at pH 7.0.

Enzymatic characterization
86
8.2.1 Standard curves for 5-hydroxytryptophan Addition of BH4 initiates the reaction and a progression curve with the emission intensity of 5-
hydroxytryptophan as a function of time is produced. At pH 7.0 BH4 absorbs at 300 nm (see figure
8.2), which is used as excitation wavelength in the assay, and therefore the fluorescence signal
from 5-hydroxytryptophan is reduced by attenuation of the incoming light. Because of this, it is
necessary to make 5-hydroxytryptophan standard curves for all BH4 concentrations used for
determination of the kinetic parameters. These standard curves were done by Michael S.
Windahl [6] and given in appendix A2.
Figure 8.2. The absorption spectra of 5,6,7,8-tetrahydrobiopterin
(BH4) at pH 7.0 (full line) and quinonoid dihydropterin (q-BH2)
(dashed line) [137]. Reproduced with permission from Elsevier.
8.3 Experimental procedures
8.3.1 Materials Ultrapure glycerol was obtained from Invitrogen. 12% Tri-HCl gels were from Bio-Rad. (6R)-
5,6,7,8-tetrahydro-L-biopterin dihydrochlorid (BH4) was from Schircks Laboratories, Jona,
Switzerland. LB media and all other chemicals used were analytical grade obtained from Sigma-
Aldrich. All solutions were prepared using 18.2 MΩ cm water from a Milli-Q synthesis A10 Q-Gard
system (Millipore).
8.3.2 Expression and purification of chTPH1 The expression and purification strategies were developed in my master project [14] and
therefore, they will not be described in details. chTPH1 was expressed in E. coli BL21 cells at 30oC,
250 rpm for approximately 5 hours. The cells were harvested using 20 mM Tris/H2SO4 pH 8.5,
transferred to 50 ml polypropylene tubes and stored at -80oC.
The protein was purified using a method consisting of four steps: Preparation of raw extract,
anion exchange, buffer exchange to the gel filtration buffer and concentration by ultrafiltration

Enzymatic characterization
87
followed by gel filtration, as given in figure 8.3. In table 8.1 the composition of the buffers used in
the purification are given. After the last purification step, fraction containing chTPH1 were
collected and pooled, the concentration determined and the protein was stored at -80oC in
Eppendorf tubes.
Figure 8.3. Steps involved in the purification of chTPH1.
Table 8.1. Composition of the buffers used in purification of chTPH1.
Buffer A Buffer B
Anion exchange 20 mM Tris/H2SO4 pH 8.5 20 mM Tris/NaOH, 800 mM
(NH4)2SO4 pH 8.5
Gel filtration 20 mM HEPES/NaOH, 200 mM
(NH4)2SO4 + 10 % glycerol pH 8.5
8.3.3 The tryptophan hydroxylase assay
8.3.3.1 Instrument and instrument settings
The activity measurements were done on a Varian Cary Eclipse Fluorescence Spectrophotometer.
The excitation wavelength was 300 nm and the emission was measured at 330 nm. Excitation and
emission slits were 5 nm and the photomultiplicator tube (PMT) voltage was 650 V. The
measurements were done in 10.00 mm x 10.00 mm QS quartz cuvettes from Helma. The
fluorescence spectrophotometer was equipped with a temperature-controlled-four-cuvette
holder with stirring. All measurements were done at 15 oC.
Anion Exchange Q Sepharose High Performance 26/10
Gradient 0-7.5 % over 15 CV of buffer B
Buffer exchange and concentration by ultrafiltration Amicon stirred pressure cell Ultracel PL-3 membrane
Gel filtration HiLoad Superdex 75 26/60
Preparation of raw extract

Enzymatic characterization
88
To control the O2 concentration a MI-730 Oxygen electrode and an OM-4 Oxygen Meter from
Microelectrodes, Inc., Londonderry, NH, USA were used. Different N2/O2 mixtures were produced
by using Mass Flow controllers model 5850 TR from Brooks instruments B.V. Veenendaal, The
Netherlands. The flow controllers were operated through a monitor model 0152 from Brooks
Instruments.
8.3.3.2 Preparation of chTPH1 samples
Stocks of the chTPH1 from section 8.3.2 were thawed on ice and the concentration was
determined using ε280 = 33350 M-1 cm-1 [126]. The samples were diluted with an equal volume of
20 mM HEPES/NaOH, 10% w/v glycerol, 200 mM (NH4)2SO4 pH 7.2, 4 mM DTT, 0.1 g/L catalase
and 0.16 mM tryptophan. The mixture was stored at 4oC in 3-6 polypropylene tubes closed under
argon. This was done to prevent loss of activity. 0.221 units of chTPH1 (measured at 70 M
tryptophan, 300 M BH4 and 500 M O2) were used in the measurements which equal ~1.26 M
chTPH1.
8.3.3.3 Composition of the assay solution
The assay volume was 2500 µl and contained 50 mM Hepes/NaOH, 200 mM (NH4)2SO4 pH 7.0, 7
mM DTT, 25 µg/ml catalase, 25 µM (NH4)2Fe(SO4)2 and standard substrate concentrations were
70 µM tryptophan, 300 µM BH4 and 500 µM O2. All measurements were done at 15oC.
Stock solutions of the different compounds were prepared as seen in table 8.2. Catalase was
dissolved in water in larger batches and frozen at -20oC in aliquots of 1.0 ml in Eppendorf tubes
until use, whereas DTT, tryptophan, BH4 and (NH4)2Fe(SO4)2 were freshly prepared prior to each
measuring session. DTT, tryptophan and (NH4)2Fe(SO4)2 were dissolved in water, while BH4 was
dissolved in 10 mM HCl in order to protonate N5 and prevent autooxidation [137]. DTT and BH4
were kept on ice during the measurements.
Table 8.2. Concentration and amounts of the stock solutions used in the standard assay. Compounds
marked with * are compounds where the concentration changes with changing in tryptophan or BH4
concentration.
Concentration in the stock solution Volume in µl Concentration in the assay
Water Variable
Hepes/NaOH,
(NH4)2SO4 pH 7.0
125 mM Hepes
50 mM (NH4)2SO4
1000 50 mM
200 mM
(NH4)2Fe(SO4)2 1.27 mM 50 25 µM
DTT 175 mM 100 7 mM
Tryptophan* 3 mM 50 60 µM
Catalase 1.25 g/L 50 25 mg/L
BH4* 15 mM 50 300 µM

Enzymatic characterization
89
The concentration of tryptophan was determined in 10 mM HCl using ε278 = 5500 M-1 cm-1 and the
concentration of BH4 was determined in 2 M HCl using ε266 = 18000 M-1 cm-1 [137]. This was done
using UV-Vis visible measurements on a HP Diode-array 8453 spectrophotometer.
8.3.3.4 Calibration of the oxygen electrode and controlling the O2 flow
Controlling the O2 concentration is not as straightforward as controlling the concentration of
tryptophan or BH4, which is determined by UV-Vis spectrophotometry. The O2 concentration in
an aqueous solution is dependent on several factors, such as temperature, the ionic strength and
the partial pressure of O2 above the solution. The solubility of O2 in water at 15oC is 1528 µM at
an O2 partial pressure of 101.325 kPa [139]. In all following measurements the value of 1528 µM
was used as equal to 100 % O2. This is an approximation since the measurements were done in 50
mM Hepes/NaOH, 200 mM (NH4)2SO4 pH 7.0 and not in pure water. Another complication in
controlling the O2 concentration is that the assay mixture contains 7 mM DTT which reacts with
O2 [140]. The reaction at pH 7.0 between DTT and O2 is not fast, but it is faster than the diffusion
of O2 from the gas above the solution and fast enough to disturb the oxygen concentration in the
mixture. To solve this problem it was necessary to use an O2 sensing electrode so that the O2
concentration could be measured at the time of the reaction. Because it was impractical to have
the electrode in the cuvette during measurements two cuvettes was used: One reaction cuvette
and one reference cuvette. The reference cuvette contained the same solution as the reaction
cuvette except that enzyme and BH4 was not added to the reference cuvette. The O2
concentration was measured in the reference cuvette.
The calibration of the electrode was done by placing the electrode into the reference cuvette
containing 50 mM Hepes/NaOH, 200 mM (NH4)2SO4 pH 7.0 at 15oC. The zero set point was
obtained by flushing the solution with 100 % N2 until saturation followed by flushing with 100 %
O2 until saturation which was equal to 1528 µM O2 in 15oC water. The flushing tube was lifted out
of the solution but still keeping 100 % O2 above the solution surface and after a few minutes the
oxygen meter was set to 100 % O2. This was done to make sure that the solution was not
supersaturated with oxygen. Corrections were not made for fluctuations in the ambient air
pressure. To obtain the desired O2 concentration in the reaction solution, the solutions in the
reference and the reaction cuvette were flushed with appropriate N2/O2 mixtures.
8.3.3.5 Procedure for measuring the initial rate of 5-hydroxytryptophan
formation
From stock solutions water, buffer, tryptophan, DTT and Fe in the amount given in table 8.2 were
added to the reaction cuvette containing cylindrical magnetic stir bar. Lids with three holes for
gas tubes, O2 electrode and enzyme/substrate addition were sealed to the cuvettes with
parafilm. The cuvettes were placed in the temperature-controlled-cuvette holder in the
fluorescence spectrophotometer and gas tubes and oxygen electrode added. The solutions were
flushed with the desired gas mixture of O2 and N2 with magnetic stirring done as described in
section 8.3.3.4. The oxygen concentration was monitored and at a desired concentration the
tubes were pulled up still keeping a constant flow of the gas mixture above the solutions.
Catalase and enzyme (kept on ice) was added to the reaction cuvette and an equal volume of

Enzymatic characterization
90
water (kept on ice) was added to the reference cuvette. BH4 was added to the reaction cuvette to
initiate reaction and an equal volume of 10 mM HCl was added to the reference cuvette.
8.3.3.6 Activity measurements of chTPH1
The enzyme activity measurements were done using the assay described in section 8.3.3.3 and
the procedure described in section 8.3.3.5. The enzyme solution was prepared as described in
section 8.3.3.2. Each of the three substrate concentrations were varied while maintaining the
other two substrate concentrations fixed using the standard substrate concentrations: 70 µM
tryptophan, 300 µM BH4 and 500 µM O2. All data points were measured at least three times.
8.3.3.7 Data acquisition
The initial slope (int/min) was determined using the fluorescence spectrophotometer software.
The software performs linear regression on an interval of the progression curve where the
selection of the interval was done manually with an interval of minimum 0.04 min. The initial rate
was converted to µM 5-hydroxytryptophan/min from the standard curves at different
concentration of BH4 as mentioned in section 8.2.1 and given in appendix A2. When the initial
rates had been measured the appropriate equation was fitted to the data using OriginPro 7.5
from OriginLab Corp. The kinetic data for varied concentrations of BH4 and O2 were fitted to the
Michaelis-Menten equation 8.1, whereas data for varied tryptophan concentration were fitted to
equation 8.2 taking substrate dead-end inhibition into account.
For each fit to the presented in the following sections a SS/DoF is presented. This is the sum of
squares (SS) divided by the number of degrees of freedom (DoF). The closer SS/DoF is to zero the
better. The coefficient of determination (R2) is also presented in the figures showing the data
points and fitted equation [141].
8.4 Results The results described in this chapter were published in 2009 [142].
8.4.1 Expression and purification chTPH1 is expressed in E. coli BL21(DE3) as described in section 8.3.2. A high level of chTPH1
expression was achieved as seen on the SDS-Page analysis in figure 8.4 lane R. The supernatant
(figure 8.4 lane S) was loaded onto a Q Sepharose High Performance column and chTPH1 eluted
at a conductivity of 1.5 mS/cm. A sample of the collected fractions from the anion exchange is
seen in the SDS-Page in figure 8.4. chTPH1 eluted from the 26/60 Superdex 75 gel filtration
column at 147 ml. A sample of the collected fractions from the gel filtration is shown in figure 8.4.
The chTPH1 band corresponds to the expected molecular weight of 36.1 kDa. The yield was 10
mg/L culture with a specific activity of 70 mol 5-hydroxytryptophan/(min mol chTPH1)
(measured with 70 M tryptophan, 300 M BH4 and 500 M O2).
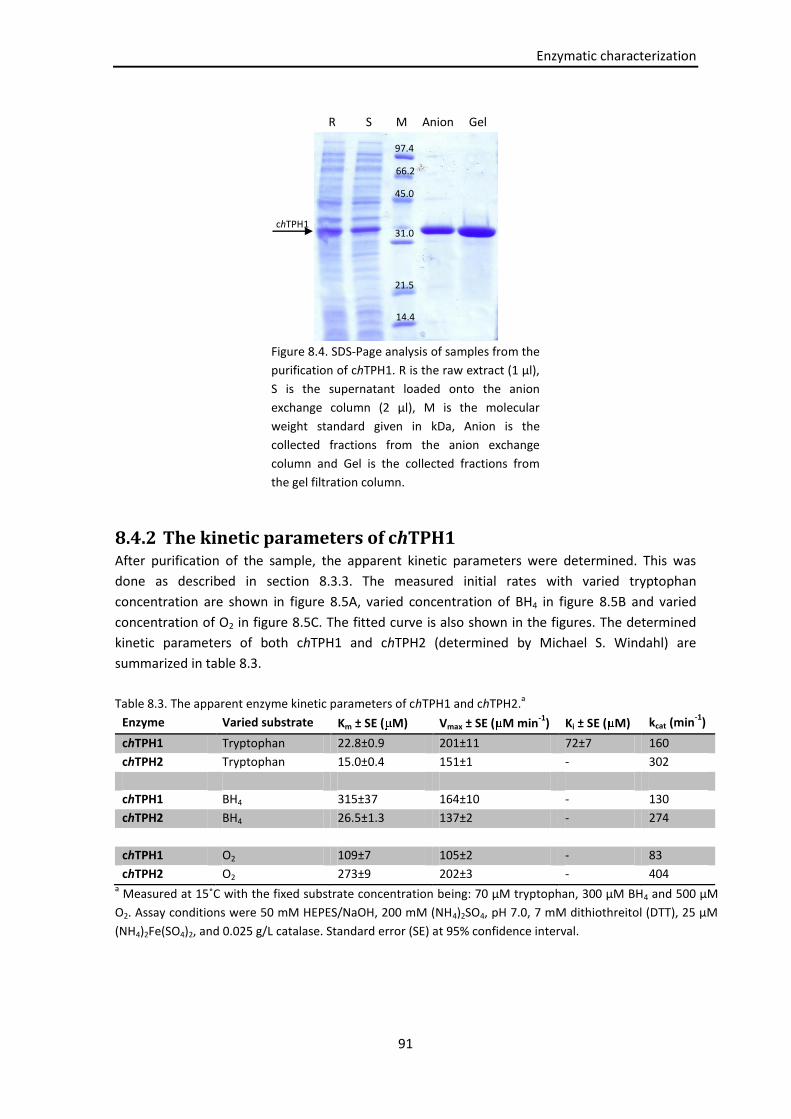
Enzymatic characterization
91
R S M Anion Gel
Figure 8.4. SDS-Page analysis of samples from the
purification of chTPH1. R is the raw extract (1 µl),
S is the supernatant loaded onto the anion
exchange column (2 µl), M is the molecular
weight standard given in kDa, Anion is the
collected fractions from the anion exchange
column and Gel is the collected fractions from
the gel filtration column.
8.4.2 The kinetic parameters of chTPH1 After purification of the sample, the apparent kinetic parameters were determined. This was
done as described in section 8.3.3. The measured initial rates with varied tryptophan
concentration are shown in figure 8.5A, varied concentration of BH4 in figure 8.5B and varied
concentration of O2 in figure 8.5C. The fitted curve is also shown in the figures. The determined
kinetic parameters of both chTPH1 and chTPH2 (determined by Michael S. Windahl) are
summarized in table 8.3.
Table 8.3. The apparent enzyme kinetic parameters of chTPH1 and chTPH2.a
Enzyme Varied substrate Km ± SE ( M) Vmax ± SE ( M min-1
) Ki ± SE ( M) kcat (min-1
)
chTPH1 Tryptophan 22.8±0.9 201±11 72±7 160
chTPH2 Tryptophan 15.0±0.4 151±1 - 302
chTPH1 BH4 315±37 164±10 - 130
chTPH2 BH4 26.5±1.3 137±2 - 274
chTPH1 O2 109±7 105±2 - 83
chTPH2 O2 273±9 202±3 - 404
a Measured at 15˚C with the fixed substrate concentration being: 70 μM tryptophan, 300 μM BH4 and 500 μM
O2. Assay conditions were 50 mM HEPES/NaOH, 200 mM (NH4)2SO4, pH 7.0, 7 mM dithiothreitol (DTT), 25 μM
(NH4)2Fe(SO4)2, and 0.025 g/L catalase. Standard error (SE) at 95% confidence interval.
97.4
66.2
45.0
31.0
21.5
14.4
chTPH1

Enzymatic characterization
92
Figure 8.5. Initial rate as a function of substrate concentrations of chTPH1. A) Varied concentrations of
tryptophan, B) varied concentrations of BH4 and C) varied concentrations of O2. Equation 8.2 was fitted to
the data from varied tryptophan concentrations. Equation 8.1 was fitted to the data from varied BH4 and
O2 concentrations. The curves from the fitted equations are shown. The kinetic parameters obtained from
fitting equation 8.1 and 8.2 to the data are listed in table 8.3.

Enzymatic characterization
93
8.5 Discussion
8.5.1 Expression and purification chTPH1 was expressed and purified using a method developed in my master project with a high
purity without any other bands on the SDS-Page gel.
8.5.2 Activity measurements of cTPH1 The apparent Km values for all three substrates of chTPH1 and chTPH2 were determined at the
same conditions and the data are therefore directly comparable.
From figure 8.5A substrate inhibition by tryptophan is observed above 40 M, which is lower
than that reported for chTPH1 [36,143]. The Ki,tryptophan for chTPH1 was determined to 72±7 M.
These values corresponds to values determined for cggTPH1 where inhibition was observed
above 15 M and with a Ki,tryptophan of 163±24 M [12]. Substrate inhibition of chTPH2 is not
observed, see table 8.3. Substrate inhibition by tryptophan have been reported for TPH1 with a
Ki,tryptophan of 282-740 M with assay conditions of 40 mM HEPES pH 7.0, 250 M BH4, 2 mM DTT,
10 M (NH4)2Fe(SO4)2 and 30 C [49]. These conditions differ significantly from the ones used in
these experimental procedures both in the temperature and the ionic strength of the solution
and can therefore not be directly compared. At conditions similar to the one used here (50 mM
MES, 100 mM (NH4)2SO4, 6 mM DTT, pH 7.0, 15 C) a Ki,tryptophan of 146±14 M have been
reported for the catalytic domain of rabbit TPH1 [144]. This Ki,tryptophan is in the same range as the
72±7 M of chTPH1 and 164±24 M of cggTPH1. To determine the mechanism of inhibition as
well as determining why tryptophan inhibition is not observed for chTPH2 (which is unexpected
in view of the high sequence identity) further studies needs to be performed.
The Km,tryptophan values for the two isoforms are similar; 22.8±0.9 M for chTPH1 and 15.0±0.4 M
for chTPH2. These values are in line with the value for cggTPH1 (7.7±0.7 M) determined at the
same conditions [12]. For hTPH1 the reported Km,tryptophan values are in the range of 10.6 – 33 M
[49,143,145] while for TPH2 the reported Km,tryptophan values are in the range of 20.1 - 77 M
[18,49,145]. It should be noted that the assay conditions in [49,18,143] differ significantly from
the ones used in this experiment by using a higher temperature and lower ionic strength
Additionally, the experiments by Tenner et al. [145] were done on crude lysates and it is unclear
if it is actually the initial rates that have been measured [145]. It is known that the catalytic
domain is unstable at low ionic strength [12,144] and therefore 200 mM (NH4)2SO4 have been
used in this assay. No (NH4)2SO4 was added to the assay used in [49,18,143] and this may yield an
unstable catalytic domain. From the results obtained in this it is concluded that the Km,tryptophan
values for the two isoforms are similar and within a quite narrow range.
A large difference is observed for Km,BH4 with a Km,BH4 of 315±37 M for chTPH1 and a Km,BH4 of
26.5±1.3 M for chTPH2. The value for chTPH1 is similar to the cggTPH1 Km,BH4 which is 324±10
M [12] and is more than a factor 10 higher than the Km,BH4 for chTPH2. Currently, two possible
explanations for this large difference between the two isoforms can be envisioned. This large

Enzymatic characterization
94
difference might be a result of the substrate inhibition by tryptophan observed for chTPH1 or it
might be due to some structural differences in the BH4 binding pocket resulting in a higher
affinity of chTPH2 for BH4. For TPH1 reported Km,BH4 values are in the range of 27-50.8 M
[49,143] and for TPH2 reported Km,BH4 values are in the range of 6.2-20.2 M [18,49].
The Km,O2 value of chTPH1 is 109±7 M while it is 272±9 M for chTPH2. The reported Km,O2 for
cggTPH1 is 39 2 M [12]. Km,O2 have only been reported for partially purified TPH from natural
sources (rabbit hindbrain [146], neoplastic murine mast cells [147] and human carcinoid tumor
[148]). The assay conditions used in [146,147,148] differ greatly from the ones used in this assay,
either by using 6-methyl-5,6,7,8-tetrahydropterin or 6,7-dimethyl-tetrahydropterin [147,148]
and/or by not measuring initial rates [146,147,148]. A comparison with these values is therefore
pointless.
8.5.2.1 Mass spectrometric observations
From mass spectrometric analysis of chTPH1 done in this project (chapter 9) two species were
present in the sample; one corresponding to chTPH1 and one corresponding to either a truncated
version of chTPH1 or another protein. The purification method of the sample used for kinetic
characterization and for mass spectrometric analysis was the same. The only difference was the
gel filtration buffer used, which should not have any influence on the species present in the
sample after purification. The other species present in the mass spectra does not contain iron
and it does not bind the other substrates. Therefore, the only influence this species has is the
determination of the concentration of chTPH1 by absorbance measurements, which will only
affect the specific activity and the determination of kcat.
The mass spectrometric results were obtained in the last part of my Ph.D. project and after the
kinetic characterization of the isoform.
8.6 Conclusion chTPH1 have been expressed and purified. The apparent Km, Vmax and Ki of chTPH1 have been
successfully determined and compared with chTPH2. Overall, large differences are observed in
the enzyme kinetic parameters of chTPH1 and chTPH2 despite the high primary sequence identity
(81 %) and homology (91 %) between the catalytic domains of the two TPH isoforms (mentioned
in chapter 2). Just a few amino acid substitutions probably lead to subtle structural differences
causing these large differences in enzyme kinetic parameters. These differences hold promises
for future identification of isoform-specific compounds that selectively can target either TPH1 or
TPH2 in contrast to the recently published inhibitors which inhibits both isoforms [43,82].

95
9 Mass spectrometric analysis of
hTPH variants
Mass spectrometry (MS) is an analytical tool that can be used for mass determination,
verification of species in a sample as well as studying sample homogeneity, which is an important
factor in crystallization of proteins, and structural analysis. In this chapter mass spectrometry of
intact non-covalent proteins and protein complexes will be described. This will be followed by an
experimental description of mass spectrometric characterization of TPH variants and a result and
discussion section.
9.1 Mass spectrometry In the last two decades MS has gained enormous significance in structural biology and it has been
used as a major tool in investigation of intact protein complexes to study their topology,
stoichiometry, secondary, tertiary and quaternary structure [149,150]. In the 1990s the first
observations of specific non-covalently interactions were reported [150,151,152].
The overall principal in MS is to determine the molecular mass of charged species in a sample. It
consists of three steps where the first step is to generate gas-phase ions from a sample of
interest, the second step is to analyze the gas-phase ions and the third step is detection of the
ions [149]. In the following sections the first two steps will be described.
9.1.1 Electrospray ionization Different techniques have been used to generate gas-phase ions such as chemical and electron
ionization (CI and EI). The problem with these ionization techniques is that they are only able to
analyze volatile organic compounds and not biopolymers such as proteins and nucleic acids. The

Mass spectrometric analysis
96
introduction and development of the matrix-assisted laser desorption ionization (MALDI) and
electrospray ionization (ESI) created a new approach to the MS in protein research, due to their
ability to ionize even fragile compounds like proteins. In particular ESI has proven to be the
ionization method of choice for the analysis of intact proteins and non-covalent protein
complexes [153].
ESI was developed in the 1960s. In 1968 Dole et al [154] showed that it was possible to generate
gas-phase macro-ions of definite mass-to-charge states by electrospray ionization, and in 1970
they sprayed polymers of masses from 600 to 97.200 Da [155]. 15 years later Yamashita and Fenn
[156] coupled ESI to MS and five years later John B. Fenn published a study of ESI on biological
macromolecules in Science [157]. His achievement was awarded in 2002 with the Nobel Prize in
Chemistry.
To analyze intact non-covalent protein complexes, nanoelectropsray ionization (nanoESI) is the
ionization method of choice (see section 9.1.1.2). To get a better understanding of nanoESI and
the reason why it is used in intact protein complex analysis, the mechanism of ESI will be
described first.
9.1.1.1 Mechanism of Electrospray ionization
The electrospray device generally consists of a needle and a counter electrode. A sample solution
flows through the needle, which is maintained at voltage of 2-3 kV and atmospheric pressure,
producing gas-phase ions. These ions are then sampled into a vacuum stage of the mass
spectrometer through an interface region. The ESI process can be divided into three major steps:
First step is production of charged droplets, second step is solvent evaporation of the droplets,
which reduces the size of the charged droplets generating highly charged “daughter” droplets,
and the third step is the mechanism where charged gas-phase ions are produced from highly
charged droplets [157,158].
In a positive ion mode a positive voltage is applied to the needle inducing an electric field. The
field causes the ions in the solution to move. Positive ions will move toward the outlet of the
needle, whereas negative ions will move away from the outlet of the needle. This charge
separation eventually make the positive charges, at the liquid surface, to repel each other and as
the repulsion overcomes the surface tension of the liquid, the surface will begin to expand
further downfield, away from the needle tip. This results in a cone-like shape, called the “Taylor
cone” *159], and is illustrated on figure 9.1. If the applied field (E) is sufficiently high a fine spray
of highly charged droplets will emerge from the cone tip [158,160].
Charged droplets will drift downfield through the air towards the counter electrode. Solvent from
the droplets will evaporate, thus decreasing the droplet size while maintaining the charge. A
decrease in size at a constant charge leads to an increase in the electrostatic repulsion of the
charges at the surface and at a given radius, R, and charge, q, the repulsion force is equal to the
force due to the surface tension, which holds the droplet together. This is known as the Rayleigh
limit [161] and is given by equation 9.1:

Mass spectrometric analysis
97
(9.1)
where ε0 is the permittivity of the vacuum and γ is the surface tension of the solvent. When the
radius is smaller than the Rayleigh limit the droplet becomes unstable and will undergo “coulomb
explosion” or droplet fission. Droplets at the Rayleigh limit undergo fission by distorting to a
teardrop shape and emitting a jet of very small droplets, as shown on figure 9.2. These small
droplets can evaporate and undergo another “coulomb explosion” at their Rayleigh limit, thus
producing smaller and smaller droplets [160].
Figure 9.1. Schematic representation of the electrospray ion source and the steps involved in
electrospray ionization [162]. Reproduced with permission.
Figure 9.2. Teardrop droplet [163]. Reproduced
with permission from Springer.
The electrospray source functions as an electrolysis cell, where oxidation reactions, such as
production of H+ from water, occur at the liquid-metal interface of the capillary tip and reduction
reactions (removal of positive ions) occur at the negative counter electrode. These
electrochemical reactions, which maintain the charge balance, allow continuous production of
charged droplets [164,165].
Two different mechanisms have been proposed to account for the formation of gas-phase ions
from the small charged droplets: Dole’s explanation, the charged residue model (CRM) *154] and
Iribarne and Thomson’s theory, the ion evaporation model (IEM) *166+. In CRM “coulomb
explosions” is assumed to continue until only one molecule is left in each droplet, and after all

Mass spectrometric analysis
98
the solvent has evaporated the molecule will be left as a charged gas-phase ion by retaining the
charge of the droplet, as shown in figure 9.3. However, in IEM solvent evaporation and coulomb
droplet fission will continue until a certain radius (R ≈ 10-20nm) of the charged droplets. When
this radius is reached, direct emission of molecular ions M+ into the gas-phase will occur. The
charge on the droplet required for this ion evaporation is lower than that required for “coulomb
explosions” and therefore, it replaces “coulomb explosions” *167]. Experimental evidence
suggests that formation of ions from large globular intact proteins proceed through CRM,
whereas IEM is true for small molecules [167,168].
Figure 9.3. Schematic representation of the charged residue model where
“coulomb explosions” continue until only one molecule is left in each droplet
and after all the solvent has evaporated the molecule will be left as a charged
gas-phase ion by retaining the charge of the droplet [162]. Reproduced with
permission.
9.1.1.2 Nano electrospray
In conventional electrospray, the ion source typically sprays ion droplets of the size of 1-2 µm
using a capillary with an inner diameter of approximately 100 µm. To evaporate the solvent from
these large droplets and to achieve ion formation, volatile solvents with low surface tension were
added and the solution was often heated [169,170]. The introduction of a nanoESI source in 1994
by Wilm and Mann [169] allowed the analysis of samples from water under more physiological
conditions and was at the same time introduced to achieve lower flow rates [169].
In nanoESI borosilicate glass capillaries are used and are typically coated with gold to make them
conductive. These capillaries have an inner tip diameter of approximately 1 µm, resulting in
droplets with a diameter less than 200 nm, about 100-1000 times smaller than for conventional
ESI. The smaller droplets make the evaporation more easily and facilitate stable spraying of
solvents with high surface tensions such as water and aqueous buffers, allowing proteins to
remain intact in their native conformation, thus preserving non-covalent interactions. The flow
rate is approximately 20-50 nL/min allowing long measuring time from small amounts of sample
(1 µl can last for more than 30 min), which is also a benefit in analysis of proteins due to low
sample volumes [169,170,171]. Sometimes it may be necessary to apply a backing pressure to
initiate the liquid flow [169,170].
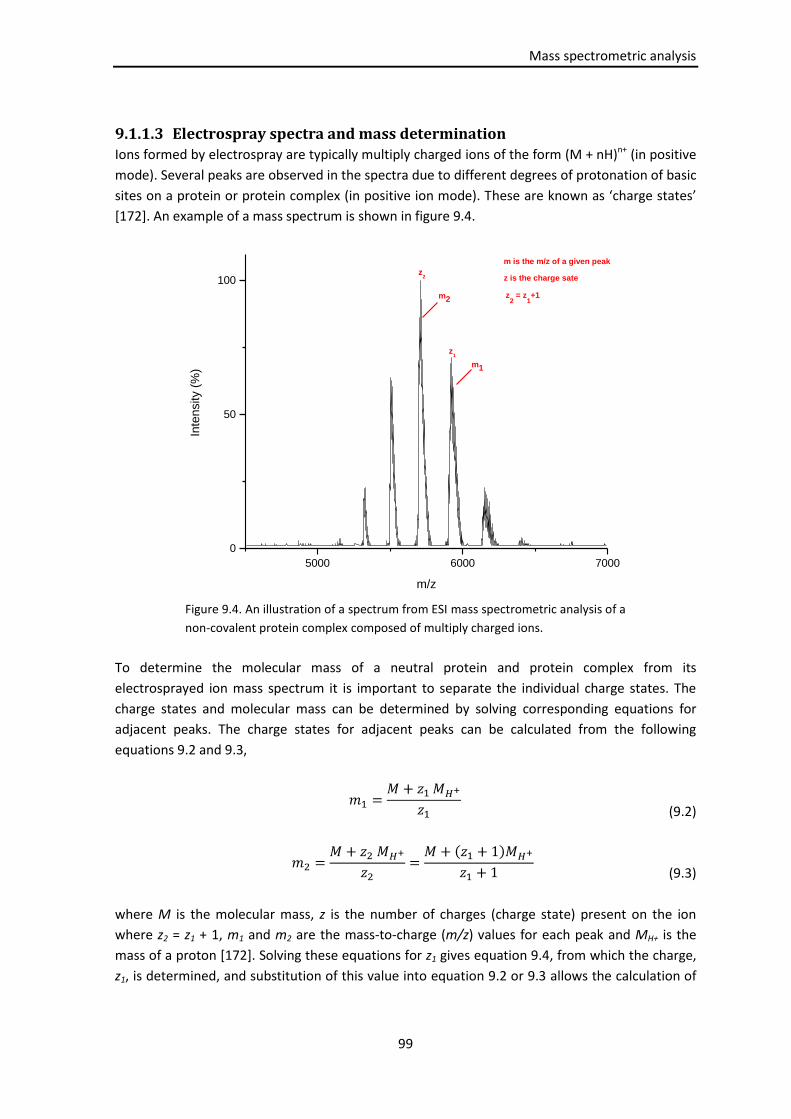
Mass spectrometric analysis
99
9.1.1.3 Electrospray spectra and mass determination
Ions formed by electrospray are typically multiply charged ions of the form (M + nH)n+ (in positive
mode). Several peaks are observed in the spectra due to different degrees of protonation of basic
sites on a protein or protein complex (in positive ion mode). These are known as ‘charge states’
[172]. An example of a mass spectrum is shown in figure 9.4.
Figure 9.4. An illustration of a spectrum from ESI mass spectrometric analysis of a
non-covalent protein complex composed of multiply charged ions.
To determine the molecular mass of a neutral protein and protein complex from its
electrosprayed ion mass spectrum it is important to separate the individual charge states. The
charge states and molecular mass can be determined by solving corresponding equations for
adjacent peaks. The charge states for adjacent peaks can be calculated from the following
equations 9.2 and 9.3,
(9.2)
(9.3)
where M is the molecular mass, z is the number of charges (charge state) present on the ion
where z2 = z1 + 1, m1 and m2 are the mass-to-charge (m/z) values for each peak and MH+ is the
mass of a proton [172]. Solving these equations for z1 gives equation 9.4, from which the charge,
z1, is determined, and substitution of this value into equation 9.2 or 9.3 allows the calculation of
5000 6000 7000
0
50
100
m2
m1
z1
Inte
nsity (
%)
m/z
z2
z2 = z
1+1
m is the m/z of a given peak
z is the charge sate

Mass spectrometric analysis
100
the molecular mass, M. Calculation of the molecular mass of a protein with multiply charged ions
is done by using this simple algorithm where the mass is calculated for two charge states differing
by one, and subsequently repeating this calculation for the rest of the charge states. The
molecular mass of a protein in this simple case is then determined by averaging these masses.
(9.4)
Using this algorithm the mass-to-charge for a multiply charged ion is converted to the mass of the
zero-charge molecule [172,173]. A problem with this approach is that it assumes that all charge is
due to excess or deficit of protons for positive or negative ions, respectively. It does not take into
account the presence of modifications such as metals and/or disulfide bonds in a protein. The
metal center in metalloproteins can carry charge depending on its oxidation state and therefore,
the use of equation 9.2 or 9.3 will overestimate (or underestimate) the number of protons giving
a higher (or lower) molecular mass than the actual mass of the metalloprotein. It is important to
take the oxidation state into account for proper determination of the molecular mass from the
mass spectrometric data. The first step in determining the oxidation state is to calculate the mass
of the metalloprotein from its amino acid composition plus the atomic masses of the metal
center, cofactors and possible post translational modifications present in the protein. This mass is
termed the calculated mass, as seen in table 9.1. The second step is to determine the apparent
mass, which is the mass determined using equation 9.2 and 9.3 for a protein where all of the
charge of an ion is assumed to be due to excess or deficit of protons. The apparent mass will
differ to the actual mass by the number of protons equal to the charge present on e.g. the metal-
centre (see table 9.1). A comparison of the apparent mass with the calculated mass allows the
oxidation state in the metalloprotein to be determined from the difference between the two
values [173]. For an intact disulfide bond there will be a difference between the apparent mass
and the calculated mass corresponding to two protons, due to a loss of one proton from each
thiol group by formation of a disulfide bond [173]. The mass which takes the oxidation state and
the number of disulfide bonds into account is termed the expected molecular mass. Therefore, in
mass spectrometric analysis of proteins it is important to distinguish between the following
masses given in table 9.1.
When determining the molecular mass of large proteins the average mass is usually used, due to
incomplete resolution of the isotopic distribution, and corresponds to the centroid of the
molecular peak in the experimental mass spectral data. It is important to remember that
different analyzers have different resolving power and some analyzers such as FTICR can resolve
the isotope distribution for very large proteins [172,173]. In table 9.2 the average masses for the
most common elements in proteins are given as well as for iron.
The experimental mass determined from the mass spectra is sometimes higher than the
calculated mass from the sum of the protein components. This is due to incomplete removal of

Mass spectrometric analysis
101
solvent and/or buffer ions during the electrospray process, which results in broadening (tailing)
of the peaks and therefore a shift in the m/z to a higher value [153].
Table 9.1. The masses that should be distinguish between in MS of intact proteins [173].
Masses Definition
Calculated
mass
The mass which is calculated based on the molecular formula of a neutral protein
molecule plus the atomic masses of the metal center, the masses of cofactors and
possible post translational modifications present in the protein; i.e., all ionizable sites
in the protein are assumed to be neutral.
Expected
mass
The mass which is determined from the calculated mass, but where oxidation state and
number of disulfide bonds have been taken into account. This is the mass that should
be compared with the apparent mass.
Apparent
mass
The mass which is derived directly from the experimental data using the algorithm
given in equation 9.2 and 9.3 where the mass-to-charge for a multiply charged ion is
converted to the mass of the zero-charge molecule. This algorithm assumes that all
charge is due to excess of protons.
Table 9.2. Masses for the most common elements.
Name Molecular formula Average Masses
Hydrogen H 1.0079
Carbon C 12.011
Nitrogen N 14.0067
Oxygen O 15.9994
Sulfur S 32.06
Iron Fe 55.847
9.1.1.4 Electrospray of non-covalent complexes
The analysis of non-covalent complexes by mass spectrometry presents several challenges.
Firstly, analyzing large complexes requires a high m/z range. Non-covalent complexes carry
relatively low charge in their native compact conformation and thus large non-covalent
complexes have relatively high m/z, because of the inaccessibility of some of the charge state
sites compared to the open (unfolded) solution conformation [150,152]. In most quadrupole
analyzers this can become a major problem, because of their upper m/z limit (see section
9.1.2.1), but by increasing the quadrupole operation range up to 32,000 m/z this problem can be
overcome [174]. Secondly, maintaining the right solution condition is important for keeping the
non-covalent complex in its folded, native state and therefore the use of appropriate solvents
(almost exclusively aqueous solutions), pH values and ionic strength is necessary to maintain
intact complex. Generally, volatile, aqueous buffered solutions, such as ammonium acetate or
ammonium bicarbonate, are used and prepared at physiological pH (6-8) [175,176]. Thirdly,
solvent adducts are often observed on large multiply charged complexes and therefore, the
degree of desolvation, i.e. stripping of solvent molecules from the molecular complex, is a critical

Mass spectrometric analysis
102
parameter in observation and correct molecular mass determination of the complex (also
mentioned in section 9.1.1.3) [175]. Therefore, additional desolvation can be accomplished by
heating of the capillary in the interface region and by gas phase collisions in the interface region
downstream from the atmospheric pressure [177]. Non-covalent complexes are extremely fragile
in the gas phase state and are easily dissociated using an excess of heat or too high collision
energy. It is therefore important to maintain a balance between removing solvent molecules and
keeping the complex intact [175,176,178]. Due to orders of magnitude smaller droplets produced
in nanoESI than in conventional ESI, the desolvation process will be less of a problem. Fourthly,
gas-phase ions are generated at atmospheric pressure, as mentioned in section 9.1.1.1, and
introduced into the vacuum chamber by acceleration to velocities of several hundred meters per
second [179]. Since energy is proportional to mass for ions having the same velocity, transmission
of large ions (mass > 500 Da) into the vacuum acquire large amount of energy compared to small
ions. This serves to broaden the ion beam leading to transmission loss. Using higher pressures in
the initial stages of the instrument will result in more collisions with the gas molecules, which
cool the large ions, effectively focus the ion beam and allowing more ions to reach the detector.
This phenomenon is known as collisional cooling [179].
Non-covalent complexes are stabilized by water molecules and in the gas phase these water
molecules are removed. One major issue regarding ESI is whether or not protein and protein
complexes preserve their solution structure in the absence of water in the gas phase. Recent
findings for protein complexes in the gas phase suggest that many features of protein structure,
including compact structure, elements of secondary structure, hydrogen bonding interactions,
and quaternary structure, can be retained in the absent of solvent. Although, it is important to
remember that these results do not necessarily imply that the precise interactions present in the
native state of a protein complex are maintained, but the overall size(s) and many of the binding
interactions deduced for proteins in solution are found to persist in the gas phase [180,181,182].
One problem in ESI-MS is the tendency of proteins and protein complexes to form nonspecific
interactions with other molecules or ions present in the sample resulting in complexes, which are
not present in solution. These are termed nonspecific complexes. The formation of gaseous
macromolecular ions in ESI proceeds through CRM, as mentioned in section 9.1.1.1, where the
initial ESI droplets undergo solvent evaporation until they come close to the Rayleigh limit at
which point they undergo droplet fission releasing several small multiply charged nanodroplets
(offspring droplets). If these offspring droplets contain more than one analyte molecules,
nonspecific interactions may be formed as the solvent evaporates to form gaseous ions [183].
The probability of a droplet to contain more than just one analyte molecule is increased by
increasing the concentration of analyte. Also by lowering the potential within the instrument (e.g.
the declustering potential) the presence of nonspecific interactions increases. Therefore, to
eliminate these nonspecific interactions either the concentration can be lowered or the
potentials within the instrument can be increased [184]. The problem with nonspecific
interactions is in interpretation of the mass spectrum where they are misidentified as specific.
This will obscure the binding stoichiometry [183,184].

Mass spectrometric analysis
103
9.1.2 Mass analyzers Mass analyzers separate ions according to their m/z ratios based on ion behavior in an electrical
and/or magnetic field. There exist many different analyzers and some of the most widely used
are the Quadrupole (Q) and the Time-Of-Flight (TOF) analyzers.
9.1.2.1 Quadrupole
The quadrupole mass filter is a commonly used analyzer. It consists of four cylindrical electrodes
(or rods), which are connected parallel to each other in opposite pairs with a fixed direct current
(DC) and an alternating radio frequency (RF) potential applied to them, as shown in figure 9.5.
The two opposite rods have a potential of and the other two of
, where U is the fixed DC potential and Vcos(2π ) is the alternating RF potential of
amplitude V and frequency [185]. This applied field causes the ions to oscillate during their
time in the quadrupole and the ions are separated based on the different stabilities of their
trajectories. By changing the two parameters U and V the quadrupole can operate in two
different modes; in a RF only mode and in a mass filter mode. In the RF only mode U is set to zero
and the quadrupole operates as a broad mass filter, whereas in the mass filter mode U and V are
fixed and only ions with specific m/z values passes through the analyzer [186].
Figure 9.5. A) A cut through the quadrupole indicating the radius between the rods. B) A and B
indicate rods with opposite charge. The dotted lines indicate planes of zero electrical fields
[187]. Reproduced with permission from Copyright Clearance Center.
The quadrupole operates in a limited m/z range with a certain upper limit, that is dependent on
the RF amplitude and frequency as well as the inner radius between the rods and the highest
m/z, Mmax, that can be transmitted is given by equation 9.5,
(9.5)
with Vmcos(2πft) as the RF voltage applied between adjacent rods (2Vm is the peak-to-peak
amplitude, f is the frequency and t is the time), as mentioned earlier, and r0 as the inner radius
A)
B)

Mass spectrometric analysis
104
between the rods in meter. The upper limit for a conventional quadrupole is between 3000 and
4000 m/z and therefore, the analysis of large non-covalent proteins and protein complexes with
much higher m/z ratios will become a problem in these analyzers. To increase the upper limit all
three parameters in equation 9.5 (Vm, f and r0) could be changed, but changing Vm is limited, due
to possible breakdown of the high voltage between the rods. Decreasing r0 can reduce
transmission. In practice there is no lower limit to the frequency and therefore, by adjusting this
parameter the mass range can be extended. Decreasing the frequency of the quadrupole reduces
the resolution of the instrument, but using the quadrupole as a mass filter to isolate ions for
tandem MS (mentioned in section 9.1.3) and a TOF analyzer as second analyzer, the resolution is
not compromised significantly [174].
9.1.2.2 TOF analyzer
The principle of the TOF analyzers is to separate ions according to the time it takes for an ion to
reach a detector in a field-free drift space. Ions, formed in the ion source, are accelerated into a
field-free drift region with the same amount of kinetic energy ( ), but different
velocities depending on their masses as given in equation 9.6,
(9.6)
where z is the number of charges, e is the charge of an electron, Va is the acceleration voltage
and m is the mass. The time it takes an ion to travel thought the drift tube, also termed the drift
time, tD, can then be described by equation 9.7,
(9.7)
where D is the length of the drift region. From these equations it is seen that the m/z ratio is
proportional to the drift time and ions with higher masses will have a longer drift time and
therefore reach the detector later than ions with smaller masses [188,189]. The first TOF analyzer
was built in 1948 by A. E. Cameron and D. F. Eggers [190], although at that time the resolution
was still poor, due to differences in the ions initial kinetic energies and their starting point, but
the introduction of the reflector has improved the resolution tremendously. It consists of an
electrostatic ion mirror that can refocus and reflect the ions towards the detector. More
energetic ions will penetrate deeper into the mirror and therefore spend more time in the
reflector, whereas less energetic ions will leave the reflector faster and the differences in flight
time for ions with same m/z ratios will be corrected. Another benefit using a reflector is the
longer drift length, which increases the time to separate ions with different m/z ratios and
therefore increases the resolution [188]. TOF analyzers have in theory an unlimited m/z range
and are therefore the analyzer of choice when studying non-covalent proteins and protein
complexes, but coupling a continuous-flow technique such as the ESI source to a TOF analyzer
can be difficult, because TOF analyzers are pulsed devices. Using orthogonal injection, in which

Mass spectrometric analysis
105
ions from the ESI source enter a storage region in the TOF instrument perpendicular to the
spectrometer axis, overcomes this problem [191].
Connecting quadrupoles and TOF together, results in hybrid Q-TOF mass analyzers that allow
mass spectrometers to function in a tandem mass spectrometry mode, as described in section
9.1.3.
9.1.3 Tandem mass spectrometry on large protein complexes ESI-MS can be used for studying the structure of protein complexes. By dissociation of non-
covalent complexes it is possible to determine the composition, stoichiometry and oligomeric
architecture of the complex. Different dissociation techniques can be used, but only collision-
induced-dissociation (CID) will be described.
In CID protein complex ions are accelerated into an inert collision gas. When the ions collide with
the neutral gas atoms or molecules (e.g. argon) a small portion of the ions kinetic energy is
converted into internal energy and if sufficient internal energy is accumulated the protein
complex ions will dissociate. These experiments can either be performed in the source region of
the mass spectrometer, known as “in-source CID”, or in a specifically designed collision-cell,
where ions with a specific m/z can be pre-selected and this is referred to as tandem-MS or
MS/MS. Tandem-MS consists of two MS stages; in the first stage (typically a quadrupole) ions of a
specific m/z value are selected and termed precursor ions. These precursor ions undergo CID in
the collision-cell giving rise to product ions which in the second MS stage is subsequently
analyzed (typically a TOF analyzer). The extent of dissociation is influenced by changing the
pressure of the argon gas and the accelerating voltage [149,153,192,193].
The general pathway of CID is ejection of a highly charged monomer and a lowly charge
“stripped” protein complex of n-1 components which appears at higher m/z values than the
parent oligomers and can be described as;
(9.8)
where n is the number of subunits in the oligomer, q is the number of charges on the oligomer,
and x is the average charge carried by a monomer m [194]. The dissociation process has been
described as being asymmetric in the charge partitioning over the CID products relative to their
mass. It has showed to be a Coulombically driven process in which the monomer becomes
unraveled and ejected from the oligomer with a disproportionally large share of the charge
[150,181,194].
9.1.4 Instrumentation The mass spectrometer used for MS and tandem MS analysis of the TPH variants is the Qstar XL
mass spectrometer (Sciex, Toronto, Canada). This is a hybrid instrument which contains three
quadrupoles and a TOF analyzer. In figure 9.6 a schematic representation of the instrument is
shown. In MS mode the protein complex ions are transmitted to the TOF analyzer and their

Mass spectrometric analysis
106
masses are determined. In MS/MS mode protein complex ions with a certain m/z ratio are
selected in the first analyzer (Q1) and subjected to CID in the gas-filled collision cell. Product ions
are then analyzed in the TOF mass analyzer. The low-frequency extended mass range of Q1
permits the isolation of ions up to 32,000 m/z [174]. A flow-restricting sleeve has been installed
in the front part of the Q0 to increase the pressure locally and allows collisional cooling (described
in section 9.1.1.4) of heavy ions [179].
Figure 9.6. Illustration of the Qstar XL platform [179]. Reproduced with permission from the American
Chemical Society.
9.2 Experimental procedures The experiments done and results described in this chapter have been performed in Professor
Carol V. Robinson Mass Spectrometry Group at the University of Cambridge, UK.
9.2.1 Materials and chemicals Three hTPH variants: chTPH1, chTPH2 and cthTPH2, were analyzed by MS and tandem MS. They
were cloned and expressed in E. coli and purified using a simple two step procedure containing
an ion exchange followed by a gel filtration. In chapter 8 the expression and purification methods
of chTPH1 are described, whereas expression and purification of chTPH2 were done by M. S.
Windahl and described in [9,142]. cthTPH2 was expressed and purified by L. T. Haahr in the
Metalloprotein Group [57]. After purification the variants were stored at -80oC. In table 9.3 the
composition of the storage buffer solution and concentration of each variant are given.
Table 9.3. Composition of storage buffer and concentration of each hTPH variant
analyzed by mass spectrometry.
Variant Buffer Concentration
chTPH1 20 mM Tris/NH3, 0.3 M CH3COONH4 pH 8.5 13 µM
chTPH2 20mM Hepes/NaOH, 0.1 M (NH3)2SO4, 5 % glycerol pH 7.2 25 µM
cthTPH2 0.3 M CH3COONH4 pH 7.2 55 µM

Mass spectrometric analysis
107
Cesium iodide solutions, used for external calibration of the Qstar instrument, were prepared
from 99 % grade CsI salt (Sigma). The ammonium acetate solutions, used for buffer exchange,
were prepared from a 7.5 M stock solution obtained from Sigma. Tryptophan, Fe(II)acetate and
ethylenediamine tetraacetate (EDTA) were obtained from Sigma. The two pterins (BH2 and BH4)
were obtained from Schircks Laboratories.
Water from an ELGA LabWater's PURELAB Maxima system was used.
9.2.2 Sample preparation Prior to MS analysis the three hTPH variants were buffer exchanged into 600 mM ammonium
acetate with a pH value of either 7.0 or 8.5 depending on the sample (see table 9.4). The buffer
exchange was done by using ultrafiltration devices (500 µl Vivaspin devices, Sartorius Stedim
Biotech.) with molecular weight cut-off (MWCO) of either 5,000 or 10,000 Da depending on the
sample. The columns were washed with 400 µl of buffer and centrifuged for 3 min at 11,000 x g
and +4oC. This was repeated 3 times (4 times in total). After washing, the sample was added to
the device followed by addition of buffer to a total volume of 400 µl and the sample was
concentrated to 50 µl by centrifugation at 11,000 x g and +4oC. The buffer exchange was done 2
or 3 times depending on the sample. After buffer exchange the concentration of the sample was
determined using a picodrop spectrophotometer (PicoDrop). In table 9.4 the pH value, amount of
sample added to the columns, total number of buffer exchange and the final concentration for
each variant are given.
Table 9.4. The pH value of the ammonium acetate buffer, the volume added of the purification
product, total number buffer exchange and the final concentration for each variant.
Sample pH
value
Volume added of the
purification product
MWCO Number of buffer
exchange
Final
concentration
chTPH1 8.5 50 µl 5 kDa 2 ~10 µM
chTPH2 7.0 5 µl 5 kDa 3 ~50 µM
cthTPH2 7.0 50 µl 10 kDa 2 ~50 µM
9.2.3 Preparation of needles The needles used for MS and tandem MS were prepared in-house. They were made from
borosilicate glass capillaries with an inner filament (cat. no. GC100TF-10, Harvard Apparatus). The
capillaries have an inner diameter (i.d.) of 0.78 mm and an outer diameter (o.d.) of 1.0 mm. They
were pulled using a micropipette puller (flaming/brown P-97, Sutter Instrument Co., Novato, CA)
and coated with a thin layer of gold using a SEM sputter-coater (Polaron, Newhaven, U.K.) to
make them electrically conductive. The pulled end of the capillary was clipped under a
stereomicroscope using a tweezer, resulting in a tip inner diameter between 1 and 5 µm.
Typically 3-6 µl of protein solution, prepared as described in section 9.2.2, were loaded into the
capillaries.

Mass spectrometric analysis
108
9.2.4 MS and tandem MS measurements All spectra were recorded in positive ion mode using a Quadrupole Time-of-Flight (Q-ToF)
instrument (Qstar XL) equipped with a nanoESI source, under conditions optimized for the
transmission of high-mass non-covalent proteins and protein complexes, as described in section
9.1.4. The following instrumental parameters were used: Capillary voltage up to 1.8 kV,
declustering potential (DP) 150-200 V, focusing potential (FP) 200-250 V, second declustering
potential 15 V and collision energy up to 220 V, microchannel plate (MCP) 2350 V. For tandem
MS argon was used as a collision gas at pressures from 3 x 10⁻² to 12 x 10-2 mBar with collision
energy ranging from 100 to 220 V. All spectra were calibrated externally by using a solution of
cesium iodide (100 mg/ml) in water with the mass range m/z 350 to 10100.
9.2.4.1 Determination of the apo-protein monomer mass
To determine the exact experimental monomer mass of the apo-protein, the protein complex
was denatured prior to ESI-MS. This was done using C4 or C18 ZipTip columns from Millipore. The
columns were washed 3 times in acetonitrile (ACN), then twice in 1% formic acid followed by one
time in 5 % formic acid. 20 µl of the protein sample (prepared as described in section 9.2.2) was
loaded by pipetting up and down five times. After loading the sample, the column was washed
once with 1 % formic acid and eluted using 2 µl of a mixture of 1 % formic acid and 50 % ACN. The
sample was immediately loaded into a capillary and introduced into the mass spectrometer. The
denatured spectrum was obtained in the mass range 300-3000 m/z.
9.2.4.2 Mass spectrometry of intact hTPH
To obtain a mass spectrum of intact hTPH the sample was prepared as described in section 9.2.2.
After buffer exchange the sample was diluted with 600 mM ammonium acetate pH 7.0 or 8.5
depending on the sample. This was done to decrease the amount of nonspecific interactions due
to high concentration of the sample in the nanoelectrospray droplets. After dilution 3-5 µl aliquot
of the samples were loaded into capillaries and analyzed immediately by the mass spectrometry.
9.2.4.3 Ligand binding
To determine the iron binding either Fe or EDTA were added to the protein sample prepared in
section 9.2.2. A mixture of Fe(II)acetate:hTPH with a ratio of 5:1 as well as a mixture of
EDTA:hTPH with a ratio of 4:1 were incubated for 15 minutes on ice. 3-5 µl aliquot of the samples
were loaded into capillaries and immediately analyzed.
To determine the substrate binding an excess of either tryptophan, BH2 or BH4 were added to the
variants prior to analysis. A solution of tryptophan:hTPH, BH2:hTPH or BH4:hTPH with a ratio of
either 1:1, 5:1, 10:1 or 20:1 with hTPH variant were incubated for 15 minutes on ice. A 3-5 ul
aliquot of this sample was loaded into a capillary and introduced immediately into the mass
spectrometer.
9.2.4.4 Oligomerization
The stoichiometry of cthTPH2 was determined by tandem-MS. The relevant m/z value was
selected in the selecting quadrupole and argon was used as a collision gas at a pressure of 3 x 10⁻²

Mass spectrometric analysis
109
mbar. In the collision cell the energy and pressure of the collision gas were increased gradually
from 50 to 200 V for the energy and from 3 x 10⁻² to 12 x 10-2 mbar of the pressure.
9.2.4.5 Data acquisition
Data were acquired and processed with MassLynx software (Waters). The average mass of both
the expected and apparent mass (centroid of the peaks) of all three variants were used due to
the size of the variants as well as the resolving power of the instrument. The apparent masses of
chTPH1, chTPH2 and cthTPH2 were calculated from the obtained spectra according to the
method described previously (section 9.1.1.3) and processed with MassLynx 4.1 software.
As mentioned in section 9.1.1.3 the apparent mass calculated by using the algorithm in equation
9.2 is the molecular mass of the zero-charge molecule where all the charge assumes to be due to
excess of protons. This is not true for metalloproteins as explained in section 9.1.1.3. Therefore,
the mass used to compare the apparent mass obtained from the mass spectra is the expected
mass, which takes into account metal binding, disulfide bonds and binding of cofactors. hTPH
binds Fe in either oxidation state +II or +III. To determine the expected mass in positive ion mode
the oxidation state is subtracted from the calculated mass. In table 9.5 and 9.6 the expected
masses of apo- and holo-hTPH are given, where Fe has a mass of 55.847 Da, tryptophan has a
mass of 204.2314 Da, BH2 has a mass of 239.2365 Da, BH4 has a mass of 241.2525 Da, H2O has a
mass of 18.0154 Da, CH3COO- has a mass of 59.0445 Da and O2 has a mass of 31.9988 Da.
All spectra are shown with no smoothing and without background subtraction.
Table 9.5. Expected average molecular masses of the monomer of apo-chTPH1, apo-chTPH2 and
apo-cthTPH2 with Met as well as the holo-form of chTPH2 with Fe, Trp, BH2 or BH4 and holo-
chTPH1-Fe. Also the expected average masses of 2mer, 3mer and 4mer of holo-cthTPH2 with
ligands are given.
chTPH1 (Da) chTPH2 (Da)
Apo-TPH 36197.4564 36316.4612
TPH-Fe(II)/(III) 36251.3034 /36250.3034 36370.3082 / 36369.3082
TPH-Fe(II)/(III)-3H2O 36305.3496 / 36304.3496 36424.3544 / 36423.3544
TPH-Fe(II)/(III)-CH3COO-
36310.3475 / 36309.3475 36429.3527 / 36428.3527
TPH-Fe(II)/(III)-Trp ------------------------------------- 36574.5382 / 36573.5382
TPH-Fe(II)/(III)-Trp-3H2O ------------------------------------- 36628.5842 / 36627.5842
TPH-Fe(II)/(III)-BH2 ------------------------------------- 36609.5447 / 36608.5447
TPH-Fe(II)/(III)-BH2-3H2O ------------------------------------- 36663.5909 / 36662.5909
TPH-Fe(II)/(III)-BH4 ------------------------------------- 36611.5607 / 36610.5607
TPH-Fe(II)/(III)-BH4-3H2O ------------------------------------- 36665.6069 / 36664.6069

Mass spectrometric analysis
110
Table 9.6. Expected average molecular masses of the monomer, dimer, trimer and tetramer of apo-
cthTPH2 and holo-cthTPH2-Fe.
cthTPH2 (Da)
1mer 2mer 3mer 4mer
Apo-TPH 39822.4411 79644.8822 119467.3233 159289.7644
TPH-Fe 39876.2881 79752.5762 119628.8643 159505.1524
TPH-Fe-3H2O 39930.3343 79860.6686 119791.0029 159721.3372
TPH-Fe-CH3COO-
39936.3405 79872.681 119809.215 159745.362
9.3 Results and discussion
9.3.1 chTPH1 Before MS analysis of the chTPH1 sample the buffer was changed to 600 mM ammonium acetate
pH 8.5 as described in section 9.2.2. After buffer exchange the concentration of the chTPH1 was
10 µM.
9.3.1.1 Determination of the experimental monomer mass of apo-chTPH1
The experimental monomer mass of apo-chTPH1 was determined as described in section 9.2.4.1.
In figure 9.7 the m/z spectrum of the denatured chTPH1 is shown.
Two proteins with different masses are present in the spectrum: One with an apparent mass of
36198.18±2.20 Da and one with an apparent mass of 33749.45±0.61 Da. The first protein with a
mass of 36198.18±2.20 Da corresponds to the expected mass of the monomer of apo-chTPH1
including its N-terminal methionine, 36197.4564 Da, as given in table 9.5. From the sequence of
chTPH1 (see figure 2.3) this protein is also expected to maintain methionine since the
penultimate amino acid is an aspartic acid [195].
The second protein with an approximately 2450 Da lower mass could either be a truncated
version of chTPH1 or another protein present in the sample. The buffer exchanged sample was
therefore analyzed by SDS-Page. Additionally, two other proteins with known masses of
approximately 38 kDa and 41 kDa were analyzed in order to see if the resolution of the SDS-Page
was high enough to distinguish between these two proteins. In figure 9.8 the SDS-Page analysis is
shown. Only one band is seen for the chTPH1 sample (see also figure 8.4), whereas the sample
with the two proteins of known size, having the same mass difference as chTPH1 and the second
species, are separated. This indicates either that the sample only contains chTPH1 and that the
truncation most probably happens during mass spectrometric analysis or that the other protein
runs through the SDS-Page as chTPH1 even though the mass is different. In order to determine
this, the chTPH1 sample was tryptic digested and the protein was identified. The identification
was done by Dr. Min Zhou and the result is given in table 9.7. Two proteins are identified: TPH1
from human and an E. coli protein, thiosulfate-binding protein. The E. coli thiosulfate-binding
protein has a mass of 37615 Da and without its 25 aa signal peptide it has a mass of 35057 Da

Mass spectrometric analysis
111
[196]. This does not correspond to the mass of 33.7 kDa determined by MS, indicating that the
second species could be due to truncation.
A)
B)
Figure 9.7. Mass spectrum of denatured chTPH1. The buffer was changed to 600 mM ammonium
acetate pH 8.5 using ultrafiltration devices and denatured using ZipTip (C4) and 5 % formic acid as
described in section 9.2.4.1. The sample was eluted from the tip using 1 % formic acid and 50 %
acetonitrile. Spectrum B) is a zoom of spectrum A) with m/z 750 to 1350. In both spectra two
species are seen; one highlighted in red with a mass corresponding to chTPH1 and one in green
corresponding to the second species.
800 1600 2400
0
50
100
+27
+28
+29
+30
+32+34
+36+38
+39
+32
+18
+17
+33
+19
+18Inte
nsity (
%)
m/z
apo-chTPH1
36198.18±2.20
33749.45±0.61
+20
800 900 1000 1100 1200 1300
0
50
100
+42 +38+37
+36
+41
+40
+39
+35+34
+33 +32
+31
+30
+29
+27+28
+44
+32
+43
+42
+41
+39
+38 +37
+36+35 +34
+33
+26
+27
+29
+30
+31
+40
Inte
nsity (
%)
m/z
apo-chTPH1
36198.18±2.20
33749.45±0.61
+28

Mass spectrometric analysis
112
kDa M chTPH1 41 41+38 38 M
Figure 9.8. SDS-Page analysis of the chTPH1 sample after transportation and
buffer exchange. Lane 1 and 6 is the marker, lane 2 the chTPH1 sample, lane 3
is the known protein of 41 kDa, lane 4 is a mixture of the known proteins (41
and 38 kDa) and lane 5 is the 38 kDa protein. The gel is a NuPage 4-12% gel
from Invitrogen, the marker is a SeeBlue Plus2 prestained standard (1x)
invitrogen and the running buffer is a MES buffer.
The truncation of chTPH1 can either be in the N-terminal, the C-terminal or in both. In figure 9.9
the sequence of chTPH1 is shown. Different truncation of the sequence were tried to see if it
could give masses corresponding to the apparent mass obtained from the denatured chTPH1
spectrum. Three different truncations of chTPH1 with a mass corresponding to 33749 Da were
observed and the sequences of the three truncations are marked with green, blue and red arrows
in figure 9.9. For the E. coli thiosulfate-binding protein only one truncation of this protein gives
rise to a mass of 33751 Da. The sequence of the E. coli thiosulfate-binding protein with the
truncation marked with green arrows is given in figure 9.10.
From these results it is difficult to determine whether or not the second species is due to another
protein or due to truncation in the chTPH1 sequence.
Table 9.7. Results obtained from the tryptic digested chTPH1 sample.
Acession # Coverage Peptides identified
(see also figure 9.9 and 9.10)
#AAs Description
P17752 20.72 VLMYGSELDADHPGFK
KYFADLAMNYK
YFADLAMNYK
EDNIPQLEDVSNFLK
NLPLLSK
VFGAGLLSSISELK
VEFTEEEIK
DFLSGLAFR
TWGTVFQELNK
444 Tryptophan 5-hydroxylase 1
OS = Homo sapiens
GN=TPH1 PE=1 SV=4 -
[TPH1_HUMAN]
P16700 12.13 KQYEAQGFEVVIPK
NIHDWNDLVR
QALAILQGLK
LIFPNPK
338 Thiosulfate-binding protein
OS = E. coli (strain K12)
GN=cysP PE=1 SV=1 -
[CYSP_ECOLI]
98
62 49
38
28

Mass spectrometric analysis
113
MDGMETVPWFPKKISDLDHCANRVLMYGSELDADHPGFKDNVYRKRRKYFADLAMNYKHGDPIPKVEFTEEEIKT
WGTVFQELNKLYPTHACREYLKNLPLLSKYCGYREDNIPQLEDVSNFLKERTGFSIRPVAGYLSPRDFLSGLAFRVFHCT
QYVRHSSDPFYTPEPDTCHELLGHVPLLAEPSFAQFSQEIGLASLGASEEAVQKLATCYFFTVEFGLCKQDGQLRVFGA
GLLSSISELKHALSGHAKVKPFDPKITCKQECLITTFQDVYFVSESFEDAKEKMREFTKTIKRPFGVKYNPYTRSIQILKD
Figure 9.9. Sequence of chTPH1. The peptide identified in tryptic digestion is highlighted in red. The
three different truncations of cTPH1 that give rise to masses of approximately 33749 Da are marked
with green arrows (33751.5261 Da), blue arrows (33749.5970 Da) and red arrows (33750.6446 Da),
respecively. The three amino acids highlighted in green are the amino acids iron is coordinated to
[13].
TELLNSSYDVSRELFAALNPPFEQQWAKDNGGDKLTIKQSHAGSSKQALAILQGLKADVVTYNQVTDVQILHDKG
KLIPADWQSRLPNNSSPFYSTMGFLVRKGNPKNIHDWNDLVRSDVKLIFPNPKTSGNARYTYLAAWGAADKADG
GDKGKTEQFMTQFLKNVEVFDTGGRGATTTFAERGLGDVLISFESEVNNIRKQYEAQGFEVVIPKTNILAEFPVAW
VDKNVQANGTEKAAKAYLNWLYSPQAQTIITDYYYRVNNPEVMDKLKDKFPQTELFRVEDKFGSWPEVMKTHFT
SGGELDKLLAAGRN
Figure 9.10. Sequence of the E. coli thiosulfate-binding protein without its signal peptide. The
peptide identified in tryptic digestion is highlighted in red. The truncation that gives rise to a mass of
33751 Da is marked with green arrows.
9.3.1.2 Mass spectrometry of intact chTPH1
The mass spectrum of intact chTPH1 was obtained after determination of the experimental
monomer mass of apo-chTPH1 using acid denaturation. This was done as described in section
9.2.4.2 and the spectrum is shown in figure 9.11. The bottom spectrum in figure 9.11B was
obtained using lower declustering and focusing potential (DP 100, FP 150) between OR and Q0
(see figure 9.6) and the upper spectrum was obtained using higher potentials (DP 150, FP 200). By
having a higher voltage in the instrument a cleaner spectrum is achieved due to elimination of
nonspecific interactions with solvent molecules.
As for the denatured chTPH1 two species are seen: One with a mass of approximately 36.3 kDa
corresponding to chTPH1 and one with a mass of approximately 33.7 kDa (figure 9.11A). This is
consistent with the results obtained from the denatured sample of chTPH1 (section 9.3.1.1).
Comparing the two spectra of intact chTPH1 from figure 9.11B obtained at low and high potential
the ratio of the intensity between chTPH1 and the second species is changed. The second species
has the highest intensity at low potential whereas chTPH1 has the highest intensity at high
potential. This is most probably due to a better resolution between the two species at higher
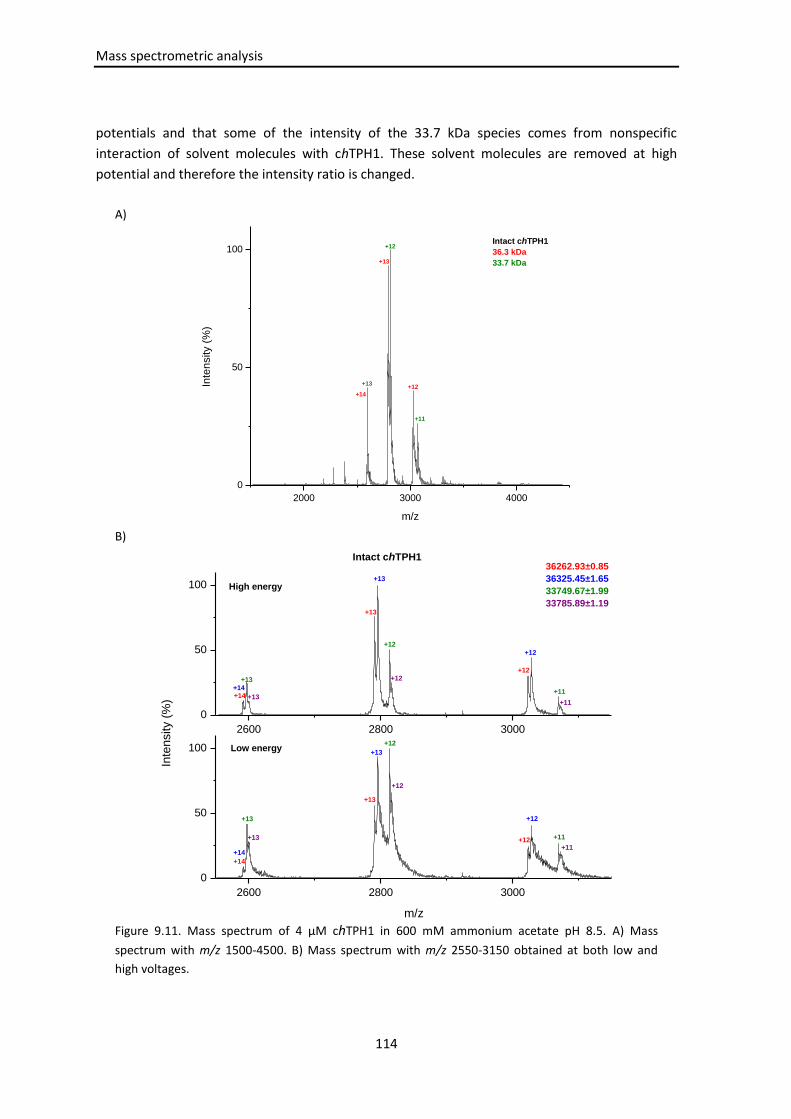
Mass spectrometric analysis
114
potentials and that some of the intensity of the 33.7 kDa species comes from nonspecific
interaction of solvent molecules with chTPH1. These solvent molecules are removed at high
potential and therefore the intensity ratio is changed.
A)
B)
Figure 9.11. Mass spectrum of 4 µM chTPH1 in 600 mM ammonium acetate pH 8.5. A) Mass
spectrum with m/z 1500-4500. B) Mass spectrum with m/z 2550-3150 obtained at both low and
high voltages.
2000 3000 4000
0
50
100
+13+12
+12
+13
+14
Inte
nsity (
%)
m/z
Intact chTPH1
36.3 kDa
33.7 kDa
+11
2600 2800 3000
0
50
100
2600 2800 3000
0
50
100
+11
+11
+11
+11
+12
+12
Inte
nsity (
%)
m/z
+13
+13
+14
+14
+14
+14
+12
+12
+13
+12
+12
+12
+12
+13
+13
+13
+13
Low energy
Intact chTPH1
High energy
+13
36262.93±0.85
36325.45±1.65
33749.67±1.99
33785.89±1.19
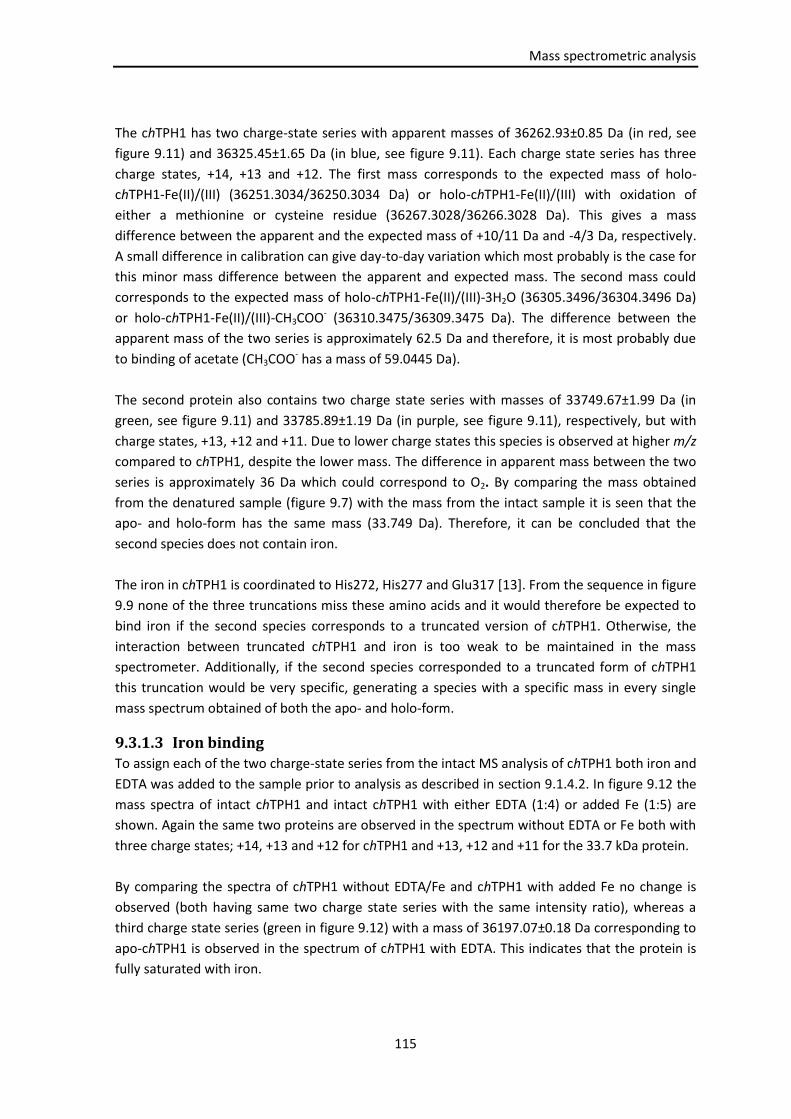
Mass spectrometric analysis
115
The chTPH1 has two charge-state series with apparent masses of 36262.93±0.85 Da (in red, see
figure 9.11) and 36325.45±1.65 Da (in blue, see figure 9.11). Each charge state series has three
charge states, +14, +13 and +12. The first mass corresponds to the expected mass of holo-
chTPH1-Fe(II)/(III) (36251.3034/36250.3034 Da) or holo-chTPH1-Fe(II)/(III) with oxidation of
either a methionine or cysteine residue (36267.3028/36266.3028 Da). This gives a mass
difference between the apparent and the expected mass of +10/11 Da and -4/3 Da, respectively.
A small difference in calibration can give day-to-day variation which most probably is the case for
this minor mass difference between the apparent and expected mass. The second mass could
corresponds to the expected mass of holo-chTPH1-Fe(II)/(III)-3H2O (36305.3496/36304.3496 Da)
or holo-chTPH1-Fe(II)/(III)-CH3COO- (36310.3475/36309.3475 Da). The difference between the
apparent mass of the two series is approximately 62.5 Da and therefore, it is most probably due
to binding of acetate (CH3COO- has a mass of 59.0445 Da).
The second protein also contains two charge state series with masses of 33749.67±1.99 Da (in
green, see figure 9.11) and 33785.89±1.19 Da (in purple, see figure 9.11), respectively, but with
charge states, +13, +12 and +11. Due to lower charge states this species is observed at higher m/z
compared to chTPH1, despite the lower mass. The difference in apparent mass between the two
series is approximately 36 Da which could correspond to O2. By comparing the mass obtained
from the denatured sample (figure 9.7) with the mass from the intact sample it is seen that the
apo- and holo-form has the same mass (33.749 Da). Therefore, it can be concluded that the
second species does not contain iron.
The iron in chTPH1 is coordinated to His272, His277 and Glu317 [13]. From the sequence in figure
9.9 none of the three truncations miss these amino acids and it would therefore be expected to
bind iron if the second species corresponds to a truncated version of chTPH1. Otherwise, the
interaction between truncated chTPH1 and iron is too weak to be maintained in the mass
spectrometer. Additionally, if the second species corresponded to a truncated form of chTPH1
this truncation would be very specific, generating a species with a specific mass in every single
mass spectrum obtained of both the apo- and holo-form.
9.3.1.3 Iron binding
To assign each of the two charge-state series from the intact MS analysis of chTPH1 both iron and
EDTA was added to the sample prior to analysis as described in section 9.1.4.2. In figure 9.12 the
mass spectra of intact chTPH1 and intact chTPH1 with either EDTA (1:4) or added Fe (1:5) are
shown. Again the same two proteins are observed in the spectrum without EDTA or Fe both with
three charge states; +14, +13 and +12 for chTPH1 and +13, +12 and +11 for the 33.7 kDa protein.
By comparing the spectra of chTPH1 without EDTA/Fe and chTPH1 with added Fe no change is
observed (both having same two charge state series with the same intensity ratio), whereas a
third charge state series (green in figure 9.12) with a mass of 36197.07±0.18 Da corresponding to
apo-chTPH1 is observed in the spectrum of chTPH1 with EDTA. This indicates that the protein is
fully saturated with iron.

Mass spectrometric analysis
116
By adding EDTA or Fe to the sample the ratio between the two charge state series for the 33.7
kDa protein does not change indicating that the protein does not bind iron and is therefore most
probably not a truncated version of chTPH1. This is consistent with the spectrum of intact chTPH1
in section 9.3.1.2.
Figure 9.12. Mass spectra of 4 µM chTPH1 in 600 mM ammonium acetate without added Fe or EDTA, with added EDTA and with added Fe.
9.3.1.4 Summary and overall discussion
The mass spectrometric results indicate that the chTPH1 sample is heterogeneous containing two
proteins: One with a mass of 36.3 kDa corresponding to the mass of chTPH1 and one with a mass
of 33.7 kDa. The second species could be due to truncation in the chTPH1 sequence or due to the
presence of an E. coli contaminant protein.
If the second species corresponded to a truncated form of chTPH1 this truncation would be very
specific, generating a species with a specific mass in every single mass spectrum obtained of both
the apo- and holo-form. The other possibility is that the second species could correspond to a
part of another protein which cannot be chromatographic purified from chTPH1 and which
migrates through the SDS-Page exactly as chTPH1 even though the masses are different. From
the iron binding analysis the second species does not bind iron and from the sequence of chTPH1
the three amino acids which coordinate iron are still present in the sequence corresponding to
the truncated version of chTPH1. This suggests that the second species is a part of another
2600 2800 3000
0
50
100
2600 2800 3000
0
50
100
2600 2800 3000
0
50
100
36262.93±0.85
36325.45±1.65
Inte
nsity (
%)
m/z
Intact chTPH1
+12
+12
36197.07±0.18
36262.93±0.85
36325.45±1.65
+12+12+12
+12
+12
+13
+13
+13
+13
+13
+13
Without added Fe or EDTA
With added EDTA
With added Fe
+13
36262.93±0.85
36325.45±1.65

Mass spectrometric analysis
117
protein, which is also consistent with the fact that chTPH1 can be crystallized and a structure of
the protein was solved with electron density from Thr104 to Gln409 (see chapter 10). To solve
this problem the purification method of chTPH1 should be changed in order to obtain a sample of
higher purity. This can be done by affinity tag purification where chTPH1 is fused to for example
GST or MBP.
9.3.2 chTPH2 Before MS analysis of the chTPH2 sample the buffer was changed to 600 mM ammonium acetate
pH 7.0 as described in section 9.2.2. Changing the buffer was necessary because chTPH2 was in a
HEPES buffer with 5 % glycerol and both HEPES and glycerol, especially glycerol, are detrimental
to ESI [197]. After the buffer was changed the protein concentration was approximately 50 µM.
9.3.2.1 Determination of the experimental monomer mass of apo-chTPH2
The experimental monomer mass of apo-chTPH2 was determined as described in section 9.2.4.1.
In figure 9.13 the m/z spectrum of denatured sample of chTPH2 is shown. From the spectrum
only one species is seen with an apparent mass of 36318.67±1.33 Da which corresponds to the
expected average mass of the monomer of apo-chTPH2 including its N-terminal methionine,
36316.46 Da, as given in table 9.5. From the sequence of chTPH2 (see figure 2.3) this protein is
also expected to maintain methionine since the penultimate amino acid is a Glu [195].
Figure 9.13. Spectrum of denatured chTPH2. The buffer was changed to 600 mM ammonium
acetate pH 7.0 using ultrafiltration devices and denatured using ZipTip (C18) and 5 % formic
acid. The sample was eluted from the tip using 1 % formic acid and 50 % acetonitrile.
9.3.2.2 Mass spectrometry of intact chTPH2
After determination of the experimental monomer mass of apo-chTPH2, the mass spectrum of
intact chTPH2 was obtained. This was done as described in section 9.2.4.2 and the spectrum is
800 1600 2400
0
50
100
+24+25
+17
+18
+19
+20
+26+27
+28+29
+41
+40
+38
+36
+37
+34
+30
+31
+32
Inte
nsity (
%)
m/z
apo-chTPH2
36318.67±1.33+33

Mass spectrometric analysis
118
shown in figure 9.14, where figure 9.14A shows the spectrum with m/z range 1500 to 5500,
whereas figure 9.14B are a zoom in with m/z range 2750 to 3150.
A)
B
Figure 9.14. Mass spectrum of 2.4 µM intact chTPH2 in 600 mM ammonium acetate pH 7.0. A)
The full mass spectrum of intact chTPH2 where both a monomer and a dimer are present. The
dimer is due to nonspecific interactions. B) Zoom in on the monomer charge states +13 and +12.
2000 3000 4000 5000
0
50
100
+18+19+14
+11
+12
Inte
nsity (
%)
m/z
Monomer
Dimer
+13
Intact chTPH2
Monomer 36.3 kDa
Dimer 72.6 kDa
2800 3000
0
50
100
+12
+12
+12
+13+13
Inte
nsity (
%)
m/z
+13
Intact chTPH2
36316.14±0.05 - apo-chTPH2
36375.82±0.88 - holo-chTPH2-Fe
36433.52±0.99 - holo-chTPH2-Fe-3H2O

Mass spectrometric analysis
119
In figure 9.14A two species are seen: One with a mass around 36.3 kDa corresponding to a
monomer of chTPH2 and one with a mass of around 72.6 kDa corresponding to a dimer of
chTPH2. By decreasing the concentration of chTPH2 the relative amount of dimer decreases
indicating that the interaction is a non-pecific interaction happening during the electrospray
process, as described in section 9.1.1.5 (data not shown).
The monomer species has three charge state series with masses of 36316.14±0.05 Da,
36375.82±0.88 Da and 36433.52±0.99 Da, respectively, and four charge states +14, +13, +12 and
+11 (figure 9.14B). The apparent mass difference between the three charge states are
approximately 60 Da and 58 Da. The two first masses correspond to apo-chTPH2 (36316.46 Da)
and holo-chTPH2-Fe(II)/Fe(III) (36370.31/36369.31 Da), whereas the latter could correspond to
holo-chTPH2-Fe(II)/(III)-3H2O (36424.35/36423.35 Da) or holo-chTPH2-Fe(II)/(III)-CH3COO-
(36429.3527/36428.3527 Da).
By increasing the declustering and focusing potential in the mass spectrometer the third charge
state series almost disappear, as shown in figure 9.15. This indicates that the series is either due
to non-specific interaction or the binding is too weak to be maintained at high voltage.
Comparing the spectra obtained at high voltage of chTPH1 (figure 9.11B) and of chTPH2 (figure
9.15), the charge state series, which could correspond to binding of either water or acetate to
chTPH, does not disappear for chTPH1 but it does for chTPH2. This could mean that the
interaction between water/acetate and chTPH1 is stronger than the interaction between
water/acetate to chTPH2 due to specific and nonspecific interaction, respectively.
Figure 9.15. Mass spectrum of 2.4 µM intact chTPH2 in 600 mM ammonium acetate pH 7.0 and
obtained at higher declustering (DP 200) and focusing potential (FP 250) compared to figure
9.14 which were DP 150 and FP 200.
2800 3000
0
50
100
36316.14±0.05 - apo-chTPH2
36375.82±0.88 - holo-chTPH2-Fe
+12
+12
+13
Inte
nsity (
%)
m/z
Intact chTPH2
+13

Mass spectrometric analysis
120
9.3.2.3 Iron binding
To assign each of the three charge state series from the intact MS analysis of chTPH2, iron or
EDTA is added to the sample prior to MS analysis as described in section 9.1.4.2. In figure 9.16 the
MS spectra of intact chTPH2 and intact chTPH2 with either EDTA (1:4) or added Fe (1:5) are
shown.
Again four charge states are present, +14, +13, +12 and +11 for each condition but only charge
state +12 and +13 are shown in figure 9.16. By comparing the three spectra the ratios between
the three charge state series are changing depending on the condition of the sample. By adding
Fe only two charge-state series are present corresponding to masses of 36375 Da (holo-chTPH2-
Fe(II)/(III)) and 36434 Da (holo-chTPH2-Fe(II)/(III)-3H2O or CH3COO-). Also, the ratio between the
second and third charge state series decreases indicating that the third series binds iron. By
adding EDTA the ratio of the apo-chTPH2 (first series) and holo-chTPH2-Fe (second series) is
increasing and more of the apo-form is present. This is due to EDTA’s chelating effect. The ratio
of the second and third series in the sample with EDTA is approximately the same as the one in
the sample without Fe or EDTA, indicating again that the third charge state series also contains
iron. The charge state series are therefore assigned as being apo-chTPH2, holo-chTPH2-Fe(II)/(III)
and holo-chTPH2-Fe(II)/(III)-3H2O or maybe holo-chTPH2-Fe(II)/(III)-CH3COO- showing that the
sample is heterogeneous with respect to Fe.
Figure 9.16. Mass spectra of 2.4 µM chTPH2 and 2.4 µM chTPH2 with EDTA (1:4) or Fe (1:5) in 600 mM
ammonium acetate pH 7.0.
2800 3000
0
50
100
0
50
100
0
50
100
+13
+13
+13
With added EDTA
With added Fe
Inte
nsity (
%)
m/z
Without added Fe or EDTA
+12
+12+13
+12
+12
+12
+13
+12
+12
+12
+13
+13
+1336316.14±0.05 - apo-chTPH2
36375.82±0.88 - holo-chTPH2-Fe
36433.42±0.99 - holo-chTPH2-Fe-3H2O

Mass spectrometric analysis
121
The difference seen in iron binding between chTPH2 and chTPH1 is due to the elution pattern
observed in the anion exchange [6,14,142]. In the anion exchange both apo-chTPH2 and holo-
chTPH2-Fe(II)/(III) elutes at the same conductivity, whereas apo-chTPH1 and holo-chTPH1-
Fe(II)/(III) elutes at different conductivities. This is due to a much higher overall charge of chTPH2
compared to chTPH1 and therefore the presence of Fe(II)/(III), which change the overall charge
by +II or +III, does not affect the elution pattern for chTPH2 in the same way as seen for chTPH1.
The chTPH1 is fully loaded with iron prior to MS analysis [12,6,142].
As already discussed in section 9.3.2.3 different scenarios exist for assignment of the third mass
(36433.42 Da), which has an apparent mass of approximately 58 Da higher than the apparent
mass of the second charge state series corresponding to holo-chTPH2-Fe. This mass difference
could be due to three water molecules (54.0462 Da), a second iron (55.847 Da) or a CH3COO-
(59.0445 Da) binding to chTPH2.
9.3.2.4 Substrate/ligand binding
The binding of substrates to chTPH2 was investigated. This was done by adding either
tryptophan, BH2 or BH4 to the chTPH2 sample followed by incubation on ice for 15 min prior to
the mass spectrometric analysis, as described in section 9.2.4.3. In order to investigate the
location and specificity of substrate binding by MS, the enzyme was analyzed in the presence of
different concentration of substrate.
In figure 9.17 the mass spectra of the two charge states, +13 and +12, of chTPH2 without and
with tryptophan in ratios of 1:5, 1:10 and 1:20 (chTPH2:tryptophan) are shown. By incubation of
chTPH2 with tryptophan a second species is seen. This species is present in two charge state
series: One with a mass of 36589.05±1.16 Da and one with a mass of 36643.89±1.85 Da. These
masses could correspond to chTPH2-Fe(II)/(III)-Trp (36574.5382/36573.5382 Da) and chTPH2-
Fe(II)/(III)-Trp-CH3COO- (36634.5906 Da). When the sample is incubated with tryptophan the peak
corresponding to apo-chTPH2 disappears, but holo-chTPH2-Trp (without Fe) cannot be detected
in the spectra. This could be due to a poor resolution between chTPH2 and chTPH2+Trp.
Comparing the apparent mass of holo-chTPH2-Fe and holo-chTPH2-Fe-Trp there is a mass
difference of 213.23 Da and the mass of Trp is 204.23 Da given a Δ10 Da. By increasing the
concentration of tryptophan only one tryptophan is bound to chTPH2. This indicates that the
binding of Trp is specific and it binds to the active site of chTPH2.
BH4 was also added to the sample as well as the inhibitor analog, BH2, in the ratios 1:5, 1:10 and
1:20. In figure 9.18 and 9.19 the sample with added BH2 and BH4 are shown, respectively. By
adding either BH2 or BH4 a second species is seen with a mass of either 36606 Da or 36620 Da
corresponding to a mass of holo-chTPH2-Fe-BH2 (36611.54 Da) or holo-chTPH2-Fe-BH4 (36613.56
Da). By increasing the amount of ligand the ratio between the two species decreases meaning
that the amount of chTPH2-Fe-BH2/BH4 is increased. By increasing the concentration of ligand
only the species with one bound ligand is observed, meaning that the enzyme must bind the
ligand specifically.

Mass spectrometric analysis
122
In the comparison of the apparent mass of holo-chTPH2-Fe and holo-chTPH2-Fe-BH2/BH4 a
difference of 230 Da is due to BH2 (239 Da) and 239 Da is due to BH4 (241 Da). Although, a better
signal-to-noise would be prepared it can be concluded that both BH2 and BH4 binds to chTPH2.
Figure 9.17. Mass spectra of chTPH2 and chTPH2 with tryptophan in the ratio 1:5, 1:10 and
1:20. The buffer was changed to 600 mM ammonium acetate pH 7.2 using ultrafiltration
devices and the concentration determined to 24 µM. Tryptophan in ratios 1.5, 1:10, 1:20
(cTPH2:Trp) were added and the sample was incubated on ice for 15 min. Before analysis the
sample was diluted to a chTPH2 concentration of 2.4-3.5 µM with 600 mM ammonium
acetate pH 7.0.
9.3.2.5 Summary
The MS results indicate that only chTPH2 is present in the sample and that it is heterogeneous
with respect to Fe, indicating that the sample is not fully saturated with iron. On the contrary,
chTPH1 is saturated with iron. This difference is most probably due to the elution pattern and the
overall charge of the two isoforms, as described in section 9.3.2.3. These results have lead to the
addition of iron during purification of chTPH2 in the other project carried out in the
Metalloprotein Chemistry and Engineering Group in order to obtain a homogenous sample for
crystallization.
All three ligands (tryptophan, BH2 and BH4) can bind individually to chTPH2 and their binding did
not change the oligomeric state of TPH. This indicates that the binding of substrate is random. It
would have been more appropriate to saturate the sample with Fe for these ligand binding
studies.
2800 3000
0
50
100
0
50
100
0
50
100
0
50
100
+13+13
+13+13
+13+13
+12+13
+12
+12
+12
+12
+12
+12
+12
+12
+12
+12
+12
+13
chTPH2:Trp (1:20)
chTPH2:Trp (1:10)
chTPH2:Trp (1:5)Inte
nsity (
%)
m/z
chTPH2
+13
+13
chTPH2
36316.14±0.05 Da
36375.82±0.88 Da
36433.52±0.99 Da
+13
+13
chTPH2+Trp
36589.05±1.16 Da
36643.89±1.85 Da

Mass spectrometric analysis
123
Figure 9.18. Mass spectra of chTPH2 and chTPH2 with BH2 in the ratio 1:1, 1:5, 1:10 and 1:20. The
buffer was changed to 600 mM ammonium acetate pH 7.2 using ultrafiltration devices and the
concentration determined to 24 µM. BH2 in ratios 1:1, 1:5, 1:10, 1:20 (chTPH2:BH2) were added
and the sample was incubated on ice for 15 min. Before analysis the sample was diluted to a
chTPH2 concentration of 2.4-3.5 µM with 600 mM ammonium acetate pH 7.0.
Figure 9.19. Mass spectra of chTPH2 and chTPH2 with BH4 in the ratio 1:5, 1:10 and 1:20. The
buffer was changed to 600 mM ammonium acetate pH 7.2 using ultrafiltration devices and the
concentration determined to 24 µM. BH2 in ratios 1:5, 1:10 and 1:20 (chTPH2:BH4) were added
and the sample was incubated on ice for 15 min. Before analysis the sample was diluted to a
chTPH2 concentration of 2.4-3.5 µM with 600 mM ammonium acetate pH 7.0.
2800 3000
0
50
100
0
50
100
0
50
100
0
50
100
+12
+13
+12
+13
+13
+13
+12
+12
+12
+12
+12
+12
+12
+12
+13 +12
+13
+13
+13
+13
chTPH2
chTPH2:BH2 (1:20)
chTPH2:BH2 (1:10)
Inte
nsity (
%)
m/z
chTPH2:BH2 (1:5)
+13
chTPH2
36316.14±0.05 Da
36375.82±0.88 Da
36433.52±0.99 Da
chTPH+BH2
36606.06±0.36 Da
2800 3000
0
50
100
0
50
100
0
50
100
0
50
100
+12
+12
+12
+12
+12
+12
+12
+12
+12
+12
+12
+12
+13
+13
+13
+13
+13
+13
+13
+13
+13
+13+13
Inte
nsity (
%)
m/z
+13
chTPH2+BH4
36619.86±0.19 Da
chTPH2:BH4 (1:20)
chTPH2:BH4 (1:10)
chTPH2:BH4 (1:5)
chTPH2
36316.14±0.05 Da
36375.82±0.88 Da
36433.52±0.99 Da

Mass spectrometric analysis
124
9.3.3 cthTPH2 Prior to MS analysis of cthTPH2 the buffer was changed to 600mM ammonium acetate pH 7.0 as
described in section 9.2.2, and the concentration was 45-55 µM for the monomer.
9.3.3.1 Determination of the experimental monomer mass of apo-cthTPH2
The experimental monomer mass of apo-cthTPH2 was determined as described in section 9.1.4.1.
In figure 9.20 the mass spectrum of the denatured cthTPH2 is shown.
A)
B)
Figure 9.20. Mass spectrum of denatured cthTPH2. The buffer was changed to 600 mM ammonium
acetate pH 7.0 using ultrafiltration devices and denatured using ZipTip (C18) and 5 % formic acid.
The sample is eluted from the tip using 1% formic acid and 50 % acetonitrile.
800 1600 2400
0
50
100
+42
+41
+40
+39
+38
+37
+36
+35
+34
+33
+31
+30+29
+28
+18
+19
+20
+21
+22
+24
+26+25
+23
Inte
nsity (
%)
m/z
Apo-cthTPH2
39832.43±2.83+27
900 1200 1500
0
50
100
+17
+18
+16
+13
+27+28+29
+30
+31+32
+33
+34
+36
+37
+38
+39
+40
+41
+42+43
Inte
nsity (
%)
m/z
Apo-cthTPH2
+35
+14
39832.43±2.83 - cthTPH2
17582.81±1.18 - other species

Mass spectrometric analysis
125
In the spectrum one dominant protein has an apparent average mass of 39831±2.93 Da
corresponding to the expected average mass of the monomer of apo-cthTPH2 including its N-
terminal methionine (39822.4411 Da) as given in table 9.6. As for chTPH2, cthTPH2 is also
expected to have the N-terminal Met presence, due to the same N-terminal sequence of the two
variants.
At the low m/z a smaller protein with an apparent mass of 17582.81±1.18 is present (figure
9.20B). This protein is probably an impurity. By comparing the relative intensity of the two
proteins cthTPH2 is by far more dominant.
9.3.3.2 Determination of the oligomeric state by tandem MS
The oligomeric state of cthTPH2 was determined by tandem MS. First the MS spectrum of intact
cthTPH2 was obtained and is shown in figure 9.21. The spectrum contains two proteins: One with
a mass corresponding to the tetramer of cthTPH2 and one with a mass corresponding to the
octamer form (see figure 9.21A). By decreasing the concentration of cthTPH2 the octamer
disappears (data not shown) and is therefore assigned to be due to nonspecific interaction
created in the ESI process, see section 9.1.1.4.
The tetramer shows 5 charge states, +26-30, centered on a m/z value of 5950 and with an
apparent mass of approximately 160823.52±26.78 Da. This corresponds to the expected mass of
the tetramer of cthTPH2 (159.5 kDa). The increase in apparent mass compared to the expected
mass could be due to non-specific binding of small molecules such as sodium and solvent/buffer
molecules such as H2O and NH4+, which also give rise to broader peaks. By increasing the voltage
in the instrument (DP 150, FP 200), shown in figure 9.21B, the peaks get sharper and less broad
indicating that some nonspecific bound molecules have been removed from the protein. The
apparent mass is also lowered to 159786.30±8.44, which is close to the expected mass of holo-
cthTPH2-Fe(II)-3H2O (159721.33 Da) or holo-cthTPH2-Fe(II)-CH3COO- (159745.36 Da). The
different forms of cthTPH2, such as apo-form and holo-Fe-forms, are more difficult to distinguish
because of the overlapping of broad peaks, if compared to the mass spectrum of chTPH2 (figure
9.14).
The +28 charge state of the intact cthTPH2 was isolated in the quadrupole and the complex
dissociated by collisions with gas molecules in an argon-filled collision cell, as described in section
9.2.4.4. In figure 9.22 the tandem mass spectrum of +28 charge state is shown. Tandem mass
spectrometry of cthTPH2 gives rise to two ion series: A highly charged series of peaks assigned to
a monomeric subunit and a “stripped” oligomer at higher m/z. The monomer mass, 39.8 kDa,
correspond to ¼ of the mass measured of the intact complex, 160 kDa. Stripping of this single
subunit gives rise to a mass of 119 kDa corresponding to a trimer. This result confirms that the
species that was isolated (+28 charge state) is a tetramer. The monomeric subunit has 6 charge
states, +16-21, centered at charge state +20 with a m/z of 2000, whereas the trimer (n-1) has 6
charge states, +8-13, centered at charge state +9 with a m/z of 13300. The charge of the parent
ion is divided between the product ions as expected and described in section 9.1.3. Due to
dissociation into a monomer and trimer and not two dimers it can be concluded that the protein

Mass spectrometric analysis
126
does not contain any intermolecular disulfide bonds. It can be concluded that cthTPH2 can retain
its oligomeric form in the absence of solvent.
A)
B)
Figure 9.21. Mass spectrum of intact cthTPH2 obtained using conditions that preserve non-
covalent interactions and maximize the transmission of large ions. The buffer was changed to
600 mM ammonium acetate pH 7.0 using ultra filtration columns and diluted to 8 µM
(monomer) before MS analysis.
3000 6000 9000
0
50
100
+25
+29
+28
+26
Inte
nsity (
%)
m/z
Intact cthTPH2
Octamer
Tetramer
+27
5600 6400
0
50
100
5600 6400
0
50
100
+29
+28
+26
159786.30±8.44
Inte
nsity (
%)
m/z
Intact cthTPH2
160823.52±26.78
+27
+26+30
+29
+27
+28
Low energy
High energy

Mass spectrometric analysis
127
Figure 9.22. Mass spectrum of intact cthTPH2 and tandem mass spectrum of the +28 charge state,
which was isolated in the quadrupole and the complex dissociated by collisions with gas
molecules in an argon filled collision cell. This gives rise to two ion series products; a highly
charged series of peaks assigned to a monomeric subunit and a “stripped” oligomer at higher m/z.
The monomer mass, 39.8 kDa, correspond to ¼ of the mass measured of the intact complex, 160
kDa. Stripping of this single subunit gives rise to a mass of 119 kDa corresponding to a trimer.
9.3.3.3 Fe binding
cthTPH2 binds Fe and taking a closer look at the highly charged monomer species present in the
tandem mass spectra of the +28 charge state isolated in the quadrupole, it is possible to see the
apo-cthTPH2 (39822.44 Da) as well as the holo-cthTPH2-Fe species, as shown in figure 9.23,
indicating that the energy necessary to dissociate the complex is not enough to fully remove the
Fe.
Figure 9.23. Tandem mass spectrum of the highly charged monomer of cthTPH2.
7000 14000
0
50
100
0
50
100
0
50
100Monomer
Trimer
Tetramer
Tetramer
+29+26
+27
+28
Inte
nsity (
%)
m/z
+28
Tetramer
Tetramer 160 kDa
Trimer 119 kDa
Monomer 39.8 kDa
2100 2200
0
50
100
+18
+18
+19Inte
nsity (
%)
m/z
+19
39823.98±3.74 Da - apo-cthTPH2
39881.54±5.25 Da - holo-cthTPH2-Fe

Mass spectrometric analysis
128
9.3.3.4 Summary
The MS results indicate that the sample almost exclusively contains cthTPH2. The MS/MS results
show that cthTPH2 is a tetramer that dissociates into a monomer and a trimer when increasing
the energy in the collision cell. This also indicates that the variant does not contain any
intermolecular disulfide bonds. The protein can preserve its solution structure in the gas phase.
9.4 Conclusion Mass spectrometry is an extremely useful technique in studying non-covalent protein complexes.
Both by chromatography and electrophoresis the chTPH1 sample was shown to be homogenous,
whereas mass spectrometric characterization of the sample showed that it was heterogeneous
and contained two species. Also the heterogeneity of chTPH2 has been detected by mass
spectrometry, but by purification or electrophoresis this is not observed. Therefore, the use of
MS gave very important results which were impossible to be obtained using other analytical
techniques. These results have also been of fundamental importance to the group who has
changed the purification strategies in order to obtain homogenous samples. Mass spectrometric
characterization also determined that cthTPH2 is a tetramer in a simple and fast way and using
this technique it does not only give the right mass of the variant but also show the dissociation
pattern of the protein complex.

129
10 Crystallization of chTPH1
The determination of the three-dimensional structure of proteins can be done by using X-ray
crystallography. The growth of suitable crystals is important for determination of the structure
and to produce these, pure and concentrated solutions of the protein must be available. So far,
only five structures of the catalytic domain of TPH have been determined: One with bound BH2,
one with tryptophan/imidazole and three with binding of different inhibitors. These structures
showed different coordination of iron where a change in iron coordination from six to five upon
incorporation of tryptophan/imidazole was observed as well as a change in structure (mentioned
in chapter 2). It is still difficult to determine whether or not these observations are due to the
substrate alone or that the imidazole mimics BH4 and therefore, the structural change is caused
by both binding of substrate and pterin (imidazole). A three-dimensional structure of the catalytic
domain without substrate as well as with both substrates binding in the active site is therefore
important for elucidating this iron coordination and the structural changes in the enzyme.
In this chapter a short introduction to protein crystallization with focus on the experimental parts
will be given. This will be followed by description of the crystallization experiments done with
chTPH1 as well as the collected diffraction data and structure solution.
10.1 Crystallization of proteins The crystallization process of proteins consists of two phases: A nucleation phase and a growth
phase, in which both are driven by creation of a supersaturated state (non-equilibrium state)
[198,199]. Before crystals can grow, stable nuclei must be formed. These are small aggregates of
protein molecules that are formed in the supersaturated state. The probability and amount of
stable nuclei formation (nucleation) are dependent on the degree of supersaturation [200].

Crystallization of chTPH1
130
The supersaturated state is divided into two regions: A metastable region and a labile region. In
the metastabile region, which is just above saturation, nucleation cannot occur but crystal growth
can continue if stable nuclei have already been formed. In the labile region, which is at higher
supersaturation, nuclei can form spontaneously. Therefore, the degree of supersaturation
necessary for nucleation is higher than that for crystal growth and at high supersaturation degree
a large number of nucleation might occur [198,200]. When stable nuclei have been formed the
protein molecules will start to order themselves into a crystal lattice with bonds that are
energetically more favorable than the supersaturated state of the protein. This drives crystal
growth. The crystal will continue to grow until the system regains its equilibrium where the
protein concentration is decreased to the point of saturation [200]. Both the nucleation rate and
growth rate are dependent on the degree of supersaturation; the higher the degree of
supersaturation is the faster the growth of crystals is. A problem with too fast growth rate is that
more growth defects can be seen [198,199]. Therefore, ideal crystal growth is where the degree
of supersaturation is just high enough to get nucleation, which is just beyond the metastable
region [199,200].
Proteins are sensitive and labile macromolecules that readily lose their native structure and the
stability of crystals in aqueous media is restricted to a narrow range of pH, temperature and ionic
strength. Therefore, protein crystals must be grown from a solution, which is known as the
mother liquor [198,200]. Determination of the optimal crystallization conditions are not as
straight forward as it might seem and usually a large range of growth conditions must be
screened. This can be done by using pre-produced crystallization screens based on different
solutions that have already been shown to be successful in crystallization of numerous proteins
[198].
An important parameter in crystallization is the purity of the protein sample. It is not an absolute
requirement but often crystals obtained from a mixture of proteins are small, not well shaped
and of bad diffraction quality. By purity it is not only meant in terms of contaminants but also in
terms of conformation and structural micro-heterogeneities, which often affect crystal growth. If
crystallization is unsuccessful an improvement or reconsideration of the purification procedures
needs to be studied first [198].
10.1.1 The vapor diffusion methods There exist different methods to crystallize proteins and one of the most used method is the
vapor diffusion method using either hanging drops or sitting drops, where only small volumes of
protein are required [201].
The concept of the vapor diffusion methods is that a droplet containing the protein to be
crystallized with buffer and precipitating agents is equilibrated against a reservoir containing a
solution of the precipitating agents. The concentration of crystallizing agents in the drops is
typically half of the concentration in the reservoir. This causes the volatile species such as water
or organic solvents to vapor diffuse until the vapor pressure in the droplet equals the one of the
reservoir and equilibrium has been reached. As a consequence the protein concentration, which
Crystallization of chTPH1
131
starts at an undersaturated state, will increase in the droplet and eventually reach the
supersaturated state [201].
10.1.2 Factors influencing crystal growth To achieve a limited degree of supersaturation, just beyond the metastabile region, the physical
properties of the protein solution needs to be modified in order to reduce the solubility of the
protein. This can be achieved by either changing the pH, temperature or through equilibration
with precipitating agents [198,199,200].
10.1.2.1 Precipitating agents
Precipitating agents (precipitants) has two functions: One is to decrease the solubility of the
protein and thereby achieve the supersaturated state faster and one is to cause vapor diffusion.
In the vapor diffusion method the initial precipitant concentration in the non-equilibrated drop is
half of that in the reservoir, which results in water diffusion until equilibrium is reached
increasing the protein concentration. Different types of precipitants are used and these are
typically categorized into four groups: Salts, organic solvents, long-chain polymers and low-
molecular-mass polymers/non-volatile organic compounds. Examples of salts and organic
solvents are ammonium sulfate and ethanol, respectively, whereas long-chain polymers are
polyethylene glycol (PEG) 4000. The latter group are typically compounds such as
methylpentanediol and PEG of molecular weight less than 1000 [199,200]. PEGs and salts are the
most used and only these will be described in the following.
The solubility of proteins is highly affected by the ionic strength of the solutions. At very low ionic
strength no ions are available to satisfy the electrostatic requirements of the protein and
therefore, protein molecules seek to interact with one another to satisfy their electrostatic
requirements, thus leading to aggregation or crystal formation. This process is known as “salting-
in” and can be achieved by removing salt ions from the solution *200]. In the opposite process,
known as “salting-out”, where salt ions are used as precipitant, the salt ions will “dehydrate” the
protein by competition for water molecules. Proteins bind water molecules on their surface to
maintain their solubility and in highly concentrated salt solutions there is a competition between
the salt ions and the protein for the binding of water molecules. At sufficiently high
concentrations the amount of water molecules available for the protein will be decreased causing
the protein to associate with one another in order to satisfy their electrostatic requirements. In
this environment ordered crystals as well as disordered amorphous precipitate may form
[199,200]. Multivalent ions, particularly anions, are the most efficient precipitants and sulfates,
phosphates and citrates have been used with success [200].
PEGs dehydrate proteins in solution by the volume exclusion effect [199,200]. They are randomly
and flexible in structure and occupies a large volume. By adding PEGs to a protein solution it
reduces the solvent available space for the protein molecules resulting in aggregation of protein
molecules [199]. PEG is produced in various lengths and molecular sizes from 400 to 20,000
[200].

Crystallization of chTPH1
132
10.1.2.2 pH and temperature
A solutions pH value affects the solubility of a protein due to change in the proteins net charge.
At the pI value, where the net charge of the protein is zero, the solubility of the protein is at its
minimum. By increasing the net charge of the protein the solubility increases [202]. The
temperature is also an important factor that affects the solubility of a protein where the solubility
varies as a function of temperature. Usually the solubility increases with increasing temperature
in low ionic strength conditions such as PEG solutions. At high ionic strength proteins are
generally less soluble at high temperatures. If the protein is unstable at high temperatures,
crystallization at low temperatures will be of choice, due to stabilization of the protein, which
increases the probability of crystal growth [203].
10.2 Experimental procedures
10.2.1 Materials The Solubility screen and the Structure screen 1 and 2 (appendix A.3) were both obtained from
Molecular Dimensions. Tryptophan was obtained from Sigma and BH2 was obtained from Schirks
Laboratories. The trays used were either CombiClover sitting drop trays from Jena Biosciences
with four satellite drop chambers connected to a central reservoir or VDX greased plates hanging
drop trays from Hampton Research.
10.2.2 Preparation of sample The chTPH1 for the crystallization experiments was purified as described in chapter 8 except that
20 mM Tris/NaOH, 100 mM (NH4)2SO4 pH 8.5 was used as gel filtration buffer. The concentration
of the sample was 2.5 mg/ml. The concentrated sample was frozen in 100 µl aliquots using liquid
N2 and stored at -80oC until use.
For crystallization stock solutions of chTPH1 was thawed on ice. Four different samples were
prepared: One with only chTPH1, one with chTPH1 and tryptophan, one with chTPH1 and BH2 and
one with chTPH1 and both tryptophan and BH2. The samples were prepared by diluting the
chTPH1 from the stock solutions to the desired concentration with 20 mM Tris/NaOH, 100 mM
(NH4)2SO4 pH 8.5 after addition of ligand, if needed. The ligands were added in 2 fold molar
excess from 7 mM stock solutions.
10.2.3 Crystallization trials using crystal screens The Solubility screen and the Structure screen 1 and 2 were used and the crystallization trials
were conducted using vapor diffusion method with sitting drop. The screens were set up with
four drops, one drop from each sample prepared as described in section 10.2.2, per reservoir.
250 µl of reservoir solution was added to the each reservoir. The chTPH1 concentration in the
non-equilibrated drops was 2 mg/ml with 2 time’s molar excess of tryptophan, BH2 or both. The
drops were set up with 2 µl reservoir solution + 2 µl of the protein solution. The trays were stored
at room temperature.

Crystallization of chTPH1
133
10.2.4 Crystallization trials using cggTPH1 conditions chTPH1 was also set up using the same condition where cggTPH1 showed to crystallize [13]. 250
µl of 22.5 % PEG10,000, 0.2M imidazole malat pH 8.5 was added to the reservoir of a sitting drop
vapor tray. Four drops were added, one drop from each sample prepared as described in section
10.2.2, per reservoir using 2 µl reservoir solution + 2 µl of the protein solution. The trays were
stored at room temperature.
10.2.5 Optimization trials Results obtained from section 10.2.3 and 10.2.4 were further optimized using different
concentration of precipitant, different concentration of protein and different temperatures. The
different optimization screens were prepared as described in section 10.2.5.1, 10.2.5.2 and
10.2.5.3 and given in appendix A.3.
10.2.5.1 Optimization screen 1
Three screens of the optimization screen 1 were set up using 1 mg/ml, 1.5 mg/ml or 2 mg/ml of
chTPH1, respectively. These optimization trials were conducted using vapor diffusion method
with sitting drop. The screens were set up with four drops, one drop from each sample prepared
as described in section 10.2.2, per reservoir. 250 µl of reservoir solution was added to the each
reservoir. The drops were set up with 2 µl reservoir solution + 2 µl of the protein solution. The
trays were stored at room temperature.
10.2.5.2 Optimization screen 2
The best conditions (precipitant concentration, protein concentration) for crystal growth of
chTPH1 seen from the optimization screen 1 (section 10.2.5.1) were used and conducted using
hanging drop vapor diffusion. The drops were set up with 2 µl reservoir solution + 2 µl of the
protein solution and having 500 µl in the reservoir. Two screens with these conditions were set
up: One stored at room temperature and one stored at +4oC.
10.2.5.3 Optimization screen 3
The optimization screen 3 contained the most suitable condition of the reservoir solution
obtained from section 10.2.5.1 and 10.2.5.2 at different pH values. One drop of chTPH1 with or
without ligands (sample prepared as described in section 10.2.2) were set up per reservoir
solution using the hanging drop vapor diffusion method. The drops were set up with 2 µl
reservoir solution + 2 µl of the protein solution and having 500 µl in the reservoir using the
hanging drop vapor diffusion method. The trays were stored at room temperature.
10.2.6 Data collection Several crystals were tested on Beamline I911-3 and I911-2 at the MaxLab synchrotron in Lund.
The crystals were transferred to a cryo-buffer (see appendix A.3), mounted in loops (from
Molecular Dimensions) and cryo-cooled immediately. For testing the crystals the loop was
centered in the x-ray beam. If the crystal gave a good diffraction a data set of the full diffraction
pattern was collected.

Crystallization of chTPH1
134
10.2.7 Data processing, structure solution and refinement Data processing and structure solution was done using the program CCP4 and molecular
replacement using the structure of chTPH1 (1MLW) and Phaser in CCP4 [204]. The refinement
was done in WinCoot using Refmac [205].
10.3 Results and discussion
10.3.1 Crystallization trials Crystallization trials of chTPH1 were done using two pre-produced crystal screens as described in
section 10.2.3 and using the same condition where cggTPH1 crystallized as described in section
10.2.4. Crystals were observed within a week in several drops both with and without ligands.
Approximately half of these drops contained calcium which could form CaSO4 with the sulfate
from the chTPH1 buffer and from the shape of the crystals these where concluded to be CaSO4
crystals.
From the Solubility screen it was seen that chTPH1 crystallized with or without ligands in
ammonium citrate pH 9, ammonium sulfate pH 9 and sodium acetate pH 4.5. The crystals from
sodium acetate pH 4.5 showed to be salt crystals of most probably NaSO4. chTPH1 also
crystallized without ligands and with BH2 at the same conditions were cggTPH1 crystallized. Even
though imidazole was present in the precipitant and the structure of cggTPH1 shows to contain
an imidazole (see chapter 2) it was still decided to go further with these crystals, see section
10.3.1.1. From the Structure screen 1 and 2 crystals were observed in several drops and marked
with a red arrow in appendix A.3.
The size, shape and amount of crystals were compared from all screens to find the most suitable
condition for further optimization trials. By comparing the crystals obtained using the solubility
screen it was seen that the amount of crystals increased whereas the size decreased by
increasing the concentration of either ammonium citrate pH 9 or ammonium sulfate pH 9.0.
Therefore, it was chosen to use the two lowest concentrations in the optimization screen 1 (see
section 10.2.5.1) as well as concentrations lower than these. From the structure screens only
solution number 15 and 32 from screen 1 and number 14 and 28 from screen 2 were used.
10.3.1.1 Data collection on crystallization trials
Crystals obtained from the same condition where cggTPH1 crystallized (22.5 % PEG10,000, 0.2 M
imidazol malat pH 8.5) without ligands as well as the condition in solubility screen box 1 set N nr.
3a (1.1 M ammonium citrate pH 9.0) with tryptophan were tested on Beamline I911-3 at the
MaxLab synchrotron in Lund as described in section 10.2.6. In figure 10.1 pictures of these
crystals are shown. Crystals obtained from 1.1 M ammonium citrate pH 9.0 diffracted to a 7-8 Å
resolution, whereas crystals obtained from the solubility screen diffracted to 4 Å resolution. A
dataset of the latter crystal was collected. The testing on the synchrotron was done immediately
after mounting and cryo-cooling of the crystals (the crystals were not stored).

Crystallization of chTPH1
135
A) B)
Figure 10.1. A) Crystal of chTPH1 crystallized with 22.5 % PEG10.000, 0.2 M imidazole malat pH
8.5, chTPH1 concentration was 2.0 mg/ml and the drops were stored at room temperature. B)
Crystal of chTPH1 and tryptophan crystallized with 1.1 M ammonium citrate pH 9.0, chTPH1
concentration was 2.0 mg/ml and the drops were stored at room temperature.
10.3.1.2 Data processing, structure solution and refinement
Data collection (section 10.3.1.1), data processing, structure solution and refinement were done
with help from Associate Professor Ole Kristensen from Department of Medicinal Chemistry,
Faculty of Pharmaceutical Sciences, University of Denmark. The structure was determined by
molecular replacement using chTPH1 (PDB entry 1MLW) as search model. The refinement was
carried out using Refmac in WinCoot, as described in section 10.2.7. In table 10.1 the data
statistics for the space group is given.
Table 10.1. Data collection and processing statistics for the chTPH1 crystal.
Space group P222
Crystallization conditions 22.5 % PEG10,000, 0.2 M imidazole malat pH 8.5
Sitting drop, room temperature
X-ray source I911-3, MAXII, MaxLab Lund
Detector Marmosaic 225
Wavelength 1.00
Data collection temperature (K) 100 K
Resolution limit (Å) 50.7 – 4.0
No. reflections 46647
Unique reflections 12486
Redundancy 3.7
Completeness (%) 92.6
Rmerge 0.236
<I/σ(I)> 4.8
Unit cell parameters
a (Å), b (Å), c (Å)
α (o), β (
o), γ (
o)
84.1, 123.6, 148.4
90.0, 90.0, 90.0
Solvent content (%) 53.8
Matthews coefficient (Å3Da
-1) 2.66
Nmol/assym. 4
.
.

Crystallization of chTPH1
136
10.3.1.3 Summary
From the crystallization trials of chTPH1 (see section 10.3.1), chTPH1 could crystallize with and
without ligands at several conditions. Two crystals of chTPH1 without and with tryptophan were
tested on the synchrotron to resolution of 4 Å and 7-8 Å, respectively. A dataset of the chTPH1
without ligands was obtained. Further optimizations needed to be done to obtain bigger and
better crystals. The crystals of especially chTPH1 with tryptophan and BH2 were very small and
the amount of crystals were high (many nucleation sites).
10.3.2 Optimization trials To obtain bigger crystals and to get crystals with a higher resolution, different optimization
screens with a change in protein concentration, precipitant concentration, pH values and
temperature were performed as described in section 10.2.5.1, 10.2.5.2 and 10.2.5.3 and given in
appendix A.3.
After 6 weeks no crystals were observed in the optimization screen 2, which was stored at +4oC,
whereas crystals were observed in several drops within the 1-2 weeks in the two other
optimization screens, but no change in size, shape or amount of crystals were observed. Most of
the crystals of chTPH with and without ligands from the crystallization trials (described in section
10.3.1) could be reproduced, but not all of them. Crystals of chTPH1 with tryptophan crystallized
with 1.1 M ammonium citrate pH 9.0 obtained from the crystallization trials described in section
10.3.1 could not be reproduced. In table 10.2 the most suitable conditions for crystallization of
chTPH1 with and without ligands are given.
Table 10.2. The different conditions for crystallization of chTPH1 with and without ligands.
Sample Conditions
chTPH1 and tryptophan 1 mg/ml protein
1.4 M ammonium citrate pH 9.0
chTPH1 and tryptophan 2 mg/ml protein
1.75 M (NH4)2SO4 pH 9.0
chTPH1 and tryptophan+BH2 1.5 mg/ml protein
2 M (NH4)2SO4 pH 9.0
chTPH1 2 mg/ml protein
22.5 % PEG10,000, 0.2 M imidazole malat pH 8.5
chTPH1 and BH2 2 mg/ml protein
22.5 % PEG10,000, 0.2 M imidazole malat pH 8.5
chTPH1 2 mg/ml protein
0.1 M Na HEPES, 20 % w/v PEG 10,000 pH 7.5
chTPH1 and BH2 2 mg/ml protein
0.1 M Na HEPES, 20 % w/v PEG 10,000 pH 7.5

Crystallization of chTPH1
137
10.3.3 Overall structure of chTPH1 The structure of chTPH1 determined from the dataset described in section 10.3.1.2 could be
refined to Rfree = 33.5 %. Due to the low resolution only a “rough” refinement was done and
water molecules were not included in the structure. The structure contained 4 molecules in the
asymmetric unit. All four molecules have a well defined electron density from Thr104 to Lys400.
For molecule A the last visible residue in the chTPH1 structure is Gln409. The overall structure is
shown in figure 10.2 with the residues Thr104 to Gln409. Electron density is observed for the iron
coordinated by His272, His277 and Glu317 (see figure 10.3).
Figure 10.2. Overall structure of chTPH1 determined at 4 Å resolution. His272,
His273 and Glu317 are shown with sticks and the iron as a brick red sphere.
The amino acid from 125 to 130 is highlighted in blue and the electron density
map for this region is shown in figure 10.4. The figure was made using pymol
[47].
The largest differences between this structure and the chTPH1 crystallized with BH2 are observed
at residue Tyr125 to Asp130, as shown in figure 10.4, where the electron density of chTPH1 is
changed and has another conformation. The density observed is continuous and it is tempting to
model the residues, so they are located in this density, but they are not able to fit. From the
crystal structure of the catalytic domains described in chapter 2 it is known that this loop change
conformation upon tryptophan binding indicating that it is flexible. This could be the reason why
some of the electron density is “missing”.
The precipitant contained imidazole, which coordinates to the iron in the cggTPH1, but from the
electron density of chTPH1 no density is observed for imidazole. Therefore, it can be speculated
that it does not bind to the active site, but it is difficult to conclude due to the low resolution.

Crystallization of chTPH1
138
Figure 10.3. Electron density (1.08 σ) of the iron coordinated by His272,
His277 and Glu317.
Figure 10.4. Electron density (1.08 σ) of amino acid Tyr125 to Asp130.
10.3.4 Future experiments From the mass spectrometric analysis of chTPH1 (chapter 9), a second species is observed in the
sample. This species could not be observed with any other technique used. As mentioned in
Tyr125 Asp130
His277
His272
Glu317
Fe

Crystallization of chTPH1
139
section 10.1 an important parameter in crystallization is the purity of the protein sample and
crystals obtained from a mixture of proteins are often small, not well shaped and of bad
diffraction quality. Therefore an improvement of the purification method of chTPH1 should be
considered in order to obtain a more pure sample.
Additionally, to achieve better and bigger crystals of chTPH1 without ligands it could be tried to
decrease the growth rate. +4oC has been tried with no success, but using a temperature of 15oC
could be enough to slow down the process and still get nucleation and crystal growth. For
crystallization of chTPH1 with tryptophan and tryptophan+BH2 streak seeding should be tried
where a concentration of the precipitant corresponding to the metastable zone is used.
10.4 Conclusion Crystals of chTPH1 crystallized with and without ligands were produced and a dataset of the
crystals of chTPH1 without ligands were collected to 4 Å. The structure could be solved in space
group P222 by molecular replacement. The structure was refined to Rfree of 33.5 %. It was
possible to build most of the protein chain and some overall structural differences are observed
compared to the structure of chTPH1 with BH2. This is the first structure of chTPH1 without any
substrates or inhibitors present in the active site and only the six structure of human TPH.


141
11 Overall conclusion
The main goal of this project was to purify full-length hTPH1. The purification strategy was based
on results obtained during my master project. These results showed that hTPH1 most probably
exists as a membrane-associated complex which can not bind to any of the ion exchange columns
applied. Therefore, it was necessary to develop a method which could eliminate these
interactions in order to get it to bind to the ion exchange columns. This was done by incubating
the protein solution with detergent. The incubation with detergent showed to successfully
solubilize the membrane-associated hTPH1, thus decreasing the size of hTPH1, causing it to bind
to the column. This was the first time full-length hTPH1 could bind to an ion exchange column.
Difficulties in understanding the behavior of full-length hTPH1 were still observed during
purification and from the elution pattern the protein was still present in different oligomer forms.
From earlier solubility test of chTPH2, cthTPH2 and full-length hTPH2 performed in this group it
was observed that presence of the regulatory domain caused the protein to be insoluble
[6,57,104]. Due to these observations and the difficulties during purification of full-length hTPH1
as well as the fact that chTPH1, chTPH2 and cthTPH2 can be purified in a simple way [6,14,57], it
was speculated that the problems with purifying full-length hTPH1 could be due to the regulatory
domain. In order to understand and elucidate the properties of full-length TPH, a “divide-and-
conquer” strategy was applied where different variants of hTPH containing the regulatory domain
or parts of the domain were constructed.
From expression and solubility test of the constructed variants it was observed that mutations in
the 3,4-hydrophobic repeat of the regulatory domain as well as truncations in N-terminal had a
negative influence on the solubility and caused the protein to be insoluble. Despite this, the
rhTPH1 as well as the two fusion proteins: rhTPH1-GFP and GST-rhTPH1, respectively showed to
be soluble and therefore these variants were used for further studies and purification attempts
Overall conclusion
142
were performed. From these results the same elution pattern, as observed for full-length hTPH1
solubilized with detergent, was seen indicating that the variant was present in different oligomer
forms. By having a high concentration of salt in the raw cell extract rhTPH1 elutes in one
oligomeric form. From these results it was concluded that salt stabilizes the variant and a
purification strategy based on this was designed and rhTPH1 was therefore fused to GST. The
GST-rhTPH1 fusion protein was successfully purified with a high concentration of salt in the buffer
system and the GST was successfully cleaved. The high salt purification strategy developed for
rhTPH1 might be the key to purification of full-length hTPH1. rhTPH1 could be successfully
purified.
In my master project a method for expression and purification of chTPH1 was successfully
developed and other members of the group had developed methods for purifying both chTPH2
and cthTPH2 [6,57]. Characterization of these three variants was therefore performed. The
apparent Km values for all three substrates of chTPH1 were determined. These were compared
with the values of chTPH2 determined by Michael S. Windahl [6]. Substrate inhibition by
tryptophan is observed for chTPH1 above 40 M but was not observed for chTPH2 at
concentrations up to 100 M. Large differences are observed between the Km values of the two
isoforms especially the Km,BH4 which is more than a factor 10 higher for chTPH1 than for chTPH2.
This large difference might be a result of the substrate inhibition by tryptophan.
Mass spectrometric analysis of chTPH1, chTPH2 and cthTPH2 showed that the purified chTPH1
was heterogenous and contained two species. Both by chromatography and electrophoresis the
chTPH1 sample was shown to be homogenous. chTPH2 showed to be heterogeneous with
respect to Fe, indicating that the sample is not fully saturated with iron. This could not be
observed either by purification or electrophoresis. Therefore, the use of MS gave very important
results which were impossible to observe using other analytical techniques and these results
have also been of fundamental importance to the group who has changed the purification
strategies in order to obtain homogenous samples. Additionally, the mass spectrometric results
showed that all three ligands (tryptophan, BH2 and BH4) can bind individually to chTPH2 and their
binding did not change the oligomeric state of TPH. Mass spectrometric analysis also determined
that cthTPH2 is a tetramer indicating that it preserves its solution structure in the gas phase.
Mass spectrometry can therefore be used in the analysis of TPH variants in a simple and fast way.
Despite the fact that the chTPH1 sample showed to be heterogeneous it was possible to
crystallize the variant. Crystallization conditions of chTPH1 with and without ligands were found
and several crystals were grown. The best crystal diffracted to 4 Å and a data set was collected.
The structure was solved by molecular replacement and refined to a Rfree of 33.5 %. Structural
differences were observed between chTHP1 without bound ligands and chTPH1 with bound BH2.
Further research on both isoforms is necessary to fully understand the enzymes and knowledge
on these will aid to the understanding of the two serotonergic systems as well as the biochemical
role of serotonin.

143
12 Bibliography [1] A. Martinez, P. M. Knappskog and J. Haavik, A structural approach into human tryptophan
hydroxylase and its implications for the regulation of serotonin biosynthesis, Curr. Med. Chem., 8, 2001, 1077-1091
[2] S. M. Mockus and K. E. Vrana, Advances in the molecular characterization of tryptophan
hydroxylase, J. Mol. Neurosci., 10, 1998, 163-179 [3] I. Lucki, The spectrum of behaviors influenced by serotonin, Biol. Psychiatry., 44, 1998, 151-162 [4] http://www.psykiatrifonden.dk/Forside/Psykiske+sygdomme (29.06.2010) [5] K. M. Fisher and P. G. Nielsen, Cloning and expression of tryptophan hydroxylase, Department of
Chemistry, Technical University of Denmark, Kgs. Lyngby, 2002, B.Sc. thesis [6] M. S. Nielsen, Expression, purification and characterization of tryptophan hydroxylase,
Department of Chemistry, Technical University of Denmark, Kgs. Lyngby, 2007, Ph.D. dissertation [7] C. R. Petersen, Production, chromatographic purification and crystallization of the catalytic
domain from Gallus gallus tryptophan hydroxylase isoform 1, Department of Chemistry, Technical University of Denmark, Kgs. Lyngby, 2006, M.Sc. thesis
[8] A. Munch, Chromatographic purification and stability studies of the catalytic domain of
tryptophan hydroxylase isoform 1, Department of Chemistry, Technical University of Denmark, Kgs. Lyngby, 2006, M.Sc. thesis
[9] M. S. Nielsen, Purification of tryptophan hydroxylase variants and the crystal structure of
Pyrococcus furiosus [Fe3S4]-ferredoxin, Department of Chemistry, Technical University of Denmark, Kgs. Lyngby, 2004, M.Sc. thesis
Bibliography
144
[10] C. R. Petersen and T. V. Rasmussen, Purification and stabilization of the catalytic domain of
tryptophan hydroxylase, Department of Chemistry, Technical University of Denmark, Kgs. Lyngby, 2004, B.Sc. thesis
[11] J. Boesen and M-J. K. Klitgaard, Cloning and chromatographic purification of full-length tryptophan
hydroxylase (in Danish), Department of Chemistry, Technical University of Denmark, Kgs. Lyngby, 2004, B.Sc. thesis
[12] M. S. Nielsen, C. R. Petersen, A. Munch, T. V. Vendelboe, J. Boesen, P. Harris and H. E. M.
Christensen, A simple two step procedure for purification of the catalytic domain of chicken tryptophan hydroxylase 1 in a form suitable for crystallization, Protein Expression Purif., 57, 2008, 116-126
[13] M. S. Windahl, C. R. Petersen, H. E. M. Christensen and P. Harris, Crystal structure of tryptophan
hydroxylase with bound amino acid substrate, Biochemistry, 47, 2008, 12087-12094 [14] J. Boesen, Cloning, production and chromatographic purification of human tryptophan
hydroxylase isoform 1 variants and initial kinetic studies (in Danish), Department of Chemistry, Technical University of Denmark, Kgs. Lyngby, 2007, M.Sc. thesis
[15] P. F. Fitzpatrick, Mechanism of aromatic amino acid hydroxylation, Biochemistry, 41, 2003, 14083-
14091 [16] P. F. Fitzpatrick, Tetrahydrobiopterin-dependent amino acid hydroxylases, Annu. Rev. Biochem.,
68, 1999, 355-381 [17] P. F. Fitzpatrick, The aromatic amino acid hydroxylases, in: Advances in enzymology and related
areas of molecular biology, 74, Editor Purich, John Wiley & Sons, Inc. New York, 2000, 235-294 [18] N. Carkaci-Salli, J. M. Flanagan, M. K. Martz, U. Salli, D. J. Walther, M. Bader and K. E. Vrana,
Functional domains of human tryptophan hydroxylase 2 (hTPH2), J. Biol. Chem., 281, 2006, 28105-28112
[19] K. E. Vrana, S. J. Walker, P. Rucker and X. Liu, A Carboxyl terminal leucine zipper is required for
tyrosine hydroxylase tetramer formation, J. Neurochem., 63, 2014-2020 [20] M. Thórólfsson, B. Ibarra-Molero, P. Fojan, S. B. Petersen, J. M. Sanchez-Ruiz and A. Martínez, L-
Phenylalanine binding and domain organization in human phenylalanine hydroxylase: a differential scanning calorimetry study, Biochemistry, 41, 2002, 7573-7585
[21] S. Kaufman, The enzymatic conversion of phenylalanine to tyrosine, J. Biol. Chem., 226, 1957, 511-
524 [22] T. Flatmark and R. C. Stevens, Structural insight into the aromatic amino acid hydroxylases and
their disease-related mutant forms, Chem. Rev., 99, 1999, 2137-2160 [23] T. Nagatsu, M. Levitt and S. Udenfriend, Tyrosine hydroxylase, the first step in norepinephrine
biosynthesis, J. Biol. Chem., 239, 1964, 2910-2917 [24] P. M. Knappshog, T. Flatmark, J. Mallet, B. Lüdecke and K. Bartholomé, Recessively inherited L-
DOPA-responsive dystonia caused by a point mutation (Q381K) in the tyrosine hydroxylase gene, Hum. Mol. Genet., 4, 1995, 1209-1212
Bibliography
145
[25] B. Lüdecke, P. M. Knappshog, p. T. Clayton, R. A. H. Surtees, J. D. Clelland, S. J. R. Heales, M. P.
Brand, K. Bartholomé and T. Flatmark, Recessively inherited L-DOPA-responsive parkinsonism in infancy caused by a point mutation (L205P) in the tyrosine hydroxylase gene, Hum. Mol. Genet., 5, 1996, 1023-1028
[26] D. J. Walther, J.-U. Peter, S. Bashammakh, H. Hörtnagl, M. Voits, H. Fink and M. Bader, Synthesis of
serotonin by a second tryptophan hydroxylase isoform, Science, 299, 2003, 76 [27] W. Lovenberg, E. Jequier and A. Sjoerdsma, Tryptophan hydroxylase: measurement in pineal
gland, brainstem, and carcinoid tumor, Science, 155, 1967, 217-219 [28] P. D. Patel, C. Pontrello and S. Burke, Robust and tissue-specific expression of TPH2 versus TPH1 in
rat raphe and pineal gland, Biol. Psychiatry, 55, 2004, 428-433 [29] A. Slominski, A. Pisarchik, O. Johansson, C. Jing, I. Semak, G. Slugocki and J. Wortsman, Tryptophan
hydroxylase expression in human skin cells, Biochem. Biophys. Acta, 1639, 2003, 80-86 [30] H. Hasegawa, M. Yanagisawa, F. Inoue, N. Yanaihara and A. Ichiyama, Demonstration of non-
neural tryptophan 5-mono-oxygenase in mouse intestinal mucosa, Biochem. J. 248, 1987, 501-509 [31] P. Zill, A. Büttner, W. Eisenmenger, H.-Jürgen Möller, M. Ackenheil and B. Bondy, Analysis of
tryptophan hydroxylase I and II mRNA expression in the human brain: a post-mortem study, Journal of Psychiatric Research, 41, 2007, 168-173
[32] X. Zhang, J.-M. Beaulieu, T. D. Sotnikova, R. R. Gainetdinov and M. G. Caron, Tryptophan
hydroxylase-2 controls brain serotonin synthesis, Science, 305, 2004, 217 [33] D. J. Walther and M. Bader, A unique central tryptophan hydroxylase isoform, Biochem.
Pharmacol., 66, 2003, 1673-1680 [34] http://www.invitrogen.com/site/us/en/home/Products-and-
services/Applications/Cloning/Vector-Design-Software/Vector-NTI-Software.html (25.06.10) [35] Gasteiger E., Gattiker A., Hoogland C., Ivanyi I., Appel R.D., Bairoch A., ExPASy: the proteomics
server for in-depth protein knowledge and analysis, Nucleic Acids Res. 31, 2003, 3784-3788 [36] L. Wang, H. Erlandsen, J. Haavik, P. M. Knappskog and R. C. Stevens, Three-dimensional structure
of human tryptophan hydroxylase and its implications for the biosynthesis of the neurotransmitters serotonin and melatonin, Biochemistry, 41, 2002, 12569-12574
[37] H. Erlandsen, F. Fusetti, A. Martinez, E. Hough, T. Flatmark and R. C. Stevens, Crystal structure of
the catalytic domain of human phenylalanine hydroxylase reveals the structural basis for phenylketonuria, Nat. Struct. Biol., 4, 1997, 995-1000
[38] K. E. Goodwill, C. Sabatier, C. Marks, R. Raag, P. F. Fitzpatrick and R. C. Stevens, Crystal structure of
tyrosine hydroxylase at 2.3 Å and its implications for inherited neurodegenerative diseases, Nat. Struct. Biol., 4, 1997, 578-585
[39] E. L. Hegg and L. Que Jr., The 2-his-1-carboxylate facial triad, Eur. J. Biochem., 250, 1997, 625-629 [40] P. C. A. Bruijnincx, G. von Koten and R. J. M. K. Gebbink, Mononuclear non-heme iron enzymes
with the 2-his-1-carboxylate facial triad: recent developments in enzymology and modeling studies,Chem. Soc. Rev., 37, 2008, 2716-2744

Bibliography
146
[41] O. A. Andersen, T. Flatmark and E. Hough, Crystal structure of the ternary complex of the catalytic
domain of human phenylalanine hydroxylase with tetrahydrobiopterin and 3-(2-thienyl)-L-alanine, and its implications for the mechanism of catalysis and substrate activation, J. Mol. Biol., 320, 2002, 1095-1108
[42] O. A. Andersen, A. J. Stokka, T. Flatmark and E. Hough, 2.0 Å resolution crystal structure of the
ternary complexes of human phenylalanine hydroxylase catalytic domain with tetrahydrobiopterin and 3-(2-thienyl)-L-alanine or L-norleucine: substrate specificity and molecular motions related to substrate binding, J. Mol. Biol., 333, 2003, 747-757
[43] G. Cianchetta, T. Stouch, W. Yu, Z.-C. Shi, L. W. Tari, R. V. Swanson, M. J. Hunter, I. D. Hoffman and
Q. Liu, Current Chemical Genomics, 4, 2010, 19-26 [44] J. N. Kemsley, N. Mitic, K. L. Zaleski, J. P. Caradonna and E. I. Solomon, Circular dichroism and
magnetic circular dichroism spectroscopy of the catalytically ferrous active site of phenylalanine hydroxylase and its interaction with pterin cofactor, J. Am. Chem. Soc., 121, 1999, 1528-1536
[45] M. S. Chow, B. E. Eser, S. A. Wilson, K. O. Hodgson, B. Hedman, P. F. Fitzpatrick and E. I. Solomon,
Spectroscopy and kinetics of wild-type and mutant tyrosine hydroxylase: mechanistic insights into O2 activation, J. Am. Soc. Chem., 131, 2009, 7685-7698
[46] B. Kobe, I. G. Jennings, C. M. House, B. J. Michell, K. E. Goodwill, B. D. Santarsiero, R. C. Stevens, R.
G. H. Cotton and B. E. Kemp, Structural basis of autoregulation of phenylalanine hydroxylase, Nat. Struct. Biol., 6, 1999, 442-448
[47] The programme can be obtained at http://www.pymol.org/ (26.06.2010) [48] G. J. Yohrling, IV, S. M. Mockus and K. E. Vrana, Identification of amino-terminal sequences
contributing to tryptophan hydroxylase tetramer, J. Mol. Neuroscience, 12, 1999, 23-34 [49] J. McKinney, P. M. Knappskog and J. Haavik, Different properties of the central and peripheral
forms of human tryptophan hydroxylase, J. Neurochem., 92, 2005, 311-320 [50] G. C.-T. Jiang, G. J. Yohrling, I. V. J. D. Schmitt and K. E. Vrana, Identification of substrate orienting
and phosphorylation sites within tryptophan hydroxylase using homology-based molecular modeling, J. Mol. Biol., 302, 2000, 1005-1017
[51] P. A. Johansen, I. Jennings, R. G. H. Cotton and D. M. Kuhn, Tryptophan hydroxylase is
phosphorylated by protein kinase A, J. Neurochem., 65, 1995, 882-888 [52] I. Winge, J. A. McKinney, M. Ying, C. S. D’Santos, R. Kleppe, P. M. Knappskog and J. Haavik,
Activation and stabilization of human tryptophan hydroxylase 2 by phosphorylation and 14-3-3 binding, Biochem. J., 410, 2008, 195-204
[53] D. M. Kuhn, S. A. Sakowski, T. J. Geddes, C. Wilkerson and J. W. Haycock, Phosphorylation and
activation of tryptophan hydroxylase 2: identification of serine-19 as the substrate site for calcium, calmodulin-dependent protein kinase II, J. Neurochem., 103. 2007, 1567-1573
[54] U. Banik, G.-A. Wang, P. D. Wagner and S. Kaufman, Interaction of phosphorylated tryptophan
hydroxylase with 14-3-3 proteins, J. Biol. Chem., 272, 1997,26219-26225
Bibliography
147
[55] Y. Furukawa, N. Ikuta, S. Omata, T. Yamauchi, T. Isobe and T. Ichimura, Demonstration of the
phosphorylation-dependent interaction of tryptophan hydroxylase with the 14-3-3 protein, Biochem. Biophys. Res. Commun., 194, 1993, 144-149
[56] F. Fusetti, H. Erlandsen, T. Flatmark and R. C. Stevens, Structure of tetrameric human
phenylalanine hydroxylase and its implications for phenylketonuria, J. Biol. Chem., 273, 1998, 16962-16967
[57] L. T. Haahr, Expression, purification and structural studies of tetrameric variants of tryptophan
hydroxylase isoform 2, Department of Chemistry, Technical University of Denmark, Kgs. Lyngby, 2008, M.Sc. thesis
[58] M. M. Abu-Omar, A. Loaiza and N. Hontzeas, Reaction mechanisms of mononuclear non-heme
iron oxygenases, Chem. Rev., 105, 2005, 2227-2252 [59] A. J. Ramsey, P. J. Hillas and P. F. Fitzpatrick, Characterization of the active site iron in tyrosine
hydroxylase, J. Biol. Chem., 271, 1996, 24395-24400 [60] T. A. Dix, G. E. Bollag, P. L. Domanico and S. J. Benkovic, Biochemistry, 24, 1985, 2955-2958 [61] A. Bassan, M. R. A. Blomberg and P. E. M. Siegbahn, Mechanism of dioxygen cleavage in
tetrahydrobiopterin-dependent amino acid hydroxylases, Chem. Eur. J., 9, 2003, 106-115 [62] A. Bassan, T. Borowski and P. E. M. Siegbahn, Quantum chemical studies of dioxygen activation by
mononuclear non-heme iron enzymes with the 2-his-1-carboxylate facial triad, Dalton Trans., 20, 2004, 3153-3162
[63] L. T. Haahr, K. P. Jensen, J. Boesen and H. E. M. Christensen, Experimentally calibrated
computational chemistry of tryptophan hydroxylase: trans influence, hydrogen-bonding and 18-electron rule govern O2-activation, J. Inorg. Biochem., 104, 2010, 136-145
[64] B. E. Eser, E. W. Barr, P. A. Frantom, L. Saleh, J. M. Bollinger, Jr., C. Krebs and P. F. Fitzpatrick, J.
Am. Chem. Soc., 129, 2007, 11334-11335 [65] C. Krebs, D. G. Fujimori, C. T. Walsh and J. M. Bollinger, Jr., Non-heme Fe(IV)-oxo intermediates,
Acc. Chem. Res., 40, 2007, 484-492 [66] J. N. Kemsley, E. C. Wasinger, S. Datta, N. Mitic, T. Acharya, B. Hedman, J. P. Caradonna, K. O.
Hodgson and E. I. Solomon, Spectroscopic and kinetic studies of PKU-inducing mutants of phenylalanine hydroxylase: Arg158Gln and Glu280Lys, J. Am. Chem. Soc., 125, 2003, 5677-5686
[67] P. J. Hillas and P. F. Fitzpatrick, A mechanism for hydroxylation by tyrosine hydroxylase based on
pertitioning of substituted phenylalanines, Biochemistry, 35, 1996, 6969-6975 [68] J. Renson, F. Goodwin, H. Weissbach and S. Udenfriend, Enzymatic conversion of 5-
tritiotryptophan to 4-tritio-5-hydroxytryptophan, Biochem. Biophys. Res. Commun., 25, 1966, 504-513
[69] G. Guroff and J. Daly, Quantitative studies on the hydroxylation induced migration of deuterium
and tritium during phenylalanine hydroxylation, Arch. Biochem. Biophys., 122, 1967, 212-217 [70] J. Daly, M. Levitt, G. Guroff and S. Udenfriend, Isotope studies on the mechanism of action of
adrenal tyrosine hydroxylase, Arch. Biochem. Biophys., 126, 1968, 593-598

Bibliography
148
[71] J. A. Pavon and P. F. Fitzpatrick, Insights into the catalytic mechanisms of phenylalanine and
tryptophan hydroxylase from kinetic isotope effects on aromatic hydroxylation, Biochemistry, 45, 2006, 11030-11037
[72] G. R. Moran, A. Derecskei-Kovacs, P. J. Hillas and P. F. Fitzpatrick, On the catalytic mechanism of
tryptophan hydroxylase, J. Am. Chem. Soc., 122, 2000, 4535-4541 [73] B. Thöny, G. Auerbach and N. Blau, Tetrahydrobiopterin biosynthesis, regeneration and functions,
Biochem. J., 347, 2000, 1-16 [74] M. Kirsch, H.-G. Korth, V. Stenert, R. Sustmann and H. de Groot, The autoxidation of
tetrahydroniopterin revisited, J. Biol. Chem., 278, 2003, 24481-24490 [75] A. Volner, J. Zoidakis and M. M. Abu-Omar, Order of substrate binding in bacterial phenylalanine
hydroxylase and its implication for pterin-dependent oxygenases, J. Biol. Inorg. Chem., 8, 2003, 121-128
[76] S. O. Pember, K. A. Johnson, J. J. Villafranca and S. J. Benkovic, Mechanistic studies on
phenylalanine hydroxylase from Chromobacterium violaceum. Evidence for the formation of an enzyme-oxygen complex, Biochemistry, 28, 1989, 2124-2130
[77] J. Veenstra-VanderWeele, G. M. Anderson and E. H. Cook Jr., Pharmacogenetics and the serotonin
system: initial studies and future directions, Eur. J. Pharmacol., 410, 2000, 165-181 [78] M. Lesurtel, R. Graf, B. Aleil, D. J. Walther, Y. Tian, W. Jochum, C. Gachet, M. Bader and P.-A.
Clavien, Platelet-derived serotonin mediates liver regeneration, Science, 312, 2006, 104-107 [79] M. Berger, J. A. Grey and B. L. Roth, The expanded biology of serotonin, Annu. Rev. Med., 60,
2009, 355-366 [80] S. Ganguly, S. L. Coon and D. C. Klein, Control of melatonin synthesis in the mammalian pineal
gland: the critical role of serotonin acetylation, Cell Tissue Res., 309, 2002, 127-137 [81] M. D. Coates, C. R. Mahoney, D. R. Linden, J. E. Sampson, J. Chen, H. Blaszyk, M. D. Crowell, K. A.
Sharkey, M. D. Gershon, G. M. Mawe and P. L. Moses, Molecular defects in mucosal serotonin content and decreased serotonin reuptake transporter in ulcerative colitis and irritable bowel syndrome, Gastroenterology, 126, 2004, 1657-1664
[82] Z.-C. Shi, A. Devasagayaraj, K. Gu, H. Jin, B. Marinelli, L. Samala, S. Scott, T. Stouch, A. Tunoori, Y.
Wang, Y. Zang, C. Zhang, S. D. Kimball, A. J. Main, W. Sun, Q. Yang, A. Nouraldeen, X.-Q. Yu, E. Buxton, S. Patel, N. Nguyen, J. Swaffield, D. R. Powell, A. Wilson and Q. Liu, Modulation of peripheral serotonin levels by novel tryptophan hydroxylase inhibitors for the potential treatment of functional gastrointestinal disorders, J. Med. Chem., 51, 2008, 3684-3687
[83] S. Walitza, T. J. Renner, A. Dempfle, K. Konrad, C. Wewetzer, A. Halbach, B. Herpertz-Dahlmann, H.
Remschmidt, J. Smidt, M. Linder, L. Flierl, U. Knölker, S. Friedel, H. Schäfer, C. Gross, J. Hebebrand, A. Warnke and K. P. Lesch, Transmission disequilibrium of polymorphic variants in the tryptophan hydroxylase-2 gene in attention-deficit/hyperactive disorder, Mol. Psychiatry, 10, 2005, 1126-1132
[84] J. J. Mann, K. M. Malone, D. J. Diehl, J. Perel, T. B. Cooper, and M. A. Mintun, Demonstration in
vivo of reduced serotonin responsivity in the brain of untreated depressed patients, Am. J. Psychiatry, 153, 1996, 174-182

Bibliography
149
[85] S. Matthes, V. Mosienko, S. Bashammakh, N. Alenina and M. Bader, Tryptophan hydroxylase as
novel target for the treatment of depressive disorders, Pharmacology, 85, 2010, 95-109 [86] K. Nakamura and H. Hasegawa, Developmental role of tryptophan hydroxylase in the nervous
system, Mol. Neurobiol., 35, 2007, 45-53 [87] Q. Liu, Q. Yang, W. Sun, P. Vogel, W. Heydorn, X-Q. Yu, Z. Hu, W. Yu, B. Jonas, R. Pineda, V.
Calderon-Gay, M. Germann, E. O’neill, R. Brammage, E. Cullinan, K. Platt, A. Wilson, D. Powell, A. Sands, B. Zambrowicz and Z.-C. Shi, Discovery and characterization of novel tryptophan hydroxylase inhibitors that selectively inhibit serotonin synthesis in the gastrointestinal tract, J. Pharmacol. Exp. Ther., 325, 2008,47-55
[88] J. McKinney, P. M. Knappskog, J. Pereira, T. Ekern, K. Toska, B. B. Kuitert, D. Levine, A. M.
Gronenborn, A. Martinez and J. Haavik, Expression and purification of human tryptophan hydroxylase from Escherichia coli and Pichia pastoris, Protein Expression Purif., 33, 2004, 185-194
[89] D. Kowlessur and S. Kaufmann, Cloning and expression of recombinant human pineal tryptophan
hydroxylase in Escherichia coli: purification and characterization of the cloned enzyme, Biochim. Biophys. Acta, 1434, 1999, 317-330
[90] A. Munch, Affinity ligands for purification of tryptophan hydroxylase (in Danish), Department of
Chemistry, Technical University of Denmark, Kgs. Lyngby, 2004 [91] R. G. H. Cotton and I. G. Jennings, Affinity chromatography of phenylalanine hydroxylase, Eur. J.
Biochem., 85, 1978, 357-363
[92] E. P. Carpenter, K. Beis, A. D. Cameron and S. Iwata, Overcoming the challenges of membrane
protein crystallography, Curr. Opin. Struct. Biol., 18, 2008, 581-586
[93] M. le Maire, P. Champeil and J. V. Møller, Interaction of membrane proteins and lipids with
solubilizing detergents, Biochim. Biophys. Acta, 1508, 2000, 86-111
[94] S. Kalipatnapu and A. Chattopadhyay, Membrane protein solubilization: recent advances and
challenges in solubilization of serotonin1A receptors, Life, 57, 2005, 505-512
[95] A. M. Seddon, P. Curnow and P. J. Booth, Membrane proteins, lipids and detergents: not just a
soap opera, Biochim. Biophys. Acta, 1666, 2004, 105-117
[96] D. Drew, M. Lerch, E. Kunji, D-J. Slotboom and J-W. de Gier, Monitoring expression of an E. coli
membrane protein GFP-(His)8 fusion and purification using a combination of IMAC and gel
filtration, Discovery Matters, Issue 5, 2007, GE Healthcare
[97] E. Layne, Spectrophotometric and turbidimetric methods for measuring proteins, Methods
Enzymol., 3, 1957, 447–454.
[98] J. H. Kleinschmidt, M. C. Wiener and L. K. Tamm, Outer membrane protein A of E. coli folds into
detergent micelles but not in the presence of monomeric detergent, Protein Sci., 8, 1999, 2065-
2071
[99] www.bio-rad.com (22.06.2010)

Bibliography
150
[100] R. G. H., Cotton, W. McAdam, I. Jennings and F. J. Morgan, A monoclonal antibody to aromatic
amino acid hydroxylases, Biochem. J., 255, 1988, 193-196
[101] http://www.bio-rad.com/LifeScience/pdf/Bulletin_9281.pdf (22.06.2010)
[102] http://www.pick-n-post.com/default.asp?ID=50010300067 (22.06.2010)
[103] http://www.epc.bio.dtu.dk/Proteinanalyse-service.aspx (22.06.2010)
[104] P. E. Karlsen, Expression and purification of the metal-containing monooxygenases tryptophan
hydroxylase and dopamine β-hydroxylase, Department of Chemistry, Technical University of Denmark, Kgs. Lyngby, 2010, Ph.D. dissertation
[105] F. W. Studier, A. H. Rosenberg, J. J. Dunn and J. W. Dubendorff, Use of T7 RNA polymerase to
direct expression of cloned genes, Methods in Enzymology, 185, 1990, 60-89
[106] J. W. Dubenhorff and F. W. Studier, Controlling basal expression in an inducible T7 expression
system by blocking the target T7 promoter with lac respressor, J. Mol. Biol., 219, 1991, 45-59
[107] pET System Manual, 11th edition:
http://kirschner.med.harvard.edu/files/protocols/Novagen_petsystem.pdf (22.06.2010) [108] J. Arnau, C. Lauritzen, G. E. Petersen and J. Pedersen, Current strategies for the use of affinity tags
and tag removal for the purification of recombinant proteins, Protein Expr. Purif., 48, 2006, 1-13 [109] A. Crameri, E. A. Whitehorn, E. Tate and W. P. C. Stemmer, Improved green fluorescent protein by
molecular evolution using DNA shuffling, Nature Biotechnology, 14, 1996, 315-319 [110] B. P. Cormack, R. H. Valdivia and S. Falkow, FACS-optimized mutants of the green fluorescent
protein (GFP), Gene, 173, 1996, 33-38 [111] G. S. Waldo, B. M. Standish, J. Berendzen and T. C. Terwilliger, Rapid protein-folding assay using
green fluorescent protein, Nature Biotechnology, 17, 1999, 691-695 [112] D. E. Drew, G. von Heijne, P. Nordlund and J.-W. L. de Gier, Green fluorescent protein as an
indicator to monitor membrane protein overexpression in Escherichia coli, FEBS letters, 507, 2001, 220-224
[113] D. Drew, M. Lerch, E. Kunji, D.-J. Slotboom and J.-W. de Gier, Optimization of membrane protein
overexpression and purification using GFP fusions, Nature Methods, 3, 2006, 303-313 [114] D. B. Smith and K. S. Johnson, Single-step purification of polypeptides expressed in Escherichia coli
as fusions with glutathione S-transferase, Gene, 67, 1988, 31-40 [115] C. Zurek, Y. Berghöfer-Hochheimer and T. Munder, Expression and purification of myoglobin using
glutathione S-transferase gene fusion system, Science Tools from Pharmacia Biotech., 2, 1997, 18-19
[116] http://www.gelifesciences.com (08.04.2010)

Bibliography
151
[117] T. Nishikubo, N. Nakagawa, S. Kuramitsu and R. Masui, Improved heterologous gene expression in
Escherichia coli by optimization of the AT-content of codons immediately downstream of the
initiation codon, J. Biotechnol., 120, 2005, 341-346
[118] S. C. Makrides, Strategies for achieving high-level expression of genes in Escherichia coli,
Micobiological reviews, 60, 1996, 512-538
[119] D. V. K. Rao, J. V. Rao, M. L. Narasu and A. K. S. B. Rao, Optimization of the AT-content of codons
immediately downstream of the initiation codon and evaluation of culture conditions for high-
level expression of recombinant human G-CSF in Escherichia coli, Mol. Biotechnol., 38, 2008, 221-
232
[120] http://www.viogene.com/files/show_case/Protocol/EG-PF_p.pdf (08.04.2010)
[121] http://www.stratagene.com/manuals/211190.pdf (08.04.2010)
[122] http://www.sigmaaldrich.com/etc/medialib/docs/Sigma/Bulletin/pln70bul.Par.0001.File.tmp
/pln70bul.pdf (08.04.2010)
[123] http://www.neb.com/nebecomm/tech_reference/restriction_enzymes/buffer
_activity_restriction_enzymes.asp? (09.04.10)
[124] http://www.usbweb.com/brief_proto/78400b.pdf (09.04.10)
[125] K. Marcher, Optimization of the expression yield of tryptophan hydroxylase i E. coli, Department of
Chemistry, Technical University of Denmark, Kgs. Lyngby, 2008, Laboratory Technician project
[126] C. N. Pace, F. Vajdos, L. Fee, G. Grimsley and T. Gray, How to measure and predict the molar absorption coefficient of a protein, Protein Science, 4, 1995, 2411-2423
[127] www.gelifesciences.com (27.06.2010)
[128] J.-D. Pédelacq, S. Cabantous, T. Tran, T. C. Twillinger and G. S. Waldo, Engineering and
characterization of a superfolder green fluorescent protein, Nature Biotechnology, 24, 2006, 79-88
[129] D. S. Waugh, Making the most of affinity tags, Trends Biotechnol., 23, 2005, 316-320
[130] http://www.qiagen.com/literature/handbooks/literature.aspx?id=1000081 (27.06.2010)
[131] http://www.gelifesciences.com/aptrix/upp01077.nsf/Content/Products?Open
Document&parented=390399&moduleid=166490 (27.06.2010)
[132] P. J. Henderson, Statistical analysis of enzyme kinetic data, Chapter 10, Enzyme Assays, A practical
approach, Editors R. Eisenthal and M. J. Danson, Oxford University Press, Oxford, 1992
[133] V. Leskovac, Kinetics of monosubstrate reactions, Chapter 3, Comprehensive enzyme kinetics,
Kluwer Academic/Plenum Press, New York, 2003

Bibliography
152
[134] D. Jukíc, K. Sabo and R. Scitovski, A review of existence criteria for parameter estimation of the
Michaelis-Menten regression model, Ann. Univ. Ferrara, 53, 2007, 281-291
[135] W. W. Cleland, Steady state kinetics, Chapter 1, The enzymes, kinetics and mechanism, vol. 2, 3rd
edition, Editor P. D. Boyer, Academic Press, New York, 1970
[136] V. Leskovac, Kinetics of monosubstrate reactions, Chapter 12, Comprehensive enzyme kinetics,
Kluwer Academic/Plenum Press, New York, 2003
[137] G. R. Moran and P. F. Fitzpatrick, A continuous fluorescence assay for tryptophan hydroxylase,
Anal. Biochem., 266, 1999, 148-152
[138] M. Storgaard, Activity assay for tryptophan hydroxylase (in Danish), Department of Chemistry,
Technical University of Denmark, Kgs. Lyngby, 2005
[139] R. Battino, Editor, IUPAC solubility data series, vol. 7, Oxygen and ozone, Pergamon Press, Oxford,
1981
[140] W. W. Cleland, Dithiothreitol, a new protective reagent for SH groups, Biochemistry, 3, 1964, 480-
482
[141] H. Motulsky and A. Christopoulos, Fitting models to biological data using linear and nonlinear
regression, a practical guide to curve fitting, Oxford University Press, Oxford 2004
[142] M. S. Windahl, J. Boesen, P. E. Karlsen and H. E. M. Christensen, Expression, purification and
enzymatic characterization of the catalytic domains of human tryptophan hydroxylase isoforms, Protein J., 28, 2009, 400-406
[143] J. McKinney, K. Teigen, N. Å. Frøystein, C. Salaün, P. M. Knappskog, J. Haavik and A. Martinéz,
Conformation of the substrate and pterin cofactor bound to human tryptophan hydroxylase. Important role of Phe313 in substrate specificity, Biochemistry, 40, 2001, 15591-15601
[144] G. R. Moran, S. C. Daubner and F. P. Fitzpatrick, Expression and characterization of the catalytic
core of tryptophan hydroxylase, J. Biol. Chem., 273, 1998, 12259-12266 [145] K. Tenner, D. Walther and M. Bader, Influence of human tryptophan hdroxylase 2 N- and C-
terminus on enzymatic activity and oligomerization, J. Neurochem., 102, 2007, 1887-1894 [146] P. A. Friedman, A. H. Kappelman and S. Kaufman, Partial purification and characterization of
tryptophan hydroxylase from rabbit hindbrain, J. Biol. Chem., 247, 1972, 4165-4173 [147] S. Hosoda, Further studies on tryptophan hydroxylase from neoplastic murine mast cells, Biochem.
Biophys. Acta, 397, 1975, 58-68 [148] S. Hosoda, W. Nakamura and K. Takatsuki, Properties of tryptophan hydroxylase from human
carcinoid tumor, 482, 1977, 27-34 [149] J. L. P. Benesch, B. T. Ruotolo, D. A. Simmons and C. V. Robinsin, Protein complexes in the gas
phase: Technology for structural genomics and proteomics, Chem. Rev., 107, 2007, 3544-3567

Bibliography
153
[150] K. J. Light-Wahl, B. L. Schwartz and R. D: Smith, Observations of the noncovalent quaternary
associations of proteins by electrospray ionization mass spectrometry, J. Am. Chem. Soc., 116, 1994, 5271-5278
[151] M. Baca and S. B. H. Kent, Direct observation of a ternary complex between the dimeric enzyme
HIV-1 protease and a substrate-based inhibitor, J. Am. Chem. Soc., 114, 1992, 3992-3993 [152] K. J. Light-Wahl, B. E. Winger and R. D. Smith, Observation of the multimeric forms of concanavalin
A by electrospray ionization mass spectrometry, J. Am. Chem. Soc., 115, 1993, 5869-5870 [153] M. Sharon and C. V. Robinson, The role of mass spectrometry in structure elucidation of dynamic
protein complexes, Annu. Rev. Biochem., 76, 2007, 167-193 [154] M. Dole, L. L. Mack and R. L. Hines, Molecular beams of macroions, J. Chem. Phys., 49, 1968, 2240-
2249 [155] L. L. Mack, P. Kralik, A. Rheude and M. Dole, Molecular beams of macroions. II, J. Chem. Phys., 52,
1970, 4977-4986 [156] M. Yamashita and J. B. Fenn, Electrospray ion source. Another variation on the free-jet theme, J.
Phys. Chem., 88, 1984, 4451-4459 [157] J. B. Fenn, M. Mann, C. K. Meng, S. F. Wong and C. M. Whitehouse, Science, 246, 1989, 64-71 [158] P. Kebarle and L. Tang, From ions in solution to ions in the gas phase, The mechanism of
electrospray mass spectrometry, Anal. Chem., 65, 1993, 972-986 [159] Sir G. Taylor, Disintegration of water drops in an electric field, Proc. Roy. Soc. (London) Series A,
280, 1964, 383-385 [160] P. Kebarle and M. Peschke, On the mechanisms by which the charged droplets produced by
electrospray lead to gas phase ions, Analytica Chemica Acta, 406, 2000, 11-35 [161] L. Rayleigh, On the equilibrium of liquid conducting masses charged with electricity, London
Philisophical Magazine 5th Series, 14, 1882, 184-186 [162] A. R.C. McKay, A mass spectrometry study of noncovalent interactions: from single proteins to
intact ribosomes, Clare Hall, University of Cambridge, Cambridge, 2006, Ph.D. thesis [163] J. H. Gross, Mass Spectrometry – A textbook, Springer, 2004 [164] A. T. Blades, M. G. Ikonomou and P. Kebarle, Mechanism of electrospray mass spectrometry.
Electrospray as an electrolysis cell, Anal. Chem., 63, 1991, 2109-2114 [165] R. B. Cole, Some tenets pertaining to electrospray ionization mass spectrometry, J. Mass
Spectrom., 35, 2000, 763-772 [166] J. V. Iribarne and B. A. Thomson, On the evaporation of small ions from charged droplets, J. CHem.
Phys., 64, 1976, 2287-2294 [167] P. Kebarle, A brief overview of the present status of the mechanisms involved in electrospray mass
spectrometry, J. Mass Spectrom., 35, 2000, 804-817
Bibliography
154
[168] J. F. de la Mora, Electrospray ionization of large multiply charged species proceeds via Dole’s
charged residue mechanism, Analytica Chimica Acta, 406, 2000, 93-104 [169] M. S. Wilm and M. Mann, Electrospray and Taylor-cone theory, Dole’s beam of macromolecules at
last?, Int. J. Mass Spectrom. Ion Processes, 136, 1994, 167-180 [170] M. Wilm and M. Mann, Analytical properties of the nanoelectrospray ion source, Anal. Chem., 68,
1996, 1-8 [171] M. Karas, U. Bahr and T. Dülcks, Nano-electrospray ionization mass spectrometry: addressing analytical problems beyond routine, Fresenius J. Anal. Chem., 366, 2000, 669-676 [172] A. G. Marshall, M. W. Senko, W. Li, M. Li, S. Dillon, S. Guan and T. M. Logan, Protein molecular
mass to 1 Da by 13
C, 15
N double-depletion and FT-ICR mass spectrometry, J. Am. Chem. Soc., 119, 1997, 433-434
[173] K.A. Johnson, M. F. J. M. Verhagen, P. S. Brereton, M. W. W. Adams and I. J. Amster, Probing the
stoichiometry and oxidation states of metal centers in iron-sulfur proteins using electrospray FTICR mass spectrometry, Anal. Chem., 72, 2000, 1410-1418
[174] F. Sobott, H. Hernández, M. G. McCammon, M. A. Tito and C. V. Robinson, A tandem mass
spectrometer for improved transmission and analysis of large macromolecular assemblies, Anal. Chem., 74, 2002, 1402-1407
[175] J. A. Loo, Electrospray ionization mass spectrometry: a technology for studying noncovalent
macromolecular complexes, Int. J. Mass Spectrom., 200, 2000, 175-186 [176] S. Yin and J. A. Loo, Mass spectrometry detection and characterization of noncovalent protein
complexes, Mass spectrometry of proteins and peptides, 492, 2009, 273-282 [177] A. R. McKay, B. T. Ruotolo, L. L. Ilag and C. V. Robinson, Mass Measurements of Increased Accuracy
Resolve, Heterogeneous Populations of Intact Ribosomes, J. Am. Chem. Soc., 128, 2006, 11433-11442
[178] J. A. Loo, Studying noncovalent protein complexes by electrospray ionization mass spectrometry,
Mass Spectrom. Rev., 16, 1997, 1-23 [179] I. V. Chernushevich and B. A. Thomson, Collisional cooling of large ions in electrospray mass
spectrometry, Anal. Chem., 76, 2004, 1754-1760 [180] B. T. Ruotolo, K. Giles, I. Campuzano, A. M. Sandercock, R. H. Bateman and C. V. Robinson,
Evidence for macromolecular protein rings in the absence of bulk water, Science, 310, 2005, 1658-1661
[181] B. T. Ruotolo and C. V. Robinson, Aspects of native proteins are retained in vacuum, Current
Opinion in Chemical Biology, 10, 2006, 402-408 [182] K. Breuker and F. W. McLafferty, Stepwise evolution of protein native structure with electrospray
into the gas phase, 10-12
to 102 s, Proc. Natl. Acad. Sci., 105, 2008, 18145-18152
[183] W. Wang, E. N. Kitova and J. S. Klassen, Nonspecific protein-carbohydrate complexes produced by
nanoelectrospray ionization. Factors influencing their formation and stability, Anal. Chem., 77, 2005, 3060-3071

Bibliography
155
[184] J. Sun, E. N. Kitova, N. Sun and J. S. Klassen, Method for identifying nonspecific protein-protein
interactions in nanoelectrospray ionization mass spectrometry, Anal. Chem., 79, 2007, 8301-8311 [185] P. E. Miller and M. B. Denton, The quadrupole mass filter: basic operating concepts, J. Chem. Edu.,
63, 1986, 617-622 [186] I. V. Chernushevich, A. V. Loboda and B. A. Thomson, An introduction to quadrupole-time-of-flight
mass spectrometry, J. Mass Spectrom., 36, 2001, 849-865 [187] C. G. Herbert and R. A. W. Johnstone, Mass spectrometry basics, 2003, CRC Press LLC [188] R. J. Cotter, Time-of-flight mass spectrometry for the structural analysis of biological moleculesI,
Anal. Chem., 64, 1992, 1027-1039 A [189] M. Guilhaus, Principles and instrumentation in time-of-flight mass spectrometry, J. Mass
Spectrom., 30, 1995, 1519-1532 [190] A. E. Cameron and D. F. Eggers, Laboratory and shop notes, Rev. Sci. Instrum., 19, 1948, 605-607 [191] A.N. Krutchinsky, I.V. Chernushevich, V. L. Spicer, W. Ens and K. G. Standing, Collisional damping
interface for an electrospray ionization time-of-flight mass spectrometer, J. Am. Soc. Mass Spectrom., 9, 1998, 569-579
[192] J. L. P. Benesch and C. V. Robinson, Mass spectrometry of macromolecular assemblies:
preservation and dissociation, Current Opinion in Structural Biology, 16, 2006, 245-251 [193] J. L. P. Benesch, Collisional activation of protein complexes: picking up the pieces, Am. Soc. Mass
Spectrom., 20, 2009, 341-348 [194] J. L. P. Benesch, J. A. Aquilina, B. T. Ruotolo, F. Sobott and C. V. Robinson, Tandem mass
spectrometry reveals the quaternary organization of macromolecular assemblies, Chemistry and Biology, 13, 2006, 597-605
[195] P. H. Hirel, J.-M. Schmitter, P. Dessen, G. Fayat and S. Blanquet, Proc. Natl. Acad. Sci. USA, 86,
1989, 8247-8251 [196] http://www.uniprot.org/uniprot/P16700 (04.05.10) [197] H. Hernández and C. V. Robinson, Determining the stoichiometry and interactions of
macromolecular assemblies from mass spectrometry, Nature protocols, Vol. 2 No. 3, 2007, 715-726
[198] R. Giegé and A. Ducruix, An introduction to the crystallogenesis of biological macromolecules,
Chapter 1 in Crystallization of nucleic acids and proteins, A practical approach, Editors A. Ducruix and R. Giegé, 2
nd edition, Oxford University Press, Oxford, 1999
[199] A. McPherson, Introduction to protein crystallization, Methods, 34, 2004, 254-265 [200] A. McPherson, Current approaches to macromolecular crystallization, Eur. J. Biochem., 189, 1990,
1-23

Bibliography
156
[201] R. Giegé and A. Ducruix, Methods of crystallization, Chapter 5 in Crystallization of nucleic acids and
proteins, A practical approach, Editors A. Ducruix and R. Giegé, 2nd
edition, Oxford University Press, Oxford, 1999
[202] C. W. Carter, Jr. and M. Riés-Kautt, Improving marginal crystals, Methods Mol. Biol., 363, 2007,
153-174 [203] T. M. Bergfors, Protein crystallization: Techniques, strategies, and tips. A Laboratory manual,
Edited by T. M. Bergfors, International University Line, 1999 [204] Collaborative Computational Project, Number 4, "The CCP4 Suite: Programs for Protein
Crystallography", Acta Cryst. D50, 1994, 760-763
[205] Emsley P, Cowtan K (2004). Coot: model-building tools for molecular graphics. Acta Crystallogr. D60, 2126-2132.

157
Appendix 1 A.1 Primer sequences Primer sequences of the hTPH1 gene variants. Table A1.1. Primer sequence for amplification of TPH1 genes as either NdeI/XhoI-fragments or NdeI/BamHI-fragments.
Gene Primer Sequence Product size
chTPH1
5’-end
HCP596
NdeI Annealing sequence 5’-AAAACATATGGATGGCATGGAAACCGTGC-3’
~950bp
3’-end
HCP593
XhoI Stop Annealing sequence 5’-AAAACTCGAGTTAATCTTTCAGAATTTGAATACTGC-3’
cthTPH1
5’-end
HCP596
NdeI Annealing sequence 5’-AAAACATATGGATGGCATGGAAACCGTGC-3’
~1000bp
3’-end
HCP655
XhoI Stop 5’-AAAACTCGAGTTAGATCGAAGGTTT-3’ Annealing sequence
rchTPH1
5’-end
HCP641
NdeI 5’-AAAACATATGATTGAAGACAACAAAGA-3’ Annealing sequence
~1300bp
3’-end
HCP593
XhoI Stop Annealing sequence 5’-AAAACTCGAGTTAATCTTTCAGAATTTGAATACTGC-3’
rhTPH1
5’-end
HCP641
NdeI 5’-AAAACATATGATTGAAGACAACAAAGA-3’ Annealing sequence
~300bp
3’-end
HCP643
XhoI Stop Annealing sequence 5’-AAAACTCGAGTTACTCTTTCAGGGTAAAATTGTC-3’

Appendix 1
158
Primer sequences of hTPH1 fusion genes. Table A1.2. Primer sequence for amplification of hTPH1 genes as either NdeI/XhoI-fragments or NdeI/BamHI-fragments.
rhTPH1-GFP
5’-end
HCP641
NdeI Annealing 5’-AAAACATATGATTGAAGACAACAAAGA-3’
~300bp
3’-end
HCP642
BamHI Annealing sequence 5’-AAAAGGATCCCTCTTTCAGGGTAAAATTGTC-3’
L24R/V28R-rhTPH1 -GFP
5’-end
HCP683
5’-GCCTGATTTTTAGCCGCAAGAACGAACGCGGCGGACTGATCAAAGC-3’
~300bp
3’-end
HCP684
3’-CGGACTAAAAATCGGCGTTCTTGCTTGCGCCGCCTGACTAGTTTCG-5’
L31R/L35R-rhTPH1 –GFP
5’-end
HCP685
5’-GAAGTGGGCGGACGCATCAAAGCGCGCAAGATTTTTCAGGAG-3’
~300bp
3’-end
HCP686
3’-CTTCACCCGCCTGCGTAGTTTCGCGCGTTCTAAAAAGTCCTC-5’
V28R/L31R-rhTPH1 -GFP
5’-end
HCP687
5’-GCCTGAAGAACGAACGCGGCGGACGCATCAAAGCGCTGAAG-3’
~300bp
3’-end
HCP688
3’-CGGACTTCTTGCTTGCGCCGCCTGCGTAGTTTCGCGACTTC-5’
GST-rhTPH1
5’-end
HCP702
BamHI Annealing sequence 5’-AAAAGGATCCCCATGATTGAAGACAACAAAGAGA-3’
~300bp
3’-end
HCP643
XhoI Stop Annealing sequence 5’-AAAACTCGAGTTACTCTTTCAGGGTAAAATTGTC-3’
Primer sequences of hTPH2 gene variants.
Table A1.3. Primer sequence for amplification of TPH2 genes.
Gene Primer Sequence Product size
TPH259-490
5’-end
HCP631
NdeI Annealing 5’-AAAACATATGACCGAAAGCGGCAAAACCG-3’
~1300bp
3’-end
HCP632
Annealing DraI 5’-TTACTTTAAAGCCCGGATGAT-3’
TPH290-490
5’-end
HCP697
NdeI Annealing 5’-AAAACATATGAACATGGTGCATATTGAAAGC-3’
~1200bp
3’-end
HCP632
Annealing DraI 5’-TTACTTTAAAGCCCGGATGAT-3’
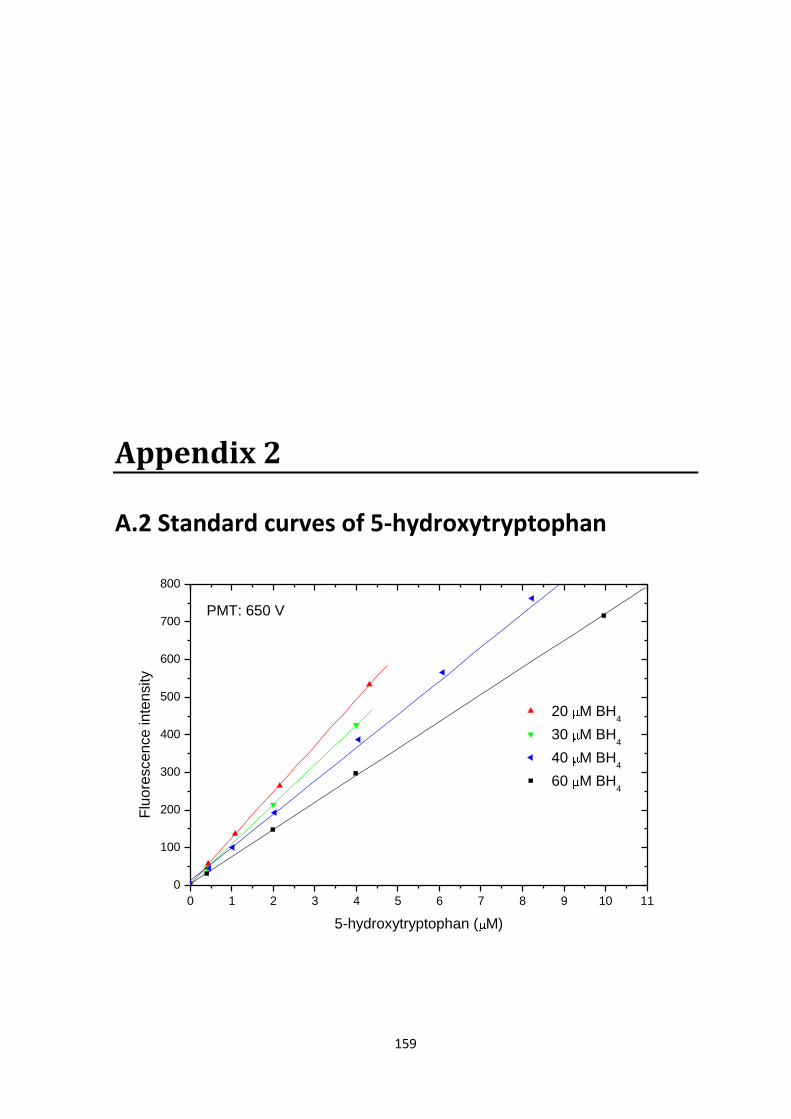
159
Appendix 2 A.2 Standard curves of 5-hydroxytryptophan
0 1 2 3 4 5 6 7 8 9 10 11
0
100
200
300
400
500
600
700
800
20 M BH4
30 M BH4
40 M BH4
60 M BH4
Flu
ore
scen
ce in
ten
sity
5-hydroxytryptophan ( M)
PMT: 650 V

Appendix 2
160
Slopes of the standard curves for 5-hydroxytryptophan at different concentrations of BH4.
BH4 (µM) Slope (f.i./ µM 5-hydroxytryptophan) R2
20 122.65±0.7 0.9999 30 105.81±0.2 0.9999 40 88.36±1.8 0.9987 60 71.625±0.6 0.9999 100 44.635±0.6 0.9996 150 27.552±0.5 0.9995 200 18.015±0.05 0.9999 300 7.7749±0.08 0.9996 400 4.5998±0.04 0.9999
0 2 4 6 8 10 12 14 16 18 20
0
100
200
300
400
500
600
700
800
900
100 M BH4
150 M BH4
200 M BH4
300 M BH4
400 M BH4
Flu
ore
scen
ce in
ten
sity
5-hydroxytryptophan ( M)
PMT: 650 V

161
Appendix 3 A.3 – Crystallization screens
Solubility screen Set contents – Box 1 set P – pH 4.5 P 1 2 3 4 5 6
Potassium Thiocyanate
Sodium chloride
Sodium acetate
Ammonium dihydrogen phosphate
Ammonium citrate
Ammonium Sulfate
A 0.05 M 0.5 M 1.0 M 1.5 M 1.1 M 1.5 M B 0.10 M 1.0 M 1.5 M 2.0 M 1.4 M 2.0 M C 0.25 M 1.5 M 2.0 M 2.5 M 1.7 M 2.5 M D 0.50 M 2.0 M 3.0M 3.0 M 2.0 M 3.0M
Set contents – Box 1 set N – pH 9.0 N 1 2 3 4 5 6
Ammonium sulfate
Di-ammonium hydrogen phosphate
Ammonium citrate
Sodium acetate
Magnesium sulfate
Calcium chloride
A 1.0 M 1.0 M 1.1 M 1.0 M 0.05 M 0.21 M B 1.5 M 1.5 M 1.4 M 1.5 M 1.00 M 0.49 M C 2.0 M 2.0 M 1.7 M 2.0 M 1.50 M 1.00 M D 2.5 M 2.5 M 2.0 M 3.0M 1.80 M 1.50 M

Appendix 3
162
Set contents – Box 2 set Z – pH = pI = 6.0 Z 1 2 3 4 5 6
A PEG 400 (v/v%) 4.8 9.6 14.4 19.2 33.6 48 B PEG 4000 (%) 6.0 12.0 18.0 24.0 30.0 45 C PEG 8000 (%) 3.6 7.2 10.8 14.4 18.0 27 D MDP (% v/v) 4.8 9.6 14.4 19.2 33.6 48
Structure screen 1 and 2 Red arrows indicate the solution conditions where crystals were observed.

Appendix 3
163

Appendix 3
164
Optimization screen 1 The optimization screen 1 was set up using 1 mg/ml, 1.5 mg/ml or 2 mg/ml of chTPH1.
1 2 3 4 5 6 7 8 9 10 11 12
A B
1.4M (NH4) citrate pH 9.0
2.0M (NH4)2SO4 pH 9.0
3.0M Na acetate pH 4.5
K_M 22.5% PEG10.000 0.2M imidazole malate pH 8.5
Structure2 – nr.28 0.1M Na HEPES 20% w/v PEG 10.000 pH 7.5
Structure1 – nr.32 0.1M Tris 2.M (NH4)2SO4
pH 8.5
C D
1.1M (NH4) citrate pH 9.0
1.75M (NH4)2SO4 pH 9.0
2.75M Na acetate pH 4.5
½*Structure2 – nr. 28 0.05M Na HEPES 10% w/v PEG 10.000 pH 7.5
½*Structure1 – nr. 32 0.05M Tris 1.0M (NH4)2SO4
pH 8.5 E F
0.8M (NH4) citrate pH 9.0
1.5M (NH4)2SO4 pH 9.0
2.5M Na acetate pH 4.5
Structure2 – nr.14 0.1M NaCl 0.1M Na HEPES 1.6M (NH4)2SO4 pH 7.5
Structure1 – nr.15 0.2M Mg acetate 0.1M Na cacodylate 20% w/v PEG 8K pH 6.5
G H
0.5M (NH4) citrate pH 9.0
1.25M (NH4)2SO4 pH 9.0
2.25M Na acetate pH 4.5
½*Structure2 – nr. 14 0.05M NaCl 0.05M Na HEPES 0.8M (NH4)2SO4 pH 7.5
½*Structure1 – nr. 15 0.1M Mg acetate 0.05M Na cacodylate 10% w/v PEG 8K pH 6.5
Optimization screen 2 The optimization screen 2 was stored at +4oC and at room temperature.
1 2 3 4 5 6
A
Solution 1 1mg/ml, Trp 1.4M (NH4) citrate pH 9.0
Solution 2 2mg/ml, Trp 1.75M (NH4)2SO4 pH 9.0
Solution 3 1.5mg/ml, Trp+BH2 2M (NH4)2SO4 pH 9.0
Solution 4 2mg/ml, without ligand K_M 22.5% PEG10.000 0.2M imidazole malate pH 8.5
Solution 5 2mg/ml, BH2 K_M 22.5% PEG10.000 0.2M imidazole malate pH 8.5
Solution 6 2mg/ml, without ligand Structure2 – nr.28 0.1M Na HEPES 20% w/v PEG 10.000 pH 7.5
B Solution 1 1mg/ml, Trp 1.4M (NH4) citrate pH 9.0
Solution 2 2mg/ml, Trp 1.75M (NH4)2SO4 pH 9.0
Solution 3 1.5mg/ml, Trp+BH2 2M (NH4)2SO4 pH 9.0
Solution 4 2mg/ml, without ligand K_M 22.5% PEG10.000 0.2M imidazole malate pH 8.5
Solution 5 2mg/ml, BH2 K_M 22.5% PEG10.000 0.2M imidazole malate pH 8.5
Solution 6 2mg/ml, without ligand Structure2 – nr.28 0.1M Na HEPES 20% w/v PEG 10.000 pH 7.5
C Solution 1 1mg/ml, Trp 1.4M (NH4) citrate pH 9.0
Solution 2 2mg/ml, Trp 1.75M (NH4)2SO4 pH 9.0
Solution 3 1.5mg/ml, Trp+BH2 2M (NH4)2SO4 pH 9.0
Solution 4 2mg/ml, without ligand K_M 22.5% PEG10.000 0.2M imidazole malate pH 8.5
Solution 5 2mg/ml, BH2 K_M 22.5% PEG10.000 0.2M imidazole malate pH 8.5
Solution 6 2mg/ml, without ligand Structure2 – nr.28 0.1M Na HEPES 20% w/v PEG 10.000 pH 7.5
D Solution 7 2mg/ml, BH2
Structure2 – nr.28 0.1M Na HEPES 20% w/v PEG 10.000 pH 7.5
Solution 7 2mg/ml, BH2
Structure2 – nr.28 0.1M Na HEPES 20% w/v PEG 10.000 pH 7.5
Solution 7 2mg/ml, BH2
Structure2 – nr.28 0.1M Na HEPES 20% w/v PEG 10.000 pH 7.5

Appendix 3
165
Optimization screen 3
1 1 mg/ml, Trp
2 2 mg/ml, Trp
3 2 mg/ml, Trp+BH2
A 1.4M Ammonium citrate pH 9.5 1.75M Ammonium sulfate pH 9.5 2M Ammonium sulfate pH 9.5 B 1.4M Ammonium citrate pH 9.0 1.75M Ammonium sulfate pH 9.0 2M Ammonium sulfate pH 9.0 C 1.4M Ammonium citrate pH 8.5 1.75M Ammonium sulfate pH 8.5 2M Ammonium sulfate pH 8.5 D 1.4M Ammonium citrate pH 8.0 1.75M Ammonium sulfate pH 8.0 2M Ammonium sulfate pH 8.0
Cryo-buffer solutions
Conditions Cryo-buffer solution
1 1 mg/ml, tryptophan 1.4 M (NH4) citrate pH 9.0
1 mg/ml, tryptophan 1.4 M (NH4) citrate pH 9.0
2 2 mg/ml, tryptophan 1.75 M (NH4)2SO4 pH 9.0
2 mg/ml, tryptophan 1.75M (NH4)2SO4 pH 9.0
3 1.5 mg/ml, tryptophan +BH2 2 M (NH4)2SO4 pH 9.0
1.5 mg/ml, tryptophan +BH2 2 M (NH4)2SO4 pH 9.0
4 2 mg/ml, without ligand 22.5 % PEG10.000, 0.2 M imidazole malate pH 8.5
2 mg/ml, without ligand 22.5 % PEG10.000, 0.2 M imidazole malate pH 8.5
5 2mg/ml, BH2 22.5 % PEG10.000, 0.2M imidazole malate pH 8.5
2emg/ml, BH2 22.5 % PEG10.000, 0.2M imidazole malate pH 8.5
6 2 mg/ml, without ligand 0.1 M Na HEPES, 20 % w/v PEG10.000 pH 7.5
2 mg/ml, without ligand 0.1 M Na HEPES, 20 % w/v PEG10.000 pH 7.5
7 2 mg/ml, BH2
0.1 M Na HEPES, 20 % w/v PEG10.000 pH 7.5 2 mg/ml, BH2
0.1 M Na HEPES, 20 % w/v PEG10.000 pH 7.5