Clinton K.Y. Lau, Louise Turner, Jakob S. Jespersen ...€™ experiments’ were’ carried’...
30
Cell Host & Microbe, Volume 17 Supplemental Information Structural Conservation Despite Huge Sequence Diversity Allows EPCR Binding by the PfEMP1 Family Implicated in Severe Childhood Malaria Clinton K.Y. Lau, Louise Turner, Jakob S. Jespersen, Edward D. Lowe, Bent Petersen, Christian W. Wang, Jens E.V. Petersen, John Lusingu, Thor G. Theander, Thomas Lavstsen, and Matthew K. Higgins
Transcript of Clinton K.Y. Lau, Louise Turner, Jakob S. Jespersen ...€™ experiments’ were’ carried’...

Cell Host & Microbe, Volume 17
Supplemental Information
Structural Conservation Despite Huge Sequence Diversity Allows EPCR Binding by the PfEMP1
Family Implicated in Severe Childhood Malaria
Clinton K.Y. Lau, Louise Turner, Jakob S. Jespersen, Edward D. Lowe, Bent Petersen, Christian W.
Wang, Jens E.V. Petersen, John Lusingu, Thor G. Theander, Thomas Lavstsen, and Matthew K. Higgins

Supplemental experimental procedures
Expression and purification of CIDRα1 domains
Domain sequences originate from Plasmodium falciparum reference genomes (Rask et al., 2010) or sequenced Tanzanian patient isolates (four digit names from Lavstsen et al., 2012 and unpublished; ERSxxxxxx names from Miotto et al., 2013). In addition to previously published CIDRα1 domains (Turner et al., 2013), new CIDRα1 DNA sequences were optimised for expression in Trichoplusia ni cells using the software GeneOptimizer. They were synthesised by Geneart (Regensburg, Germany) after modification to include C-‐terminal V5 and His tags and were subcloned into the baculovirus expression vector pAcGP67-‐A (BD Biosciences). FlashBac DNA (Oxford Expression Technologies, OE-‐100150) was co-‐transfected with the recombinant vectors into Sf9 insect cells for the generation of recombinant virus particles.
High-‐Five insect cells grown in 600 ml of serum-‐free media (10486; GIBCO) were infected with 18 ml of the second amplification of the recombinant virus particles. Two days later the cells were centrifuged (8000g, 4 °C, 10 min), and the supernatant was filtered using two 10-‐kDa NMWC PES membranes (0.45 μm) (56-‐4112-‐04; GE Healthcare) with a total surface area of 200 cm2. The supernatant was then concentrated to 30 ml and diafiltrated using an ÄKTA cross-‐flow (GE Healthcare) into buffer A (20 mM Tris (pH 9.0) and 500 mM NaCl). Retentate was recovered from the system and filtered (0.2 μm), yielding a final volume of 40 ml. Before loading onto a 1 ml HisSelect column (H8286; Sigma-‐Aldrich), 150 μl of 1 M imidazole (pH 7.4; Sigma-‐Aldrich) was added to the sample, giving a final imidazole concentration of 15 μM. The bound protein was eluted with buffer A+200 mM imidazole.
For crystallisation, CIDRα1 domains from HB3var03 and IT4var07 were expressed in E. coli. Domain boundaries were selected using a structure-‐based alignment against pdb 2YK0 (Vigan-‐Womas et al., 2012) using FUGUE (Shi et al., 2001). Genes were amplified from HB3 or IT4 strain P. falciparum genomic DNA respectively and were cloned into the pEt15b vector. This allowed expression of the protein with an N-‐terminal hexa-‐histidine tag and a TEV cleavage site using Escherichia coli (BL-‐21 strain). Transformed E. coli were grown up to an optical density at 600 nm of 1.0 and expression was induced by the addition of IPTG to a final concentration of 1 mM. Cells were harvested after 3 h at 27°C. The CIDRα1 domains expressed in the form of inclusion bodies, which were unfolded by incubation at room temperature in 6 M guanidine-‐hydrochloride, 20 mM Tris pH 8, 300 mM NaCl, 15 mM imidazole for 15 h. Refolding was achieved by gradual buffer exchange into 20 mM Tris pH 8, 300 mM NaCl, 15 mM imidazole in the presence of a glutathione redox buffer (3 mM reduced glutathione, 0.3 mM oxidised glutathione) while the protein was bound to a Ni-‐NTA column. Refolded protein was eluted and further purified by size exclusion gel chromatography (HiLoad Superdex 75 16/60, GE Healthcare) into 20 mM HEPES pH 7.5, 150 mM NaCl.
Single site mutants were generated from the wild type HB3var03 CIDRα1 construct as described by the Quikchange mutagenesis method (Stratagene) and
plasmid sequences were verified. Proteins from these constructs were expressed and purified in E. coli as above.
Recombinant EPCR expression and purification
A codon-‐optimised synthetic gene was designed for EPCR (Syngene), using domain boundaries obtained from the crystal structure of pdb 1L8J (Oganesyan et al., 2002) and was produced by Geneart. This gene was cloned into the pExpreS2 vector, in frame with a BIP leader sequence and an N-‐terminal extension containing a BAP tag, an N-‐terminal hexa-‐histidine tag, and a TEV cleavage site. The vector was then transfected into Drosophila S2 cells using ExpreS2 Insect TRx5 liposome transfection reagent (Expres2ion Biotechnologies). Stably transfected cells were selected using zeocin (Invitrogen, Thermo Fisher Scientific). Culture media containing EPCR was buffer exchanged into 20 mM Tris pH 8, 500 mM NaCl and protein was purified by Ni-‐NTA affinity chromatography and size exclusion gel chromatography (HiLoad Superdex 75 16/60, GE Healthcare) using 20 mM HEPES pH 7.5, 150 mM NaCl.
Protein for crystallography was deglycosylated by treatment with endoglycosidase Hf (Sigma) and endoglycosidase F3 at enzyme:protein ratios of 1:50 in 50 mM MES pH 6.5 for 15 h. N-‐terminal tags were cleaved using TEV protease at an enzyme:protein ratio of 1:50 in PBS (Melford) with 3 mM reduced glutathione, 0.3 mM oxidised glutathione for 15 h at 25°C.
CIDRα1-EPCR complex crystallisation
HB3var03 and IT4var07 CIDRα1s were mixed separately with EPCR at 1:1 molar ratios and complexes were obtained by size exclusion chromatography on a Superdex 75 HiLoad 16/60 column (GE Healthcare). Fractions containing complexes were concentrated up to 10.7 mg/ml (HB3var03) and 8.1 mg/ml (IT4var07). Crystals were grown using the sitting-‐drop vapour-‐diffusion method in 96 well plates. Initial crystals were obtained through a broad screen with droplets containing 100 nl of protein solution mixed with 100 nl of well solution. Optimisation screens were performed including seed stocks obtained from initial crystals, with each droplet contained 100 nl of protein solution, 50 nl of seed solution and 50 nl of well solution and 50 nl of additive solution (Silver Bullets, Hampton Research).
HB3var03 CIDRα1-‐EPCR crystals grew as needle clusters with a reservoir solution of 0.2 M NaNO3, 0.1 M BTP pH 8.5, 20% PEG 3350. Needle clusters were transferred into a drop of well solution containing 25% ethylene glycol and single needles detached. These needles were then cryo-‐cooled in liquid nitrogen for storage and data collection.
IT4var07 CIDRα1-‐EPCR crystals grew as hexagonal prisms with a reservoir solution of 0.2 M NaNO3, 0.1 M BTP pH 7.5, 20% PEG 3350. MPD was gradually

added to the crystals in a drop of mother liquor to a final concentration of 25%. Crystals were cryo-‐cooled in liquid nitrogen for storage and data collection.
Data collection and structure determination
Data from crystals containing the HB3var03 CIDRα1-‐EPCR complex were collected at beamline I04 (Diamond Light Source, UK) using radiation with a wavelength of 0.98Å and a Pilatus 6M-‐F detector. These data were indexed and refined using iMosflm (Leslie and Powell, 2007), then scaled using SCALA (CCPN4, 1994) to resolution of 2.65 Å. Molecular replacement using Phaser-‐MR (CCPN4, 1994) found two copies of EPCR (pdb code 1L8J) (Oganesyan et al., 2002) in the asymmetric unit. The models of the CIDRα1 domains were built into the remaining electron density using an iterative cycle of refinement using Refmac (CCPN4, 1994) and autobuster (Bricogne et al., 2011) and manual model building using Coot (Emsley et al., 2010).
Data from crystals containing the IT4var07 CIDRα1-‐EPCR complex were collected at beamline I02 (Diamond Light Source, UK) using a Pilatus 6M detector. These data were indexed and refined using iMosflm and scaled using SCALA to a resolution of 2.9 Å. Phaser-‐MR using the structure of the HB3var03 CIDRα1-‐EPCR complex found one copy in the asymmetric unit. The model of the IT4var07 CIDRα1:EPCR complex was built using iterative cycles of manual model building using Coot and refinement using autobuster.
Surface plasmon resonance
EPCR was coupled to an SPR chip using a biotin attached to the N-‐terminal BAP tag. This strategy was designed to allow EPCR to be immobilised with an orientation matching that found on the endothelial surface, and to generate a surface that could readily be regenerated. The S2 cell produced EPCR was not biotinylated during expression, so 1 mg EPCR (30 μM) in 20 mM HEPES pH 7.5, 150 mM NaCl was incubated with 20 μg BirA, 0.3 μM biotin, 5 mM ATP, for 15 h at 25°C.
SPR experiments were carried out on a Biacore T200 instrument (GE Healthcare). All experiments were performed in 20 mM HEPES pH 7.5, 150 mM NaCl, 0.005% Tween-‐20 at 25°C. Two-‐fold dilution series of each CIDRα1 were prepared for injection over an EPCR-‐coated chip. For each cycle, biotinylated recombinant EPCR was immobilised on a CAP chip using the Biotin Capture Kit (GE Healthcare) to a total loading of 150 RU. Binding partners were injected for 240 s with a dissociation time of 300 s. The chip was regenerated in between cycles using regeneration solution from the Biotin Capture Kit (GE Healthcare). The specific binding response of the CIDRα1s to EPCR was determined by subtracting the response given by CIDRα1 from a surface to which no EPCR had been coupled. The kinetic sensorgrams were globally fitted to a 1:1 interaction model to allow calculation of the association rate constant, ka; the dissociation

rate constant, kd; and the dissociation constant Kd using BIAevaluation software version 1.0 (GE Healthcare).
Isothermal titration calorimetry
ITC measurements were carried out on a MicroCal iTC200 System (GE Healthcare). Samples were dialysed for 15 h into 20 mM HEPES pH 7.5, 150 mM NaCl at 4°C. Experiments were performed at 25°C with 60 μl of EPCR at 50 μM titrated into a cell containing 300 μl of HB3var03 CIDRα1.4 at 5 µM. Concentrations of both components were checked using a BCA assay kit (Merck Millipore). Data were integrated and fit by nonlinear least-‐squares fitting using Origin ITC Software (GE Healthcare).
Small angle X-ray scattering
SAXS data were collected on beamline P12 at DESY (Hamburg, Germany) at a wavelength of 0.124 nm using a Pilatus 2M pixel X-‐ray detector. For each protein sample, a series of data sets were collected for a 2-‐fold dilution series from 4 mg/ml to 0.125 mg/ml, with buffer measurements taken in between each sample measurement. All samples were in 20 mM HEPES pH 7.5, 150 mM NaCl.
Concentration series for each sample, after normalisation and buffer subtraction, were extrapolated to zero to check for concentration dependent aggregation in Primus (Konarev et al., 2003). The radius of gyration, Rg, and zero angle scattering, I(0), were calculated using AutoRg. Data points from the lowest scattering angle (q), as well as at those at higher q with a low signal to noise ratio, were removed, depending on AutoRg results and Kratky plots. Inverse Fourier calculations of I(q) were used to yield P(r) functions, I(0), Rg and the maximum dimension (Dmax) using GNOM (Svergun, 1992).
Initial bead models for these data were created ab initio using DAMMIF (Franke and Svergun, 2009). These were averaged using DAMAVER (Volkov and Svergun, 2003), and refined from the averaged model, based on the original P(r) function, using DAMMIN (Svergun, 1999). The resulting model was converted into an envelope using Situs (Wriggers, 2010), before docking pdb models into the envelope using Sculptor (Birmanns et al., 2011). Chain A from the HB3var03:EPCR structure was used for the CIDRα1 domain model and chain B from the HB3var03:EPCR structure as the EPCR model in the HB3var03:EPCR envelope; the NTSDBL domain from PDB 2YK0 (Vigan-‐Womas et al., 2012) and the DBL3x domain from PDB 3BQK (Higgins, 2008) were used in addition to the aforementioned domains as models in the DD2var32:EPCR envelope.

Size exclusion chromatography-multiangle laser light scattering
Samples were purified by size exclusion chromatography on a Superdex 75 gel filtration column (analytical grade, GE Healthcare), then analysed using laser light scattering detected at 662 nm wavelength at 8 scattering angles between 20.6° and 149.1° using a Heleos 8 instrument (Wyatt Technology). Molecular weights were calculated using the Zimm equation by ASTRA 6.1 (Wyatt Technology).
Equilibrium analytical ultracentrifugation
Analytical ultracentrifugation was carried out using a Beckman Optima XL-‐1 analytical ultracentrifuge. Experiments were run until equilibrium at 20°C, with HB3var03 at 8 μM. Absorbance data were taken at a wavelength of 280 nm at equilibrium at 10,000, 12,000, 14,000 and 16,000 rpm analysed the data using sedphat (Vistica et al., 2004), globally calculating the molecular weight modeling a single species of an interacting system.
Sequence analysis
To facilitate analysis of CIDRα1 sequence diversity we expanded our collection of CIDRα1 domains from the previously described 66 sequences, originating mainly from seven whole genome sequenced parasites (Lavstsen et al., 2012; Rask et al., 2010), with domains extracted from assemblies of Illumina whole genome sequencing data from 226 samples collected in both Africa and Asia (Miotto et al., 2013) (Study number ERP000190), available through the MalariaGEN community. All data available from each sample was collectively assembled with Velvet (Zerbino, 2010) using an optimized k-‐mer value. Assembled contigs were subjected to the Virtual Ribosome open reading frame (ORF) finder (Wernersson, 2006) searching all reading frames, resulting in ~3.4 million ORFs ranging from 21 bp to 30,940 bp, median 258 bp (starting with any codon) and ~850,000 ORFs longer than 750 bp. The 66 different previously classified CIDRα1 sequences (Lavstsen et al., 2012; Rask et al., 2010) were each used to blastp search (Altschul, 1997) the ORFs keeping all hits with an expectation value of < 10-‐10 to extract even very divergent CIDRα1 variants. This resulted in ~1050 hits for each query and a total of 1,894 non-‐redundant ORF hits. The amino acid sequence of these ORFs were then aligned together with the 66 query sequences using MUSCLE (Edgar, 2004) and the CIDRα1 region excised. Incomplete domain sequences were discarded (domain borders defined in Turner et al, 2013), and the remaining sequences were blastp searched against a library of all known annotated PfEMP1 domains (Rask et al., 2010) (including 649 CIDR domains of all types). Query domains whose best hit was not a CIDRα1 domain were discarded, leaving 831 complete CIDRa1 sequences originating from 198 of the 226 assembled samples. Hand corrected MUSCLE alignments were used to generate sequence logos by WebLogo 3 (Crooks et al., 2004) and
sequence distance trees by MEGA (Tamura et al., 2013). As a measure of the residue-‐wise conservation/variation of EPCR binding CIDRα1 domains, the Shannon property entropy was calculated on the basis of the physiochemical property groupings defined by Mirny and Shakhnovich (aliphatic [AVLIMC], aromatic [FWYH], polar [STNQ], positive [KR], negative [DE] and special conformation [PG]) and using sequence weighting (Capra and Singh, 2007; Mirny and Shakhnovich, 1999). As shown in Figure 1 and Table S1 these domains grouped into the eight previously defined subtypes with the additional separation of CIDRα1.5, -‐6 and -‐8 variants into two, i.e. CIDRα1.5a/b, 1.6a/b and 1.8a/b.
Human IgG antibody purification
Plasma samples collected in 2005 during a cross sectional malaria survey in an area of high malaria transmission (Tanzania) were screened for the ability to inhibit the EPCR binding of HB3var03 CIDRα1.4 or IT4var20 CIDRα1.1 in ELISA. A set of 45 or 76 plasma samples were screened for each protein, respectively. 41 of 45 and 51 of 76 samples inhibited the EPCR binding to OD values <50% of the no plasma control. Inhibitory plasma samples were then screened by ELISA for reactivity to peptides covering the EPCR binding region of HB3var03 CIDRα1.4 or IT4var20 CIDRα1.1, respectively.
The HB3var03 peptide sequence: LFTNKHDIPKKYYLNINDLFDSFFFQVIYKFNEGEAKWNELKENLKKQIASSKANNGTKDSEA. The IT4var20 peptide sequence: VFGNNNRMSYIYYNNLSRVFDSFLFQVMFALDQDEKGKWDQFTEDLKKKFEPSKTNTPTGKSQD
Fifteen of 41 (average donor age: 10.5 years; range 4.3-‐14.3 years) and 17 of 51 (average donor age: 9.4 years; range 4.7-‐15.3 years) samples were found to react with the respective peptide (OD>0.7). Plasma interacting with each peptide was collected to create two pools and IgG was purified yielding approximately 30 mg total IgG/pool. These IgG preparations were then purified by affinity to the HB3var03 or the IT4var20 peptides to generate a human anti-‐HB3var03 peptide IgG preparation (pool A) and a human anti-‐IT4var20 peptide IgG preparation (pool B). The IgG yield was 0.2 mg for both preparations.
IgG was prepared from each pool according to manufacturer’s protocol (GammaBind Plus Sepharose, GE Healthcare). Briefly, the plasma was diluted two fold in PBS, filtered and passed seven times through 1 ml packed slurry. After washing, the bound IgG was eluted in a total of 10 ml using Tris–glycine (pH 2.4), and neutralised by dialysis against phosphate-‐buffered saline.
The affinity purification was carried out according to the manufacturer’s protocol. Briefly, 1 mg of each peptide was coupled to NHS columns (NHS activated HP, GE Healthcare). The dialysed IgG from each pool was passed through the respective column twice. Both the eluted sample and the run-‐through IgG were dialysed against phosphate-‐buffered saline and the affinity

purified IgG sample was concentrated up using a spin column (Vivaspin VS2022) to a concentration of 0.2 mg/ml.
ELISA
Unless stated otherwise, ELISAs were carried out as described here. Recombinant human EPCR and CD36 were coated at 3 μg/ml and PfEMP1 proteins/peptides and APC were coated at 5 μg/ml in PBS, overnight at 4 oC. Plates were blocked using PBS+3% skimmed milk (150µl/well) and washed three times after all steps with PBS+0.05% Tween-‐20 (all 50µl/well). All test samples and secondary antibodies were diluted in PBS+1% skimmed milk. All tests were run in duplicate and incubations were carried out at room temperature, for 1 hour with gentle shaking. Plates were developed using 100 μl of a phosphate solution with 0.012% H2O2 substrate and o-‐phenylenediamine per well. The colorimetric reaction was stopped with 100 μl of 3 M H2SO4 after 10 minutes and the optical density (OD) was measured at 490 nm. The quality of the APC was tested by confirming binding to EPCR.
For specific cases: PfEMP1:EPCR binding: Recombinant CIDRα1 domains were added to EPCR coated plates at a concentration of 5 ug/ml. Secondary antibody anti-‐V5-‐HRP was diluted at 1:3000 (Invitrogen R96125). Plasma sample screens for inhibition of CIDRα1:EPCR binding: Recombinant HB3var03 CIDRα1.4 or IT4var20 CIDRα1.1 protein was pre-‐incubated at 0.5 ug/ml with 25% plasma, as well as a no plasma control. The protein-‐plasma sample was then transferred to EPCR coated plates and developed using anti-‐V5-‐HRP at 1:3000. Plasma sample screens for recognition of peptides: Plates coated with peptides as described were incubated with a 1:50 dilution of plasma in PBS+1% skimmed milk and developed using rabbit anti-‐human IgG-‐HRP (Dako P214) at 1:3000. Testing CIDRα1 reactivity of affinity purified IgG: IgG pools were added to recombinant CIDRα coated plates at 1:50 in PBS+1% milk. Secondary rabbit anti-‐human IgG-‐HRP was added at 1:3000 for detection. Testing CIDRα1 reactivity of affinity purified IgG: IgG pools were added to recombinant CIDRα or APC coated plates at 1:50 in PBS+1% milk. Secondary rabbit anti-‐human IgG-‐HRP was added at 1:3000 for detection. Testing CIDRα1:EPCR binding inhibition of affinity purified IgG: Recombinant CIDRα1 at 0.0012 mg/ml was pre-‐incubated with nothing or with human IgG preparations at concentrations shown in Figure 6 and Figure S6 for 1 hour before transferring to plates coated with EPCR or CD36. Secondary anti-‐V5-‐HRP was added at 1:3000.

Parasite assays
The FCR3 IT4VAR20 parasite line was cultured and PfEMP1 expression was maintained by selection for binding to recombinant EPCR as described (Turner et al., 2013). The parasite adhesion assay was carried out as previously described (Turner et al., 2013). In short, HBMECs kindly provided by M. Stins (Johns Hopkins University) were grown to a monolayer over two days. Ring-‐stage infected erythrocytes were radioactively labelled with tritiated hypoxanthine the day before the adhesion assay. Radioactively labelled late trophozoite and schizont stages were purified and adjusted to 1.25 × 10⁷ cells ml−1 in 2% FCS (in RPMI 1640). For binding inhibition, antibodies or proteins diluted in PBS were added to HBMECs in triplicates to final concentrations as shown in figure 3. PBS alone was added as a control. Twenty microlitres of late-‐stage infected erythrocytes were added to HBMECs and co-‐incubated for 1 h at 37 °C. Unbound infected erythrocytes were removed with a washing robot (Biomek 2000, Beckman Coulter) and radioactivity was measured on a Topcount NXT (PerkinElmer). The total amount of radioactivity added per well (max-‐value) was measured and adhesion was calculated as the proportion (percentage) of bound radioactively labelled infected erythrocytes out of the total amount of radioactively labelled infected erythrocytes added per well. The binding was then normalised into units by assigning the value 100 to the percentage radioactivity bound and recovered under optimal conditions.
Sequences of recombinant CIDR domains used in this study
>CIDRa1.4 HB3var03_HB3 PDCGVECKNETCTPKTVIYPDCGKNEKYEPPGDAKNTEINVINSGDKEGYIFEKLSEFCTNENNENGKNYEQWKCYYDNKKNNNKCKMEINIANSKLKNKITSFDEFFDFWVRKLLIDTIKWETELTYCINNTDVTDCNKCNKNCVCFDKWVKQKEDEWTNIMKLFTNKHDIPKKYYLNINDLFDSFFFQVIYKFNEGEAKWNELKENLKKQIASSKANNGTKDSEAAIKVLFNHIKEIATICKDNNTNEGC >CIDRa1.1 IT4var20_IT4 PDCVVQCKGGKCTEDKKNDKCRSKIIKKILQSEEPTEIHVLNSDDKQGDITKKLEVFCSSTTNYEGRNVQKWKCYNKNSDYNNCEMNISSYKDSTDANVMLSVECFHSWAKNLLIDTIKWEHQLKNCINNTNVTYCESKCIKNCECYEKWIKRKEHEWEKVKNVFGNNNRMSYIYYNNLSRVFDSFLFQVMFALDQDEKGKWDQFTEDLKKKFEPSKTNTPTGKSQDAIEFLLDHLKDNALTCRDNNSNESCDVSKKVKTNPC >CIDRa1.1 PFD0020c_3D7 PDCVVECDGKTCTQKTDDDKNCRSKIIQKILESETPIEIEVLYSDDKQGVITEKLKDFCRGPNNYNDENLQKWKCYNKNSEYNKCEMISWLYQDPKEYNLMLSVECFHSWAKNLLIDTIRWEHQLKNCINNTNVTDCTSKCIKNCECYEAWIERKKDEWEKLKEVLNKKDETSHNYYNKLKDVFDRFLFQVMFALDQDEKGKWDQFTEDLKKKFGPSVESAGTANSQDAIEFLLDHLKDNALTCRDNNSIKPCTYPPNPTPNPC >CIDRa1.8a MAL6P1.316_3D7 PACVVECDGGKCEEKKNSDGTCIEAQIYTVVRDETPTPIKVLFSGDHQKDITKKLSSFCKNPESENNRDYQTWQCYYKSSDYNNCEMKGSLYKVEGDPNIIVSHECFHLWVQSLLI

DTIKWETKLKKCINNTNVTNCYNKCNKNCECFENWVEQKKKEWENVNDVYKDQKQSLGIYYEKLENLFKSNFFQVMKALEGDEKGKWYQFKDDLKKKFEPSEKNTRTTDSQDAIKLILDHLKDNATTCKDNNSLEEDENC >CIDRa1.6a PFD1235w_3D7 PECGVQCSGTTCTPKKVIHPNCKDKETYEPGDAKTTDITVLYSGDEEGDIAQKLQDFCNDKNKENDENYEKWQCYYKSSEINKCQMTPSSHKVPKHGYIMSFYAFFDLWVKNLLIDSINWKNDLTNCINNTNVTDCKNDCNTNCKCFENWAKTKENEWKKVKTIYKNENGNTNNYYKKLNNHFQGYFFHVMKELNKEEKWYKLMEDLKEKIDSSNLKNGTKDSEGAIKVLFDHLKDIAERCIDNNSKDSC >CIDRa1.6b IT4var18_IT4 PYCGLDCGGKTCTAKQEIYPDCVYNGAYEPPNGAETTEITVLYNDNEGDMSKKLSQFCSNENKENIENYQKWKCYYKDRDDIECEMISSSQKDEKHRKVMIFYNFFDLWVKNLLRDSIKWEIELKDCINNTNVTDCNNKCNKNCECFDEWVKQKEKEWGSIKDVLKKESNMPEKYYININKNFEFYFFRVMFELKKEEKWNKLMENLRIKIKSSKSNKGTIDSDGAIKVLFDHLKEIAEKCIDNNSKDSC >CIDRa1.6a HB3var02_HB3 PECGVQCSGTTCTPKKVIHPNCKDKETYEPGDAKTTDITVLYSGDEEGDIAQKLQDFCNDKNKENDENYEKWQCYYKSSEINKCQMTRSSKKVPKHRGVMSFYAFFDLWVKNLLIDSINWKNDLTNCINNTNVTDCNKDCNKNCVCFDQWVIKKEEEWKNVNKVFENKNIDLHDYYNKLNKHFEGYFFHVMKELNKEEKWYKLMEDLKEKIDFSKGKADGKNSEGAIKVLFDHLKEIAEKCIHNNSNESCEASTNRTPNPC >CIDRa1.1 IT4var06_IT4 PDCVVQCDGKRCAEDTKDNNCRSKIIEEILQSEETTDIYVLYSGKGPGAITKKLHDFCSNTNKEDRKYYKKWKCYNKNKDYNNCEMNISSYKDATDPNVMLSVECFHSWAKNLLIDTIRWEHQLKNCINNTNVTDCKSKCNSNCQCYEKWIKEKEKEWPQVKGVLKKKDETSHNYYDKLKDVFDRFLFEVKGALDQDEKGKWDQFTKDLEKKFGPSVESAGTANSQDAIELLLDHLNDNAITCKDNNSLKEDKNC>CIDRa1.2 HB3var1csa_HB3 PDCGVKCDGIKYTHKSDNDRERVNNEDYKPPWGVKPTNITVLYSGNEQGDITQKLENFCNSSTNYKDKNNQKWECYYKDENINRCKLEQNTEINNDNPKIISFHNFFELWVTYLLRDTIKWNDKLKTCINNTTTHCIDECNRNCLCFDRWVKQKEEEWNSIKKLFTKKKNMQQSYYSNINNLFEGYFFKVMDKLDKNEAKWKELMENIKKKKNEFSNLKNNRDYLENAIELLLDHLKETSTICKDNNTNEAC >CIDRa1.3 PFE1640w_3D7 PHCEVDCENGNCEVKNKPDGNCGKNVKYKPPYGVKPTEITVLYSGNEKGDISKKLSEFCSNKNNINVKNNETWKCYYKNSDNNKCKMESNSENNKGAEKITSFHEFFELWVKNLLKDTMKWENEIKDCINNTNITDCNDECNKNCVCFDKWVKQKEEEWKNVKKVFENKKYIQDKYYLDINKLFESFLFKVISELDQGEAKWNQLKEELKKKIESSKANEGIKDSESAIELLLDHLKESATTCKDNNANEAC >CIDRa1.4 DD2var32_DD2 PDCGVECNKGTCKKKPNDSNCRNNEAYIPPRDVTPTKINVLYSGDGHGDITKKLKGFCSNPTDYDGKNYENWQCYYKSSEDNKCQMTSLSQTLQKHHYVMSFYAFFDFWVRKFLIDTIKWENELKNCINNTTTDCSDGCNKHCVCFDKWVKQKEKEWNSIKKLFTKKNNVPQPYYTNINNLFDSFYFQVMYELNHDEAKWKELTQELRNKINSSKKNTDAADSKDAIELLLEYLKEKSTICKDNNTNEAC >CIDRa1.4 PF11_0521_3D7 PDCGVDCSSGTCIEKKDDINCGKKINYEPPHGVKPIDIIVLYSGNEEGEITKRLSEFCTDSSNNKGKNYEQWKCYYKNGDDNKCKMVKNSGNNITEEKIISFDEFFYVWVRKLLIDSIKWENELNNCIDNTSTHCNKECNKNCECFDKWVKKKEDEWKNVKNVFENKNGTSHNY

YNKLNGLFKGFFFEVMDKLNKDETKWNKLIESLRTKIDSSKENIGTGNTQDTIKVLLDHLKETATICKDNNTNEAC >CIDRa1.5a DD2var43_DD2 PDCGVECKNGRCKKKMDTGNNCGEPYIYNIPKNVNPIGINILNSDDEHVDIVKRLSEFCRDSKKENGKNTEIWHCYYIGDKHNQCKMEKAVAENKHQTKITTFDFFFDLWIKNLLRDTINWKSELKNCINNKNTEKCNKECNENCKCFEKWVKQKEQEWKNVKKVFENKNGTSQNYYNKLKSHFDNYFFLVINNVNQGEEKWKKFTDELRKKMDFSKANTGTNDAQDSIKILLDHEKKNAGTCLENNPSEPC >CIDRa1.7 DD2var49_DD2 PHCGVVCNNGTCRDKPNNGNCGNNVIYNPPQGVTPTNLNVLYSADQEGDISNKLSEFCNEEIEKNSQKWQCYYVNSYINACKMEKKNGNNTSEEKITKFHNFFEMWVTYLLTETITWKDKLKTCMNNTKTADCIDECSTNCVCFDKWVKQKEQEWNSIKELLTEEQKNPKQNYGNINIYFESFFFHVMKKLNKEAKWNKLMDELRNKIELSKGNEGTKDLQDAIELLLDHLKEIATICKDNNTNEAC >CIDRa1.1 2110-‐3_2110 CPDCVVECVGGECKQKTDDDKNCRSKIIEEILKGEEPTVIDVLYSGNGQGVITKKLHDFCSSTNKEDDKYYKKWKCYNKNSDYNNCELISSLSTDPNDPNVMLSIKCFDSWARNLLVDALKWEHQLKNCINNTNVTDCKSNCNNNCKCYEEWIKRKGREWKQVKGVIENNDEGSHYYYKNVKNLFYNFLYPVIYKLEKEEKNGKWDQFMEDLKKKIESSETNTHTTDSQDAIELLLDHLKENAITCKDNNSLEEDKNC >CIDRa1.1 IT4var19_IT4 PDCVVVCEGGNCKEKTEDDNCRSEIIKKILKYETPTPIDVLYSGKGQGLITKKLEDFCSSTTNYEGTNVQKWKCYNKNKDYNNCEMNISSYKDATDPNVMLSVECFHSWAKNLLIDTIRWEHQLKNCINNTNVTDCTSKCIKNCECYEKWIKEKEKEWPQVKGVLKKKDETSHNYYDKLKDVFDRFLFEVKGALDQDEKGKWDQFTKDLEKKFGPSVESAGTANSQDAIELLLDHLNDNATTCKDNNSLAVENC >CIDRa1.4 IT4var07_IT4 PDCGVICENGKCVVKENGSNCRHYNIYEPAPDVKTTEINVIVSGDEQGIITKKLQDFCMNPNNENGTNNQIWKCYYKDEKENKCKVETKSGNSTYKEKITSFDEFFDFWVRKLLIDTIKWETELTYCINNTTNADCNNECNKNCVCFDKWVKQKEKEWKNIMDLFTNKHDIPKKYYLNINDLFNSFFFQVIYKFNEGEAKWNKLKENLKKKTESSKKNKGTKDSEAAIKVLFDHLKETATICKDNNTNEAC >CIDRa1.1 IGHvar19_IGH PDCVVVCSNGTCSQKKDDDHCRSEIIKKILKYETPTPIEVLYSGDGQGLITEKLHEFCRGPNKVDSKNYKTWNCYNKNNDYNKCEMISWLYEDPKKSNLMLSIQCFDSWVQNLLIDTIKWEYELKDCINNTYDADCNDECNKNCECYEKWIKQKEKEWQKVKNVFGNNNRMSYIYYNNLSRIFDSFLFPVIYKLQKEEKDGKWDQFTKDLKKKFESSETNTPTGNSQDAIEFLLDHLKDNATICKDNNTNEAC >CIDRa1.1 PFCLINvar30_PFCLIN PDCVVKCDGKTCEQKKDDENCRSKIIQKILQGEEPTVIDVLYSGKGQGLITKKLHDFCSSTNKEDDKYYKKWKCYNKNSDYNNCELISSLSTDPTDPKVMLSIKCFDSWARNLLVDALKWEHQLKNCINNTNVTDCKSNCNNNCKCYEEWIKQKEKEWQKVKGVLKKKDKNSDNYYKNVKNLFYSFLFQVIYELEKEEKNGKWDQFMEDLKKKIEASQKNKGTENSQDAIELLLDHLKDNATICKDNNTNEAC >CIDRa1.1 RAJ116var08_RAJ116 PDCVVDCTGGNCKENKKHDNCRSKIIEEILRSEETTDIDVLYSGKGPGAITKKLHDFCSNPNNYKRANVQKWKCYNKNKDYNNCEMNISSYKDATDPNVMLSVQCFYSWAQNLLIDIIRWEHQLKDCINNTNVTDCDNECNKNCECFEKWIKQKQKEWQQVKEVLKKKDE

NSHNYYNKLRSVFDSFLYQVMFALNNEEKGKWDQFTEDLEKKFESSKKSAGTGNSQDAIEFLLDHLNDNAITCKDNNSKESC >CIDRa1.1 GA011_ERS009959 PDCVVYCEGGECKENENGDNCRSEIIKEIVRSETPTVIDVLYSGNGQDHITEKLDHFCSSTNKEDRKYYKTLKCYNKNNDYNKCEMISWLYQDPKESNLMLSIQCFYSWAQNLLIDTIRWEHQLKDCINNTNVTDCKSNCNKNCKCYKKWIEQKGSEWQQVKQVLKKKDKNSENYYDKLKDVFDTLYFEVMHELNKGKEKGKSEELTEDLKKKFGPSKKNTDAADSKDAIEFLLDHLNDNAITCKDNNSLAVENCTRTKSNPC >CIDRa1.5a 1965-‐2_1965 PDCGVECKNGRCKKKTDADGNCGKTQIYDIPKDVTPTDINVLYSGDEYGDIAKRLSEFCRDSKKENGKNTEIWHCYYIGDKHNQCKMEKAVAENKHQTKITTFDFFFDLWIKNLLRDTINWKSQLKNCINNTNKTNCNKTCNENCKCFENWVNQKEKEWNNMKELFKNKNRTSQNYYNKLKSHFDNYFFLVINNVNKGEAKWKKFTDELRNKIDSSKAKNGTSDSQDSIKMLLEHLKEDGTTCTANNPDSICNTPGTDARSLEPASKIEPQNKDTRTNPC >CIDRa1.5a GA013_ERS010323 PYCGVDCSNGTCKENGNDDNCGEQQNYNIPKGVDPTNINVLYSVDGHGDIAKRLSTFCNDKNNKNAKNNEIWQCYYIGHKNNQCKIEKSVSQKKHQTKIAPFDYFFDLWVTNLLRDNIDWKNELKNCINNKNTEKCNKECNDNCKCFQSWLNKKEDEWNKITGLLKNKNGILQNYYNKLKSHFDYYFFQVINNINKGEEKWKKLKEDLKKEIDFSKLKTNTGDSQDSIKLLLDHENKNAGTCLKNNPIDSCPKAEPQKSDEKVQPQDTPPNSC >CIDRa1.5a GA014_ERS010022 PYCGVDCNGTTCTPKTVIYPDCGNNDVYEPPRGVTPTDINVLYSGDEYGDIAKRLSEFCNDKNNKNGKKNETWKCYYENSEKNMCKMDKNSKNHTSEEKITSFDYFFDLWVTNLLRDTINWKNDLMNCINNKKMKNCNKTCNDNCKCFQSWLNKKEDEWNKITGLLKNKNRTSQNYYNKLNNHFQGYFFQVTNEVNKDEAKWNQFTEELRKKMDFSKANTGTNDSQDAIKVLLEHLKEDGKTCTANNPDSACNNPKAARIIIRATTRNPC >CIDRa1.5b 1918-‐5_1918 PDCGVKCTNGKCEEKTDVDGNCGNKETYIPPRDISPTEISVLYSGYKRDDISEKLETFCREPTNNKSKNNETWKCYYKHSYNNKINKCIRQNEENIKNKLIINLDTFFEFWVRSFLNDTIDWKYDLNTCMNFTNTTKCNNNCNKNCKCFEQWVNKKETEWKNVAQYFFKHNEISKKKYCEILKDIFENYYVEVIKKVFKGDNKWKEIMVDIKNKIDCSNLKNGTEHLEKIINVLINQEQADATTCLKNNPIESCPKAEPQKSDENTQPQDTPPNSC >CIDRa1.5b 1983-‐13_1983 PDCGVECNGKTCTKKEETDENCGKPPNYTIPTDVTPTDINVLYSGDEQGYITKRLSEFCGPTKNYIGKKNELWKCYYDDKQKNNNNNNNICKLQPNAHIKNENIIINFDNFFEFWVRRFLNDTIDWKYDLNTCMNFTNTTKCNNNCNKNCKCFEQWVNIKKTEWKNVTEYFFKHDETSKKKYCEILKDIFENYYVEVIEKFYKGKHKWKERIEKLKNMDCSQVKIGTNASQDQIDIFLSNLKGDATQCTSKNPKSACNKPHAARIITRATTRNPC >CIDRa1.5b GA017_ERS010601 PDCGVECTKGRCEKKAETDDNCGKPPIYTIPTDVTPTDINVLYSGDEQGYITKRLSKFCGPRKNYIGKKNELWKCYYDDKHNNKDNICITDTNQKITNRYIMNFDNFFEFWVRRLLIDTINWEYKLKTCIDNNNNDKCISGCNEDCKCFDKWVDQKEKEWKSVKKHIAKEKEIGKNKYCEKLKKIFSDYYVQVIETIYKGKHKWKRRIESIKKIDCSQVKIGNKDSEYQIDTFFRSVKEGATQCTSKNPKSACDKPKAARIITPATTRNPC >CIDRa1.6b GA018_ERS010570 PYCGLDCVGTECTAKEEIYPDCVYNGEYDPPKDVRPTEINVIDSGNAVNISEKLNDFCTNPTNPNDKIYQKWQCYYKSSKVNKCQMTSLTQTLQKHHYVMTFYIFFDLWVKNLLRDSVKWEIELKDCINNTNVTDCNNKCNKNCVCFDKWVKQKKKEWDSIKKLFKTEKDE

MKKYYTNINKNFEFFFFRVMYELNNEEAKWNKLMENLRIKIKSSKRNKRTKDSEGVIKVLFDHLKETATICKDNNTNEACVSSQNATTNPC >CIDRa1.6b GA019_ERS010031 PYCGLDCVGKTCTAKQEIYPDCVYNGDYEPPNGAETTEITVLYNDNEGDMSKKLSQFCSNENKENIENYQKWKCYYKDRDDIECEMISSSQKDEKHRKVMIFYNFFDLWVKNLLRDSIKWEIELKDCINNTNVTDCKSVCNVNCECFDKWVKQKEKEWDSIKKLLKKKKNVSKKYYTNINKNFEFFFFRVMYELNNEEAKWNKLMENLRTKINSYKKNKRTKDSEGAIKVLFDHLKETATICKDNNTNEACVSSQNATTNPC >CIDRa1.7 IT4var22_IT4 PYCGLDCGGKTCTAKQEIYPDCVYNGAYEPPNGAETTEITVLYSADQEGDISNKLSEFCNDENNKNSQKWQCYYVSSENNGCKMEKKNANHTPEVKITKFHNFFEMWVTYLLTETITWKDKLKTCMNNTKTADCIHECNKNCVCFDKWVKQKEDEWNSIKKLFTKEKKMPKQYYGNINIYFESFFFHVMKKLNKEAKWNKLMDELRNKIELSKGNEGTKDLQDAIELLLEYLKEKSTICKDNNTNEACDPTVDPTKNPC >CIDRa1.7 1965-‐8_1965 PHCGVDCNGKKCTLKSDNDPQCVNKLKYEPPYGVKPTEITVLYSADQEGDISKKLSEFCNDEKKINSKNIETWKCYYKSTYNNACKMDKNSKNHTPEVKITKFHNFFEMWIVYLLTETITWNDKLKTCMNNIKTTDCIDECNTNCVCFDKWVKQKGKEWNSIKKLFIKEQKNPKQNYGNINIYFESFFFHVMDKLNHDEAKWNELMNELKQIIDSSKANTDNKNLQDAIKVLFDHLKEIATICKDNNTNEACEDSKKETQNPC >CIDRa1.4 1918-‐3_1918 PDCGVECNGETCTPKKEKYPECLNKEIYTPNGAKTTEINVIVSGNEQGDITKKLEDFCNNSTNYKGKNYQKWQCYYENSKKNMCKMDKNSKNHTSEEKITKFHNFFELWVIYLLTETIRWNDKIKNCINNTTIHCIDKCNKNCVCFDKWIKQKEQEWNSIKKLFIKKQKMPNEYYLNIKNHFEGYFFHVMKKLNKEAKWNELMENLRTKINSSKKNKGTKDSEGAIKVLLDHLKETATICKDNNTNEGCVSSKKSKTNPC >CIDRa1.7 1914-‐14_1914 PDCGVQCNGEKCKEKEYDHECENDEDYGLPSDVTPIDITVLYSGNEAGDISEKLKDFCNISTKYEGKNYENWQCYYKNKNKNKCKMEQNSKKDKDKPKITKFHNFFELWVIYLLTETIRWNDKIKNCMNNTNITDCSDGCNKHCVCFDKWVKQKEEEWNSIKKLFIKEQEMPNEYYLNIKNHFEGYFFHVMDKLNHDEAKWKELTQELKKKIDSSKEKPGTKDSESAIELLLDHLKEIATICKDNNTNEACASSKKSKTNPC >CIDRa1.4 GA024_ERS010438 PDCGVECTNGRCEKKAETDGNCGNKETYKPPHGVEPIDITVLYSGNEEREITKRLSEFCTDSSNNKGKNYENWQCYYKNGDDNKCQMTSLTQTDEKHRYVMTFHKFFNFWVRNLLIDTINWETDLRNCLNNTGITDCNDGCNNNCTCFDKWVKQKEGEWNSIKLLLAKEQKMPKKYYLNINDLFDSFFFEVMDKLNKDETKWNKLKENLKKKIKSSNENRGTKDSESAIELLLDHLKEIATICKDNNANEACETSRNRKTNPC >CIDRa1.8a GA026_ERS010178 PDCVVDCKGAKCEQKMKPDGTCEKPQIYTRPKDVTPKIIKVLFSGDNQEDITEKLSSFCSNPKSKIDRNYQTWKCYYKSGHYNICEMKGSLYKYPEHPNDMLSVECFHLWVKNLLIDTIKWETKLKKCINNTNVTDCDNECNKNCECFENWVEQKKKEWEEVRKVYKDQKESLGIYYKKLENLFDTYYFEVMGALENEEKHGKWNQLTAKLKQIIESHKKNRHSGNSQDAIELLLDHLKETATTCKDNNSNESCDVSKDSKTNPC >CIDRa1.8b 2053-‐3_2053 PICGVKCENKSCTDKENDDDCKNKKKYDPPKGVTPIDIPILYSGDKQGDITKKLEDFCYNRTKENEKTYQNWKCYYKDSEFNKCKMESKSGKSTTQEKIISFDEFFYLWVNNLLIDSIMWENDIKHCINNTNVTNCKNKCNENCKCFKNWVKKKEEEWTKVKQILGNRSENLN

NYYNKLNSLFKGFFFEVVYKFNNKEEKWNKLTEKLEQKIGSSKGKEGVENPKDAIELLLDHLKENAITCKDNNSLEEDKNCPKIKINPC >CIDRa1.8b 1702-‐3_1702 PDCIVVCDYKGCKENKNDENCKSKRTYSLPPDVNSTEIEVLFSGDNQEDIVEKLSSFCKNTNNENGENVEKWECYYESEHNNKCKMTSPKHKDEKRPTVMIFDEFFDFWVTHLIKDTIKWESDINDCINNTNVTDCDSACNENCKCFDEWVEKKEVEWGNVKKVLGNRSENLNIYYNKLNGIFSGFFFGVMHELKKKEAKQGVKAEEAQEAEETQEAQEEEAKWNKLTAKLQEIIDSSKGKADTANSQDAIKPLLEYIKETATTCIDNNSLAVENCPKTKINPC >CIDRa1.8b GA029_ERS010532 PDCVVVCERGNCTEKKGDDKCRKKYTYEIPAGMESTKIDILFSGENQEDITEKLRSFCKNTNNENGENIEKWECYYKNEYDNKCKMTSLKREDQKHHDLMSYYEFFDFWVTHLIKDTIKWESDINDCINNTNVTNCNNGCNENCICFEKWVGQKEKEWENVKKVLKNPSENLNNYYNKLNGIFSGFFFGVMHELKKKEAKQGVKVEKAEKSEEAQEAQEEEAKWNKLTAKLEEIIKSHKENTGTGNTQDAIEPLLKYLDENAITCKDNNSLKEDKNCPKTKKNPC >CIDRa1.6a PF08_0140_3D7 PDCGVEYKNGRYTAKDQKYPDCRNEKYDPNNAETTDITVLYSGDVGDFSEKLQDFCNDINNGKVKNYQIWQCYYENSEINKCQMTPSSHKVPKHGYIMSFFAFFDLWVKNLLIDTINWKNELTNCINNTNVTDCKNDCNTNCKCFENWAKTKEKEWENVKTIYKNENRNTNNYYKKLNDLFKGYFFHVMYELNNEEAKWNKLMKNLRTKIDSSRKNAGNEDSEGAIKVLFDHLKDIAERCIDNNSIKPC >CIDRa1.4 GA045_PREICH PECGVKCEHGSCRDKPKDDHCINKNEYDPPRDVTPTNITVIYSGNEEGEITKRLSAFCTDSSKDEGKNYQKWECYYVNSDSNRCKMDKTSGKNMTEDKITSFDEFFYSWVQNFLIDTIKWENELNNCINNTILTDCNDGCNSNCVCFDKWVKKKENEWKKVKNVFENKSGISDNHYKKLNGLFDSFFFPVMHALNEQEKRKWKELTKKLEEISGFSKGKTGTVNSQDTIKVLLDHLKENATICKDNNTNEAC >CIDRa3.1 DD2var01_DD2 PYCGVKKVNNGGSSNEWEEKNNGKCKSGKLYEPKPDKEGTTITILKSGKGHDDIEEKLNKFCDEKNGDTINSGGSGTGGSGGGNSGRQELYEEWKCYKGEDVVKVGHDEDDEEDYENVKNAGGLCILKNQKKNKEEGGNTSEKEPDEIQKTFNPFFYYWVAHMLKDSIHWKKKLQRCLQNGNRIKCGNNKCNNDCECFKRWITQKKDEWGKIVQHFKTQNIKGRGGSDNTAELIPFDHDYVLQYNLQEEFLKGDSEDASEEKSENSLDAEEAEELKHLREIIESEDNNQEASVGGGVTEQKNIMDKLLNYEKDEADLCLEIHEDEEEEKEKGDGNECIEEGENFRYNPC >CIDRa3.5 IT4var15_IT4 PGCGVELIGNEWKEKNKGECKGGKRYNIPKGTKHNVIPVLSFGDEHKEIIEKIEQFCAESNSDSSKLTEQWKCYYGDKEYEVCTLENRNKSEEDPEEIQKTFHNFFYFWIRHLLNDSIEWRDKINNCIEKAKEGKCKNECKTDCGCFQRWIGKKKEEWGEIKKHFKTQDGFSIFGNNYDFVLENVLNIDELFQDITEAYGNSQKIQGIKDTLAKKKTQAADDATEQKNTIDLLFEYDSEEAEKCKKIQEECQPKKPTKVRNPC
Supplemental figure legends:
Supplemental Figure 1 – Binding of CIDRα1 variants to EPCR – related to Figure 1
A. ELISA was used to study binding of 40 recombinant CIDRα1 and two CD36-‐binding CIDRα3 variants binding to EPCR and CD36. Domains were classified as EPCR binders if OD > 0.1. B. Surface plasmon resonance was used to quantify the binding of CIDRα1 domains to an EPCR coupled surface. EPCR was coupled by capture using a biotin attached to a BAP tag at the N-‐terminus and the chip was regenerated and coupled with fresh EPCR after each cycle. CIDRα1 domains were injected at concentrations described in Table S2.
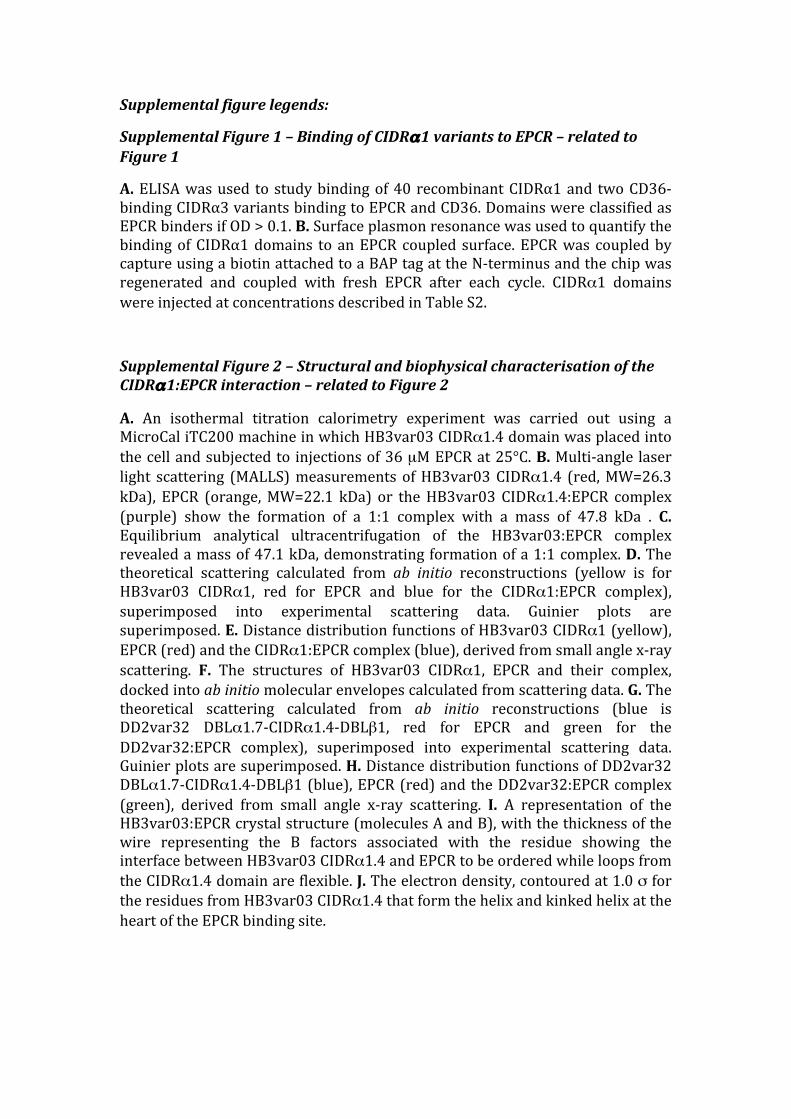
Supplemental Figure 2 – Structural and biophysical characterisation of the CIDRα1:EPCR interaction – related to Figure 2
A. An isothermal titration calorimetry experiment was carried out using a MicroCal iTC200 machine in which HB3var03 CIDRα1.4 domain was placed into the cell and subjected to injections of 36 µM EPCR at 25°C. B. Multi-‐angle laser light scattering (MALLS) measurements of HB3var03 CIDRα1.4 (red, MW=26.3 kDa), EPCR (orange, MW=22.1 kDa) or the HB3var03 CIDRα1.4:EPCR complex (purple) show the formation of a 1:1 complex with a mass of 47.8 kDa . C. Equilibrium analytical ultracentrifugation of the HB3var03:EPCR complex revealed a mass of 47.1 kDa, demonstrating formation of a 1:1 complex. D. The theoretical scattering calculated from ab initio reconstructions (yellow is for HB3var03 CIDRα1, red for EPCR and blue for the CIDRα1:EPCR complex), superimposed into experimental scattering data. Guinier plots are superimposed. E. Distance distribution functions of HB3var03 CIDRα1 (yellow), EPCR (red) and the CIDRα1:EPCR complex (blue), derived from small angle x-‐ray scattering. F. The structures of HB3var03 CIDRα1, EPCR and their complex, docked into ab initio molecular envelopes calculated from scattering data. G. The theoretical scattering calculated from ab initio reconstructions (blue is DD2var32 DBLα1.7-‐CIDRα1.4-‐DBLβ1, red for EPCR and green for the DD2var32:EPCR complex), superimposed into experimental scattering data. Guinier plots are superimposed. H. Distance distribution functions of DD2var32 DBLα1.7-‐CIDRα1.4-‐DBLβ1 (blue), EPCR (red) and the DD2var32:EPCR complex (green), derived from small angle x-‐ray scattering. I. A representation of the HB3var03:EPCR crystal structure (molecules A and B), with the thickness of the wire representing the B factors associated with the residue showing the interface between HB3var03 CIDRα1.4 and EPCR to be ordered while loops from the CIDRα1.4 domain are flexible. J. The electron density, contoured at 1.0 σ for the residues from HB3var03 CIDRα1.4 that form the helix and kinked helix at the heart of the EPCR binding site.

Supplemental Figure 3 - A sequence logo describing conservation across the EPCR-binding CIDRα1 domains – related to Figure 2
All sequences of CIDRα1 subclasses 1.1 and 1.4-‐8 were aligned and a sequence logo generated (of positions corresponding to residues of the HB3var03 CIDRα1 domain). Residue positions are numbered according to the position in HB3var03. Below the logo is shown the secondary structure in HB3var03. Size polymorphisms are indicated >< for deletions and <> for insertions (see table for details). Residues that make direct contact with EPCR are annotated with * above the logo. Cysteines are labelled, with C5-‐C12, C6-‐C7, C8-‐C10, C11-‐C13 forming disulphide bonds in HB3var03.
Supplemental Figure 4 – Binding of HB3var03 CIDRα1 mutants to EPCR – related to Figure 3
Surface plasmon resonance was used to quantify the binding of mutants of the HB3var03 CIDRα1.4 domain to an EPCR coupled surface. EPCR was coupled using a biotin attached to a BAP tag at the N-‐terminus and the chip was regenerated and coupled with fresh EPCR after each cycle. CIDRα1 domains were injected at concentrations described in Table S6.
Supplemental Figure 5 – Sequence diversity of the nine EPCR interacting residues of CIDRα1 domains
A maximum likelihood tree built on the nine residues that directly interact with EPCR forms subgroups similar to trees built on the whole domains. Branches are coloured according to the sub-‐classification of the whole domain given in Figure 1. Sequence logos for each CIDRα1 subclass show the diversity of the residues making direct contacts with EPCR.
Supplemental Figure 6 – Human IgG pool reactivity to recombinant CIDRα1 domains – related to Figure 6
A. Two human IgG pools were made from human plasma samples selected after screening for reactivity to either a UPSA CIDRα1 (HB3var03 CIDRα1.4) or a UPSB CIDRα1 (IT4var20 CIDRα1.1) as described in materials and methods. From the pools, IgG was affinity purified on 63-‐amino acid peptides corresponding to the EPCR binding region of either HB3var03 or IT4var20 CIDRα1 domains. The graph shows CIDRα reactivity of the IgG pools prior to purification, the purified IgG pools and the run-‐through IgG (that did not stick to the peptide) pools. B. The reactivity of IgG purified on the HB3var03 CIDRα1 domain was tested against activated protein C, showing negligible cross reactivity.

Supplemental references:
Altschul, S. (1997). Gapped BLAST and PSI-‐BLAST: a new generation of protein database search programs. Nucleic Acids Res. 25, 3389–3402.
Crooks, G.E., Hon, G., Chandonia, J.-‐M., and Brenner, S.E. (2004). WebLogo: a sequence logo generator. Genome Res. 14, 1188–1190.
Edgar, R.C. (2004). MUSCLE: multiple sequence alignment with high accuracy and high throughput. Nucleic Acids Res. 32, 1792–1797.
Franke, D., and Svergun, D.I. (2009). DAMMIF , a program for rapid ab-‐initio shape determination in small-‐angle scattering. J. Appl. Crystallogr. 42, 342–346.
Higgins, M.K. (2008) The structure of a chondroitin sulfate-‐binding domain important in placental malaria. J Biol Chem. 283, 21842-‐6.
Konarev, P. V., Volkov, V. V., Sokolova, A. V., Koch, M.H.J., and Svergun, D.I. (2003). PRIMUS : a Windows PC-‐based system for small-‐angle scattering data analysis. J. Appl. Crystallogr. 36, 1277–1282.
Miotto, O., Almagro-‐Garcia, J., Manske, M., Macinnis, B., Campino, S., Rockett, K.A., Amaratunga, C., Lim, P., Suon, S., Sreng, S., et al. (2013). Multiple populations of artemisinin-‐resistant Plasmodium falciparum in Cambodia. Nat. Genet. 45, 648–655.
Shi, J., Blundell, T.L., and Mizuguchi, K. (2001). FUGUE: sequence-‐structure homology recognition using environment-‐specific substitution tables and structure-‐dependent gap penalties. J. Mol. Biol. 310, 243–257.
Svergun, D.I. (1992). Determination of the regularization parameter in indirect-‐transform methods using perceptual criteria. J. Appl. Crystallogr. 25, 495–503.
Svergun, D.I. (1999). Restoring low resolution structure of biological macromolecules from solution scattering using simulated annealing. Biophys. J. 76, 2879–2886.
Tamura, K., Stecher, G., Peterson, D., Filipski, A., and Kumar, S. (2013). MEGA6: Molecular Evolutionary Genetics Analysis version 6.0. Mol. Biol. Evol. 30, 2725–2729.
Vistica, J., Dam, J., Balbo, A., Yikilmaz, E., Mariuzza, R.A., Rouault, T.A., and Schuck, P. (2004). Sedimentation equilibrium analysis of protein interactions with global implicit mass conservation constraints and systematic noise decomposition. Anal. Biochem. 326, 234–256.
Volkov, V. V., and Svergun, D.I. (2003). Uniqueness of ab initio shape determination in small-‐angle scattering. J. Appl. Crystallogr. 36, 860–864.

Wernersson, R. (2006). Virtual Ribosome-‐-‐a comprehensive DNA translation tool with support for integration of sequence feature annotation. Nucleic Acids Res. 34, W385–8.

Figure S1
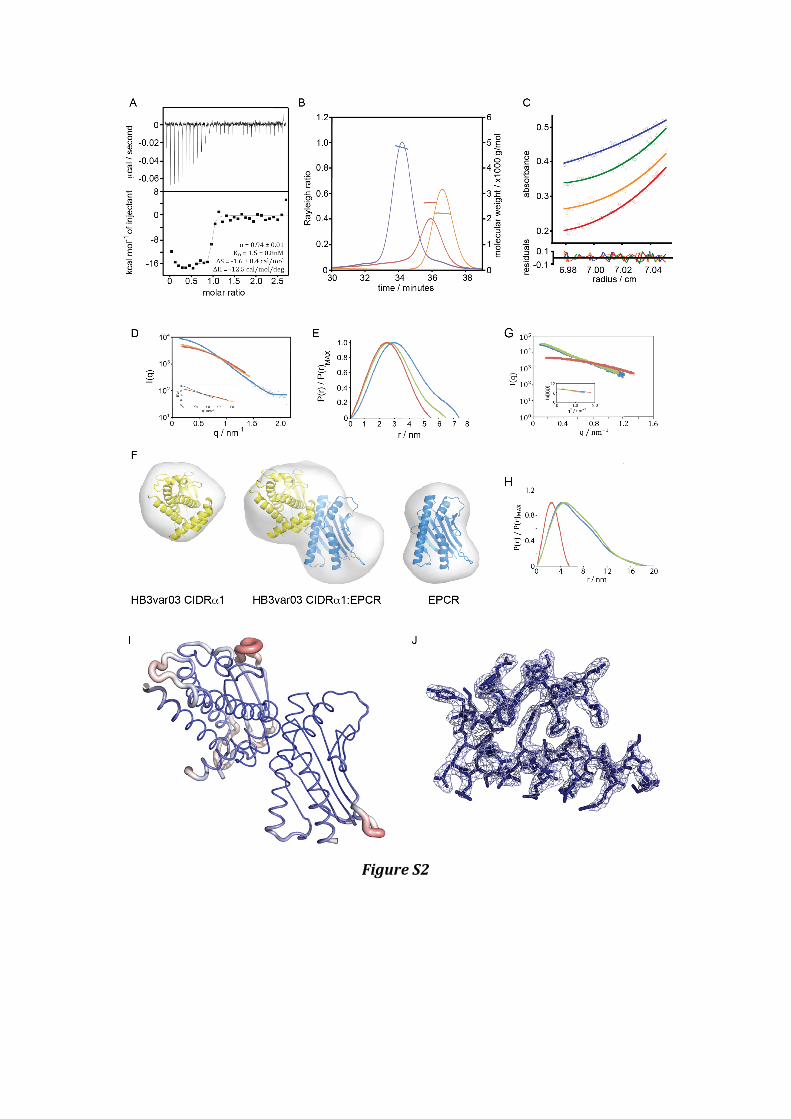
Figure S2

Figure S3

Figure S4

Figure S5

Figure S6

Table S1: Distribution and pairwise sequence similarity of the analysed CIDRα1 subclasses – related to Figure 1
Based on the maximum likelihood tree in Figure 1A we annotated the 885 CIDRα1 domains utilized for sequence variation analysis. §Redundancy was evaluated from the amino acid sequence. *Three small clusters of sequences of intermediate subtypes with highest resemblance to 1.4, 1.7 and 1.6a subtypes, respectively.
Sequence pair wise identity (%) Subtype
Total obs.
Non-‐redundant sequences§ Minimum Average Median
CIDRα1.1 168 (19%) 124 (74%) 50 68 67 CIDRα1.2 86 (10%) 25 (29%) 57 94 95 CIDRα1.3 62 (7%) 12 (19%) 56 86 100 CIDRα1.4 130 (15%) 109 (84%) 40 59 57 CIDRα1.5a 74 (8%) 54 (73%) 45 66 64 CIDRα1.5b 69 (8%) 50 (72%) 40 63 65 CIDRα1.6a 33 (4%) 25 (76%) 58 81 83 CIDRα1.6b 41 (5%) 28 (68%) 54 70 67 CIDRα1.7 104 (12%) 75 (72%) 51 68 66 CIDRα1.8a 48 (5%) 41 (85%) 59 74 71 CIDRα1.8b 32 (4%) 24 (75%) 49 69 69 Unclassified* 38 (4%) 35 (92%) -‐ -‐ -‐ All 885 602 (68%) 27 49 46

Table S2: Affinities of CIDRα1.1 domains for ECPR as measured by surface plasmon resonance – related to Figure 1
CIDR Subclass Range KD (nM) kon (M-‐1s-‐1) koff (s
-‐1) IT4var20 1.1 1uM-‐0.9nM 0.37 3.32 x 10⁵ 1.23 x 10-‐4 IT4var19 1.1 0.5uM-‐0.5nM 16 2.27 x 10⁴ 3.64 x 10-‐4 2110-‐3 1.1 1uM-‐0.9nM 32 1.57 x 10⁴ 5.11 x 10-‐4 RAJ116var08 1.1 1uM-‐0.9nM 1.4 2.79 x 10⁴ 3.85 x 10-‐5 ERS009959 1.1 8uM-‐7.8nM 182 3.89 x 10² 7.24 x 10-‐5 HB3var1csa 1.2 1uM-‐0.9nM -‐ -‐ -‐ PFE1640w 1.3 1uM-‐0.9nM -‐ -‐ -‐ HB3var03 1.4 1uM-‐0.9nM 0.37 5.32 x 10⁵ 1.97 x 10-‐4 IT4var07 1.4 1uM-‐0.9nM 1.3 3.70 x 10⁵ 4.68 x 10-‐4 DD2var32 1.4 1uM-‐0.9nM 0.3 1.06 x 10⁶ 3.43 x 10-‐4 1965-‐2 1.5a 1uM-‐0.9nM 54 1.89 x 10⁴ 1.03 x 10-‐3 ERS010323 1.5a 1uM-‐0.9nM 57 1.47 x 10⁴ 8.32 x 10-‐4 1918-‐5 1.5b 8uM-‐7.8nM 229 4.71 x 10² 1.08 x 10-‐4 1983-‐13 1.5b 8uM-‐7.8nM 168700 2.8 4.70 x 10-‐4 HB3var02 1.6a 8uM-‐7.8nM 1400 9.75 x 10² 1.39 x 10-‐3 PFD1235w 1.6a 1uM-‐0.9nM 8.8 7.55 x 10³ 6.62 x 10-‐5 IT4var18 1.6b 2uM-‐1.8nM 56 5.62 x 10³ 5.63 x 10-‐8 ERS010570 1.6b 1uM-‐0.9nM 15 3.51 x 10⁴ 5.31 x 10-‐4 ERS010031 1.6b 1uM-‐0.9nM 8.8 3.70 x 10⁴ 3.28 x 10-‐4 IT4var22 1.7 1uM-‐0.9nM 17 6.13 x 10⁴ 1.05 x 10-‐3 1965-‐8 1.7 1uM-‐0.9nM 3.5 5.92 x 10⁴ 2.10 x 10-‐4 ERS010178 1.8a 1uM-‐0.9nM 48 1.77 x 10⁴ 8.42 x 10-‐4 MAL6P1.316 1.8a 1uM-‐0.9nM 50 1.67 x 10⁴ 8.28 x 10-‐4 2054-‐3 1.8b 1uM-‐0.9nM 4 2.02 x 10⁴ 7.65 x 10-‐5 1702-‐3 1.8b 1uM-‐0.9nM 6 3.64 x 10³ 2.28 x 10-‐5 ERS010532 1.8b 1uM-‐0.9nM 24.18 6.55 x 10³ 1.58 x 10-‐4

Table S3: Analysis of insertions and deletions in the CIDRα1.1 domains – related to Figure 1
Size polymorphisms are indicated with >< for deletions and <> for insertions in Figure 1B. Here the details of the type, prevalence and size of these polymorphisms.
Size variation (residues) Average Median 199-‐252 218.7 218
Position Indel Size Prevalence Associated subtype 515 Deletion 1 8% 1.6
532-‐534 Deletion 3 6.5% 1.7 549 Insertion 1-‐6 15.5% 1.4/1.5b 559 Deletion 1 10% 1.5b 566 Deletion 1 6% 1.5b 602 Deletion 1 8% 1.4/1.7
607-‐608 Insertion 1 95% 640-‐641 Insertion 1 9% 1.5b
1-‐3 82% 665 Insertion
18-‐35 2.3% 1.8b 677 Deletion 1 7% 1.5b

Table S4: Summary of SAXS parameters of PfEMP1 domains, alone and in complex with EPCR – Related to Figure 2
The radius of gyration (Rg) was determined from the Guinier plot, and the maximum particle dimension (Dmax) and the Porod volume were calculated using GNOM. I0 is an estimate of the scattering intensity at zero angle. An estimate of the molecular weight (Mwapp) was obtained by dividing the Porod volume by 1.7 and can be compared with the predicted molecular weight from sequence (Mwcalc ), assuming a 1:1 complex.
Rg (nm) I0
Volume (nm3)
Mwapp (kDa)
Mwcalc
(kDa) Dmax
(nm)
HB3var03 CIDRα1.4 2.34 5643 42.6 25.0 26.1 6.5
EPCR 1.99 4727 38.9 22.9 20.0 5.5
HB3var03 CIDRα1.4:EPCR complex 2.63 9323 76.5 45.0 46.1 7.4
DD2var32 head (DBLα1.7-‐CIDRα1.4-‐DBLβ1 5.30 31700 263.9 155.2 140 18.7
DD2var32 head (DBLα1.7-‐CIDRα1.4-‐DBLβ1):EPCR complex 5.38 37550 309.0 181.8 160 18
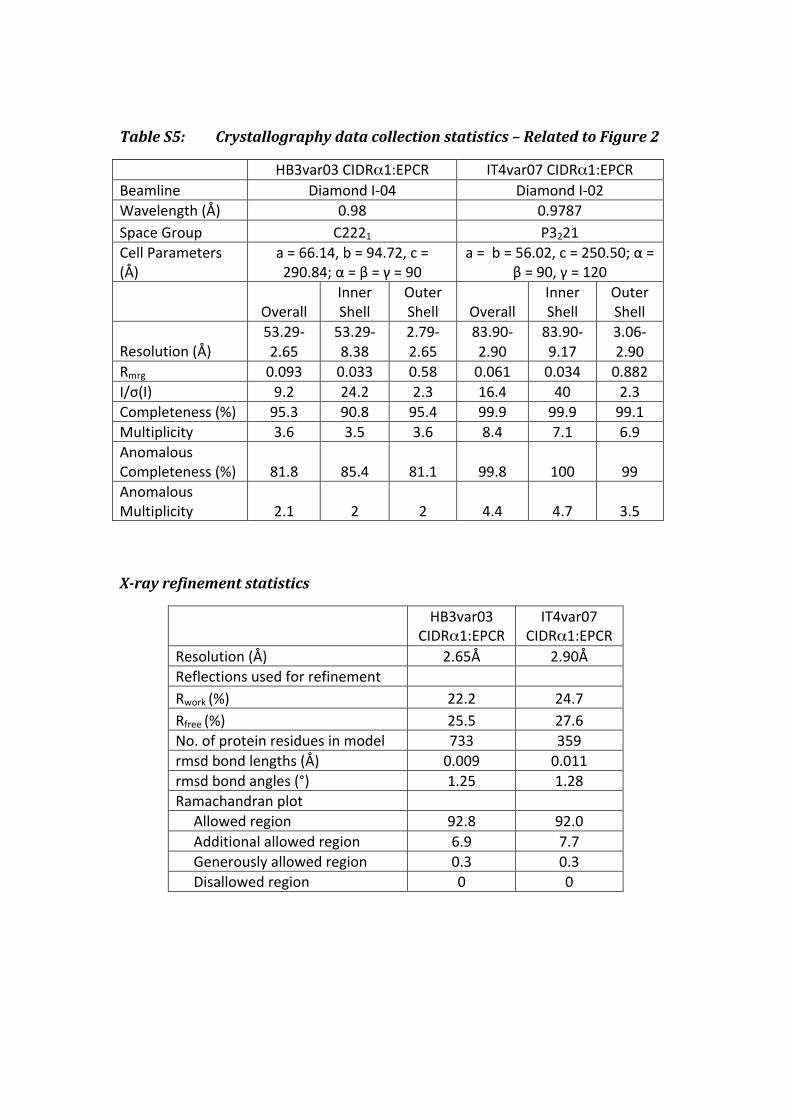
Table S5: Crystallography data collection statistics – Related to Figure 2
HB3var03 CIDRα1:EPCR IT4var07 CIDRα1:EPCR Beamline Diamond I-‐04 Diamond I-‐02 Wavelength (Å) 0.98 0.9787 Space Group C2221 P3221 Cell Parameters (Å)
a = 66.14, b = 94.72, c = 290.84; α = β = γ = 90
a = b = 56.02, c = 250.50; α = β = 90, γ = 120
Overall Inner Shell
Outer Shell Overall
Inner Shell
Outer Shell
Resolution (Å) 53.29-‐2.65
53.29-‐8.38
2.79-‐2.65
83.90-‐2.90
83.90-‐9.17
3.06-‐2.90
Rmrg 0.093 0.033 0.58 0.061 0.034 0.882 I/σ(I) 9.2 24.2 2.3 16.4 40 2.3 Completeness (%) 95.3 90.8 95.4 99.9 99.9 99.1 Multiplicity 3.6 3.5 3.6 8.4 7.1 6.9 Anomalous Completeness (%) 81.8 85.4 81.1 99.8 100 99 Anomalous Multiplicity 2.1 2 2 4.4 4.7 3.5
X-ray refinement statistics
HB3var03
CIDRα1:EPCR IT4var07
CIDRα1:EPCR Resolution (Å) 2.65Å 2.90Å Reflections used for refinement Rwork (%) 22.2 24.7 Rfree (%) 25.5 27.6 No. of protein residues in model 733 359 rmsd bond lengths (Å) 0.009 0.011 rmsd bond angles (°) 1.25 1.28 Ramachandran plot Allowed region 92.8 92.0 Additional allowed region 6.9 7.7 Generously allowed region 0.3 0.3 Disallowed region 0 0
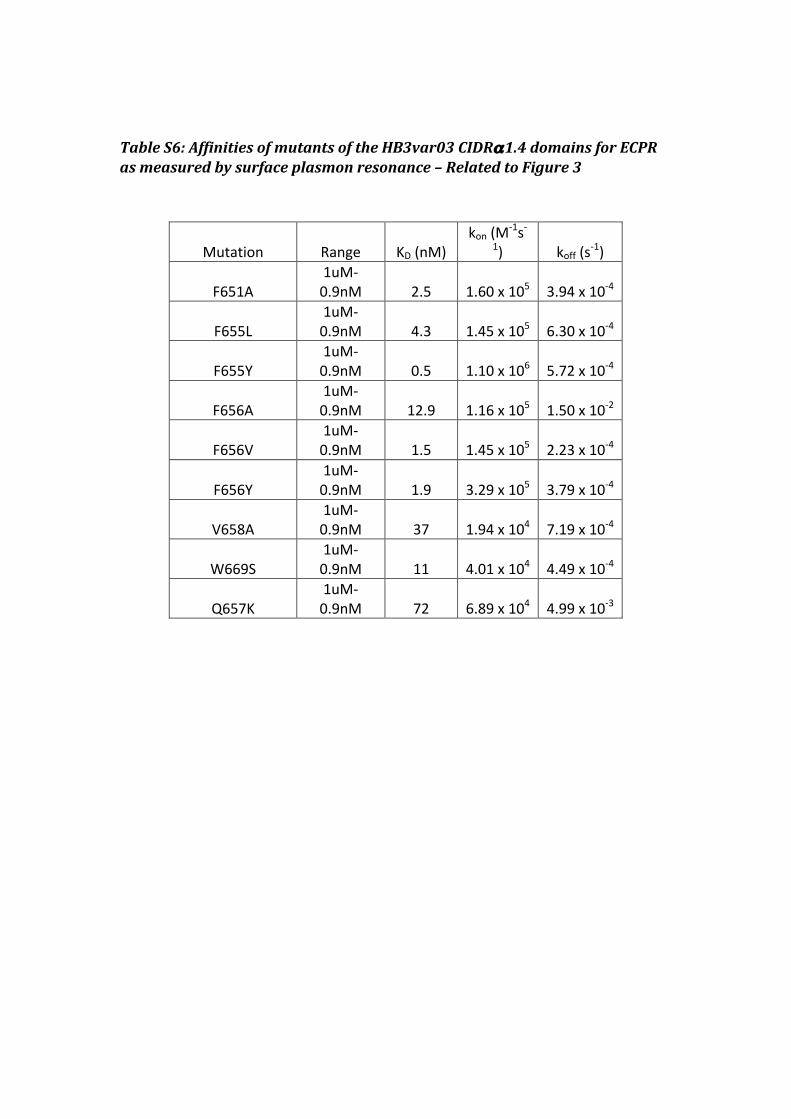
Table S6: Affinities of mutants of the HB3var03 CIDRα1.4 domains for ECPR as measured by surface plasmon resonance – Related to Figure 3
Mutation Range KD (nM) kon (M
-‐1s-‐1) koff (s
-‐1)
F651A 1uM-‐0.9nM 2.5 1.60 x 10⁵ 3.94 x 10-‐4
F655L 1uM-‐0.9nM 4.3 1.45 x 10⁵ 6.30 x 10-‐4
F655Y 1uM-‐0.9nM 0.5 1.10 x 10⁶ 5.72 x 10-‐4
F656A 1uM-‐0.9nM 12.9 1.16 x 10⁵ 1.50 x 10-‐2
F656V 1uM-‐0.9nM 1.5 1.45 x 10⁵ 2.23 x 10-‐4
F656Y 1uM-‐0.9nM 1.9 3.29 x 10⁵ 3.79 x 10-‐4
V658A 1uM-‐0.9nM 37 1.94 x 10⁴ 7.19 x 10-‐4
W669S
1uM-‐0.9nM 11 4.01 x 10⁴ 4.49 x 10-‐4
Q657K 1uM-‐0.9nM 72 6.89 x 10⁴ 4.99 x 10-‐3