CLINICAL PREDICTORS OF HYPOXAEMIA IN UNDER- FIVE …
130
i CLINICAL PREDICTORS OF HYPOXAEMIA IN UNDER- FIVE CHILDREN WITH PNEUMONIA AT THE UNIVERSITY OF ILORIN TEACHING HOSPITAL A DISSERTATION SUBMITTED TO THE NATIONAL POSTGRADUATE MEDICAL COLLEGE OF NIGERIA IN PART FULFILMENT OF THE REQUIREMENTS FOR THE FELLOWSHIP OF THE COLLEGE IN PAEDIATRICS DR RASHEEDAT MOBOLAJI IBRAHEEM MBBS (IBADAN) 2002 MAY, 2013
Transcript of CLINICAL PREDICTORS OF HYPOXAEMIA IN UNDER- FIVE …

i
CLINICAL PREDICTORS OF HYPOXAEMIA IN UNDER-
FIVE CHILDREN WITH PNEUMONIA AT THE UNIVERSITY
OF ILORIN TEACHING HOSPITAL
A DISSERTATION SUBMITTED TO THE NATIONAL
POSTGRADUATE MEDICAL COLLEGE OF NIGERIA IN PART
FULFILMENT OF THE REQUIREMENTS FOR THE FELLOWSHIP
OF THE COLLEGE IN PAEDIATRICS
DR RASHEEDAT MOBOLAJI IBRAHEEM
MBBS (IBADAN) 2002
MAY, 2013

ii
DECLARATION
I, DR. RASHEEDAT MOBOLAJI IBRAHEEM, hereby declare that this dissertation is
original unless otherwise acknowledged. The dissertation has not been presented to any
college for fellowship examination.
_______________________________
DR. IBRAHEEM R.M.

iii
CERTIFICATION
We hereby certify that Dr. Rasheedat Mobolaji Ibraheem of the Department of Paediatrics
and Child Health, University of Ilorin Teaching Hospital, Ilorin prepared this dissertation
under our close supervision.
1. SIGNATURE ___________________________________
NAME OF SUPERVISOR Prof ‘Wahab B.R. Johnson
2. SIGNATURE _________________________________
NAME OF SUPERVISOR Dr. Aishat A. Gobir

iv
DEDICATION
This dissertation is dedicated to God Almighty, the fountain of knowledge and health who enabled
me to do this work, and to all children who ever had pneumonia.

v
ACKNOWLEDGEMENT
With utmost humility and gratitude, I wholeheartedly acknowledge the Almighty God in the
pursuit of my career, and for giving me the grace to do this work. I thank my parents, most
especially my late father, who put my feet in this noble profession, and for their ever ready
support and help. I acknowledge my able supervisors, Professor ‘W.B.R. Johnson and Dr.
A.A Gobir, for always finding time for me from their busy schedule. I am immensely grateful
to Prof. Johnson who has been not only a supervisor but also a mentor throughout the
residency program. My immense gratitude goes to Emeritus Professor Adeoye Adeniyi, who
has availed me of his knowledge and experience despite retirement, and to Professors A.
Ojuawo, O.A. Mokuolu and O.T. Adedoyin. My profound gratitude also goes to my able
teachers, Drs S.K. Ernest, O.A. Adegboye, O.A. Adesiyun, J.K. Afolabi and M.A.N.
Adeboye, who out of their busy schedule found time to give advice, criticism, encouragement
and direction in the art of research and scientific writing.
I thank Drs. A. Fadeyi, H. Ekundayo and Mrs. R. Abubakar, all of the Department of
Microbiology, for their help during the laboratory analysis. The same goes for Dr. K. Jimoh
of the Radiology Department and Dr. R.O. Oladosu of the Haematology Department. I am
also greatly indebted to Dr. A. Oyeyemi of the Statistics Department, University of Ilorin for
deploying his expertise in assisting with the statistical analysis and for always willing to
explain and demystify the copious statistical analysis required.
I am deeply grateful to my senior colleagues in the department, Drs. A. Saka and M.B.
Abdulkadir for their encouragement and support. I am grateful for the support and assistance
rendered by all the members of the department; nurses, house officers especially Drs
Oyeyemi, Oyinloye and Agaja, and my co-residents.
I acknowledge the encouragement, kindness and support of my mother-in-law, Mrs B.A.
Ibraheem. To my aunt, Mrs Iyabo Ogunbiyi who looked after my children whenever I needed
Commented [MA1]: hope no change of name issues

vi
to be away for long hours (at one stage or the other of the residency training), I am indeed
grateful. My siblings and brothers-in-law are all appreciated for their understanding and
support during the ‘trying period’ of my residency training.
Finally, I am immensely grateful to my darling husband, Dr Gbadebo Ibraheem, for his
unwavering love, support and help at all times, and my children, Jibril, Haneefah and Aishat,
who endured many long days and nights without my company in my pursuit of academic and
professional goals.
To all my benefactors in accomplishing this research project, God bless you all.

vii
TABLE OF CONTENTS
Title page i
Declaration ii
Certification iii
Dedication iv
Acknowledgement v
Table of contents vii
List of Tables ix
List of Figures xi
List of abbreviations xii
Glossary of terms xiv
Summary xv
Introduction 1
Literature review 4
Justification 42
Aims and objectives 44
Materials and Method 45
Results 54
Discussion 77
Conclusions 88
Recommendations 89
Limitations of the study 90
References 91
Appendices
I. Information sheet 102
viii
TABLE OF CONTENTS continued Page
II. Informed consent form 104
III. Study proforma 105
IV. Social class classification 111
V. British Thoracic Society (BTS) Guidelines on childhood CAP 112
VI. UITH ethical committee approval 113
VII. National Postgraduate Medical College of Nigeria (NPMCN) approval 114
ix
LIST OF TABLES PAGE
Table I: Limitations of pulse oximeter 17
Table II: Common agents causing community-acquired pneumonia based on age 29
Table III: Severity assessment of pneumonia 38
Table IV: Options of antibiotics in relation to age and clinical presentation of CAP 39
Table V: Age and gender distribution of the children with pneumonia 54
Table VI: Some risk factors of pneumonia in the study population 55
Table VII: The physical examination findings in children with pneumonia 57
Table VIII: Anthropometric measurements in children with pneumonia 58
Table IX: Bacterial agents of pneumonia in the subjects 59
Table X: Hypoxaemia and SpO2 levels in children with pneumonia 60
Table XI: Hypoxaemia based on the severity and type of pneumonia 61
Table XII: Pneumonia symptoms as predictors of hypoxaemia in the subjects 62
Table XIIIA: Clinical parameters as predictors of hypoxaemia in the children
with pneumonia-I 63
Table XIIIB: Clinical parameters as predictors of hypoxaemia in the children
with pneumonia-II 64
Table XIV: Linear regression model of the clinical features and the presence of
hypoxaemia in children with pneumonia 65
Table XVA: Hypoxaemia and risk factors of pneumonia in the study
Population-Group 1 66
Table XVB: Hypoxaemia and risk factors of pneumonia in the study
Population-Group 2 67
Table XVI: Correlation of the risk factors of pneumonia with the presence of
hypoxaemia 68
Table XVII: Pneumonia-associated complications and hypoxaemia in the subjects 70
Table XVIII: Hypoxaemia and treatment outcome in the children with pneumonia 71

x
LIST OF TABLES continued Page
Table XIX: The pulse oximeter reading and outcome in children with pneumonia 72
Table XX: The duration of hospitalization and hypoxaemia in children with pneumonia 74
Table XXI: The duration on oxygen therapy and hypoxaemia in the study population 76

xi
LIST OF FIGURES PAGE
Figure 1: Diagram of the respiratory tract 5
Figure 2: Diffusion of gases across the alveolar–capillary membrane 7
Figure 3: Pathophysiology of respiratory signs in pneumonia 9
Figure 4: Common pulsatile signals on a pulse oximeter 15
Figure 5 Symptoms of pneumonia in the study population 56
Figure 6: Complications of pneumonia in the study population 69
xii
LIST OF ABBREVIATIONS
1. ABG - Arterial blood gases
2. AIDS - Acquired immumodeficiency syndrome
3. ALRI - Acute lower respiratory infections
4. ARI - Acute respiratory infections
5. AURI - Acute upper respiratory infections
6. BBS - Bronchial breath sounds
7. BTS - British Thoracic Society
8. CAP - Community acquired pneumonia
9. CIE - Counterimmunoelectrophoresis
10. CO2 - Carbon dioxide
11. 0C -Degree Centigrade
12. DAMA -Discharge against medical advice
13. EPU -Emergency Paediatric Unit
14. g/L -Grams per Litre
15. Hb - Haemoglobin
16. Hib -Haemophilus influenzae type b
17. HIV - Human immunodeficiency virus
18. LAT - Latex agglutination test
19. µ -Micro
20. mg/dl -Milligram per deciliter
21. mls -Millilitres
22. mmHg -Millimeters of Mercury
23. mmol/L -Millimole per Litre
24. nm -Nanometer
xiii
LIST OF ABBREVIATIONS continued
25. O2 - Oxygen
26. ODC - Oxygen-haemoglobin dissociation curve
27. PaO2 - Partial pressure of oxygen in arterial blood
28. PaCO2 - Partial pressure of carbon dioxide in arterial blood
29. PCR - Polymerase chain reaction
30. PiO2 - Inspired partial pressure of oxygen
31. RBC -Red blood cell
32. SpO2 - Haemoglobin oxygen saturation
33. 2,3-DPG - 2,3 diphosphoglycerate
34. UITH -University of Ilorin Teaching Hospital
35. WBC -White blood cell
36. WHO - World Health Organization

xiv
GLOSSARY OF TERMS
Wheeze: a high pitched musical whistling noise, often heard at expiration with
corresponding prolongation and increased effort of expiration, emanating from the
intrathoracic airway.
Nasal flaring: widening of the alae nasi as the child breathes in.
Rhonchi: an audible wheeze using a stethoscope.
Crepitations: are discontinuous, interrupted explosive sounds audible with a
stethoscope, which may be coarse (loud, low pitched) or fine (high-pitched).
Central cyanosis: bluish discoloration of the tongue and buccal mucosa due to the
presence of > 5 g/dl of deoxygenated (reduced) haemoglobin.
Chest wall indrawing: inward movement of the lower chest wall on breathing in.
Sensitivity: is the probability that individuals with the disease would be correctly
identified as having the disease by the diagnostic test.
Sensitivity = _______True Positive________
True Positive + False Negative
Specificity: is the probability that individuals without the disease would be correctly
identified as not having the disease by the diagnostic test.
Specificity = ______True Negative_______
True Negative + False Positive
Positive predictive value (PPV): is the probability that individuals who test positive
for the disease actually have the disease.
PPV = _______True Positive_____
True Positive + False Positive
Negative predictive value (NPV): is the probability that individuals who test
negative for the disease are really disease free.
NPV= _______True Negative_______
True Negative +False Negative

xv
SUMMARY
Hypoxaemia constitutes a possible complication of severe respiratory illness which is often
under-reported in developing countries. In view of this, the current study was carried out to
determine the prevalence and clinical predictors of hypoxaemia in hospitalized under-five
children with pneumonia in Ilorin. An association between the risk factors of pneumonia and
hypoxaemia, as well as the relationship between various levels of hypoxaemia and the
management outcome of pneumonia were also explored.
This is a descriptive cross-sectional study of 200 children aged between two months and five
years with pneumonia recruited consecutively as subjects. Socio-demographic,
anthropometric, clinical and laboratory data were obtained, while the admission diagnosis
was based on clinical features. The pulse oximetry measurement was recorded after a stable
reading for at least one minute while the child was breathing room air. Hypoxaemia was
defined as an arterial oxygen saturation of less than 90% as recorded by pulse oximetry
Blood samples were collected for determining the packed cell volume, total and differential
white blood cell (WBC) count and blood cultures. Also, chest radiographs were obtained in
all subjects. Data was analyzed using the IBM®SPSS 20.0 (2011) software package.
There were 119 males and 81 females (M:F=1.5:1). Severe pneumonia was present in 188
(94.0%) children while 12(6.0%) children had moderate pneumonia. Bronchopneumonia was
identified in 168(84.0%) of the children while lobar pneumonia was diagnosed in 32(16.0%)
children. The prevalence of hypoxaemia in the children with pneumonia was 41.5%.
Using a linear regression analysis, the clinical features that were significantly associated with
hypoxaemia were restlessness, lower chest wall indrawing, bronchial breath sounds and
tender hepatomegaly (p <0.05). Restlessness had a sensitivity of 22.9%, specificity of 91.5%,
positive predictive value (PPV) of 65.5% and a negative predictive value (NPV) of 62.6%,
while chest wall indrawing had a sensitivity of 86.7%, specificity of 53.3%, PPV of 56.7%

xvi
and NPV of 84.9% for detecting hypoxaemia. Bronchial breath sound had a poor sensitivity
(16.9%), a high specificity (95.7%), PPV of 73.7% and a NPV of 61.9%, whereas tender
hepatomegaly had a sensitivity of 48.2%, specificity of 82.9%, PPV of 66.7% and a NPV of
69.3%.
There was a negative correlation between the social class of the child and the presence of
hypoxaemia (r= -0.191, p=0.007). Also, each of maternal age (years), maternal literacy level,
birth order of the child and lack of immunization had a negative correlation with the presence
of hypoxaemia (r= -0.151, -0.162, -0.154, -0.148; p=0.032, 0.022, 0.030 and 0.036
respectively).
Seventeen of the children with pneumonia died, giving a corresponding case fatality of 8.5%.
The mean(SD) SpO2 level of 78.3(10.9) percent recorded among the fatal cases was
significantly lower compared to the corresponding value of 91.5(7.8) percent recorded in the
survivors (p=0.001). The mean(SD) duration of hospitalization in hypoxaemic children of
6.9(6.4) days was significantly longer compared to the corresponding value of 4.9(2.7) days
recorded in those without hypoxaemia (p=0.002). Also, the mean duration of hospitalization
increased significantly as the SpO2 levels reduced (p=0.002).
It is concluded that there is a high local burden of pneumonia-associated hypoxaemia and that
hypoxaemic-related pneumonia is frequently associated with a fatal outcome. It is
recommended that pulse oximeters be made available in facilities where pneumonia is
managed. There is also a need to emphasize the potential value of clinical parameters like
restlessness, lower chest wall indrawing, bronchial breath sounds and tender hepatomegaly
for detecting pneumonia-related hypoxemia in poorly equipped health facilities.

1
INTRODUCTION
Globally, pneumonia remains a leading cause of death among under-five children, with
pneumonia accounting for over 90% of ALRI-related deaths.1 In Nigeria, pneumonia-related
deaths account for 20-25% of childhood mortality; the estimated median incidence of
pneumonia is 34 per 100 child years, with approximately 6.1 million new cases annually.1, 2
Previous studies from Ilorin in the North-Central regions of Nigeria have shown a mean
incidence of pneumonia of 1.3 episodes per child-year in under-five children and a case
fatality rate of 10% respectively.3, 4 These pneumonia-related deaths may be ascribed to one
or more of dissemination of the causative pathogens, or ventilation-perfusion mismatch with
resultant hypoxaemia and subsequent respiratory failure.5 Hence, the advent of hypoxaemia
constitutes a grave manifestation of severe respiratory illness.
Traditionally, the levels of arterial blood gases are used for monitoring hypoxaemia in
patients with pneumonia, but more recently the use of pulse oximeters has been gaining
ground in many health facilities. As a non-invasive, simple and reproducible method of
measuring the arterial haemoglobin oxygen saturation (SpO2), pulse oximetry remains a
reliable bedside tool for monitoring the level of hypoxaemia in clinical practice.6 In a 2009
systematic review, the median prevalence of hypoxaemia in ill children using WHO-defined
pneumonia was 13.0% in developing countries, varying with a prevalence rate of 3.0-10.0%
in Africa and 9.0-39.0% in Asia.7 Despite the morbidity burden of pneumonia in the African
sub-region, the limited data on ALRI-related hypoxaemia have emanated from a few
countries like Kenya, the Gambia, and Zambia.8-12 To the best of the knowledge of this
researcher, there is a clear paucity of accessible data on pneumonia-related hypoxaemia in
Nigerian children.
Various clinical symptoms and signs have been studied for their ability to predict hypoxemia
in children with pneumonia.13-16 The major symptoms and physical signs associated with

2
hypoxaemia include central cyanosis, altered mental state, tachypnoea, chest wall retractions
and the use of accessory muscles of respiration. Although the reported sensitivity and
specificity of these signs varied widely in some earlier studies, the presence of respiratory
rates above age specific cut-off values and lower chest indrawing were reported as highly
specific and sensitive. Hence, these clinical parameters were considered useful for identifying
hypoxaemia.16,17 On the other hand, physical signs such as central cyanosis, grunting and
head nodding had earlier been identified as poorly sensitive but nevertheless specific clinical
predictors of hypoxaemia.9,13-15 The current study was therefore aimed at determining the
ability of clinical symptoms and signs to predict hypoxaemia in children with pneumonia in
Ilorin, North Central Nigeria.
Socio-demographic factors such as the age, sex, parental income, and level of parental
education, had earlier been identified as risk factors of pneumonia-related morbidity and
mortality.18-20 Also domestic crowding, maternal age/child care experience, exposure to
indoor air pollutants especially firewood burning, and parental smoking had each been
recognized as important domestic/household risk factors.21,22 Other factors identified by
earlier studies included attendance at day care facilities, breastfeeding practices,
malnutrition, co-morbidities like diarrhoea, HIV/AIDS, micronutrient deficiency (especially
vitamin A and zinc), and inter-current infections such as measles and pertussis.23-27 Despite
the current body of knowledge linking these risk factors with the frequency of pneumonia and
a fatal outcome, there is still a dearth of published data assessing the association between
these risk factors of pneumonia and the occurrence of hypoxaemia.
Given the association between hypoxaemia and a fatal disease outcome, the dire need for an
early detection of hypoxaemia and prompt oxygen therapy in children with ALRI is hardly
contestable. Hence, with a view to preventing an adverse outcome, the identification of
certain clinical signs which are predictive of hypoxaemia may be a crucial part in the clinical

3
management of under-five children with pneumonia. Undoubtedly, the identification of
predictive clinical clues of hypoxaemia by the current study will guide the formulation of
rational guidelines for initiating oxygen therapy in children with pneumonia and improve the
disease outcome of children with pneumonia. Ultimately this will reduce the corresponding
disease-related mortality. It is envisaged that this will be a significant step towards
formulating health policies for accomplishing the fourth Millennium Development Goal
(MDG), namely a reduction by two-thirds of the national under-five mortality rate in Nigeria
by 2015.

4
LITERATURE REVIEW
Anatomy of the respiratory tract
The respiratory tract is made up of the organs involved in breathing, transport and exchange
of respiratory gases. It can be divided into a conducting portion (naso-oropharynx, larynx,
trachea, bronchi, bronchioles) which carries the gases during inspiration and expiration and a
respiratory portion (alveoli in the lungs) which provides for gas exchange.28 A thin epithelial
basement membrane forms the outer layer of the alveolar wall, and a dense network of
capillaries surrounds each alveolus. The basement membranes of the alveolus and the
capillary network are in close proximity, creating an air–blood interface.
The part of the respiratory system which contains gas that is not available for gaseous
exchange with pulmonary capillary blood constitutes the dead space.28 This space comprises
the anatomic dead space (respiratory system volume exclusive of alveoli), and the
physiologic dead space (volume of gas not equilibrating with blood). In healthy individuals
the two dead spaces are identical. However in disease states such as atelectasis and
pneumonia, there may be no exchange between the gas in some of the alveoli and the blood,
either as a result of compensatory under-perfusion or overventilation of some of the alveoli.
The upper respiratory tract consists of the airways from the nostrils to the vocal cords in the
larynx (including the paranasal sinuses and the middle ear) while the lower respiratory tract
covers the continuation of the airways from the trachea and bronchi to the bronchioles and
the alveoli (Figure 1).29 Thus, infections involving anatomic areas above the defined
boundary are regarded as upper respiratory infections, while those below are referred to as
lower respiratory infections. With the larynx, particularly the vocal cords, chosen as the
demarcation between the upper and lower tracts, epiglottitis is subsumed as a diagnostic
entity along with nasopharyngitis, sinusitis, pharyngitis (pharyngotonsillitis) and otitis media
as acute upper respiratory infections (AURI).30, 31 Acute lower respiratory infections (ALRI)

5
comprise tracheo-bronchitis, bronchiolitis and pneumonia. The latter ALRI syndrome
(pneumonia) constitutes a major cause of hypoxaemia and indeed the commonest cause of
ALRI-associated death.
Figure 1: Anatomy of the respiratory tract (Image source-http://en.wikipedia.org/wiki/Lower respiratory tract&usg.com)
Pulmonary physiology
The goals of respiration are to provide oxygen to the tissues and to remove carbon dioxide.
These goals are achieved through four major functions:
1. Pulmonary ventilation which involves the inflow and outflow of air between the
atmosphere and the lung alveoli.
2. Diffusion of oxygen and carbon dioxide between the alveoli and the blood – gas
exchange.
3. Transport of oxygen and carbon dioxide in the blood and body fluids to, and from the
body's tissue cells.
4. Regulation of ventilation and other aspects of respiration.

6
Mechanics of pulmonary ventilation: Pulmonary ventilation is achieved through sequential
expansion and emptying of the lungs in two ways. The mechanical processes consist of either
downward and upward movement of the diaphragm (to lengthen or shorten the height of the
chest cavity) or the elevation and depression of the ribs (to increase or decrease the antero-
posterior diameter of the chest cavity).28 Normal quiet breathing is accomplished almost
entirely by the first process, while the second occurs during heavy breathing and involves the
use of the accessory muscles of inspiration and expiration, especially the intercostal
muscles.28
Compliance is the term used to describe the elasticity or distensibility of tissues and organs of
the respiratory pump such as the lungs and chest wall.28 The higher the compliance, the
larger the delivered volume per unit changes in pressure. Alveolar surface tension is an
important factor affecting the compliance of the lungs. If the surface tension is not kept low,
there is the inevitable tendency for the alveoli to collapse at smaller volumes during
expiration. Normally, the low alveolar surface tension is maintained at small alveoli volumes
due to the presence of pulmonary surfactant at the alveolar air-liquid interface. In contrast to
compliance, resistance describes the inherent capacity of the air conducting system and
tissues to oppose airflow towards the lungs.28
Airway resistance depends on the radii of the airways, the length of airways, the flow rate,
and the density and viscosity of gas. The airway resistance is inversely proportional to its
radius raised to the fourth power. Thus if the airway lumen is decreased by half, there is a
corresponding 16-fold increase in the airway resistance.28 Newborns and infants with their
inherently smaller airways are especially prone to marked increase in airway resistance from
inflamed tissues and secretions. This age-related difference in airway dimensions accounts
for why croup and bronchiolitis are almost entirely confined to infants and pre-school
children. Also, in patients with increased airway resistance (as is the case in bronchiolitis and

7
pneumonia), a fast respiratory rate does not allow enough pressure equilibration to occur
between the proximal segments of the airway and the alveoli, with a resulting tendency to
develop hypoxia.
Gas exchange: Gaseous exchange in the respiratory system occurs only in the terminal
segments of the airway via the process of diffusion and equilibration of alveolar gas with
pulmonary capillary blood (Figure 2). Diffusion depends on the expansive surface area of
the lungs (estimated to be approximately 160m2 in an adult) which promotes extensive
diffusion, and the amount of available time for equilibration.28 Also, the minute diffusion
distance of the thin alveolar and capillary walls (the alveolar-capillary barrier is less than
0.5 mm in thickness) enhances the rate of diffusion 28
Figure 2: Diffusion of gases across the alveolar–capillary membrane. (Image source- http://cuthbert7thgradescience.blogspot.com)
In health, the equilibration of alveolar gases and pulmonary capillary blood is complete for
both oxygen and carbon dioxide. In diseases in which alveolo-capillary barrier is abnormally
increased (alveolo-interstitial diseases) and/or when the time available for equilibration is
decreased (increased blood flow velocity), diffusion is incomplete.28

8
Oxygen transport: Oxygen (O2) diffuses through the respiratory membrane from the alveoli
to the blood from where it is transported to the tissues for utilization.28 The O2 is transported
in blood in two forms with majority bound to haemoglobin (oxygenated haemoglobin) and
the rest dissolved in plasma.28 The delivery of oxygen to a particular tissue depends on the
amount of O2 entering the lungs, the adequacy of pulmonary gaseous exchange, the blood
flow to the tissue, and the capacity of the blood to carry O2.28 Under normal conditions, each
100ml of blood contains about 20ml of oxygen bound to haemoglobin and about 0.3ml
dissolved in plasma.32 The dissolved fraction is available to tissues first, and then the fraction
bound to haemoglobin. Consequently as tissues metabolize oxygen or with inadequacy of
oxygen transport, the dissolved oxygen and the haemoglobin - bound oxygen will eventually
become depleted.32 In pneumonia, the oxygen transfer across the lungs and lung function
could become compromised as tissues continue to metabolize oxygen with a resultant
decrease in the percentage of oxygenated haemoglobin.
Control of respiration: The control and maintenance of normal breathing largely resides
within the bulbopontine region of the brainstem.28 The carotid bodies (peripheral
chemoreceptors) detect changes in partial pressures of oxygen (PaO2), carbon dioxide
(PaCO2) and pH, whereas the medullary (central) chemoreceptors monitor PaCO2 and pH
alone.28 The ventilatory drive is stimulated by PaO2 and PaCO2 levels, although the body
demonstrates far greater sensitivity to PaCO2 levels. In response to a decrease in pH, the
central chemoreceptors stimulate the respiratory center to increase the rate of inspiration.
Conversely, an increase in PaCO2 and/or a decrease in pH or PaO2, would each cause the
peripheral chemoreceptor to stimulate the respiratory center.28
Patho-physiology of respiratory signs in pneumonia: The arterial partial pressures of
oxygen (PaO2) and carbon dioxide (PaCO2) are tightly regulated by the central nervous
system, and therefore any alteration in their values can be taken as an indication that either

9
the regulatory system (the central control of breathing) or its effector organs (the respiratory
muscles and lungs) have become impaired or overwhelmed.33 Pneumonia may result in
hypoxaemia and respiratory failure from poor matching of pulmonary ventilation and
perfusion, or alveolar hypoventilation. This may occur following alterations in the
mechanical functions of the lung parenchyma, and usually manifest as a restrictive disease
with a corresponding decrease in the lung compliance. In the presence of this mechanical
dysfunction, arterial hypoxaemia and hypercapnia (and decreased pH) are sensed by the
peripheral and central chemoreceptors.33 After being integrated with other afferent
information from the lungs and chest wall, the activation of chemoreceptors trigger an
increase in the neural output to the respiratory muscles with the resultant physical signs that
characterize respiratory distress (Figure3 ).33
Figure 3: Pathophysiology of respiratory signs in pneumonia.33
Respiratory distress is a term utilized to summate a conglomerate of clinical features
reflecting respiratory ill-health.33 Features include tachypnoea, use of accessory muscles of
respiration like the intercostal muscles, lower chest wall indrawing, grunting, hypoxaemia
and cyanosis.33 The patient with respiratory distress develops a subjective perception of
difficulty in breathing or dyspnoea and consequently, an increase in respiratory muscle effort.

10
The physical signs of respiratory distress can be explained by a decrease in pleural pressure
during inspiration, recruitment of the accessory muscles that do not participate in normal
breathing at rest, and the activation of the dilator muscles of the upper airway as reflected by
a visible nasal flaring.33 Another prominent sign is grunting, which is due to decreased lower
airway compliance.33 The expiratory grunt is a physiological mechanism that generates high
pressure in the alveoli. The increase in intrapulmonary pressure at the initial phase of
grunting is associated with the closure of the glottis by the epiglottis during expiration.33
When the epiglottis subsequently opens abruptly, gas rushes past the vocal cords producing
the expiratory grunting sound. Thus, grunting is produced by expiration against a partially
closed glottis and is an attempt to maintain positive airway pressure during expiration for as
long as possible. Such prolongation of positive pressure is most beneficial in diseases that
produce widespread loss of the functional residual capacity, such as in extensive pneumonic
consolidation or one associated with pleural effusion.33 By maintaining a high intrapulmonary
pressure, more oxygen is expected to diffuse into the blood in the lungs. It is
characteristically seen in infants, and is a sign of severe respiratory difficulty. Disappearance
of grunting may suggest fatigue.33 End-organ hypoxia of the central nervous system causes
lethargy and confusion, sometimes alternating with agitation.33 The arterial hypoxaemia
causes haemoglobin desaturation, which if severe could manifest as central cyanosis.
HYPOXAEMIA
Hypoxaemia is generally defined as a decrease in the partial pressure of oxygen in arterial
blood.34 Specifically, it may also be defined as a partial pressure of oxygen in arterial blood
of less than 60 mmHg, or one causing haemoglobin oxygen saturation of less than 90%
recorded by pulse oximetry.32,34 On the other hand, hypoxia (which is sometimes confused
with hypoxaemia), refers to an abnormally low oxygen availability to the body, or an

11
individual tissue or organ. It may be defined as a state in which tissues receive an inadequate
supply of oxygen to support normal aerobic metabolism.34
Mechanisms of hypoxaemia
The mechanisms involved in the development of hypoxaemia include34:
1. Low inspired partial pressure of oxygen
2. Impairment of diffusion across blood-gas membrane
3. Alveolar hypoventilation
4. Shunt
5. Ventilation-perfusion inequality/mismatch
Conditions that result in hypoxaemia act via one or more of these primary mechanisms.
Low inspired oxygen partial pressure: If the partial pressure of oxygen in the inspired gas is
low, then a reduced amount of oxygen is delivered to the alveoli each minute.34 The reduced
oxygen partial pressure can be a result of reduced fractional oxygen content (low FiO2) or
simply a result of low barometric pressure as is the case at high altitudes. This reduced PiO2
can result in hypoxaemia even if the lungs are functioning normally. Furthermore, it is the
inspired oxygen content that is important in this case, rather than the atmospheric
concentration, as the person may not be breathing atmospheric gas (example is during general
anaesthesia).34 Low PiO2 is important in circumstances such as high altitude-induced
hypoxaemia (in which the FiO2 may even be normal). Hence, it may not be operative in
children with pneumonia-associated hypoxaemia.
Impaired diffusion: In health, the partial pressure of oxygen (PaO2) in capillary blood
equilibrates with the alveolar gas in approximately 0.25 seconds which is more than enough
time for adequate oxygenation of the red blood cell (RBC).34 This is because the RBC spends
0.75 seconds in the pulmonary capillaries. In disorders associated with a diffusion defect
such as interstitial fibrosis, interstitial processes retard the diffusion of oxygen into the

12
blood.34 Thus, such conditions associated with impaired diffusion across the blood-gas
membrane in the lungs may result in hypoxaemia.34 Although diffusion defects can be easily
corrected with the administration of supplemental oxygen, clinical conditions associated with
this defect are rare causes of hypoxaemia in paediatric practice.5
Alveolar hypoventilation: Alveolar ventilation is the volume of atmospheric air entering the
alveoli.34 The amount of alveolar ventilation per minute must be adequate to keep the
alveolar PO2 and PCO2 at values that will promote the escape of CO2 from venous blood, and
the uptake of oxygen by pulmonary capillary blood.5 Hypoventilation is defined as a PCO2
greater than 45mmHg and hyperventilation as a PCO2 less than 35mmHg.5 If the alveolar
ventilation is low, there may be insufficient oxygen delivered to the alveoli each minute. This
can cause hypoxaemia even in the absence of lung pathology, as the cause may be outside the
lungs. In a child with pneumonia, the occurrence of alveolar hypoventilation is ascribable to
extensive loss of functioning lung tissue.5
Shunt: This refers to blood that reaches the systemic circulation without coming into direct
contact with a ventilated area of the lung.5 This lowers the PO2 with a resultant hypoxaemia
because of the deoxygenated blood.5 Shunting of blood from the right side to the left side of
the circulation (right-to-left shunt) is a cause of hypoxaemia. Pathological shunts occur when
abnormal vascular channels exist, as is the case in cyanotic congenital heart disease.5 In the
diseased lung, shunting is most commonly associated with the continuing perfusion of the
unventilated alveoli. This is known as intra-pulmonary shunting. It occurs in a variety of
common paediatric clinical conditions such as pneumonia, pleural effusion (with or without
atelectasis).5
Ventilation-perfusion mismatch/inequality: The average ratio between alveolar ventilation
and blood flow (Va/Q) is 0.8, but even in normal lungs, this value may range from near zero
in the unventilated alveoli to infinity in the un-perfused alveoli.5 When a lung unit receives

13
inadequate ventilation relative to its blood flow, the PCO2 rises and the PO2 falls, with the
oxygen content of the end-capillary blood also falling.5 This blood mixes with blood coming
from normal Va/Q regions of the lung with the resultant lowering of oxygen concentration
and arterial hypoxaemia. This is the so-called “shunt-like” effect.5 Hypoxaemia by this
mechanism results from V/P mismatch emanating from areas of the lungs with ventilation
perfusion ratios that are less than one (but not zero).34 Clinically, ventilation/perfusion
mismatch is a major cause of hypoxaemia in children with pneumonia.5Administration of
supplemental oxygen will correct the hypoxaemia due to V/Q mismatch by raising the PO2.
This is in contrast to what happens in a true shunt. Thus, the administration of supplemental
100% oxygen allows differentiating between a V/Q mismatch and a shunt.5
Investigation of hypoxaemia
This can be achieved via:
the measurement of arterial blood gases(ABG),
the use of a pulse oximeter.
Analysis of arterial blood gases: Arterial blood gas (ABG) analysis refers to the
measurement the partial pressures of oxygen and carbon-dioxide, as well as the pH of arterial
blood.35 The values can then be used to assess how well the lungs are performing the function
of gas exchange and acid-base balance in the body. Direct measurement of arterial oxygen
tension using arterial blood gas sampling is very accurate. Compared with pulse oximetry,
arterial blood gas analysis remains the gold standard for detecting hypoxaemia.35 It is clearly
superior to pulse oximetry since unlike ABG, pulse oximetry does not measure the PCO2.32
However, ABG remains an invasive procedure requiring the potentially difficult arterial
puncture, hence the need for safer and less invasive methods like pulse oximetry.
Pulse oximetry: This is a non-invasive, simple, convenient and reproducible method of
measuring the haemoglobin oxygen saturation (SpO2).6,36 The equipment for this
14
measurement is referred to as a pulse oximeter. Pulse oximetry was first developed in
Germany in 1932 by Nikolai, Kramer and Matthes.32 While the early models of pulse
oximeters were designed using the spectrophotometric principle, modern pulse oximeters
combine the principles of optical plethysmography and spectrophotometry.32 The advent of
this modern variant of the equipment has been credited to the pioneering works of Aoyagi
and co-workers in 1974.37 Current models of pulse oximeter have a probe and an on-board
computer. The probe is made of two photo-diodes on one side and a photo-detector on the
other side of a pulsatile vascular bed such as the finger, toe, ear lobe or bridge of the nose.32
The use of this device requires no special training, thus providing an inexpensive early
warning of diminished tissue perfusion while avoiding the discomfort and risks of arterial
puncture. Appropriately tagged a ‘fifth paediatric vital sign’, the pulse oximeter has become a
reliable contemporary bedside tool for monitoring the level of hypoxaemia not only in
emergency paediatric practice, but also the intensive care setting.6, 36 By alerting the clinician
to the presence of hypoxaemia, the use of pulse oximeters can lead the health care worker to
an early recognition and treatment of severe hypoxemia. Thus, its use can prevent possible
serious complications.
Principles of pulse oximetry: This is based on two fundamental principles as detailed below.
The principle of spectrophotometry: This is based on the Beer-Lambert law which states that
the concentration of an unknown light-absorbing solute dissolved in a solvent can be
determined by the amount of light absorbed by that solvent.32 In respect of blood, the light-
absorbing solutes are oxygenated haemoglobin and deoxygenated haemoglobin. Thus, using
this principle, the percentages of oxygenated haemoglobin and deoxygenated haemoglobin in
the blood can be estimated.32 The two photodiodes used in pulse oximeters comprise one that
produces light at 660 nanometer (nm) in the red band of the spectrum, and another which
emits light at 900-940nm in the infrared band of the spectrum.32 These particular wavelengths
15
are used because the absorption characteristics of oxygenated-haemoglobin and
deoxygenated-haemoglobin differ at the two wavelengths; light emitted at 660nm is better
absorbed by oxygenated-haemoglobin, while light emitted at 940nm is better absorbed by
deoxygenated-haemoglobin.32
The principle of optical plethysmography: This is used to display the amplitude of the pulse
and heart rate. Each peak of the arterial waveform corresponds to one cardiac cycle.32 The
phasic signal presented to the sensor calculates the pulse amplitude according to the relative
absorption during systole and diastole.32 During ventricular systole, there is a phasic increase
of blood volume in the perfused organs, with light having to travel a longer distance through
distended subcutaneous tissue and a corresponding decrease in the light transmission through
the sampling site.32 During ventricular diastole, there is a phasic decrease of blood volume in
the perfused organs which results in light traveling a shorter distance through contracted
subcutaneous tissue, and the light transmission through the sampling site is increased.32 This
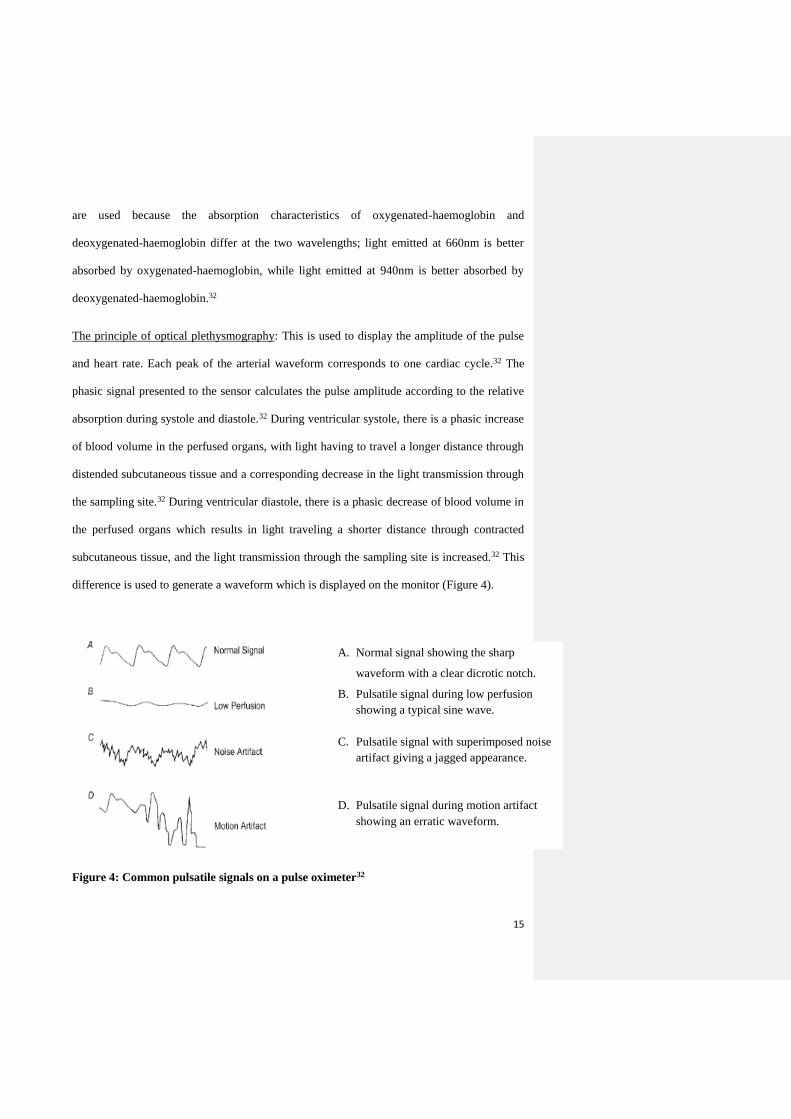
difference is used to generate a waveform which is displayed on the monitor (Figure 4).
Figure 4: Common pulsatile signals on a pulse oximeter32
A. Normal signal showing the sharp
waveform with a clear dicrotic notch.
B. Pulsatile signal during low perfusion
showing a typical sine wave.
C. Pulsatile signal with superimposed noise
artifact giving a jagged appearance.
D. Pulsatile signal during motion artifact
showing an erratic waveform.

16
Types of pulse oximeters
There are two types of pulse oximeter in contemporary use comprising the transmission and
reflectance pulse oximeters.32 Transmission pulse oximeters are however more commonly
used in contemporary clinical practice.
1. Transmission pulse oximeter: The components of this type comprise a pair of light
emitting diodes (LED) that emits light through interposed tissue (typically a finger, toe or
the ear lobe).32 The change in light frequency is read out by a photo-detector placed on
the opposite side of the interposed tissue.
2. Reflectance pulse oximeter: In this type, the photo-waves from the LED are bounced off
an appropriate surface such as the skull bone.32 The reflected light beam passes back
through the tissue to reach a photo-detector placed adjacent to the LED.
Procedure for using a pulse oximeter
The location for the probe is determined by the clinical situation and number of probes.32 A
re-usable probe makes the digits easily accessible. Apart from the digits, other sites include
the ear lobe, nasal bridge or septum, and the foot or palm of an infant.32 Tape or splints can
be used to secure the digit probe and minimize motion. After placement of the probe, the
equipment is switched on. The computer then analyzes the incoming data to identify the
arteriolar pulsation and displays this in beats per minute.32 Simultaneously, O2 saturation is
displayed on a beat-to-beat basis. In addition to the digital read-out of O2 saturation, some
devices display a plethysmographic waveform, which enables the user to distinguish an
artefactual signal from a true signal.32 If the oximeter fails to detect pulsatile flow, the
reading will either not be displayed, or depending on the machine, the SpO2 will be displayed
with a poor signal quality warning.32
Interpretation of readings: Patients with good gaseous exchange have SpO2 of 97% to
100%. When the SpO2 falls below 95%, hypoxaemia is present.32 SpO2 values of less than

17
90% represent relatively severe hypoxaemia.32 Children with SpO2 less than 92% often
require admission for oxygen and additional therapy.32 From the clinician’s perspective,
persistently low SpO2 values should be heeded as an important clinical warning sign.
Limitations of pulse oximetry
Specific limitations could be classified as technical or physiological, and whether they are
safe or potentially dangerous, as shown in Table I.36
Table I: Limitations of pulse oximeter.36
Safe Dangerous
Technical Mechanical artefacts
Electromagnetic interference
Magnetic resonance imaging
Accuracy
Calibration
Delay
‘Flooding’
‘Penumbra’
Physiological Pulse dependence
Volume
Rhythm
Abnormal haemoglobins
Other absorbents
Dyes
Delay
Pulsatile veins
Safe limitations may be defined as conditions when the pulse oximeter is not indicating the
correct value of SpO2, but the user is warned that the value may be inaccurate.36 On the other
hand, dangerous limitations are those where the device seems to be working correctly but
gives the wrong value.36 Details of these limitations of pulse oximetry are as provided below.
Mechanical artefacts are due to movement of the probe on the extremeties.36 Most pulse
oximeters are able to detect excessive movement and indicate malfunction, except the
movement is rhythmic and approximately at the heart rate. These artefacts are obvious if it
displays a plethysmograph wave.36
Electromagnetic interference (EMI) may cause a malfunction that is obvious if a trace is
displayed and always leads to an alarm situation.36 Common causes of EMI include the radio
frequency diathermy and the electromagnetic radiation from cellular phones.

18
Magnetic resonance image (MRI) is a special class of EMI.36 Due to the intense magnetic
field in the vicinity of MRI, metallic object should not be in the high field area.36 In order to
avoid this effect, special pulse oximeters containing both the LED and the photo-detector in
the case of the apparatus, are connected via optic fibres between the patient and the photo-
detector.36
Pulse dependence arises because pulse oximetry requires an adequate pulse volume.36 Most
pulse oximeters display a message indicating an inadequate pulse signal and thus such
readings could be discarded or the reading is taken only when an appropriate signal is
displayed.
Calibration of pulse oximeters are done against in vitro arterial blood samples tested in a co-
oximeter. This is a spectrophotometer that is dedicated to assessing haemoglobin oxygen
saturation.36 On the other hand, ABG values are derived from pH, carbon dioxide and oxygen
tension. Thus, pulse oximetry generated SpO2 should never be compared with values
indicated by blood gas analysis for calibration.
Accuracy of pulse oximeters is quoted by most manufacturers of being +/- 2%.36 Strictly,
pulse oximeters indicate neither functional nor fractional O2 saturation values. Indeed, the
pulse oximeter O2 saturation is the value of O2 saturation using the wavelength of 660nm and
940nm. For this reason, the abbreviation SpO2 should always be used for pulse oximeter
generated oxygen saturation values.
Delay may occur between a change in O2 saturation and a corresponding change in pulse
oximeter reading.36 These delays may be attributed to irregular pulse volume or rhythm
slowing the computation of SpO2.36
It may also be ascribed to averaging algorithms which
produce more accurate but slower readings.36 When using the SpO2 to detect hypoxaemia,
separate measurement systems to differentiate between an alarm for inspired oxygen
concentration and failure/disconnection of mechanical ventilation should be used.36 This is
19
important to prevent a comparatively late warning. Placement of the probe centrally (cheeks
or tongue) rather than peripheral may halve the delay in oximeter display of values
suggesting desaturation.36
Flooding occurs when extraneous energy sources especially bright visible or infrared light
overload the semiconductor detector.36 If the pulse oximeter does not give an alarm to
indicate flooding, it may display a reading of 85%. This is because a ratio of red/infrared of
one is equivalent to a SpO2 of 85%. A similar problem, penumbra effect, often occurs in
children.36 In this case, the pulse oximeter may over-read or under-read due to the existence
of a different path length of tissue for each of the wavelengths.36 This occurs with very small
fingers or when the LED is projected tangentially through the tip of a digit. To avoid this
effect, probes designed for children should be used.
Current pulse oximeters are unable to detect dyshaemoglobins, and will therefore produce
erroneous results.36 For example, carboxyhaemoglobin and methaemoglobin levels can cause
the pulse oximeter to over-read. If significant levels of these dyshaemoglobins are
anticipated, the use of a co-oximeter is preferred.36 Co-oximeters are safe to use in the
presence of abnormal haemoglobin, as one machine uses as many as 17 wavelengths, unlike
the pulse oximeter which uses two wavelengths.
Dyes given intravenously such as methylene blue, indocyanine green and indigo carmine can
cause falsely low SpO2 readings, an effect that persists for up to 20 minutes.36 The accuracy
however improves as the dye dilutes.
Anaemia, when severe, causes the pulse oximeter to become less accurate and less reliable as
the device depends on light absorption by haemoglobin. Accuracy is however, not diminished
until the haemoglobin content is less than 5g/dl.36 This should be taken into consideration
when taking pulse oximeter readings in children with haematocrit values of less than 15%.

20
Skin pigmentation and other pigments may be associated with inaccurate oximetry readings.36
Placing the probe on the fifth finger or an earlobe has been suggested as a means of
minimizing this effect.
Indications/ clinical applications of pulse oximetry
i. Detection of hypoxemia: With the introduction of pulse oximetry, hypoxemia is
detected earlier and more often in critically ill patients.38 The current study used the
pulse oximeter to detect hypoxaemia in children with pneumonia.
ii. During emergency airway management: The pulse oximetry is useful in this instance
to assess whether there is need for further airway management, and also to assess the
adequacy of pre-oxygenation before endotracheal intubation.38 It is also an invaluable
tool for monitoring ventilator changes, providing an early index of ventilator
dysfunction and the need for weaning the patient off oxygen therapy.38
iii. Titration of fractional inspired oxygen concentration (FiO2): Pulse oximetry can assist
with titration of FiO2 in ventilator-dependent patients.38
iv. In acute asthma: Pulse oximetry has been evaluated as a means of screening for
respiratory failure in patients with acute severe asthma with or without life threatening
features.38
v. Oxygenation monitor: The pulse oximeter may also serve as a sensitive monitoring
device to detect a sudden drop in oxygenation during procedures involving sedation,
inter-hospital and intra-hospital transfer.38 It is also a useful adjunct in deciding the
desirability and progress of weaning a patient off oxygen.38
Pneumonia
Pneumonia refers to a disease of the lungs caused by micro-organisms in which there is
accumulation of secretions and inflammatory cells in the pulmonary alveolar spaces.39
Essentially, it can be broadly defined as a pathogen-driven inflammation of the lung tissue

21
resulting in damage to the lung tissue.40 Different definitions for pneumonia exist, varying
from the microbiologic identification of pathogens in lung specimens, to the radiologic
presence of pulmonary infiltrates in chest radiographs, or one based solely on the clinical
findings of tachypnoea or chest retractions.40 The World Health Organization (WHO)
guidelines define pneumonia as an acute disease episode with cough and/or difficult
breathing, associated with respiratory rates exceeding the age-specific cut-off values.41 This
WHO operational definition has proved useful worldwide for early disease identification in
facilities without access to chest radiography. For practical and conventional reasons, most
respiratory physicians define pneumonia as a lower respiratory illness associated with the
relevant clinical findings like fever, breathlessness/difficulty breathing, tachypnoea,
auscultatory features of consolidation and/or crepitations, and the corroborative evidence of
radiographic infiltrates on chest x-ray.40
Classification of pneumonia
Pneumonia may be classified in various ways, but the following constitute the common basis
for categorizing the disease in children:
I. Area of probable origin: This includes community-acquired pneumonia (CAP) which
is defined as pneumonia acquired outside the hospital setting, or hospital acquired
(nosocomial or health-care associated infection) pneumonia.39 The latter type refers to
pneumonia which has its onset during a stay in the hospital, and up to one week after
discharge.
II. Pattern of involvement/anatomical distribution: This is the basis for the common
categorization as lobar-, broncho-, and interstitial pneumonia.39 In lobar pneumonia,
most of the parenchyma within an anatomic lobe is affected, sparing the airways with
a positive air bronchogram sign on chest radiograph.39 On the other hand,
bronchopneumonia is characterized by multiple, patchy opacities, usually bilateral.

22
Interstitial pneumonia is associated with streaky opacities with an interstitial
distribution.39
III. The type of infecting micro-organism: These include bacterial, viral, mycoplasmal,
chlamydia, and fungal pneumonia.39 The pathogen-based classification can also be
based on the actual infecting organism such as staphylococcal, streptococcal,
Haemophilus influenzae, tuberculous, parainfluenza, adenoviral pneumonia or
pneumocystic jiroveci pneumonia associated with HIV/AIDS.
Epidemiology of pneumonia
A recent review of the epidemiology of pneumonia has shown that the estimated median
incidence of pneumonia for developing countries is 0.28 episodes per child-year, with an
inter-quartile range of 0.21–0.71 episodes per child-year in under-five children.2 This equates
to 151.8 million new cases every year, 13.1 million or 8.7% (7–13%) of which are severe
enough to require hospitalization.2 More than half of the world’s annual new cases of
pneumonia are concentrated in six countries where 44% of the world’s children aged less
than five years live. These countries comprise India, China, Pakistan, Bangladesh, Indonesia
and Nigeria.2 In Nigeria, the estimated median incidence was 0.34 episodes per child-year,
with an inter-quartile range of 0.31-0.40 episodes per child-year.2 This equates to 6.1million
new cases each year in under-five children.2 A previous study from Ilorin, Nigeria reported a
mean pneumonia incidence value of 1.3 episodes per child-year.3
Recent estimates of the total pneumonia-related mortality by the Child Health Epidemiology
Reference Group (CHERG) indicate that there are more than two million deaths due to
pneumonia each year in children aged less than five years.2 These estimates are exclusive of
deaths in the neonatal period, 26% of which are related to severe infections, including
pneumonia.42 Additionally, at least another 300,000 deaths caused by pneumonia are likely to
occur worldwide during the neonatal period.42

23
Pneumonia-related deaths vary widely between the major WHO regions and increases
significantly in relative importance in regions that have inefficient health systems.2 In
general, the African region has the highest burden of global child mortality.2 This region,
inhabited by about 20% of the world’s population of children aged less than five years, has a
disproportionate 45% of all deaths occurring globally in the same age group and 50% of such
deaths have been ascribed to pneumonia.2 By contrast, less than two percent of these deaths
take place in the same age group in countries of the European region, while less than three
percent occur in North America.2 Indeed two-thirds of these pneumonia-related deaths are
concentrated in just 10 countries, of which India, Nigeria, the Democratic Republic of the
Congo, Ethiopia and Pakistan rank as the top five.2 In Nigeria, the estimated (national)
mortality rate is 84.7/10,000 in under-five children.2 Earlier studies from the South West
(Ibadan) and North central (Ilorin) had reported the case fatality rates of 7.8 and 10% in
under-five children with pneumonia.3,4,43
Risk factors of pneumonia
Various risk factors of pneumonia associated morbidity and mortality have been identified
and can be categorized as demographic, socioeconomic, environmental, nutritional and co-
morbid risk factors.
A. Demographic risk factors: These include
Age: Pneumonias are common in infancy with a stepwise decrease in the age-specific
incidence with increasing age.44 Also, a fatal disease outcome is generally more likely in
the younger child.44
Gender: There is a male preponderance for the incidence and prevalence of pneumonia.44,
45 Whereas boys may appear more frequently affected by pneumonia than girls, this may
be partly ascribed to the confounding effect of a possible gender bias regarding health
seeking behaviour in many communities.44
24
B. Socio-economic risk factors: These may be sub-categorized as follows:
Family income: The first indication that pneumonia is associated with socioeconomic
factors is the pronounced differences between industrialized countries and those of the
developing world.44 The estimated incidence of pneumonia in children aged less than 5
years was 0.29 and 0.05 episodes per child-year in developing and industrialized countries
respectively. This translates to 151 million and 5 million new episodes respectively each
year.2 Furthermore, the annual incidence of pneumonia which ranges from 3% to 4% in
industrialized countries and 10% to 20% in developing countries constitutes yet another
evidence of the negative impact of poverty on the incidence of pneumonia.2
Parental education: A 2011 review of various studies done by Principi and Esposito on
pneumonia in developing and developed countries reported that poor maternal education
was associated with an increased risk of hospitalizations and mortality due to
pneumonia.46
C. Environmental risk factors: The most frequently studied environmental risk factors for
respiratory infections include exposure to environmental pollutants and crowding.
Atmospheric pollution: Refers to introduction into the air of any substance different from
any of its natural constituents.47 This may come from one or more of noxious atmospheric
gases (such as carbon monoxide, sulphur dioxide, benzene and ozone) or particulates like
dust or soot from several domestic sources.47 These pollutants can cause impairment of the
natural respiratory defense mechanisms if inhaled at adequate concentrations, and over a
long enough period of time. Some earlier Nigerian reports had identified an association
between air pollution levels and respiratory illnesses.22, 47
Domestic biomass pollution: In Nigeria, as is the case in many tropical countries, cooking
is often done indoors in poorly ventilated rooms with the possibility of a consequent build
up of high levels of domestic smoke pollution.22 Studies have shown that the occurrence of

25
pneumonia increases in direct relation to the amount of time a child spends exposed to this
type of pollution.21,48 In Nigeria, and many other tropical African communities, young
infants are usually carried on the backs of mothers while cooking. This puts such infants at
special risk of culinary smoke exposure.21,22
Environmental tobacco smoke: The association between environmental tobacco smoke,
often referred to as passive smoking, and respiratory illness in childhood has been
established by some earlier studies.49,50 In a cohort of children followed up for the first two
years of life in Brazil, Victora et al51 found a 50% increase in ALRI hospitalizations
among children with two smoking parents compared to children of non-smokers. This
association is reportedly stronger for infants than for older children, and also stronger for
maternal smoking than for paternal smoking.49,50
Crowding: This occurs in various forms such as the number of siblings in the household,
room occupancy, population density, as well as daycare attendance. Crowding, a common
occurrence in most developing countries, was found to contribute to the transmission of
droplet-acquired respiratory infections.44 Crowding-related variables such as birth order
and the number of children under-five years in the household have been associated with a
higher risk of pneumonia.2,44,49,52 Of a cohort of 238 children who attended day care during
the first year of life, Celadon and others reported that children who attended day care
were 1.6 times more likely to have ALRI compared with those not attending day care.53
D. Nutritional factors: The nutrition-related factors that may influence the risk of
pneumonia include birth weight, breast-feeding, the nutritional (macronutrient) status, as
well as the levels of vitamin A and zinc.2
Malnutrition: Most hospital-based data found a two- to four- fold increase in the
prevalence of pneumonia among malnourished children.24,44,45,52 In a systematic review of
16 relevant studies in developing countries, Chisti et al52 reported that children with
26
pneumonia and moderate or severe malnutrition (defined as <-2 to ≥-3 z- score of weight-
for-age, weight-for-height or 60–74% weight-for-age of the median of the NCHS) are at
higher risk of death. Improving the nutritional status of children is therefore a potentially
beneficial intervention towards preventing pneumonia, reducing the associated mortality,
as well as improving growth and development in children in the developing countries.19
Breast-feeding: Breast milk may protect against pneumonia through a number of
mechanisms, which include its contents of antibacterial and antiviral substances,
immunologically active cells and stimulants of the infant’s immune system.26 Also, studies
concerning the association between breast-feeding and overall infant mortality in
developing countries suggest a protective effect of exclusive breast-feeding in early
infancy.2, 19, 26 Not only was pneumonia common in those who were not breast-fed, but
pneumonia-related deaths were reportedly higher in the same group.2,19,26,54
Micronutrient deficiency: The two micronutrients that have been identified to have a
major impact on the morbidity and mortality burden of pneumonia in children include
Vitamin A and zinc.
o Vitamin A: Vitamin A, a fat-soluble vitamin which is available in liver and dairy products,
is known to enhance immune function and also plays an important role in the normal
functioning of the lungs, skin, intestines and eyes.55 Unlike most risk factors for
pneumonia, the evidence on the role of vitamin A deficiency results mainly from
randomized controlled trials.55,56 Periodic vitamin A supplementation in children was
shown to substantially reduce the overall childhood mortality.55 Furthermore, a large-dose
vitamin A supplementation during illness has been shown to reduce the mortality, severity
of illness, and the duration of pneumonia in children with measles.56
o Zinc: Zinc is an essential nutrient and factor for the immune system.57 Zinc deficiency
decreases the ability of the body to respond to infection, and it is also known to affect
27
adversely both cell-mediated and humoral immune responses.57 The evidence of the
importance of zinc in child health has come from recent randomized controlled trials of
zinc supplementation. A systematic review of studies evaluating preventive effects of zinc
supplementation on the morbidity burden of ALRI noted an overall reduction of 15% in
the incidence of pneumonia in zinc-supplemented preschool children.58
E. Co-Morbid factors/Inter-current illness: These include conditions such as diarrhoea
disease, measles, pertussis and concomitant infection with the Human Immunodeficiency
Virus/ Acquired Immunodeficiency Syndrome (HIV/AIDS).
Diarrhoea disease: It has been shown that children who suffer from repeated or severe
episodes of diarrhoea are also at a higher risk of pneumonia.27,59,60 However, it is not clear
whether these conditions are causally related or whether their observed co-occurrence
merely reflects the presence of common risk factors, for example a weak immune system
and malnutrition. The latter view is supported by the fact that risk factors such as lack of
breastfeeding, low family income and age are commonly identified in children with
diarrhoea disease, as well as those with pneumonia.2 Diarrhoea may also increase the risk
of pneumonia in the short term by causing acute micronutrient loss, stressing the host
immune system, causing dehydration and consequently creating a vulnerable period of
increased risk of infections. Recently, a review of studies carried out in Ghana and Brazil
were compared to see the association between pneumonia and diarrhoea.27 In the review,
diarrhoea disease contributed substantially to the risk of pneumonia within a few weeks of
its occurrence.27
HIV/AIDS: The HIV pandemic has had a great impact on childhood mortality in sub-
Saharan Africa since 1990.23 In addition to the increased predisposition of HIV-infected
children to bacterial and viral (non-HIV) pneumonia, HIV-infected children have also
been found to have a 6.5 times greater case-fatality rate than HIV-uninfected children.61

28
Measles and pertussis: Measles is a major cause of ALRI in developing countries.62
Hospital and community-based studies of pneumonia have found that measles accounted
for 6%-21% of the morbidity and 8%-93% of the pneumonia-related mortality.62
Furthermore, measles and pertussis are commonly complicated by pneumonia, while co-
morbid measles or pertussis in children with pneumonia is associated with a severe disease
and higher case-fatality.2,43,52,62
Aetiological agents of pneumonia
There is a wide spectrum of potential causative agents of pneumonia, but the major categories
comprise bacterial and non-bacterial pathogens. These may be specific viral, bacterial, fungal
or mycoplasmal agents.40,46 Studies have shown that mild and moderate CAP is mainly
caused by viruses, particularly in the first year of life, whereas most cases of severe CAP are
caused by bacteria.2,49,52 However, it has also been shown in developing and developed
countries that measles virus, influenza viruses and respiratory syncytial virus play a major
role in causing severe and/or complicated CAP.43,45,63 The leading bacterial cause in several
earlier studies was Streptococcus pneumoniae (pneumococcus) reportedly identified in 30.0–
50.0% of pneumonia cases.46,64-68 The second most common organism isolated in most
studies was Haemophilus influenzae type b (Hib; 10.0–30.0% of cases) followed by
Staphylococcus aureus and Klebsiella pneumonia in the paediatric pneumonia cases.46, 64-68
However in the studies by Johnson et al and Fagbule et al, from Ibadan and Ilorin in the
South West and North Central regions of Nigeria respectively, Staphlococcus aureus was
identified to be the commonest bacterial agent.45,69 The importance of ‘atypical’ bacteria
(Mycoplasma pneumoniae and Chlamydia pneumoniae) in severe and/or complicated CAP
has not been completely defined worldwide, largely because of difficulties in identifying
them.67 However, recently published data indicate that a considerable number of children
with CAP caused by atypical bacteria would have a complicated course, mainly because of

29
the presence of pleural effusion.70 The causative agent of pneumonia has been found to differ
according to the age of the patient as shown in Table II.40
Table II: Common agents causing community-acquired pneumonia according to age. 40
Age
Newborns 1 – 3 months 1 - 12 months 1 – 5 years Older than 5 years
Enteric Gram
negative, Group
B streptococcus
Viruses,
Chlamydia
trachomatis,
Ureaplasma
urealyticum,
Bordetella
pertussis
Viruses,
Streptococcus
pneumoniae,
Haemophilus
influenzae,
Staphylococcus
aureus,
Moraxella
catarrhalis
Viruses,
Streptococcus
pneumoniae,
Chlamydia
trachomatis,
Mycoplasma
pneumoniae
Streptococcus
pneumoniae,
Mycoplasma
pneumoniae,
Chlamydia
pneumoniae
In recent years, the HIV pandemic has also contributed substantially to increases in the
incidence and mortality from childhood pneumonia.2 In children with HIV, CAP remains a
major cause of mortality, but additional pathogens like Pneumocystis jiroveci have also been
found in HIV-infected children.2 Other organisms such as Mycoplasma pneumoniae,
Chlamydia spp, Pseudomonas spp, Escherichia coli, measles, varicella, influenza,
Histoplasma capsulatum and Toxoplasma gondii can also cause pneumonia in children with
HIV.2
Clinical features of pneumonia
The major clinical manifestations of pneumonia include fever, cough, tachypnoea,
breathlessness/difficulty breathing, poor feeding/anorexia, and in the older child capable of
complaining, chest pain.40 The presence of restlessness and/or cyanosis may suggest
hypoxia, while vomiting and diarrhoea are particular symptoms prominent in infants.40
Children with pneumonia may also present with abdominal pain and/or vomiting and
headache. Among other physical signs, children with pneumonia may have chest wall
retractions, the presence of bronchial breath sounds and/or crepitations on auscultation.40 In
the overtly malnourished or immunocompromised child with pneumonia, respiratory signs or

30
symptoms are notably few. Using the age-specific cut-off points as the reference points,
tachypnoea has been identified as an invaluable sign of pneumonia in developing countries.71
Some earlier reports have however contended that respiratory rate may not be particularly
useful in identifying children with pneumonia, especially in the infant.72,73
Using clinical and radiological parameters two major types of pneumonia can be
distinguished as lobar and bronchopneumonia.4,24,74 In bronchopneumonia, patchy opacities
of the lung field on chest radiograph, auscultatory findings of diminished breath sounds and
coarse crepitations constitute the usual characteristics.4,24,74 On the other hand, lobar
pneumonia is characterized by reduced chest movement on the affected side, dullness to
percussion, bronchial or tubular breath sounds and crepitations. In addition, a homogenous
opacity involving the affected lobe with or without a positive air bronchogram sign is usually
evident on the chest radiograph in lobar pneumonia.4,65
Complications of pneumonia
Various complications of pneumonia have been reported. Heart failure has been reported as
the most common in most studies.4,24,45,74 Respiratory complications reported include pleural
effusion, empyema, pneumothorax, subcutaneous emphysema, lung abscess, pneumatocoeles
and purulent otitis media.4,24,45,74 Other complications reported were anaemia, gastroenteritis,
pericarditis and septicaemia.4, 24
Investigations in pneumonia
The goals of investigations are to confirm a diagnosis and exclude the close differential
diagnoses. Furthermore, investigations may also be carried out to determine the causative
organism, the extent of the lesion present as well as to monitor the response to management.
Investigations may be specific or supportive. For pneumonia, these include radiological,
microbiological and haematological investigations.

31
Radiological: Chest radiography remains perhaps the most frequently requested investigation
in confirming a diagnosis of pneumonia.40 A posterior-anterior (PA) film, with or without a
lateral, is often used. Radiographic findings of pneumonia include peribronchial and
interstitial infiltrates, or lobar/segmental consolidation with the air bronchogram sign.4,46,49,74
A chest radiograph is also useful in identifying the anatomic pattern of the parenchymal
lesion, location, extent and/or the presence of associated intrathoracic lesions/complications
such as hyperinflation, parapneumonic effusion and air-leak syndromes.39,46 In addition to
aiding diagnosis, chest radiographs are also useful in monitoring the course of pneumonia.39,
46 Also, certain radiographic patterns may suggest the possibility of a specific aetiology. A
right upper lobe consolidation with bulging fissure may suggest Klebsiella pneumonia while
the presence of pneumatocoele, with or without pleural effusion may suggest a
Staphylococcal aetiology.39 Perihilar infiltrates in a previously healthy infant may suggest a
possible viral aetiology.
One of the problems about interpreting chest radiographs is the great intra- and inter-observer
variation in radiographic features used for diagnosing pneumonia, and also the lack of
standardization. The WHO produced a method for standardizing the interpretation of chest
radiographs in children for epidemiologic purposes.75
Microbiological: Investigative tools under this category are particularly useful in identifying
the aetiological agent of pneumonia. Whereas the identification of the causative pathogen
enables the health worker to select the appropriate antimicrobial agent, the ideal investigative
tool for identifying most pathogens of pneumonia remains elusive. Some of the methods
available for detecting the aetiological agent(s) of pneumonia include:
Nasal wash or nasopharyngeal swab: These samples have been used for viral detection by
culture, polymerase chain reaction and/or immunofluorescence. Swab samples may be used
to detect some bacteria agents such as Streptococcus pneumoniae and Hib.45, 66 It is however
32
important to note that the identification of bacterial growth from the nasopharynx does not
indicate infection in the lower airways.
Blood culture: A sample obtained before the commencement of antibiotics has been
identified as a specific investigative tool for pneumonia, with a positive yield correctly
identifying the causative organism in 20-33% of patients in different studies.45,46,65,66 69
Pleural fluid culture: This may grow potential pathogens, but the usual practice of empirical
antibiotic use in pneumonia may reduce the sensitivity of this method.76 However, pleural
fluid should be aspirated for microscopic examination and culture whenever technically
feasible.76
Sputum culture: Children aged less than ten years are unable to produce adequate sputum. 76
Furthermore, samples are usually contaminated by oral flora. Induced sputum production,
with the use of nebulized saline, has been used in children aged less than five years not
capable of producing sputum.66
Bronchoscopy: Flexible fiberoptic bronchoscopy has been useful to obtain lower air way
secretions for culture or cytology.76 Samples that can be obtained by bronchoscopy include
bronchial washings, bronchoalveolar lavage fluid and transbronchial biopsy specimens.76
Lung aspirate: Lung aspirate studies have been used in several earlier studies to identify the
common bacterial agents of pneumonia in childhood.65,66,69,77,78 The reported diagnostic yield
from culture of lung aspirates is approximately 50% in children, as opposed to the yield of
20%- 30% from blood culture.78 The reported complications include pneumothorax in 1.5-9%
of cases and a transient small haemoptysis identified in 0.7-3% cases.65,66, 69, 77,78
Serology: The demonstration of a four-fold rise in the titres of specific antibody to the target
pathogen(s) in the two serum samples taken 10-14 days apart, at the acute and convalescent
phases, is considered a sufficient ground for a recent infection due to the pathogen(s).45, 79
33
Serology is an invaluable laboratory tool for detecting viruses, chlamydial and mycoplasmal
organisms.39,45,79
Nucleic acid amplification tests: These tests have been developed by many modern
laboratories to achieve a rapid and accurate detection of those pathogens that are difficult to
culture.76 One of such tests is the polymerase chain reaction (PCR) assay, which may be
applied to specimens from respiratory secretions, lung aspirate samples or blood.76 Viruses,
M. pneumoniae, C. pneumoniae, and bacteria agents can be identified through this method. It
has excellent sensitivity and specificity for pathogen identification, but is costly and time-
consuming. Furthermore, its usefulness is also limited by the inability to differentiate a
carrier state from an active disease except for lung aspirate studies. The cost of the equipment
continues to underscore the poor availability of this method in most developing countries.
Other tests: These includes hematological and blood biochemistry tests.
Haematological: This test provides only supportive clues of a current infection. A complete
blood count (CBC) may show anaemia with leucocytosis in an infant with Staphylococcal
pneumonia.39 Also, leucocytosis with a left shift in the presence of pneumonia would suggest
a bacterial rather than viral origin.39
Blood biochemistry and arterial blood gas determination: These tests are considered useful in
monitoring the response to fluid therapy and supportive care. This is necessary in view of the
risk of hypoxaemia, respiratory failure and syndrome of inappropriate antidiuretic hormone
secretion (SIADH).39
An overview of hypoxaemia and pneumonia
Hypoxaemia constitutes a serious manifestation of severe respiratory illness. Indeed, it is a
strong risk factor of ALRI-related mortality, particularly pneumonia.7,8,80,81 Several co-
morbidities and respiratory complications may follow pneumonia. While the common
respiratory complications of pneumonia include atelectasis, pleural effusion and acute

34
respiratory failure amongst others, systemic consequences also abound. A systemic
complication of many lower respiratory infections is hypoxaemia. Pneumonia-related
hypoxaemia can evolve from more than one mechanism.5 The presence of alveolar
hypoventilation in pneumonia may occur due to extensive loss of lung tissue, as is the case in
those with associated atelectasis. On the other hand, hypoxaemia may complicate pneumonia
from the associated limitation of chest wall movement, as is the case with an associated
pneumothorax or pleural effusion.5 In addition, pneumonia-related intrapulmonary shunting
and ventilation-perfusion mismatch may also lead to hypoxaemia, and ultimately respiratory
failure.
A systematic review by Lozano82 reported that the prevalence of hypoxaemia in children with
ALRI using pulse oximetry varied from 6-8% in the outpatient setting, increasing to 31%
and 43% in emergency room patients and those with clinical pneumonia respectively. Also,
the prevalence was reportedly higher among hospitalised children (47%) and in those with
radiographically confirmed pneumonia (72%).82 However, the differences in the criteria for
establishing the diagnosis of pneumonia and bronchiolitis was not mentioned in several
reports included in the review by Lozano. Also, some reports with lower prevalence values of
hypoxaemia studied ambulatory and hospitalised children with several forms of ALRI.9,10
In a more recent literature review in 2009, the corresponding median prevalence of
hypoxaemia associated with WHO-defined pneumonia was estimated as 13% in the
developing countries.7 While there is evidence that the prevalence of hypoxaemia in
hospitalized children with pneumonia differs between regions, the differences are however
within comparable pneumonia severity classifications and heights above sea level. However,
the reported prevalence is consistently lower in reports emanating from Africa (eight studies;
range of prevalence 3–10%) compared with those from Asia (eight studies; range of
prevalence 9–39%). In addition, the prevalence of pneumonia-associated hypoxaemia from
35
locations that are more than 1000m above sea level,16,83,84 ranged from 39% (for a study
based on WHO-defined pneumonia)16 to 73% (for a study in which the diagnosis was based
on radiographic findings).83
Traditionally, the monitoring of hypoxaemia in the patient with pneumonia has been with
arterial blood gases. More recently however, pulse oximetry has been identified as a more
convenient, safer and valid monitoring tool. The severity of hypoxaemia is affected by
altitude, haematocrit concentration, degree of acidosis, and the body temperature all of which
are important considerations in determining the oxygen-carrying capacity of blood.32 As a
non-invasive, simple and reproducible method of measuring the oxygen saturation of arterial
haemoglobin, pulse oximetry remains a reliable bedside tool for monitoring the level of
hypoxaemia in paediatric practice.6 However, the required pulse oximeters are relatively
expensive and have the additional recurring costs of the need for replacing the probes. For
these reasons, they are not usually available in most primary health care facilities and even in
many referral facilities in developing countries.
While pneumonia may be diagnosed by identifying tachypnoea, with or without chest wall
indrawing, the clinical recognition of hypoxemia is more problematic. Different sets of
clinical signs and symptoms have been studied to predict the presence of hypoxemia in
children with pneumonia.13 Majority of such studies were carried out at high altitude,8,80,82-86
as against the limited data from locations at sea level.13 Therefore, in order to guide the health
care worker regarding the desirable timing of appropriate intervention like oxygen therapy or
referral, the early detection of these clinical clues of hypoxemia will be a crucial part in the
clinical management of patients with pneumonia. Such clinical symptoms and signs like
altered levels of consciousness are often attributable to compensatory respiratory responses to
hypoxaemia, or indeed, the clinical indicators of its consequences.
36
The major physical signs attributable to hypoxaemia include central cyanosis, tachypnoea,
chest wall retractions, and the use of accessory muscles of respiration, sometimes resulting in
head nodding. Central cyanosis, which sometimes poses some difficulties in the black race,
was reportedly highly specific (with a range of 84-100%) but the corresponding sensitivity is
poor (9-42%).8-11,14 The clinical interpretation of this is that although the presence of central
cyanosis is useful for identifying hypoxaemia, inability to detect its presence does not
exclude hypoxaemia. On the other hand, against the background of a reported sensitivity and
specificity of 82% and 51% respectively, respiratory rates above the age-specific cut-offs
remains perhaps, the single most useful clinical sign for predicting hypoxaemia.17 Inability to
drink/feed and altered mental state (which encompasses severe lethargy, prostration, or
sometimes coma) was reported to have a sensitivity of less than 50% and an equally poor
specificity in most studies.8, 84 Other clinical signs like chest wall indrawing and grunting
though specific for hypoxaemia (83%) had a modest sensitivity(69%).16 Also, the specificity
of 83% and sensitivity of 57% associated with head nodding were comparable to those of
chest wall indrawing and grunting. The poor predictive value of auscultatory finding of either
rhonchi or crepitations is indicated by the reported poor specificity of 47% at high altitude,
despite a corresponding sensitivity of 96%.16,17
Whereas several risk factors of pneumonia have been previously studied, especially with
respect to pneumonia-related mortality,2 54 to the best knowledge of this researcher, the
relationship between these risk factors and the presence of hypoxaemia has hardly been
earlier explored. Studies have shown that the risk of hypoxaemia was between 3.5 to 16.2
times higher in the presence of pneumonia than in the more common acute upper respiratory
illnesses.17, 87 In addition, the relative risk of mortality in children with hypoxaemic
pneumonia is notably higher than in those with non-hypoxaemic pneumonia at
admission.8,10,12 Furthermore, hypoxaemia is associated with a two-to five-fold increase in the
37
risk of a fatal outcome from pneumonia.8,10,12,80 Also haemoglobin oxygen saturation (SpO2)
measured using a pulse oximeter has been shown to correlate with the outcome of pneumonia
in children.86 The management import of these observations is that if a fatal outcome is to be
avoided in children with pneumonia, it is important to detect hypoxemia as early as possible
with a view to effecting the appropriate modifications of the initial treatment strategies.
In conclusion, it can be surmised that hypoxaemia had earlier been overlooked in worldwide
strategies for pneumonia control and reducing child mortality. Worse still, the import of this
complication has also been frequently underestimated in developing countries, apparently due
to the limited availability of the required hypoxaemia-monitoring tools like ABG facilities
and pulse oximetry.7 Yet, the accurate identification of hypoxaemia in pneumonia will be
crucial in determining the safety or otherwise of continuing outpatient treatment, or indeed,
may constitute a valid criterion for possible hospital admission. There is thus a need for more
data on the prevalence of hypoxaemia amongst children with pneumonia, as well as the
profile of children who are hypoxaemic, and those who are potential beneficiaries of prompt
oxygen treatment.
Management of pneumonia
The main principles in the management of pneumonia are to assess disease severity, eradicate
the infection, give symptomatic care and deal with complications.
Severity assessment: The spectrum of severity of pneumonia can be mild to severe using the
British Thoracic Society guidelines (Table III).88 The presence of any of the signs of severe
pneumonia is an indication for hospital admission. Infants and children with mild to moderate
respiratory symptoms can be managed safely in the community.88 The severity assessment
will also influence microbiological investigations, initial antimicrobial therapy, routes of
administration, duration of treatment and level of nursing and medical care.

38
Table III: British Thoracic society severity assessment of pneumonia88
Mild to moderate Severe
Infants Temperature <38.5°C Temperature >38.5°C
RR <50 breaths/min RR >70 breaths/min
Mild recession Moderate to severe recession
Taking full feeds Nasal flaring
Cyanosis
Intermittent apnoea
Grunting respiration
Not feeding
Tachycardia(age dependent)
Capillary refill time > 2seconds
SpO2<92%
Older Children Temperature <38.5°C Temperature >38.5°C
RR <50 breaths/min RR >50 breaths/min
Mild breathlessness Severe difficulty in breathing
No vomiting Nasal flaring
Cyanosis
Grunting respiration
Signs of dehydration
Tachycardia (age dependent)
Capillary refill time > 2 seconds
SpO2<92%
On the other hand, using the WHO classification for severity, pneumonia could be assessed to
be non-severe, severe and very severe.41 The presence of cough or difficult breathing plus
age-specific increase in respiratory rate (>60 breaths/min for infants aged less than two
months, >50 breaths/min for infants aged two months up to less than 12 months, and >40
breaths/min for children aged 12-59 months) is classified as non-severe. Severe pneumonia is
diagnosed when in addition to all the signs and symptoms used to diagnose non severe
pneumonia, there is at least one of either lower chest wall indrawing, nasal flaring or
grunting. A diagnosis of very severe pneumonia is based on the presence of at least one of the
following: central cyanosis; inability to breastfeed/drink or vomiting; convulsions, lethargy
or unconsciousness; severe respiratory distress such as head nodding.41 The WHO severity
assessment does not include SpO2 measurement which is present in the BTS guidelines.
39
However, experts agree that blood oxygenation is an essential factor for evaluating CAP
severity and indeed constitutes the best indicator of the need for hospitalization.88
Treatment with antibiotics: Against the background of the reported causative role of viruses
in childhood pneumonia,30,45 it is appropriate not to treat every child with antibiotics.
However, making therapeutic decisions in the individual case may be difficult, because most
tests do not adequately differentiate viral from bacterial infections. Besides, some children
with severe pneumonia have mixed viral and bacterial agents.45 An additional treatment
challenge is the problem of bacterial resistance which has increased steadily over the years.40
The advent of bacterial resistance is related to the common practice of inappropriate
antibiotic usage in clinical conditions in which a viral aetiology is most likely, and/or the
illness is self limiting. The commonest clinical scenario which frequently attracts such an
inappropriate usage of antimicrobials is acute nasopharyngitis.
Table IV: Options of antibiotics in relation to age and clinical presentation of CAP.40
Age/ Clinical picture Inpatient Outpatient
Newborn
Ampicillin + gentamicin -
3 weeks to 3 months
interstitial infiltrate, not toxic
Macrolides Macrolides
4 months to 4 years Penicillin or ampicillin; add
macrolide if not responding.
Amoxicillin
5 years or older:
Alveolar infiltrate, pleural
effusion, toxic appearance
Penicillin or ampicillin; add
macrolide if not responding.
Macrolide; amoxicillin
5 years or older:
interstitial infiltrate
Macrolides; consider adding
a beta-lactam if not
responding.
Macrolides
Although none of the recent studies have addressed the issue of comparing the use of
antibiotics versus their non-use,40 it is logical to use them whenever a bacterial pneumonia is
the most probable diagnosis. Since an aetiologic diagnosis is more of the exception than the
rule in routine clinical practice, antibiotics are usually started on an empiric basis. The choice

40
of antibiotics in such situations is usually based on a summation of clinical features and the
regional prevalence data of CAP-causing pathogens in different age groups (Table IV).
General management: The general management of pneumonia for in-patients besides
oxygen therapy include adequate hydration (intravenous fluid as required), especially in
children whose intake has been significantly compromised by breathlessness and/or fatigue.39
Fluid intake should however be carefully monitored in such patients because pneumonia can
be complicated by SIADH.39 Furthermore, adequate nursing care via regular monitoring of
the vital signs, clearing the nostrils of mucus, provision of adequate calories via regular
feeding, as well as changing the position in bed for the child with impaired mental state are
all important general treatment measures required for a favorable disease outcome.
Oxygen therapy: Increased concentration of inspired oxygen is required when tissue
oxygenation is inadequate. Oxygen therapy not only improves the survival, but it may also
prevent substantial morbidity that may occur from prolonged hypoxemia in children who
survive.89 It may be a life-saving measure at the time it is required to treat the pneumonia.
The use of humidified oxygen is usually preferred, not only because it relieves hypoxaemia,
but also liquefies secretions and moistens the airway.39 The ultimate effect is a decrease in the
tenacity and viscosity of the usually copious respiratory secretions. The WHO recommends
administering oxygen, if there is ample supply, to children with signs and symptoms of
severe pneumonia and where supply is limited, to children with any of the following signs:
inability to feed and drink, cyanosis, respiratory rate greater than or equal to 70 breaths per
minute, or severe chest wall retractions.89 Oxygen is preferably administered at a flow rate of
0.5liter per minute for children younger than two months, and one liter per minute for older
children. However, if a pulse oximeter is available for monitoring the treatment of children
41
with severe pneumonia, the flow rate of the oxygen should be titrated against the SpO2 to
ensure adequate oxygenation of greater than 95%.89
Sources of oxygen may be from the oxygen cylinder or an oxygen concentrator.89 Oxygen
cylinders are heavy and difficult to transport, as they need to be transported to and fro for
refill, and to the point of use.89 Oxygen cylinders usually contain 100% oxygen. The other
major source of therapeutic oxygen is the oxygen concentrator. An oxygen concentrator
works by separating nitrogen from the oxygen in atmospheric air. Most of the available
oxygen concentrators use an electrically powered compressor to force compressed air through
synthetic aluminium silicate (zeolite) which reversibly binds nitrogen.89 This device usually
comes with an oxygen concentration indicator (OCI) which indicates the concentration of
oxygen being delivered at a time. The OCI consists of three lights; green when the oxygen
concentration being delivered is greater than 95%, orange when it is between 85-95% and red
if less than 85%.89 An oxygen concentrator delivers approximately 2-4l/min of gas,
containing over 90% oxygen.89 The concentration of the oxygen delivered is however less at
higher flow rates. Whereas oxygen concentrators are reliable, smaller, lighter and cheaper
than oxygen cylinders, a major limitation is that they are dependent on electricity, thus
restricting its usefulness in a country like Nigeria where power supply is neither reliable nor
dependable. It is also noteworthy that oxygen from both sources is completely dry, and would
need to be passed through a humidifier before delivery to the patient to achieve the required
humidified oxygen.
Oxygen can be delivered to the patient via one of the following devices which include face
masks, nasal prongs, nasal cannula, nasopharyngeal catheters, head box, or tents.89
42
JUSTIFICATION FOR THE STUDY
Pneumonia remains a major contributor to the high global, African regional and national
childhood mortality. In Nigeria, pneumonia accounts for an estimated 20-25% of childhood
deaths.59 Hypoxaemia remains a serious complication of severe respiratory illnesses in
general, and a strong risk factor of pneumonia-associated mortality in particular.8 10 80 In the
past, hypoxaemia has been overlooked in world-wide strategies for pneumonia control and
reducing child mortality. In most developing countries, including Nigeria where the majority
of pneumonia-related deaths occur, the situation is not different with respect to the paucity of
data on the role of hypoxaemia in pneumonia-related mortality.1 In developing countries, this
is due to the limited availability of the required tools (such as the pulse oximeter) for the early
detection and monitoring of hypoxaemia following oxygen therapy.7 Clearly, the identification
of a minimum set of clinical signs that can reliably detect the presence of hypoxaemia in
children with pneumonia will be an invaluable tool for the clinician in deciding when to
commence oxygen therapy. Furthermore, accurate identification of pneumonia-related
hypoxaemia in children will be crucial in determining the safety of continuing outpatient
treatment. In Nigeria and many other developing countries, the primary health care (PHC)
facility is usually the first point of contact for most children in the country requiring the
services of health care workers. These PHC facilities are usually manned by the lower cadres
of the health care team. Thus, the findings of the current study are likely to prove invaluable
for the health care workers at the primary health care centre especially in identifying the
criteria for referring patients to other facilities at the higher tiers of the health care system
where oxygen therapy is available.
To the best knowledge of the researcher, the aforementioned paucity of information on the
magnitude of pneumonia-related hypoxaemia is even more evident in Ilorin located in North
Central Nigeria where the current study was carried out. Also, there is the dearth of data on the

43
association between several risk factors of pneumonia and hypoxaemia. These knowledge
gaps are expected to be filled by the findings of the current study, which is also expected to
generate a data-base of the magnitude of pneumonia-associated hypoxaemia in Nigerian
children. In addition, by identifying the possible clinical signs that can detect hypoxaemia, the
current study also hopes to provide a data-base that can be incorporated into evolving national
guidelines on the management of children with pneumonia. Undoubtedly, such guidelines
would facilitate the early recognition of a child with hypoxaemia and thus, prompt referral
from PHC facilities to the higher tiers of the health system. It would also be a useful clinical
tool in the Paediatric Emergency Room, where oxygen use is currently being “rationed” due to
the limited availability. The clinical import of harnessing the use of the expected findings in
the in-patient care of children with CAP will be an ultimate reduction in the current
unacceptably high pneumonia-associated mortality in Nigeria, and the accomplishment of the
fourth MDG.

44
AIMS AND OBJECTIVES
A) General Objective:
To determine the clinical predictors of hypoxaemia in hospitalized children aged between
two months and up to five years with pneumonia at the University of Ilorin Teaching
Hospital (UITH), Ilorin, Kwara State.
B) Specific Objectives:
a) To determine the prevalence of hypoxaemia in children aged two months and up to five
years with pneumonia.
b) To identify the clinical predictors of hypoxaemia in children with pneumonia.
c) To determine the association between the risk factors of pneumonia and hypoxaemia.
d) To determine the relationship between various levels of hypoxaemia and the management
outcome of pneumonia.
45
MATERIALS AND METHOD
Study site
The study was conducted in the Emergency Paediatric Unit (EPU) and the Paediatric Medical
Ward of University of Ilorin Teaching Hospital (UITH). The hospital is located in Ilorin
South Local Government Area of Kwara State. Ilorin is the capital city of Kwara State,
situated in the North Central geopolitical zone of Nigeria. The hospital is a tertiary health
facility that serves as a referral centre, not only for patients from Kwara State, but also the
adjoining states of Osun, Niger, Kogi and Ekiti. It also provides significant primary and
secondary health care services to the general public. The EPU, which constituted the
principal recruitment site of the current study receive paediatric medical emergencies beyond
the neonatal period and up to the age of 14 years.
The yearly temperature in Ilorin ranges between 19.50 to 37.50C, while the ambient humidity
is usually between 42 and 45%.90 With a population of 777,667 and an annual growth rate of
2.3% (2006 census), Ilorin town is located at an altitude of 303m above sea level.90 Majority
of the inhabitants are predominantly artisans with poor income.
Study design
This was a descriptive cross-sectional study in which the subjects were children aged
between two months and up to five years diagnosed with pneumonia.
Sample size determination
The formula91 used for estimating the minimum sample size required for the study was:
n = z2pq
d2
Where:
n = the desired minimum sample size.

46
z = the standard normal deviation usually set at 1.96 which corresponds to 95% confidence
interval.
p = the proportion in the target population estimated to have a particular characteristic
(pneumonia). This was estimated at 11.1% from a previous study.4
q = the proportion in the target population who do not have a particular characteristic, i.e.
q = 1.0 – p = 1 – 0.111 = 0.889
d = tolerable margin of error, an observed difference of 5% or more taken as being
significant.
Therefore the minimum sample size required for the current study is:
n = (1.96)2×0.111 ×0.889
(0.05)2 = 151
However, for ease of statistical analysis, a total of 200 under-five children were recruited for
the study.
Subject recruitment
The subjects were children aged between two months and up to five years presenting at the
EPU of UITH with clinical features comprising cough of less than 28 days duration, fever,
difficult breathing, tachypnoea, and auscultatory findings of one or more of reduced breath
sound intensity, bronchial breath sounds, or crepitations.40
Subject recruitment was done at the initial presentation in EPU. All consecutive admissions
into the EPU with a diagnosis of pneumonia that fulfilled the inclusion criteria were enrolled.
Subjects were recruited by the researcher or, in the occasional case, by a trained paediatric
resident doctor. The study was completed within twelve months of commencement (June,
2011- May, 2012).

47
Inclusion criteria
Children aged between two months and up to five years admitted into the EPU with an
admission diagnosis of pneumonia based on the presence of cough of less than 28 days
duration, fever and two or more of the following clinical parameters of:
i. breathlessness,
ii. age-related tachypnoea (>50 breaths/minutes for infants aged two months up to one
year, and > 40 breaths/minute for children aged 12-59 months) .
iii. auscultatory findings of one or more of reduced breath sound intensity, bronchial
breath sounds and crepitations.40
Exclusion criteria
1) Children with severe anaemia defined as a haematocrit value of ≤15%.
2) Children with clinical features of shock like cold clammy extremities, weak thready
pulse and other parameters of poor peripheral perfusion.
3) Children that had previously been recruited for the study who re-present to the unit with
symptom recrudescence.
4) Children with sickle cell disease.
5) Children previously diagnosed to have bronchial asthma.
Ethical clearance
The study was approved by the Ethics and Research Committee of the University of Ilorin
Teaching Hospital (Appendix VI).
College approval
Approval was obtained from the National Postgraduate Medical College of Nigeria to
proceed with the study (Appendix VII).
48
Consent
The caregivers were interacted with and were provided with adequate explanations about the
study as contained in the information sheet (Appendix I). Subsequently, parental consent was
obtained by seeking their signatures or thumb printing on the form provided for that purpose
(Appendix II).
METHOD
On presentation at the EPU, each child had a full clinical evaluation after obtaining an
informed consent from the parent. A semi–structured questionnaire was administered to
obtain the clinical and socio-demographic data from each subject’s parent or guardian
(Appendix III).
Using the socio-economic classification scheme of Oyedeji (Appendix IV),92 the socio-
economic index score of each child was calculated based on the occupations and educational
attainments of their parents or caregiver. The mean of four scores (two for the father and two
for the mother) approximated to the nearest whole number was the social class assigned to
the child as proposed by the same author.92 For example, if the mother was a junior school
teacher (score = 3) and father a senior teacher (score=2) and the educational attainment of the
mother was primary six (score=4), and the father was a school certificate holder (score=2).
The socio-economic index score for this child was: (3+2+4+2)/4 =2.75, which approximated
to the nearest whole number was three.
The informant (mother/caregiver) was asked about their child's symptoms, specifically the
presence of symptoms such as cough, fever, inability to feed or drink, vomting, rapid or
difficult breathing, abnormal sleepiness and/or the child being difficult to wake or irritable.
The relevant parameters obtained from the physical examination included anthropometric
measurements (weight, height and mid- arm circumference in those aged one to five years).
The weight was measured using a bassinet weighing scale (Surgifriend Medicals, London,

49
England) in infants, and a beam balance weighing scale (Marsdens weighing machine,
London, England) in children who were able to stand unsupported. Both scales have a degree
of accuracy of 50g, and were calibrated prior to use. The standing height was measured to an
accuracy of 0.1cm using a stadiometer. The mid-arm circumference (MAC) was measured to
the nearest 0.1cm using a non-flexible tape measure. The MAC was taken at the point mid-
way between the olecranon process of the ulna and the acromion process of the scapula.
The presence or absence of the relevant clinical signs like tachypnoea, nasal flaring, wheeze,
central cyanosis and chest indrawing were also noted. The respiratory rate was counted by
visual inspection of upward movement of the abdominal and/or chest wall while the child
was calm for one minute. The presence/absence of fast breathing in the individual subject
was determined using the age-related cut-off values of >50 breaths/minute for infants aged
two months up to one year, and >40 breaths/minute for children aged 12-59months. To
determine the presence of chest indrawing the child’s clothing were removed gently to enable
visualization of the lower chest wall. Chest wall indrawing was identified as inward
movement of the lower chest wall on breathing in, with the child lying flat on either the
mother's lap, or the examination couch. If the child was not quiet, examination was delayed
until the mother was able to make the child calm enough. Central cyanosis was determined by
bluish discoloration of the tongue and/or buccal mucosa. Percussion was done over the inter-
costal spaces (anterior and posterior), and the presence of resonant, dull or hyper-resonant
percussion notes were noted. Similarly, auscultatory signs like reduction in the intensity of
breath sounds, presence of crepitations, rhonchi, bronchial or transmitted sounds were
recorded in the study proforma. The clinical findings/observations made were recorded by the
investigator, and/or a trained assistant whose expertise regarding study guidelines had been
verified by the investigator as well as her supervisors.

50
Haemoglobin oxygen saturation (SpO2) was measured by attaching a Smartsigns® Liteplus
CE 0088 pulse oximeter (Huntleigh Healthcare, Cardiff, United Kingdom) to a finger using
an appropriately sized paediatric sensor. This was done as soon as possible after presentation
before oxygen administration as required. The oxygen saturation was recorded after a stable
reading was obtained for at least one minute while the child was breathing room air. The
oxygen saturation level of the researcher obtaining the measurement was recorded at the
beginning of each day of data collection. This was to serve as a control and confirm that the
oximeter was functioning appropriately. For the purpose of the current study, hypoxaemia
was defined as an arterial oxygen saturation of less than 90% as recorded by pulse oximetry.
8,32 Also, in the present study, the various levels of SpO2 were divided as ‘‘greater than 95%,
93-95%, 90-92%, 86-89%, and less than or equal to 85%’’.
The severity of pneumonia in each subject was graded (mild, moderate, severe) using the
British Thoracic Society (BTS) guidelines on the management of CAP in children.88 The
presence of two or more features in each category was used to grade the severity of
pneumonia in the subjects (Appendix V). Subjects with complications of pneumonia at
presentation were considered as having severe pneumonia.88
Chest radiographs were obtained in all subjects within 24 hours of presentation. Radiographic
features were recorded as either normal, presence of patchy opacities in one or more lobes, or
lobar/segmental consolidation with or without an air bronchogram. Also, the presence of
radiographic features of effusion, or other intra-thoracic complications such as pneumothorax
were identified and recorded. In order to validate the above radiographic findings, the
radiograph findings were corroborated by a Consultant Radiologist. Using a combination of
clinical and radiographic parameters, subjects were grouped as having either lobar or
bronchopneumonia.

51
All subjects had a blood specimen obtained for bacterial culture to determine the possible
causative agent, and haematologic parameters like packed cell volume (PCV), total and
differential white blood cell (WBC) count. All subjects were treated with the most
appropriate medications according to the current institutional guidelines. Furthermore, the
patient’s management was in no way hindered by his or her recruitment into the current
study.
Blood sample collection
Using strict aseptic techniques, the selected body site for blood sample collection was wiped
thoroughly by the investigator, or in the occasional case a trained paediatric resident, using
cotton wool soaked in 70% alcohol and chlorhexidine. Sufficient time was allowed for the
skin of the selected site to dry prior to the venepuncture.93 A fixed hypodermic needle was
used to collect four millilitres of whole blood from an accessible peripheral vein into a five
ml syringe. A separate needle was attached to the syringe for inoculating two millilitres of the
venous blood into the bottle containing the blood culture media. This was done by puncturing
the sealed opening at the top after wiping with wet cotton wool (soaked in 70% alchohol and
clorhexidine). The remaining two millilitres were transferred into a sample bottle containing
ethylene-diamine-tetra-acetate (EDTA), and gently mixed to prevent clotting. This latter
sample was used for obtaining the relevant haematological indices like total and differential
WBC counts. For the purpose of determining the haematocrit, heparinised capillary tube
sample was taken at an angle of 450 from the blood surface and the tube subsequently sealed
with plasticine at one end before centrifugation.
Laboratory Techniques
Blood culture bottles were incubated at 370C and examined for evidence of growth (turbidity,
cotton balls, bubbles, clots) on a daily basis by the microbiologist(s) in the laboratory.93
Subsequently, films were made from individual colonies when growths were observed. A

52
Gram stain examination was carried out on each sample. Whenever evidence of growth was
noticed, subculturing was done on MacConkey, chocolate and sheep blood agar. The blood
culture findings were corroborated by a Consultant Microbiologist. Inoculated media was
discarded on the seventh day whenever there was no evidence of growth.
The packed cell volume (pcv) was determined by spinning the capillary tube containing
blood samples in a micro-centrifuge at a centrifugal force of c12, 000g for five minutes by
the investigator. In the occasional case, this was determined by the trained paediatric resident
doctor. Subsequently, the reading was done using a haematocrit reader. The WBC and
differential count was done with an automated blood analyzer Symex KX 21® (Sysmex
Corporation, Kobe, Japan) by the senior laboratory scientist(s) and the results were recorded
in the study proforma.

53
Data analysis
Data was analyzed using the IBM® SPSS version 20.0 (IBM corporation, Virginia, U.S.A.)
2011 for windows software package. The data collected on the proforma were transferred into
a master sheet using numerical codes. A nutritional anthropometry program, NutriStat® of
Epi-info version 3.5.1(2008) was used to determine the percentage and z-score for age of
each child based on the WHO Growth Reference dataset.94
After the generation of frequency tables and simple proportions, the chi-square (χ2) and
Student’s t-tests were used to identify significant differences for categorical and continuous
variables respectively. Analysis of variance (ANOVA) test was used in comparing the means
when there were more than two groups for comparison. The distributions of discrete clinical
signs between hypoxaemic and non-hypoxaemic children were compared by using the χ2 test.
The Yates corrected value or the Fisher's exact test was used for testing the significance of
associations between cells with small numbers (<5) as appropriate. The sensitivity,
specificity, as well as positive and negative predictive values (PPV and NPV respectively)
was determined for the symptoms and signs in predicting the presence of hypoxaemia. Also,
a linear regression analysis was done to determine the best independent combinations of
symptoms and clinical signs for predicting hypoxaemia. In determining the correlation
between some risk factors of pneumonia and the SpO2 levels, the Spearman’s rank
correlation was used for categorical variables while the Pearsons correlation test was used
for quantitative variables. A p-value of <0.05 was considered significant.

54
RESULTS
Age and gender distribution of the children with pneumonia
A total of 200 children with pneumonia were recruited into the study. One hundred and
thirteen (56.5%) of the children were infants as shown in Table V. The mean(SD) age was
14.3 (13.5) months while the male: female (M:F) ratio was 1.5:1.
Table V: Age and gender distribution of the children with pneumonia
Age group
(months)
Male
n(%)
Female
n(%)
Total
n(%)
2-<12 64(32.0) 49(24.5) 113(56.5)
12-<24 32(16.0) 14(7.0) 46(23.0)
24-<36 16(8.0) 10(5.0) 26(13.0)
36-<48 1(0.5) 3(1.5) 4(2.0)
48-<60 6(3.0) 5(2.5) 11(5.5)
Total 119(59.5) 81(40.5) 200(100.0)

55
Some risk factors of pneumonia in the study population
Thirteen (6.5%) of the children with pneumonia had never received any vaccination, while
187 (93.5%) had received at least one or more types of vaccination. Seventeen (8.5%) of the
children had concomitant measles infection, five (2.5%) had HIV co-infection while three
(1.5%) had pertussis as a co-morbid illness with the pneumonia. The distribution of some of
the other risk factors of pneumonia among the study population is shown in Table VI.
Table VI: Some risk factors of pneumonia in the study population
Parameter Frequency Percentage Cumulative percent
Family type
Monogamous 169 84.5 84.5
Polygamous 31 15.5 100.0
Number of siblings
≤3 126 63.0 63.0
>3 31 15.5 78.5
None 43 21.5 100.0
Birth interval
None 43 21.5 21.5
<24months 33 16.5 38.0
≥24months 124 62.0 100.0
Smoking in the house
Yes 19 9.5 9.5
No 181 90.5 100.0
Attendance at day care
centre
Yes 25 12.5 12.5
No 175 87.5 100.0
Indoor cooking
Yes 153 76.5 76.5
No 47 34.5 100.0
Cooking with firewood
Yes 21 10.5 10.5
No 179 89.5 100.0
Exclusive breastfeeding
Yes 160 80 80.0
No 40 20 100.0
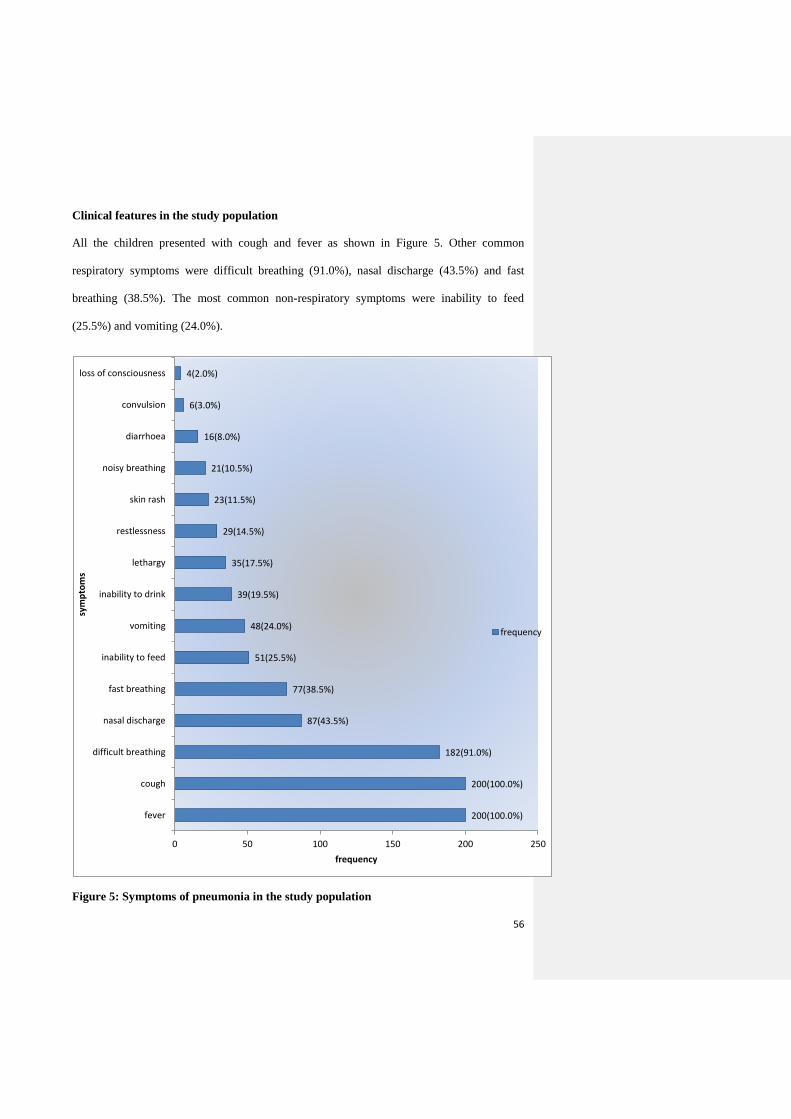
56
Clinical features in the study population
All the children presented with cough and fever as shown in Figure 5. Other common
respiratory symptoms were difficult breathing (91.0%), nasal discharge (43.5%) and fast
breathing (38.5%). The most common non-respiratory symptoms were inability to feed
(25.5%) and vomiting (24.0%).
Figure 5: Symptoms of pneumonia in the study population
200(100.0%)
200(100.0%)
182(91.0%)
87(43.5%)
77(38.5%)
51(25.5%)
48(24.0%)
39(19.5%)
35(17.5%)
29(14.5%)
23(11.5%)
21(10.5%)
16(8.0%)
6(3.0%)
4(2.0%)
0 50 100 150 200 250
fever
cough
difficult breathing
nasal discharge
fast breathing
inability to feed
vomiting
inability to drink
lethargy
restlessness
skin rash
noisy breathing
diarrhoea
convulsion
loss of consciousness
frequency
sym
pto
ms
frequency

57
Age-related tachypnoea, nasal flaring, reduced intensity of breath sounds and crepitations
were the most common findings and were identified in 191 (95.5%), 181 (90.5%), 176
(88.0%) and 162 (81.0%) subjects respectively. Central cyanosis and head nodding were the
least common findings identified in six (3.0%) and four (2.0%) of the subjects respectively.
The other physical findings in the study population with their frequency of occurrence are
shown in Table VII.
Table VII: The physical examination findings in children with pneumonia
Examination findings Frequency Percentage
Age-related tachypnoea 191 95.5
Nasal flaring 181 90.5
Diminished breath sounds 176 88.0
Crepitations 162 81.0
Febrile≥37.5oC 145 72.5
Lower chest wall indrawing 127 63.5
Hepatomegaly 127 63.5
Intercostal recession 91 45.5
Pallor 64 32.0
Tender hepatomegaly 61 30.5
Grunting 59 29.5
Rhinorrhoea 53 26.6
Dehydration 50 25.0
Abnormal percussion findings 46 23.0
Splenomegaly 22 11.0
Snuffle 21 10.5
Bronchial breath sounds 19 9.5
Unconsciousness 8 4.0
Central cyanosis 6 3.0
Head nodding 4 2.0

58
Anthropometry of the study population
As shown in Table VIII, the mean(SD) weight of the children recruited was 7.8(3.1) kg,
while the mean(SD) height was 71.2(31.5) cm. Ninety (45.0%) of the children had a weight
for age percentage which was estimated as less than 80% of the expected while 18 (20.5%) of
the 87 children aged between one and five years had a mid- arm circumference less than 13.5
cm.
Table VIII: Anthropometric measurements in children with pneumonia
Anthropometry Frequency Percentage Range Mean±SD
Weight (Kg) 200 100.0 3.0-20.0 7.8±3.1
Height (cm) 200 100.0 50.0-114.5 71.2±31.5
Weight for age percentage (%)
≤80 90 45.0 43.4-79.9 69.8±8.2
>80 110 55.0 80.6-140.6 99.4±11.5
Total 200
100.0 43.4 – 140.6 83.3±15.9
Height for age percentage (%)
≤95 101 50.5 75.3-94.9 89.7±4.4
>95 99 49.5 95.1-128.3 101.5±6.1
Total 200
100.0 75.3 – 128.3 95.6±7.9
Weight for height percentage (%)
≤90 90 45.0 38.9-88.9 77.4±10.6
>90 110 55.0 90.4-175.6 108.2±16.7
Total 200
100.0 38.9- 175.6 94.3±21.0
Weight for age z-score
<-1 125 62.5 -5.7- -1.1 -2.3±0.9
≥-1 75 37.5 -1.0- 3.2 -0.1±0.8
Total 200
100.0 -5.7- 3.2 -1.5±1.4
Height for age z-score
<-1 109 54.5 -6.3 - -1.1 -2.5±1.2
≥-1 91 45.5 -1 – 7.0 0.5±1.5
Total 200
100.0 -6.3- 7.0 -1.1±2.0
Weight for height z-score
<-1 93 46.5 -7.8- 1.1 -2.5±1.3
≥-1 107 53.5 -1.0- 5.6 0.7±1.4
Total 200
100.0 -7.8- 5.6 -0.8±2.1
Mid- arm circumference (cm)
<13.5 18 20.5 10.0-13.0 12.5±0.8
≥13.5 69 79.5 13.5-18.0 14.8±0.9
Total 87 100.0 10.0-18.0 14.3±1.3

59
Distribution of pneumonia among the study population
Bronchopneumonia accounted for the diagnosis in 168(84.0%) of the children while lobar
pneumonia was diagnosed in 32(16.0%) of the children recruited. Twelve (6.0%) of the
children were classified with moderate pneumonia while 188(94.0%) had severe pneumonia.
Bacteria isolates in the children with pneumonia
A positive growth was identified on blood culture in 67(33.5%) children, while the pleural
aspirate yielded a positive growth in three (20.0%) children. Staphylococcus aureus was the
most common bacterial agent present accounting for 21 (31.3%) of the 67 positive blood
culture and two (66.7%) of the three positive pleural aspirate cultures as shown in Table IX
Table IX: Bacterial agents of pneumonia in the subjects
Culture Findings Frequency Percentage
Blood culture growth
Present 67 33.5
Absent 133 66.5
Total 200 100.0
Type of organism in blood culture
Staphylococcus aureus 21 31.3
Klebsiella spp. 13 19.4
Mixed growth 9 13.4
Coagulase negative Staphylococcus 9 13.4
Escherichia coli 4 6.0
Coliforms 3 4.5
Micrococcus spp. 2 3.0
Streptococcus pyogenes 2 3.0
Non-haemolytic Streptococci 1 1.5
Actinobacter spp. 1 1.5
Pseudomonas spp. 1 1.5
Streptococcus pneumoniae 1 1.5
Total 67 100.0
Pleural aspirate growth Present 3 20.0
Absent 12 80.0
Total 15 100
Type of organism in pleural fluid Staphylococcus aureus 2 66.7
Streptococcus pyogenes 1 33.3
Total 3 100.0

60
Hypoxaemia in the study population
The mean(SD) SpO2 level of the 200 children recruited was 90.4(8.9) % with a range of 47-
100%. Using SpO2 level of less than 90% as the cut-off, the prevalence of hypoxaemia in the
children with pneumonia was 41.5% and the mean(SD) SpO2 was 82.3(8.1) % as shown in
Table X.
Table X: Hypoxaemia and SpO2 levels in children with pneumonia
Parameter Frequency Percentage Mean±SD (%)
Hypoxaemia
Yes 83 41.5 82.3±8.1
No 117 58.5 96.2±2.8
Total 200 100.0 90.4±8.9
Levels of SpO2 (%)
>95 75 37.5 98.0±1.5
93-95 24 12.0 93.8±0.9
90-92 18 9.0 91.8±0.4
86-89 34 17.0 88.1±1.0
≤85 49 24.5 78.2±8.5

61
Table XI shows that 83 (44.1%) children with severe pneumonia had hypoxaemia and this
proportion was significantly higher compared to none recorded among those with moderate
pneumonia (p=0.003). Furthermore, 62.5% of the children with lobar pneumonia had
hypoxaemia which was significantly higher than the corresponding value of 37.5% recorded
in those with bronchopneumonia (p =0.009).
Table XI: Hypoxaemia based on the severity and type of pneumonia
Pneumonia Hypoxaemia present Total χ2 p-value
Yes No
Severity
Moderate 0(0.0) 12(100.0) 12 # 0.003
Severe 83(44.1) 105(55.9) 188
Type
Bronchopneumonia 63(37.5) 105(62.5) 168 6.920 0.009
Lobar pneumonia 20(62.5) 12(37.5) 32
# = Fisher’s exact test
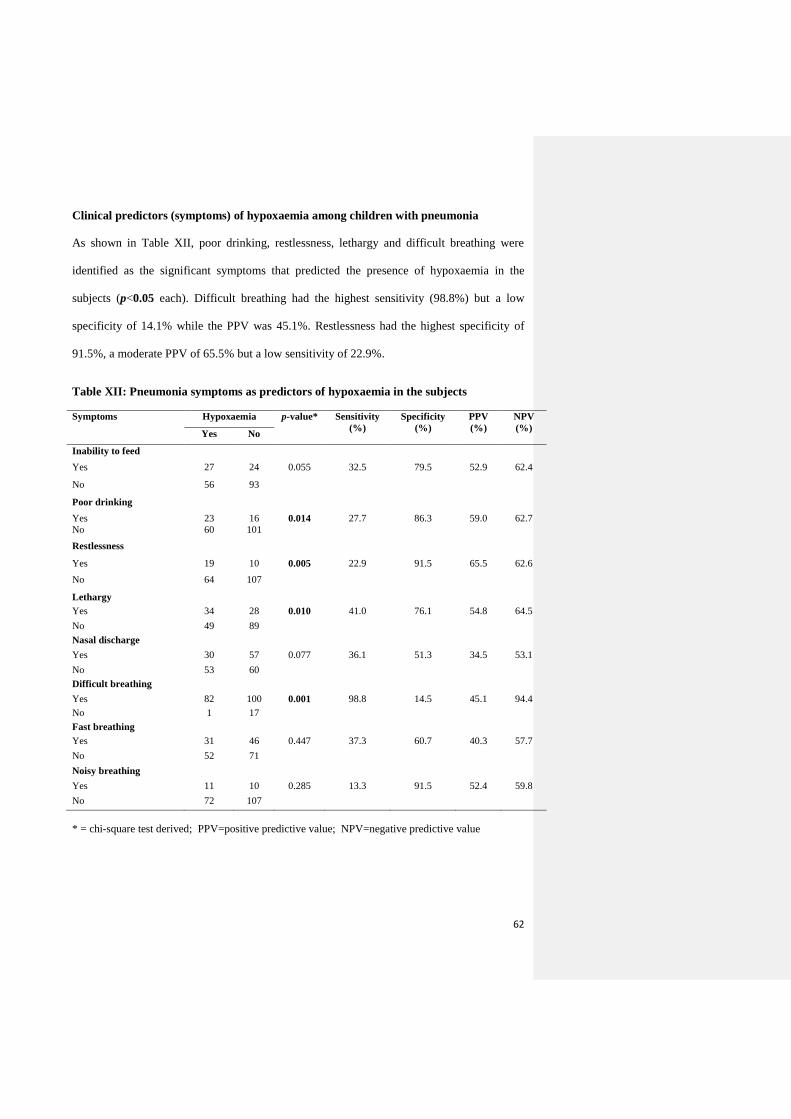
62
Clinical predictors (symptoms) of hypoxaemia among children with pneumonia
As shown in Table XII, poor drinking, restlessness, lethargy and difficult breathing were
identified as the significant symptoms that predicted the presence of hypoxaemia in the
subjects (p<0.05 each). Difficult breathing had the highest sensitivity (98.8%) but a low
specificity of 14.1% while the PPV was 45.1%. Restlessness had the highest specificity of
91.5%, a moderate PPV of 65.5% but a low sensitivity of 22.9%.
Table XII: Pneumonia symptoms as predictors of hypoxaemia in the subjects
Symptoms
Hypoxaemia p-value* Sensitivity
(%)
Specificity
(%)
PPV
(%)
NPV
(%) Yes No
Inability to feed
Yes 27 24 0.055 32.5 79.5 52.9 62.4
No 56 93
Poor drinking
Yes 23 16 0.014 27.7 86.3 59.0 62.7
No 60 101
Restlessness
Yes 19 10 0.005 22.9 91.5 65.5 62.6
No 64 107
Lethargy
Yes 34 28 0.010 41.0 76.1 54.8 64.5
No 49 89
Nasal discharge
Yes 30 57 0.077 36.1 51.3 34.5 53.1
No 53 60
Difficult breathing
Yes 82 100 0.001 98.8 14.5 45.1 94.4
No 1 17
Fast breathing
Yes 31 46 0.447 37.3 60.7 40.3 57.7
No 52 71
Noisy breathing
Yes 11 10 0.285 13.3 91.5 52.4 59.8
No 72 107
* = chi-square test derived; PPV=positive predictive value; NPV=negative predictive value
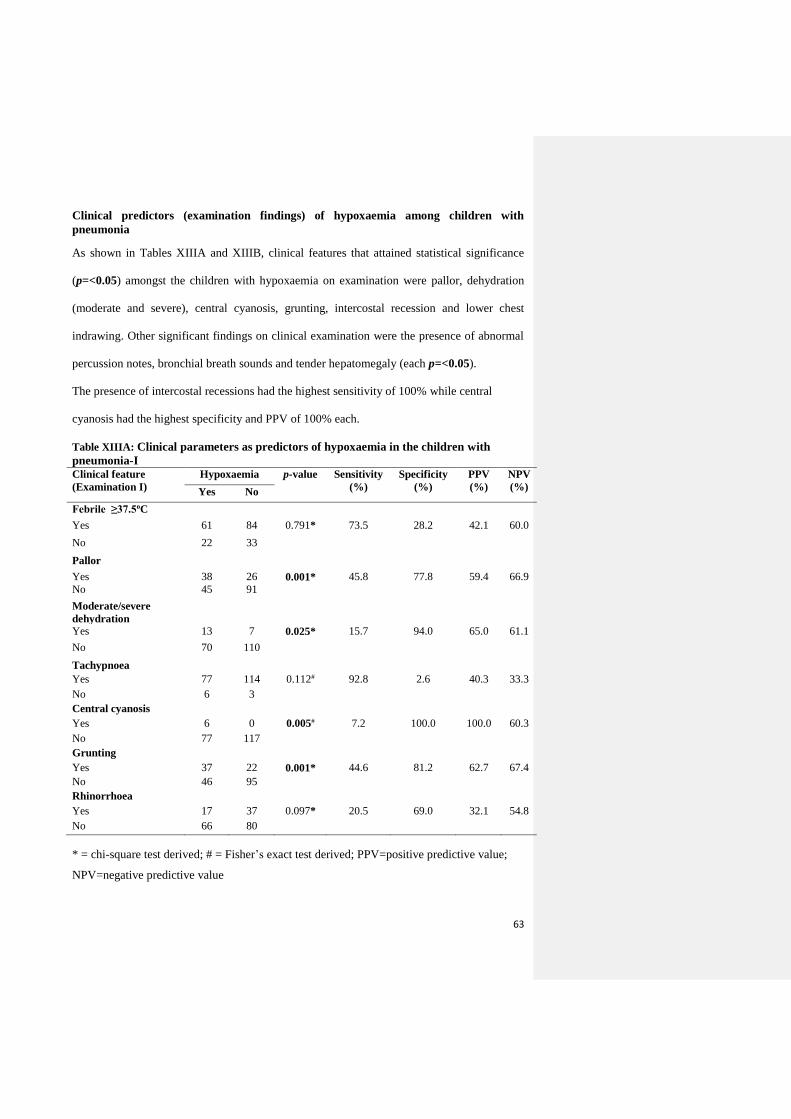
63
Clinical predictors (examination findings) of hypoxaemia among children with
pneumonia
As shown in Tables XIIIA and XIIIB, clinical features that attained statistical significance
(p=<0.05) amongst the children with hypoxaemia on examination were pallor, dehydration
(moderate and severe), central cyanosis, grunting, intercostal recession and lower chest
indrawing. Other significant findings on clinical examination were the presence of abnormal
percussion notes, bronchial breath sounds and tender hepatomegaly (each p=<0.05).
The presence of intercostal recessions had the highest sensitivity of 100% while central
cyanosis had the highest specificity and PPV of 100% each.
Table XIIIA: Clinical parameters as predictors of hypoxaemia in the children with
pneumonia-I Clinical feature
(Examination I)
Hypoxaemia p-value Sensitivity
(%)
Specificity
(%)
PPV
(%)
NPV
(%) Yes No
Febrile ≥37.5oC
Yes 61 84 0.791* 73.5 28.2 42.1 60.0
No 22 33
Pallor
Yes 38 26 0.001* 45.8 77.8 59.4 66.9
No 45 91
Moderate/severe
dehydration
Yes 13 7 0.025* 15.7 94.0 65.0 61.1
No 70 110
Tachypnoea
Yes 77 114 0.112# 92.8 2.6 40.3 33.3
No 6 3
Central cyanosis
Yes 6 0 0.005# 7.2 100.0 100.0 60.3
No 77 117
Grunting
Yes 37 22 0.001* 44.6 81.2 62.7 67.4
No 46 95
Rhinorrhoea
Yes 17 37 0.097* 20.5 69.0 32.1 54.8
No 66 80
* = chi-square test derived; # = Fisher’s exact test derived; PPV=positive predictive value;
NPV=negative predictive value

64
Table XIIIB: Clinical parameters as predictors of hypoxaemia in the children with
pneumonia-II
Clinical feature
(Examination )
Hypoxaemia p-
value
Sensitivity
(%)
Specificity
(%)
PPV
(%)
NPV
(%) Yes No
Nasal flaring
Yes 79 102 0.057* 95.8 12.8 43.6 78.9
No 4 15
Intercostal recession
Yes 83 99 0.001* 100.0 15.4 45.6 100.0
No 0 18
Lower chest indrawing
Yes 72 55 0.001* 86.7 53.3 56.7 84.9
No 11 62
Head nodding
Yes 3 1 0.195# 3.6 99.1 75.0 59.2
No 80 116
Abnormal percussion note
Yes 31 15 0.001* 37.3 87.2 67.4 66.2
No 52 102
Reduced BS intensity
Yes 77 98 0.058* 92..8 16.2 44.0 75.0
No 6 19
Crepitations
Yes 71 91 0.168* 85.5 22.2 43.8 68.4
No 12 26
Bronchial BS
Yes 14 5 0.003* 16.9 95.7 73.7 61.9
No 69 112
Tender hepatomegaly
Yes 40 21 0.001* 48.2 82.1 65.6 69.1
No 43 96
Splenomegaly
Yes 6 16 0.151* 7.2 86.3 27.3 56.7
No 77 101
Unconsciousness
Yes 6 2 0.056# 7.2 98.3 75.0 59.9
No 77 115
* = chi-square test derived; # = Fisher’s exact test derived; PPV=positive predictive value;
NPV=negative predictive value; BS= breath sounds

65
In order to exclude the effect of confounding variables in predicting hypoxaemia among the
children with pneumonia, a subsequent linear regression analysis of the relative contribution
of these variables was carried out list-wise. Table XIV shows that the clinical features that
remained significant were restlessness, lower chest wall indrawing, bronchial breath sounds
and tender hepatomegaly (p<0.05 each). The model shows that the effect of clinical features
on the presence of hypoxaemia is 44.8%. The goodness-of-fit model gave an F-value of
16.851; df=4, p =0.001.
Table XIV: Linear regression model of the clinical features and the presence of
hypoxaemia in children with pneumonia
Clinical feature Beta Co-efficient t p-value
Inability to feed 0.009 0.101 0.920
Inability to drink 0.062 0.679 0.499
Restlessness 0.181 2.165 0.033
Vomiting 0.007 0.083 0.934
Diarrhoea -0.011 -0.129 0.897
Convulsion -0.125 -1.480 0.143
Nasal discharge 0.059 0.709 0.480
Difficult breathing 0.053 0.615 0.540
Fast breathing 0.064 0.769 0.444
Noisy breathing -0.054 -0.632 0.529
Dehydration 0.092 1.047 0.298
Febrile ≥37.5 0.004 0.048 0.962
Age-related tachypnoea -0.057 -0.685 0.496
Pallor 0.113 1.137 0.259
Central cyanosis 0.102 1.194 0.236
Grunting 0.025 0.262 0.794
Snuffles -0.056 -0.675 0.502
Rhinorrhoea -0.045 -0.546 0.586
Nasal flaring -0.030 -0.350 0.727
Intercostal recession 0.012 0.132 0.895
Lower chest indrawing 0.354 4.250 0.001
Head nodding 0.002 0.020 0.984
Abnormal percussion notes 0.075 0.704 0.483
Abnormal breath sound intensity -0.024 -0.280 0.780
Crepitations 0.039 0.466 0.642
Bronchial breath sound 0.271 3.168 0.002
Hepatomegaly 0.165 1.841 0.069
Tender hepatomegaly 0.284 3.253 0.002
Splenomegaly -0.041 -0.482 0.631
Unconscious state -0.116 -1.410 0.162

66
Relationship between risk factors of pneumonia and the presence of hypoxaemia
Table XVA shows that 59(49.2%) of the children in the low social class had hypoxaemia
which was significantly higher when compared with 24(30.0%) of the children from a high
social class (p=0.007). Also, a significantly higher proportion of children with a high birth
order had hypoxaemia compared with the corresponding proportion in those with a lower
birth order, p=0.026. Furthermore, hypoxaemia was significantly higher in children of
mothers who had primary school education compared with the corresponding proportion of
children whose mothers had at least secondary school education, p=0.022 (Table XVIA).
Table XVA: Hypoxaemia and risk factors of pneumonia in the study population-Group 1
Risk factors 1 Hypoxaemia p-value*
n Yes (%) No (%)
Age group (months)
2-<12 113 52(46.0) 61(54.0) 0.140
12-<60 87 31(35.6) 56(64.4)
Gender
Male 119 51(42.9) 68(57.1) 0.637
Female 81 32(39.5) 49(60.5)
Social class of child
High(I,II) 80 24(30.0) 56(70.0) 0.007
Low(III,IV,V) 120 59(49.2) 61(50.8)
Maternal educational level
≥Secondary 106 36(34.0) 70(66.0) 0.022
≤Primary 94 47(50.0) 47(50.0)
Maternal age group (years)
<35 158 61(38.6) 97(61.4) 0.107
≥35 44 22(52.4) 20(47.6)
Family type
Monogamous 168 69(41.3) 99(58.7) 0.778
Polygamous 32 14(45.2) 18(54.8)
Number of siblings
≤3 169 68(40.2) 101(59.8) 0.397
>3 31 15(48.4) 16(51.6)
Birth order
1st - 4th child 174 67(38.5) 107(61.5) 0.026
≥ 5th child 26 16(61.5) 10(38.5)
Exclusive breastfeeding
Yes 160 66(41.3) 94(57.9) 0.886
No 40 17(42.5) 23(57.5)
*= chi-square test derived
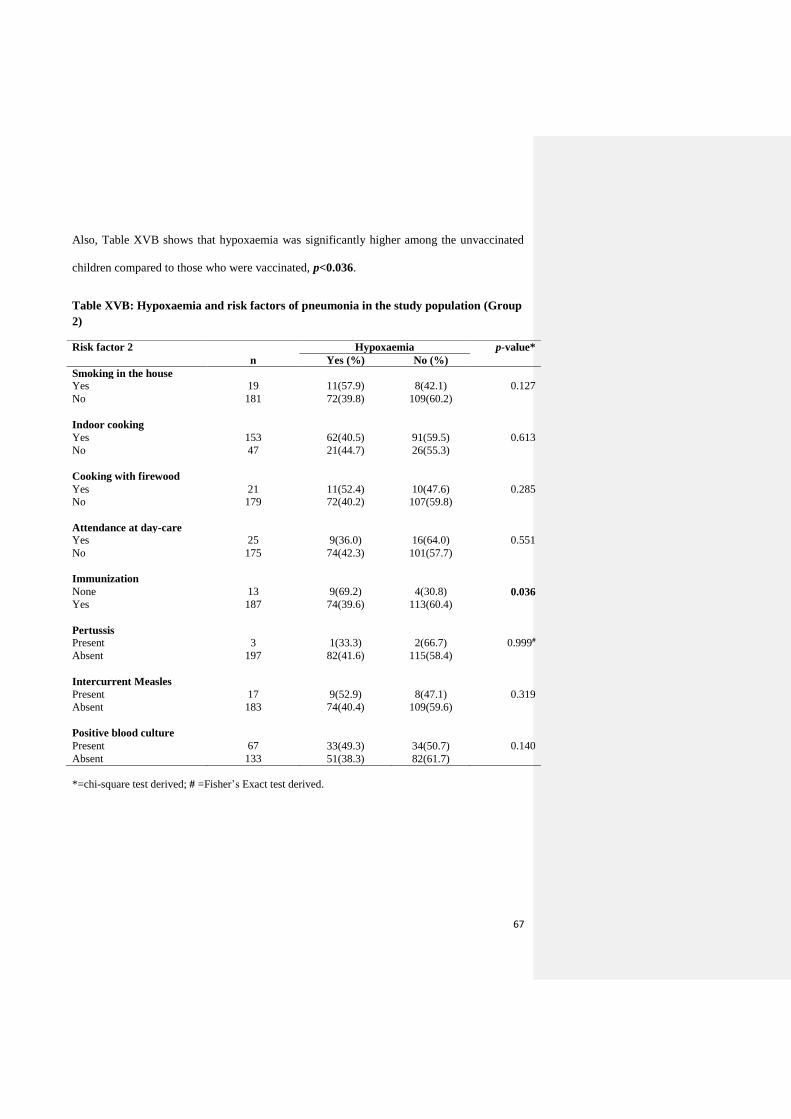
67
Also, Table XVB shows that hypoxaemia was significantly higher among the unvaccinated
children compared to those who were vaccinated, p<0.036.
Table XVB: Hypoxaemia and risk factors of pneumonia in the study population (Group
2)
Risk factor 2 Hypoxaemia p-value*
n Yes (%) No (%)
Smoking in the house
Yes 19 11(57.9) 8(42.1) 0.127
No 181 72(39.8) 109(60.2)
Indoor cooking
Yes 153 62(40.5) 91(59.5) 0.613
No 47 21(44.7) 26(55.3)
Cooking with firewood
Yes 21 11(52.4) 10(47.6) 0.285
No 179 72(40.2) 107(59.8)
Attendance at day-care
Yes 25 9(36.0) 16(64.0) 0.551
No 175 74(42.3) 101(57.7)
Immunization
None 13 9(69.2) 4(30.8) 0.036
Yes 187 74(39.6) 113(60.4)
Pertussis
Present 3 1(33.3) 2(66.7) 0.999#
Absent 197 82(41.6) 115(58.4)
Intercurrent Measles
Present 17 9(52.9) 8(47.1) 0.319
Absent 183 74(40.4) 109(59.6)
Positive blood culture
Present 67 33(49.3) 34(50.7) 0.140
Absent 133 51(38.3) 82(61.7)
*=chi-square test derived; # =Fisher’s Exact test derived.

68
Correlation of the risk factors of pneumonia and the presence of hypoxaemia
As shown in Table XVI, the social class of the child was identified to have a negative
correlation with the presence of hpoxaemia. Also, factors such as the maternal age, maternal
literacy level, the birth order of the child and absence of immunization had a negative
correlation with the presence of hypoxaemia.
Table XVI: Correlation of the risk factors of pneumonia with the presence of
hypoxaemia
Risk Factor Correlation (r) p-value
Age (months) 0.087 0.221
Social class -0.191 0.007
Maternal age (years) -0.151 0.032
Maternal literacy -0.162 0.022
Family type 0.013 0.853
Birth order -0.154 0.030
Sibling group 0.064 0.365
Birth interval -0.022 0.753
Smoking in the house 0.108 0.129
Attendance at daycare -0.042 0.553
Immunization status -0.148 0.036
Pertussis -0.020 0.774
Measles 0.071 0.319
Exclusive breastfeeding -0.010 0.887
Duration of exclusive breastfeeding -0.063 0.378
Indoor cooking -0.036 0.615
Cooking with firewood 0.076 0.287
WAP 0.095 0.182
HAP 0.063 0.378
WHP 0.013 0.852
WAZ 0.107 0.130
WHZ -0.012 0.865
HAZ 0.016 0.827
WAP (weight for age percentage), HAP (height for age percentage), WHP (weight for height
percentage), WHZ (weight for height –z-score), WAZ (weight for age-z-score) and HAZ
(height for age-z-score)
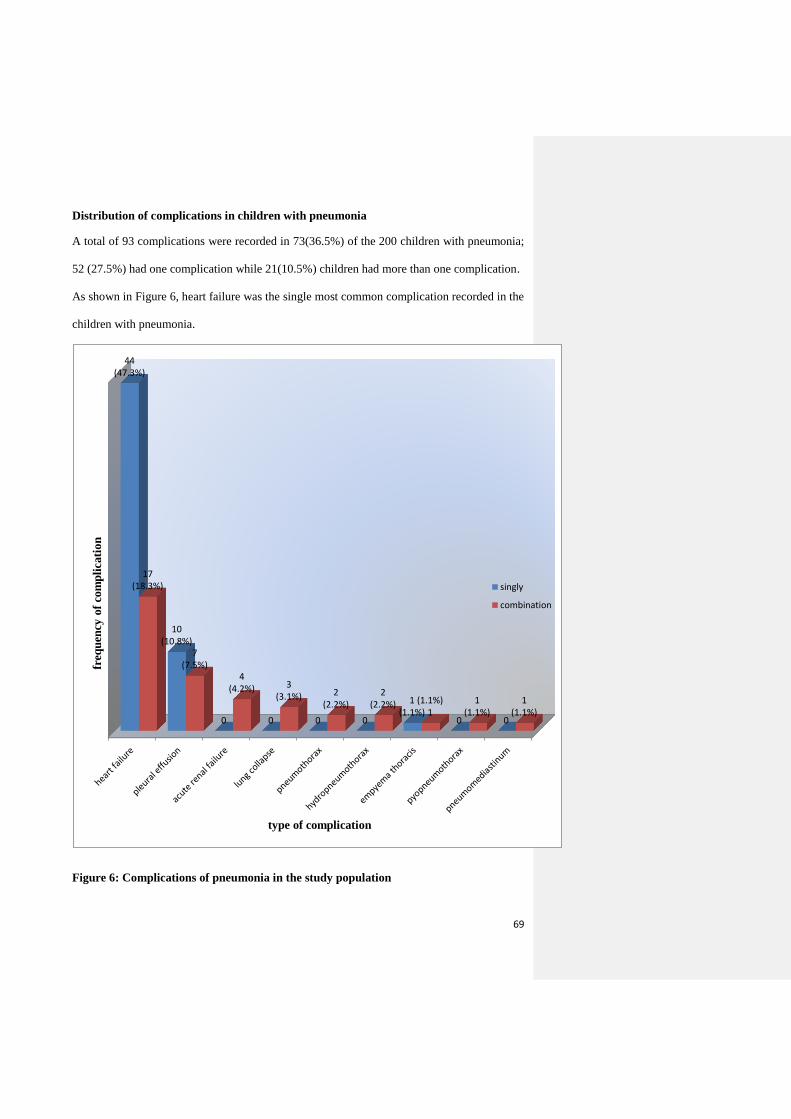
69
Distribution of complications in children with pneumonia
A total of 93 complications were recorded in 73(36.5%) of the 200 children with pneumonia;
52 (27.5%) had one complication while 21(10.5%) children had more than one complication.
As shown in Figure 6, heart failure was the single most common complication recorded in the
children with pneumonia.
Figure 6: Complications of pneumonia in the study population
44(47.3%)
10(10.8%)
0 0 0 0
1(1.1%)
0 0
17(18.3%)
7(7.5%)
4(4.2%) 3
(3.1%) 2(2.2%)
2(2.2%) (1.1%)
11
(1.1%)1
(1.1%)
freq
uen
cy o
f co
mp
licati
on
type of complication
singly
combination

70
Hypoxaemia and complications in children with pneumonia
Table XVII shows that a significantly higher proportion of the subjects with pneumonia-
associated complications had hypoxaemia compared with the corresponding proportion in
those without hypoxaemia, p=0.001.
Table XVII shows that SpO2 levels of ≤ 85% was associated with a significantly higher
proportion of children with complications when compared with those with SpO2 of >95%.
Table XVII: Pneumonia-associated complications and hypoxaemia in the subjects
Parameter Complication χ2 p-value
Present Absent
Hypoxaemia
Present 48(57.8) 35(42.2) 27.854 0.001
Absent 25(21.4) 92(78.6)
Levels of SpO2 (%)
>95 10(13.3) 65(86.7) 35.303 0.001
93-95 7(29.2) 17(70.8)
90-92 8(44.4) 10(55.6)
86-89 18(52.9) 16(47.1)
≤85 30 (61.8) 19(38.2)
Severity of pneumonia
Moderate 0(0.0) 12(100.0) # 0.007
Severe 73(38.8) 115(61.2)
Type of pneumonia
Bronchopneumonia 51(29.8) 117(70.2) 17.734 0.001
Lobar pneumonia 22(68.8) 10(31.2)
Admission outcome
Survived 56(30.6) 127(69.4) 32.323 0.001
Died 17(100.0) 0(0.0)
# =Fisher’s Exact test derived

71
Treatment outcome in the children with pneumonia
Seventeen of the children with pneumonia died giving a case fatality of 8.5%. Ten (58.8%) of
those who died were aged less than 12months, while the remaining seven (41.2%) were aged
between 12 and 60months. Furthermore, six (18.7%) of the 32 children with lobar pneumonia
died, while 11(6.5%) of the 168 children with bronchopneumonia had a fatal outcome.
All the children who died had hypoxaemia while no fatality was recorded in the children
without hypoxaemia, and this difference in the treatment outcome was significant (p=0.001).
(Table XVIII).
Table XVIII: Hypoxaemia and treatment outcome in the children with pneumonia
Parameter Outcome of treatment p-value*
Survived
n (%)
Died
n (%)
Hypoxaemia
Present 66(79.5) 17(20.5) 0.001
Absent 117(100.0) 0(0.0)
Levels of SpO2 (%)
>95 75(100.0) 0(0.0)
93-95 24(100.0) 0(0.0)
90-92 18(100.0) 0(0.0)
86-89 28(81.8) 6(18.2) 0.673a
≤85 38(78.0) 11(22.0)
*= chi-square test derived
a: compares outcome among those with levels of SpO2 ‘86-89%’ and ‘≤85’

72
The mean SpO2 level in children with hypoxaemia was significantly lower than the recorded
value in those without hypoxaemia, p=0.001. Furthermore, the mean SpO2 level of 78.3% in
the fatal cases was significantly lower than the corresponding value of 91.5% recorded in the
survivors, p=0.001. The relationship between the recorded pulse oximeter values and some
other parameters are shown in Table XIX.
Table XIX: The pulse oximeter readings and outcome in children with pneumonia
Parameter n(%) Pulse oximeter reading (%) t p-value
Range Mean±SD
Hypoxaemia
Present 83(41.5) 47-89 82.3±8.1 -17.118 0.001
Absent 117(58.5) 91-100 96.2±2.8
Levels of SpO2 (%)
>95 75(37.5) 96-100 98.0±1.5a 161.403* 0.001
93-95 24(12.0) 93-95 93.8±0.9b
90-92 18(9.0) 91-92 91.8±0.4c
86-89 34(17.0) 86-89 88.1±1.0c
≤85 49(24.5) 47-85 78.2±8.5d
Admission outcome
Survived 183(91.5) 55-100 91.5±7.8 6.437 0.001
Died 17(8.5) 47-89 78.3±10.9
Type of pneumonia
Bronchopneumonia 168(84.0) 47-100 91.0±9.0 2.029 0.044
Lobar pneumonia 32(16.0) 64-99 87.5±7.9
Severity of pneumonia
Moderate 12(6.0) 94-100 97.1±2.2 2.729 0.007
Severe 188(94.0) 47-100 90.0±9.0
Complication
Present 73(36.5) 47-100 85.6±10.0 -6.392 0.001
Absent 127(63.5) 55-100 93.2±6.8
Number of complication
None 127(63.5) 55-100 93.2±6.8a 21.615* 0.001
One 52(26.0) 60-100 86.4±9.1b
>One 21(10.5) 47-99 83.4±12.0b
*= F-value (derived from ANOVA) a, b,c, d: Duncan multiple range test shows that means with the same letter are not statistically
different at p<0.05.

73
The relationship between duration of hospitalization and the presence of hypoxaemia in
children with pneumonia
The mean (SD) duration of hospital admission among the subjects with pneumonia was 5.7
(4.7) days. Table XX shows that the mean (SD) duration of hospital stay of 6.9(6.4) days in
subjects with hypoxaemia was significantly longer than the corresponding value of 4.9(2.7)
days recorded in those without hypoxaemia (p=0.002). Also, the mean duration of
hospitalization increased as the SpO2 levels reduced, and this observation was significant at
p=0.002. Furthermore, the mean duration of hospital stay in children with lobar pneumonia
was significantly longer than the corresponding value recorded in those with
bronchopneumonia, p=0.001.(Table XX)
Subjects with pneumonia-associated complications had a significantly longer mean duration
of hospitalization compared with the corresponding value in subjects without complications,
p=0.001. Also, Table XX shows that the mean duration of hospitalization was significantly
longer in children with two or more pneumonia-associated complications compared with the
corresponding value in those who had either one pneumonia complication or none (p=0.001).

74
Table XX: The duration of hospitalization and hypoxaemia in the children with
pneumonia
Parameter n(%) Duration of hospitalization (days) t p-value
Range Mean±SD
Hypoxaemia
Present 83(41.5) 0.2-33 6.9±6.4 3.131 0.002
Absent 117(58.5) 1-19 4.9±2.7
Levels of SpO2 (%)
>95 75(37.5) 1-10 4.2±2.0a 4.296* 0.002
93-95 24(12.0) 1-13 5.4±2.7a
90-92 18(9.0) 3-19 6.7±4.2ab
86-89 34(17.0) 0.3-32 7.9±7.0b
≤85 49(24.5) 0.2-33 6.3±6.0ab
Admission outcome
Survived 183(91.5) 1-33 6.1±4.7 3.560 0.001
Died 17(8.5) 0-12 1.9±3.0
Type of pneumonia
Bronchopneumonia 168(84.0) 0.2-33 5.1±3.8 -1.812 0.001
Lobar pneumonia 32(16.0) 0.3-32 9.0±7.2
Severity of pneumonia
Moderate 12(6.0) 2-9 3.3±2.1 -1.812 0.072
Severe 188(94.0) 0.3-33 5.9±4.8
Complication
Present 73(36.5) 0.2-33 7.4±6.7 3.859 0.001
Absent 127(63.5) 1-22 4.8±2.7
Number of complication
None 127(63.5) 1-22 4.8±2.7a 13.316* 0.001
One 52(26.0) 0-32 6.3±5.5a
>One 21(10.5) 0-33 10.1±8.4b
*= F-value (derived from ANOVA) a, b: Duncan multiple range test shows that means with the same letter are not statistically
different at p<0.05.
75
The relationship between the duration of oxygen therapy and presence of hypoxaemia
in the study population
The mean (SD) duration of supplemental oxygen therapy among all the subjects recruited
was 26.3(34.5) hours. Table XXI shows that the mean (SD) duration of supplemental oxygen
administration to the subjects with hypoxaemia was 45.1(41.9) hours which was significantly
longer than the corresponding value of 12.9(19.2) hours recorded in those without
hypoxaemia (p=0.001).
The mean duration of oxygen therapy in children with pneumonia increased significantly as
the SpO2 level decreased, p=0.001 (Table XXI). Furthermore, children with severe
pneumonia had supplemental oxygen for a significantly longer mean (SD) duration compared
with the corresponding value in those with moderate pneumonia, p=0.001.
As shown in Table XXI, the mean (SD) duration of the children with lobar pneumonia on
supplemental oxygen was significantly longer at 52.1(55.6) hours compared with the mean
(SD) duration of 21.3(26.3) hours recorded in those with bronchopneumonia, p=0.001. Also,
the mean duration of supplemental oxygen administration to the subjects increased with an
increase in the number of complications, p=0.001 (Table XXI).

76
Table XXI: The duration on oxygen therapy and hypoxaemia in the study population
Parameter n (%) Duration on oxygen (hours) t p-value
Range Mean ±SD
Hypoxaemia
Present 83(41.5) 5-240 45.1±41.9 7.329 0.001
Absent 117(58.5) 0-96 12.9±19.2
Levels of SpO2 (%)
>95 75(37.5) 0-48 5.8±11.9a 17.522* 0.001
93-95 24(12.0) 0-72 20.8±20.6 b
90-92 18(9.0) 0-96 31.9±24.8b,c
86-89 34(17.0) 6-240 47.2±47.8c
≤85 49(24.5) 5-194 43.7±37.9c
Severity of pneumonia
Moderate 12(6.0) 0-72 2.8±9.2 -2.454 0.015
Severe 188(94.0) 0-240 27.8±35.0
Diagnosis
Bronchopneumonia 168(84.0) 0-178 21.3±26.3 -4.869 0.001
Lobar pneumonia 32(16.0) 0-240 52.1±55.6
Admission outcome
Survived 183(91.5) 0-240 26.0±34.4 -0.408 0.684
Died 17(8.5) 5-137 29.5±37.0
Complication
Present 73(36.5) 0-194 41.8±39.2 5.122 0.001
Absent 127(63.5) 0-240 17.3±27.9
Number of complications
None 127(63.5) 0-240 17.3±27.9a 18.000* 0.001
One 52(26.0) 0-98 34.8±27.7b
>One 21(10.5) 0-194 59.2±55.7c
*= F-value (derived from ANOVA) a, b, c: Duncan multiple range test shows that the means with the same letter are not
statistically different at p<0.05.

77
DISCUSSION
The prevalence of hypoxaemia among hospitalized children with pneumonia was estimated to
be 41.5% in the current study which is in accord with the range of 31.0-43.0% found in a
systematic review of hypoxaemia among children with clinical pneumonia by Lozano et al.82
The present value is however lower than the prevalence of 48.0%, 58.9%, and 63.0%
reported from Kenya and the Peruvian Andes.8,83,84 These earlier studies with higher
prevalence values were carried out at high altitudes compared to the location of the present
study which is at near sea level of 303metres.90 Hypoxemia may be more frequent and more
severe in children who live at high altitude because of the reduced pressure of the
atmospheric oxygen. Physiological responses to high altitude hypoxemia comprise shunting
of pulmonary blood flow to the lung apices, an increase in the cardiac output, increase in the
depth and rate of ventilation as well as the pulmonary arterial pressure, exaggerated
vasoconstriction at the lung bases, and a resultant ventilation perfusion mismatch in the
supine position. All of these may further worsen the severity and indeed prolong the duration
of hypoxemia recorded at higher altitude locations.13
Equally noteworthy in the current study is the high prevalence value of 41.5% recorded
among children with severe pneumonia. This value is considerably higher when compared
with the corresponding value of 13.3% (inter-quartile range 7.5-18.5%) reported earlier in
children hospitalized with “severe” and “very severe pneumonia” in a recent systematic
review.7 However, the severity assessment tool of the studies in this recent systematic review
was the WHO clinical classification as against the BTS guidelines (for assessing disease
severity) used in the present study. In areas where facilities for investigations are limited and
there is a paucity of clinicians, health care workers (who may not be doctors) are the first
contact of the patient. Furthermore, these health care workers are trained to identify children
with pneumonia using the WHO criteria for ALRI which does not differentiate between the

78
various ALRI syndromes. There is therefore the possibility of ‘‘diagnostic contaminations’’
by these health personnel who may misdiagnose some AURI syndrome as pneumonia with a
resultant over-diagnosis of the disease. On the other hand, it is also possible to underestimate
the prevalence of severe pneumonia in the poorly organized health services of many
developing countries.46 The implication of this inadequacy in health service delivery is that
many children with severe CAP are not admitted to the hospital, and are therefore more likely
to die at home.46
In the current study, children with lobar pneumonia were found to have a higher prevalence
of hypoxaemia compared to those with bronchopneumonia. However, a valid comparison of
the present data is precluded by the paucity of published studies comparing hypoxaemia in
children with lobar and bronchopneumonia. Lobar pneumonia is associated with more
extensive consolidation of the lungs and hence, a more severe compromise of alveolar
gaseous exchange compared to bronchopneumonia. In lobar pneumonia, there is a reduction
in lung compliance, with extensive loss of functioning lung tissue. The latter may be
attributable to the involvement of one of either a segment or the entire lobe in the
consolidation process and hence, the resultant alveolar hypoventilation and hypoxaemia.5
Also, the resultant hypoxaemia may be attributed to the extensive consolidation which results
in under-ventilated areas of the lungs that are reasonably well perfused with a resultant
ventilation-perfusion mismatch. This is further supported by the fact that bronchial breath
sounds was an independent predictor of hypoxaemia identified in the current study; bronchial
breath sounds are normally heard over an area of lung consolidation which is present in lobar
pneumonia.
Pneumonia remains a serious disease in children and hypoxaemia is reportedly the best
indicator of either or both of a severe and potentially fatal pneumonia.8 Prompt recognition of
hypoxaemia and use of supplemental oxygen therapy improves the outcome in severe
79
pneumonia.89 The current study had examined the association between some clinical features
of children with pneumonia and the SpO2 levels with the aim of identifying their usefulness
as early predictors of hypoxaemia. Restlessness, inability to drink, lethargy, difficult
breathing, cyanosis, pallor, grunting, intercostal recession, lower chest wall in-drawing,
bronchial breath sounds and tender hepatomegaly were significantly associated with
hypoxaemia in the present study. With the exception of pallor, previous studies had also
identified these clinical findings as significant predictors of hypoxaemia.11,13,14,16,84,95
However, in the present study some of these clinical features with high sensitivity had poor
specificity and vice versa. This observation is in accord with the findings in earlier
studies.11,13,14,16,84,95 The wide variability in the sensitivity and specificity of the symptoms
and signs reported in predicting the presence of hypoxaemia could be due to differences in
definitions of hypoxaemia used, even among studies conducted at similar altitudes. While
Onyango et al 8 defined hypoxaemia as SpO2< 91%, Dyke et al85 defined same as SpO2<
86% while a SpO2< 88% was used by Duke et al.86
The best clinical predictors for detecting hypoxaemia in the current study are the presence of
restlessness, lower chest wall indrawing, bronchial breath sounds and tender hepatomegaly.
Restlessness, as a manifestation of impaired mental state, has been shown to have a very
close correlation with oxygen saturation, and the degree of restlessness tends to increase with
increasing hypoxaemia.11 Thus, its presence should arouse the suspicion of both the clinician
and the health worker of the presence of hypoxaemia. While restlessness was a significant
finding in the present study, which is similar to the findings in an earlier report from the
Gambia,9 it was not associated with hypoxaemia in another study.10
Previous studies that examined the relationship between chest indrawing and hypoxemia had
conflicting results.8,9,14,16,84 In one of these studies which was carried out at high altitude,8
chest indrawing was reportedly highly sensitive (88%) but poorly specific. This observation
80
is in accord with that of the present study. On the other hand, other workers had reported
variable sensitivity (35.0-78.5%) but a high specificity (60.0-94.0%) respectively.9,14,16,84
However, chest indrawing was the best independent predictor of hypoxaemia in the present
study, and this appears to be consistent with the findings from some earlier studies.8,16 Lower
chest indrawing is an evidence of severe respiratory distress with increased respiratory
muscle effort and increased work of breathing in an attempt to breathe against a poorly
compliant lung parenchyma. The clinical implication of the current finding is that the absence
of this sign is only likely to miss a small percentage of patients with pneumonia who are
hypoxemic.
Several studies have found the association of auscultatory signs such as crepitations or
rhonchi to be associated with hypoxaemia.10,83,85 On the other hand, others did not find a
consistent association between the presence of these auscultatory signs and hypoxaemia.9,84
The finding in the present study of a significant association between bronchial breath sound
and hypoxaemia with a high specificity and poor sensitivity is noteworthy. However, a valid
comparison with previous work is precluded by the paucity of comparable reports on the
study. The fact that BBS is associated with hypoxaemia may be explained by the fact that
BBS is usually heard over consolidated area(s) of the lung. This pathologic change is more
likely to be accompanied by ventilation-perfusion mismatch, alveolar hypoventilation and a
resultant severe hypoxaemia.
The current study found that tender hepatomegaly had a fair sensitivity but a moderate
specificity, PPV and NPV. The presence of tender hepatomegaly, tachypnoea and tachycardia
in a child with pneumonia remains a valid clinical indicator of heart failure.24 The
predominance of heart failure as a complication of childhood pneumonia in the current study
is consistent with the findings of earlier Nigerian hospital-based reports.4,24,74 The high
prevalence of heart failure in the current series is not surprising, especially in view of the

81
significant inflammation-driven reduction in the lung compliance associated with
pneumonia.24 Consequently, heart failure may occur due to the resultant right ventricular
strain.24 A prompt identification and treatment of co-morbid heart failure remains a crucial
aspect of the management of childhood pneumonia. In this regard, identification of heart
failure as a predictor of hypoxaemia should hardly pose a problem for the clinician in view of
the ease of identifying the clinical parameter of liver tenderness.
Oxygen administration remains the key therapeutic measure in children with hyoxaemia. A
judicious deployment of this important “medication” by administering the agent to patients
who need it remains a desirable cost-saving measure in health care service delivery. Against
this background, the implication of the low sensitivity of various signs of hypoxemia in a
clinical setting is that some children with severe pneumonia who need oxygen will not
receive it if the administration is based on clinical evaluation alone.96 However, therapy
based on clinical signs with high sensitivity but at the same time low sensitivity is likely to
encourage the hardly cost-effective and inappropriate administration of oxygen. This
resource (oxygen) is often expensive and in limited supply in low income countries.96
Clearly, it is this logic that underscores the value of pulse oximetry as a cost-effective
intervention in small and moderate sized hospitals in developing countries.80,97 As shown by
the present study, the use of the pulse oximeter (as against the more hazardous and more
expensive measurement of arterial blood gases) has proven to be an invaluable and safe bed
side investigative tool for detecting pneumonia-related hypoxaemia.
Various risk factors which were earlier identified with the occurrence and severity of
pneumonia were explored as possible clinical correlates of hypoxaemia in the current study.
In this regard, hypoxaemia was found to be associated with a low socio-economic
background of the child, high birth order of the child, low maternal age, poor maternal
literacy level, as well as a poor immunization status.

82
As is the case with most of the risk factors explored, the dearth of earlier published data on
the association between risk factors of pneumonia and the presence of hypoxaemia would
obviously preclude a robust comparison with previous data. However the current association
of low socio-economic background with hypoxaemia is putatively attributable to parental
health-seeking behaviour; the more affluent, literate mothers are more likely to afford and
seek health care early and hence, their chidren’s illness more likely to be less severe, and the
risk of hypoxaemia lower.98
Similarly, the appropriate and timely health care-seeking behaviour, as well as a clear
understanding of the available preventive strategies are less likely to be appreciated by the
younger, illiterate mothers.99 In such children with a poor parental socio-economic
background, the (expected) inadequate family income would hardly support a prompt and
appropriate health seeking behaviour in the event of the occurrence of pneumonia.98 One of
the possible consequences of such belated presentations (at the relevant health care facilities)
is the unfettered progression of the pneumonia with increasing risk of hypoxemia. Also,
children from higher socioeconomic class are more likely to be better nourished and thus
protected from severe pneumonia and its severe complications. However, the current study
did not however find any association between a poor nutritional status (as a risk factor of
pneumonia) and the presence of hypoxaemia.
The finding of a higher proportion of hypoxaemia in children of high birth order compared to
the corresponding observation in those with a low birth order in the current study is not
surprising. Birth order has been reported to be a risk factor for pneumonia.2 A high birth
order suggests that there is an increased likelihood of a higher number of siblings/other
children in the household sharing the meager household facilities and food, and are therefore
exposed to a higher risk of overcrowding and malnutrition. This may be further aggravated
83
by short birth intervals between the siblings in the household such that the maternal care is
inadequate. The predisposition of the child of high birth order to severe pneumonia with
resultant hypoxaemia may be a consequence of some or all of these aforementioned adverse
household variables.
Measles and pertussis are vaccine preventable co-morbidities which had earlier been
identified with pneumonia-related deaths.25 The present study found that a poor immunization
status (as a co-morbidity of pneumonia) was associated with a higher risk of hypoxaemia. In
addition, there was a negative correlation between lack of immunization and the presence of
hypoxaemia such that the children who were unvaccinated were at increased risk of having
hypoxaemia. Appropriate immunization in childhood has been shown to confer protection
against pathogens that could cause severe pneumonia.2,62, 100 Therefore, unvaccinated children
are more likely to have no protection against these pathogens, develop severe pneumonia and
thus an increased risk of hypoxaemia.
The relevant correlation values of all the aforementioned risk factors of pneumonia with
respect to hypoxaemia is however weak, and there is therefore a need for a larger series. Also
noteworthy for its absence in the present study is the earlier reported association between age
of the children with pneumonia and the occurrence of hypoxaemia. Earlier reports from
India13 16had suggested that hypoxaemia was significantly more common in infants compared
with older children.
Hypoxaemia was present in a higher percentage of the children with bacteraemia compared
with the corresponding value in those without bacteraemia. While this finding was not
significant in the present study, it is apparently in accord with those of Nantanda et al in
Uganda.81 The most common bacterial pathogen of pneumonia in the current study was
Staphylococcus aureus, a finding that is similar to the earlier findings from Ibadan,45 Ilorin,4
Benin,77and Uganda.81 Although Streptococcus pneumoniae and Haemophilus influenzae type
84
b are reportedly the most common bacterial pathogens worldwide,2 this was not the case in
the current study. The absence of these two key organisms of pneumonia, Streptococcus
pneumoniae and Haemophilus influenzae, from the spectrum of the isolates may be a
reflection of the limited microbiologic support for the isolation of these organisms at the
current study site. However, the present study was not designed to identify a possible
association of the individual bacterial pathogens with the presence of hypoxaemia in the
children studied.
The case fatality among the children with pneumonia in the current series was 8.5%. While
this value is slightly higher than the 7.8% recorded by Johnson et al in Ibadan,24 a slightly
higher case fatality value of 10.0% had been identified in an earlier report (some 25years
earlier)4 from Ilorin where the present study was carried out. The corresponding values from
other countries included the 15.0% reported by Nathoo et al 100 in Zimbabwe and 10.5% by
Seghal et al54 in India. None of these values was lower than the recorded value in the present
study. The small, but hardly significant decrease in pneumonia-related mortality over the
years in the present study may be possibly ascribed to a more prompt home recognition of
disease severity, early diagnosis, better defined criteria for referrals, as well as the
institutional adoption of more effective management strategies in the last few years.46,54
The fact that the presence of hypoxaemia was associated with a significantly higher
pneumonia-related mortality is in accord with the findings in earlier reports.8,10,12,81 Majority
of the children might have had pre-admission antimicrobial therapy which could have been
either inappropriate or not completed due to cost considerations. The consequence of this is a
severe disease or a fatal outcome possibly due to drug-resistant pathogens. Also, the
association of a higher fatal disease outcome with hypoxaemia may be ascribed to a
prolonged pre-admission duration of this complication due to parental delay in seeking
hospital consultation. While there is a paucity of published studies documenting the
85
relationship between the presence of pneumonia-associated complications and hypoxaemia,
the current study was able to show that hypoxaemia was more common in children with
pneumonia-associated complications compared to those without any complications. Indeed,
the lower the SpO2 levels, the more the number of complications and the higher the mortality.
Similarly, the presence of hypoxaemia had earlier been associated with severe pneumonia.46
Hence, it can be safely deduced that the presence of pneumonia-related complications is a
marker of disease severity.88 Clearly, a timely recognition of pneumonia complications, as
well as prompt institution of specific therapy remain indispensable components of a
favourable treatment outcome of the disease.
In the present study, the duration of hospital stay was found to be significantly longer for
hypoxaemic children compared with the corresponding value in non-hypoxaemic children.
This observation is similar to the reported findings in some earlier studies.8,10 Indeed, the
mean duration of hospitalization increased as the levels of hypoxaemia worsened with
decreasing SpO2 levels. This apparent inverse relation between the SpO2 levels and the mean
duration of hospitalization was significant. A possible explanation for this relationship
appears to be the longer time required by hypoxaemic children with pneumonia to recover
from the underlying pathophysiological aberrations of alveolar hypoventilation and
ventilation-perfusion mismatch.
Children with lobar pneumonia (LP) had a longer mean duration of hospital stay which was
approximately twice that of the corresponding value in those with bronchopneumonia (BP).
This current finding is similar to the observation made in an earlier report by Johnson et al.74
The more extensive area of consolidation in lobar pneumonia may be associated with a more
severe ventilation-perfusion mismatch and alveolar hypoventilation and hence, a more severe
level of hypoxaemia. Also, this finding could be related to the fact that BP may be attributed
to a greater likelihood of a viral aetiology, as against a bacterial aetiology in LP.2,46,74

86
Complete and rapid resolution is the rule in most cases of viral pneumonia as against the
expected slower resolution in the extensive lobar consolidation with LP and bacterial
aetiology.2,46,74
In the current study, the presence of pneumonia-related complications was associated with a
longer mean duration of stay (approximately twice) compared to those without complications.
A possible explanation include the fact that the children with pneumonia-related
complications would need a longer time to recover from both the pneumonia and the
complication(s) as against the expected faster resolution in children with uncomplicated
pneumonia. Hence, the current findings with respect to pneumonia-related complications
constitute compelling grounds for a timely recognition and treatment of complications at
presentation.
Supplemental oxygen is given to children with pneumonia to relieve hypoxaemia. In the
present study, the mean duration of treatment with supplemental oxygen administration
increased with decreasing SpO2 and severity of pneumonia. Furthermore, children with
pneumonia-related complications had a longer mean duration of treatment with supplemental
oxygen (2.5 times) when compared those with uncomplicated disease. In addition, children
with multiple pneumonia-related complications had significantly longer duration on
supplemental oxygen. In most centres in developing countries including Nigeria, hospital-
based facilities for continuous monitoring of SpO2 levels are not available for all patients that
require oxygen therapy. Hence, the inevitable need for rationing this therapy frequently
informs the discontinuation of the oxygen administration with the earliest evidence of clinical
resolution of respiratory distress. Also, this study has shown that without monitoring the
SpO2 levels, there is a small but definite tendency to initiate oxygen therapy in children with
SpO2 levels that are within normal range. Clearly, this constitutes a potential source of

87
oxygen wastage, with the subsequent non-availability for patients that require this life saving
treatment measure. This data therefore underscores the need to make pulse oximeters
available in our health care facilities, with the capacity and wherewithal for administering
oxygen therapy.
In conclusion, the identified prevalence of pneumonia-associated hypoxaemia is high in the
present study population. It has also been identified that the best independent clinical
correlates of hypoxaemia are restlessness, the presence of lower chest wall indrawing,
bronchial breath sounds and tender hepatomegaly. For clinicians working at the higher tiers
of health care delivery, the presence of chest wall indrawing, lobar consolidation and clinical
evidence of heart failure should arouse a high index of suspicion for hypoxaemia in the
patient. The identification of these clinical parameters in a child with pneumonia should also
dictate the need for supplemental oxygen in an emergency room setting even when the SpO2
cannot be monitored. On the other hand, for the health care workers at the primary health care
facility, lower chest wall indrawing remains perhaps the single most reliable clinical predictor
of hypoxaemia that should suggest a need for immediate referral to centres where oxygen
therapy is available.
88
CONCLUSIONS
The following conclusions can be drawn from the present study:
1. The prevalence of hypoxaemia in the children with pneumonia was 41.5%
2. The best independent clinical predictors of hypoxaemia identified were restlessness,
lower chest wall indrawing, bronchial breath sounds and tender hepatomegaly.
3. Low socio-economic class of the child, high birth order of the child, low maternal age
and maternal literacy level, as well as poor immunization status were risk factors of
pneumonia significantly associated with the presence of hypoxaemia.
4. The presence of pneumonia-related complications, especially heart failure was
associated with hypoxaemia.
5. Mortality and the pneumonia-associated complications were higher in hypoxaemic
children compared with their non-hypoxaemic peers.
6. The mean SpO2 level was lower amongst the fatal cases compared with the value in
the survivors.
7. Duration on supplemental oxygen therapy increased with increasing level of
hypoxaemia and there is an apparent need for concomitant pulse oximetry monitoring
in patients on oxygen therapy to reduce wastage.
89
RECOMMENDATIONS
The following recommendations have been made based on the study:
1. Pulse oximeters should be made available in various hospitals and monitoring for
hypoxaemia should be included in the guidelines for the routine inpatient
management of children with severe pneumonia.
2. The presence of lower chest wall indrawing, bronchial breath sounds and clinical
heart failure in children with pneumonia may be used by clinicians as an index of
adjudging the presence of hypoxaemia in areas where pulse oximeters are not
available.
3. The health care workers at the primary health care facility may use restlessness and
lower chest wall indrawing as a predictor of hypoxaemia. These features should serve
as an urgent sign for referral to centres where oxygen therapy is available.

90
LIMITATIONS OF THE STUDY
1. Continuous pulse oximeter monitoring would have been the ideal for the present study
as against the intermittent use of the device in the study.
2. Bactec is the ideal way of doing bacterial blood culture which was however not
available at health facility where the current study was carried out.
3. Determination of arterial blood gases is the ‘gold standard’ for measuring the partial
pressure of oxygen which could not be carried out in the present study.

91
REFERENCES
1. Williams BG, Gouws E, Boschi-Pinto C, Bryce J, Dye C. Estimates of world-wide
distribution of child deaths from acute respiratory infections. Lancet Infect Dis 2002;
2:25–32.
2. Rudan I, Boschi-Pinto C, Biloglav Z, Mulholland K, Campbell H. Epidemiology and
etiology of childhood pneumonia. Bull WHO 2008;86:412-16.
3. Fagbule D, Parakoyi DB, Spiegel R. Acute respiratory infections in Nigerian children:
prospective cohort study of incidence and case management. J Trop Pediatr
1994;40:279-84.
4. Fagbule D, Adedoyin MA, Nzeh DA. Childhood pneumonia in the University of
Ilorin Teaching Hospital. Nig J Paediatr 1987;14:73-78.
5. Chernick V, West JB. The functional basis of respiratory disease In: Chernick V, Boat
T, Wilmott R, Bush A, editors. Kendig’s Disorders of the Respiratory Tract in
Children. 7th ed. Philadelphia: Saunders-Elsevier, 2006:29-64.
6. Mower WR, Sachs C, Nicklin EL, Baraff L. Pulse oximetry as a fifth pediatric vital
sign. Pediatrics 1997;99:681-86.
7. Subhi R, Adamson M, Campbell H, Weber M, Smith K, Duke T. The prevalence of
hypoxaemia among ill children in developing countries: a systematic review. Lancet
Infect Dis 2009;9:219-27.
8. Onyango FE, Steinhoff MC, Wafula EM, Wariua S, Musia J, Kitonyi J. Hypoxaemia
in young Kenyan children with acute lower respiratory infection. BMJ 1993;306:612-
5.
9. Weber MW, Usen S, Palmer A, Jaffar S, Mulholland EK. Predictors of hypoxaemia in
hospital admissions with acute lower respiratory tract infection in a developing
country. Arch Dis Child 1997;76:310-4.

92
10. Usen S, Weber M, Mulholland K, Jaffar S, Oparaugo A, Omosigho C, et al. Clinical
predictors of hypoxaemia in Gambian children with acute lower respiratory tract
infection: prospective cohort study. BMJ 1999;318:86-91.
11. Usen S, Webert M. Clinical signs of hypoxaemia in children with acute lower
respiratory infection: indicators of oxygen therapy. Int J Tuberc Lung Dis 2001;5:505-
10.
12. Smyth A, Carty H, Hart CA. Clinical predictors of hypoxaemia in children with
pneumonia. Ann Trop Paediatr 1998;18:31-40.
13. Singhi S, Deep A, Kaur H. Prevalence and predictors of hypoxemia in acute
respiratory infections presenting to paediatric emergency department. Indian J Crit
Care Med 2003;7:118-23.
14. Lodha R, Bhadauria PS, Kuttikat AV, Puranik M, Gupta S, Pandey RM, et al. Can
clinical symptoms or signs accurately predict hypoxemia in children with acute lower
respiratory tract infections? Indian Pediatr 2004;41:129-35.
15. Ayieko P, English M. In children aged 2-59 months with pneumonia, which clinical
signs best predict hypoxaemia? J Trop Pediatr 2006;52:307-10.
16. Basnet S, Adhikari RK, Gurung CK. Hypoxemia in children with pneumonia and its
clinical predictors. Indian J Pediatr 2006;73:777-81.
17. Margolis PA, Ferkol TW, Marsocci S, Super DM, Keyes LL, McNutt R, et al.
Accuracy of the clinical examination in detecting hypoxemia in infants with
respiratory illness. J Pediatr 1994;124:552-60.
18. Johnson WBR, Aderele WI, Gbadero D. Host factors and acute lower respiratory
infections in preschool children. J Trop Pediatr 1992;38:132-36.

93
19. Victora CG, Kirkwood BR, Ashworth A, Black RE, Rogers S, Sazawal S, et al.
Potential interventions for the prevention of childhood pneumonia in developing
countries: improving nutrition. Am J Clin Nutr 1999;70:309-20.
20. Folashade IB. Environmental factors, situation of women and child mortality in
southwestern Nigeria. Soc Sci Med 2000;51:1473-89.
21. Smith KR, Samet JM, Romieu I, Bruce N. Indoor air pollution in developing
countries and acute lower respiratory infections in children. Thorax 2000;55:518-32.
22. Johnson WBR, Aderele WI. The association of household pollutants and
socioeconomic risk factors with the short term outcome of acute lower respiratory
infections in pre-school Nigerian children. Ann Trop Pediatr 1992;38: 421-32.
23. Graham SM. HIV and respiratory infections in children. Curr Opin Pulm Med
2003;9:215–20.
24. Johnson WBR, Aderele WI, Osinusi K, Gbadero D. Acute lower respiratory
infections in hospitalised urban pre-school Nigerian children: a clinical overview. Afr
J Med Med Sci 1994;23:127-38.
25. Mulholland K. Measles and pertussis in developing countries with good vaccine
coverage. Lancet 1995;345:305-07.
26. Roth DE, Caulfield LE, Ezzati M, Black RE. Acute lower respiratory infections in
childhood: opportunities for reducing the global burden through nutritional
interventions. Bull WHO 2008;86:356-64.
27. Schmidt WP, Cairncross S, Barreto ML, Clasen T, Genser B. Recent diarrhoeal
illness and risk of lower respiratory infections in children under the age of 5 years. Int
J Epidemiol 2009;38:766-72.

94
28. Person Anne, Mintz-Matthew L. Anatomy and physiology of the respiratory tract. In:
Skolnik Neil, editor. Disorders of the Respiratory Tract: Common Challenges in
Primary care. Totowa, New Jersey: Humana Press, 2006:11-16.
29. The lower respiratory tract. In: Ellis H, editor. Clinical Anatomy: A Revision and
Applied Anatomy for Clinical Students and Junior Doctors. 11th ed. Massachusetts:
Blackwell Publishing Ltd, 2006:19-23.
30. Johnson A-WBR. Acute respiratory infections. In: Azubuike JC, Nkanginieme KEO,
editors. Paediatrics and Child Health in a Tropical Region. 2nd ed. Owerri: African
Educational services, 2007:396 – 424.
31. Simoes E, Cherian T, Chow J, Shahid–Salles S, Laxminaray ARan R, Jacob J. Acute
respiratory infections in children In: Jamison DT, Breman GJ, Measham AR, editors.
Disease Control Priorities in Developing Countries. 2nd ed. Washington, DC: The
World Bank 2006:485-97.
32. Hassan A. Non-invasive monitoring of blood gases. In: Hassan A, editor. Handbook
of Blood Gas / Acid Base Interpretation. London: Springer-Verley, 2009:63-95.
33. Perez-Fontan J, Haddad G. Respiratory pathophysiology. In: Behrman R, Kliegman
R, Jensen H, editors. Nelson Textbook of Pediatrics. 17th ed. Philadelphia: Saunders-
Elsevier, 2004:1362-70.
34. Henig NR, Pierson DJ. Mechanisms of hypoxemia. Respir Care Clin N Am
2000;6:501-21.
35. Williams A. Assessing and interpreting arterial blood gases and acid-base balance.
BMJ 1998;317:1213.
36. Moyle J. Uses and abuses of pulse oximetry. Arch Dis Child 1996;74:77-80.
37. Severinghaus J, Honda Y. History of blood gas analysis. VII. Pulse oximetry. J Clin
Monit 1987;3:135-38.

95
38. Hill E, Stoneham M. Practical applications of pulse oximetry. Practical procedures
2000;4:1-2.
39. Aderele WI, Johnson AWBR. Pneumonias. In: Azubuike JC, Nkanginieme KEO,
editors. Paediatrics and Child Health in a Tropical Region. 2nd ed. Owerri: African
Educational Services, 2007:425-41.
40. Stein R, Marostica P. Community-acquired pneumonia. Pediatr Res Rev
2006;75:S136-S37.
41. Management of the child with a serious infection or severe malnutrition : guidelines
for care at the first-referral level in developing countries. Geneva: World Health
Organization, 2000.
42. Lawn JE, Cousens S, Zupan J. 4 million neonatal deaths: when? where? why? Lancet
2005;365:891-900.
43. Oyejide C, Osinusi K. Acute respiratory tract infections in children in Idikan
community, Ibadan, Nigeria: severity, risk factors and frequency of occurrence. Rev
Inf Dis 1990;12:1042–46.
44. Victora CG, Fuchs SC, Flores AC, Fonseca W, Kirkwood BR. Risk factors for
pneumonia among Brazilian children in a metropolitan area. Pediatrics 1994;93:977-
85.
45. Johnson A-WBR, Osinusi K, Aderele W I, Gbadero DA, Olaleye OD, Adeyemi-Doro
FAB. Etiologic agents and outcome determinants of community-acquired pneumonia
in urban children: a hospital-based study. J Natl Med Ass 2008;100:370 -85.
46. Principi N, Esposita S. Community-acquired pneumonia in developing and developed
countries. Thorax 2011;66:815-22.
47. Tanimowo MO. Air pollution and respiratory health in Africa: a review. East Afr M J
2000;77:71-75.

96
48. Ezzati M, Kammen DM. Indoor air pollution from biomass combustion and acute
respiratory infections in Kenya: an exposure-response study. Lancet 2001;358:619-24.
49. Ranganathan SC, Sonnappa S. Pneumonia and other respiratory infections. Ped Clin
N Am 2009;56:135e56.
50. Graham NMH. The epidemiology of acute respiratory infections in children and
adults: a global perspective. Epidemiol Rev 1990;12:149-78.
51. Victora CG, Barros FC, Kirkwood BR, Vaughan J. Pneumonia, diarrhoea and growth
in the first four years of life: a longitudinal study of 5,914 Brazilian infants. Am J Clin
Nutr 1990;52:391-96.
52. Chisti MJ, Tebruegge M, La Vincente S, Graham SM, Duke T. Pneumonia in severely
malnourished children in developing countries―mortality risk, aetiology and validity
of WHO clinical signs: a systematic review. Trop Med Int Hlth 2009;14:1173-e89.
53. Celedon JC, Litonjua AA, Weiss ST, Gold D. Day care attendance in the first year of
life and illnesses of the upper and lower respiratory tract in children with a familial
history of atopy. Pediatrics 1999;104:495-500.
54. Sehgal V, Sethi GR, Sachdev HPS, Satyanarayana L. Predictors of mortality in
subjects hospitalized with acute lower respiratory tract infections. Indian Pediatr
1997;34:213 -19.
55. Fawzi WW, Chalmers TC, Herrera MG, Mosteller F. Vitamin A supplementation and
child mortality: a meta-analysis. JAMA 1993;269:899-903.
56. Coutsoudis A, Broughton M, Coovadia HM. Vitamin A supplementation reduces
measles morbidity in young African children: a randomized, placebo-controlled,
double-blind trial. Am J Clin Nutr 1991;54:890-5.
57. Shankar AH, Prasad AS. Zinc and immune function: the biological basis of altered
resistance to infection. Am J Clin Nutr 1998;68:447S-63S.

97
58. Brown KH, Peerson JM, Baker SK, Hess SY. Preventive zinc supplementation among
infants, preschoolers, and older prepubertal children. Food Nutr Bull 2009;30:S12-40.
59. Bryce J, Boschi-Pinto C, Shibuya K, Black RE. WHO estimates of the causes of death
in children. Lancet 2005;365:1147-52.
60. Fenn B, Morris SS, Black RE. Comorbidity in childhood in northern Ghana:
magnitude, associated factors, and impact on mortality. Int J Epidemiol 2005;34:368–
7.
61. Madhi SA, Petersen K, Madhi A, Khoolsal M, Klugman KP. Burden of disease and
drug resistance of bacteria in HIV infected children with severe lower respiratory tract
infections. Clin Inf Dis 2006;31:170-76.
62. Markowitz LE, Nieburg P. The burden of acute respiratory infection due to measles in
developing countries and the potential impact of measles vaccine. Rev Inf Dis
1991;13:S555-61.
63. Finelli L, Fiore A, Dhara R, Brammer L, Shay DK, Kamimoto L, et al. Influenza-
associated pediatric mortality in the United States: increase of Staphylococcus aureus
coinfection. Pediatrics 2008;122:805-11.
64. Forgie IM, O’Neill KP, Lloyd-Evans N, Leinonen M, Campbell H, Whittle HC, et al.
Etiology of acute lower respiratory tract infections in Gambian children: I. Acute
lower respiratory tract infections in infants presenting at the hospital. Pediatr Infect
Dis J 1991;10:33-41.
65. Falade A, Mulholland E, Adegbola R, Greenwood BM. Bacterial isolates from blood
and lung aspirate cultures in Gambian children with lobar pneumonia. Ann Trop
Paediatr 1997;17:315-19.
98
66. Adegbola RA, Falade AG, Sam BE, Aidoo M, Baldeh I, Hazlett D, et al. The etiology
of pneumonia in malnourished and well-nourished Gambian children. Pediatr Infect
Dis J 1994;13:975-82
67. Vuori-Holopainen E, Salo E, Saxen H, Hedman K, Hyypia T, Lahdenpera R, et al.
Etiologic diagnosis of childhood pneumonia by use of transthoracic needle aspiration
and modern microbiological methods. Clin Infect Dis 2002;34:583-90.
68. Kumar S, Awasthi S, Jain A, Srivastava RC. Blood zinc levels in children
hospitalized with severe pneumonia: A case control study. Indian Pediatr
2004;41:486-91.
69. Adedoyin M, Fagbule D. Bacterial aetiology of childhood pneumonia. Nig J Paediatr
1987;14:37-40.
70. Esposito S, Bosis S, Cavagna R, Faelli N, Begliatti E, Marchisio P, et al.
Characteristics of Streptococcus pneumoniae and atypical bacterial infections in
children 2-5 years of age with community-acquired pneumonia. Clin Infect Dis
2002;35:1345-52.
71. Russel G. Community-acquired pneumonia. Arch Dis Child 2001;85:456-57.
72. Oviawe O, Okuonghae H. Respiratory rate thresholds in children with varying
severity of pneumonia. Inter Child Hlth 1993;4:67-70
73. Tagbo BN, Ude AC, Ibe BC. Predictive value of respiratory thresholds in pneumonia
among preschool children. Nig J Paediatr 2002;29:108-12.
74. Johnson AWBR, Aderele W, Osinusi K, Gbadero D. Community-acquired pneumonia
in hospitalized urban young Nigerian children: clinical and hematological correlates
of diagnosis and outcome. Nig J Paediatr 2001;28:101-14.

99
75. Cherian T, Mulholland EK, Carlin JB, Ostensen H, Amin R, deCampo M, et al.
Standardized interpretation of paediatric chest radiographs for the diagnosis of
pneumonia in epidemiological studies. Bull WHO 2005;83:353-59.
76. Skerrett SJ. Diagnostic testing to establish a microbial cause is helpful in the
management of community-acquired pneumonia. Sem Res Inf 1997 12:308-21.
77. Diakaparomre MA, Obi J. Aetiological diagnosis of pneumonia in children by lung
puncture. Nig J Paediatr 1981;8:61-64.
78. Vuori-Holopainen E, Peltola H. Lung aspiration in childhood pneumonia Clin Infect
Dis 2001;32:715-26.
79. Johnson AWBR, Osinusi K, Aderele W, Tomori O. Viral pathogens of acute lower
respiratory infections in pre-school Nigerian children and clinical implications of
multiple microbial identifications. West Afr J Med 1993;12:11-20.
80. Duke T, Mgone J, Frank D. Hypoxaemia in children with severe pneumonia in Papua
New Guinea. Int J Tuberc Lung Dis 2001;5:511-9.
81. Nantanda R, Hildenwall H, Peterson S, Kaddu-Mulindwa D, Kalyesubula I, Tumwine
JK. Bacterial aetiology and outcome in children with severe pneumonia in Uganda.
Ann Trop Paediatr 2008;28:253-60.
82. Lozano JM. Epidemiology of hypoxaemia in children with acute lower respiratory
infection. Int J Tuberc Lung Dis 2001;5:496-504.
83. Lozano JM, Steinhoff M, Ruiz JG, Mesa ML, Martinez N, Dussan B. Clinical
predictors of acute radiological pneumonia and hypoxaemia at high altitude. Arch Dis
Child 1994;71:323-7.
84. Reuland DS, Steinhoff MC, Gilman RH, Bara M, Olivares EG, Jabra A, et al.
Prevalence and prediction of hypoxemia in children with respiratory infections in the
Peruvian Andes. J Pediatr 1991;119:900-6.
100
85. Dyke T, Lewis D, Heegaard W, Manary M, Flew S, Rudeen K. Predicting hypoxia in
children with acute lower respiratory infection: a study in the highlands of Papua New
Guinea. J Trop Pediatr 1995;41:196-201.
86. Duke T, Blaschke AJ, Sialis S, Bonkowsky JL. Hypoxaemia in acute respiratory and
non-respiratory illnesses in neonates and children in a developing country. Arch Dis
Child 2002;86:108-12.
87. Madico G, Gilman RH, Jabra A, Rojas L, Hernandez H, Fukuda J, et al. The role of
pulse oximetry. Its use as an indicator of severe respiratory disease in Peruvian
children living at sea level. Respiratory Group in Peru. Arch Pediatr Adolesc Med
1995;149:1259-63.
88. Harris M, Clark J, Coote N, Fletcher P, Harnden A, McKean M, et al. BTS Guidelines
for the management of community acquired pneumonia in children: update 2011
Consultation draft.18 January 2011
89. Oxygen therapy for acute respiratory infections in young children in developing
countries Programme for the Control of Acute Respiratory Infections of the World
Health Organization. Geneva: World Health Organization, 1993.
90. Provisional census figures by States and LGA: National Population Commission,
Kwara State, 2006.
91. Araoye MO. Subjects selection. In: Araoye MO, editor. Research Methodology with
Statistics for Health and Social Sciences. 1st ed. Ilorin: Natadex 2003:115 – 21.
92. Oyedeji GA. Socio-economic and cultural background of the hospitalized children in
Ilesha Nig J Paediatr 1985;12:111-17.
93. Akuse R. Laboratory techniques relevant to paediatrics. In: Azubuike J, Nkanginieme
K, editors. Paediatrics and Child Health in a Tropical Region. 2nd ed. Owerri: African
Educational services, 2007:697-707.

101
94. http://www.who.int/growthref/en/.
95. Laman M, Ripa P, Vince J, Tefuarani N. Can clinical signs predict hypoxaemia in
Papua New Guinean children with moderate and severe pneumonia? Ann Trop
Paediatr 2005;25:23-7.
96. Duke T, Graham SM, Cherian MN, Ginsburg AS, English M, Howie S, et al. Oxygen
is an essential medicine: a call for international action. Int J Tuberc Lung Dis
2010;14:1362-8.
97. Duke T, Subhi R, Peel D, Frey B. Pulse oximetry: technology to reduce child
mortality in developing countries. Ann Trop Paediatr 2009;29:165-75.
98. Ahmed S, Ahmed A, Chowdhury M, Bhuiya M. Gender, socio-economic
development and health-seeking behaviour in Bangladesh. Soc Sci Med 2000;51:361-
73.
99. Ogunlesi TA, Olanrewaju DM. Socio-demographic factors and appropriate health
care-seeking behavior for childhood illnesses. J Trop Pediatr 2010;56(6):379-85.
100. Otczyk DC, Cripps AW. Delivering vaccines for the prevention of pneumonia -
programmatic and financial issues. Pneumonia 2013;2:19-29
101. Nathoo K, Nkrumah F, Ndlovu D, Nhembe M, Pirie D, Kowo H. Acute lower
respiratory tract infection in hospitalized children in Zimbabwe. Ann Trop Paediatr
1993;13:253-61.

102
APPENDIX I
CLINICAL PREDICTORS OF HYPOXAEMIA IN CHILDREN AGED TWO
MONTHS UP TO FIVE YEARS WITH PNEUMONIA AT THE UITH, ILORIN
INFORMATION SHEET FOR PARENTS/CAREGIVERS OF PROSPECTIVE
SUBJECTS
WHAT IS THE STUDY ABOUT?
The study is intended to find out how common low blood level of oxygen (low arterial
hemoglobin saturation or hypoxaemia) is in patients with pneumonia, the clinical symptoms
and signs associated with it and the outcome of hypoxaemia in Nigerian children aged two
months to five (5) years, seen at the Emergency Paediatric Unit (EPU) of the University of
Ilorin Teaching Hospital.
BENEFIT(S) OF PARTICIPATION
Observations made at the end of this study will contribute to the understanding of the various
symptoms and signs that are associated with hypoxaemia in patients with pneumonia and thus
aid in the early recognition of this lethal complication, as well as the need for early
commencement of oxygen treatment. It would also ensure that wastage of oxygen is
minimized.
POTENTIAL RISK(S) OF PARTICIPATION
The only anticipated risk is the discomfort of putting the pulse oximeter gadget on either the
toe or the finger. There is definitely no risk of damage to the fingers or toes.
WHAT IS EXPECTED OF YOU IF YOU AGREE TO PARTICIPATE?
You will be expected to provide answers to simple questions like your child’s age, sex, your
level of education and occupation which are in any case required for making the right
diagnosis and as well as starting the correct treatment in the first place. Your child will then
be examined in detail, and the arterial oxygen saturation will be taken using a pulse oximeter.

103
However, your child will still have other tests required for making the right diagnosis and
formulating the right treatment, all of which would have been done, regardless of
participation in the study. These include chest radiographs and a few blood tests.
CONFIDENTIALITY!
The information obtained will be treated in absolute confidence. No part or whole of such
information shall be divulged to anyone except the investigators. We owe it a duty to keep
your child’s records absolutely confidential.
YOUR PARTICIPATION IS VOLUNTARY!
Your participation and that of your child are voluntary. You may withdraw him/her at any
time in the course of the study. Please note that your participation or refusal (to participate)
will in no way influence the quality of treatment and care given to your child or ward.
COST OF PARTICIPATION
The measurement of arterial oxygen saturation, examination of the child and completion of
questionnaires attract no cost; the cost of your participation in this study is absolutely free.
This is however exclusive of the cost of routine investigations and treatment.

104
APPENDIX II
INFORMED CONSENT FORM
Alhaji/Hajia/Chief/Mr/Mrs ……………………………….....……………………..
Whose address is ……………………….....………………….....…………. do hereby gives
consent on behalf of my child or ward to participate as a subject in a study/research as
explained to me verbally and as contained in the attached “Information sheet for Parents &
Care givers.” I am aware that my child will be fully evaluated and treated regardless of my
consent or otherwise to participate in the study.
All the terms of this consent including the potential risks and what it takes to participate have
been fully explained to me in a language that I understand.
Signature/thumbprint__________________
Signature________________________
Child’s Parent/Guardian Interviewer
Date_________________________________
Time__________________________________
Witness’s signature:_____________________
Name of witness:______________________________

105
APPENDIX III: STUDY PROFOMA
CLINICAL PREDICTORS OF HYPOXAEMIA IN CHILDREN AGED TWO
MONTHS UP TO FIVE YEARS WITH PNEUMONIA AT THE UITH, ILORIN
Hospital No_________Serial No _______ Name____________________________
Date of Presentation____________ Informant _______________
A) Sociodemographic data
1. Age________
2. Sex: Male (1) Female (2)
3. Mother’s Education level: university/HND(1) post secondary(2) secondary(3)
primary (4) none (5) arabic(6) not known (7)
4. Father’s Education Level: university/HND(1) post secondary(2) secondary(3)
primary (4) none (5) arabic(6) not known (7)
5. Mother’s Occupation: …………. professionals(1) senior school teacher or its
equivalents(2) Junior school teachers, drivers, artisan(3) petty trader(4)
housewife/unemployed(5) student(6) not known/dead(7)
6. Mother’s age :_________________________________
7. Father’s Occupation: professionals(1) senior school teacher or its equivalents(2)
Junior school teachers, drivers, artisan(3) petty trader(4) unemployed(5)
student(6) not known/dead(7)
8. Family type : Monogamous (1) Polygamous (2)
9. No. of sibling(s): 1-2 (1) 3-4 (2) ≥5 (3) none (4)
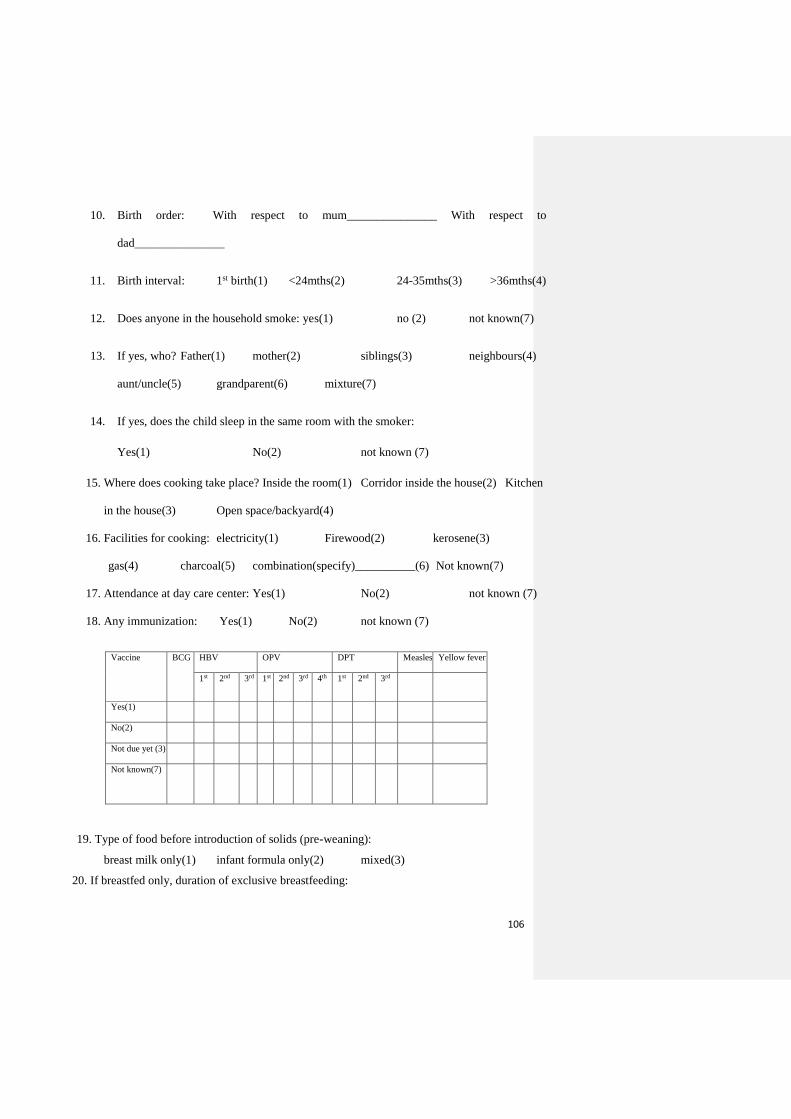
106
10. Birth order: With respect to mum_______________ With respect to
dad_______________
11. Birth interval: 1st birth(1) <24mths(2) 24-35mths(3) >36mths(4)
12. Does anyone in the household smoke: yes(1) no (2) not known(7)
13. If yes, who? Father(1) mother(2) siblings(3) neighbours(4)
aunt/uncle(5) grandparent(6) mixture(7)
14. If yes, does the child sleep in the same room with the smoker:
Yes(1) No(2) not known (7)
15. Where does cooking take place? Inside the room(1) Corridor inside the house(2) Kitchen
in the house(3) Open space/backyard(4)
16. Facilities for cooking: electricity(1) Firewood(2) kerosene(3)
gas(4) charcoal(5) combination(specify)__________(6) Not known(7)
17. Attendance at day care center: Yes(1) No(2) not known (7)
18. Any immunization: Yes(1) No(2) not known (7)
Vaccine BCG HBV OPV DPT Measles Yellow fever
1st 2nd 3rd 1st 2nd 3rd 4th 1st 2nd 3rd
Yes(1)
No(2)
Not due yet (3)
Not known(7)
19. Type of food before introduction of solids (pre-weaning):
breast milk only(1) infant formula only(2) mixed(3)
20. If breastfed only, duration of exclusive breastfeeding:

107
<3months(1) 4 – 6 months(2) none (3) not known(7)
21. PRESENT ILLNESS HISTORY
A) Non respiratory symptoms
Symptom Present (1)/Absent(2) Duration(days}
1. Fever
2. Inability to feed
3. Inability to drink
4. Restlessness
5. Lethargy
6. Vomiting
7. Diarrhea
8. Rash
9 .Others(specify)
B) Respiratory symptoms
Symptom Present (1)/Absent(2) Duration(days}
1. Cough
2. Nasal discharge
3. Difficulty breathing
4. Fast breathing
5. Wheeze
6. Chest pain
7.Others(specify)

108
23. GENERAL PHYSICAL EXAMINATION
a) Anthropometric measurement
Weight_____________ Expected weight for age_________%
Height _____________Mid-Upper Arm Circumference _______________
b) Hydration status: well hydrated (1) mild dehydration (2)
moderate dehydration(3) severe dehydration (4)
c) Pallor (Y/N) ________________________________
d) Axillary temperature recording (oC) _______________________
e) Oedema Yes (1) No (2)
24. RESPIRATORY SIGNS
a. Respiratory rate per minute _____________________________
b. Central cyanosis: Yes (1) No (2)
c. Grunting: Yes (1) No (2)
d. Wheeze: Yes (1) No (2)
e. Snuffles/noise from blocked nostrils: Yes (1) No (2)
f. Rhinorrhoea: Yes (1) No (2)
g. Nasal flaring: Yes (1) No (2)
h. Intercostal recession: Yes (1) No (2)
i. Lower chest wall indrawing: Yes (1) No (2)

109
j. Percussion notes: normal (1) dull (2) hyperresonant (3)
k. Breath sounds: normal (1) diminished (2) absent (3)
l. Bronchial breath sounds: Yes (1) No (2)
m. Adventitious sounds: crepitations (1) rhonchi (2)
none (3) crepitations and rhonchi
(4)
n. Head nodding Yes (1) No (2)
p. Other respiratory findings (specify)___________________________________
_________________________________________________________________
25. OTHER SYSTEMIC FINDINGS
Heart rate_________________________________________________________
Heart sounds______________________________________________________
Hepatomegaly : Yes(1) No(2)
If yes, any tenderness: Yes (1) No (2)
Splenomegaly : Yes(1) No(2)
Unconscious: Yes(1) No(2)
If yes, GCS score_____________________________
Other findings_____________________________________________________
_________________________________________________________________
_____________________________________________________________________
____________________________________________________________________
26. DIAGNOSIS: bronchopneumonia (1) lobar pneumonia(2) mixed(3)

110
o COMPLICATIONS: Yes (1) No(2)
o If yes, indicate type:_____________________________________________
Severity of pneumonia_____________________________________________
27. RESULTS
Pulse Oximeter Reading_______________________________________
Pulse oximeter reading on O2_____________________________________________________
HYPOXAEMIA: Yes(1) No(2)
Chest radiograph findings_____________________________________
_____________________________________________________________________
_____________________________________________________________________
____________________________________________________________________
Haematocrit/packed cell volume______________________________
Total WBC count_________________________________________
WBC Differentials____________________________________________
__________________________________________________________________
_________________________________________________________________
Blood Culture growth: Yes(1) No(2)
If positive, indicate organism_____________________________________
28. OUTCOME OF ADMISSION:
a. recovery(1) death(2) DAMA(3)
b. duration of hospitalization_____________________________
c. duration on supplemental oxygen therapy_____________________

111
APPENDIX IV
SOCIAL CLASSIFICATION SCHEME
SOCIAL
CLASS
PROFESSION EDUCATIONAL
ATTAINMENT
I Professional, Senior Public Servants, Owners of
large business concerns, Senior military officers,
large-scale contractors.
University graduates or
equivalents
II Non-academic professional e.g. Nurses, Secondary
school teachers, Secretaries, Owners of medium
sized business, intermediate grade public servants.
School certificate holders
and equivalent
III Non-manual skilled workers including clerks,
typist, telephone operators, junior school teachers,
driver.
Grade II teachers or
equivalent
IV Petty traders, Labourers, Messengers Primary certificate
V Unemployed. Full time house wives, students,
subsistence farmers.
No formal education
The mean of four scores (two for the father and two for the mother) to the nearest whole
number is the social class to be assigned to the child.

112
APPENDIX V
Severity assessment of pneumonia according to British Thoracic Guidelines
Mild to moderate Severe
Infants Temperature <38.5°C Temperature >38.5°C
RR <50 breaths/min RR >70 breaths/min
Mild recession Moderate to severe recession
Taking full feeds Nasal flaring
Cyanosis
Intermittent apnoea
Grunting respiration
Not feeding
Tachycardia(age dependent)
Capillary refill time > 2seconds
SpO2 <92%
Older Children Temperature <38.5°C Temperature >38.5°C
RR <50 breaths/min RR >50 breaths/min
Mild breathlessness Severe difficulty in breathing
No vomiting Nasal flaring
Cyanosis
Grunting respiration
Signs of dehydration
Tachycardia (age dependent)
Capillary refill time > 2 seconds
SpO2 <92%
Significant tachycardia - HR > 160beats/minute in infancy; >150 beats/minute at 1year;
>140beats/minute at 2 years; 130beats/minute at 3 years; 120 beats/minute at 4 years and
>110beats/minute at 5 years
113
APPENDIX VI

114
APPENDIX VII