Deliver Today : Shape Tomorrow Dr Nicolas Small, GP Chairman Margaret Stockham Strategic Adviser.

UNIVERSITÁ DEGLI STUDI DI MILANO Facoltà di Medicina Veterinaria
Dipartimento di Scienze veterinarie e Sanità pubblica
PhD COURSE OF VETERINARY HYGIENE AND ANIMAL PATHOLOGY
XXVIII cycle
CLINICAL PATHOLOGICAL MONITORING OF DAIRY COWS IN THE TRANSITION PERIOD
PhD Student ddd Dr. Pierangelo Moretti Matr. R10040
PhD Supervisor Dr. Alessia Giordano PhD Coordinator Prof. Giuseppe Sironi
Academic Year 2014-2015

To Cá and Pé,
with love

“Pe’ fa’ ‘e cose bone ce vo’ tiemp”
Popular saying from Benevento

Table of content
Chapter 1: The health monitoring of transition cows 1
1.1 – Introduction 2
1.2 - Laboratory test in veterinary clinical pathology 3
1.2.1 Hematology 4
1.2.2 Clinical chemistry 6
1.3 - Determination of reference intervals 11
1.4 - Interpretation of herd-based laboratory data 12
Chapter 2: Physiologic changes during the transition period 14
2.1 - Metabolic changes during transition 15
2.2 - Relationship between metabolism, oxidative stress
and inflammation in transition cows 17
Chapter 3: Diseases of the transition period 20
3.1 – Introduction 21
3.2 - Clinical and subclinical hypocalcaemia 21
3.3 - Clinical and subclinical ketosis 22
3.4 - Left-displaced abomasum 23
3.5 - Subacute ruminal acidosis 23
3.6 – Mastitis 24
3.7 - Uterine diseases 24
3.8 - Retained placenta 25
Chapter 4: Aims of the study 27
Chapter 5: Reference intervals for hematological and biochemical 30
parameters, acute phase proteins, and markers of oxidative
stress in holstein dairy cows at 3 and 30 days post-partum
5.1 – Introduction 31
5.2 - Material and methods 32
5.3 - Results 38
5.4. Discussion and conclusions 48
Chapter 6: Evaluation of peri-partum laboratory changes in dairy 54
cows with and without retained placenta
Section 1: Early post-partum hematological changes in 55
holstein dairy cows with retained placenta
6.1.1 Introduction 55
6.1.2 Material and methods 57
6.1.3 Results 61
6.1.4 Discussion 66
Section 2: Hematological changes around parturition 71
in holstein dairy cows with retained placenta
6.2.1 Introduction 71
6.2.2 Material and methods 72
6.2.3 Results 74
6.2.4 Discussion and conclusions 84
Chapter 7: An attempt to prevent production diseases in dairy cows 87
by intense monitoring and ad hoc treatment.
7.1 Introduction 88
7.2 Material and methods 90
7.3 Results 94
7.4 Discussion 100
7.5 Conclusion 103
Chapter 8: General discussion and conclusions 104
References 110
Annex: Scientific production during the PhD 122

1
CHAPTER 1:
The health monitoring of transition cows

2
CHAPTER 1: THE HEALTH MONITORING OF TRANSITION COWS
1.1 – Introduction
As a matter of fact, milk yield and reproductive performances are the standard economic barometers
of dairy production (Esposito, 2014). Intensive genetic selection and improvements in dairy cow
nutrition, housing and management, have led to significant increases in average milk yield with no
signs that the limits have been reached (Barkema et al., 2015; Opsomer, 2015). The transition
period for dairy cows, extending from approximately 3 weeks pre-partum until 3 weeks post partum
is subject to enormous metabolic, hormonal, inflammatory and oxidative stress changes (Sordillo
and Raphael, 2013). When, in early lactation, modern high yielding dairy cows are compromised by
the nutritional and hormonal environment, started during the last weeks of gestation, they are able
to direct higher priority on maintaining lactation rather than on maintaining their body energy
reserves (Esposito, 2014; Opsomer, 2015). The increased capacity of adaptation to a lower energy
availability implicates that modern cows have to deal with increased metabolic instability compared
to low producing cows. If this challenge fails, and the compensatory processes are not sufficient to
sustain energy requirements, subclinical and clinical diseases may develop. As all the efforts are
going in the direction of milk production, also other processes that require energy, as immunity and
reproduction, are at greater risk to fall (Opsomer, 2015). For these reasons, all the conditions
predisposing to an inadequate adaptation to the energy requirement (subclinical diseases,
environmental, nutritional errors) are recognized as openers to other metabolic and reproductive
disturbances such as clinical ketosis, milk fever, displaced abomasum, endometritis, metritis,
mastitis (Mulligan et al., 2008). These diseases are the major responsible for culling thus causing
productive and consequently economic losses in dairy farming (Esposito, 2014; Barkema et al.,
2015; Opsomer, 2015).
Adaptative processes, subclinical and clinical conditions, and infectious diseases occurring during
the transition period may be all reflected by a broad range of changes in the concentration of plasma

3
metabolites and hematological parameters, that can be evaluated with laboratory techniques (e.g.
clinical chemistry and hematology) (Stockham and Scott, 2008a). The goal from this perspective is
to investigate which are the biochemical and hematological changes associated with a proper
adaptative process rather than to a failure of this adaptation, to identify pathological states and
possibly to find early signals of these abnormalities. In this context, the veterinary clinical
pathology, a discipline of the veterinary medicine that deals with the use of laboratory methods for
the diagnosis and treatment of diseases, has the primary role to assist clinicians for an adequate
application and interpretation of laboratory data (Stockham and Scott, 2008a). Maintaining health
and productivity in the transition period is one of the most difficult challenges that dairy herds face.
Most health-promotion strategies including nutrition and other aspects of management are logically
and practically implemented at the herd level rather than at individual level (Chapinal et al., 2012).
The main reasons to perform laboratory analyses at a herd level are to detect an unidentified
pathological states, to rule out a possible cause of illness, but especially to evaluate the nutritional
and metabolic status of cows in order to detect subclinical conditions that may affect productive and
reproductive performances of the herd. Finally, laboratory data may also be used for research
purposes in order to contribute to the definition of the pathophysiological or pathogenetic processes
underlying the diseases affecting transition cows.
1.2 – Laboratory tests in veterinary clinical pathology
Laboratory tests in veterinary clinical pathology may involve the analysis of blood, tissues and body
fluids; numerous laboratory methods and techniques are available. The complete description of all
the methods is beyond the scope of this thesis; therefore, in the following section, the assays
commonly employed for determination of the hematological and clinical chemistry profile of cattle
are only briefly described.

4
1.2.1 Hematology
Hematology assays are commonly performed with automated cell counters using whole blood
samples, with ethylenediaminetetraacetic acid (EDTA) as preferred additive to prevent clotting of
the sample. The objective of this technique is the quantification of concentration, size and cellular
content (e.g. haemoglobin and peroxidase) of leukocytes, erythrocytes (RBCs), and platelets
(PLTs). As many haematological instruments, included those used in veterinary laboratories are
firstly designed for human patients, in veterinary species a differential leukocyte count, which is the
proportion of the different classes of white cells in the blood, performed by microscopy is always
recommended, since morphology, size and cellular complexity of leukocytes are not accurately
identified by the instrument in many cases. Hematological analysis is not only relevant for
diagnosing disorders of the hemopoietic system but also helpful in the monitoring of different
organs and for the identification of systemic diseases. Specifically, obtained information may be
related to the inflammatory status of the animal (mainly leukocyte related parameters) or may be an
indirect evaluation of metabolic and nutritional performances (mainly erythroid related parameters)
(Stockham and Scott, 2008a; Tornquist and Rigas, 2010).
Concerning abnormalities in the number of circulating white blood cells, total leukocyte number
and the proportions of the different leukocyte subpopulations are influenced by stress and
excitement, pathological or physiological conditions occurring around parturition (Tornquist and
Rigas, 2010). For example neutrophilia, an increased concentration of neutrophils in peripheral
blood, with or without the presence of immature forms (the so called left shift) may be found in
association with inflammatory conditions related to bacterial, viral, fungal, protozoal, and parasitic
infections, but also with neoplasia, abomasal displacement, toxicosis, immune-mediated anemia,
stress and excitement, but with a lower magnitude compared to other mammals (Tornquist and
Rigas, 2010). The pre-partum period is accompanied by increased leukocytes mainly due to
neutrophils then followed by a decrease during the first week post-partum (Kehrli et al., 1989; Cai

5
et al., 1994; Zerbe et al., 2000). In contrast, neutropenia, the decreased concentration on neutrophils
in peripheral blood, lasting 48 hours may be found associated with hyperacute inflammatory
conditions mainly due to gram-negative infection, mastitis, peritonitis, metritis, pneumonia, and
gastrointestinal disease, but also to some viral infections such as bovine viral diarrhoea (BVDV),
and bluetongue virus (Tornquist and Rigas, 2010). Inflammatory neutropenia is common in adult
cattle, since they have a relatively small storage neutrophil pool (Stockham and Scott, 2008b).
Lymphocytosis (an increased blood concentration of lymphocytes) is not common in ruminants,
though it may occur in chronic viral infections, chronic trypanosomiasis, and in bovine leukemia
virus (BLV) infection. On the other hand, lymphopenia is most commonly seen as a consequence of
a corticosteroid-stress response(Tornquist and Rigas, 2010). Monocytosis can be observed during
acute and especially chronic inflammatory diseases, and is of rare occurrence in stress response in
cattle, whereas eosinophilia and basophilia have been reported in a variety of ecto and endoparasitic
infections (Tornquist and Rigas, 2010). Monocytopenia, eosinopenia and basopenia are infrequently
reported during hematological examination of cattle as different techniques are needed to find this
anomaly (bone marrow evaluation) (Tornquist and Rigas, 2010). Moreover is plausible that the very
high imprecision of the method does not allow to reach the minimum requirement for clinical
purposes as observed in other species (Kjelgaard-Hansen and Jensen, 2006)
As regards erythroid changes, common indications for RBC analysis are clinical or suspected
anemia or hemorrhage (Roland et al., 2014). As typical features of anemia, RBC count,
haemoglobin concentration, and/or hematocrit are decreased. A reduction of the hematocrit value
(which is the percentage of blood volume that consists of red blood cells) is also caused by an
increased plasma volume (e.g., during pregnancy or after fluid therapy) (Roland et al., 2014).
Anemia can be categorized into regenerative and nonregenerative anemia according to the bone
marrow response, and it can be also classified with regard to the cell size (normocytic, macrocytic,
and microcytic, indicating normal, increased, and decreased mean cellular volume or MCV,
respectively) and haemoglobin concentration (normochromic, hypochromic, and hyperchromic,

6
indicating normal, decreased, and increased haemoglobin, respectively) (Roland et al., 2014).
Common causes for regenerative anemia are hemorrhages or hemolysis. Causes for haemorrhage in
cattle include trauma, abomasal ulcers, hemorrhagic enteritis, vena cava syndrome, blood-sucking
parasites, hemostasis defects, and vessel erosion or rupture (Roland et al., 2014). Nonregenerative
anemia, which is due to a defective or reduced erythropoiesis, may occur during chronic
inflammation, due to chronic renal disease (with erythropoietin deficiency), endocrine disorders,
bone marrow depression, some drugs (e.g., estrogens), toxins (e.g., lead poisoning), abscesses,
neoplasia and for nutritional causes (e.g. vitamins or iron deficiency) (Roland et al., 2014).
A platelet count might be indicated in case of severe hemorrhage or increased bleeding tendency.
Thrombocytosis (increased concentration of platelets in peripheral blood) may occur
physiologically as a consequence of epinephrine-induced splenic contraction (Roland et al., 2014).
Essential or primary thrombocytosis is an uncommon myeloproliferative condition. Reactive or
secondary thrombocytosis is commonly associated with inflammatory conditions but can be also
observed with chronic blood loss, neoplasia, or iron deficiency. Thrombocytopenia is found in
excessive consumption (e.g., with blood loss, disseminated intravascular coagulation), decreased
platelet production (e.g., in myelophthisis or bone marrow hypoplasia due to toxins), destruction
(e.g., due to infections, toxins, drugs, neoplasia, or immune-mediated), or distribution disorders
(e.g., splenomegaly) (Roland et al., 2014).
1.2.2 Clinical chemistry
Quantitative, semi-quantitative and qualitative analysis of metabolites may be performed on serum
and plasma in order to detect or quantify the concentration or the activity of serum or plasma
chemical substances. There are many parameters that can be evaluated in plasma of animals, but
they can be grouped based on their relevance in reflecting specific organ or system functionality.
Concerning dairy cows, the most important analytes, included also as part of the investigation
described in the present thesis, are listed here below.

7
Nonesterified fatty acids (NEFA) and β-hydroxybutyrate (BOHB) are energy metabolites that can
be used as markers of energy balance in dairy cows (Stockham and Scott, 2008a). NEFAs form
from hydrolysis of triacylglycerol in adipose tissue, in liver and mammary gland. Its increases occur
with increased fat mobilization in response to negative energy balance from any cause (Kaneko,
2008). BOHB is a ketone body, derived from the β-oxidation of lipids that accumulates when an
increased lipolysis is associated with increased gluconeogenesis as occurs during a negative energy
balance (Bruss, 2008). Increased NEFA and BOHB are thus considered reliable markers of an
excessive negative energy balance in dairy cows during the transition period when there are high
energy demands for the foetus and milk production (Stockham and Scott, 2008a). When sampled in
the appropriate time frame, pre-partum and post-partum NEFA and BOHB concentrations above
certain threshold levels are associated with negative downstream outcomes such as increased risk of
disease, and decreased milking and reproductive performance (Stockham and Scott, 2008c). BOHB
concentrations can be measured with several tests of different sensitivities and specificities both
cow-side and in laboratories. At present, NEFA concentrations can be measured only in laboratories
(Oetzel, 2004).
Serum urea and creatinine concentration are used in the assessment of urinary system disorders but
urea concentration is also a reflection of ruminal function and available dietary protein at the herd
level (Stockham and Scott, 2008a). Urea is synthesized in the liver as a byproduct of dietary and
muscle proteins catabolism. It is completely and freely filtrated by the renal glomerulus, so it is a
reliable indicator of the glomerula filtration rate. Creatinine is a breakdown product of muscle
creatine and phosphocreatine which are in turn molecules involved in the energy metabolism. As a
consequence, creatinine serum concentration may be slightly affected by muscle mass but remains
the test of choice in the evaluation of kidney function in cattle, since it the best indicator of the
glomerular filtration rate (Russell and Roussel, 2007).

8
Serum calcium, magnesium and phosphorous concentrations reflect the dynamics and hormonal
control of these metabolites in different organs (mobilization from bone, absorption from intestine,
renal excretion, shift between intracellular and extracellular fluid, and protein concentration) (Rosol
and Capen, 1997). Low serum levels of calcium are commonly adopted to identify animals with
clinical and subclinical hypocalcemia which is one of the most common and relevant problem in the
transition cow, due to the increased demand of calcium for foetus skeletal formation and milk
production (Stockham and Scott, 2008a; Martinez et al., 2012).
Serum electrolytes typically included in a chemistry profile are sodium, potassium and chloride.
Sodium is the major extracellular cation and is responsible for most of the osmotic force that
maintains the size of the extracellular fluid (ECF) compartment. The concentration of serum sodium
is thus related to the animal's hydration status. Potassium is the major intracellular cation.
Hyperkalemia or hypokalemia cause muscle weakness affecting skeletal, cardiac, and smooth
muscle. Chloride is the major anion in ECF. It is an important component in many secretions
(sweat, saliva, and gastric secretions) as sodium chloride (NaCl), potassium chloride (KCl), or
hydrogen chloride (HCl). Even slight changes in serum electrolytes concentration may be life-
threatening, since they are paramount for the acid-base balance as well as for plasma osmolarity
which are of primary relevance for the homeostasis (Russell and Roussel, 2007).
Serum electrolytes are useful in the evaluation of several body systems and for formulating and
monitoring of fluid and electrolyte therapy.
The serum measurement of liver enzyme activities is pivotal in detecting possible hepatocyte
damage. The increased activity of aspartate transaminase (AST), alkaline phosphatase (ALP), and
γ-glutamyltransferase (GGT) may be indicative of hepatic or muscular cell damage (AST) or gall
bladder and bile ducts disorders (ALP and GGT). In the latter case, GGT is known to have a better

9
diagnostic sensitivity. Mild increases in GGT activity have been found in association with hepatic
lipidosis (Stockham and Scott, 2008d), a frequent condition in transition cows due to the fat
mobilization associated with the negative energy balance. Increased ALP activity is also present in
younger cows probably due to increased osteoblastic activity (Russell and Roussel, 2007).
Glucose is a tightly regulated metabolite, influenced by several hormones, thus its concentration in
serum is not a useful indicator of energy metabolism in cattle. Hyperglycemia may occurs in
different condition as stress, bovine milk fever, hyperammonemia, displaced abomasum, abomasal
volvulus, or proximal duodenal obstruction, or associated to administration of different drugs
(xylazine, corticosteroids, solutions containing dextrose) (Russell and Roussel, 2007).
Hypoglicemia in contrast, is sometimes associated with ketosis in dairy cattle, during septicemia, or
malnutrition.. Hypoglycemia may be also seen with pregnancy toxemia in cows as in other species.
Healthy cows present lower concentration of bilirubin compared to other species. Increased total
bilirubin concentration may be indicative of colestatic liver disease, even if the increase may be
only moderate (Russell and Roussel, 2007). Sick cattle with anorexia and rumen stasis may also
have hyperbilirubinemia due to a lower uptake from hepatocytes, not associated with hemolysis or
hepatic diseases (Stockham and Scott, 2008e).
Serum proteins concentration is related to both nutritional causes as well as the functionality of
organs and systems involved in their metabolism (mainly liver, kidney, gut and immune system).
Changes in the concentration of total proteins (increases and decreases) may be thus a reflection of
different causes. Total proteins are composed by albumin and globulins which in turn are mainly
composed by inflammatory proteins and immunoglobulins (antibodies). Concentration of serum
total proteins is better measured with automated spectrophotometers, using the biuret method,
whereas albumin and globulins fractions are better evaluated with electrophoretic techniques.
Albumin, synthetized in the liver, is the main contributor to the oncotic pressure in plasma and it is

10
responsible of the transport of many substances into the blood (calcium and magnesium ions, fatty
acids and hormones). It is also considered a negative acute phase protein due to decreased
production by hepatocytes during inflammation. Due to the prolonged half-life of albumin in cows,
hypoalbuminemia is detected only in chronic inflammatory states or during chronic hepatic failure.
Many different proteins compose the globulin fraction. A large proportion of globulins consists of
immunoglobulins, which are synthesized by plasmacells. Many other globulins are synthesized by
the liver, with a small amount synthesized by other tissues. Hyperglobulinemia may be an indicator
of an inflammatory response common to a variety of conditions (traumatic reticuloperitonitis, liver
abscesses, chronic pneumonia) or a reflection of an immune stimulation due to the presence of
infectious agents. Hyperproteinemia with hyperalbuminemia and hyperglobulinemia is commonly
due to dehydration (Russell and Roussel, 2007).
Acute phase proteins (APPs) are a group of molecules whose liver production and release is
influenced by inflammatory mediators (IL-1, IL-6, TNFα) which lead to a huge variation of their
concentration during the acute phase response. APPs can be classified according to the magnitude
of their increase (positive acute phase proteins) or decrease (negative acute phase proteins) in serum
concentrations during an acute phase response. Examples of positive APP in cattle are haptoglobin
(Hp), ceruloplasmin (Cp), and serum amyloid A (SAA), whereas negative APP are considered the
paraoxonase (PON-1) and albumin (Petersen et al., 2004; Giordano et al., 2013). Evaluation of
plasma concentration of APPs in cattle was found as an excellent tool to determine the presence of
an inflammatory condition in cattle and to predict possible transition diseases (Petersen et al., 2004;
Trevisi, 2009; Dubuc et al. 2010; Huzzey et al., 2011; Giordano et al., 2013). PON-1 is supposed to
hydrolyses lipid hydroperoxides generated on low density lipoproteins (LDL) during oxidative
events (Turk et al., 2004) thus determination of PON-1 concentration and the estimation of serum
hydroperoxides trought the dROM test may be used to evaluate the oxidative status in cattle
(Bionaz et al., 2007). Increased concentrations of hydroperoxides, and of other derivatives of

11
reactive oxygen metabolites are important risk factor for disorders occurring in the transition period
as ketosis, fatty liver, mastitis, and retained placenta (Sordillo and Raphael, 2013).
Vitamins are divided in fat-soluble (A, D, E and K) and water-soluble (B and C) vitamins. In cows,
Vitamin K, and the water-soluble vitamins B and C, are synthesised by ruminal and intestinal
bacteria, whereas vitamin D may be of dietary origin and or synthesised starting from cholesterol
and through conversion by the ultraviolet light (National Research Council, 2001). All vitamins are
important for animal health; vitamins A and E are considered to play an important role for the
immune response. Deficiencies in β-carotene and vitamin A around calving have been associated
with lower reproductive performance and higher incidence of intramammary infections (Johnston &
Chew, 1984), whereas vitamin E deficiency at the same period may lead to increased incidence of
reproductive diseases such as retained placenta, metritis and mastitis (Smith et al., 1997;
Hemingway, 2003). Vitamin D, in turn, is crucial for calcium metabolism, since it promotes the
intestinal uptake of calcium and phosphates and in general it promotes hypercalcemia (Rosol and
Capen, 1997).
1.3 - Determination of reference intervals
The detection of pathological and paraphysiological conditions, achievable by their reflection on
alterated biochemical and hematological data, first requires the definition of which results are
expected to be found in a healthy animals, the improperly defined ‘normal values’. This is based on
the use of reference intervals. Reference intervals are statistically derived intervals between and
including the two reference limits in which results from the 95% of the healthy population are
expect to be found (Geffré et al., 2009). The determination of reference intervals is a critical aspect
of veterinary clinical pathology and was recently the subject of guidelines, based on the 2008
Clinical Laboratory and Standards Institute (CLSI) recommendations (CLSI, 2008), reported by the

12
American Society for Veterinary Clinical Pathology (ASVCP) (Friedrichs et al., 2012). Due to the
variability among different assays used to measure a single analyte and the intrinsic variability of
different population of animals, each laboratory should create its own reference intervals. This
procedure requires an economical effort, since a minimum number of healthy animals on which
performs a complete set of analysis is required to produce a proper reference interval, so alternative
options are available, such as the use of reference intervals obtained from literature. This is possible
only when the methods used by the ‘donating’ and ‘receiving’ laboratories are overlapping, when
all the information related to the procedures employed in their determination are available and when
the reference intervals from literature are suitable for the population of the receiving laboratory
through the application of specific procedures. The difficulty to perform the transference is
primarily due to the unavailability of all these information. As reference intervals may vary
according to age, breed, level of production, distance from parturition, number of lactations and
management, the presence of published data concerning updated well established reference intervals
in cows for a wide panel of laboratory data is extremely important to unravel the possible effect of
all these factors, as showed in recently published studies (Quiroz-Rocha et al., 2009; Cozzi et al.,
2011; Brscic et al., 2015)
1.4 - Interpretation of herd-based laboratory data
Laboratory assays in dairy cows are used on individuals to detect a pathological state, or on groups
of animals in order to evaluate the nutritional and metabolic status of the group. In the first case
both hematological and biochemical analyses are performed in clinically ill animals to reveal
pathological states that may be linked to the reproductive apparatus (endometritis, metritis) or
infectious diseases that require punctual therapeutic intervention or, as commonly happen in the
dairy industry, a culling decision to avoid further costs. When laboratory assays are performed on a
groups of cow, laboratory profiles are commonly performed on a representative number of animals

13
of the herd (that need to be clinically healthy) which belong to defined groups of similar age and
lactation stage. Sampling multiple animals from a defined group allow to reduce the physiologic
variation. (Stockham and Scott, 2008a). Commonly, a sample size of 7-12, regardless the herd size,
is considered the minimum number of animals to obtain sufficient information at the field level for
most of the parameters. Adding more individuals to the test group will allow obtaining more
representative results, but often for economic reasons, smaller test groups are encouraged by the
breeders. On the other hand pooling of samples is strongly discouraged since the pool often showed
biased results compared to the mean values obtained from individuals. The goal of herd-based
samplings is to detect metabolic abnormalities that may be corrected through interventions on
nutrition or management. In this case animals with evident signs of disease are excluded because
variations of the mean values of the groups may be influenced by an individual problem that may
not reflect the problem of the herd. For the same reason, most of the results from a herd-based
sampling will fall within reference intervals. To achieve this goal, different approaches were
suggested by some authors based on their experience and researches (Herdt 2000; Oetzel, 2004).
For example, mean values of the examined herd were compared with mean values from reference
herds or with expected mean results. In other cases, acceptable, unacceptable and borderline
percentages of sampled animals with values above or below a threshold level have been established.
Both these strategies are widely adopted in field and may provide useful information; however it is
questionable how thresholds that may be valid for a herd in a specific geographical area could be
adopted worldwide, due to inter-laboratory variability in assays results and to other sources of
variation (Stockham and Scott, 2008a).

14
CHAPTER 2:
Physiological changes during the transition
period

15
CHAPTER 2: PHYSIOLOGICAL CHANGES DURING THE TRANSITION
PERIOD
2.1 - Metabolic changes during transition
The transition period for dairy cows extends from approximately three weeks before parturition
until three weeks after parturition (Sordillo and Raphael, 2013). During this phase, physiological,
nutritional, metabolic, and immunologic changes occur as the cow leaves a gestational non-lactating
state, passes through the onset of milk synthesis and secretion, and finally reaches a more stable
lactation phase near peak lactation. In the weeks before parturition, the metabolism of the pregnant
cow has to face with the highest nutrient requirement of the foetus in a time where the dry matter
intake (DMI) decreases of 10-30% (Bell, 1995). In this phase, the suppression of cow appetite is
compounded by additional factors such as stress and management, which further reduce DMI
(Esposito et al., 2014). Leptin, a hormone that influence voluntary feed intake in ruminants, was
found decreased in late pregnancy of dairy cows (Wathes et al., 2007). At the same time the cow
experiences a physiologic increase of serum triglyceride and decreased cholesterol concentrations
likely due to the reduction in the udder uptake of triglyceride and to the increased use of cholesterol
for foetus development and steroid hormone synthesis (Turk et al., 2005). Moreover, an impairment
of the whole antioxidative system has been found during the pre-partum as shown by the reduced
paraoxonase-1 activity during this period (Turk et al., 2005). All these factors participate to the
negative energy balance. The main substrate for the synthesis of glucose in a moment of normal
energy demands in cow is represented by the propionate originating from rumen microbial
fermentation of feed carbohydrates. As a consequence of the reduced DMI intake during late
pregnancy, the energy requirement are partially met by an increased state of insulin resistance in
adipose tissue and muscle, coupled with an increased sensitivity to lipolytic agents (Bell, 1995);
these events reduce peripheral glucose uptake and facilitate the use of endogenous substrates,

16
mainly glucogenic amino acids (glutamine, alanine) from degraded endogenous protein sources,
and glycerol from adipose tissue mobilization (Sordillo and Mavangira, 2014).
The inflammatory and oxidative stress experienced during parturition (Turk et al. 2004), together
with the start of milk production, drive to another dramatic increase in energy requirements. At this
time the drop of plasma progesterone level, together with the transient estrogen and glucocorticoid
increase, contribute to the further decline in DMI (Drackley et al., 2005; Ingvartsen, 2006). The
imbalance between energy consumption and energy demand for production induces a physiologic
state of negative energy balance (NEB) (Grummer et al., 2004; Ingvartsen, 2006). To cope with the
decreased energy availability, further sources of energy must be mobilized from tissue stores to
support energy-dependent needs of the body, and adipose tissue is a major source for this. The
decrease in blood glucose level reflecting both high demands for the lactation and decreased DMI
results in lower insulin levels that, coupled with the elevation in growth hormone (GH)
concentration, further increases the lipolytic activity started before calving (Lucy et al., 2001;
Drackley et al., 2005; Ingvartsen, 2006). During lipolysis, non-esterified fatty acids (NEFA) are
cleaved from triglyceride molecules within adipocytes through the action of various hormone-
sensitive lipases. NEFA is then transported by albumin into the blood, where it can be used as an
energy source also initiating negative feedback loops to regulate the rate of lipolysis. When blood
NEFA concentration increases, NEFA are gradually taken up by the liver and can undergo complete
oxidation to carbon dioxide, incomplete oxidation to ketone bodies, or can be re-esterified and
stored as triacylglyceroles (Herdt, 2000; Bobe et al., 2004; Drackley et al., 2010). The overall
cumulative effect should result in relatively constant blood glucose concentration, which is needed
for milk synthesis without excessive NEFA accumulation in the blood. The determination of blood
concentration of NEFA and beta-hydroxybutyric acid (BOHB) is widely used in the monitoring of
the proper adaptation to NEB in dairy cows. Substantially, NEFA concentration reflects the use of
lipid sources whereas the peripheral concentration of ketone bodies, mainly BOHB, reflects the
ability of the liver to cope with the NEFA overload (Opsomer, 2015).

17
Finally, the process of metabolic adaptation to the increased energy requirements depends on
individual factors, environmental and management conditions (Jorritsma et al., 2003; Hammon et
al., 2009; van Dorland et al., 2009). Due to the genetic selection, modern cows are considered to
have a more adaptable metabolism that allows them to cope with NEB, giving at the same time the
possibility to reach a higher production target (Opsomer, 2015).
2.2 - Relationship between metabolism, oxidative stress and inflammation in transition cows
In recent years, researches concerning the transition period have been mainly focused on the
statement that metabolic and inflammatory pathways are strictly correlated and contribute to the
pathogenesis of both metabolic and infectious diseases occurring in transition cows (Sordillo and
Raphael, 2013). Different studies proved that both parturition and the onset of lactation are
responsible for the altered immune system of transition cows. It has been observed that in
mastectomized cows, compared to cows with intact mammary glands during the peri-parturient
period, only moderate increases in NEFA, no hypocalcemia, slight compromission of lymphocyte
and neutrophil function and a little impact on peripheral blood leukocytes number were found
(Kimura et al., 1999; Goff et al. 2002; Kimura et al., 2002a; Nonnecke et al., 2003). Changes in
glucose availability during the transition period may also have adverse effects on some bovine
immune responses. Leukocytes require glucose to support antimicrobial functions, thus the dramatic
decrease in blood glucose concentration during intense lipid mobilisation may limit the availability
for immune cells to work optimally (Sordillo and Mavangira, 2014). At the same time, the increased
requirement of glucose to support the inflammatory response in diseased cow may compete with the
energy requirement for production.
Also hyperketonemia can adversely affect several important immune functions leading to a possible
increased disease susceptibility in transition cows. BOHB has detrimental effect on leukocyte

18
antimicrobial mechanisms (Hammon et al., 2006) and may exacerbate injury to bovine hepatocytes
inducing oxidative stress that can in turn activate an inflammatory response (Shi et al., 2014).
Even if the clear effect on signalling pathways in bovine immune cells during transition is still not
known, some authors hypothesized that the progressive increase of NEFA concentration and the
changes in NEFA composition may affect the immune response of transition cows (Sordillo and
Mavangira, 2014). This is supported by the finding that the exposure to a composition of NEFA
similar to that present in the plasma of transition cows, resulted in a greater expression of pro-
inflammatory and adhesion molecules such as cytokines (IL-6, IL-8), I-CAM and V-CAM), ROS
(reactive oxygen species) production by endothelial cells (Contreras et al., 2012) and decreased
antibacterial activities of cultured neutrophils (Ster et al., 2012). Previous studies in dairy cows also
demonstrated that elevated NEFA during the peri-parturient period decrease lymphocytes’ secretion
of IFN-γ and IgM, molecules with anti-inflammatory properties (Lacetera et al., 2004); in contrast,
an activation of neutrophil phagocytosis, was found by Scalia et al. (2006).
The altered regulation of the inflammatory response experienced during the transition period is also
reflected by the changes in acute phase proteins (APP), molecules whose liver production and
release is influenced by inflammatory mediators (IL-1, IL-6, TNFα) which lead to a huge variation
of their concentration during the acute phase response. Evaluation of plasma concentration of APPs
in animals is thus an excellent tool to determine the presence of an inflammatory status, and it is
gaining increasing interest also due to the low cost and availability of laboratory tests. According to
their changes during the acute phase of inflammation, APPs in cattle may be defined as positive if
their concentration increases, for example serum amyloid A (SAA), haptoglobin (Hb) and
ceruloplasmin (Cp), and negative, for example paraoxonase (PON-1) and albumin, (Petersen et al.,
2004, Giordano et al., 2013). Haptoglobin is produced by the liver under stimulation of IL-6 or
TNF-α. Increased concentration of serum Hp has been found to be associated with increased risk of
metritis and endometritis (Dubuc et al. 2010) and concomitant with the occurrence of retained
placenta (Huzzey et al., 2011). Lower concentrations of PON-1 and albumin and higher

19
concentration of Hp were found in association with transition disorders in a retrospective study on
dairy herds (Bertoni et al., 2008). Treatment with low oral dose of IFN-α, supposed to stimulate the
innate immune system, was shown to increase the plasma Hp and Cp concentration in a study
(Trevisi, 2009).
The oxidative stress in dairy cattle is also considered a contributing factor of dysfunctional
inflammatory response during the transition period (Sordillo and Mavangira, 2014). Reactive
oxygen species (ROS) such as oxide anion (O-2), hydrogen peroxide (H2O2), and hydroxyl radical
(OH-), are normal end products of the cellular metabolism responsible for the conversion of
nutrients in energy and the cellular oxygen-dependent defences against bacteria (Sordillo and
Mavangira, 2014). The generation of ROS has a critical role in the regulation of normal cellular
processes, including the regulation of inflammation, but excessive ROS production can cause
damage to lipids, DNA, proteins, and other macromolecules. The regulation of ROS concentration
requires the action of enzymatic (cytosolic glutathione peroxidase) and non-enzymatic antioxidants
(e.g. glutathione and vitamin E) that directly catalyse or indirectly favour, respectively, the
reduction of ROS to less reactive molecules (Sordillo and Aitken, 2009). The increased oxygen
requirements during increased metabolic demands, as occurs in the transition period, result in
increased production of ROS in a time when the total antioxidant potential of sera is reduced
(Sordillo et al., 2007). Immune cells are particularly sensitive to oxidative stress because their
membranes contain high concentration of polyunsaturated fatty acids that are very susceptible to
peroxidation (Sordillo and Mavangira, 2014). Increased concentrations of hydroperoxides, and of
other derivatives of reactive oxygen metabolites (dROMs) are important risk factor for disorders
occurring in the transition period as ketosis, fatty liver, mastitis, and retained placenta (Sordillo and
Raphael, 2013). The role of PON-1 as an antioxidant was suggested by Turk et al. (2004). Increased
concentrations of d-ROMs were found in cows with the lowest levels of PON-1 during the first two
weeks of lactation (Bionaz et al., 2007) when concentrations of HDL-cholesterol, the carrier of
PON-1, is reduced (Turk et al., 2004).

20
CHAPTER 3:
Diseases of the transition period

21
CHAPTER 3: DISEASES OF THE TRANSITION PERIOD
3.1 – Introduction
Due to the strict relationship between metabolism, immunity and oxidative status in the transition
period, as described before, the term ‘production disease’, traditionally regarding the metabolic
disorders of dairy cows (namely hypocalcaemia and ketosis) has been now broadened to infectious
diseases and other diseases such as retained placenta, displacement of the abomasum and the
laminitis (Mulligan and Doherty, 2008). All these conditions have the highest incidence in the
period from calving until 10 days after calving (Ingvartsen et al., 2003). These diseases, especially
ketosis and retained placenta are opener to further uterine and udder diseases. A description of the
main diseases occurring during transition are reported in the following paragraphs.
3.2 - Clinical and subclinical hypocalcaemia
Conditions frequently observed in dairy farm are subclinical and clinical hypocalcemia (also known
as milk fever). Subclinical conditions may have an incidence of 33% in dairy farms (increasing to
about 50% if considering only pluriparous cows) whereas the clinical form has usually a lower
incidence, limited to 3 - 5% (Mulligan and Doherty, 2008). Primiparous cows seem not to be less
exposed to hypocalcemia around calving than multiparous cows. The pathogenesis is supposed to
be linked to a reduced response of gut and bones to parathyroid hormone (PTH) due substantially to
a reduced expression of receptors for this hormone on target cells at the moment of increased
calcium demand such as at beginning of lactation. This condition seems to be enhanced by an
excessive calcium (or vitamin D) supplementation in the diet before parturition (Rosol and Capen,
1997). The clinical form is characterized by a different severity of clinical signs ranging from mild
excitement, anorexia and weakness to more severe lateral recumbency, gastrointestinal atony, and
difficulty to perceive pulse, always accompanied by hypocalcemia and hypophosphatemia, within

22
72 hours from calving (Kelton et al., 1998). Other clinical pathological changes vary depending on
the stage of disease and may be represented by increased or decreased concentration of magnesium,
increased hepatic and muscle enzymes. When hematological abnormalities are present they may
consist with a neutropenia, in the first phase of disease, or with a stress leukogram in more
advanced conditions. The subclinical form of hypocalcemia is characterized by a reduced
concentration of serum calcium without clinical signs (Roche, 2003; Martinez et al., 2012). These
latter authors suggested different cut-offs to consider a condition as subclinical (ranging from 8.02
to 8.59 mg/dL). Both subclinical and clinical hypocalcemia have been correlated with dystocia,
uterine prolapse, retained placenta, endometritis, infertility, mastitis, displaced abomasum, ketosis
and immunosuppression (Mulligan and Doherty, 2008).
3.3 - Clinical and subclinical ketosis
Ketosis in dairy cows is a metabolic disturbance associated with NEB and characterized by
abnormally elevated concentration of the ketone bodies acetoacetic acid (AcAc), acetone (Ac), and
β-hydroxybutyric acid (BOHB) in the body tissues and fluids (Opsomer, 2015). The clinical signs
include reduced appetite, excessive loss of body weight, reduced milk yield, ketone odour in the
breath or milk, hard or dry faeces, reduced motility and, in severe cases, a variety of neurological
signs. Ketosis is classified as clinical or subclinical based on levels of ketone bodies in the blood,
urine, and milk and the presence or absence of clinical signs. In literature are reported many
different cut-off values for BOHB concentration in blood (Opsomer, 2015). As an example, Oetzel
(2004) proposed to adopt specific intervention in order to prevent ketosis when more than 10% of
cows between 5 and 50 days after parturition have BOHB higher than 1400 µmol/L, while a cut-off
of 3000 µmol/L is more suggestive of a clinical condition. Ketosis may increases the risk and
severity of the occurrence of other diseases during lactation. The relative risk associated with
subclinical ketosis, in a recently published meta-analysis was calculated in terms of odd ratio and it

23
was found as 3.33 for left abomasal displacement, 5.38 for clinical ketosis, 1.92 early culling and
death, 1.75 for metritis, 1.52 for placental retention, 1.61 for clinical mastitis, 2.01 for lameness,
and 1.42 for doubling of the somatic cell count. In the same work, the milk losses on 305 milking
days, associated with subclinical ketosis were about 251 kgs (Raboisson et al., 2014).
3.4 - Left-displaced abomasum
The shift of the abomasum to the left abdominal space, left-displaced abomasum or LDA, is a
disorder frequently observed in early postpartum cows that in some circumstances may cause overt
clinical signs, characterized by decreased appetite accompanied by an audible, high pitched
tympanic resonance (ping) produced by percussion of the left abdominal wall between the 9th and
12th ribs (Kelton et al., 1998). The pathogenesis is multifactorial with hypocalcemia, metritis,
negative energy balance, and nutritional errors being predisposing factors (Esposito et al. 2014).
BOHB and aspartate aminotransferase (AST) activity in the blood, both parameters associated with
NEB of post- partum cows, may be used to predict the development of LDA but with low
sensitivity and specificity (Esposito et al., 2014).
3.5 - Subacute ruminal acidosis
Subacute (or sub-clinical) ruminal acidosis is a common digestive problem in high-producing dairy
herds. Producers respond to the demands for increased milk production with higher grain, lower
fibre diets that maximize energy intake during early lactation. The combined action of a slower
adaptation of rumen to the higher supplementation of early lactation diet, and a higher concentrate
intake around parturition may lead to subacute ruminal acidosis (SARA) characterized by a ruminal
pH lower than 5.5, a value at which rumen function is depressed (Esposito et al., 2014). This
condition has a reported prevalence of 10% to 26%, it has been implicated in the aetiology of
laminitis, low BCS, reduced feed intake, abomasal displacement and inflammation (Esposito et al.,

24
2014). The effect on these conditions seems to be related to a reduced insulin secretion, increased
cortisol secretion and reduced phagocytic and migration capacity of neutrophils (Esposito et al.,
2014).
3.6 – Mastitis
Mastitis is one of the most prevalent and costly diseases in the high- producing dairy herds with
losses attributable to reduced milk production, discarded milk, early culling, veterinary services,
and labor costs (Moyes et al., 2009). Typically, mastitis is an inflammation of the mammary gland
most often due, but not limited to, bacterial infections and is characterized by the movement of
leukocytes and serum proteins from the blood to the site of inflammation. It contributes to
compromised milk quality and the potential spread of antimicrobial resistance if antibiotic treatment
is not astutely applied. Mastitis can be classified as subclinical or clinical depending on the presence
of clinical signs. During subclinical mastitis, somatic cell counts (SCC) in milk are usually elevated,
milk production is decreased, inflammation occurs with or without the presence of an
intramammary pathogen and no abnormalities in the milk or gland are observed. Clinical mastitis is
characterized by an elevated SCC in milk and visual signs of inflammation such as clumpy, watery,
bloody, or yellowish milk, and an intramammary pathogen may be isolated. Clinical mastitis may
cause a decrease in DMI, swelling of the udder and, in extreme cases, septicemia or endotoxemia
that can cause death (Moyes et al., 2009).
3.7 - Uterine diseases
After parturition, uterine involution, regeneration of the endometrium, elimination of bacterial
contamination of the uterus and the return of ovarian cyclical activity are necessary for the cow to
conceive again. Clinical and subclinical uterine diseases are thus associated with sub-fertility and
infertility such as prolonged interval from calving to first insemination or conception, and failure to

25
conceive. As proposed by Sheldon et al. (2008) uterine diseases may be classified as puerperal and
clinical metritis, or as clinical and subclinical endometritis according to the presence of systemic
illness, the presence and characteristic of the vaginal discharge and the cytological characteristics of
the endometrium. Metritis is a more severe condition requiring more rapid diagnosis and systemic
treatments. When an animal is found with abnormal enlarged uterus and a fetid watery red-brown to
suppurative uterine discharge within 21 days after parturition, is considered to have metritis. The
absence or the presence of systemic illness, such as decreased milk yield, dullness or other signs of
toxaemia, fever >39.5 °C, is then used to classify the severity of the disease. Clinical endometritis is
defined by purulent or mucopurulent uterine discharge detected in vagina 21 to 26 days after
parturition; finally, subclinical endometritis is defined as more than about 10% of neutrophils in
uterine cytological samples collected in the five weeks after parturition in an animal without uterine
swelling and clinical signs of endometritis. The risk factors for uterine infection include retention of
the placenta, the calving environment, twins, dystocia, and diet, whereas microbial contamination of
the calving environment is less well established as a predisposing factor for infection of the uterine
lumen (Sheldon et al., 2009).
Comprlessively, clinical metritis may occur in 36% to 50% of cows at the herd level, with about
20% of animals having metritis with signs of systemic illness such as pyrexia. Three weeks after
parturition, about 20% of cattle have clinical persistent disease (endometritis), and about 30% have
chronic inflammation of the uterus without clinical signs of uterine disease (subclinical
endometritis) (Sheldon et al., 2009).
3.8 - Retained placenta
Retained placenta (RP) is defined as fetal membranes not expelled after parturition. The time
interval to classify a cow as affected by RP varies with the different studies (Fourichon et al., 2000).
Membranes can be retained for 7 days or more if a treatment is not administered (Paisley et al.,

26
1986). This condition causes huge economic losses since it predisposes to metritis and mastitis
(Laven and Peters, 1996; Dubuc et al., 2010), even if no association with milk yield has been found
and effects on subsequent fertility are debated (Laven and Peters, 1996). The pathogenesis of this
syndrome reflects the multifactorial process leading to normal delivery of the placenta. Metabolic,
immunological and endocrine alterations are, independently or together, potential gateways to RP
(Beagley et al., 2010). The normal release of fetal membranes require the proper activation of an
immune response since endometrial leukocytes, mainly neutrophils and macrophages, are involved
in the breakdown of the collagen link at the foetus-maternal interface (Beagley et al., 2010).
Negative energy balance may play a role in the occurrence of RP, as a high concentration of ketone
bodies is known to interfere with leukocyte activities (Scalia et al., 2006). Even if increased NEFA
and BOHB concentration 7 days after parturition were found to be associated with the occurrence of
RP (Seifi et al., 2007), no differences in these metabolites were found in the days before calving,
suggesting that the metabolic milieu preceding the parturition is similar for both cows that will
retain and cows that will not retain the fetal membranes. Anyway, leukocytes from cows with RP
show, around the time of parturition, a decreased chemotaxis (Gunnink, 1984a; Gunnink, 1984b;
Gunnink 1984c; Gunnink 1984d) and a decreased phagocytic activity (Kimura et al., 2002b),
confirming the role of a defective immune system in the occurrence of RP. The antioxidant capacity
may also affect the proper release of the fetal membranes. This is also suggested by lower
prepartum level of superoxide dismutase found in cows with RP (Beagley et al., 2010) and by the
beneficial effect of vitamin E supplementation in reducing the occurrence of RP (Bourne et al.,
2007). The role of hypocalcaemia as a predisposing factor to RP is still debated. Even if
hypocalcaemia may predispose to dystocia and may interfere with the final stage of placental
release, interfering with uterine contractions, no differences were found in RP incidence when cows
were supplemented with oral calcium or not (Beagley et al., 2010). Despite the presence of an
extensive literature, the pathogenesis of RP is still largely unknown (Beagley et al., 2010).

27
CHAPTER 4:
Aims of the study

28
CHAPTER 4: AIMS OF THE STUDY
The general aim of this PhD thesis is to determine a diagnostic approach, using methods and
techniques usually employed in veterinary clinical pathology, to investigate and monitor the health
status of cows in the transition period, paying a special attention to some of the diseases that usually
affect cows in this very sensitive period. As previously stated, the transition period is a crucial
period for dairy cows as both reproductive and productive challenges are in course. The
management of the dry period, the hormonal changes near parturition and the following metabolic,
inflammatory and oxidative challenges occurring before and after parturition drive the cow through
a period of substantially low energy availability. All these factors predispose to the occurrence of
different subclinical conditions that often represent the initial phases of more overt diseases
frequently observed mainly in early lactation. Both subclinical and clinical diseases directly or
indirectly affect the productive and reproductive outcome of the affected cows, leading to evident
economic losses and increased use of drugs. The presence of a not identified subclinical condition
has more detrimental effects on the herd health, as it may lead to a delay in the proper nutritional or
management intervention necessary to ameliorate the health of the farm. In this context the clinical
pathologist may help farmers and clinicians to develop strategies to prevent, identify, and control
subclinical diseases affecting dairy cows through the use of laboratory analysis.
The identification of abnormal hematological or biochemical results first requires the knowledge of
which results may be considered as ‘normal’. The chapter 5 describes a study that was conducted
to establish reference intervals for healthy high producing dairy cows around 3 and 30 days after
calving. In this study the possible influence of variables such as herd, distance from parturition and
parity, was also examined. The results obtained from this study were then applied to interpret data
from further studies. In literature in fact, there are several publications reporting reference intervals
of the most common analytes in cows, but none of them has compared results obtained at
parturition and one month later for a huge panel of analytes as it has been done in the present thesis.

29
The retained placenta is one of the most debated diseases of the peri-partum in cows. Besides the
variable occurrence of this condition (the incidence is variable depending on farm and, within a
farm, also among different years), and the demonstrated predisposing role for productive and
reproductive issues, its pathogenesis and the related hematological variations are still largely
unknown. The identification of a specific pattern associated with the occurrence of the disease
could have beneficial effects in the timely intervention and could be useful to recommend new
strategic treatments. The second aim of this thesis, covered in chapter 6, was thus the evaluation of
the possible laboratory changes that may be associated with or that may be predisposing for
retention of the fetal membranes around calving. The first part of the work (section 6.1) concerned
a retrospective analysis of data regarding hematological and biochemical parameters, acute phase
proteins and markers of oxidative stress on samples obtained soon after parturition from high
producing cows with and without retained placenta. In the second section of the chapter (6.2), a
prospective study was focused on the hematological variations occurring around calving in cows
with retained placenta and in cows that normally expelled the placenta, in order to explore the
dynamics of these changes and the possible relationship with the pathogenesis of the disease.
As stated above, veterinary clinical pathology may also have a role in the prevention and
monitoring of subclinical diseases and in the evaluation of efficacy of specific treatments. Results
from these investigations are presented in chapter 7, where a systematic screening for sub-clinical
ketosis during the transition period was performed. The measurement of the blood levels of BHOB
and NEFA, eventually followed by ad hoc treatment with propylene glycol, calcium propionate,
betaine, niacin and molasses and by selective treatment with calcium, was adopted to monitor the
morbidity and incidence of milk fever, retained placenta, metritis and displaced abomasum during
the post-partum period.

30
CHAPTER 5:
Reference intervals for hematological and
biochemical parameters, acute phase proteins,
and markers of oxidative stress in holstein
dairy cows at 3 and 30 days post-partum

31
CHAPTER 5: REFERENCE INTERVALS FOR HEMATOLOGICAL AND
BIOCHEMICAL PARAMETERS, ACUTE PHASE PROTEINS, AND MARKERS
OF OXIDATIVE STRESS IN HOLSTEIN DAIRY COWS AT 3 AND 30 DAYS
POST-PARTUM
5.1. Introduction
The first step in determining the health status of an animal through the evaluation of blood analytes
is the comparison of laboratory results with a set of reference values representing healthy animals.
Population-based reference intervals (RIs) have become one of the most commonly used tools
employed in the clinical decision-making process (Horn and Pesce, 2005).
Recently, the American Society for Veterinary Clinical Pathology (ASVCP) has established the
guidelines for the determination of de novo reference intervals in veterinary species (Friedrichs et
al., 2012). The establishment of specific RIs is advisable when different metabolic status, habits,
gender, ages and breeds in the patient population are present, or when existing RIs are not suitable
for the laboratory’s patient population (Lefebvre, 2011; Friedrichs et al., 2012;).
As known, soon after parturition, the lactation in cows is characterized by the start of homeostatic
mechanisms that have to maintain proper blood nutrients concentration in order to sustain the
increased needs for synthesis of colostrum and milk (Goff et al., 2008; Bertoni et al., 2009; Bertoni
and Trevisi, 2013). These increased energy requirements, often associated with a decline of food
intake during late gestation, generally result in a state of negative energy and protein balance that
persists for the first weeks of lactation (Bell, 1995; Grummer et al., 2004; Ingvartsen, 2006).
Moreover, this period is characterized by an altered immune system function that predisposes the
cows to different pathological conditions (Goff, 2006; Kehrli et al., 2006). As a matter of fact, most
metabolic diseases, including milk fever, ketosis, abomasal displacement, and retained placenta
primarily affect cows within the first two weeks of lactation (Fronk et al., 1980; Erb et al., 1984;

32
Drackley 1999, Heuer et al., 1999) while metritis, mastitis and lameness are diagnosed mostly
within the first month of lactation (Erb et al., 1984; Kinsel et al., 1998). Four weeks after calving,
even if the homeostatic processes are not yet terminated, healthy dairy cows show a more balanced
metabolic condition that will allow them to reach the lactation peak (Opsomer, 2015). It is well
known that lactation stage and the presence of subclinical problems are factors that may determine
variations in metabolic and inflammatory profiles (Bionaz et al., 2007; Bertoni et al., 2008; Cozzi et
al., 2011;). Consequently, laboratory results obtained from a heterogenic population of lactating
cows, regerdless the lactation stage, will probably generate wider RIs leading to misdiagnosis when
these RIs are adopted to identify abnormalities in a specific lactation moment. The introduction of
new technologies makes problematic the use of reference values generated in the past (Lumsden et
al., 1980; Roussel et al., 1982; Dubreil et al., 1997). Moreover, only few recent works were focused
on the establishment of biochemical and haematological reference limits for transition cows
(Quiroz-Rocha et al., 2009; Cozzi et al., 2011; Brscic et al., 2015). The present study was realized
in order to define specific reference intervals for hematological and biochemical variables in a
population of clinically healthy lactating Holstein cows sampled around 3 and 30 days in milk
(DIM) selecting results from a database concerning a three years period.
5.2 - Material and methods
5.2.1 Retrospective analysis of the database
This study started with a retrospective search of data recorded in the database of the ProZoo project,
a research project aimed to investigate the relationship between genomic traits and bovine health
and production. The ProZoo database lists information about production, reproduction, and health
status, including results of blood samplings recorded over a 3 year period (from June 2010 to
February 2013) from 4 intensive farms in the area of Lodi (Lombardy region, Italy). The evaluated
herds had 265, 415, 423 and 206 milking cows respectively; a mean (±SD) days in milk (DIM)

33
duration of 304 (±37), 321 (±35), 311 (±37) and 318 (41); a mean (±SD) normalized production at
305 days of 9577 (±1794), 10404 (±1953), 10278 (±1965), 9319 (±1851) kilograms of milk
respectively for herd A, B, C, and D. All the cows were fed with a TMR (total mixed ration).
Milking was performed twice a day, at 12 h intervals.
The database was searched in order to select data corresponding to cows that fulfilled the following
inclusion criteria.
- availability of data about the complete blood count (CBC), biochemical profile, serum
protein electrophoresis, and markers of inflammation/oxidative stress at 3±1 DIM and 30±3 DIM;
- negative history for any clinical disease or laboratory abnormality during the gestation
period and normal parturition course;
- no clinical events or abnormal laboratory results during the first month of lactation;
- no anti-inflammatory or antibiotic treatments administered in the days before collection of
blood samples;
- average production adjusted for 305 days during the lactation period included in this study:
≥7.000 kg;
- lactation period of at least 200 days.
Exclusion criteria were:
- the absence of at least one of the above mentioned inclusion criteria
- samples characterized by evidence of lipemia, hemolysis or icterus or by the presence of
visible clots in samples collected in EDTA for routine hematology.
A complete clinical examination, included the record of body condition score (BCS), was
performed in the first days after calving and at the time of the gynecological visits performed at the
end of the first month of lactation.

34
5.2.2 Blood sampling
In all the animals included in this study, peripheral blood samples were collected at 3±1 DIM and at
30±3 DIM. Specifically, 30 mLs of venous blood were collected from the jugular vein: 10 mLs of
blood were placed in plain tubes (Venosafe plastic tubes for serum, Terumo, Europe) to perform
routine biochemistry, 10 mLs were placed in tubes with EDTA (Venosafe plastic tubes for
hematology, Terumo, Europe) to perform routine hematology, and 10 mLs were placed in tubes
with lithium heparin (Venosafe plastic tubes for plasma, Terumo, Europe) for the measurement of
acute phase proteins (APPs) and of analytes associated with oxidative stress metabolism.
All the samples were immediately placed at 4 °C and submitted to the Central Laboratory of the
Veterinary Teaching Hospital of the University of Milan where routine hematology was performed
as described below. Plain tubes and tubes with lithium heparin were immediately centrifuged at
2,200 x g for 10 minutes upon arrival at the lab. Harvested heparinized plasma and sera were then
frozen at -80°C for a maximum of 3 months before biochemical tests were performed.
5.2.3 Routine hematology
Routine hematology was performed using an automated laser hematology analyzer (ADVIA 120
with multispecies software for veterinary use, Siemens Healthcare Diagnostics, Milan, Italy). The
leukocyte differential provided by the instrument was checked microscopically on blood smears
prepared upon arrival of the sample at the laboratory and stained with a modified Romanowsky
stain (Dif-stain kit, Titolchimica S.P.A., Rovigo, Italy). Only samples without visible clots were
processed.
5.2.4 Clinical chemistry and serum protein electrophoresis

35
Routine biochemical analyses were run on serum or plasma with automated spectrophotometers
(ILAB300 plus and ILAB600, Instrumentation Laboratory S.p.a., Milan, Italy) using reagents
provided by the manufacturer of the instruments, except when otherwise specified. The following
analytes were measured: alkaline phosphatase (ALP, kinetic IFCC method), aspartate
aminotransferase (AST, kinetic IFCC method), calcium (orthocresoftaleine method), creatinine
(Jaffè method), total proteins (biuret method), albumin (bromochresol green method), total bilirubin
(diazo reactive with sulphanilic acid), glucose (GOD-POD method), total cholesterol (cholesterol
oxidase method), urea (urease method), phosphate (phosphomolibdate method), γ-glutamyl
transferase (GGT, kinetic IFCC method), zinc (colorimetric with Nitro-PAPS), sodium, potassium
and chloride (ion selective electrodes method), non-esterified fatty acid (NEFA, ACS-ACOD
method, Wako Chemicals GmbH, Neuss, Germany), β-hydroxybutyrate (BOHB, D-3-
Hydroxybutyrate dehydrogenase method, Randox Laboratories Ltd., Crumlin, Co. Antrium, UK),
fructosamine (Randox Laboratories Ltd., Crumlin, Co. Antrium, UK).
Serum protein electrophoresis was performed on agarose gel using the automated analyzer Hydrasis
(Sebia Italia Srl, Bagno a Ripoli, Florence, Italy) and the specific manufacturer's reagents (Hydragel
15 β1-β2, Sebia Italia Srl) following the procedure described in another study (Paltrinieri et al.,
2014). Absolute concentrations (g/L) for each electrophoretic fraction were calculated based on
total serum protein and on the percentage of the area under each peak.
5.2.5 Acute phase proteins (APPs) and other markers of inflammation and oxidative stress
Heparinized plasma was periodically sent to the Institute of Zootechnics (Università Cattolica del
Sacro Cuore, Piacenza), to measure the markers of inflammation and oxidative stress:
ceruloplasmin (Cp) with the method described by Sunderman and Nomoto (1970); haptoglobin
(Hp), using the method described by Skinner et al. (1991); paraoxonase-1 (PON-1) with the method
described by Ferré et al. (2002); derivates of reactive oxygen metabolites (d-ROMs) using the Kit

36
“d-ROMs Test” from Diacron International S.r.l. (Grosseto, Italy); thiol groups (SHp) measured
using a specific colorimetric kit (Diacron International S.r.l.); myeloperoxidase (MPO) determined
through a colorimetric method described by Bradley et al. (1982). These methods were run on
plasma with an automated spectrophotometer (ILAB 600, Instrumentation Laboratory S.p.a., Milan,
Italy).
Moreover, plasma retinol, tocopherol and β-carotene were detected in accordance to the procedure
described by Trevisi et al., 2013. Briefly, vitamins were extracted from plasma with hexane and
analyzed by reverse-phase HPLC using Spherisorb ODS-2.3 µm, in a 150 × 4.6 mm column
(Alltech, Deerfield, IL); a UV detector set at 325 nm (for retinol) or 290 nm (for tocopherol) or 460
nm (for β-carotene); and 80:20 methanol: tetrahydrofurane as the mobile phase.
5.2.6 Establishment of new RIs
Specific RIs were generated for the two sampling times (3±1 DIM and 30±3 DIM) using an Excel
spreadsheet with the Reference Value Advisor (v 2.1) set of macroinstructions (Geffré et al., 2011).
The software performs the following computations recommended by the International Federation of
Clinical Chemistry-Clinical and Laboratory Standards Institute (CLSI, 2008): descriptive statistics
(e.g. mean, median, SD, minimum and maximum values); tests of normality (Anderson–Darling
with histograms and Q–Q plots and Box–Cox transformation); outlier analysis. Both Dixon–Reed
and Tukey tests were used, and outliers classified as ‘suspected’ were retained, as recommended by
the ASVCP guidelines (Friedrichs et al., 2012), while far outliers were removed from the analysis.
RIs were calculated using standard and robust methods on both non-transformed and transformed
data. The software indicates the best method to define the RI based on data distribution. A non-
parametric bootstrap method was used to calculate the 90% confidence interval.
5.2.7 Statistical analysis and partitioning of RIs

37
For all the variables, the results at the two sampling times (3±1 DIM and 30±3 DIM) were
compared with a paired T-test or a Wilcoxon signed-rank test according to normality and
homogeneity of variance of the parameter. Within each sampling time (3±1 and 28±3 DIM), the
effect of herd (n=4) was evaluated by a Kruskal-Wallis test followed by a Bonferroni post-test
procedure whereas the effects of day of sampling (3 at 3±1 DIM and 7 at 30±3 DIM) and parity (1
vs 2 vs >2) were evaluated by regression analysis followed by Kruskal-Wallis test with Bonferroni
post-test procedure on significant results. For all the calculation the p-value was set at 0.05.
When statistically significant differences were found between the two sampling times, the Harris
and Boyd z-test (Harris and Boyd, 1990) was applied to verify the possible need to adopt separated
reference intervals.
Table 5.1: detail of the numbers of animals for herd and day of sampling finally included in the reference interval study Herd A Herd B Herd C Herd D TOTAL
n n n n n
3±1 DIM 37 41 39 28 145
2 DIM 14 20 13 13 60
3 DIM 14 10 15 5 44
4 DIM 9 11 11 10 41
30±3 DIM 37 41 39 28 145
27 DIM 4 8 2 3 17
28 DIM 6 6 8 5 25
29 DIM 4 6 6 4 20
30 DIM 12 7 9 4 32
31 DIM 5 8 9 5 27
32 DIM 5 5 4 4 18
33 DIM 1 1 1 3 6

38
5.3. Results
5.3.1 Characteristics of the reference sample group and new RIs
After adoption of inclusion and exclusion criteria, laboratory results from 145 Holstein dairy cows
from four different herds were included. Details of the number of animals sampled in each herd and
at each sampling time are reported in table 5.1. A lower number of samples was available for
routine hematology, due to the need to immediately process whole blood samples: samples in
EDTA that cannot be processed in the day of sampling were not included in the study. Similarly,
serum protein electrophoresis was performed on a lower number of samples, due to the insufficient
volume of serum available in the other cases. The median (min-max) BCS at 3±1 DIM were 3.25
(3-3.75), 3.5 (3-3.75), 3.5 (3-4), 3.25 (3-4) for herd A, B, C and D respectively. The median BCS at
30±1 DIM was 3.00 in all the herds (minimum and maximum values were 2.75-3.25 in herd A,
2.75-3.50 in herd B and C and 2.50-3.25 in herd D). No statistically significant differences between
herds were observed for BCS at both times whereas, as expected, in all the herds a significant
decrease in the BCS was observed according to time (P=0.000 for the four herds). The mean milk
production normalized at 305 days was significantly lower (P=0.000) in herd D (mean±SD
8831±516 kgs) compared to the other herds (10028 ±806, 10948±1176, 9845±903 kgs, and P values
of 0.017, 0.000, and 0.001 for herd A, B, and C respectively). A significantly lower (P=0.002) mean
DIM was found in herd B (mean±SD 298±29 days) compared to herd C (355±88 days with
P=0.011), and D (308±43 days with P=0.029) whereas herd A had a mean DIM of 312±40 days.
Finally, no differences were found in the means of the interval from partum to conception in the
four herds (mean±SD were 101±50, 81±25, 129±87, and 90±38 days for herd A, B, C and D
respectively).
39
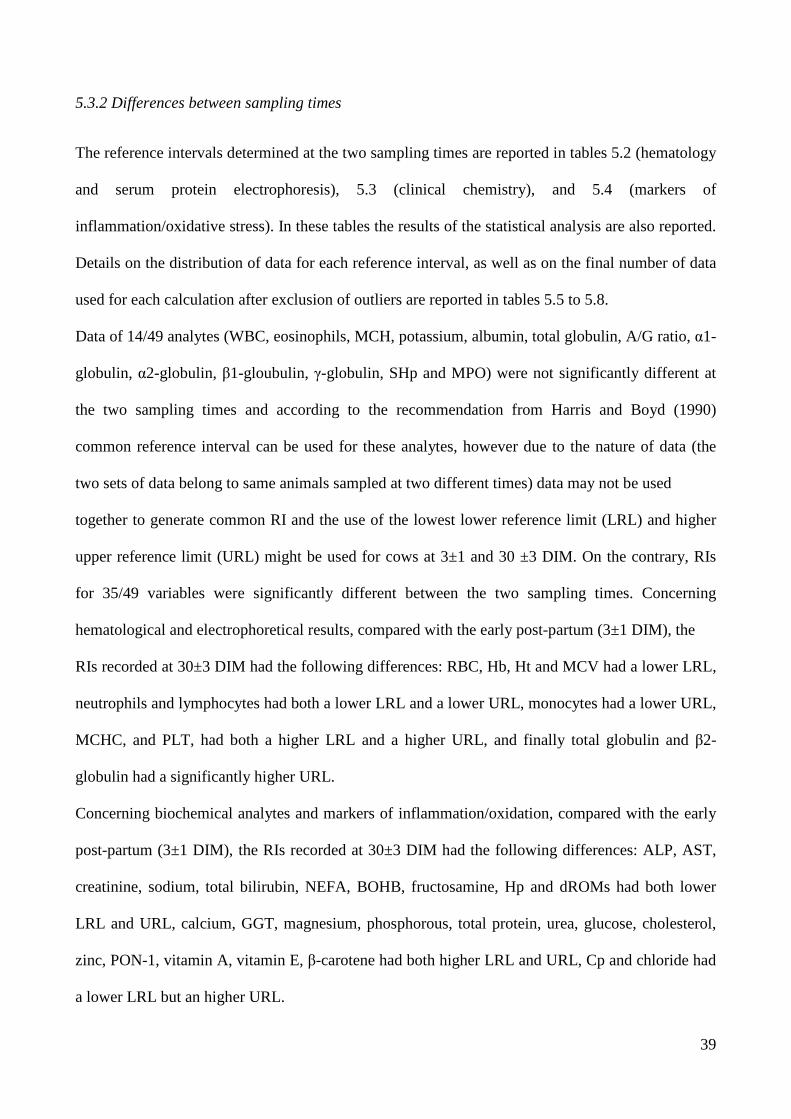
5.3.2 Differences between sampling times
The reference intervals determined at the two sampling times are reported in tables 5.2 (hematology
and serum protein electrophoresis), 5.3 (clinical chemistry), and 5.4 (markers of
inflammation/oxidative stress). In these tables the results of the statistical analysis are also reported.
Details on the distribution of data for each reference interval, as well as on the final number of data
used for each calculation after exclusion of outliers are reported in tables 5.5 to 5.8.
Data of 14/49 analytes (WBC, eosinophils, MCH, potassium, albumin, total globulin, A/G ratio, α1-
globulin, α2-globulin, β1-gloubulin, γ-globulin, SHp and MPO) were not significantly different at
the two sampling times and according to the recommendation from Harris and Boyd (1990)
common reference interval can be used for these analytes, however due to the nature of data (the
two sets of data belong to same animals sampled at two different times) data may not be used
together to generate common RI and the use of the lowest lower reference limit (LRL) and higher
upper reference limit (URL) might be used for cows at 3±1 and 30 ±3 DIM. On the contrary, RIs
for 35/49 variables were significantly different between the two sampling times. Concerning
hematological and electrophoretical results, compared with the early post-partum (3±1 DIM), the
RIs recorded at 30±3 DIM had the following differences: RBC, Hb, Ht and MCV had a lower LRL,
neutrophils and lymphocytes had both a lower LRL and a lower URL, monocytes had a lower URL,
MCHC, and PLT, had both a higher LRL and a higher URL, and finally total globulin and β2-
globulin had a significantly higher URL.
Concerning biochemical analytes and markers of inflammation/oxidation, compared with the early
post-partum (3±1 DIM), the RIs recorded at 30±3 DIM had the following differences: ALP, AST,
creatinine, sodium, total bilirubin, NEFA, BOHB, fructosamine, Hp and dROMs had both lower
LRL and URL, calcium, GGT, magnesium, phosphorous, total protein, urea, glucose, cholesterol,
zinc, PON-1, vitamin A, vitamin E, β-carotene had both higher LRL and URL, Cp and chloride had
a lower LRL but an higher URL.

40
5.3.3 Differences between herds, days of sampling, and parity group
Regression analysis revealed a few day-related differences at day 3±1 (eosinophils, AST, and
fructosamine) and 30±3 (lymphocytes, monocytes, and cholesterol) that, however, were not
supported by significant results at Kruskal-Wallis test. According to these findings, the adoption of
separated reference intervals for the two days of sampling was considered not necessary.
Conversely, the comparison of results between herds revealed, both at 3±1 DIM and at 30±3 DIM,
several differences that were significant according to both regression analysis and Kruskal-Wallis
test and all required a herd-specific RIs, according to the Harris and Boyd z-test. These include, at
3±1 DIM, RBC, WBC, AST, creatinine, potassium, sodium, NEFA, fructosamine, PON-1, d-
ROMs, SHp, vitamin A and β-carotene, and at day 30±3, HCT, RBC, Hb, MCH, MCHC, RDW,
lymphocytes, eosinophils, calcium, creatinine, potassium, magnesium, phosphorous, total proteins,
urea, zinc, NEFA, BOHB, fructosamine, Cp, Hp, d-ROMs, vitamin E and β-carotene. However, in
most cases the differences between single samplings were not univocal and/or not depending on a
specific difference between a single herd and all the others. This occurred only for phosphorous of
herd B at 30 ±3 DIM , for creatinine at 3±1 DIM and for chloride and potassium at 30 ±3 DIM in
herd C, for MCHC, total proteins, urea, zinc, and Cp of herd D at 30 ±3 DIM, that were different
compared with other herds.
Finally, significant effects according to parity were found only for eosinophils at 3±1 DIM and for
HCT, RBC, Hb, MCV, MCH, WBC, neutrophils, lymphocytes, eosinophils, ALP, calcium,
creatinine, potassium, phosphorous, total proteins, glucose, total bilirubin, PON-1 and vitamin A at
30±3 DIM. Except for eosinophils at 3±1 DIM and neutrophils, eosinophils, and total proteins at
day 30±3 DIM, all these variables had significant differences at Kruskal-Wallis comparison as
shown in tables 5.2 and 5.3 and in figure 5.1. Again, the differences between parity groups were not
univocal and/or not depending on a specific difference between one group and to all the others. This

41
occurred, at 30±3 DIM, only for WBC, ALP, calcium and creatinine of cows at first lactation and
for total bilirubin, PON-1, and vitamin A of cows with more than 3 lactations that, compared to the
other groups, were significantly higher and lower, respectively.
Figure 5.1: Laboratory parameters significantly different between parity groups. 1 = cows at first lactation; 2 = cows at second lactation; 3 = cows with three or more lactations. *P value <0.05
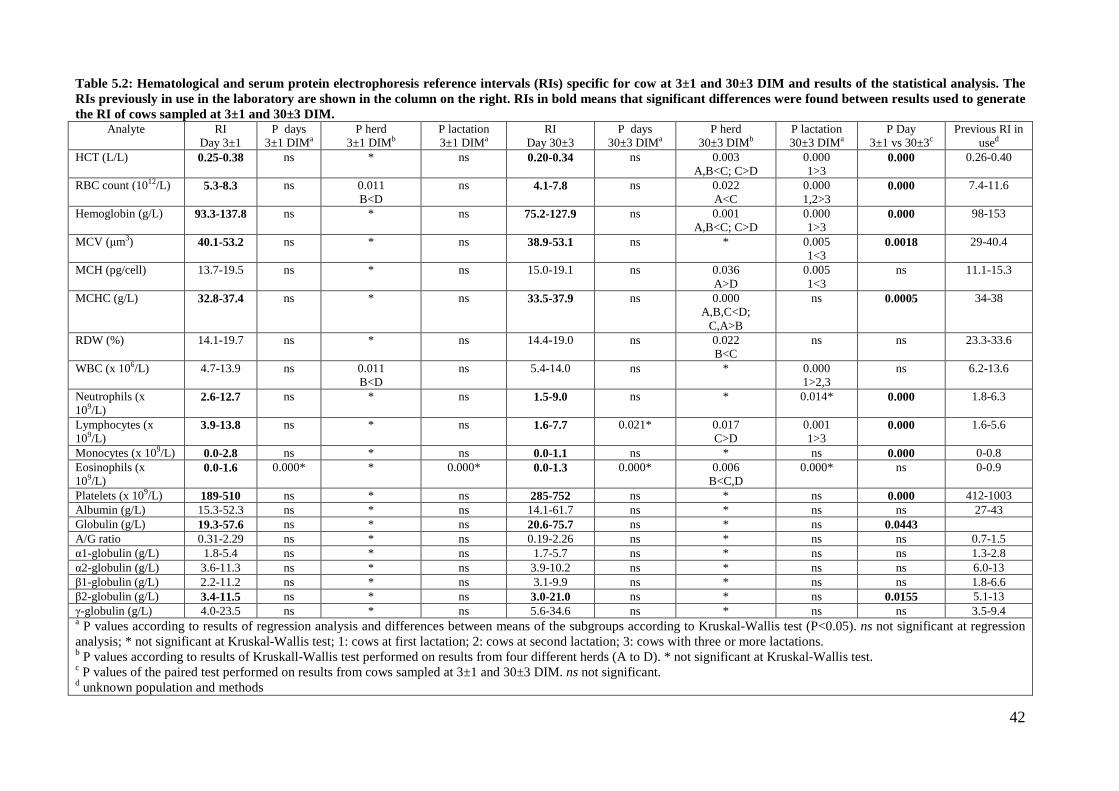
42
Table 5.2: Hematological and serum protein electrophoresis reference intervals (RIs) specific for cow at 3±1 and 30±3 DIM and results of the statistical analysis. The RIs previously in use in the laboratory are shown in the column on the right. RIs in bold means that significant differences were found between results used to generate the RI of cows sampled at 3±1 and 30±3 DIM.
Analyte RI Day 3±1
P days 3±1 DIMa
P herd 3±1 DIMb
P lactation 3±1 DIMa
RI Day 30±3
P days 30±3 DIMa
P herd 30±3 DIMb
P lactation 30±3 DIMa
P Day 3±1 vs 30±3c
Previous RI in used
HCT (L/L) 0.25-0.38 ns * ns 0.20-0.34 ns 0.003 A,B<C; C>D
0.000 1>3
0.000 0.26-0.40
RBC count (1012/L) 5.3-8.3 ns 0.011 B<D
ns 4.1-7.8 ns 0.022 A<C
0.000 1,2>3
0.000 7.4-11.6
Hemoglobin (g/L) 93.3-137.8 ns * ns 75.2-127.9 ns 0.001 A,B<C; C>D
0.000 1>3
0.000 98-153
MCV (µm3) 40.1-53.2 ns * ns 38.9-53.1 ns * 0.005 1<3
0.0018 29-40.4
MCH (pg/cell) 13.7-19.5 ns * ns 15.0-19.1 ns 0.036 A>D
0.005 1<3
ns 11.1-15.3
MCHC (g/L) 32.8-37.4 ns * ns 33.5-37.9 ns 0.000 A,B,C<D;
C,A>B
ns 0.0005 34-38
RDW (%) 14.1-19.7 ns * ns 14.4-19.0 ns 0.022 B<C
ns ns 23.3-33.6
WBC (x 106/L) 4.7-13.9 ns 0.011 B<D
ns 5.4-14.0 ns * 0.000 1>2,3
ns 6.2-13.6
Neutrophils (x 109/L)
2.6-12.7 ns * ns 1.5-9.0 ns * 0.014* 0.000 1.8-6.3
Lymphocytes (x 109/L)
3.9-13.8 ns * ns 1.6-7.7 0.021* 0.017 C>D
0.001 1>3
0.000 1.6-5.6
Monocytes (x 109/L) 0.0-2.8 ns * ns 0.0-1.1 ns * ns 0.000 0-0.8 Eosinophils (x 109/L)
0.0-1.6 0.000* * 0.000* 0.0-1.3 0.000* 0.006 B<C,D
0.000* ns 0-0.9
Platelets (x 109/L) 189-510 ns * ns 285-752 ns * ns 0.000 412-1003 Albumin (g/L) 15.3-52.3 ns * ns 14.1-61.7 ns * ns ns 27-43 Globulin (g/L) 19.3-57.6 ns * ns 20.6-75.7 ns * ns 0.0443 A/G ratio 0.31-2.29 ns * ns 0.19-2.26 ns * ns ns 0.7-1.5 α1-globulin (g/L) 1.8-5.4 ns * ns 1.7-5.7 ns * ns ns 1.3-2.8 α2-globulin (g/L) 3.6-11.3 ns * ns 3.9-10.2 ns * ns ns 6.0-13 β1-globulin (g/L) 2.2-11.2 ns * ns 3.1-9.9 ns * ns ns 1.8-6.6 β2-globulin (g/L) 3.4-11.5 ns * ns 3.0-21.0 ns * ns 0.0155 5.1-13 γ-globulin (g/L) 4.0-23.5 ns * ns 5.6-34.6 ns * ns ns 3.5-9.4 a P values according to results of regression analysis and differences between means of the subgroups according to Kruskal-Wallis test (P<0.05). ns not significant at regression analysis; * not significant at Kruskal-Wallis test; 1: cows at first lactation; 2: cows at second lactation; 3: cows with three or more lactations. b P values according to results of Kruskall-Wallis test performed on results from four different herds (A to D). * not significant at Kruskal-Wallis test. c P values of the paired test performed on results from cows sampled at 3±1 and 30±3 DIM. ns not significant. d unknown population and methods

43
Table 5.3: Reference intervals for biochemical parameters specific for cow at 3±1 and 30±3 DIM and results of the statistical analysis. The RIs previously in use in the laboratory are shown in the column on the right. RIs in bold means that significant differences were found between results used to generate the RI of cows sampled at 3±1 and 30±3 DIM.
Analyte RI Day 3±1
P days 3±1 DIMa
P herd 3±1 DIMb
P lactation 3±1 DIMa
RI Day 30±3
P days 30±3 DIMa
P herd 30±3 DIMb
P lactation 30±3 DIMa
P Day 3±1 vs 30±3c
Previous RI in used
ALP (U/L) 26-145 ns * ns 16-132 ns * 0.000 1>2,3
0.000 29-99
AST (U/L) 58.8-150.5 0.029* 0.022 A>C
ns 52.3-111.8 ns * ns 0.000 48-100
Ca (mmol/L) 1.60-2.54 ns * ns 1.92-2.70 ns 0.003 A<B,C
0.001 1>2,3
0.000 1.97-2.49
Creatinine (µmol/L) 70.7-130.2 ns 0.002 A,B,D>C
ns 61.9-106.1 ns * 0.001 1>2,3
0.000 0-141
GGT (U/L) 12.0-36.8 ns * ns 13.2-48.0 ns * ns 0.000 28-48 Cl (mmol/L) 87.0-102.8 ns * ns 81-103 ns 0.000
A,B,D>C ns 0.000 90-110
K (mmol/L) 2.7-4.7 ns 0.019 A<B
ns 2.5-5.0 ns 0.000 A,B,D>C
0.008 1<3
ns 4-5.3
Na (mmol/L) 126.0-144.0 ns 0.002 A>C,D; B>D
ns 123.3-143.0 ns * ns 0.000 135-155
Mg (mmol/L) 0.62-1.25 ns * ns 0.71-1.35 ns 0.018 C>D
ns 0.000 0.57-0.95
Phosphorous (mmol/L) 0.82-2.02 ns * ns 0.98-2.29 ns 0.002 B>A,C,D
0.017 1>3
0.000 1.48-2.9
Total proteins (g/L) 48.3-83.4 ns * ns 59.8-95.7 ns 0.000 A,B,C>D
0.002*
0.000 59-77
Urea (mmol/L) 1.67-4.45 ns * ns 2.21-6.95 ns 0.000 C>A,B,D; A>D
ns 0.000 2.27-7.5
Glucose (mmol/L) 2.85-4.81 ns * ns 3.18-4.90 ns * 0.020 1>2
0.0018 2.77-3.88
Cholesterol (mmol/L) 1.35-3.34 ns * ns 2.67-6.90 0.019* * ns 0.000 2.25-6.57 Zinc (µmol/L) 2.80-17.3 ns * ns 10.71-19.89 ns 0.003
A,B,C>D ns 0.0037 70-130
Total bilirubin (µmol/L) 1.03-19.45 ns * ns 0.51-6.10 ns * 0.001 1,2>3
0.000 1.71-5.13
NEFA (mmol/L) 0.16-1.63 ns 0.001 A>B,C
ns 0.09-0.89 ns 0.005 C>B,D
ns 0.000 0.4-0.8
BOHB (mmol/L) 0.38-1.71 ns * ns 0.26-1.12 ns 0.003 A,B<C
ns 0.000 0.03-0.3
Fructosamine (µmol/L) 135-228 0.016* 0.001 ns 113-210 ns 0.000 D>A,B; B<C
ns 0.000 na
a P values according to results of regression analysis and differences between means of the subgroups according to Kruskal-Wallis test (P<0.05). ns not significant at regression analysis; * not significant at Kruskal-Wallis test; 1: cows at first lactation; 2: cows at second lactation; 3: cows with three or more lactations. b P values according to results of Kruskall-Wallis test performed on results from four different herds (A to D). * not significant at Kruskal-Wallis test. c P values of the paired test performed on results from cows sampled at 3±1 and 30±3 DIM. ns not significant. d unknown population and methods

44
Table 5.4: Reference intervals for some markers of inflammation/oxidation specific for cow at 3±1 and 30±3 DIM and results of the statistical analysis. The RIs previously in use in the laboratory are shown in the column on the right. RIs in bold means that significant differences were found between results used to generate the RI of cows sampled at 3±1 and 30±3 DIM.
Analyte RI Day 3±1
P days 3±1 DIMa
P herd 3±1 DIMb
P lactation 3±1 DIMa
RI Day 30±3
P days 30±3 DIMa
P herd 30±3 DIMb
P lactation 30±3 DIMa
P Day 3±1 vs 30±3c
Previous RI in used
Ceruloplasmin (µmol/L) 2.35-4.98 ns * ns 1.35-5.23 ns 0.000 A<B,C,D
ns 0.000 na
Haptoglobin (g/L) 0.08-2.18 ns * ns 0.01-0.44 ns 0.000 A,D<B
ns 0.000 na
Paraoxonase-1 (U/mL) 46.3-135.0 ns 0.000 A,B<C,D
ns 63.2-183.9 ns * 0.002 1,2>3
0.000 na
dROMs (mg H2O2/100 mL)
9.4-24.2 ns 0.033 A>C
ns 7.0-21.5 ns 0.018 C<D
ns 0.000 na
Thiol groups (µmol/L) 226-522 ns 0.014 A>B,C
ns 240-517 ns * ns ns na
Myeloperoxidase (U/L) 262-742 ns * ns 310-634 ns * ns ns na Vitamin A (µg/100 mL) 16.6-68.0 ns 0.000
A,B<C,D ns 22.9-87.4 ns * 0.002
2<3 0.000 na
Vitamin E (µg/mL) 0.36-3.92 ns * ns 1.02-5.86 ns 0.012 B<C
ns 0.000 na
Beta-carotene (mg/100 mL)
0.03-0.24 ns 0.000 A,B<C,D;
A<B
ns 0.05-0.27 ns 0.000 A,B<C,D
ns 0.0001 na
a P values according to results of regression analysis and differences between means of the subgroups according to Kruskal-Wallis test (P<0.05). ns not significant at regression analysis; * not significant at Kruskal-Wallis test; 1: cows at first lactation; 2: cows at second lactation; 3: cows with three or more lactations. b P values according to results of Kruskall-Wallis test performed on results from four different herds (A to D). * not significant at Kruskal-Wallis test. c P values of the paired test performed on results from cows sampled at 3±1 and 30±3 DIM. ns not significant. d unknown population and methods

45
Table 5.5: Descriptive statistics of hematological reference intervals for cows at 3±1 DIM. Number of reference values included, mean, standard deviation, median, minimum, maximum, RI, number of outliers, confidence intervals of the lower and upper reference limits, distribution of data and method employed to generate the reference interval.
Analyte SI Units N Mean SD Median Min Max RI Outliers Lower Ref Lim
90% CI
Upper Ref Lim
90% CI
Dist. Method
HCT L/L 126 0.31 0.03 0.31 0.24 0.39 0.25-0.38 1S 0.24-0.27 0.37-0.39 G NP
RBC count 1012/L 126 6.7 0.7 6.7 4.8 8.5 5.3-8.3 2S 4.8-5.7 7.8-8.5 G NP
Hemoglobin g/L 126 114.7 11.0 114.5 87.0 141.0 93.3-137.8 0 87-96 133-141 G NP
MCV µm3 126 47.0 3.1 46.6 39.9 54.8 40.1-53.2 0 39.9-42.4 52.9-54.8 G NP
MCH pg/cell 126 17.1 1.3 17.2 12.7 19.9 13.7-19.5 3 12.7-14.7 19.3-19.9 G NP
MCHC g/L 126 35.2 1.2 35.0 29.6 38.2 32.8-37.4 2S 29.6-33.6 37.1-38.2 NG NP
RDW % 125 16.7 1.2 16.7 13.7 20.1 14.1-19.7 3S, 1R 13.7-15.1 18.9-20.1 NG NP
WBC 109/L 126 9.4 2.6 9.4 3.4 17.1 4.7-13.9 0 3.4-5.4 13.2-17.1 G NP
Neutrophils 109/L 126 7.3 2.7 7.3 2.0 13.3 2.6-12.7 0 2.0-3.2 11.7-13.3 G NP
Lymphocytes 109/L 126 8.4 2.7 8.4 2.6 15.3 3.9-13.8 0 2.6-4.6 12.5-15.3 G NP
Monocyte 109/L 125 1.0 0.7 0.9 0.0 3.4 0.0-2.8 1S, 1R 0.0-0.0 2.1-3.4 NG NP
Eosinophils 109/L 125 0.3 0.4 0.2 0.0 1.8 0.0-1.6 1S, 1R 0.0-0.0 1.1-1.8 NG NP
Platelets (optical) 109/L 125 339 87 337 40 550 189-510 1S, 1R 40-218 474-550 G NP
S: suspected outliers; R: removed outliers; G: Gaussian distribution of data; NG: non-gaussian distribution of data; NP: nonparametric method.

46
Table 5.6: Descriptive statistics of biochemical reference intervals for cows at 3±1 DIM. Number of reference values included, mean, standard deviation, median, minimum, maximum, RI, number of outliers, confidence intervals of the lower and upper reference limits, distribution of data and method employed to generate the reference interval.
Analyte SI Units N Mean SD Median Min Max RI Outliers Lower Ref Lim
90% CI
Upper Ref Lim
90% CI
Dist. Method
ALP U/L 131 69 28 64 17 166 26-145 1S 17-35 121-166 NG NP
AST U/L 129 86.7 20.4 82.0 52.0 164.0 58.8-150.5 5S, 2R 52.0-62.0 127.0-164.0 NG NP
Ca mmol/L 131 2.09 0.23 2.10 1.20 2.84 1.60-2.54 3S, 1R 1.20-1.70 2.40-2.84 NG NP
Creatinine µmol/L 130 96.7 14.3 97.2 70.7 132.6 70.7-130.2 3S, 1R 70.7-70.7 123.8-132.6 NG NP
GGT U/L 128 20.5 6.5 19.0 7.0 47.0 12.0-36.8 3S, 3R 7.0-12.0 33.0-47.0 NG NP
Cl mmol/L 129 95.9 3.7 96.0 85.0 104.0 87.0-102.8 5S, 2R 85-88 102-104 NG NP
K mmol/L 131 3.7 0.5 3.6 2.5 5.0 2.7-4.7 0 2.5-2.9 4.6-5.0 NG NP
Na mmol/L 128 137.7 4.1 139.0 125.0 146.0 126.0-144.0 6S, 3R 125.0-130.0 146.0-149.0 NG NP
Mg mmol/L 129 0.89 0.16 0.91 0.53 1.32 0.62-1.25 1S, 2R 0.53-0.62 1.11-1.32 G NP
Phosphate mmol/L 131 1.37 0.33 1.32 0.71 2.39 0.82-2.02 1S 0.71-0.90 1.97-2.39 NG NP
Total protein g/L 131 67.4 8.4 68.0 46.0 97.0 48.3-83.4 1S 46.0-52.0 79.0-97.0 NG NP
Urea mmol/L 131 2.91 0.75 2.83 1.50 5.00 1.67-4.45 0 1.50-1.83 4.16-5.00 NG NP
Glucose mmol/L 131 3.81 0.53 3.85 1.90 5.74 2.85-4.81 0 1.90-2.97 4.68-5.74 G NP
Cholesterol mmol/L 130 2.16 0.51 2.14 1.25 3.95 1.35-3.34 6S, 1R 1.25-1.38 3.22-3.95 NG NP
Zinc µmol/L 131 10.60 3.64 10.86 1.07 19.28 2.79-17.30 0 1.07-5.20 16.52-19.28 G NP
Total bilirubin mmol/L 130 6.57 4.43 5.48 0.29 21.99 1.03-19.45 6S, 1R 0.29-1.86 15.57-21.99 NG NP
NEFA mmol/L 131 0.66 0.38 0.55 0.11 1.96 0.16-1.63 0 0.11-0.20 1.43-1.96 NG NP
BOHB mmol/L 129 0.75 0.31 0.71 0.31 1.76 0.38-1.71 7S, 2R 0.31-0.40 1.44-1.76 NG NP
Fructosamine µmol/L 131 182 22 179 119 244 135-228 3S 119-144 217-244 G NP
S: suspected outliers; R: removed outliers; G: Gaussian distribution of data; NG: non-gaussian distribution of data; NP: nonparametric method.

47
Table 5.7: Descriptive statistics of reference intervals for some markers of inflammation/oxidation for cows at 3±1 DIM. Number of reference values included, mean, standard deviation, median, minimum, maximum, RI, number of outliers, confidence intervals of the lower and upper reference limits, distribution of data and method employed to generate the reference interval.
Analyte SI Units N Mean SD Median Min Max RI Outliers Lower Ref Lim 90% CI
Upper Ref Lim 90% CI
Dist. Method
Ceruloplasmin µmol/L 131 3.65 0.67 3.69 2.24 5.04 2.35-4.98 0 2.24-2.53 4.88-5.04 G NP Haptoglobin g/L 131 0.85 0.54 0.78 0.01 2.36 0.08-2.18 2S 0.01-0.11 1.99-2.36 NG NP Paraoxonase U/L 131 84.1 21.4 84.0 39.4 142.5 46.3-135.0 1S 39.4-53.6 128.4-142.5 G NP
dROMs(H2O2) mg/100 mL 131 15.3 3.9 14.5 7.7 25.9 9.4-24.2 1S 7.7-10.0 22.5-25.9 NG NP Thiol groups µmol/L 131 354 68 352 190 563 226-522 4S 190-244 474-563 G NP
Myeloperoxidase U/L 131 476 99 469 237 808 262-742 3S 239-339 637-808 G NP Vitamin A µmol/L 130 36.7 13.6 34.8 10.1 87.9 16.6-68.0 2S, 1R 10.1-16.9 62.3-87.9 NG NP Vitamin E µg/mL 130 1.51 0.81 1.37 0.20 4.38 0.36-3.92 5S, 1R 0.20-0.46 3.09-4.38 NG NP
Beta-carotene mg/100 ml 130 0.10 0.06 0.09 0.02 0.27 0.03-0.24 1R 0.02-0.04 0.22-0.27 NG NP S: suspected outliers; R: removed outliers; G: Gaussian distribution of data; NG: non-gaussian distribution of data; NP: nonparametric method.
Table 5.8: Descriptive statistics of reference intervals for electrophoretical parameters for cows at 3±1 DIM. Number of reference values included, mean, standard deviation, median, minimum, maximum, RI, number of outliers, confidence intervals of the lower and upper reference limits, distribution of data and method employed to generate the reference interval.
Analyte SI Units N Mean SD Median Min Max RI Outliers Lower Ref Lim 90% CI
Upper Ref Lim 90% CI
Dist. Method
Albumin g/L 44 37.2 8.3 37.2 14.7 52.5 15.3-52.3 1S 14.7-25.1 48.7-52.5 G NP Globulin g/L 44 33.3 10.0 32.3 19.3 58.5 19.3-57.6 0 19.3-20.8 49.6-58.5 G NP A/G ratio ratio 44 1.26 0.55 1.17 0.29 2.31 0.31-2.29 0 0.29-0.49 2.14-2.31 G NP α1-globulin g/L 44 3.2 0.9 3.1 1.8 5.5 1.8-5.4 1S 1.8-2.0 5.1-5.5 NG NP α2-globulin g/L 44 6.7 1.7 6.7 3.6 11.5 3.6-11.3 1S 3.6-4.6 9.2-11.5 NG NP β1-globulin g/L 44 5.8 1.9 5.6 2.2 11.2 2.2-11.2 2S 2.2-2.9 8.9-11.2 NG NP β2-globulin g/L 44 6.7 2.2 6.3 3.4 11.6 3.4-11.5 0 3.4-3.8 10.4-11.6 NG NP γ-globulin g/L 44 10.9 5.1 10.0 3.9 23.9 4.0-23.5 0 3.9-4.6 19.1-23.9 NG NP
S: suspected outliers; R: removed outliers; G: Gaussian distribution of data; NG: non-gaussian distribution of data; NP: nonparametric method.

48
5.4. Discussion and conclusions
In routine practice, hematological and biochemical RIs for cows are established using the
transference method, based on RIs obtained from literature (Friedrichs et al., 2012), or generated
within the lab from the patient’s database, which includes a wide population of animals irrespective
on possible biological peculiarities associated with pregnancy or lactation. However, the ASVCP
guidelines recommend that in some circumstances (e.g. differences in pre-analytical or analytical
methods) transference may not be appropriate (Friedrichs et al., 2012). Due to the unavailability of
information concerning their study population, the most common used biochemical RIs cited in
textbooks (for example Kaneko, 2008) were not considered acceptable for the transference
procedures. A recently published study on hematological RIs of Holstein cows (George et al., 2010)
included only cows with at least 18 weeks in lactation. Other studies on biochemical analytes
classified as “early lactation” the period ranging from 30 to 90 DIM (Cozzi et al., 2011; Bertoni and
Trevisi, 2013). Studies on acute phase proteins and other analytes related with inflammation were
not focused on generation of RIs (Bionaz et al., 2007, Bertoni et al., 2008, Trevisi et al., 2012).
Therefore, there are no specific studies on the RIs regarding hematology, clinical chemistry and
acute phase proteins/inflammatory markers in the first days post-partum compared with one month
later, when the metabolic status of lactating cows is deeply different. Hence, we focused our study
on these two periods. To this aim we applied recently published guidelines for veterinary species
(Friedrichs et al., 2012). According to these guidelines, strict inclusion criteria were applied, in
order to exclude from the study not only sick animals but also any animal potentially affected by
subclinical diseases. To achieve this objective, we reviewed the health status of cows included in a
larger study focused on genetic bases of bovine disease susceptibility (ProZoo Project) and we
excluded from the study either the cows that had health problems during the whole lactation period
subsequent to the samplings included in this study, or the animals that had problems of fertility or
low production, potentially consistent with subclinical abnormalities. This allowed us to include in

49
the study only samples from animals that were clinically healthy for the whole lactation period and
had production and fertility consistent with the normal standard of dairy herds of our region. The
application of these strict inclusion criteria induced us to exclude from the study a large number of
animals (the original database with the whole set of analyses, included more than 1,000 samples per
each lactation period) but despite this, the final dataset remained higher than the minimum caseload
recommended for establishing RIs (n= 120, Geffrè et al., 2009). To our knowledge, other studies on
bovine RIs were generally based on numbers of samples largely lower than those included in this
study and this further reinforce the statistical power of our results.
Our results confirm the importance to establish different RIs, appropriate for the lactation stage,
since results recorded at 3±1 DIM and at 30±3 DIM were often significantly different either in
terms of mean and median values or in terms of RIs. In most of the cases, the differences were
justifiable with the biological events that characterize early post-partum or early lactation. In these
cases, the adoption of separated RIs for these parameters was thus supported both from the
statistical analysis and from a biological point of view.
In particular, the biological events occurring soon after parturition may justify some of the
differences recorded between day 3±1 and 30±3: for example, the reference limits for RBC, Hb and
Ht are higher at 3±1 DIM maybe due to hemoconcentration associated with parturition (Enemark et
al., 2009). Moreover, at this sampling time, reference limits of MCV and MCHC were slightly
higher and lower, respectively, likely due to the moderate blood loss that may occur after
parturition, suggesting the release into the circulation of younger RBCs (that show higher mean cell
volume). Mild blood losses may also justify the lower reference limits for PLT count (Stockham
and Scott, 2008f). Hemoconcentration, stress or inflammatory stimuli associated with parturition,
may also justify the higher counts of all the leukocyte populations (Tornquist and Rigas, 2010),
except eosinophils, recorded at 3±1 DIM compared with 30±3 DIM. The production of colostrum
and milk and the low food intake in the days around calving may explain the lower calcium,
50
phosphorous, magnesium, glucose, total proteins and GGT as many of these metabolites cross the
hemato-mammary barrier or are used as source for milk production (Ramberg et al., 1970; Goff and
Horst, 1997; Butler, 2005, Hoffman and Solter, 2008). The high creatinine concentration at 3±1
DIM may be justified by several factors such as dehydration, increased muscle catabolism
associated with the decrease food intake in the peri-partum, or an increased catabolism of proteins
from placental tissues or allantoic fluids (Braun and Lefabvre, 2008). The negative energy balance
following the start of the lactation justify the high NEFA and BOHB level (Drackley et al., 2005;
Martinez et al., 2012). The higher AST and total bilirubin may be explained by a higher degree of
hepatic exploitation also due to the increased inflammatory stimuli or by an increased degradation
of fetal hemoglobin and increased muscle damage around parturition (Hoffmann and Solter, 2008;
Bertoni and Trevisi, 2013). Finally, dehydration may explain the higher chloride and sodium
concentration found in early post-partum (Carlson and Bruss, 2008).
Parturition represents a sort of inflammatory stimulus. Therefore, is not surprising that RIs for Cp
and Hp, that are positive APPs in cattle (Arthington et al., 2008; Trevisi et al., 2009; Eckersall and
Bell, 2010) are higher and the RI for PON-1, that is a negative APP in cattle (Bionaz et al., 2007;
Trevisi et al., 2009; Giordano et al., 2013) is lower at parturition. Moreover, oxidative stress
associated with inflammation may justify the higher dROMs (Trevisi et al., 2009) and the lower
zinc, vitamin A, vitamin E and β-carotene (Goff and Stabel, 1990; Wilde, 2006; Bionaz et al., 2007)
recorded at parturition..
Conversely, the approaching peak of lactation, starting approximately six weeks after parturition
may justify other findings. The β2-globulin fraction, is higher at 30±3 DIM than in early post-
partum likely due to an increased antibody production (Stockham and Scott, 2008g), or to a smaller
loss of immunoglobulins in milk than in colostrum. These changes may reflect also in the higher
total globulin encountered at the same time. The more balanced energy state that occurs at 30±3
DIM may lead to a reduction in calcium resorption from bones, thus explaining the lower ALP
compared with early post-partum (Rosol and Capen, 1997). The higher cholesterol is consistent

51
with other studies, where this analyte was found to increase with the progress of lactation (Herdt
and Smith, 1996; Bionaz et al., 2007; Bertoni et al., 2008; Cozzi et al., 2011) maybe due to changes
in serum lipoprotein concentration (Raphael et al., 1973).
Finally, it is more difficult to explain the lower concentration of urea that reflects an increased
protein catabolism, at 3±1 DIM, when fetal and placental catabolism is active. In another study,
lower serum urea concentration was found in cows in the first week after parturition (RIs are very
similar to that obtained in the present study for cow at 3±1 DIM) compared to the pre-calving
period (Quiroz-Rocha et al., 2009). The authors attributed the finding to the increased recycling of
ruminal urea as source of proteins synthesis at the starting of lactation, when a decreased dry matter
intake may reduce the endogenous availability of ammonia for urea production. In our case, data
regarding urea in the two periods minimally overlap and therefore the use of different RIs is highly
justified, independently on its possible pathogenic mechanism.
Hence, in all the cases above, the adoption of RIs specific for each period is highly recommendable
in order to avoid that results actually depending solely on the lactation stage are erroneously
interpreted as associated to pathophysiological or pathological conditions.
The guidelines for establishing reference intervals, recommend also investigating any possible pre-
analytical source of variation that may justify the adoption of additional RIs. From this perspective,
the herd of origin, the precise day of sampling and the parity group may represent additional
variables that may induce laboratory changes so severe to require additional day-, herd-or parity-
specific RIs. Regression analysis based on the day of sampling revealed only few differences
according to time that however were not supported by the statistical paired test. In this case, the
utility of separated RIs according to days is questionable and, moreover, in routine practice it may
be difficult to use a different RI for each specific day of lactation.
Similarly, despite partitioning based on the herd of origin revealed several significant differences
and the possible need of herd-specific RIs, the data distribution evidenced only in a few cases an
univocal trend (i.e. a given change or RI found in a single herd and not in the other ones).

52
Conversely, in most cases, the significant differences seemed to be a “statistical artifact” without
practical or biological significance. As regards the few parameters that were significantly different
in a single herd (in our caseload, herd B, C or D, depending on the analyte), the recorded
differences may be associated with different dietary or management procedures that, although very
similar in the 4 herds, may have been characterized by slight differences (e.g. vitamin
supplementation, management of groups, microclimate management). In addition, differences
among herds could be also justified by the presence of specific subclinical conditions, which were
not identified. Also in this case, herd-specific RIs have not been determined in this study, either
because the number of animal per herd was often too low to allow a reliable statistical analysis, or
because in routine practice it may not be applicable the use of an herd-specific RI only for some
analyte and not for the others.
Finally, many significant differences according to parity were found but only in few cases there
were specific differences between the group of cows at first lactation or than that of cows with more
than 3 lactations and the others groups. Interestingly all these differences were found at 30±3 DIM.
The higher ALP activity and creatinine concentration observed in primiparous cows may be
associated with the increased osteoblastic activity that occurs in young growing cattle and with
higher muscle activity in young growing cattle as observed also in similar studies at different
sampling times (Brscic et al., 2015; Cozzi et al. 2011). The higher calcium concentration in cows at
first lactation may be related to an age dependent effect as shown in another study (Quiroz-Rocha et
al., 2009). One of the reasons suggested in this latter study is the decreased numbers of receptors for
1,25-dihydroxyvitamin D in the intestine, resulting in decreased absorption of the mineral. Finally,
the higher total bilirubin and PON-1 found in older cows (3 or more lactations) may be explained
with a slower return to normal condition after a period of liver exploitation and with a less reactive
immune system supported also by the higher total leukocytes count found in younger cows.
In conclusion, this study confirmed the results of previous studies that evidenced different
metabolic/pro-inflammatory states in different periods in lactating cows. Based on these differences

53
we were able to establish different RIs to be applied just after parturition (3±1 DIM) or when
lactation is approaching the peak (30±3 DIM). The use of different RIs in the different periods is
highly justified not only on a statistical basis but also on a biological point of view, since the
analytes that were different between the two periods are involved in the metabolic processes that
differ in the two lactation phases. Further differences may be found in the different herds included
in this study or in each different sampling day. The application of additional day- or herd-specific
RIs, however, has several practical limitations and therefore it may be recommendable, in routine
practice, to use different RIs at early post-partum and one month later and, within this period,
carefully consider results that in a given day or in a given herd seem to move towards one or the
other reference limit since this trend may depend on day-, herd- or parity specific pre-analytical
factors. These specificities may have determined the definition of wider RIs in the past. However in
our opinion the RIs generated in the present study may be a useful tool to interpret hematological,
biochemical and inflammatory parameters of dairy cows belonging to commercial herds, in the
more critical phases of lactation as the immediate post calving and the peak of lactation.

54
CHAPTER 6:
Evaluation of peri-partum laboratory changes
in dairy cows with and without retained
placenta

55
CHAPTER 6: SECTION 1 - EARLY POST-PARTUM HEMATOLOGICAL
CHANGES IN HOLSTEIN DAIRY COWS WITH RETAINED PLACENTA
Moretti, P., Probo, M., Morandi, N., Trevisi, E., Ferrari, A., Minuti, A., Venturini, M., Paltrinieri,
S., Giordano, A.: Early post-partum hematological changes in Holstein dairy cows with retained
placenta. Animal Reproduction Science. 2015, 152, 17–25
6.1.1 Introduction
Retention of fetal membranes or retained placenta (RP) occurs frequently in high-yielding dairy
cows and has been proven to cause negative effects on reproductive performances (Kelton et al.,
1998). A worldwide survey by Kelton et al. (1998) estimates an incidence of between 1.3% and
39.2% with a median of 8.6%. These results agree with those obtained by a preliminary study on
Italian herds (Bolla and Fantini, 2003).
Retained placenta is defined as fetal membranes not expelled after parturition. The time interval to
classify a cow as affected by RP varies with different studies (Fourichon et al., 2000). Membranes
can be retained for 7 days or more if a treatment is not administered (Paisley et al., 1986). This
condition causes huge economic losses since it predisposes to a variety of reproductive and
productive problems (Laven and Peters, 1996; Trevisi et al., 2008; Dubuc et al., 2010).
Although there are many studies concerning RP in cows, its pathogenesis is still not well
understood (Schlafer et al., 2000; Boos et al., 2003). Pregnancy maintenance requires suppression
of the immune response in order to avoid rejection of the fetal-placental unit and RP might result
from a failure in switching off these immune-protective mechanisms.

56
In the last few years the understanding of the role of the innate immune system in the pathogenesis
of reproductive diseases which occur in the transition period has been improved (Cai et al., 1994;
Kimura et al., 2002b; Hammon et al., 2006; Bertoni et al., 2008). The increasing number and
activity of endometrial leucocytes appears to play an important role in placental detachment and
neutrophil dysfunction may be involved in RP. It has been observed that leukocytes from cows with
RP show, around the time of parturition, decreased chemotaxis (Gunnink, 1984a; Gunnink, 1984b;
Gunnink 1984c; Gunnink 1984d) and decreased phagocytic activity (Kimura et al., 2002b).
Moreover, leukocytes of cows with hyperketonemia, a condition frequently associated with RP,
have a lower phagocytic activity, decreased cytokine production and chemotactic activity (Scalia et
al., 2006).
Changes in clinical biochemistry associated with RP have also been described. Compared to healthy
cows, cows with RP have higher serum concentration of non-esterified fatty acids (NEFA) and D-3-
hydroxybutyrate (BOHB), lower serum concentration of vitamin E and calcium (Seifi et al., 2007).
Inflammatory changes occurring after RP were described by Trevisi et al. (2008); cows with RP
having lower concentrations of albumin (a negative acute phase protein) whilst the serum
concentration of typical inflammatory markers (haptoglobin and ceruloplasmin) were similar to
those of cows that normally expelled fetal membranes. Conversely, little is known about
hematological changes occurring soon after parturition in affected cows. Therefore this
retrospective study was designed to investigate the hematological changes associated with RP in the
immediate post-partum period and to assess whether hematological changes are associated with an
acute phase reaction, in order to provide additional insights on the pathogenesis of this condition.

57
6.1.2 Material and methods
6.1.2.1 Retrospective analysis of the database
This study started with a retrospective search of data recorded in the database of the ProZoo project,
a research project aimed to investigate the relationship between genomic traits and bovine health
and production. The ProZoo database includes information about production, reproduction, and
health status, including results of blood samplings recorded over a 3 year period (2010-2013) from
5 intensive farms in the area of Lodi (Lombardy region, Italy), two of which (herds A and B) had a
high prevalence of RP (20% and 29%, respectively). These two herds were composed of 187 and
360 milking cows, respectively, with a mean days in milk (DIM) of 199 for the farm A and 188 for
the farm B. All the cows were fed with a TMR (total mixed ration). Milking was performed twice a
day, at 12 h intervals. A thorough gynecological investigation (transrectal uterine palpation and
ultrasonography) was conducted at 30 DIM on all the cows.
The database was examined in order to select data corresponding to cows from herds A and B that
fulfilled the following inclusion criteria.
- availability of data from the complete blood count (CBC) and biochemical profile performed
at 3±1 DIM;
- negative history for any clinical disease or laboratory abnormality during the gestation
period and normal parturition course;
- average production adjusted for 305 days during the lactation period included in this study:
≥7.000 kg;
- lactation period of at least 200 days;
- no clinical events or abnormal laboratory results during the first month of lactation, except
for RP and associated laboratory changes for animals included in the RP group;

58
- no anti-inflammatory or antibiotic treatments administered in the days before collection of
blood samples.
In order to exclude from the study all the animals that did not fulfill the criteria above, data
regarding clinical visits recorded in the first days after calving were examined. At each visit, the
evaluation for RP was conducted visually and vaginally by the veterinarian. A cow was judged to
have an RP when the placental membranes had been retained for at least 24 h. All cows from the
two farms were monitored for the occurrence of vaginal discharge in the following 30 days.
6.1.2.2 Blood sampling
In all the animals included in this study, peripheral blood samples were collected at 3±1 DIM.
Specifically, 30 mLs of venous blood were collected: 10 mLs of blood were placed in a tube
without anticoagulant (Venosafe plastic tubes for serum, Terumo, Europe) to perform routine
biochemical analyses, 10 mLs were placed in tubes with EDTA (Venosafe plastic tubes for
hematology, Terumo, Europe) to perform routine hematology, and 10 mLs were placed in tubes
with lithium heparin (Venosafe plastic tubes for plasma, Terumo, Europe) for the measurement of
acute phase proteins (APPs).
All the samples were immediately placed at 4 °C and submitted to the Central Laboratory of the
Veterinary Teaching Hospital of the University of Milan where routine hematology was performed
as described below. Tubes with lithium heparin were immediately centrifuged at 2,200 x g for 10
minutes upon arrival at the Central Laboratory. Samples in tubes without anticoagulant were
allowed to clot at room temperature for 30 minutes and then centrifuged at 2,200 g for 10 minutes.
Harvested heparinized plasma and sera were then frozen at -80°C for a maximum of 3 months
before biochemical tests were performed.

59
6.1.2.3 Routine hematology
Routine hematology was performed at the Central Laboratory of the Veterinary Teaching Hospital
of the University of Milan using an automated laser hematology analyzer (ADVIA 120 with
multispecies software for veterinary use, Siemens Healthcare Diagnostics, Milan, Italy). The
following variables generated by the instrument were recorded: hemoglobin (Hb) concentration,
hematocrit (HCT), erythrocyte (RBC) counts, white blood cells (WBC) counts.
The leukocyte differential provided by the instrument was checked microscopically on blood
smears prepared upon arrival of the sample at the laboratory and stained with a modified
Romanowsky stain (Dif-stain kit, Titolchimica S.P.A., Rovigo, Italy). The total number of the
leukocyte populations was then calculated based on the total number of WBC and on the percentage
of each cell population.
6.1.2.4 Clinical chemistry
Routine biochemical analyses were run on serum or plasma with automated spectrophotometers
(ILAB300 plus and ILAB600, Instrumentation Laboratory S.p.a., Milan, Italy) using reagents
provided by the manufacturer of the instruments, except when otherwise specified. The following
analytes were measured: alkaline phosphatase (ALP, kinetic IFCC method), aspartate
aminotransferase (AST, kinetic IFCC method), calcium (orthocresoftaleine method), creatinine
(Jaffè method), total proteins (biuret method), albumin (bromochresol green method), total bilirubin
(diazo reactive with sulphanilic acid), glucose (GOD-POD method), total cholesterol (cholesterol
oxidase method), urea (urease method), phosphate (phosphomolibdate method), -glutamyl
transferase (GGT, kinetic IFCC method), zinc (colorimetric with Nitro-PAPS), sodium, potassium
and chloride (ion selective electrodes method), non-esterified fatty acid (NEFA, ACS-ACOD
method, Wako Chemicals GmbH, Neuss, Germany) and β-hydroxybutyrate (BOHB, D-3-
Hydroxybutyrate dehydrogenase method, Randox Laboratories Ltd., Crumlin, Co. Antrium, UK).

60
6.1.2.5 Acute phase proteins (APPs) and other markers of inflammation
Heparinized plasma was periodically sent to the Institute of Zootechnics, Faculty of Agriculture,
Università Cattolica del Sacro Cuore, Piacenza, to measure the following APPs and other markers
of inflammation: ceruloplasmin (Cp) with the method described by Sunderman and Nomoto (1970);
haptoglobin (Hp), using the method described by Skinner et al. (1991); paraoxonase (PON1) with
the method described by Ferré et al. (2002); reactive oxygen metabolites (d-ROMs) using the Kit
“d-ROMs Test” from Diacron International S.r.l. (Grosseto, Italy); thiol groups (SHp) measured
using a specific colorimetric kit (Diacron International S.r.l.); myeloperoxidase (MPO) determined
through a colorimetric method described by Bradley et al. (1982). All the methods were run on
plasma with an automated spectrophotometer (ILAB600, Instrumentation Laboratory S.p.a., Milan,
Italy).
6.1.2.6 Statistical analysis
Statistical analyses were done on an Excel (Microsoft Corp, Redmond, WA, USA) spreadsheet
using the Analyse-it software (Analyse-it Software Ltd, Leeds, UK). Results recorded at day 3±1
after calving from both groups were compared with the reference intervals established in our
laboratory from clinically healthy animals sampled in the same post-partum period. Results from
cows affected by RP and from CTRL cows were compared to each other using a Wilcoxon signed
rank test. Comparison of neutrophils was done either for the whole group of animals or for animals
subgrouped according to the herd of origin. The Wilcoxon signed rank test was also used to
compare the neutrophil counts obtained in the two herds either in cows affected by RP or in CTRL
cows.

61
6.1.3. Results
6.1.3.1 Case selection and characteristics of the study population
As shown in figure 6.1.1, most of the animals sampled in the study period were finally excluded
because they did not fulfill the inclusion criteria. Therefore, the study population was finally
composed of 22 cows with RP (14 from herd A and 8 from herd B), sampled at 2 (n=12), 3 (n=6)
and 4 (n=4) days post-partum, and of 23 cows without RP and without any other clinical symptoms
in the 1st month after calving (CTRL group, 9 from herd A and 14 form herd B), sampled at 2 (n=5),
3 (n=14) and 4 (n=4) days post-partum.
The median (min-max) BCS at 3±1 DIM were 3.25 (3.00-4.00) points in the RP group and 3.50
(3.00-3.75) in the CTRL group. The median (min-max) 305-days milk production were 9647 (7099-
11990) and 9954 (7268-11950) Kg for the RP and the CTRL group respectively. The median (min-
max) number of lactations were 3 (1-6) in the RP group and 3 (1-5) in the CTRL group. Regarding
these parameters, no statistically significant differences between the two farms were observed.
A combination of manual removal of the fetal membranes and intramuscular administration of
30,000 UI/kg of benzylpenicillin (Depomicina, Intervet Italia, Peschiera Borromeo, Milan, Italy)
was performed in 15 cows with RP whereas a combination of manual removal of the fetal
membranes and intrauterine administration of 1.2 g of rifaximin (Fatroximin Pessari, Fatro s.p.a.,
Ozzano dell’Emilia, Bologna, Italy) was performed in 5 cows with RP. All the treatments were
administered on the day of blood collection.
On the basis of the 30 DIM gynecological visits all animals with RP recovered completely.

62
Figure 6.1.1: flowchart summarizing the results of the retrospective search in the database and the final composition of the study group.
63
6.1.3.2 Hematology and clinical chemistry
Results recorded at 3±1 DIM are reported in Figure 6.1.2 and 6.1.3 and shows that RBC counts
were significantly higher in cows affected by RP compared with CTRL cows (P=0.034) but values
were within the reference intervals in both groups. Conversely, neutrophils counts were
significantly lower (P=0.015) in the RP affected group, in which about one third of the cows had
values lower than the lower limit of the reference interval, compared with controls which,
conversely, had values included in the reference interval, with rare exceptions. The differences
between neutrophil counts of CTRL and RP groups of herd A (CTRL = mean ± S.D: 2.93 ± 1.51 x
10³/µL; median: 2.59 x 10³/µL; RP = 1.69 ± 1.11 x 10³/µL; 1.35 x 10³/µL) and B (CTRL = 3.76 ±
1.90 x 10³/µL; 3.57 x 10³/µL; RP = 2.26 ± 2.35 x 10³/µL; 1.45 x 10³/µL) were statistically
significant (P=0.038 and P=0.042, respectively). Conversely, no significant differences were found
when neutrophil counts recorded in CTRL cows of herd A and B were compared to each other or
when neutrophil counts recorded in RP cows of herd A and B were compared to each other.
With regard to the whole set of data (i.e. herds A and B), no significant differences were found for
total WBC, lymphocytes, and monocytes. Band neutrophils, basophils and eosinophils were only
occasionally seen in both groups but the total number of these cells was always within the reference
interval, without differences between the two groups (data not shown). Similarly, no significant
differences for the markers of inflammation and oxidation were recorded between CTRL and RP
cows, except for a significant increase of d-ROMs and for a significant decrease of thiol groups
although these largely remained within the reference intervals in both groups. Biochemistry was
also unremarkable, with no significant differences between groups except for AST activity, which
was significantly higher in the RP group, and serum zinc concentration, that was significantly lower
in the RP group. However, for both these analytes values were largely within the reference intervals
in both groups. Interestingly, no significant differences between the groups were found regarding
the analytes that are considered as risk factors for RP such as Calcium, NEFA and BOHB.

64
Figure 6.1.2: Results regarding hematological parameters, inflammatory markers and biochemical parameters showing significant differences between groups. The figure displays the comparison between animals with retained placenta (RP) and controls (CTRL). Boxe indicate the I-III interquartile interval, the horizontal line corresponds to the median, vertical lines are the limits of outlier distribution according to the Tukey rule. Near outliers are indicated by the symbols “x” and far outliers with asterisks outside the boxes. The black bolded asterisks within the boxes indicate significant differences between groups (* = P<0.05). When no asterisks are reported within boxes, the difference between groups are not significant. The gray areas display the reference interval of our lab referred to cows at 3±DIM

65
Figure 6.1.3: Results regarding hematological parameters, inflammatory markers and biochemical parameters of potential interest for placental retention that did not were significantly different between groups. The figure displays the comparison between anima with retained placenta (RP) and controls (CTRL). See figure 6.1.1 for interpretation of box and whiskers.
66
6.1.4. Discussion
This study is focused on the hematological profile analysis of cows affected by retained placenta,
since most of the previous reports were focused on biochemical alterations (Peter and Bosu, 1987;
Melendez et al., 2004; Seifi et al., 2007; Ospina et al., 2010; Huzzey et al., 2011) or in vitro
leukocyte functions (Gunnink, 1984a; Gunnink, 1984b; Gunnink, 1984c; Gunnink, 1984d;
Hammon et al., 2006) associated with RP while alterations of erythrogram and leukogram were not
considered. These may be particularly important in the management of animals that are at risk for or
are affected by RP, since the depression of neutrophil functions and the inflammatory state, and the
association with RP (Gunnink, 1984b; Gunnink, 1984d; Gilbert et al., 1993; Hammon et al., 2006;
Trevisi et al., 2008), may change the amount of circulating neutrophils. The most relevant findings
recorded in RP affected cows compared to controls in the present study are represented by a higher
RBC count and a lower neutrophil count. The high RBC count probably reflects a moderate
dehydration. This condition is usually associated with increased concentration of albumin and total
proteins. However, they were not increased in this study, probably because albumin usually
decreases immediately post-partum (Seifi et al., 2007; Trevisi et al., 2009; Trevisi et al., 2012)
especially in RP affected cows (Trevisi et al. 2008). In addition, the increase of RBCs, although
statistically significant, is probably not relevant on a biological or pathological point of view, since
all the values (including those of the RP group) were within the reference intervals.
The lower number of circulating neutrophils recorded in RP affected cows is potentially associated
with a variety of metabolic and pathological conditions, we thus investigated the possible presence
of inflammation, evaluating results concerning serum inflammatory markers and biochemical
profiles in order to exclude that hematological changes were related to any generic alteration of the
health status or to conditions such as hyperketonemia or hypocalcemia, that have been reported to
play a role in the pathogenesis of RP in cows (LeBlanc et al., 2004; Seifi et al., 2007; Ospina et al.,
2010).

67
The analysis of the obtained biochemical data did not keep identity with peculiar abnormalities at
3±1 DIM in animals with RP, as previously reported by Trevisi et al. (2008). In the present study
the concentration of the analytes recorded in most of the animals from both RP and CTRL groups
was within reference intervals although slightly higher than in previous studies (Trevisi et al., 2009;
Trevisi et al., 2012). The lack of significant changes in NEFA and BOHB suggests that any possible
difference in leukocyte and neutrophil counts between the two groups are probably unrelated to
metabolic abnormalities, since severe changes in neutrophil number and functions may be found
only when severe increases of NEFA and BOHB or severe hypocalcemia are present (Sartorelli et
al., 1999; Sartorelli et al., 2000; Zerbe et al., 2000; Scalia et al., 2006; Martinez et al., 2012).
The decrease of neutrophils at 3±1 DIM is particularly severe, with values in many cases below the
lower limit of the reference intervals in the RP group, suggesting that neutropenia is consistent with
an actual pathological condition. Moreover, this seems to be a constant finding since it occurred in
both herds. Therefore, the association between RP and neutropenia is the most important finding
detected in this study. Severe neutropenia may be primary (e.g. associated to a decreased
myelopoiesis) or secondary to severe inflammation (consumption due to an increased peripheral
demand) (Tornquist and Rigas, 2010; Harvey, 2012). This latter condition may depend on a severe
systemic inflammation, mostly of bacterial origin (e.g. septicemia), that is usually associated with
severe clinical signs (fever and/or hypothermia, depression, etc.), and to the recruitment of
neutrophils in organs with focal inflammatory changes, that leads to a macroscopic evidence of the
neutrophils gathering in inflamed sites (e.g. purulent inflammation, abscesses, etc.). However, none
of the animals with RP included in this study had evident vaginal purulent discharges or clinical
signs potentially associated with a severe systemic inflammatory response. On the contrary, the
persistency of fetal membranes from calving to the time of sampling may have induced a moderate
inflammatory response (e.g. inflammation not associated with severe migration of neutrophils in
inflamed sites). This type of inflammation, however, is usually associated with neutrophilia rather

68
than neutropenia (Tornquist and Rigas, 2010). Therefore, an excessive peripheral consumption of
neutrophils is unlikely in our study. Results regarding inflammatory markers support once more this
hypothesis since in this study the serum concentration of positive APPs (i.e. proteins whose
concentration increases in blood during inflammation), such as haptoglobin or ceruloplasmin, was
normal. The increases of the APPs concentration in serum is considered the most rapid event
occurring in blood after inflammation (Petersen et al., 2004). In the current study, the serum
concentration of APPs did not significantly differ in cattle with RP compared with CTRL cows
suggesting that an acute phase reaction had not yet been mounted in cattle with RP. Reference
intervals for Hp are wider in lactating than in non-lactating cows, since the metabolic events of the
transition period induce changes in the serum concentration of hormones and cytokines that mimic
an inflammatory reaction (Bionaz et al., 2007; Trevisi et al., 2012). Theoretically, both groups may
have a reduced rate of hepatic synthesis of negative APPs, as it may occur in the peri-partum period
(Bertoni et al., 2008; Trevisi et al., 2012). However, this is very unlikely since the possible
indicators of liver failure (bilirubin, albumin, urea, APPs) were in normal concentration in both
groups, and only AST, that ultimately is not an indicator of liver function (Stockham and Scott,
2008e), significantly increased in cattle with RP compared with CTRL cows; this increase was of
small proportions and not exceeding, in most cows, the upper reference limit. As an additional
support to this hypothesis, paraoxonase activity, that has been shown to decrease during
inflammation due to both a decreased production and to an increased consumption associated with
oxidative phenomena typical of inflammatory states (Turk et al., 2004; Bionaz et al., 2007;
Giordano et al., 2013), was not significantly different between RP and CTRL cows. However,
oxidation was likely present in cows with RP since reactive oxygen species and thiol groups were
respectively increased and decreased in the RP group compared with CTRL. Additionally, cows
with RP had a low serum concentration of zinc, that is considered to have antioxidant properties,
contributes to the efficiency of immune responsiveness and has been thought to be a co-factor in the
pathogenesis of RP (Laven and Peters, 1996; Wilde, 2006). However, all the changes in the serum

69
concentration of these molecules were moderate and did not exceed the reference intervals. More
importantly, they were not associated with an increase of myeloperoxidase, whose serum
concentration may increase in association with increased d-ROMs when oxidants are released from
inflammatory cells (Bochsler and Slauson, 2002; Sordillo and Aitken, 2009; van der Veen et al.,
2009; Mittal et al., 2014).
Neutropenia may also depend on antibiotic treatments. However, this is unlikely since the
antibiotics used are not reported to induce alterations in leukocyte counts at conventional
therapeutic doses (Papich and Riviere, 2009) and, additionally, the period of time between
administration of antibiotics and samplings was too short (both were done in the same day) to
induce changes in the leukograms.
Therefore, all these findings support the hypothesis that neutropenia in cattle affected by RP may
exist independently on the presence of inflammation. If this interpretation is correct, neutropenia
may be considered as an additional predisposing factor for placental retention. This may be also
consistent with the presence of neutrophil dysfunction demonstrated in previous studies on animals
with RP (Gunnink, 1984a; Gunnink, 1984b; Gunnink, 1984c; Gunnink, 1984d; Hammon et al.,
2006).
The design of this study does not allow us to formulate any hypothesis about the mechanism
responsible for such a severe neutropenia. More specifically, this was an observational study
focused on hematological findings recorded at the time of occurrence of RP and the number of
cases included in the study was quite low, due to the application of strict inclusion criteria to
exclude any sample potentially affected by confounding factors (e.g. other infectious, metabolic,
reproductive or productive disorders). Longitudinal studies, possibly on a higher number of
animals, based on samples collected before parturition and at the occurrence of RP would provide
more information about the temporal relationship between the appearance of neutropenia and RP.

70
In conclusion, although retained placenta has to be considered as a syndrome with multifactorial
causes, many of which associated with parturition or with altered metabolic states leading to
hyperketonemia and/or hypocalcemia (Beagley et al., 2010), the obtained results suggest that
neutropenia may serve as a co-factor involved in its pathogenesis. Further studies are needed to
clarify whether neutropenia acts as a contributor in the pathogenesis of RP or if it is a very early
consequence of RP, preceding any other inflammatory changes in blood. Moreover it would be
interesting to investigate the mechanism responsible for this hematological change, as well as the
possible genetic predisposition leading to this condition.

71
CHAPTER 6: SECTION 2 - HEMATOLOGICAL CHANGES AROUND
PARTURITION IN HOLSTEIN DAIRY COWS WITH RETAINED PLACENTA
6.2.1 Introduction
Retained placenta (RP) occurs frequently in high-yielding dairy cows and it has been proved to
cause negative effects on productive and reproductive performances (Laven and Peters, 1996;
Kelton et al., 1998; Trevisi et al., 2008; Dubuc et al., 2010). Its pathogenesis is still not well
understood. In normal conditions, the breakdown of the collagenous fetal-maternal link is the result
of endocrine and immunological pathways (Beagley et al., 2010). At parturition, the activation of a
cellular immune response against the placenta mediated by the release of pro-inflammatory
cytokines and chemokines, seems necessary for the proper dissolution of this link (Davies et al.,
2000; Davies et al., 2004; Beagley et al., 2010). Alteration of leukocyte functions may contribute to
a failure of this process. This hypothesis is supported by different studies where cows with RP have
shown to have decreased neutrophil function around parturition (Gunnink, 1984a, 1984b, 1984c,
1984d; Cai et al., 1994; Kimura et al., 2002b; Hammon et al., 2006). In a previous work we found
that cows with RP and without evidence of metabolic abnormalities and inflammatory conditions
have lower circulating neutrophil number soon after parturition compared to normal cows (Moretti
et al., 2015). After parturition, the possible mechanisms involved in RP have just occurred, thus it
was not possible to deduce if neutropenia was a predisposing factor or a consequence of RP. The
objective of the present study is to examine the temporal dynamics of some hematological
parameters around parturition in cows with RP in order to better clarify the relationship between
neutropenia and RP and to assess the possible role of this finding as a contributing factor for
pathogenesis of the disease.

72
6.2.2 Material and methods
6.2.21 Study design, herds and groups
A prospective study was carried out on 4 Holstein intensive dairy farms located in the Po valley
(Italy) from November 2013 to December 2014. The herds were composed of 270, 300, 700, and
300 animals, respectively, with 150, 130, 250 and 150 milking cows each, a mean days in milk
(DIM) of 320, 180, 297 and 220 days respectively, and a normalized production of 9500, 10500,
11360 and 8900 kgs respectively. All the cows were fed with a TMR (total mixed ration). Milking
was performed twice a day, at 12 h intervals.
A cow was judged to have an RP when the placental membranes had been retained for at least 24 h.
All cows were monitored for the occurrence of vaginal discharge in the following 30 days. The
electronic database of each farm was searched in order to retrieve information concerning health
and management (clinical diseases, treatments, production, and days in milk) covering the study
period.
Cows with RP and without other pathological conditions within the following 30 DIM were
assigned to the RP group (n=12) whereas, 17 cows, randomly selected within the cows with a
normal parturition course and without other pathological conditions in the following 30 DIM, were
assigned to the control group (CTRL).
6.2.2.2 Blood sampling
Peripheral blood samples from the coccygeal vein were collected in EDTA tubes (Venosafe plastic
tubes for hematology, Terumo, Europe) and in plain tubes (Venosafe plastic tubes for serum,
Terumo, Europe) 2 to 7 days before parturition (T0), within 12 h from calving (T1) and between 48
and 72 hours after parturition (T2). All the samples were immediately placed at 4 °C and submitted
to the Central Laboratory of the Veterinary Teaching Hospital of the University of Milan where

73
routine hematology was immediately performed as described below. Samples in tubes without
anticoagulant were allowed to clot at room temperature for 30 minutes and then centrifuged at 2,200
g for 10 minutes. Harvested sera were then frozen at -80°C for a maximum of 3 months before
biochemical tests were performed.
6.2.2.3 Hematology
Routine hematology was performed using an automated laser hematology analyzer (ADVIA 120
with multispecies software for veterinary use, Siemens Healthcare Diagnostics, Milan, Italy). The
following variables generated by the instrument were recorded: hemoglobin (Hb) concentration,
hematocrit (HCT), erythrocyte (RBC) counts, white blood cells (WBC) counts, mean corpuscular
hemoglobin (MCH), corpuscular hemoglobin concentration mean (CHCM), mean cellular volume
(MCV), and platelet (PLT) counts. The leukocyte differential provided by the instrument was
checked microscopically on blood smears prepared upon arrival of the sample at the laboratory and
stained with a modified Romanowsky stain (Dif-stain kit, Titolchimica S.P.A., Rovigo, Italy). The
total number of each leukocyte population was then calculated based on the total number of WBC
and on the percentage of each cell population.
6.2.2.4 Clinical chemistry
In order to obtain information on the metabolic status of the cows, routine biochemical analyses
were run on serum or plasma with an automated spectrophotometer (ILAB300 plus, Instrumentation
Laboratory S.p.a., Milan, Italy) using reagents provided by the manufacturer of the instrument,
except when otherwise specified. The following analytes were measured: β-hydroxybutyrate
(BOHB, D-3-Hydroxybutyrate dehydrogenase method, Randox Laboratories Ltd., Crumlin, Co.
Antrium, UK), calcium (orthocresoftaleine method), creatinine (Jaffè method), glucose (GOD-POD
method), non-esterified fatty acid (NEFA, ACS-ACOD method, Randox Laboratories Ltd.,

74
Crumlin, Co. Antrium, UK), phosphate (phosphomolibdate method), and total proteins (biuret
method).
6.2.2.5 Statistical analysis
At each sampling time (T0, T1 and T2) results from cows affected by RP and from CTRL group
were compared using a Mann-Whitney U test. Within the two groups results were also compared
over time with a Friedman test followed by a Wilcoxon test, when a significant difference was
found. Statistical analyses were done on an Excel (Microsoft Corp, Redmond, WA, USA)
spreadsheet using the Analyse-it software (Analyse-it Software Ltd, Leeds, UK) with P value set at
0.05 for all calculations.
6.2.3. Results
6.2.3.1 Characteristics of the study population
A total of 111 cows were sampled during the study period (13, 46, 36 and 16 animals from herd A,
B, C and D respectively). The prevalence of RP (diseased animals / (diseased animals + not
diseased animals) was 0% (0/13), 13% (6/46), 5.5% (2/36), and 25% (4/16) in herd A, B, C, and D
respectively. One cow with RP from herd C had a dystocic calving (assisted parturition longer than
15 minutes) and one from herd D was unable to stand after the parturition. No twins occurred.
6.2.3.2 Erythrocytes and platelets
Results (mean values ± SD) of hematological parameters recorded at T0, T1 and T2 from RP and
CTRL groups are reported in table 6.2.1. Parameters significantly different between the two groups
are shown graphically in figure 6.2.1. Results of the comparison over time are graphically
represented in figures 6.2.2 and 6.2.3 respectively for RP and CTRL groups.
Concerning erythroid parameters, the analysis of results revealed that RP cows had significantly
lower HCT at T0 and significantly higher CHCM at T0, T1, and T2 compared to CTRL cows. All

75
the other parameters were not statistically different between the groups at the three time points
examined. A trend with increased RBC counts and HCT in CTRL cows was observed at all the time
points.
Concerning the comparison over time, both in RP cows and CTRL cows RBC, Hb and HCT,
significantly varied over time (respectively P=0.0052, P=0.0006 and P=0.0052 for RP cows and
P=0.0004, P=0.0003 and P<0.0001 for CTRL cows). Compared to the day of parturition, all these
parameters had significantly lower value in the week before parturition (T0) and 2 days after (T2) in
both the groups (figures 6.2.2 and 6.2.3), but at T2, values were significantly lower compared to T0
only in CTRL group. The same trend was observed for MCV in CTRL cows (P=0.0003) but at T2
values were significantly higher compared to T0. Finally, only in CTRL group CHCM appeared
significantly affected by time (P=0.0008) with T0 values significantly higher than other time points.
6.2.3.3 Peripheral leukocytes
Concerning leukocytes, WBC and absolute neutrophil counts were significantly lower in RP cows
than CTRL cows at T1 whereas significantly higher absolute lymphocyte counts were found at T0
in RP cows. Finally, absolute monocytes counts were significantly lower in RP cows compared to
CTRL cows at all the sampling times. All the other parameters were not statistically different
between the two groups at the three time points examined. A tendency to lower absolute neutrophil
counts was observed in RP cows at all the time points even if was not supported by the statistics
maybe due to the low number of animals included in the study.
Concerning the differences over time, only CTRL cows showed a significant increase of WBC
counts together with a significant increase of neutrophil counts at T1 followed by a significant
decrease of these parameters at T2. Whereas in both RP and CTRL cows, eosinophils counts exhibit
significantly higher values at T0 compared to T1 and T2.

76
6.2.3.4 Clinical chemistry
Results (mean values ± SD) concerning the clinical chemistry profile performed on samples from
RP and CTRL cows at T0, T1, and T2 are reported in table 6.2.2. Parameters significantly different
between the two groups are shown graphically in figure 6.2.1. Results of the comparison over time
are graphically represented in figures 6.2.4 and 6.2.5 for RP and CTRL groups, respectively.
The majority of the investigated parameters (calcium, creatinine, glucose, NEFA, phosphorous and
total proteins) were not statistically different in RP and CTRL cows at the three time points.
Magnesium was found significantly higher in RP cows than CTRL cows only at T2. The analysis of
results revealed also that RP cows had significantly higher BOHB both before (T0) and after (T2)
parturition compared to CTRL cows. Concerning variations of biochemical parameters over time,
results are represented in figures 6.2.4 and 6.2.5. Calcium, creatinine, NEFA, and BOHB had
identical pattern of variation in both RP (P=0.0004, P=0.0273, P=0.0022, and P=0.0450
respectively) and CTRL cows (P=0.0125, P=0.0015, P=0.0092 and P=0.0498 respectively) with
calcium significantly higher and NEFA significantly lower at T0 compared to T1 and T2, BOHB
value lower at T0 than T1, and creatinine values lower at T2 compared to the other times (figures
6.2.4 and 6.2.5). Glucose concentration also varied significantly in both the groups (P=0.0033 and
P=0.0111 respectively in RP and CTRL cows). Glucose concentration increased with parturition but
this finding was clearly supported by the statistical analysis only in RP cows whereas in CTRL
cows the P value was only slightly above the level of significance (P=0.0547 for T0 versus T1).
Finally, only in CTRL cows differences over time were found for phosphorous and magnesium
concentrations (P=0.0001 and P=0.0125 respectively). Phosphorous was found significantly higher
before parturition compared to T1 and T2 whereas magnesium had the lowest values at T2
compared to the other two time points.
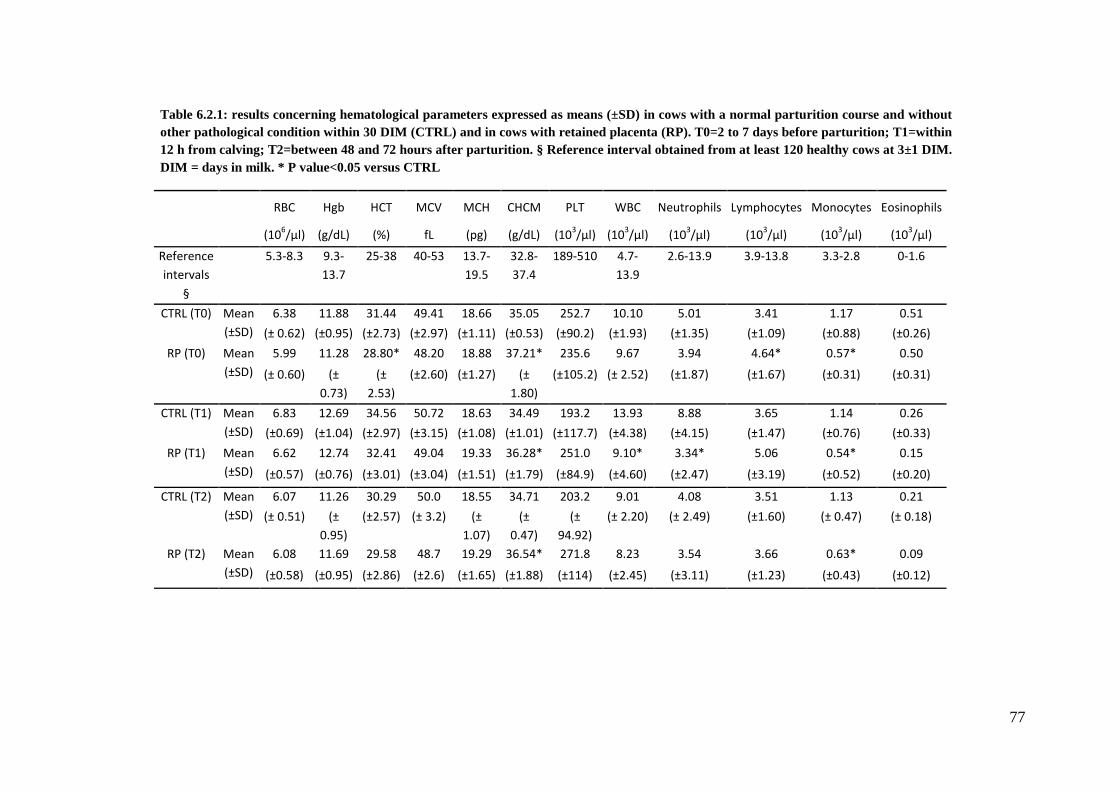
77
Table 6.2.1: results concerning hematological parameters expressed as means (±SD) in cows with a normal parturition course and without other pathological condition within 30 DIM (CTRL) and in cows with retained placenta (RP). T0=2 to 7 days before parturition; T1=within 12 h from calving; T2=between 48 and 72 hours after parturition. § Reference interval obtained from at least 120 healthy cows at 3±1 DIM. DIM = days in milk. * P value<0.05 versus CTRL
RBC Hgb HCT MCV MCH CHCM PLT WBC Neutrophils Lymphocytes Monocytes Eosinophils
(106/µl) (g/dL) (%) fL (pg) (g/dL) (10
3/µl) (10
3/µl) (10
3/µl) (10
3/µl) (10
3/µl) (10
3/µl)
Reference
intervals
§
5.3-8.3 9.3-
13.7
25-38 40-53 13.7-
19.5
32.8-
37.4
189-510 4.7-
13.9
2.6-13.9 3.9-13.8 3.3-2.8 0-1.6
CTRL (T0) Mean
(±SD)
6.38 11.88 31.44 49.41 18.66 35.05 252.7 10.10 5.01 3.41 1.17 0.51
(± 0.62) (±0.95) (±2.73) (±2.97) (±1.11) (±0.53) (±90.2) (±1.93) (±1.35) (±1.09) (±0.88) (±0.26)
RP (T0) Mean
(±SD)
5.99 11.28 28.80* 48.20 18.88 37.21* 235.6 9.67 3.94 4.64* 0.57* 0.50
(± 0.60) (±
0.73)
(±
2.53)
(±2.60) (±1.27) (±
1.80)
(±105.2) (± 2.52) (±1.87) (±1.67) (±0.31) (±0.31)
CTRL (T1) Mean
(±SD)
6.83 12.69 34.56 50.72 18.63 34.49 193.2 13.93 8.88 3.65 1.14 0.26
(±0.69) (±1.04) (±2.97) (±3.15) (±1.08) (±1.01) (±117.7) (±4.38) (±4.15) (±1.47) (±0.76) (±0.33)
RP (T1) Mean
(±SD)
6.62 12.74 32.41 49.04 19.33 36.28* 251.0 9.10* 3.34* 5.06 0.54* 0.15
(±0.57) (±0.76) (±3.01) (±3.04) (±1.51) (±1.79) (±84.9) (±4.60) (±2.47) (±3.19) (±0.52) (±0.20)
CTRL (T2) Mean
(±SD)
6.07 11.26 30.29 50.0 18.55 34.71 203.2 9.01 4.08 3.51 1.13 0.21
(± 0.51) (±
0.95)
(±2.57) (± 3.2) (±
1.07)
(±
0.47)
(±
94.92)
(± 2.20) (± 2.49) (±1.60) (± 0.47) (± 0.18)
RP (T2) Mean
(±SD)
6.08 11.69 29.58 48.7 19.29 36.54* 271.8 8.23 3.54 3.66 0.63* 0.09
(±0.58) (±0.95) (±2.86) (±2.6) (±1.65) (±1.88) (±114) (±2.45) (±3.11) (±1.23) (±0.43) (±0.12)

78
Table 6.2.2: clinical chemistry results expressed as means (±SD) in cows with a normal parturition course and without other pathological condition within 30 DIM (CTRL) and in cows with retained placenta (RP). T0=2 to 7 days before parturition; T1=within 12 h from calving; T2=between 48 and 72 hours after parturition. § Reference interval obtained from at least 120 healthy cows at 3±1 DIM. DIM = days in milk. * P value<0.05 versus CTRL
Calcium Creatinine Glucose Magnesium NEFA Phosphorous BOHB Total
proteins
(mg/dL) (mg/dL) (mg/dL) (mg/dL) (mmol/L) (mg/dL) (mmol/L) (g/dL)
Reference intervals at 3 ±1 DIM §
6.41-10.18 <1.47 51-87 1.51-3.04 0.16-1.63 2.54-6.26 0.38-1.71 4.8-8.3
CTRL (T0) Mean (±SD)
9.49 1.30 66.6 2.11 0.26 5.69 0.38 5.78
(± 0.91) (±0.20) (±3.6) (±0.22) (±0.15) (±0.94) (±0.12) (±0.45)
RP (T0) Mean (±SD)
9.55 1.19 65.7 2.21 0.22 6.17 0.48* 5.63
(± 0.36) (± 0.20) (± 5.4) (± 0.36) (± 0.20) (±0.72) (± 0.10) (±0.55)
CTRL (T1) Mean (±SD)
7.84 1.42 95.8 2.23 0.69 3.50 0.52 5.75
(±1.78) (±0.16) (±29.0) (±0.32) (±0.45) (±1.46) (±0.19) (±0.39)
RP (T1) Mean (±SD)
7.05 1.22 81.8 2.52 0.78 4.16 0.66 5.89
(±1.30) (±0.27) (±16.1) (±0.51) (±0.50) (±1.49) (±0.18) (±0.43)
CTRL (T2) Mean (±SD)
8.53 1.08 53.1 1.76 0.54 4.36 0.44 5.48
(± 0.79) (± 0.15) (± 11.7) (± 0.39) (± 0.25) (± 0.86) (± 0.11) (± 0.55)
RP (T2) Mean (±SD))
7.93 1.08 64.5 2.43* 0.48 5.40 1.00* 5.79
(±1.04) (±0.14) (±15.0) (±0.70) (±0.25) (±1.37) (±0.76) (±0.59)
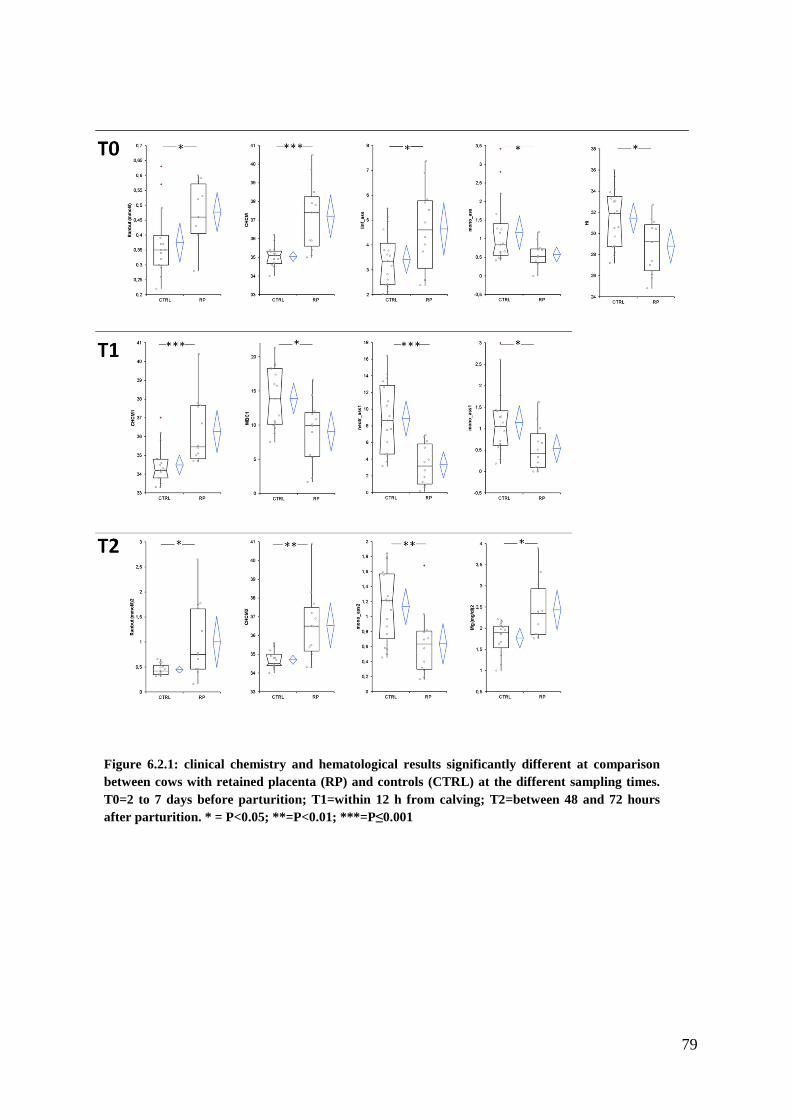
79
Figure 6.2.1: clinical chemistry and hematological results significantly different at comparison between cows with retained placenta (RP) and controls (CTRL) at the different sampling times. T0=2 to 7 days before parturition; T1=within 12 h from calving; T2=between 48 and 72 hours after parturition. * = P<0.05; **=P<0.01; ***=P ≤0.001

80
Figure 6.2.2: comparison of hematological parameters according to sampling time in cows with retained placenta. Boxes indicate the I-III interquartile interval, the horizontal line corresponds to the median, vertical lines are the limits of outlier distributi on according to the Tukey rule. Near outliers are indicated by the symbols “x” and far outliers with asterisks outside the boxes. T0=2 to 7 days before parturition; T1=within 12 h from calving; T2=between 48 and 72 hours after parturition. *= T0 versus T1(P<0.05); **= T0 versus T2 (P<0.05); ***= T1 versus T2 (P<0.05).

81
Figure 6.2.3: comparison of hematological parameters according to sampling time in CTRL cows. Boxes indicate the I-III interquartile interval, the hori zontal line corresponds to the median, vertical lines are the limits of outlier distribution according to the Tuk ey rule. Near outliers are indicated by the symbols “x” and far outliers with asterisks outside the boxes. T0=2 to 7 days before parturition; T1=within 12 h from calving; T2=between 48 and 72 hours after parturition. *= T0 versus T1(P<0.05); **= T0 versus T2 (P<0.05); ***= T1 versus T2 (P<0.05).

82
Figure 6.2.4: comparison of clinical chemistry results over time in cows with retained placenta. Boxes indicate theI-III interquartile interval, the horizontal lin e corresponds to the median, vertical lines are the limits of outlier distribution according to the Tukey rule. Near outliers are indicated by the symbols “x” and far outliers with asterisks outside the boxes. T0=2 to 7 days before parturition; T1=within 12 h from calving; T2=between 48 and 72 hours after parturition. *= T0 versus T1(P<0.05); **= T0 versus T2 (P<0.05); ***= T1 versus T2 (P<0.05).

83
Figure 6.2.5: comparison of clinical chemistry results according to sampling time in CTRL cows. Boxes indicate theI-III interquartile interval, the horiz ontal line corresponds to the median, vertical lines are the limits of outlier distribution according to the Tuk ey rule. Near outliers are indicated by the symbols “x” and far outliers with asterisks outside the boxes. T0=2 to 7 days before parturition; T1=within 12 h from calving; T2=between 48 and 72 hours after parturition. *= T0 versus T1(P<0.05); **= T0 versus T2 (P<0.05); ***= T1 versus T2 (P<0.05).

84
6.2.4 Discussion and conclusions
Both animals with RP and normal cows manifested an increase of the erythroid mass at
parturition, probably as a consequence of stress and reduction of water and food assumption
around this time (Bell, 1995). Only in CTRL cows that was followed by a drop in the days after
parturition with values that appeared lower than pre-partum. It may be speculated that this
difference could reflect a delay in the access to water and food or a more “stressful” post-partum
in cows that experience RP. However, in both the groups and in the three sampling times, RBC
values were within the reference intervals, thus this difference is most likely attributable to an
individual variation and/or a statistical artifact due to the low number of animals.
The leukocyte dynamics observed in CTRL cows may be justified by a normal leukogram in
response to the inflammatory and stressful stimuli necessary for the correct parturition course
(Beagley et al., 2010). In fact, stress leukogram changes in cattle include mild mature
neutrophilia, lymphopenia, eosinopenia and variable monocytosis (Tornquist and Rigas, 2010).
All these parameters returned to pre-partum values in the days after parturition, when probably
inflammatory and stressful stimuli are progressively decreasing. It is well known that
corticosteroids increase in the last weeks of gestation (Beagley et al., 2010) and is supposed to
maintain a status of immune suppression that is needed to avoid the early detachment of the link
between the cow and the foetus which is considered as non-self (Davies et al., 2000; Davies et
al., 2004). The majority of cows with RP, in contrast, did not show a tendency to these changes,
demonstrating the presence of a less responsive immune system at parturition. Differently to
what happen in CTRL cows, mean values of leukocyte count did not change across time in RP
cows that, however, have a lower number of circulating neutrophils and monocytes at parturition
than cows without RP. The absence of significant differences in the number of circulating
neutrophils before parturition between the two groups did not support the role of neutropenia as

85
an early predisposing factor to RP even if the low number of animals in this study should be
increased to support this hypothesis. The lower number in RP cows of circulating neutrophils
and monocytes at the time of parturition, both parts of the phagocytic system, may lead to an
insufficient availability of neutrophils and monocytes in the endometrium at parturition thus
reflecting a less efficient phagocytic system, likely affecting the proper dissolution of the fetal-
maternal link and thus the expulsion of the fetal membranes.
Around parturition, high producing cows are subject to an increased negative energy balance
(NEB) that favour an increased lipomobilization and the accumulation of NEFA in the blood
(Opsomer, 2015). The results of this study showed that the rate of NEB was similar in the two
groups (similar changes over time and concentration of NEFA and glucose) but cows that
subsequently successfully expelled the fetal membranes were able to maintain BOHB
concentration at lower levels compared to cows that retained the placenta. The possible
pathogenesis of RP involves the impaired number and activities of endometrial leukocytes
(Beagley et al., 2010). Different studies have proposed the role of hyperketonaemia, often
observed in peri-parturient cows, as a cause of leukocyte disfunction although in literature is
reported that very high concentrations of ketone bodies are necessary to interfere with leukocyte
activities in ruminants (Sartorelli et al., 1999 and 2000; Scalia et al., 2006). In the two groups,
both concentrations of NEFA and BOHB before and at parturition, when the mechanism
responsible for the release of the placenta must be activated, were found within the reference
range adopted in our laboratory for normal cows at 3±1 days. Even if huge increases of ketone
bodies were not observed in RP cows, the higher BOHB may have influenced the number of
circulating leukocytes as BOHB and AcAc at concentrations observed after parturition were
shown to inhibit the proliferation of hematopoietic cells (Hoeben et al., 2000).
Glucose and calcium had similar temporal changes in both the groups. These findings may be
explained with physiological changes occurring around parturition. In both groups, glucose

86
increased at parturition and decreased in the days after. This finding may be explained as the
effect of the stress or of the hemoconcentration due to the reduced access to water at parturition
followed by a return to water intake in the days after.
In the present study, both in RP and CTRL cows, calcium had the lowest mean concentration
soon after parturition and the values remained lower in the days after. This finding may be
related to the increased secretion of calcium in colostrum and the inadequate ability of the cow to
mobilize bone calcium to restore blood concentration (Martinez et al., 2012). In contrast with the
study from Melendez et al. (2004), where lower calcium concentrations 6 hours after parturition
were found only in cows that retained the placenta, compared to cows that normally expelled, in
the present study, this peculiarity was common for both the groups.
The very few differences observed and the similarity in variation over time between RP and
CTRL cow likely reflect the similar metabolic and hormonal changes that cows in both groups
had to deal with during the peri-partum. However, cows with RP were found to have some
important peculiarities around parturition that may give an insight in the unknown pathogenesis
of this condition. The most important finding in this part of the thesis was the observation of a
lack of neutrophil peak in the RP group at parturition. This finding, especially if supported by a
higher number of cases may have relevant diagnostic and prognostic implications. In fact, a
complete blood cell count, which is an easy to perform and cheap analysis, may provide, alone, a
helpful information. When performed at parturition, the finding of a neutropenia could predict
which cows are at high risk of retain fetal membranes, thus allowing a very early medical
intervention and possibly reduce economic and productive costs.

87
CHAPTER 7:
An attempt to prevent production diseases in
dairy cows by intense monitoring and ad hoc
treatment.

88
CHAPTER 7: AN ATTEMPT TO PREVENT PRODUCTION DISEASES IN DAIRY COWS BY INTENSE MONITORING AND AD HOC TREATMENT.
Preprint version of:
Coiatelli M., Giordano A., Sicilia F., Moretti P. , Durel L. An attempt to prevent production diseases in dairy cows by intense monitoring and ad hoc treatment. Italian Journal of Animal Science. 2015; 14:3918
7.1 Introduction
During the past two decades, considerable progress has been made in understanding the
physiology of the transition towards lactation in dairy cows (Drackley et al., 2006). During the
transition period, and particularly during the two weeks following parturition, dairy cows are
faced with an inevitable energy deficit (NEB), which will play a crucial role for the remainder of
lactation (Wensing et al., 1997).
Relations have already been reported between the duration and severity of periods of NEB, on
the one hand, and the incidence of certain diseases, on the other hand, particularly digestive
disorders and lameness (Collard et al., 2000). Between 30 and 50% of cows may suffer from a
metabolic or infectious disease just before or after calving (Ingvartsen et al., 2003; LeBlanc,
2010). The disorders associated with inadequate energy intake predispose cows to metabolic or
infectious diseases such as milk fever (MF), metritis (MET), acetoneamia (CK), displaced
abomasum (DA) and retention of the placenta (RP) (Esposito et al., 2014). The reciprocal
relations between the disorders referred to above have long since been demonstrated (Morrow,
1976; Curtis et al., 1985; Peeler et al., 1994; Heuer et al., 1999; Chapinal et al., 2011).
Uncomplicated CK, RP MET and MF are risk factors for DA (Shaver, 1997).

89
It is now an accepted fact that an extreme rate of mobilisation of fatty tissue is related to a high
incidence of metabolic diseases (Drackley, 1999). Such intense lipomobilisation leads to an
elevation in the serum concentration of non-esterified fatty acids (NEFA) and then to their
uptake by the liver, and to the accumulation of triglycerides in the latter. This accumulation of
fatty acids in the liver predisposes the cow to the induction of ketosis accompanied by an
elevation of serum beta-hydroxybutyrate (BOHB). Various authors have already demonstrated
that the blood levels of BOHB, NEFA and calcium (Ca) are closely correlated with the incidence
of production diseases (Hoedemaker et al., 2004; Goff, 2006; Stengärde et al., 2010; Chapinal et
al., 2011; Chapinal et al., 2012).
The idea of compensating a NEB by the daily administration of propylene glycol or glycerol,
starting from the last days of gestation and for 2 or 3 weeks after calving, is inconsistently
practiced in modern dairy farms although it has already been experimented by various authors (
Miettinen, 1995; Formigoni et al., 1996; Hoedemaker et al., 2004; Castañeda-Gutiérrez et al.,
2009; McArt et al., 2011; Lomander et al., 2012). In addition to the practical and economic
constraints involved, and although propane 1,2-diol is a permitted additive for animal feed in
Europe (EU Regulation 892/2010) and in the United States, the adjunction of a non-natural
additive to the ration of dairy cows may be questioned. It may be judicious to use propylene
glycol sparingly in the form of a prescription drug. Some authors have already suggested the
strategic use of blood tests for the detection of animals suffering from sub-clinical ketosis. The
measurement of NEFA should be used during the last week of gestation and that of BOHB
during the first week post-partum (McArt et al., 2013).
The purpose of this study was to verify whether systematic screening for sub-clinical ketosis
during the transition period (2 weeks before and after calving) via the measurement of the blood
levels of BOHB and NEFA, followed by ad hoc treatment with propylene glycol, calcium
propionate, betaine, niacin and molasses (ENERGAN KETOSIS, Virbac) and by selective
treatment with calcium (ENERGAN CALCIUM) for as long as necessary to restore the normal

90
values of these metabolites could have an impact on the morbidity and incidence of MF, RP,
MET and DA during the immediate post-partum period.
7.2 Material and methods
The study was conducted in specialised dairy farms in the region of Milano (Italy) which had
volunteered to take part in the trial. The farms were monitored by the same veterinary practice
and were located close to the laboratory. All samplings points aimed to monitor the transition
period disturbances and were performed under informed consent of the breeders. Blood (10 mL)
were taken from all the animals during or just after the morning meal as animals were restrained
for feeding, placed in plain tubes and immediately delivered to the laboratory. After
centrifugation (2,200 g X 10 minutes), serum was separated and analysed soon after.
Concentration of NEFA, BOHB and calcium were measured by means of an automated
spectrophotometer (ILAB 300 plus; Instrumentation Laboratory S.p.a., Milan, Italy) using
commercially available kits: NEFA (Acetyl CoA synthetase colorimetric method, Randox
Laboratories Ltd., Crumlin, Co. Antrium, UK) and BOHB (D-3-Hydroxybutyrate dehydrogenase
method, Randox Laboratories Ltd., Crumlin, Co. Antrium, UK), calcium (orthocresoftaleine
method; Instrumentation Laboratory S.p.a., Milan, Italy).
The investigating veterinarian was responsible for evaluating the annual incidence of DA, RP,
MF, MET and CK, one of which must exceed 5, 15, 10, 10, 10% respectively.
Monitored animals were gestating dairy cows. The size of the population was set at about 200
animals. Animals were recruited according to their foreseeable due date. No animal was
excluded a priori if gestation was confirmed. Animals were maintained in permanent open
housing, with individual bedding cubicles. Towards the end of gestation, the animals were fed a
diet of corn silage, straw and concentrates. Glucogenic treatments were prohibited and their use
was grounds for exclusion.

91
7.2.1 Follow-up protocol
The animals were included starting at 2 weeks before the presumed date of parturition. The study
was continued until 15 days after calving. A computerised data-collection form provided, for
each animal, the dates of the blood samples and the tests to be performed. Sampling on day d±1
was tolerated, according to the day of the week on which the animals were included. Overall,
blood samples were taken 3 times a week from the animals monitored. The results from the
laboratory were available late in the afternoon. The sampling plan was as follows:
• First week of the study (14-7days pre-partum): all the animals in both groups had
samples taken for the measurement of BOHB and NEFA.
• Second week of the study (7 days pre-partum up to the date of parturition), all the
animals had samples taken for the measurement of BOHB, NEFA and Ca.
• Third week of the study (first week post-partum): all the animals were monitored for
BOHB and Ca.
• Fourth week (final sample) of the study (7-15 days post-partum): all the animals were
monitored for BOHB.
7.2.2 Treatment given the animals
Animals presenting levels of BOHB>1.2 mmol/L or of NEFA>0.5 mmol/L for the first time
were considered as POSITIVE animals. Positive animals with an odd-numbered ear tag (last
digit) were included in the treatement group (group T) and were then drenched on a daily basis,
with a glucogenic medication containing propylene glycol (122 g), calcium propionate (11 g),
betaine (7 g), niacin (5 g) and molasses (~150 g) until the biological values returned to normal.
Others POSITIVE animals (even-numbered ear tag) were left untreated and served as control
(group C). Animals with BOHB and NEFA within the physiological range all over the study
period were declared NEGATIVE (Fig. 1).

92
Hypocalcemia, even if mild, was judged to be a potential bias, liable in itself to jeopardise the
possible beneficial effect of the glucogenic treatment. In an attempt to control it, calcium was
therefore administered selectively at the time of parturition. The effects of the two treatments
were therefore merged. Animals with an odd-numbered ear tag (last digit), including POSITIVE
and NEGATIVE animals were also equipped with a parturition detector (VEL’PHONE, Medria,
France), in order to be able to treat them with calcium in due time. When the parturition detector
made it possible to predict the hour at which calving would occur, the animals involved received
41.4 g of elemental calcium 12 h prior to parturition and 12 hours after it, in the form of a
commercial preparation containing calcium propionate and chloride associated with disodium
phosphate and magnesium oxide (ENERGAN CALCIUM, Virbac).
7.2.3 Data collection and processing
The occurrence of DA, MF, RP, CK and MET during the study period was recorded for all the
animals in order to compare the incidence of those diseases in each group.
In order to allow the processing of the blood tests, the calving dates had to be made to coincide
and the values relating to dates -1, -2, -3, and so on had to be processed n-1 day prior to
parturition and those relating to dates +1, +2, +3, and so on, had to be processed n+1 day after
that date. However, while 80% of calvings in artificially inseminated Holstein cows occur
272±10 days after insemination (Matthews and Morton, 2012), predicting the exact date of
parturition in an individual remains problematic. As a result, and without even taking into
account the uncertainties regarding the presumed date of term, the date of the animals’
incorporation into the follow-up may be somewhat distant from the date of calving. In addition,
since blood samples were taken in each animal about 1 out of every 3 days (d±1), the number of
values able to be processed for each of the three groups and for each day prior to calving may be
expected to possibly be small. Moreover, in cows, the physiological distribution of BOHB serum
concentrations may be very broad (<0.4 to >1.2 mmol/L) (Enjalbert et al., 2001). The

93
combination of such phenomena may lead to a significant loss of statistical power over the pre-
partum period, which would not do justice to the importance of the work done. We thus propose
to group the pre-partum data together, on the basis of the following principles:
• Metabolic changes having a significant impact on the health of a cow are unlikely more
than 2 weeks before calving. They may then appear gradually and possibly accelerate
suddenly during the days prior to parturition.
• The performance of a blood test a week before the presumed date of calving, for the
purpose of anticipating a possible metabolic problem, would already constitute a practical
advance. The test could be renewed a week later, if the cow had not calved. It is
unreasonable to expect farmers to agree to additional tests.
• Consecutive daily data that are not significantly different have been grouped together.
• Data series that remained incomplete following consolidation have been excluded.
The samples were thus grouped together as follows:
• Pre-partum: 3 periods that are meaningful from a biological and operational viewpoint:
[-30;-13], [-12;-7] and [-6;-1] days.
• Post-partum: the situation was simpler. The periods chosen were 1, 4, 7, 10, 13 days ±1
day ([0-2], [3-5], etc.
The data were analysed at DIVET using the Analyse-it software (Analyse-it Ltd, Leeds, UK).
The relative incidence of the diseases monitored were compared via a chi-2 test. The evolution
of the relative blood levels of various metabolites over time was analysed via the non-parametric
ANOVA test for paired measurement, followed by a Wilcoxon signed rank test to assess the
difference between single groups.

94
Figure 7.1: Study design and experimental groups, group definition and size (n). POSITIVE animals are animals with BOHB or NEFA values out of the physiological range (>1.2 or 0.5 mmol/L respectively). POSITIVE animals are therefore treated with a glucogenic medicine (group T) or left untreated (group C), according to final digit of their ear tag (even number=C; odd number=T). Positive animals were also drenched with an oral calcium solution at calving time.
7.3 Results
Two dairy farms and 201 animals were included in this trial. The final study population is
represented in figure 7.1.
7.3.1 Application of glucogenic treatments
Fifty-seven animals received glucogenic treatment during the study. The average treatment
duration was 4.6 days, involving one dose per day of the commercial product. All treatment took
place before parturition. Forty-three animals (75%) did not require any other treatment. Ten
animals relapsed and had to be treated again for a mean duration of 6.2 days.
7.3.2 Prevalence of the diseases monitored
A total of 57 animals (28.4%) were diagnosed as having one of the monitored diseases during the
trial period (SICK animals). The total numbers of animals (and percentages) presenting DA, MF,
RP or CK was 9 (4.5%), 4 (2.0%), 20 (10.0%) and 38 (18.9%), respectively. No puerperal
metritis (MET) was reported in any group. The incidence of the various conditions in all
experimental groups is reported in Table 7.1.

95
A comparison between negative and control animals in one hand, and negative and treated
animals in the other hand, revealed the following points:
• Animals belonging to group C (tests+ but untreated) were significantly (p<0.01) more
SICK than NEGATIVE animals (test-), and presented significantly more CK (p<0.01)
and DA (p<0.05).
• Animals belonging to group T (tests+ and treated) were significantly (p<0.01) more
SICK than negative animals and presented significantly more CK (p<0.05). Regarding
DA and other conditions differences are not significant.
• There is no significant difference between group C and group T animals for any of the
monitored conditions.
Table 7.1: Statistical comparison of the distribution of animals affected by diseases (sick) or by specific a condition in negative animals (BOHB and NEFA within the range), in positive and treated animals (group T) and in positive and untreated controls (group C) *Yate’s correction applied. **Fisher’s exact test. Threshold of significance: p<0.05
Overall Negative animals
Positive animals
(C)
Positive animals
(T)
Negative vs positive animals
Negative animals
vs C
Negative animals
vs T Affected/
not affected affected/
non affected (%) affected/
non affected (%) affected/
non affected (%) P values
Sick 57/144 (28.3)
15/81 (15.6)
22/26 (45,8)
20/37 (35,1)
<0.001 <0.001 0.006
Displaced abomasum (DA)
9/192 (4.5)
2/94 (2.1)
5/43 (10.4)
2/55 (3,5)
0.116
0.028
0.593
Milk fever (MF) 4/197 (2.0)
2/94 (2.1)
1/47 (2,0)
1/56 (1,8)
0.928 1.000 0.887
Retention of the placenta(RP)
20/181 (9.9)
6/90 (6.2)
7/41 (14,6)
7/50 (12,3)
0.093 0.099 0.196
Clinical ketosis (CK)
38/163 (18.9)
9/87 (9.4)
17/31 (35,4)
12/45 (21,1)
<0.001 <0.001 0.042

96
7.3.3 Blood chemistry tests pre-partum
Dispersion of calving
The median time elapsing between the inclusion of the animals and calving was 18 days, 50% of
cows having calved between 15 and 21 days. The rest of the animals calved between 49 and 0
days after inclusion.
Dispersion of blood chemistry results
Although 2459 blood tests were performed on the animals, the number of samples available for
each day prior to calving varied from 59 (NEFA, -12 days) to 0 (Ca, -27 days).
The samples from 3 pre-partum periods, i.e. [-30;-13], [-12;-7] and [-6;-1] days, were grouped
together as explained in the materials & methods section. After eliminating the cases for which
the data set was incomplete, the final number of animals for which statistical analysis was
possible is presented in Table 7.2. Concerning post-partum, most of the blood test results could
not be included for comparison with the pre-partum results due to the problem of heterogeneity
between the groups, as referred above. The numbers of samples that could be compared, both for
Ca and for BOHB, are indicated in Table 7.3.
Table 7.2. Number of cases included in the statistical comparison of results BOHB grouped by 3 consecutive days from day -29 to day -2 pre-partum.

97
Table 7.3: number of cases included in the statistical comparison of results recorded post-partum
BOHB results
The results recorded for BOHB during the pre-partum period (Figures 7.2 and 7.3) showed that
serum levels of BOHB increased during this period in all groups. For all the samples collected
after d-12, those levels were significantly higher than during the -30/-13 days period, and as
early as day -6 they were significantly higher than during the -12/-7 days period. At no time
during monitoring, were significant differences between groups C, T and negative animals noted
(data not presented). Post-partum, the comparison of results recorded in the two groups day by
day did not revealed significant differences between controls and treated animals (Figures 7.2
and 7.3).
NEFA results
Results concerning NEFA concentration are shown in figures 7.4 and 7.5. The results recorded
for NEFA during the pre-partrum period showed significant differences (p<0.001) in group T. In
this group NEFA blood serum concentration dramatically increased from day 30 before calving
to the very last days of gestation.
Calcium results
Pre-partum and post-partum results from calcium are graphically reported in figure 7.6. In the
pre-partum period, due to the low number of animals in the experimental groups, it was not
possible to assess a possible difference between these groups nor to investigate the trend over
time detectable in groups. Also in cows treated with calcium no relevant changes were found.
number
Controls 100
Treated 91 T- 37
T+ 54
TOTAL 191

98
Concerning the post-partum samples no significant differences between treated and untreated
animals were observed
Figure 7.2: distribution of serum BOHB values and statistical comparison of results recorded pre-and post-partum in controls(C) and in the whole group of treated animals (T+ and T-). Boxes indicate the I-II interquartile interval, the horizontal line corresponds to the median, the vertical lines are the limits of outlier distribution according to the Tukey rule. Near outliers are indicated by the symbols “+”; far outliers are indicated by the orange asterisks outside the boxes. The black bolded symbols reported below each box and whiskers indicate significant differences between groups as follows: * = P<0.05 vs days -30 -13; *** = P<0.001 vs days -30 -13; † = P<0.05 vs days -12 -7; †† = P<0.01 vs days -12 -7; ††† = P<0.001 vs days -12 -7; ‡ = P<0.05 vs days -6 -1; ‡‡ = P<0.01 vs days -6 -1; ǁ = P<0.05 vs day 1.
Figure 7.3: distribution of serum BOHB values and statistical comparison of results recorded pre-and post-partum in animals from groups T+ and T-. See figure 7.2 for interpretation of box and whiskers. The black bolded symbols reported below each box and whiskers indicate significant differences between groups as follows: * = P<0.05 vs days -30 -13; ** = P<0.01 vs days -30 -13; *** = P<0.001 vs days -30 -13; † = P<0.05 vs days -12 -7; †† = P<0.01 vs days -12 -7; ††† = P<0.001 vs days -12 -7; ‡ = P<0.05 vs days -6 -1.

99
Figure 7.4: distribution of serum NEFA values and statistical comparison of results recorded pre- partum in controls (C) and in treated animals (T+ and T-). See figure 7.2 for interpretation of box and whiskers. The black bolded symbols reported below each box and whiskers indicate significant differences between groups as follows: *** = P<0.001 vs days -30 -13; ††† = P<0.001 vs days -12 -7.
Figure 7.5: comparison of results from NEFA recorded pre-partum in each group of sampling days in Controls (C) and in animals from group T+ and T-. See figure 7.2 for interpretation of box and whiskers. *** = P<0.001 vs group C; ††† = P<0.001 vs group T+

100
Figure 7.6: distribution of serum Ca and statistical comparison of results recorded pre-and post-partum in controls and in treated animals (T+ and T-). See figure 7.2 for interpretation of box and whiskers. The black bolded symbols reported below each box and whiskers indicate significant differences between groups as follows: ** = P<0.01 vs day 1; *** = P<0.001 vs day 1; † = P<0.05 vs day 4; †† = P<0.01 vs day 4.
7.4 Discussion
This study was conducted in order to verify whether it would be possible to decrease the
incidence of metabolic related diseases in dairy cows presenting metabolic abnormalities during
the transition period (altered blood concentration of BOHB, NEFA and to a lesser extent Ca), by
administering a commercial product containing molasses, propylene glycol, calcium propionate
and niacin and selective treatment with calcium at the time of calving.
The main result of this study shows that animals that always had levels of NEFA<0.5 and of
BOHB<1.2 mmol/L (negative animals) during the pre-partum period are significantly (p<0.01)
unlikely to develop one of the diseases monitored (DA, MF, RP or CK) than positive animals.
Specifically, positive animals were more likely to get CK (p<0.01) and in a lesser extend RP
(p=0.09).
Group T animals were always less sick and always presented less incidence of DA, MF, RP and
CK than those belonging to group C. Animals in which the correction of those transition diseases
was not attempted (group C) were more likely to get sick (p<0.01), to get CK (p<0.01) as well,
to get DA (p=0.03) and in a lesser extend to get RP (p=0.09), than negative animals. In contrast,

101
treated animals (group T) were more likely to get sick (p<0.01) and to get CK (p=0.04) than
negative individuals. Differences with negative animals were no longer significant for DA and
RP, pointing out a possible interest of treating dairy cows with a glucogenic medicine as soon as
they display elevated blood serum BOHB or NEFA. Based on the design of the study, we cannot
exclude the possibility that some of the animals of this group developed one of the diseases
mentioned above after the end of this study. However, this is unlikely since most of these
conditions usually occur just after parturition. Moreover, in the case of the animals presenting a
distinct elevation of BOHB or NEFA at any time prior to calving, the daily treatment with PG
(group T) allowed a permanent return to normal values in 75% of them within 4 to 5 days.
The biochemical results for the pre-partum period were grouped together into weekly or
fortnightly periods ([-1;-6], [-7;-13] and [-13;-30] days before calving), such periods being
clinically and practically significant. For the post-partum period, the exact date of the blood
sample was chosen. Whatever the period considered, it was not possible to observe any
significant difference between the various groups of animals. This difficulty is ascribed to the
great variability of the individual data and to the small size of each group, for each period.
However, a significant (p<0.001) increase in BOHB levels was observed during the pre-partum
period. That increase continued during the post-partum period, after which the values returned to
normal. Non-esterified fatty acid levels increased significantly (p<0.001) during the pre-partum
period. Ca levels remained rather equal during the study period, except for a significant drop 1
and 4 days after calving.
The incidences of the four diseases monitored are those usually reported by the literature (Goff,
2006; Mulligan et al., 2006; Parker Gaddis et al., 2012), except in the case of clinical ketosis
(CK), For the negative animals the incidence of CK is slightly higher than those reported in the
literature (0 to 5%), but for the other groups the incidence is more comparable to that reported
for sub-clinical ketosis (20 to 40% or even more) (McArt et al., 2013, 2011).

102
Various blood parameters have been used as advanced indicators of an energy imbalance
(Stengärde et al., 2010; Hailemariam et al., 2014). However, NEFA and BOHB measurements
are among the most convenient, as blood BOHB can also be measured next to the cow by means
of small portable devices (Optium Xceed, Abbott Laboratories) (Voyvoda and Erdogan, 2010).
The threshold values chosen for this study are the same as those used by others (LeBlanc et al.,
2005; Mulligan et al., 2006; McArt et al., 2011; McArt et al., 2012; McArt et al., 2013). NEFA
and BOHB levels provide two measures of the severity of energy imbalance. It is now well
known that this imbalance affects both cows at the start of lactation and dry cows at the end of
gestation and predisposes them to LDA, RP, dystocia, fatty liver, CK and other problems
(Mulligan et al., 2006). LeBlanc (LeBlanc, 2010) reports that NEFA>0.4 mmol/L during the 7 to
10 days before calving multiplies the risk of LDA by 2 to 4 fold and the risk of RP by 2 fold.
Likewise, BOHB>1,2 mmol/L after calving multiplies the risk of LDA by 3 to 8 fold and the risk
of CK by 4 to 6 fold. The observations reported here fully agree with those findings, since the
negative animals were less (or significantly less) affected than the positive animals.
The early detection of sub-clinical ketosis on the basis of measurements of BOHB and NEFA,
for the purpose of instituting corrective treatment and subsequently reducing the incidence of
metabolic related diseases, has already been proposed by other authors (Hoedemaker et al., 2004;
Overton and Waldron, 2004; Lomander et al., 2012; McArt et al., 2012). While it is possible,
generally speaking, to have an effect on the serum concentrations of BOHB and NEFA, the
results in regards the cows’ health, are however, diverse. Some have ascribed the lack of
effectiveness of such treatments to the fact that the studies are conducted on herds of high-
producing cows, an objective that can be attained only thanks to excellent management of the
stock, and the cows can then go through the NEB period without any particular consequences
(Hoedemaker et al., 2004). Overton et Waldron (Overton and Waldron, 2004) have stated that, in

103
the absence of proven positive benefits, the routine administration of propylene glycol is not
recommended.
7.5 Conclusion
This study confirms that an aggressive monitoring of pre-partum blood level would help to
identify animals at increased risk to develop a production disease in the early post-partum.
Although the proposed on demand glycogenic treatment shows a sharp decrease in the incidence
of DA in animals with biochemical abnormalities and results in an absence of statistical
difference between treated and negative animals, other studies involving more aggressive
therapeutic diets and more animals would be worth conducting.

104
CHAPTER 8
General discussion and conclusions

105
CHAPTER 8: GENERAL DISCUSSION AND CONCLUSIONS
Ideally, due to the variation in methods, procedures, sampling sites and population of animals
sampled among different laboratories, each diagnostic laboratory should establish a set of
reference intervals for all the parameters and all the species analysed. Even if the transference of
existing RIs may be possible in some circumstances, this may be not applicable when all the
information concerning possible sources of variation are not available. In accordance to the
guidelines recently published by the American Society for Veterinary Clinical Pathology
(ASVCP) (Friedrichs et al., 2012), reference intervals for healthy high producing dairy cows
around 3 and 30 days after calving were established as shown in the study presented in chapter
5. The adoption of separated RIs for these two different moments of lactation was mandatory due
to the remarkable metabolic, hormonal, and immune changes occurring during the post-partum
period but was also supported by the statistical analysis as shown in the study. The statistical
analysis confirmed also some known differences concerning the variation occurring in the early
post-partum period, such as the higher degree of negative energy balance (higher NEFA and
BOHB), increased inflammatory status (higher ceruloplasmin and haptoglobin, and lower
paraoxonase-1), and the increased oxidative stress (higher dROMs) near parturition. The
establishment of RIs may be based on an a priori study, characterized by the determination of
inclusion and exclusion criteria preceding the sampling or, as happened in this case, through the
selection of data from an existing database, with an a posteriori method (Friedrichs et al. 2012).
In the present case, the availability of a database derived from a large field study allowed us to
select a sufficient number of reference values (results obtained from a selected reference
individuals selected according to the inclusion and exclusion criteria) belonging to cows that
were clinically healthy for the whole lactation period and that had production and fertility
consistent with the normal standard of dairy herds of our geographical area. This allowed also to
reduce the variability of results, leading to the establishment of narrower reference intervals

106
compared to the previously adopted reference intervals in many cases. According to the aims, in
the same work, the possible effects of herd, days of sampling and parity were evaluated,
evidencing only rare variations mainly regarding the samples obtained 30 days post-partum.
Even if the low number of samples in each subgroup did not allow to establish specific RIs for
the affected variables, some important information can be derived from these results. In
particular, the differences observed among the herds one month after parturition highlighted that
during a period less influenced by huge metabolic and hormonal variations as occurs one month
after parturition, also slight differences in dietary and management strategy may reflect in
changes of some metabolic and inflammatory variables, with a higher magnitude compared to
the peri-parturient period.
Moreover, the metabolic, hormonal, and inflammatory variations occurring during transition,
point out the importance to find possible markers that early indicate the presence of a subclinical
condition in cows. Based on the published literature available, this is the first time that RIs for
the main acute phase proteins (APPs) in cows (paraoxonase-1, haptoglobin, ceruloplasmin)
(Giordano et al., 2004; Eckersall and Bell, 2010) and for some markers of oxidative stress
(dROM and thiol groups) were provided. APPs are promising early markers of inflammation due
to their rapid increase or decrease during this condition (Bertoni et al., 2008; Huzzey et al.,
2011). Markers of oxidative stress are of relatively recent adoption in dairy monitoring but, as
stated in the general introduction of this thesis, their role may be crucial to understand the
relationship between metabolism and inflammation during the transition period (Sordillo and
Mavangira, 2014).
The RIs established in the present thesis were generated for laboratory methods that are
commonly available in routine practice. Commonly applied biochemical parameters, but also
recently adopted inflammatory and oxidative parameters, were all performed on automated
biochemistry analyzers, helping the standardization of the procedures and reducing the cost of
analyses, a primary issue for dairy industry. In practice, these RIs may be useful for practitioners
107
to interpret results from cows in different lactation stages, especially in our geographical area.
Moreover, applying a transference method (schematically represented in figure 8.1), every
laboratory could adopt these RIs, provided that the laboratory’s animal patient population and
laboratory methods of the ‘receiving’ laboratory are appropriate (Friedricks et al., 2012).
Concerning the second aim of the thesis, even if a prognostic role of the investigated parameters
in predicting the occurrence of retained placenta (RP) was not completely confirmed (based on
the low number of affected cows enrolled in the study), some peculiarities in the biochemical,
hematological and inflammatory patterns associated with the peri-partum in dairy cows with and
without retained placenta had been shown in chapter 6. Concerning differences between healthy
and diseased animals, the combined results from the two works evidenced a lack in peripheral
neutrophils increase and lower neutrophil and monocyte concentrations at parturition in cows
that retained placenta compared to not affected cows. Thus, although a similar pattern of NEB
was present in the two groups, as shown by the presence of metabolic parameters within
reference intervals before and soon after parturition in both the groups, a lower mass of
phagocytes was present at parturition in blood of cows that subsequently developed RP. This
deficiency occurs when one of the mechanisms responsible of the disruption of the feto-maternal
link that involves the local presence of these cellular elements should be working efficiently
(Beagley et al., 2010). In addition to the alteration of the normal leukocyte functions, found
associated with retained placenta in different studies (Gunnink, 1984a, Gunnink, 1984b,
Gunnink, 1984c, Gunnink, 1984d; Kimura et al., 2002b), the insufficient number of peripheral
leukocytes may reflect a decreased availability of cells for migration into the endometrium. Due
to the primary role of the aspecific immune response during transition, attempts to increase the
number and functionality of leukocytes at parturition, in order to improve the ability of the cow
to prevent clinical production diseases are in course (Kimura et al., 2014).
It is well known that disease prevention requires the adoption of a multidisciplinary team
approach involving the farmer, the veterinarian, the nutritional and animal breeding consultants

108
(Mulligan and Doherty, 2008). The present thesis highlights the important role that the veterinary
clinical pathologist may have in the strategic prevention and monitoring of dairy herd diseases.
According to this topic, the study reported in chapter 7 confirmed the utility of the monitoring
of blood level of specific metabolic parameters to identify cows at increased risk of disease. In
this study, the use of cut-off values for NEFA and BOHB was applied in conjunction with
clinical signs in order to identify animals requiring intervention. The absence of significant
differences of these metabolites across time in both groups with low and high incidence of
diseases, once more highlights the limited power of the adoption of thresholds to identify
animals requiring intervention to prevent production diseases. Different thresholds, also called
decision limits, concerning NEFA and BOHB have been established experimentally and by
consensus, in order to discriminate between individuals or groups of cows with and without
subclinical diseases (Opsomer, 2015). However, the analytical variability among methods and
instruments used in different laboratories become even more relevant when these thresholds are
applied by practitioners which often use cow-side tests that are characterized by lower sensitivity
and specificity compared to the gold standards (Oetzel, 2004).
The execution of laboratory tests in dairy herds is often hampered by economical and practical
factors that limit the monitoring to only few parameters (namely NEFA and BOHB). Based on
the results achieved in this thesis, it could be suggested that, in order to find possible subclinical
conditions associated to metabolic, immune and oxidative disturbances during the transition
period, a wider panel of analytes, from a consistent number of the herd individuals, should be
applied. Moreover, each animal should be considered individually, taking in mind the possible
sources of variability deriving from the effect of parity, distance from parturition, season of
production, and management of the herd. The combination of this knowledge with those derived
from clinicians, nutritionists and farmers is the gold standard in the final monitoring of the health
of dairy cows.

109
In conclusion, the generation of RIs specific for 3±1 days after parturition, characterized by the
start of lactation, and 30±3 days from parturition, when dairy cow metabolism is reaching a more
stable phase, is of primary importance in the interpretation of laboratory results, since the
application of non specific RIs may lead to the incorrect classification of animals as diseased or
healthy, in absence of clear clinical or productive issues. All these considerations need to be kept
in mind for the proper use of laboratory data in the management of the dairy herd.
Figure 8.1: Algorithm of actions to validate the RIs provided in the present thesis for the use in other laboratories. From Geffré et al. (2009)

110
REFERENCES
Arthington, J.D., Qiu, X., Cooke, R.F., Vendramini, J.M.B., Araujo, D.B., Chase, C.C., Coleman, S.W., 2008. Effects of preshipping management on measures of stress and performance of beef steers during feedlot receiving. J. Anim. Sci. 86, 2016–2023.
Barkema, H.W., von Keyserlingk, M.A.G., Kastelic, J.P., Lam, T.J.G.M., Luby, C., Roy, J.-P., LeBlanc, S.J., Keefe, G.P., Kelton, D.F., 2015. Invited review: Changes in the dairy industry affecting dairy cattle health and welfare. J. Dairy Sci. 98 (11), 7426-45.
Beagley, J.C., Whitman, K.J., Baptiste, K.E., Scherzer, J., 2010. Physiology and treatment of retained fetal membranes in cattle. J. Vet. Intern. Med. 24, 261–268.
Bell, A.W., 1995. Regulation of organic nutrient metabolism during transition from late pregnancy to early lactation. J. Anim. Sci. 73, 2804–2819.
Bertoni, G., Trevisi, E., 2013. Use of the Liver Activity Index and other metabolic variables in the assessment of metabolic health in dairy herds. Veterinary Clinics of North America Food Animal Practice: 29(2), 413–431.
Bertoni, G., Trevisi, E., Han, X., Bionaz, M., 2008. Effects of inflammatory conditions on liver activity in puerperium period and consequences for performance in dairy cows. J. Dairy Sci. 91, 3300–3310.
Bertoni, G., Trevisi, E., Lombardelli, R., 2009. Some new aspects of nutrition, health conditions and fertility of intensively reared dairy cows. Ital. J. Anim. Sci. 8, 491–518.
Bionaz, M., Trevisi, E., Calamari, L., Librandi, F., Ferrari, a, Bertoni, G., 2007. Plasma paraoxonase, health, inflammatory conditions, and liver function in transition dairy cows. J. Dairy Sci. 90, 1740–1750.
Bobe, G, Young, J.W., Beitz, D.C., 2004. Invited review: Pathology, etiology, prevention, and treatment of fatty liver in dairy cows. J Dairy Sci. 87, 3105–3124.
Bochsler, P., Slauson, D., 2002. Inflammation and repair of tissues, in: Slauson, D., Cooper, B. (Eds.), Mechanisms of Disease. Mosby, St. Louis, MO, pp. 140–245.
Bolla, A., Fantini, A., 2003. Incidenza di alcune patologie post-parto nella vacca da latte: risultati preliminari. Atti della Soc. Ital. di Buiat. 25, 361–368.
Boos, A., Janssen, V., Mülling, C., 2003. Proliferation and apoptosis in bovine placentomes during pregnancy and around induced and spontaneous parturition as well as in cows retaining the fetal membranes. Reproduction 126, 469–480.
Bourne, N., Laven, R., Wathes, D.C., Martinez, T., McGowan, M., 2007. A meta-analysis of the effects of Vitamin E supplementation on the incidence of retained foetal membranes in dairy cows. Theriogenology 67, 494–501.

111
Bradley, P.P., Priebat, D.A., Christensen, R.D., Rothstein, G., 1982. Measurement of cutaneous inflammation: estimation of neutrophil content with an enzyme marker. J. Invest. Dermatol. 78, 206–209.
Braun J.P., Lefebvre H.P., 2008. Kidney function and damage. In: Kaneko J.J., Harvey J.W., Bruss M.L. (eds) Clinical Biochemistry of Domestic Animals. 6th ed, Burlington, MA: Academic Press, 485-528.
Brscic, M., Cozzi, G., Lora, I., Stefani, A.L., Contiero, B., Ravarotto, L., Gottardo, F., 2015. Short communication: Reference limits for blood analytes in Holstein late-pregnant heifers and dry cows: Effects of parity, days relative to calving, and season. J. Dairy Sci. 98, 7886–7892.
Bruss, M.L., 2008. Lipids and Ketones. In: Kaneko JJ, Harvey JW, Bruss ML, eds. Clinical Biochemistry of Domestic Animals. 6th ed. Burlington, MA: Academic Press, 81-115.
Butler, W.R. 2005. Nutrition, negative energy balance and fertility in the postpartum dairy cow. Cattle Pract.13, 13–18.
Cai, T.Q., Weston, P.G., Lund, L.A., Brodie, B., McKenna, D.J., Wagner, W.C., 1994. Association between neutrophil functions and periparturient disorders in cows. Am. J. Vet. Res. 55, 934–943.
Carlson, G.P. and Bruss, M., 2008. Fluid, electrolyte, and acid-base balance. In: Kaneko JJ, Harvey JW, Bruss ML, eds. Clinical Biochemistry of Domestic Animals. 6th ed. Burlington, MA: Academic Press, 529-559
Castañeda-Gutiérrez, E., Pelton, S.H., Gilbert, R.O., Butler, W.R., 2009. Effect of peripartum dietary energy supplementation of dairy cows on metabolites, liver function and reproductive variables. Anim. Reprod. Sci. 112, 301–315.
Chapinal, N., Carson, M., Duffield, T.F., Capel, M., Godden, S., Overton, M., Santos, J.E.P., LeBlanc, S.J., 2011. The association of serum metabolites with clinical disease during the transition period. J. Dairy Sci. 94: 4897–4903.
Chapinal, N., LeBlanc, S.J., Carson, M.E., Leslie, K.E., Godden, S., Capel, M., Santos, J.E.P., Overton, M.W., Duffield, T.F., 2012. Herd-level association of serum metabolites in the transition period with disease, milk production, and early lactation reproductive performance. J. Dairy Sci. 95, 5676–5682
CLSI, Clinical and Laboratory Standards Institute. 2008. Defining, Establishing, and Verifying Reference Intervals in the Clinical Laboratory; Approved Guidelines. 3rd ed. Wayne, PA
Collard, B.L., Boettcher, P.J., Dekkers, J.C., Petitclerc, D., Schaeffer, L.R., 2000. Relationships between energy balance and health traits of dairy cattle in early lactation. J. Dairy Sci. 83: 2683–2690.
Contreras, G.A., Raphael, W., Mattmiller, S.A., Gandy, J., Sordillo, L.M. 2012. Nonesterified fatty acids modify inflammatory response and eicosanoid biosynthesis in bovine endothelial cells. Journal of Dairy Science 95, 5011–5023.

112
Cozzi, G., Ravarotto, L., Gottardo, F., Stefani, L., Contiero, B., Moro, L., Brscic, M., Dalvit, P., 2011. Short communication: reference values for blood parameters in Holstein dairy cows: effects of parity, stage of lactation, and season of production. J. Dairy Sci. 94, 3895–901
Curtis, C.R., Erb, H.N., Sniffen, C.J., Smith, R.D., Kronfeld, D.S., 1985. Path analysis of dry period nutrition, postpartum metabolic and reproductive disorders, and mastitis in Holstein cows. J. Dairy Sci. 68, 2347–2360.
Davies, C.J., Fisher, P.J., Schlafer, D.H., 2000. Temporal and regional regulation of major histocompatibility complex class I expression at the bovine uterine/placental interface. Placenta 21, 194–202.
Davies, C.J., Hill, J.R., Edwards, J.L., Schrick, F.N., Fisher, P.J., Eldridge, J.A., Schlafer, D.H., 2004. Major histocompatibility antigen expression on the bovine placenta: its relationship to abnormal pregnancies and retained placenta. Anim. Reprod. Sci. 82-83, 267–280.
Drackley, J.K., 1999. Biology of dairy cows during the transition period: the final frontier? J. Dairy Sci. 82, 2259–2573.
Drackley, J.K., Dann, H.M., Douglas, G.N., et al., 2005. Physiological and pathological adaptations in dairy cows that may increase susceptibility to periparturient diseases and disorders. Ital J. Anim. Sci. 4, 323–44.
Drackley, J., Donkin, S., Reynolds, C., 2006. Major advances in fundamental dairy cattle nutrition. J. Dairy Sci. 89, 1324–1336.
Drackley, J.K., Dann, H.M., Douglas, G.N., Janovick, Guretzky N.A., Litherland, N.B., Underwood, J.P., Loor, J.J., 2010. Physiological and pathological adaptations in dairy cows that may increase susceptibility to periparturient diseases and disorders. Ital. J. Anim. Sci. 4, 323-344.
Dubreuil, P., Lapierre, H., 1997. Biochemistry reference values for Quebec lactating dairy cows, nursing sows, growing pigs and calves. Can. J. Vet. Res. 61, 235–239.
Dubuc, J., Duffield, T.F., Leslie, K.E., Walton, J.S., LeBlanc, S.J., 2010. Risk factors for postpartum uterine diseases in dairy cows. J. Dairy Sci. 93, 5764–5771.
Eckersall, P.D., Bell, R., 2010. Acute phase proteins: Biomarkers of infection and inflammation in veterinary medicine. Vet. J. 185, 23–7.
Enemark, J.M.D., Schmidt, H.B., Jakobsen, J. Enevoldsen, C., 2009. Failure to improve energy balance or dehydration by drenching transition cows with water and electrolytes at calving. Veterinary research communications vol. 33 (2), 123-37
Enjalbert, F., Nicot, M.C., Bayourthe, C., Moncoulon, R., 2001. Ketone bodies in milk and blood of dairy cows: relationship between concentrations and utilization for detection of subclinical ketosis. J. Dairy Sci. 84, 583–589.
Erb, H.N., Smith, R.D., Hillman, R.B., Powers, P.A., Smith, M.C., White, M.E., et al. 1984. Rates of diagnosis of six diseases of Holstein cows during 15-day and 21-day intervals. Am J Vet Res. 45, 333–335.
113
Esposito, G., Irons, P.C., Webb, E.C., Chapwanya, A., 2014. Interactions between negative energy balance, metabolic diseases, uterine health and immune response in transition dairy cows. Anim. Reprod. Sci. 144, 60–71
Ferré, N., Camps, J., Prats, E., Vilella, E., Paul, A., Figuera, L., Joven, J., 2002. Serum paraoxonase activity: a new additional test for the improved evaluation of chronic liver damage. Clin. Chem. 48, 261–268.
Formigoni, A., Cornil, M.C., Prandi, A., Mordenti, A., Rossi, A., Portetelle, D., Renaville, R., 1996. Effect of propylene glycol supplementation around parturition on milk yield, reproduction performance and some hormonal and metabolic characteristics in dairy cows. J. Dairy Res. 63, 11–24.
Fourichon, C., Seegers, H., Malher, X., 2000. Effect of disease on reproduction in the dairy cow: a meta-analysis. Theriogenology 53, 1729–1759.
Friedrichs, K.R., Harr, K.E., Freeman, K.P., Szladovits, B., Walton, R.M., Barnhart, K.F., Blanco-Chavez, J., 2012. ASVCP reference interval guidelines: determination of de novo reference intervals in veterinary species and other related topics. Vet. Clin. Pathol. 41, 441–53
Fronk, TJ, Schultz, LH, Hardie, AR., 1980 Effect of dry period overconditioning on subsequent metabolic disorders and performance of dairy cows. J Dairy Sci. 63:1080–90.
Geffré, A., Friedrichs, K., Harr, K., Concordet, D., Trumel, C., Braun, J.P., 2009. Reference values: a review. Vet. Clin. Pathol. 38, 288–98
Geffré, A., Concordet, D., Braun, J.P., et al. 2011. Reference Value Advisor: a new freeware set of macroinstructions to calculate reference intervals with Microsoft Excel. Vet. Clin. Pathol.; 40: 107–112
George, J.W., Snipes, J., Lane, V.M., 2010. Comparison of bovine hematology reference intervals from 1957 to 2006. Vet. Clin. Pathol. 39, 138–48.
Gilbert, R.O., Gröhn, Y.T., Guard, C.L., Surman, V., Neilsen, N., Slauson, D.O., 1993. Impaired post partum neutrophil function in cows which retain fetal membranes. Res. Vet. Sci. 55, 15–19.
Giordano, A., Veronesi, M.C., Rossi, G., Pezzia, F., Probo, M., Giori, L., Paltrinieri, S., 2013. Serum paraoxonase-1 activity in neonatal calves: age related variations and comparison between healthy and sick animals. Vet. J. 197, 499–501.
Goff, J.P., 2006. Major advances in our understanding of nutritional influences on bovine health. J. Dairy Sci. 89, 1292–1301.
Goff, J.P. 2008. The monitoring, prevention, and treatment of milk fever and subclinical hypocalcemia in dairy cows. Vet. J. 176, 50–57
Goff, J.P., Horst, R.L., 1997. Physiological changes at parturition and their relationship to metabolic disorders. Journal of dairy science. 80 (7), 1260-1268.
Goff, J.P., Stabel, J.R., 1990. Decreased plasma retinol, alpha-tocopherol, and zinc concentration during the periparturient period: effect of milk fever. J. Dairy Sci. 73, 3195.

114
Goff, J.P., Kimura, K., and Horst, R.L., 2002. Effect of mastectomy on milk fever, energy, and vitamin A, E, and β-carotene status at parturition. J. Dairy Sci. 85, 1427–1436
Grummer, R.R., Mashek, D.G., Hayirli, A., 2004. Dry matter intake and energy balance in the transition period. Vet. Clin. N. Am. Food Anim. Pract. 20 (3), 447–470.
Gunnink, J.W., 1984a. Retained placenta and leucocytic activity. Vet. Q. 6, 49–51.
Gunnink, J.W., 1984b. Pre-partum leucocytic activity and retained placenta. Vet. Q. 6, 52–54
Gunnink, J.W., 1984c. Post-partum leucocytic activity and its relationship to caesarian section and retained placenta. Vet. Q. 6, 55–57
Gunnink, J.W., 1984d. Influence of dilution on the chemotactic properties of cotyledon suspensions. Vet. Q. 6, 57–59
Hailemariam, D., Mandal, R., Saleem, F., Dunn, S.M., Wishart, D.S., Ametaj, B.N., 2014. Identification of predictive biomarkers of disease state in transition dairy cows. J. Dairy Sci. 97: 2680–2693.
Hammon, D.S., Evjen, I.M., Dhiman, T.R., Goff, J.P., Walters, J.L., 2006. Neutrophil function and energy status in Holstein cows with uterine health disorders. Vet. Immunol. Immunopathol. 113, 21–29.
Hammon, H. M., G. Stürmer, F. Schneider, A. Tuchscherer, H. Blum, T. Engelhard, A. Genzel, R. Staufenbiel, and W. Kanitz. 2009. Performance and metabolic and endocrine changes with emphasis on glucose metabolism in high-yielding dairy cows with high and low fat content in liver after calving. J. Dairy Sci. 92, 1554–1566.
Harris, E.K., Boyd, J.C., 1990. On dividing reference data into subgroups to produce separate reference ranges. Clin. Chem. 36, 265–70.
Harvey, J.W., 2012. Evaluation of Leukocytic Disorders, in: Harvey, J.W. (Ed.), Veterinary Hematology: A Diagnostic Guide and Color Atlas. Elsevier Saunders, St. Louis, MO, pp. 122–176.
Hemingway, R. G. 2003. The influences of dietary intakes and supplementation with selenium and vitamin E on reproduction diseases and reproductive efficiency in cattle and sheep. Veterinary Research Communications 27, 159 – 174.
Herdt, T.H., 2000. Variability characteristics and test selection in herd-level nutritional and metabolic profile testing. Vet. Clin. North Am. Food Anim. Pract. 16, 387–403
Herdt, T.H., Smith, J.C., 1996. Blood-lipid and lactation-stage factors affecting serum vitamin E concentrations and vitamin E cholesterol ratios in dairy cattle. J. Vet. Diagn. Invest. 8, 228–232
Heuer, C., Schukken, Y.H., Dobbelaar, P., 1999. Postpartum body condition score and results from the first test day milk as predictors of disease, fertility, yield, and culling in commercial dairy herds. J. Dairy Sci. 82: 295–304.

115
Hoeben, D., Monfardini, E., Opsomer, G., Burvenich, C., Dosogne, H., De Kruif, A., Beckers, J.F., 2000. Chemiluminescence of bovine polymorphonuclear leucocytes during the periparturient period and relation with metabolic markers and bovine pregnancy-associated glycoprotein. J. Dairy Res. 67, 249–59.
Hoedemaker, M., Prange, D., Zerbe, H., Frank, J., Daxenberger, A., Meyer, H.H.D., 2004. Peripartal propylene glycol supplementation and metabolism, animal health, fertility, and production in dairy cows. J. Dairy Sci. 87: 2136–2145.
Hoffman, W.E. and Solter, P.F., 2008, Diagnostic Enzymology of Domestic Animals. In: Kaneko J.J., Harvey J.W., Bruss M.L., eds. Clinical Biochemistry of Domestic Animals. 6th ed. Burlington, MA: Academic Press; 2008:351-378.
Horn, P.S., Pesce, A.J.. Reference intervals: a user’s guide, AACC Press, Washington DC, 2005.
Huzzey, J.M., Nydam, D.V, Grant, R.J., Overton, T.R., 2011. Associations of prepartum plasma cortisol, haptoglobin, fecal cortisol metabolites, and nonesterified fatty acids with postpartum health status in Holstein dairy cows. J. Dairy Sci. 94, 5878–5889.
Ingvartsen, K.L., 2006. Feeding-and management-related diseases in the transition cow: physiological adaptations around calving and strategies to reduce feeding-related diseases. Anim. Feed Sci. Technol. 126, 175–213.
Ingvartsen, K., Dewhurst, R., Friggens, N., 2003. On the relationship between lactational performance and health: is it yield or metabolic imbalance that cause production diseases in dairy cattle? A position paper. Livest. Prod. Sci. 83, 277–308.
Johnston, L. A., and Chew, B. P. 1984. Peripartum changes of plasma and milk vitamin A and β-carotene among dairy cows with or without mastitis. Journal of Dairy Science 67, 1832 – 1840.
Jorritsma, R., Wensing T., Kruip T.A.M., Vos P.L.A.M., Noordhuizen J. P. T. M. 2003. Metabolic changes in early lactation and impaired reproductive performance in dairy cows. Vet. Res. 34:11–26
Kaneko, J.J., 2008. Carbohydrate Metabolism and Its Diseases. In: Kaneko JJ, Harvey JW, Bruss ML, eds. Clinical Biochemistry of Domestic Animals. 6th ed. Burlington, MA: Academic Press; 45-80
Kaneko, J.J., Harvey J.W., Bruss M.L. eds. Clinical Biochemistry of Domestic Animals. 6th ed. Burlington, MA: Academic Press; 2008
Kehrli, M.E., Nonnecke, B.J., Roth, J.A., 1989. Alterations in bovine neutrophil function during the periparturient period. Am. J. Vet. Res. 50, 207–14
Kehrli, Jr., M., Neil, J., Burvenich, C., Goff, J., Lippolis, J., Reinhardt, T., Nonnecke, B., 2006. Energy and Protein Effects on the Immune System: Ruminant Physiology: Digestion, Metabolism and Impact of Nutrition on Gene Expression, Immunology and Stress. Wageningen Academic Publishers, The Netherlands, pp. 455–471
Kelton, D.F., Lissemore, K.D., Martin, R.E., 1998. Recommendations for recording and calculating the incidence of selected clinical diseases of dairy cattle. J. Dairy Sci. 81, 2502–2509.

116
Kimura, K., Goff, J.P., Kehrli, M.E., 1999. Effects of the presence of the mammary gland on expression of neutrophil adhesion molecules and myeloperoxidase activity in periparturient dairy cows. J. Dairy Sci. 82, 2385–92.
Kimura, K., Goff, J.P., Kehrli, M.E., Harp, J., Nonnecke, B.J., 2002a. Effects of mastectomy on composition of peripheral blood mononuclear cell populations in periparturient dairy cows. J. Dairy Sci. 85, 1437–1444.
Kimura, K., Goff, J.P., Kehrli, M.E., Reinhardt, T. A., 2002b. Decreased neutrophil function as a cause of retained placenta in dairy cattle. J. Dairy Sci. 85, 544–550.
Kimura, K., Goff, J.P., Canning, P., Wang, C., Roth, J., 2014. Effect of recombinant bovine granulocyte colony-stimulating factor covalently bound to polyethylene glycol injection on neutrophil number and function in periparturient dairy cows. J. Dairy Sci. 97, 4842–51.
Kinsel, ML, Etherington, WG., 1998. Factors affecting reproductive performance in Ontario dairy herds. Theriogenology 50:1221–38
Kjelgaard-Hansen, M., Jensen, A.L., 2006. Is the inherent imprecision of manual leukocyte differential counts acceptable for quantitative purposes? Vet. Clin. Pathol. 35, 268–70.
Lacetera, N., Scalia, D., Franci, O., Bernabucci, U., Ronchi, B., Nardone, A., 2004. Short communication: Effects of nonesterified fatty acids on lymphocyte function in dairy heifers. J. Dairy Sci. 87:1012–1014.
Laven, R. A., Peters, A. R., 1996. Bovine retained placenta: aetiology, pathogenesis and economic loss. Vet. Rec. 139, 465–471.
LeBlanc, S., 2010. Monitoring metabolic health of dairy cattle in the transition period. J. Reprod. Dev. 56 Suppl, S29–S35.
LeBlanc, S.J., Herdt, T.H., Seymour, W.M., Duffield, T.F., Leslie, K.E., 2004. Peripartum serum vitamin E, retinol, and beta-carotene in dairy cattle and their associations with disease. J. Dairy Sci. 87, 609–619
LeBlanc, S.J., Leslie, K.E., Duffield, T.F., 2005. Metabolic predictors of displaced abomasum in dairy cattle. J. Dairy Sci. 88: 159–170.
Lefebvre, H.P., 2011. Greyhound-specific reference intervals: a good start to a long race. Vet. Clin. Pathol. 40, 405–6
Lomander, H., Frössling, J., Ingvartsen, K.L., Gustafsson, H., Svensson, C., 2012. Supplemental feeding with glycerol or propylene glycol of dairy cows in early lactation--effects on metabolic status, body condition, and milk yield. J. Dairy Sci. 95: 2397–2408.
Lucy, M., Jiang, H., Kobayashi, Y., 2001. Changes in the somatotrophic axis associated with the initiation of lactation. J. Dairy Sci. 84, E113–E119.
Lumsden, JH, Mullen, K, Rowe, R.. 1980. Hematology and biochemistry reference values for female holstein cattle. Can J Comp Med, 44: 24–31

117
Martinez, N., Risco, C., Lima, F.S., Bisinotto, R.S., Greco, L.F., Ribeiro, E.S., Maunsell, F., Galvão, K., Santos, J.E.P., 2012. Evaluation of peripartal calcium status, energetic profile, and neutrophil function in dairy cows at low or high risk of developing uterine disease. J. Dairy Sci. 95, 7158–72
Matthews, B.J., Morton, J.M., 2012. Accuracy of predicted calving dates in Holstein-Friesian dairy cows based on fetal ages estimated using manual rectal palpation. N. Z. Vet. J. 60: 234–240.
McArt, J.A.A., Nydam, D.V, Ospina, P.A., Oetzel, G.R., 2011. A field trial on the effect of propylene glycol on milk yield and resolution of ketosis in fresh cows diagnosed with subclinical ketosis. J. Dairy Sci. 94: 6011–6020.
McArt, J.A.A., Nydam, D.V, Oetzel, G.R., 2012. A field trial on the effect of propylene glycol on displaced abomasum, removal from herd, and reproduction in fresh cows diagnosed with subclinical ketosis. J. Dairy Sci. 95: 2505–12.
McArt, J.A.A., Nydam, D.V, Oetzel, G.R., Overton, T.R., Ospina, P.A., 2013. Elevated non-esterified fatty acids and β-hydroxybutyrate and their association with transition dairy cow performance. Vet. J. 198: 560–570.
Melendez, P., Donovan, G.A., Risco, C.A., Goff, J.P., 2004. Plasma mineral and energy metaboite concentrations in dairy cows fed an anionic prepartum diet that did or did not have retained fetal membranes after parturition. Am. J. Vet. Res. 65, 1071–1076.
Miettinen, P.V.A., 1995. Prevention of bovine ketosis with glucogenic substance and its effect on fertility in Finnish dairy cows. Berl. Munch. Tierarztl. Wochenschr. 108, 14–19
Mittal, M., Siddiqui, M.R., Tran, K., Reddy, S.P., Malik, A.B., 2014. Reactive oxygen species in inflammation and tissue injury. Antioxid. Redox Signal. 20, 1126–1167.
Moretti, P., Probo, M., Morandi, N., Trevisi, E., Ferrari, A., Minuti, A., Venturini, M., Paltrinieri, S., Giordano, A., 2015. Early post-partum hematological changes in Holstein dairy cows with retained placenta. Anim. Reprod. Sci. 152, 17–25.
Morrow, D.A., 1976. Fat cow syndrome. J. Dairy Sci. 59, 1625–1629.
Moyes, K.M., Larsen, T., Friggens, N.C., Drackley, J.K., Ingvartsen, K.L., 2009. Identification of potential markers in blood for the development of subclinical and clinical mastitis in dairy cattle at parturition and during early lactation. J. Dairy Sci. 92, 5419–5428.
Mulligan, F.J., O’Grady, L., Rice, D.A., Doherty, M.L., 2006. A herd health approach to dairy cow nutrition and production diseases of the transition cow. Anim. Reprod. Sci.: 331–353.
Mulligan, F.J., Doherty, M.L., 2008. Production diseases of the transition cow. Vet. J. 176, 3–9.
National Research Council, 2001. Nutrient Requirements of Dairy Cattle, 7 revised. ed. National Academy Press, Washington, DC.

118
Nonnecke, B.J., Kimura, K., Goff, J.P., Kehrli, M.E., 2003. Effects of the mammary gland on functional capacities of blood mononuclear leukocyte populations from periparturient cows. Journal of Dairy Science 86, 2359–2368.
Oetzel, G.R., 2004. Monitoring and testing dairy herds for metabolic disease. Vet. Clin. North Am. Food Anim. Pract. 20, 651–74.
Opsomer, G., 2015. Interaction between metabolic challenges and productivity in high yielding dairy cows. Jpn. J. Vet. Res. 63 Suppl 1, S1–14.
Ospina, P.A., Nydam, D. V, Stokol, T., Overton, T.R., 2010. Evaluation of nonesterified fatty acids and beta-hydroxybutyrate in transition dairy cattle in the northeastern United States: Critical thresholds for prediction of clinical diseases. J. Dairy Sci. 93, 546–554.
Overton, T.R., Waldron, M.R., 2004. Nutritional Management of Transition Dairy Cows: Strategies to Optimize Metabolic Health. J. Dairy Sci. 87: E105–E119.
Paisley, L.G., Mickelsen, W.D., Anderson, P.B., 1986. Mechanisms and therapy for retained fetal membranes and uterine infections of cows: A review. Theriogenology 25, 353–381.
Paltrinieri, S., Ibba, F., Rossi, G., 2014. Hematological and biochemical reference intervals of four feline breeds. Journal of Feline Medicine and Surgery, 16, pp. 125–136
Papich, M., Riviere, J., 2009. Chemotherapy of microbial diseases, in: Riviere, J., Papich, M. (Eds.), Veterinary Pharmacology and Therapeutics. Wiley-Blackwell, Ames, IA, pp. 835–1013.
Parker Gaddis, K., Cole, J., Clay, J., Maltecca, C., 2012. Incidence validation and relationship analysis of producer-recorded health event data from on-farm computer systems in the United States. J. Dairy Sci. 95: 5422–5435.
Peeler, E., Otte, M., Esslemont, R., 1994. Inter-relationships of periparturient diseases in dairy cows. Vet. Rec. 134: 129–132.
Peter, A.T., Bosu, W.T.K., 1987. Peripartal endocrine changes associated with retained placenta in dairy cows. Theriogenology 28, 383–394.
Petersen, H.H., Nielsen, J.P., Heegaard, P.M.H., 2004. Application of acute phase protein measurements in veterinary clinical chemistry. Vet. Res. 35, 163–187
Quiroz-Rocha, G.F., LeBlanc, S.J., Duffield, T.F., Wood, D., Leslie, K.E., Jacobs, R.M., 2009. Reference limits for biochemical and hematological analytes of dairy cows one week before and one week after parturition. Can. Vet. J. 50, 383–388.
Raboisson, D., Mounié, M., Maigné, E., 2014. Diseases, reproductive performance, and changes in milk production associated with subclinical ketosis in dairy cows: A meta-analysis and review. J. Dairy Sci. 97, 7547–7563.
Ramberg C.F., Mayer G.P., Kronfeld D.S., Phang J.M., Berman M., 1970. Calcium kinetics in cows during late pregnancy, parturition, and early lactation. Am J Physiol. 219, 1166–1177.
Raphael, B.C., Dimick, P.S., Puppione, D.L., 1973. Lipid characterization of bovine serum lipoproteins throughout gestation and lactation. J. Dairy Sci. 56, 1025–32

119
Roland, L., Drillich, M., Iwersen, M., 2014. Hematology as a diagnostic tool in bovine medicine. J. Vet. Diagn. Invest. 26, 592–598.
Rosol, T.J. and Capen, C.C., 1997. Calcium-regulating hormones and diseases of abnormal mineral (calcium, phosphorous, magnesium) metabolism. In: Kaneko JJ, Harvey JW, Bruss ML, eds. Clinical Biochemistry of Domestic Animals. 5th ed. London: Academic Press 610-702
Roussel, J.D., Aranas, T.J., Seybt S.H., 1982. Metabolic profile testing in holstein cattle in Louisiana reference values. Am. J. Vet. Res. 43:1658–1660.
Russell, K.E., Roussel, A.J., 2007. Evaluation of the Ruminant Serum Chemistry Profile. Vet. Clin. North Am. - Food Anim. Pract. 23, 403–426.
Sartorelli, P., Paltrinieri, S., Agnes, F., 1999. Non-specific immunity and ketone bodies. I: In vitro studies on chemotaxis and phagocytosis in ovine neutrophils. Zentralbl. Veterinarmed. A 46, 613–619.
Sartorelli, P., Paltrinieri, S., Comazzi, S., 2000. Non-specific immunity and ketone bodies. II: In vitro studies on adherence and superoxide anion production in ovine neutrophils. J. Vet. Med. A. Physiol. Pathol. Clin. Med. 47, 1–8.
Scalia, D., Lacetera, N., Bernabucci, U., Demeyere, K., Duchateau, L., Burvenich, C., 2006. In vitro effects of nonesterified fatty acids on bovine neutrophils oxidative burst and viability. J. Dairy Sci. 89, 147–154.
Schlafer, D.H., Fisher, P.J., Davies, C.J., 2000. The bovine placenta before and after birth: placental development and function in health and disease. Anim. Reprod. Sci. 60-61, 145–160.
Seifi, H.A., Dalir-Naghadeh, B., Farzaneh, N., Mohri, M., Gorji-Dooz, M., 2007. Metabolic changes in cows with or without retained fetal membranes in transition period. J. Vet. Med. A. Physiol. Pathol. Clin. Med. 54, 92–97.
Shaver, R., 1997. Nutritional risk factors in the etiology of left displaced abomasum in dairy cows: a review. J. Dairy Sci. 80: 2449–2453.
Sheldon, M.I., Williams, E.J., Miller, A., Nash, D.M., Herath, S., 2008. Uterine diseases in cattle after parturition. The Veterinary Journal 176 (1), 115–121
Shi, X., Li, X., Li, D., Li, Y., Song, Y., Deng, Q., Wang, J., Zhang, Y., Ding, H., Yin, L., Wang, Z., Liu, G., 2014. Beta-hydroxybutyrate activates the NF-kappaB signaling pathway to promote the expression of pro-inflammatory factors in calf hepatocytes. Cellular Physiology and Biochemistry: International Journal of Experimental Cellular Physiology. Biochemical Pharmacology 33, 920–932.
Skinner, J.G., Brown, R.A., Roberts, L., 1991. Bovine haptoglobin response in clinically defined field conditions. Vet. Rec. 128, 147–149.
Smith, K. L., Hogan, J. S., & Weiss, W. P. 1997. Dietary vitamin E and selenium affect mastitis and milk quality. Journal of Animal Science 75, 1659 – 1665
Sordillo, L.M., Aitken, S.L., 2009. Impact of oxidative stress on the health and immune function of dairy cattle. Vet. Immunol. Immunopathol. 128, 104–109.

120
Sordillo, L.M., Mavangira, V., 2014. The nexus between nutrient metabolism, oxidative stress and inflammation in transition cows. Anim. Prod. Sci. 1204–1214
Sordillo, L.M., Raphael, W., 2013. Significance of Metabolic Stress, Lipid Mobilization, and Inflammation on Transition Cow Disorders. Vet. Clin. North Am. Food Anim. Pract. 29, 267–278.
Sordillo, L.M., O’Boyle, N., Gandy, J.C., Corl, C.M., Hamilton, E., 2007. Shifts in thioredoxin reductase activity and oxidant status in mononuclear cells obtained from transition dairy cattle. J. Dairy Sci. 90, 1186–1192.
Stengärde, L., Holtenius, K., Tråvén, M., Hultgren, J., Niskanen, R., Emanuelson, U., 2010. Blood profiles in dairy cows with displaced abomasum. J. Dairy Sci. 93: 4691–4699.
Ster, C., Loiselle, M.C., Lacasse, P. 2012. Effect of postcalving serum nonesterified fatty acids concentration on the functionality of bovine immune cells. Journal of Dairy Science 95, 708–717.
Stockham, S.L., Scott, M.A., 2008a. Introductory concepts, in: Stockham, S.L., Scott, M.A. (Eds.), Fundamentals of Veterinary Clinical Pathology. Blackwell Publishing Ltd, Ames, IA, pp. 3–52
Stockham, S.L., Scott, M.A., 2008b. Leukocytes, in: Stockham, S.L., Scott, M.A. (Eds.), Fundamentals of Veterinary Clinical Pathology. Blackwell Publishing Ltd, Ames, IA, pp. 53–106.
Stockham, S.L., Scott, M.A., 2008c. Lipids, in: Stockham, S.L., Scott, M.A. (Eds.), Fundamentals of Veterinary Clinical Pathology. Blackwell Publishing Ltd, Ames, IA, pp. 763–782.
Stockham, S.L., Scott, M.A., 2008d. Enzymes, in: Stockham, S.L., Scott, M.A. (Eds.), Foundamentals of Veterinary Clinical Pathology. Blackwell Publishing Ltd, Ames, IA, pp. 639–674.
Stockham, S.L., Scott, M.A., 2008e. Liver function, in: Stockham, S.L., Scott, M.A. (Eds.), Fundamentals of Veterinary Clinical Pathology. Blackwell Publishing Ltd, Ames, IA, pp. 675–706.
Stockham, S.L., Scott, M.A., 2008f. Platelets. In: Stockham, S.L., Scott, M.A. (Eds.), Fundamentals of Veterinary Clinical Pathology. Blackwell Publishing Ltd., Ames, IA, pp. 223-257
Stockham, S.L., Scott, M.A., 2008g. Proteins. In: Stockham, S.L., Scott, M.A. (Eds.), Fundamentals of Veterinary Clinical Pathology. Blackwell Publishing Ltd., Ames, IA, pp. 369-413
Sunderman, F.W., Nomoto, S., 1970. Measurement of human serum ceruloplasmin by its p-phenylenediamine oxidase activity. Clin. Chem. 16, 903–910.
Tornquist, S.J., Rigas, J., 2010. Interpretation of Ruminant Leukocyte Responses, in: Weiss, D.J., Wardrop, K.J. (Eds.), Shalm’s Veterinary Hematology. Blackwell Publishing Ltd, Ames, IA, pp. 307–313.

121
Trevisi, E., Ferrari, A. R., Bertoni, G., 2008. Productive and metabolic consequences induced by the retained placenta in dairy cows. Vet. Res. Commun. 32 Suppl 1, S363–366.
Trevisi, E., Amadori, M., Bakudila, A.M., Bertoni, G., 2009. Metabolic changes in dairy cows induced by oral, low-dose interferon-alpha treatment. J. Anim. Sci. 87, 3020–3029.
Trevisi, E., Amadori, M., Cogrossi, S., Razzuoli, E., Bertoni, G., 2012. Metabolic stress and inflammatory response in high-yielding, periparturient dairy cows. Res. Vet. Sci. 93, 695–704.
Trevisi, E., G. Bertoni, R. Lombardelli, Minuti, A., 2013. Relation of inflammation and liver function with the plasma cortisol response to ACTH in early lactating dairy cows. J. Dairy Sci. 96:5712–5722.
Turk, R., Juretic, D., Geres, D., Turk, N., Rekic, B., Simeon-Rudolf, V., Svetina, A., 2004. Serum paraoxonase activity and lipid parameters in the early postpartum period of dairy cows. Res. Vet. Sci. 76, 57–61.
Turk, R., Juretic, D., Geres, D., Turk, N., Rekic, B., Simeon- Rudolf, V., Robic, M., Svetina, A., 2005. Serum paraoxonase activity in dairy cows during pregnancy. Res. Vet. Sci. 79, 15–18.
van der Veen, B.S., de Winther, M.P.J., Heeringa, P., 2009. Myeloperoxidase: molecular mechanisms of action and their relevance to human health and disease. Antioxid. Redox Signal. 11, 2899–2937.
van Dorland, H.A., Richter, S., Morel, I., Doherr, M. G., Castro, N., Bruckmaier, R. M., 2009. Variation in hepatic regulation of metabolism during the dry period and in early lactation in dairy cows. J. Dairy Sci. 92:1924–1940.
Voyvoda, H., Erdogan, H., 2010. Use of a hand-held meter for detecting subclinical ketosis in dairy cows. Res. Vet. Sci. 89, 344–351.
Wathes, D., Cheng, Z., Bourne, N., Taylor, V., Coffey, M., Brotherstone, S., 2007. Differences between primiparous and multiparous dairy cows in the inter-relationships between metabolic traits, milk yield and body condition score in the periparturient period. Domest. Anim. Endocr. 33, 203–225.
Wensing, T., Kruip, T., Geelen, M.J.H., Wentink, G.H., van den Top, A.M., 1997. Postpartum fatty liver in high-producing dairy cows in practice and in animal studies. The connection with health, production and reproduction problems. Comp. Haematol. Int. 7, 167–171.
Wilde, D., 2006. Influence of macro and micro minerals in the peri-parturient period on fertility in dairy cattle. Anim. Reprod. Sci. 96, 240–249.
Zerbe, H., Schneider, N., Leibold, W., Wensing, T., Kruip, T.A., Schuberth, H.J., 2000. Altered functional and immunophenotypical properties of neutrophilic granulocytes in postpartum cows associated with fatty liver. Theriogenology 54, 771–786.

122
ANNEX:
Scientific production during the PhD

123
ANNEX: SCIENTIFIC PRODUCTION DURING THE PhD
The list of the publications produced during the course of this thesis is presented in the following
section. Concerning the aim developed in chapter 5, related to the establishment of RIs in cows,
one oral communication and one poster (publication 2.3 and 3.1, respectively) were produced,
and a manuscript is under submission (publication 4.1). Related to the same topic, but with the
application to a wild species, a poster (publication 3.2) concerning the establishment of RI for
Egyptian fruit bats was presented at the 17th ESVCP annual congress. The topic presented in
chapter 6, concerning the peri-partum laboratory changes associated with retained placenta, was
the subject of one peer reviewed article (publication 1.4) and two oral communications
(publication 2.1 and 2.2). The last topic, presented in chapter 7, concerning the prevention of
production diseases in dairy cows, was the subject of a peer reviewed article (publication 1.1)
and a poster (publication 3.3).
Besides the main topics addressed in this thesis, during this PhD course I dealt also with some
aspects of veterinary clinical pathology in calves. In particular, a peer reviewed article
concerning the hematological profile of calves associated with different mode of delivery was
produced (publication 1.7). Other two studies, one concerning the biochemical profiles of calves
associated with different mode of delivery (publication 4.2) and another one aimed to elucidate
the characteristics of calves lipidograms and his correlation with inflammatory conditions, are
under submission (pubblication 4.3).
A latere of the above mentioned research activities, during this PhD course, due to the
involvement in the clinical pathology laboratory diagnostic service at the Large Animal Hospital
(Azienda “Polo Veterinario di Lodi”), I dealt also with some aspects of veterinary clinical
pathology in small animals. In particular, concerning different aspects of veterinary oncology,
three peer reviewed articles (publication 1.2, 1.3 and 1.6), one oral communication
(publication 2.4) and one poster (publication 3.5) were produced. Finally I’ve actively
participated to the preparation of a manuscript concerning biochemical variations associated with
contrast medium administration in dogs (publication 1.5), and to the preparation of a poster
concerning the method validation for paraoxonase-1 determination in feline samples
(publication 3.4).

124
List of publications
1. Peer-reviewed publications
1.1. Coiatelli M., Giordano A., Sicilia F., Moretti P. , Durel L. An attempt to prevent production diseases in dairy cows by intense monitoring and ad hoc treatment. Italian Journal of Animal Science. 2015; 14:3918.
1.2. Moretti, P., Giordano, A., Stefanello, D., Ferrari, R., Castellano, S., Paltrinieri, S.:
Nucleated erythrocytes in blood smears of dogs undergoing chemotherapy. Veterinary and Comparative Oncology. Epub ahead of print. 2015 n/a–n/a. doi:10.1111/vco.12156
1.3. Marconato, L., Martini, V., Stefanello, D., Moretti, P., Ferrari, R., Comazzi, S.,
Laganga, P., Riondato, F., Aresu, L.: Peripheral blood lymphocyte/monocyte ratio as a useful prognostic factor in dogs with diffuse large B-cell lymphoma receiving chemoimmunotherapy. The Veterinary. Journal. 2015. Epub ahead of print. doi:10.1016/j.tvjl.2015.07.009
1.4. Moretti, P., Probo, M., Morandi, N., Trevisi, E., Ferrari, A., Minuti, A., Venturini, M.,
Paltrinieri, S., Giordano, A.: Early post-partum hematological changes in Holstein dairy cows with retained placenta. Animal Reproduction Science. 2015, 152, 17–25
1.5. Carotenuto A. M., Borghi L., Paltrinieri S., Giordano A., Moretti P. , Di Giancamillo
M.:Serum biochemical response to contrast media administration in anaesthetised dogs. Veterinary Record. 2013, 172(4): 101
1.6. Paltrinieri S, Rossi G., Meregalli A., Stefanello D., Pecile A., Moretti P , Rondena M.: Sialic acid and sialyltransferase activity in serum and tissues of dogs with mammary tumors. Veterinary Pathology. July 2012, vol 49 n.4, pages 669-681
1.7. Probo M., Giordano A., Opsomer G., Fiems L., Moretti P. , Cairoli F.: Mode of delivery
is associated with different hematological profiles in new born calf. Theriogenology. 2012, vol. 77, issue 55. pages 865-872
2. Oral communications at international congresses (*presented as speaker)
2.1. Moretti P. *, Cantoni A., Probo M., Paltrinieri S., Giordano A.: Hematological changes around parturition in dairy cows with and without retained placenta. 16th ECVCP and ESVCP annual congress, Milan, Oct 1th-14th 2014
2.2. Moretti P. *, Giordano A., Venturini M., Morandi N., Paltrinieri S.: Hematological
changes associated with retained placenta in cattle. 15th congress ISACP-14th congress ESVCP. Ljiubljana (SLO) 3rd-7th July, 2012

125
2.3. Paltrinieri S., Moretti P. , Venturini M., Morandi N, Giordano A.: Association between hematological and electrophoretic profiles and prevalence of post-partum disease in dairy cows. 15th congress ISACP-14th congress ESVCP. Ljiubljana (SLO) 3rd-7th July, 2012
2.4. Giordano A., Stefanello D., Pastore M., Ferrari R., Giori L., Moretti P. , Paltrinieri S.:
Lactate dehydrogenase (LDH) isoenzymes in dogs affected by lymphoma. 15th congress ISACP-14th congress ESVCP. Ljiubljana (SLO) 3rd-7th July, 2012
3. Posters at international congress
3.1. Moretti P. , Paltrinieri S., Probo M., Giordano A.: Laboratory reference intervals of holstein lactating cows at 3 and 30 days post-partum. 17th ESVCP annual congress, Lisbon, Sep 9th-12th 2015
3.2. Giordano A., Ravasio G., Moretti P. , Moretti P., Di Cesare F., Paltrinieri S., Pecile A.:
Hematological, serum biochemical and electrophoretic values in captive Egyptian fruit bats (Rousettus Aegyptiacus). 17th ESVCP annual congress, Lisbon, Sep 9th-12th 2015
3.3. Coiatelli M., Giordano A., Sicilia F., Moretti P. , Durel L.: Prevention of production
diseases in dairy cows by intense monitoring and ad hoc treatment. Preliminary results. 53rd annual meeting of the national mastitis council at Fourth Worth, Texas (USA), 26-28th January, 2014
3.4. Rossi G., Giordano A., Costarelli E., Moretti P. , Paltrinieri S.: Analytical validation of a
paraoxon-based method to measure the activity of paraoxonase-1 in feline serum. 2014 ACVP and ASVCP annual meeting, Atlanta, Nov 8th-12th, 2014
3.5. Moretti P. , Ferrari R., Castellano S., Giordano A., Stefanello D., Paltrinieri S.:
Nucleated erythrocytes in blood smears of dogs on chemotherapy. 15th ESVCP and ECVCP annual congress Berlin, Germany November 6th–9th November 2013
4. Manuscripts under submission 4.1. Moretti P. , Paltrinieri S.,Trevisi E., Probo M., Ferrari A., Minuti A., Giordano A.
Reference intervals for hematological and biochemical parameters, acute phase proteins, and markers of oxidative stress in holstein dairy cows at 3 and 30 days post-partum. Submitted to Journal of dairy science
4.2. Probo M., Giordano A., Moretti P. , Opsomer G., Fiems L., Veronesi M.C.: Serum biochemical profile in newborn calves; a comparison between Belgian Blue and Holstein Friesian calves in the first 48 hours of age. Submitted to The Veterinary Journal.
4.3. Giordano A., Rossi G., Moretti P. , Probo M., Paltrinieri S.: Biochemical and electrophoretic evaluation of high density lipoproteins (HDL) in healthy neonatal calves: comparison with results of adult cows and of calves with inflammatory conditions. Submitted to Acta Vecterinaria Scandinavica.