Clinical Microbiology and Infection - Sciensano · 2 J. Nielsen et al. / Clinical Microbiology and...
11
Original article European all-cause excess and influenza-attributable mortality in the 2017/18 season: should the burden of influenza B be reconsidered? J. Nielsen 1 , * , L.S. Vestergaard 1 , L. Richter 2 , D. Schmid 2 , N. Bustos 3 , T. Asikainen 3 , R. Trebbien 1 , G. Denissov 4 , K. Innos 4 , M.J. Virtanen 5 , A. Fouillet 6 , T. Lytras 7 , K. Gkolfinopoulou 7 , M. an der Heiden 8 , L. Grabenhenrich 8 , H. Uphoff 9 , A. Paldy 10 , J. Bobvos 11 , L. Domegan 12 , J. O'Donnell 12 , M. Scortichini 13 , A. de Martino 14 , J. Mossong 15 , K. England 16 , J. Melillo 17 , L. van Asten 18 , M. MA de Lange 18 , R. Tønnessen 19 , R.A. White 19 , S.P. da Silva 20 , A.P. Rodrigues 20 , A. Larrauri 21 , C. Mazagatos 21 , A. Farah 22 , A.D. Carnahan 22 , C. Junker 23 , M. Sinnathamby 24 , R.G. Pebody 24 , N. Andrews 24 , A. Reynolds 25 , J. McMenamin 25 , C.S. Brown 26 , C. Adlhoch 27 , P. Penttinen 27 , K. Mølbak 1 , 28 , T.G. Krause 1 1) Statens Serum Institut, Copenhagen, Denmark 2) Austrian Agency for Health and Food Safety, Vienna, Austria 3) Sciensano, Brussels, Belgium 4) National Institute for Health Development, Tallinn, Estonia 5) Finnish National Institute for Health and Welfare, Helsinki, Finland 6) French Public Health Agency (Sant e Publique France), Saint-Maurice, France 7) Hellenic Centre for Disease Control and Prevention, Athens, Greece 8) Robert Koch Institute, Berlin, Germany 9) Hessisches Landesprüfungs- und Untersuchungsamt im Gesundheitswesen, Dillenburg, Germany 10) National Public Health Institute, Budapest, Hungary 11) Ministry of Human Capacities, Budapest, Hungary 12) Health Service Executive - Health Protection Surveillance Centre, Dublin, Ireland 13) Dipartimento Epidemiologia del S.S.R., Lazio - ASL Roma 1, Rome, Italy 14) Ministero della Salute, Rome, Italy 15) Laboratoire National de Sant e, Luxembourg 16) Directorate for Health Information and Research, Pieta, Malta 17) Department of Health Regulation, Pieta, Malta 18) National Institute for Public Health and the Environment (RIVM), Bilthoven, the Netherlands 19) Norwegian Institute of Public Health, Oslo, Norway 20) Instituto Nacional de Saúde Doutor Ricardo Jorge, Lisbon, Portugal 21) National Centre of Epidemiology, CIBER Epidemiología y Salud Pública (CIBERESP), Carlos III Health Institute, Madrid, Spain 22) Public Health Agency of Sweden, Stockholm, Sweden 23) Federal Statistical Office, Neuch^ atel, Switzerland 24) Public Health England, Colindale, United Kingdom 25) Health Protection Scotland, Glasgow, United Kingdom 26) World Health Organization, Regional Office for Europe, Copenhagen, Denmark 27) European Centre for Disease Prevention and Control, Solna, Sweden 28) Department of Veterinary and Animal Science, Faculty of Health and Medical Science, University of Copenhagen, Copenhagen, Denmark * Corresponding author: Jens Nielsen Infectious Disease Epidemiology and Prevention, Statens Serum Institute, Artillerivej 5, DK2300 Copenhagen, Denmark. E-mail address: [email protected] (J. Nielsen). Contents lists available at ScienceDirect Clinical Microbiology and Infection journal homepage: www.clinicalmicrobiologyandinfection.com https://doi.org/10.1016/j.cmi.2019.02.011 1198-743X/© 2019 The Authors. Published by Elsevier Ltd on behalf of European Society of Clinical Microbiology and Infectious Diseases. This is an open access article under the CC BY-NC-ND license (http://creativecommons.org/licenses/by-nc-nd/4.0/). Clinical Microbiology and Infection xxx (xxxx) xxx Please cite this article as: Nielsen J et al., European all-cause excess and influenza-attributable mortality in the 2017/18 season: should the burden of influenza B be reconsidered?, Clinical Microbiology and Infection, https://doi.org/10.1016/j.cmi.2019.02.011
Transcript of Clinical Microbiology and Infection - Sciensano · 2 J. Nielsen et al. / Clinical Microbiology and...

lable at ScienceDirect
Clinical Microbiology and Infection xxx (xxxx) xxx
Contents lists avai
Clinical Microbiology and Infection
journal homepage: www.cl inicalmicrobiologyandinfect ion.com
Original article
European all-cause excess and influenza-attributable mortality in the2017/18 season: should the burden of influenza B be reconsidered?
J. Nielsen 1, *, L.S. Vestergaard 1, L. Richter 2, D. Schmid 2, N. Bustos 3, T. Asikainen 3,R. Trebbien 1, G. Denissov 4, K. Innos 4, M.J. Virtanen 5, A. Fouillet 6, T. Lytras 7,K. Gkolfinopoulou 7, M. an der Heiden 8, L. Grabenhenrich 8, H. Uphoff 9, A. Paldy 10,J. Bobvos 11, L. Domegan 12, J. O'Donnell 12, M. Scortichini 13, A. de Martino 14,J. Mossong 15, K. England 16, J. Melillo 17, L. van Asten 18, M. MA de Lange 18,R. Tønnessen 19, R.A. White 19, S.P. da Silva 20, A.P. Rodrigues 20, A. Larrauri 21,C. Mazagatos 21, A. Farah 22, A.D. Carnahan 22, C. Junker 23, M. Sinnathamby 24,R.G. Pebody 24, N. Andrews 24, A. Reynolds 25, J. McMenamin 25, C.S. Brown 26,C. Adlhoch 27, P. Penttinen 27, K. Mølbak 1, 28, T.G. Krause 1
1) Statens Serum Institut, Copenhagen, Denmark2) Austrian Agency for Health and Food Safety, Vienna, Austria3) Sciensano, Brussels, Belgium4) National Institute for Health Development, Tallinn, Estonia5) Finnish National Institute for Health and Welfare, Helsinki, Finland6) French Public Health Agency (Sant�e Publique France), Saint-Maurice, France7) Hellenic Centre for Disease Control and Prevention, Athens, Greece8) Robert Koch Institute, Berlin, Germany9) Hessisches Landesprüfungs- und Untersuchungsamt im Gesundheitswesen, Dillenburg, Germany10) National Public Health Institute, Budapest, Hungary11) Ministry of Human Capacities, Budapest, Hungary12) Health Service Executive - Health Protection Surveillance Centre, Dublin, Ireland13) Dipartimento Epidemiologia del S.S.R., Lazio - ASL Roma 1, Rome, Italy14) Ministero della Salute, Rome, Italy15) Laboratoire National de Sant�e, Luxembourg16) Directorate for Health Information and Research, Pieta, Malta17) Department of Health Regulation, Pieta, Malta18) National Institute for Public Health and the Environment (RIVM), Bilthoven, the Netherlands19) Norwegian Institute of Public Health, Oslo, Norway20) Instituto Nacional de Saúde Doutor Ricardo Jorge, Lisbon, Portugal21) National Centre of Epidemiology, CIBER Epidemiología y Salud Pública (CIBERESP), Carlos III Health Institute, Madrid, Spain22) Public Health Agency of Sweden, Stockholm, Sweden23) Federal Statistical Office, Neuchatel, Switzerland24) Public Health England, Colindale, United Kingdom25) Health Protection Scotland, Glasgow, United Kingdom26) World Health Organization, Regional Office for Europe, Copenhagen, Denmark27) European Centre for Disease Prevention and Control, Solna, Sweden28) Department of Veterinary and Animal Science, Faculty of Health and Medical Science, University of Copenhagen, Copenhagen, Denmark
* Corresponding author: Jens Nielsen Infectious Disease Epidemiology and Prevention, Statens Serum Institute, Artillerivej 5, DK2300 Copenhagen, Denmark.E-mail address: [email protected] (J. Nielsen).
https://doi.org/10.1016/j.cmi.2019.02.0111198-743X/© 2019 The Authors. Published by Elsevier Ltd on behalf of European Society of Clinical Microbiology and Infectious Diseases. This is an open access article underthe CC BY-NC-ND license (http://creativecommons.org/licenses/by-nc-nd/4.0/).
Please cite this article as: Nielsen J et al., European all-cause excess and influenza-attributable mortality in the 2017/18 season: should theburden of influenza B be reconsidered?, Clinical Microbiology and Infection, https://doi.org/10.1016/j.cmi.2019.02.011
J. Nielsen et al. / Clinical Microbiology and Infection xxx (xxxx) xxx2
a r t i c l e i n f o
Article history:Received 20 December 2018Received in revised form5 February 2019Accepted 10 February 2019Available online xxx
Editor: L. Leibovici
Keywords:B/YamagataEuroMOMOFluMOMOInfluenzaMortality
Please cite this article as: Nielsen J et al., Eburden of influenza B be reconsidered?, Clin
a b s t r a c t
Objectives: Weekly monitoring of European all-cause excess mortality, the EuroMOMO network,observed high excess mortality during the influenza B/Yamagata dominated 2017/18 winter season,especially among elderly. We describe all-cause excess and influenza-attributable mortality during theseason 2017/18 in Europe.Methods: Based on weekly reporting of mortality from 24 European countries or sub-national regions,representing 60% of the European population excluding the Russian and Turkish parts of Europe, weestimated age stratified all-cause excess morality using the EuroMOMO model. In addition, age stratifiedall-cause influenza-attributable mortality was estimated using the FluMOMO algorithm, incorporatinginfluenza activity based on clinical and virological surveillance data, and adjusting for extremetemperatures.Results: Excess mortality was mainly attributable to influenza activity from December 2017 to April 2018,but also due to exceptionally low temperatures in February-March 2018. The pattern and extent ofmortality excess was similar to the previous A(H3N2) dominated seasons, 2014/15 and 2016/17. The2017/18 overall all-cause influenza-attributable mortality was estimated to be 25.4 (95%CI 25.0-25.8) per100,000 population; 118.2 (116.4-119.9) for persons aged 65. Extending to the European population thistranslates into over-all 152,000 deaths.Conclusions: The high mortality among elderly was unexpected in an influenza B dominated season,which commonly are considered to cause mild illness, mainly among children. Even though A(H3N2) alsocirculated in the 2017/18 season and may have contributed to the excess mortality among the elderly, thecommon perception of influenza B only having a modest impact on excess mortality in the older pop-ulation may need to be reconsidered. J. Nielsen, Clin Microbiol Infect 2019;▪:1© 2019 The Authors. Published by Elsevier Ltd on behalf of European Society of Clinical Microbiology and
Infectious Diseases. This is an open access article under the CC BY-NC-ND license (http://creativecommons.org/licenses/by-nc-nd/4.0/).
Introduction
Mortality in temperate countries, in particular among seniorcitizens, exhibits a marked seasonality, with higher mortality in thewinter period. Excess mortality may vary considerably betweencountries and from season to season [1e7]. One of the main driversof increased winter mortality is seasonal influenza, however sea-sonal transmission of other communicable diseases, such as RSVand enteric infections, as well as the effect of extreme ambienttemperatures may also contribute [8,9].
Since 2009, the European network for monitoring of excessmortality for public health action, EuroMOMO (www.euromomo.eu), has monitored weekly all-cause, age-specific mortality inreal-time in participating European countries and provided pooledestimates of excess mortality (observed minus expected), using theEuroMOMOmodel [10]. These estimates are published on a weeklybasis and included in the weekly FluNewsEurope bulletin (www.FluNewsEurope.org) to assess the influenza situation in Europe.Recently, the EuroMOMO model was supplemented with anothertime-series regression model, FluMOMO, which includes indicatorsof influenza activity and extreme temperatures [7]. The aim of thismodel is to obtain timely estimates of influenza-attributable mor-tality adjusted for extreme temperatures.
From December 2017 a marked increase in all-cause excessmortality was observed within the participating countries, espe-cially inwestern and southern European countries, and particularlyamong elderly (65 years or older). At the same time, most countriesreported rates of Influenza Like Illness (ILI) reaching moderatelevels, while only a few countries reported higher levels comparedwith recent seasons. However, in some countries number of influ-enza hospitalisations and intensive care admissions reached orexceeded peak levels of recent influenza seasons [11]. Overall, thedominant influenza type was B/Yamagata followed by influenza A,with both A(H1N1)pdm09 and A(H3N2) circulating in varyingpatterns between countries [12]. The WHO recommended vaccinecomponents for the trivalent vaccine in the 2017/18 season on theNorthern Hemisphere contained B/Victoria [13].
uropean all-cause excess andical Microbiology and Infect
Knowledge about the burden of seasonal influenza is crucial toinforming policies for prevention and control of influenza, inparticular seasonal influenza vaccination programs. Hence, beingable to quantify the mortality-burden of influenza, and associate itto circulating seasonal influenza viruses, adds valuable information.
The aim of the present study is to describe excess all-causemortality and estimate all-cause mortality attributable to influ-enza during the season 2017/18 in Europe, using the EuroMOMOand FluMOMO models and available influenza surveillance andtemperature data.
Methods
All-cause excess mortality, the EuroMOMO model
Countries participating in the EuroMOMO network collect dataon number of all-cause deaths weekly, and undertake nationalanalyses using the EuroMOMO model [4].
The EuroMOMO hub at Statens Serum Institut in Denmarkreceive mortality data aggregated by week and age group from theparticipating countries, and conducts country-stratified pooledanalyses of these data [10]. We estimated the pooled excess mor-tality for the winter season 2017/18 using all-cause mortality datafromweek 1/2014 to week 20/2018, from 24 participating nationalor sub-nation states (Austria, Belgium, Berlin (Germany), Denmark,England (UK), Estonia, Finland, France, Greece, Hesse (Germany),Hungary, Ireland, Italy, Luxembourg, Malta, Netherlands, NorthernIreland (UK), Norway, Portugal, Scotland (UK), Spain, Sweden,Switzerland, Wales (UK)), further on referred to as countries.
Mortality data reported to the EuroMOMO hub in week 27/2018were used.
Influenza-attributable mortality, the FluMOMO model
The FluMOMO model is a multiplicative Poisson regressiontime-series model with overdispersion, ISO-week as time unit anda post-estimation correction for skewness of the residuals by
influenza-attributable mortality in the 2017/18 season: should theion, https://doi.org/10.1016/j.cmi.2019.02.011
J. Nielsen et al. / Clinical Microbiology and Infection xxx (xxxx) xxx 3
applying a 2/3-power correction, and have been described in detailelsewhere [7].
To estimate influenza-attributable mortality for each countrywe used the all-cause mortality data from EuroMOMO, aggregatedby week and age group, combined with weekly influenza activity(IA) and temperature data. As IA indicator, we used the Goldsteinindex [14], defined as the ILI rate multiplied by the Positive Per-centage (PP), i.e. proportion of sentinel influenza-positive speci-mens among all sentinel specimens tested for influenza. Thisindicator combines the clinical measure of influenza circulating inthe population (ILI) with PP to take into account that not all ILI casesare due to influenza. In countries or seasons, where ILI data wereunavailable, Acute Respiratory Infection (ARI) rates or alternativelythe indicator Intensity (Low, Medium, High or Very High; a quali-tative measure, recommended to be based on the Moving EpidemicMethod [15]) was used. ILI/ARI/Intensity data as well as virologydata were downloaded from the TESSy database at the EuropeanCentre for Disease Prevention and Control (ECDC) [16,17]. Virolog-ical data registered in TESSy are not age differentiated, therefore thesame all-ages virological data had to be used in each age group.Ambient daily temperature data from weather stations in each ofthe participating countries was captured from the National Oceanicand Atmospheric Administration (NOAA) [18]. Weekly extremetemperatures were defined as degrees of temperature above theexpected weekly average maximum temperatures or below theweekly average minimum temperature [7].
We estimated the pooled mortality attributable to influenza andextreme temperatures for the winter seasons 2012/13 to 2017/18using country-stratified pooled analyses, thus adjusting for
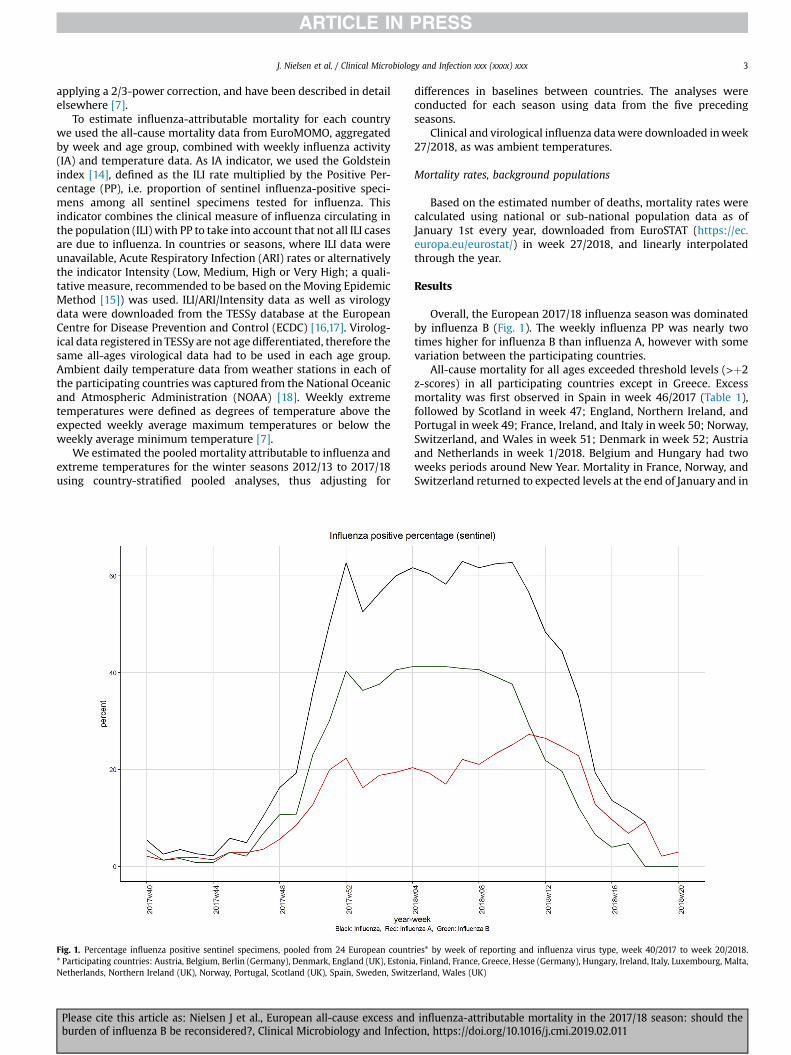
Fig. 1. Percentage influenza positive sentinel specimens, pooled from 24 European countr* Participating countries: Austria, Belgium, Berlin (Germany), Denmark, England (UK), EstoniNetherlands, Northern Ireland (UK), Norway, Portugal, Scotland (UK), Spain, Sweden, Switz
Please cite this article as: Nielsen J et al., European all-cause excess andburden of influenza B be reconsidered?, Clinical Microbiology and Infect
differences in baselines between countries. The analyses wereconducted for each season using data from the five precedingseasons.
Clinical and virological influenza datawere downloaded inweek27/2018, as was ambient temperatures.
Mortality rates, background populations
Based on the estimated number of deaths, mortality rates werecalculated using national or sub-national population data as ofJanuary 1st every year, downloaded from EuroSTAT (https://ec.europa.eu/eurostat/) in week 27/2018, and linearly interpolatedthrough the year.
Results
Overall, the European 2017/18 influenza season was dominatedby influenza B (Fig. 1). The weekly influenza PP was nearly twotimes higher for influenza B than influenza A, however with somevariation between the participating countries.
All-cause mortality for all ages exceeded threshold levels (>þ2z-scores) in all participating countries except in Greece. Excessmortality was first observed in Spain in week 46/2017 (Table 1),followed by Scotland in week 47; England, Northern Ireland, andPortugal in week 49; France, Ireland, and Italy in week 50; Norway,Switzerland, and Wales in week 51; Denmark in week 52; Austriaand Netherlands in week 1/2018. Belgium and Hungary had twoweeks periods around New Year. Mortality in France, Norway, andSwitzerland returned to expected levels at the end of January and in
ies* by week of reporting and influenza virus type, week 40/2017 to week 20/2018.a, Finland, France, Greece, Hesse (Germany), Hungary, Ireland, Italy, Luxembourg, Malta,erland, Wales (UK)
influenza-attributable mortality in the 2017/18 season: should theion, https://doi.org/10.1016/j.cmi.2019.02.011
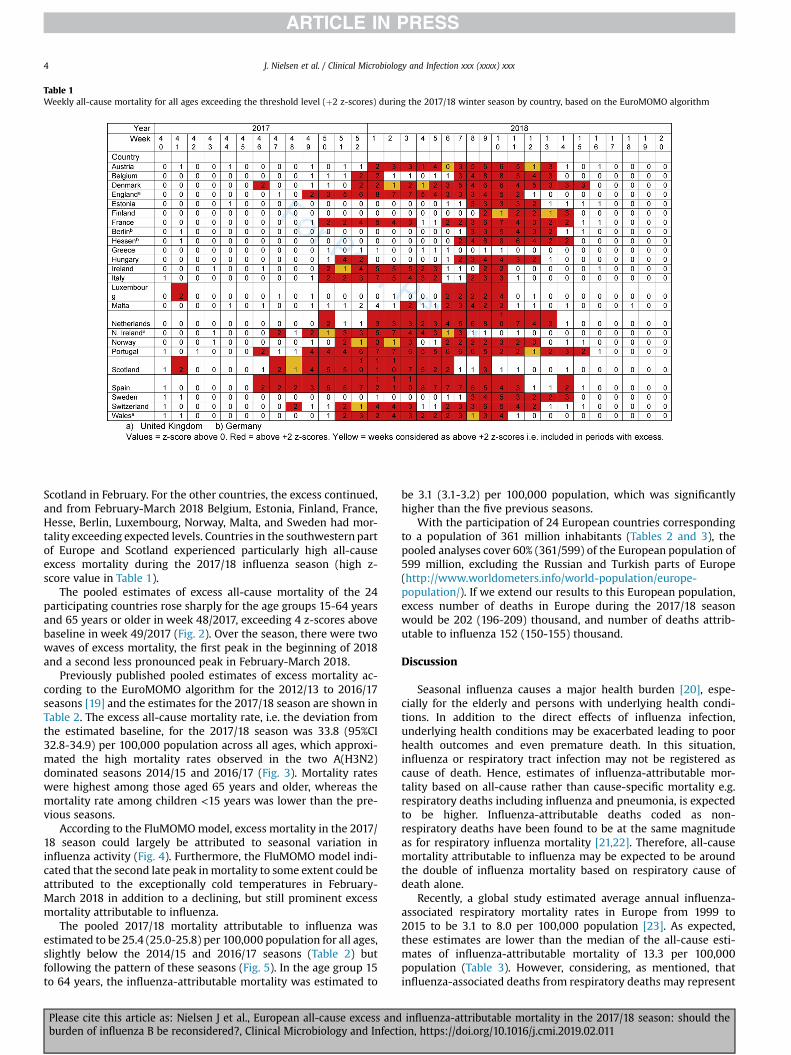
Table 1Weekly all-cause mortality for all ages exceeding the threshold level (þ2 z-scores) during the 2017/18 winter season by country, based on the EuroMOMO algorithm
J. Nielsen et al. / Clinical Microbiology and Infection xxx (xxxx) xxx4
Scotland in February. For the other countries, the excess continued,and from February-March 2018 Belgium, Estonia, Finland, France,Hesse, Berlin, Luxembourg, Norway, Malta, and Sweden had mor-tality exceeding expected levels. Countries in the southwestern partof Europe and Scotland experienced particularly high all-causeexcess mortality during the 2017/18 influenza season (high z-score value in Table 1).
The pooled estimates of excess all-cause mortality of the 24participating countries rose sharply for the age groups 15-64 yearsand 65 years or older in week 48/2017, exceeding 4 z-scores abovebaseline in week 49/2017 (Fig. 2). Over the season, there were twowaves of excess mortality, the first peak in the beginning of 2018and a second less pronounced peak in February-March 2018.
Previously published pooled estimates of excess mortality ac-cording to the EuroMOMO algorithm for the 2012/13 to 2016/17seasons [19] and the estimates for the 2017/18 season are shown inTable 2. The excess all-cause mortality rate, i.e. the deviation fromthe estimated baseline, for the 2017/18 season was 33.8 (95%CI32.8-34.9) per 100,000 population across all ages, which approxi-mated the high mortality rates observed in the two A(H3N2)dominated seasons 2014/15 and 2016/17 (Fig. 3). Mortality rateswere highest among those aged 65 years and older, whereas themortality rate among children <15 years was lower than the pre-vious seasons.
According to the FluMOMOmodel, excess mortality in the 2017/18 season could largely be attributed to seasonal variation ininfluenza activity (Fig. 4). Furthermore, the FluMOMO model indi-cated that the second late peak inmortality to some extent could beattributed to the exceptionally cold temperatures in February-March 2018 in addition to a declining, but still prominent excessmortality attributable to influenza.
The pooled 2017/18 mortality attributable to influenza wasestimated to be 25.4 (25.0-25.8) per 100,000 population for all ages,slightly below the 2014/15 and 2016/17 seasons (Table 2) butfollowing the pattern of these seasons (Fig. 5). In the age group 15to 64 years, the influenza-attributable mortality was estimated to
Please cite this article as: Nielsen J et al., European all-cause excess andburden of influenza B be reconsidered?, Clinical Microbiology and Infect
be 3.1 (3.1-3.2) per 100,000 population, which was significantlyhigher than the five previous seasons.
With the participation of 24 European countries correspondingto a population of 361 million inhabitants (Tables 2 and 3), thepooled analyses cover 60% (361/599) of the European population of599 million, excluding the Russian and Turkish parts of Europe(http://www.worldometers.info/world-population/europe-population/). If we extend our results to this European population,excess number of deaths in Europe during the 2017/18 seasonwould be 202 (196-209) thousand, and number of deaths attrib-utable to influenza 152 (150-155) thousand.
Discussion
Seasonal influenza causes a major health burden [20], espe-cially for the elderly and persons with underlying health condi-tions. In addition to the direct effects of influenza infection,underlying health conditions may be exacerbated leading to poorhealth outcomes and even premature death. In this situation,influenza or respiratory tract infection may not be registered ascause of death. Hence, estimates of influenza-attributable mor-tality based on all-cause rather than cause-specific mortality e.g.respiratory deaths including influenza and pneumonia, is expectedto be higher. Influenza-attributable deaths coded as non-respiratory deaths have been found to be at the same magnitudeas for respiratory influenza mortality [21,22]. Therefore, all-causemortality attributable to influenza may be expected to be aroundthe double of influenza mortality based on respiratory cause ofdeath alone.
Recently, a global study estimated average annual influenza-associated respiratory mortality rates in Europe from 1999 to2015 to be 3.1 to 8.0 per 100,000 population [23]. As expected,these estimates are lower than the median of the all-cause esti-mates of influenza-attributable mortality of 13.3 per 100,000population (Table 3). However, considering, as mentioned, thatinfluenza-associated deaths from respiratory deaths may represent
influenza-attributable mortality in the 2017/18 season: should theion, https://doi.org/10.1016/j.cmi.2019.02.011
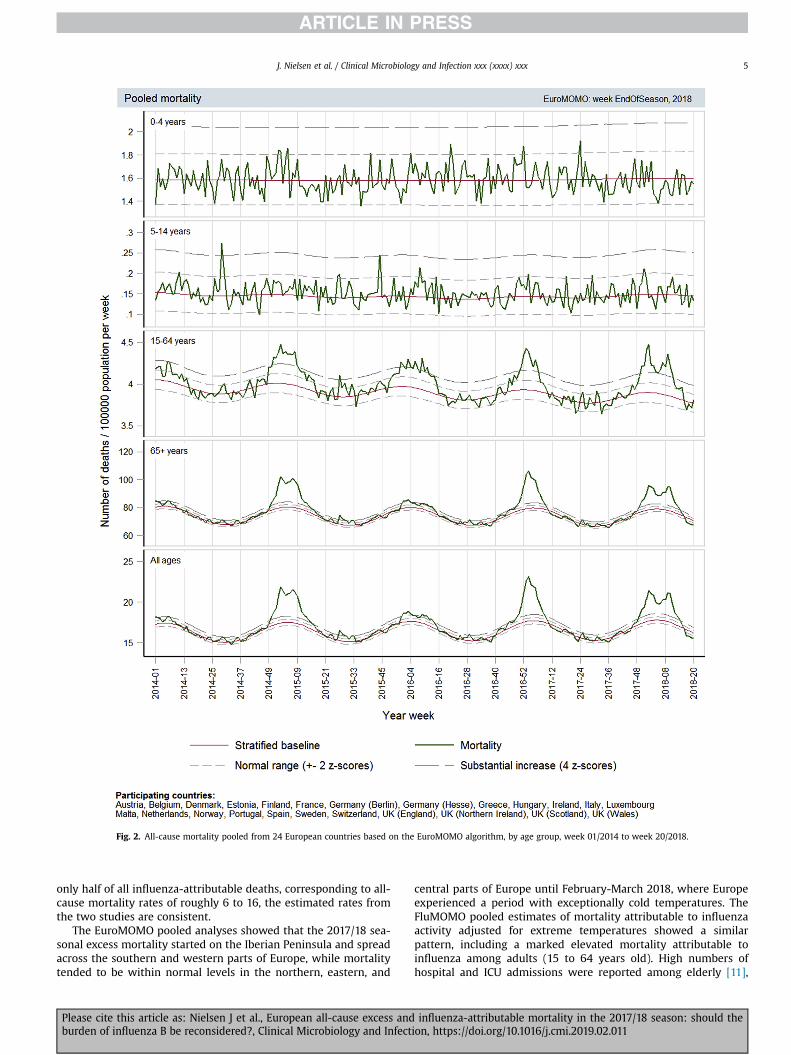
Fig. 2. All-cause mortality pooled from 24 European countries based on the EuroMOMO algorithm, by age group, week 01/2014 to week 20/2018.
J. Nielsen et al. / Clinical Microbiology and Infection xxx (xxxx) xxx 5
only half of all influenza-attributable deaths, corresponding to all-cause mortality rates of roughly 6 to 16, the estimated rates fromthe two studies are consistent.
The EuroMOMO pooled analyses showed that the 2017/18 sea-sonal excess mortality started on the Iberian Peninsula and spreadacross the southern and western parts of Europe, while mortalitytended to be within normal levels in the northern, eastern, and
Please cite this article as: Nielsen J et al., European all-cause excess andburden of influenza B be reconsidered?, Clinical Microbiology and Infect
central parts of Europe until February-March 2018, where Europeexperienced a period with exceptionally cold temperatures. TheFluMOMO pooled estimates of mortality attributable to influenzaactivity adjusted for extreme temperatures showed a similarpattern, including a marked elevated mortality attributable toinfluenza among adults (15 to 64 years old). High numbers ofhospital and ICU admissions were reported among elderly [11],
influenza-attributable mortality in the 2017/18 season: should theion, https://doi.org/10.1016/j.cmi.2019.02.011
Table 2Cumulated pooled all-cause excess mortality during the winter season based on the EuroMOMO algorithm, by season (week 40 to week 20) 2012/13 to 2017/18
Season 2012/13 2013/14 2014/15 2015/16 2016/17 2017/18
Circulating typesof influenza1
A(H1N1)pdm09 (47%)B/Yamagata (53%)
Mixed A (98%)B/Yamagata (2%)
A(H3N2) (67%)B/Yamagata (33%)
A(H1N1)pdm09 (56%)B/Victoria (44%)
A(H3N2) (89%)Mixed B (11%)
Mixed A (33%)B/Yamagata (67%)
WHO recommendedvaccine strains
A(H3N2)A(H1N1)pdm09B/Yamagata
A(H3N2)A(H1N1)pdm09B/Yamagata
A(H3N2)A(H1N1)pdm09B/Yamagata
A(H3N2)A(H1N1)pdm09B/Yamagata
A(H3N2)A(H1N1)pdm09B/Victoria
A(H3N2)A(H1N1)pdm09B/Victoria
Age groups Excess all-cause mortality per 100,000 population (95% CI)0-4 1.14 (0.36;1.92) 1.76 (1.00;2.52) 1.38 (0.62;2.14) 2.42 1.70;3.14) 0.88 (0.15;1.60) -1.07 (-1.72;-0.41)5-14 0.49 (0.31;0.67) 0.18 (0.02;0.35) 0.51 (0.35;0.67) 0.50 (0.34;0.66) 0.18 (0.03;0.34) 0.13 (-0.01;0,27)15-64 2.09 (1.66;2.53) 1.67 (1.22;2.12) 5.94 (5.53;6.35) 4,85 (4.47;5.23) 3.49 (3.13;3.86) 5.03 (4.71;5.35)�65 88.20 (81.42;94.99) -12.46 (-20.11;-4.79) 214.17 (207.60;220.74) 14.71 (8.82;20.60) 152.79 (146.43;159.16) 154.12 (149.35;158.89)Total 17.25 (15.96;18.55) -1.39 (-2.96;0.18) 43.63 (42.30;44.96) 5.37 (4.15;6.58) 29.21 (27.97;30.45) 33.81 (32.76;34.85)Number of countries
participating14 17 18 19 21 24
Population covered(millions)
268 275 279 340 345 361
Note: Excess mortality is defined as observed mortality minus baseline.1) For 2012/13 and 2013/14 all EU/EEA sentinel samples reported to ECDC (https://ecdc.europa.eu/en/seasonal-influenza/surveillance-and-disease-data/aer). From 2014/15
and onward, all European sentinel samples reported to WHO/ECDC (http://flunewseurope.org/Archives).
J. Nielsen et al. / Clinical Microbiology and Infection xxx (xxxx) xxx6
supporting increased disease impact especially among adults andelderly. In contrast, the influenza-attributable mortality amongchildren <15 years of age was at the same level or lower thanprevious seasons.
During the 2017/18 season, influenza B/Yamagata circulatedwidely and dominated over mixed influenza A subtypes. ManyEuropean countries experienced a marked excess mortality amongthe elderly similar to that observed during the A(H3N2) dominatedseasons 2014/15 and 2016/17. This observation challenges thecommon perception that influenza B has only a modest impact onsevere illness and mortality in the elderly population [24,25].Published data on burden of influenza B in Europe is scarce [26].However, a global review found that influenza B can pose a sig-nificant burden [27]. A Canadian study reported that the age dis-tribution differ between the two B lineages, with a substantiallyhigher median age for B/Yamagata [28]. This may explain thepattern in mortality observed during the B/Yamagata dominated2017/18 season. However, A(H3N2) circulated too, and may alsohave contributed to the excess mortality among elderly. It is alsopossible that the European population was more susceptible to B/Yamagata infection as B/Victoria has been the main circulatinglineage since the 2014/15 season and before that 2012/13 [11].Though B/Yamagata was included in the WHO recommended vac-cines from 2012/13 to 2015/16, the immunity in the populationmaybe limited due to low coverage, as influenza vaccination pro-grammes in most European countries target only risk groups inorder to minimise severe outcomes, and do not consider indirectprotection and herd immunity. However, even though influenza B/Yamagata was not included in the 2017/18 season's trivalentinfluenza vaccine, which was most widely used in Europeancountries, the vaccine effectiveness against influenza B has beenestimated to 36-54% [29], maybe due to preserved immunity fromprevious immunisation (infection or vaccination) [30] or crossprotection.
Limitations
Pooled estimates can both mask and accentuate differencesbetween countries in excess and influenza-attributable mortality.Therefore, an important component in the EuroMOMO proceduresis the initial national analyses to reveal excess mortality at country
Please cite this article as: Nielsen J et al., European all-cause excess andburden of influenza B be reconsidered?, Clinical Microbiology and Infect
level, while the pooled analyses may reveal small increases inmortality not immediately recognisable locally. For example, anexcess mortality among adults aged 15-64 years was detected inthe pooled analyses in the current season, but only in few of thecountries' national analyses.
All analyses of influenza-attributable mortality were per-formed at the EuroMOMO hub, using IA data from TESSy. Thishas the advantage of using common, standardised IA data, butalso has limitations e.g. missing a local review and validationprocess.
The Goldstein Index: ILI x PP, represents the most conservativeindicator of influenza activity and was the IA indicator used in theFluMOMO model [7,14]. However, not all countries report ILI, andwe used ARI or Intensity, where ILI was unavailable. Further,virology data from TESSy were not age-stratified; hence, the sameall-ages-PP was used in each of the age groups, which may havemasked differences between age groups. The impact of these lim-itations in IA should be investigated.
Mortality attributable to influenza differentiated by type/sub-type may provide an improved understanding of the burdenattributable to each type/sub-type. However, the nearly equalpattern in the circulation of influenza A and B in the 2017/18 season(Fig. 1) introduced collinearity between the influenza types i.e.making the effects difficult to separate. Further, splitting the IAparameter into type/sub-type substantially reduced the statisticalpower making the model unstable. Therefore, it was not feasible tomake type/sub-type differentiated estimates.
Heterogeneity in mortality patterns between countries mayreflect some real differences, possibly related to differences ininfluenza circulation by type/sub-type, country-specific populationsusceptibility, differences in influenza vaccine uptake, varying from5 to 75% coverage among elderly [31], or vaccine effectiveness.Therefore, regional analyses have the potential to provide addedvalue. However, with few participating countries in some regions ofEurope, this was not explored further.
We extended the estimated excess mortality in the participatingcountries to the European population, this extension is uncertainas potential differences in climate, influenza transmission, under-lying immunity and access to health care between the participatingand non-participating European countries were not taken intoaccount.
influenza-attributable mortality in the 2017/18 season: should theion, https://doi.org/10.1016/j.cmi.2019.02.011
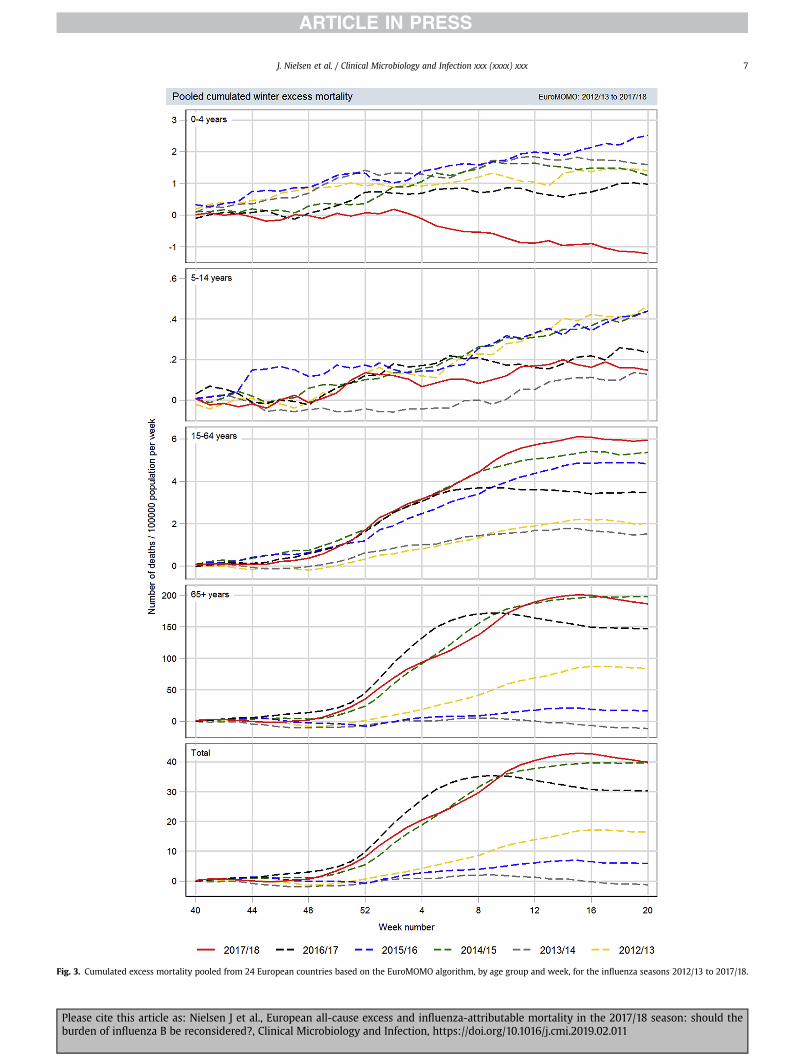
Fig. 3. Cumulated excess mortality pooled from 24 European countries based on the EuroMOMO algorithm, by age group and week, for the influenza seasons 2012/13 to 2017/18.
J. Nielsen et al. / Clinical Microbiology and Infection xxx (xxxx) xxx 7
Please cite this article as: Nielsen J et al., European all-cause excess and influenza-attributable mortality in the 2017/18 season: should theburden of influenza B be reconsidered?, Clinical Microbiology and Infection, https://doi.org/10.1016/j.cmi.2019.02.011
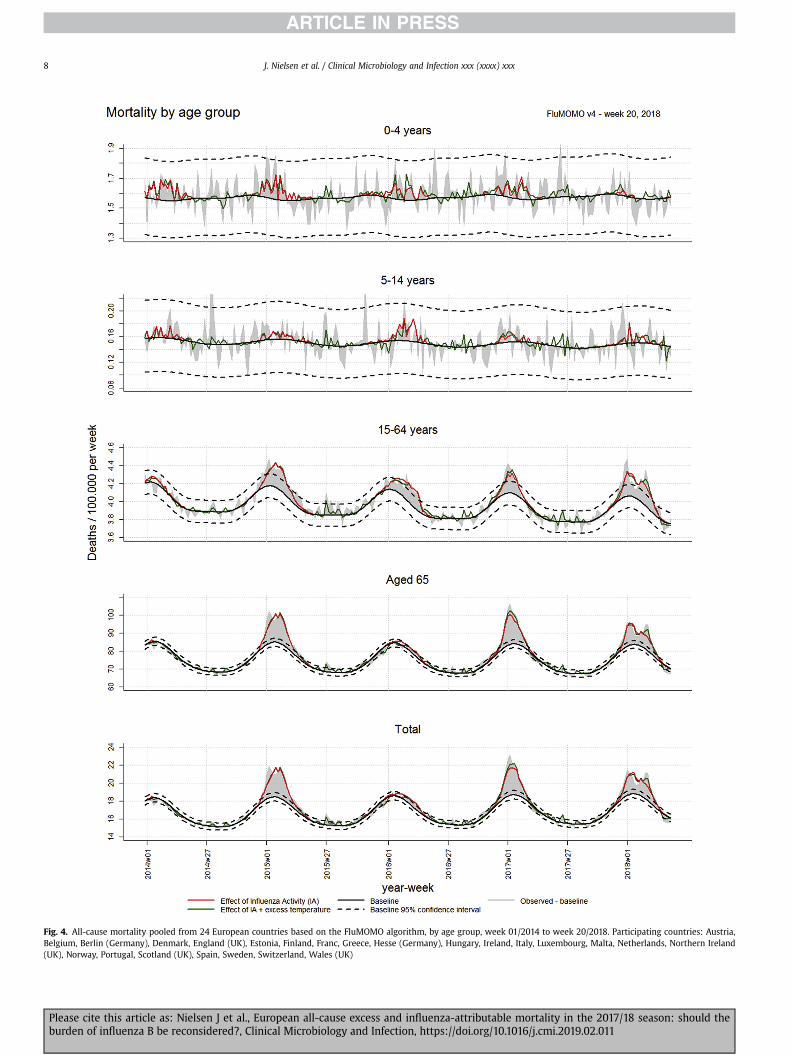
Fig. 4. All-cause mortality pooled from 24 European countries based on the FluMOMO algorithm, by age group, week 01/2014 to week 20/2018. Participating countries: Austria,Belgium, Berlin (Germany), Denmark, England (UK), Estonia, Finland, Franc, Greece, Hesse (Germany), Hungary, Ireland, Italy, Luxembourg, Malta, Netherlands, Northern Ireland(UK), Norway, Portugal, Scotland (UK), Spain, Sweden, Switzerland, Wales (UK)
J. Nielsen et al. / Clinical Microbiology and Infection xxx (xxxx) xxx8
Please cite this article as: Nielsen J et al., European all-cause excess and influenza-attributable mortality in the 2017/18 season: should theburden of influenza B be reconsidered?, Clinical Microbiology and Infection, https://doi.org/10.1016/j.cmi.2019.02.011

Fig. 5. Cumulated influenza attributable mortality pooled from 24 European countries based on the FluMOMO algorithm, by age group and week, for the influenza seasons 2012/13to 2017/18.
J. Nielsen et al. / Clinical Microbiology and Infection xxx (xxxx) xxx 9
Please cite this article as: Nielsen J et al., European all-cause excess and influenza-attributable mortality in the 2017/18 season: should theburden of influenza B be reconsidered?, Clinical Microbiology and Infection, https://doi.org/10.1016/j.cmi.2019.02.011
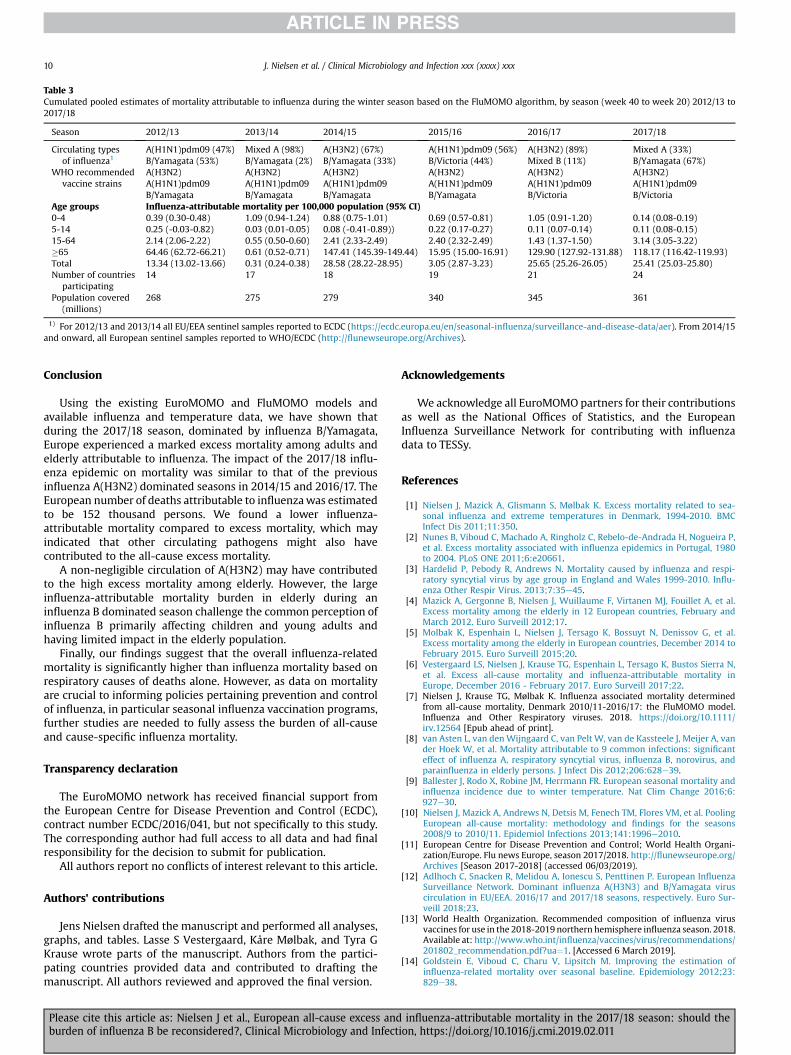
Table 3Cumulated pooled estimates of mortality attributable to influenza during the winter season based on the FluMOMO algorithm, by season (week 40 to week 20) 2012/13 to2017/18
Season 2012/13 2013/14 2014/15 2015/16 2016/17 2017/18
Circulating typesof influenza1
A(H1N1)pdm09 (47%)B/Yamagata (53%)
Mixed A (98%)B/Yamagata (2%)
A(H3N2) (67%)B/Yamagata (33%)
A(H1N1)pdm09 (56%)B/Victoria (44%)
A(H3N2) (89%)Mixed B (11%)
Mixed A (33%)B/Yamagata (67%)
WHO recommendedvaccine strains
A(H3N2)A(H1N1)pdm09B/Yamagata
A(H3N2)A(H1N1)pdm09B/Yamagata
A(H3N2)A(H1N1)pdm09B/Yamagata
A(H3N2)A(H1N1)pdm09B/Yamagata
A(H3N2)A(H1N1)pdm09B/Victoria
A(H3N2)A(H1N1)pdm09B/Victoria
Age groups Influenza-attributable mortality per 100,000 population (95% CI)0-4 0.39 (0.30-0.48) 1.09 (0.94-1.24) 0.88 (0.75-1.01) 0.69 (0.57-0.81) 1.05 (0.91-1.20) 0.14 (0.08-0.19)5-14 0.25 (-0.03-0.82) 0.03 (0.01-0.05) 0.08 (-0.41-0.89)) 0.22 (0.17-0.27) 0.11 (0.07-0.14) 0.11 (0.08-0.15)15-64 2.14 (2.06-2.22) 0.55 (0.50-0.60) 2.41 (2.33-2.49) 2.40 (2.32-2.49) 1.43 (1.37-1.50) 3.14 (3.05-3.22)�65 64.46 (62.72-66.21) 0.61 (0.52-0.71) 147.41 (145.39-149.44) 15.95 (15.00-16.91) 129.90 (127.92-131.88) 118.17 (116.42-119.93)Total 13.34 (13.02-13.66) 0.31 (0.24-0.38) 28.58 (28.22-28.95) 3.05 (2.87-3.23) 25.65 (25.26-26.05) 25.41 (25.03-25.80)Number of countries
participating14 17 18 19 21 24
Population covered(millions)
268 275 279 340 345 361
1) For 2012/13 and 2013/14 all EU/EEA sentinel samples reported to ECDC (https://ecdc.europa.eu/en/seasonal-influenza/surveillance-and-disease-data/aer). From 2014/15and onward, all European sentinel samples reported to WHO/ECDC (http://flunewseurope.org/Archives).
J. Nielsen et al. / Clinical Microbiology and Infection xxx (xxxx) xxx10
Conclusion
Using the existing EuroMOMO and FluMOMO models andavailable influenza and temperature data, we have shown thatduring the 2017/18 season, dominated by influenza B/Yamagata,Europe experienced a marked excess mortality among adults andelderly attributable to influenza. The impact of the 2017/18 influ-enza epidemic on mortality was similar to that of the previousinfluenza A(H3N2) dominated seasons in 2014/15 and 2016/17. TheEuropean number of deaths attributable to influenzawas estimatedto be 152 thousand persons. We found a lower influenza-attributable mortality compared to excess mortality, which mayindicated that other circulating pathogens might also havecontributed to the all-cause excess mortality.
A non-negligible circulation of A(H3N2) may have contributedto the high excess mortality among elderly. However, the largeinfluenza-attributable mortality burden in elderly during aninfluenza B dominated season challenge the common perception ofinfluenza B primarily affecting children and young adults andhaving limited impact in the elderly population.
Finally, our findings suggest that the overall influenza-relatedmortality is significantly higher than influenza mortality based onrespiratory causes of deaths alone. However, as data on mortalityare crucial to informing policies pertaining prevention and controlof influenza, in particular seasonal influenza vaccination programs,further studies are needed to fully assess the burden of all-causeand cause-specific influenza mortality.
Transparency declaration
The EuroMOMO network has received financial support fromthe European Centre for Disease Prevention and Control (ECDC),contract number ECDC/2016/041, but not specifically to this study.The corresponding author had full access to all data and had finalresponsibility for the decision to submit for publication.
All authors report no conflicts of interest relevant to this article.
Authors' contributions
Jens Nielsen drafted the manuscript and performed all analyses,graphs, and tables. Lasse S Vestergaard, Kåre Mølbak, and Tyra GKrause wrote parts of the manuscript. Authors from the partici-pating countries provided data and contributed to drafting themanuscript. All authors reviewed and approved the final version.
Please cite this article as: Nielsen J et al., European all-cause excess andburden of influenza B be reconsidered?, Clinical Microbiology and Infect
Acknowledgements
We acknowledge all EuroMOMO partners for their contributionsas well as the National Offices of Statistics, and the EuropeanInfluenza Surveillance Network for contributing with influenzadata to TESSy.
References
[1] Nielsen J, Mazick A, Glismann S, Mølbak K. Excess mortality related to sea-sonal influenza and extreme temperatures in Denmark, 1994-2010. BMCInfect Dis 2011;11:350.
[2] Nunes B, Viboud C, Machado A, Ringholz C, Rebelo-de-Andrada H, Nogueira P,et al. Excess mortality associated with influenza epidemics in Portugal, 1980to 2004. PLoS ONE 2011;6:e20661.
[3] Hardelid P, Pebody R, Andrews N. Mortality caused by influenza and respi-ratory syncytial virus by age group in England and Wales 1999-2010. Influ-enza Other Respir Virus. 2013;7:35e45.
[4] Mazick A, Gergonne B, Nielsen J, Wuillaume F, Virtanen MJ, Fouillet A, et al.Excess mortality among the elderly in 12 European countries, February andMarch 2012. Euro Surveill 2012;17.
[5] Molbak K, Espenhain L, Nielsen J, Tersago K, Bossuyt N, Denissov G, et al.Excess mortality among the elderly in European countries, December 2014 toFebruary 2015. Euro Surveill 2015;20.
[6] Vestergaard LS, Nielsen J, Krause TG, Espenhain L, Tersago K, Bustos Sierra N,et al. Excess all-cause mortality and influenza-attributable mortality inEurope, December 2016 - February 2017. Euro Surveill 2017;22.
[7] Nielsen J, Krause TG, Mølbak K. Influenza associated mortality determinedfrom all-cause mortality, Denmark 2010/11-2016/17: the FluMOMO model.Influenza and Other Respiratory viruses. 2018. https://doi.org/10.1111/irv.12564 [Epub ahead of print].
[8] van Asten L, van denWijngaard C, van Pelt W, van de Kassteele J, Meijer A, vander Hoek W, et al. Mortality attributable to 9 common infections: significanteffect of influenza A, respiratory syncytial virus, influenza B, norovirus, andparainfluenza in elderly persons. J Infect Dis 2012;206:628e39.
[9] Ballester J, Rodo X, Robine JM, Herrmann FR. European seasonal mortality andinfluenza incidence due to winter temperature. Nat Clim Change 2016;6:927e30.
[10] Nielsen J, Mazick A, Andrews N, Detsis M, Fenech TM, Flores VM, et al. PoolingEuropean all-cause mortality: methodology and findings for the seasons2008/9 to 2010/11. Epidemiol Infections 2013;141:1996e2010.
[11] European Centre for Disease Prevention and Control; World Health Organi-zation/Europe. Flu news Europe, season 2017/2018. http://flunewseurope.org/Archives [Season 2017-2018] (accessed 06/03/2019).
[12] Adlhoch C, Snacken R, Melidou A, Ionescu S, Penttinen P. European InfluenzaSurveillance Network. Dominant influenza A(H3N3) and B/Yamagata viruscirculation in EU/EEA. 2016/17 and 2017/18 seasons, respectively. Euro Sur-veill 2018;23.
[13] World Health Organization. Recommended composition of influenza virusvaccines for use in the 2018-2019 northern hemisphere influenza season. 2018.Available at: http://www.who.int/influenza/vaccines/virus/recommendations/201802_recommendation.pdf?ua¼1. [Accessed 6 March 2019].
[14] Goldstein E, Viboud C, Charu V, Lipsitch M. Improving the estimation ofinfluenza-related mortality over seasonal baseline. Epidemiology 2012;23:829e38.
influenza-attributable mortality in the 2017/18 season: should theion, https://doi.org/10.1016/j.cmi.2019.02.011
J. Nielsen et al. / Clinical Microbiology and Infection xxx (xxxx) xxx 11
[15] Vega T, Lozano JE, Meerhoff T, Snacken R, Beaut�e J, Jorgensen P, et al. Influenzasurveillance in Europe: comparing intensity levels calculated using themoving epidemic method. Influenza Other Respir Virus 2015;9:234e46.
[16] European Centre for Disease Prevention and Control. The European surveil-lance system (TESSy). Available at: https://ecdc.europa.eu/en/publications-data/european-surveillance-system-tessy (accessed 06/03/2019).
[17] Snacken R, Brown C. New developments of influenza surveillance in Europe.Euro Surveill 2015;20.
[18] NOAA. National Oceanic and Atmospheric Administration (ftp://ftp.ncdc.noaa.gov/pub/data/gsod/GSOD_DESC.txt, accessed 06/03/2019).
[19] reportWinter season 2016/17 mortality summary report. http://www.euromomo.eu/methods/publications.html (accessed 06/03/2019).
[20] Cassini A, Colzani E, Pini A, Mangen MJ, Plass D, McDonald SA, et al. Impact ofinfectious diseases on public health using incidence-bassed-disability-adjusted life years (DALY’s): results from the Burden of Communicable Dis-ease in Europe study, European Union and European Economic Area countries,2009 to 2013. EuroSurveillance 2018;23.
[21] Redlberger-Fritz M, Aberle JH, Popow-Kraupp T, Kundi M. Attributable deathsdue to influenza: a comparative study of seasonal and pandemic influenza.Eur J Epidemiol 2012;27:567e75.
[22] Muscatello DJ, Newall AT, Dwyer DE, Macintyre CR. Mortality attributable toseasonal and pandemic influenza, Australia, 2003 to 2009, using a novel timeseries smoothing approach. PLoS One 2014;8:e64734.
[23] Iuliano AD, Roguski KM, Chang HH, Muscatello DJ, Palekar R, Tempia S, et al.Estimates of global seasonal influenza-associated respiratory mortality: amodelling study. Lancet 2018;391:1285e300.
Please cite this article as: Nielsen J et al., European all-cause excess andburden of influenza B be reconsidered?, Clinical Microbiology and Infect
[24] Wilson JD, Braunwald E, Isselbacher KJ, Petersdrof RG, Martin JB, Fauci AS,et al. Harrison’s principles of internal medicine 12th ed. (page 697). McGraw-Hill, Inc.
[25] Nelsen KE, Williams CFM. Infectious disease epidemiology, theory and prac-tice (page 583). 2nd ed.. Jones and Bartlett Publishers, Inc.
[26] Tafalla M, Buijssen M, Geets R, Noordegraaf-Schouten MV. A comprehensivereview of the epidemiology and disease burden of Influenza B in 9 Europeancountries. Hum Vaccines Immunotherapeutics 2016;12:993e1002.
[27] Glezen WP, Jordana K, Kuehn CM, Ryan KJ, Oxford J. The burden of InfluenzaB: a structured literature review. Am J Public Health 2013;103:e43e51.
[28] Skowronski DM, Chambers C, De Serres G, Sabaiduc S, Winter AL,Dickinson JA, et al. Age-related differences in influenza B infections by lineagein a community-based sentinel system, 2010-2011 to 2015-2016, Canada.J Infect Dis 2017;216:697e708.
[29] Rondy M, Kissling E, Emborg H-D, Gherasim A, Pebody R, Trebbien R, et al.Interim 2017/18 influenza seasonal vaccine effectiveness: combined resultsfrom five European studies. Euro Surveill 2018;23.
[30] Frey S, Vesikari T, Szymczakiewicz-Multanowska A, Lattanzi M, Izu A, Groth N,et al. Clinical efficacy of cell-derived and egg-derived inactivated subunitinfluenza vaccines in healthy adults. Clin Infect Dis 2010;51:997e1004.
[31] European Centre for Disease Prevention and Control, Seasonal influenzavaccination in Europe - Vaccination recommendations and coverage rates foreight influenza seasons (2007-2008 to 2014-2015). https://ecdc.europa.eu/en/publications-data/seasonal-influenza-vaccination-europe-vaccination-recommendations-and-coverage-2007-2015 (accessed 06/03/2019).
influenza-attributable mortality in the 2017/18 season: should theion, https://doi.org/10.1016/j.cmi.2019.02.011
![Sport Utility Vehicle...Rated output1 (kW [HP] at rpm) XXX XXX XXX XXX XXX Acceleration from 0 to 100 km/h (s) XXX XXX XXX XXX XXX Top speed (km/h) XXX 3XXX XXX 3XXX XXX3 Fuel consumption4](https://static.fdocuments.in/doc/165x107/5e9ad03bae36bf4b5c045c78/sport-utility-vehicle-rated-output1-kw-hp-at-rpm-xxx-xxx-xxx-xxx-xxx-acceleration.jpg)