Clinical Chemistry -Samples
105
MANUAL ON STANDARD OPERATION PROCEDURES, SAMPLE COLLECTION AND REFERENCE RANGES FOR CLINICAL CHEMISTRY WORLD HEALTH ORGANISATION, MINISTRY OF HEALTH AND THE DEPARTMENT OF BIOCHEMISTRY, MEDICAL RESEARCH INSTITUTE SRI LANKA
-
Upload
samar-sharaf -
Category
Documents
-
view
244 -
download
25
Transcript of Clinical Chemistry -Samples

MANUAL ON STANDARD OPERATION PROCEDURES, SAMPLE COLLECTION AND
REFERENCE RANGES FOR
CLINICAL CHEMISTRY
WORLD HEALTH ORGANISATION,
MINISTRY OF HEALTH
AND
THE DEPARTMENT OF BIOCHEMISTRY, MEDICAL RESEARCH INSTITUTE
SRI LANKA


MANUAL ON STANDARD OPERATION PROCEDURES, SAMPLE COLLECTION
AND REFERENCE RANGES FOR CLINICAL CHEMISTRY
Dr. Meliyanthi M. Gunatillaka Consultant Chemical Pathologist and Head, Department of Biochemistry
Medical Research Institute, Colombo
Ms. D. K. Daya Silva Superintendent Grade Medical Laboratory Technologist
Medical Research Institute, Colombo
Mr. M. Muhammed Hunais Medical Laboratory Technologist
Medical Research Institute, Colombo

This document is NOT for sale. The document may, however, be freely reviewed, abstracted, reproduced or translated, in
part or in whole for non commercial purposes.
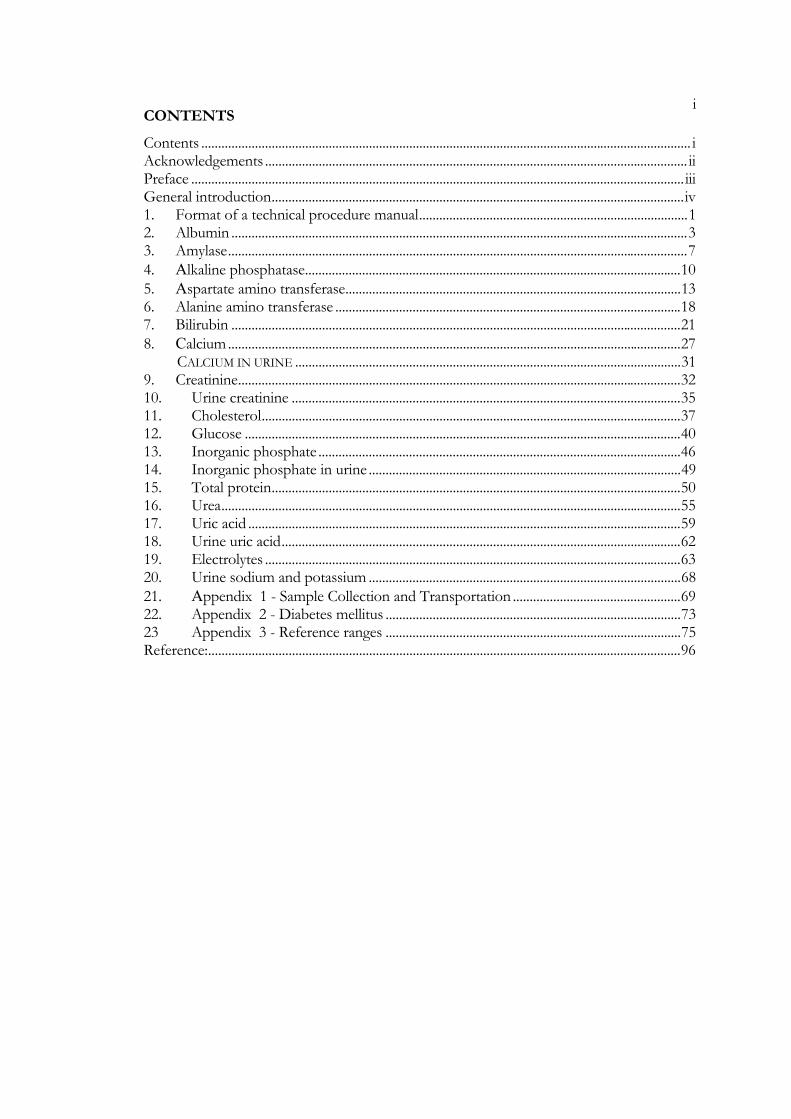
iCONTENTS
Contents .................................................................................................................................................. i Acknowledgements .............................................................................................................................. ii Preface ................................................................................................................................................... iii General introduction...........................................................................................................................iv 1. Format of a technical procedure manual................................................................................1 2. Albumin ........................................................................................................................................3 3. Amylase.........................................................................................................................................7 4. Alkaline phosphatase................................................................................................................10 5. Aspartate amino transferase....................................................................................................13 6. Alanine amino transferase .......................................................................................................18 7. Bilirubin ......................................................................................................................................21 8. Calcium.......................................................................................................................................27 CALCIUM IN URINE ...................................................................................................................31 9. Creatinine....................................................................................................................................32 10. Urine creatinine ....................................................................................................................35 11. Cholesterol.............................................................................................................................37 12. Glucose ..................................................................................................................................40 13. Inorganic phosphate ............................................................................................................46 14. Inorganic phosphate in urine .............................................................................................49 15. Total protein..........................................................................................................................50 16. Urea.........................................................................................................................................55 17. Uric acid .................................................................................................................................59 18. Urine uric acid.......................................................................................................................62 19. Electrolytes ............................................................................................................................63 20. Urine sodium and potassium .............................................................................................68 21. Appendix 1 - Sample Collection and Transportation ..................................................69 22. Appendix 2 - Diabetes mellitus ........................................................................................73 23 Appendix 3 - Reference ranges ........................................................................................75 Reference:.............................................................................................................................................96
ii
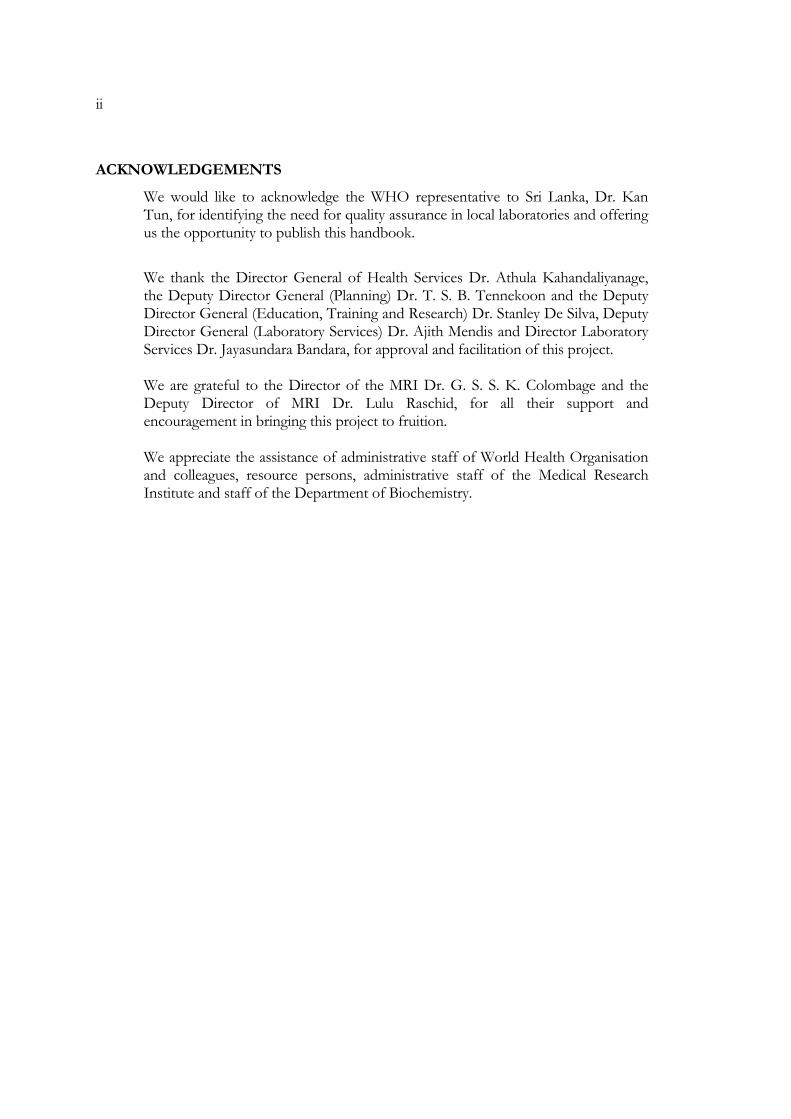
ACKNOWLEDGEMENTS
We would like to acknowledge the WHO representative to Sri Lanka, Dr. Kan Tun, for identifying the need for quality assurance in local laboratories and offering us the opportunity to publish this handbook.
We thank the Director General of Health Services Dr. Athula Kahandaliyanage, the Deputy Director General (Planning) Dr. T. S. B. Tennekoon and the Deputy Director General (Education, Training and Research) Dr. Stanley De Silva, Deputy Director General (Laboratory Services) Dr. Ajith Mendis and Director Laboratory Services Dr. Jayasundara Bandara, for approval and facilitation of this project. We are grateful to the Director of the MRI Dr. G. S. S. K. Colombage and the Deputy Director of MRI Dr. Lulu Raschid, for all their support and encouragement in bringing this project to fruition. We appreciate the assistance of administrative staff of World Health Organisation and colleagues, resource persons, administrative staff of the Medical Research Institute and staff of the Department of Biochemistry.
iii
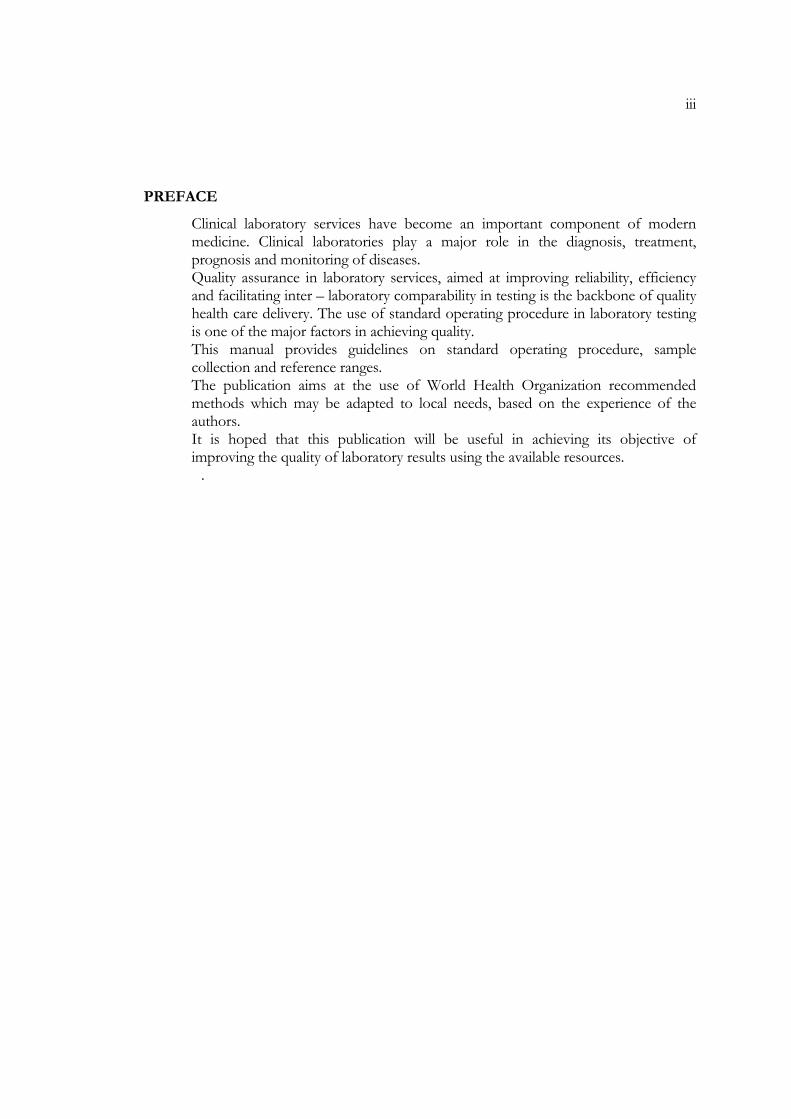
PREFACE
Clinical laboratory services have become an important component of modern medicine. Clinical laboratories play a major role in the diagnosis, treatment, prognosis and monitoring of diseases. Quality assurance in laboratory services, aimed at improving reliability, efficiency and facilitating inter – laboratory comparability in testing is the backbone of quality health care delivery. The use of standard operating procedure in laboratory testing is one of the major factors in achieving quality. This manual provides guidelines on standard operating procedure, sample collection and reference ranges. The publication aims at the use of World Health Organization recommended methods which may be adapted to local needs, based on the experience of the authors. It is hoped that this publication will be useful in achieving its objective of improving the quality of laboratory results using the available resources.
.
iv
GENERAL INTRODUCTION
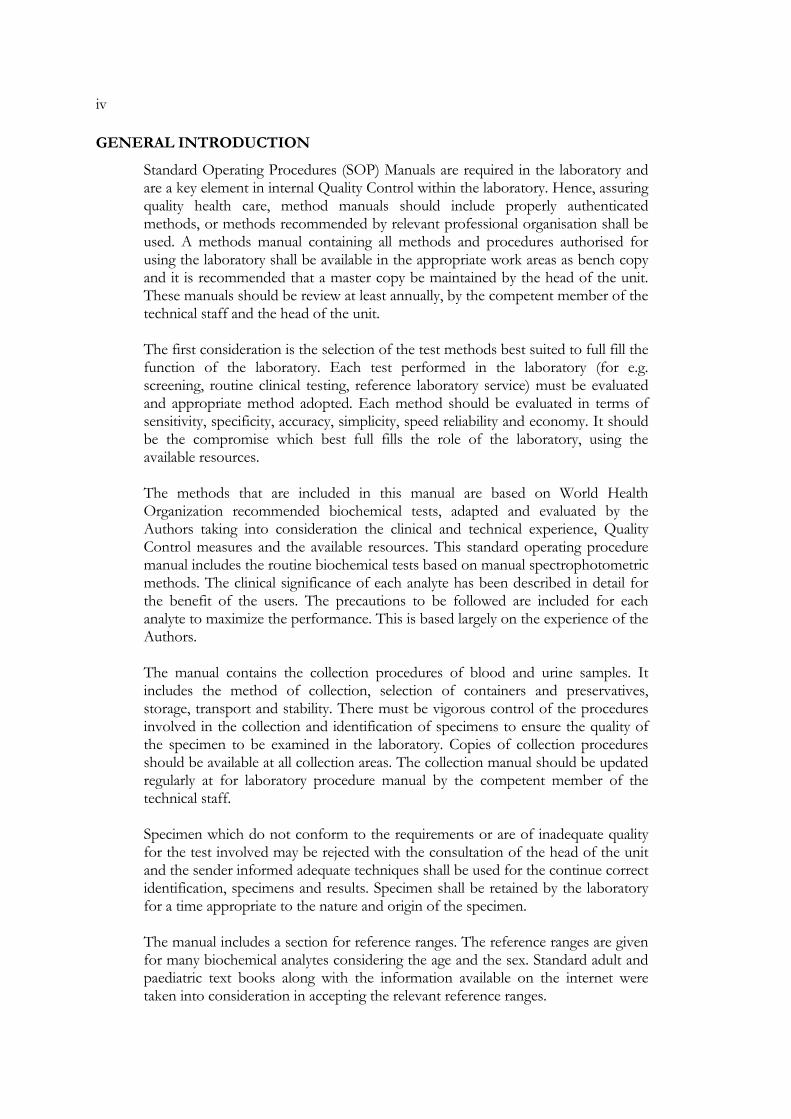
Standard Operating Procedures (SOP) Manuals are required in the laboratory and are a key element in internal Quality Control within the laboratory. Hence, assuring quality health care, method manuals should include properly authenticated methods, or methods recommended by relevant professional organisation shall be used. A methods manual containing all methods and procedures authorised for using the laboratory shall be available in the appropriate work areas as bench copy and it is recommended that a master copy be maintained by the head of the unit. These manuals should be review at least annually, by the competent member of the technical staff and the head of the unit. The first consideration is the selection of the test methods best suited to full fill the function of the laboratory. Each test performed in the laboratory (for e.g. screening, routine clinical testing, reference laboratory service) must be evaluated and appropriate method adopted. Each method should be evaluated in terms of sensitivity, specificity, accuracy, simplicity, speed reliability and economy. It should be the compromise which best full fills the role of the laboratory, using the available resources. The methods that are included in this manual are based on World Health Organization recommended biochemical tests, adapted and evaluated by the Authors taking into consideration the clinical and technical experience, Quality Control measures and the available resources. This standard operating procedure manual includes the routine biochemical tests based on manual spectrophotometric methods. The clinical significance of each analyte has been described in detail for the benefit of the users. The precautions to be followed are included for each analyte to maximize the performance. This is based largely on the experience of the Authors. The manual contains the collection procedures of blood and urine samples. It includes the method of collection, selection of containers and preservatives, storage, transport and stability. There must be vigorous control of the procedures involved in the collection and identification of specimens to ensure the quality of the specimen to be examined in the laboratory. Copies of collection procedures should be available at all collection areas. The collection manual should be updated regularly at for laboratory procedure manual by the competent member of the technical staff. Specimen which do not conform to the requirements or are of inadequate quality for the test involved may be rejected with the consultation of the head of the unit and the sender informed adequate techniques shall be used for the continue correct identification, specimens and results. Specimen shall be retained by the laboratory for a time appropriate to the nature and origin of the specimen. The manual includes a section for reference ranges. The reference ranges are given for many biochemical analytes considering the age and the sex. Standard adult and paediatric text books along with the information available on the internet were taken into consideration in accepting the relevant reference ranges.
1
1. FORMAT OF A TECHNICAL PROCEDURE MANUAL
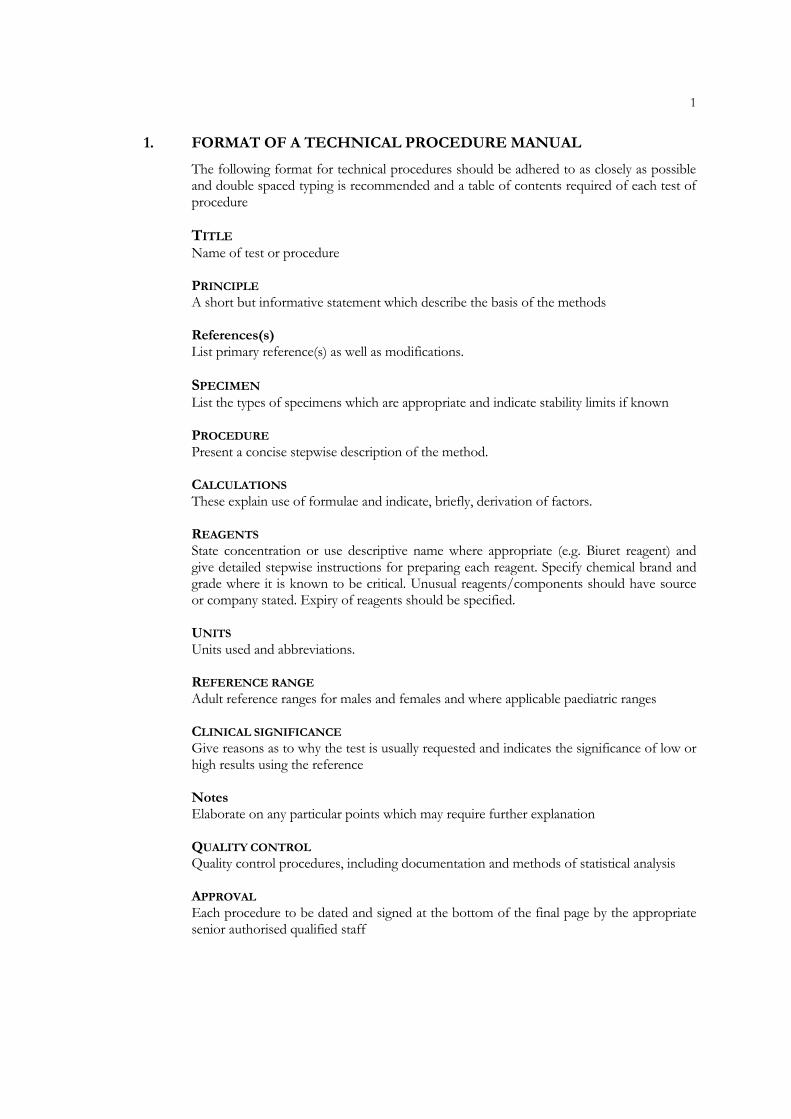
The following format for technical procedures should be adhered to as closely as possible and double spaced typing is recommended and a table of contents required of each test of procedure TITLE Name of test or procedure PRINCIPLE A short but informative statement which describe the basis of the methods References(s) List primary reference(s) as well as modifications. SPECIMEN List the types of specimens which are appropriate and indicate stability limits if known PROCEDURE Present a concise stepwise description of the method. CALCULATIONS These explain use of formulae and indicate, briefly, derivation of factors. REAGENTS State concentration or use descriptive name where appropriate (e.g. Biuret reagent) and give detailed stepwise instructions for preparing each reagent. Specify chemical brand and grade where it is known to be critical. Unusual reagents/components should have source or company stated. Expiry of reagents should be specified. UNITS Units used and abbreviations. REFERENCE RANGE Adult reference ranges for males and females and where applicable paediatric ranges CLINICAL SIGNIFICANCE Give reasons as to why the test is usually requested and indicates the significance of low or high results using the reference Notes Elaborate on any particular points which may require further explanation QUALITY CONTROL Quality control procedures, including documentation and methods of statistical analysis APPROVAL Each procedure to be dated and signed at the bottom of the final page by the appropriate senior authorised qualified staff

2 METHOD HISTORY This to be a separate sheet and include date notations of method changes and review REPORTING Format and procedure of reporting, including procedures for urgent and especially clinically significant results, must be described. COPIES Any copies of method for bench use are to be made in full from the master copy and should include method history and approval sections SUPPLEMENTARY INFORMATION Certain information to be used at the bench to implement procedures may be extracted from the procedure manual. This information may include flow diagrams, index cards, and manufacturer product literature. Such supplementary information must be current and be referenced to the procedure manual by date, procedure, reviewer’s initials, etc.

3 2. ALBUMIN
2.1 INTRODUCTION Albumin is the most abundant protein in human plasma from 20 weeks of gestation, representing 40-60% of the total protein. It is synthesized exclusively in the liver. The rate of synthesis is depended on protein intake and subject to feed back regulation by the plasma albumin level. The half life of albumin is estimated at 15-19 days. Traces of albumin can be found in almost all extra vascular body fluids. The loss of albumin via the glomerular filtrate is very small as almost all the albumin is reabsorbed by the proximal tubular cells. Albumin is catabolised in various tissues where it is taken up by cells by pinocytosis. Its constituent amino acids are released by intracellular proteolysis and returned to the body pool. Albumin has a molecular weight of approximately 66,000. Albumin is an anion at pH 7.4 with more than 200 negative charges/molecule. The chief biological functions of albumin are to transport and store a wide variety of ligands to maintain the plasma osmotic pressure and to serve as a source of endogenous amino acid. The capacity of albumin to act as a binding protein is due to the large numbers of charges of each molecule as well as very large no of molecules available. Albumin binds nonpolar compounds such as Bilirubin & long chain fatty acids. Albumin binds hormones such as thyroxin, Triiodothyronin, cortisol and aldosteron, thus act as a reservoir in which these compounds are stored in inactive form but from which they are readily mobilised. Some 40% of serum calcium is bound to albumin. Many drug such as phenyl glutazone, warfferin and salicylates are also strongly bounded to albumin. Albumin concentration is the major determinant of plasma oncotic pressure one of the factors that regulate partition water between intra and extra vascular compartments.
2.2 CLINICAL SIGNIFICANCE Hypoalbuminaemia is very common and may result due to the following factors
o Impaired synthesis: Diminished protein intake or liver disease o Increased catabolism: Due to tissue damage on inflammation o Reduce absorption of amino acid: caused by malabsorption syndrome or malnutrition. o Protein loss in urine: Due to Nephrotic syndrome chronic glomerular nephritis,
Diabetes,or systemic lupus erythromatosis o Protein loss in faeces: Due to protein losing enteropathy o Protein loss through the skin: Burns o Altered distribution: as for instance in ascites
Most severe hypoalbuminaemia is caused by protein loss by way of urine or faeces. When plasma albumin levels are less 2.0 g/l oedema is usually present. Hyper albumin: is of little diagnostic signification except in dehydration.
Albumin has more than 20 genetic variants, which are not associated with disease but which cause two bands or single band in the albumin region on electrophoresis. The condition is called bisalbuminaemia. Congenital absence of albumin or analbuminaemia is asymptomatic except for occasional slight oedema.
2.3 PRINCIPLE OF THE METHOD The requirements of a dye binding method for albumin include specific binding of the dye to albumin in the presence of other plasma or serum protein, high binding affinity between dye and albumin so that small changes in ionic strength and pH or presence of competing ligands do not break the dye-protein complex; a substantial shift in the absorption

4 wavelength of the dye in the bound form so that it remains spectrally distinct from the free form present in excess, and absorption maximum for the bound form at a wavelength distinct from those at which Bilirubin and haemoglobin can interfere. Serum albumin and buffered BCG (Bromocresol green) are allowed to bind at pH 4.2, and absorption of the BCG/Albumin complex is determined spectrometrically at 632 nm (filter No 607) Albumin act as a cation to bind the anionic dye. Absorption reading taken within 30 seconds of mixing the serum and BCG avoids the problem of non specific reaction of BCG with globulin. The manual method described here for albumin by BCG is adaptable to automated analysis.
2.4 SPECIMEN TYPE, COLLECTION AND STORAGE Serum is preferred. Fasting specimen is not an absolute requirement but it may be desirable because marked lipaemia interferes in the assay. Avoid, apply a tourniquet in specimen collection because haemoconcentration due to venous stasis increases the apparent concentration of albumin and other plasma proteins. Storage: Separate the serum within 2 hours of collection, separated serum in a tightly stoppered container is stable for 24 hours at room temperature 25-30 0 C, for 1 week at 2-8 0C, for 3 months at -20 0C.
APPARATUS AND CHEMICALS APPARATUS: Visible spectrophotometer, wavelength 632 nm or Colorimeter, orange filter, Ilford 607 (600nm) pH meter GLASSWARE: Volumetric flasks (1 litre and 100 ml volumes) Micro pipette (20 µl) Graduated pipettes (10 ml in 0.1 ml) Beakers (5ml, 50ml, 500 ml and 1 litre) Amber colour reagent bottles (1 litre) Test tubes (125 mm x 16 mm) Measuring cylinders (1 litre) CHEMICALS: (All chemicals must be analytical grade) Bromocresol green sodium salt, also called BCG, water soluble Sodium azide caution: handle with care Sodium chloride Succinic acid Sodium hydroxide pellets Brij-35 (polyoxy7ethylene (23) lauryl ether) solid or solution 30% w/v Standard buffers for pH meter Bovine albumin or other available calibrator(fraction v powder) REAGENTS 1. Succinic acid solution 50 g/l: weigh out 1.0 g of Succinic acid, dissolve and make up to
about 20 ml with distilled water. Prepare as required, discard after use. 2. Sodium hydroxide solution 10 g/l: Weigh out 1.0 g of sodium hydroxide in a glass beaker,
dissolve and make up to 100 ml with distilled water. This solution is stable for several months at 20-25 C. Store in polypropylene bottle.
3. Brij-35 solution 250 g/l: Warm 25 g solid Brij-35 in a small volume of distilled water to dissolve and make up to 100 ml with distilled water or use the 30 % w/v Brij-35 solution.
4. Working dye solution: Dissolve 5.6 g of Succinic acid, 58 mg of Bromocresol green (Sodium salt) and 100 mg of sodium azide in about 900 ml of distilled water in a clean beaker. Add 1.0 g of sodium hydroxide and dissolve, and then add 2.5 ml of Brij-35
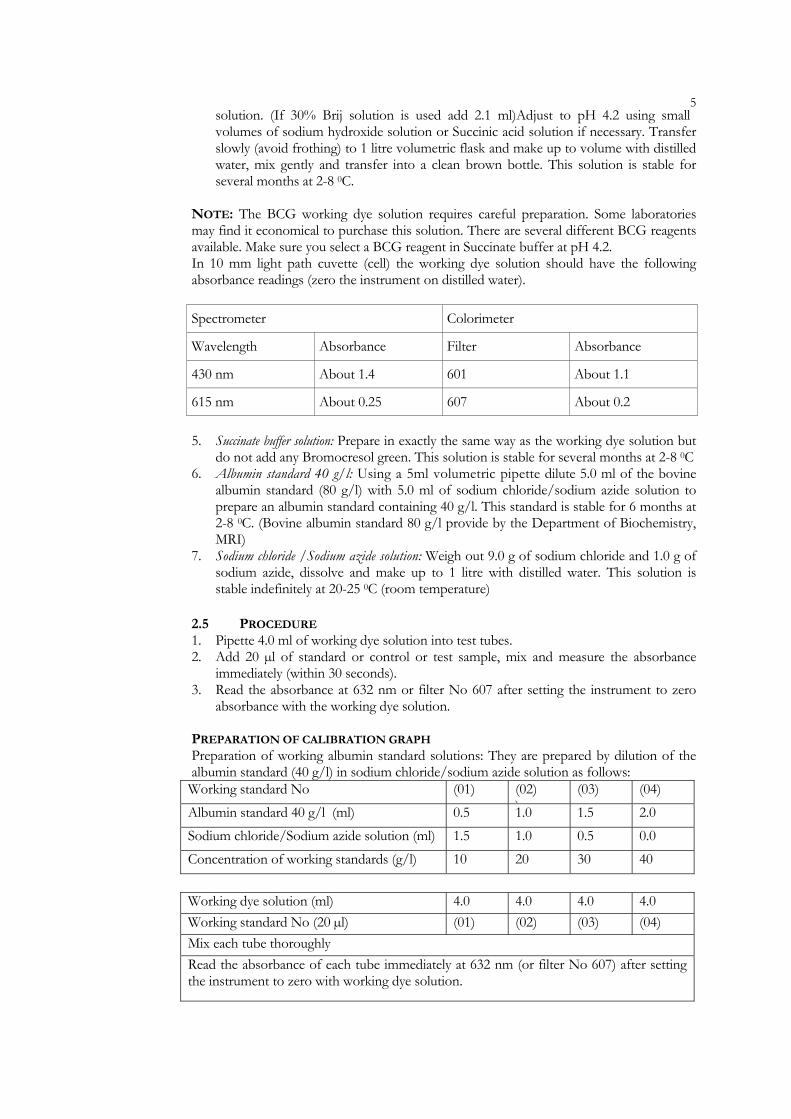
5solution. (If 30% Brij solution is used add 2.1 ml)Adjust to pH 4.2 using small volumes of sodium hydroxide solution or Succinic acid solution if necessary. Transfer slowly (avoid frothing) to 1 litre volumetric flask and make up to volume with distilled water, mix gently and transfer into a clean brown bottle. This solution is stable for several months at 2-8 0C.
NOTE: The BCG working dye solution requires careful preparation. Some laboratories may find it economical to purchase this solution. There are several different BCG reagents available. Make sure you select a BCG reagent in Succinate buffer at pH 4.2. In 10 mm light path cuvette (cell) the working dye solution should have the following absorbance readings (zero the instrument on distilled water). Spectrometer Colorimeter
Wavelength Absorbance Filter Absorbance
430 nm About 1.4 601 About 1.1
615 nm About 0.25 607 About 0.2 5. Succinate buffer solution: Prepare in exactly the same way as the working dye solution but
do not add any Bromocresol green. This solution is stable for several months at 2-8 0C 6. Albumin standard 40 g/l: Using a 5ml volumetric pipette dilute 5.0 ml of the bovine
albumin standard (80 g/l) with 5.0 ml of sodium chloride/sodium azide solution to prepare an albumin standard containing 40 g/l. This standard is stable for 6 months at 2-8 0C. (Bovine albumin standard 80 g/l provide by the Department of Biochemistry, MRI)
7. Sodium chloride /Sodium azide solution: Weigh out 9.0 g of sodium chloride and 1.0 g of sodium azide, dissolve and make up to 1 litre with distilled water. This solution is stable indefinitely at 20-25 0C (room temperature)
2.5 PROCEDURE 1. Pipette 4.0 ml of working dye solution into test tubes. 2. Add 20 µl of standard or control or test sample, mix and measure the absorbance
immediately (within 30 seconds). 3. Read the absorbance at 632 nm or filter No 607 after setting the instrument to zero
absorbance with the working dye solution. PREPARATION OF CALIBRATION GRAPH Preparation of working albumin standard solutions: They are prepared by dilution of the albumin standard (40 g/l) in sodium chloride/sodium azide solution as follows: Working standard No (01) (02)
)(03) (04)
Albumin standard 40 g/l (ml) 0.5 1.0 1.5 2.0 Sodium chloride/Sodium azide solution (ml) 1.5 1.0 0.5 0.0 Concentration of working standards (g/l) 10 20 30 40
Working dye solution (ml) 4.0 4.0 4.0 4.0 Working standard No (20 µl) (01) (02)
)(03) (04)
Mix each tube thoroughly Read the absorbance of each tube immediately at 632 nm (or filter No 607) after setting the instrument to zero with working dye solution.

6 Plot the absorbance of each tube against the concentrations of working standards solution on the graph. The calibration graph should be linear up to 40 g/l. If the graph is linear then a single standard (40g/l) may be used for routine analysis but linearity should be confirmed for each new batch of working dye solution and at least once a month. The recommended method proposes the use of a bovine albumin solution as a calibrator. Alternative commercial bovine albumin solutions are available.
2.6 CALCULATION Albumin concentration = T/S x 40 g/l
Where T=the absorbance of the test
S=the absorbance of the standard NOTE: Always include a standard (40 g/l) in each and every batch of samples.
QUALITY CONTROL OPTIMAL CONDITIONS VARIANCE : A coefficient of variation of around 3% should be attainable. ROUTINE CONDITIONS VARIANCE : The value obtained for the RCV should not exceed 6%
REFERENCE VALUES New born : 25-50 g/l 1 Year : 35-50 g/l 2-3 Year : 36-50 g/l 4th Year and after : 37-50 g/l Adult : 30-45 g/l
2.7 LIMITATIONS If a serum sample is extremely lipaemic a serum blank should be used. (Moderate lipaemia does not affect the results) The blank is prepared by adding 20 µl of sample to 4.0 ml of Succinate buffer solution. The absorbance of this blank, with distilled water as reference is subtracted from the test. Grossly haemolysed specimens are unsuitable for albumin determination.
REFERENCES Ann.clin.Biochem.14 (1977)105-115 Tietz text book of clinical chemistry

7 3. AMYLASE
3.1 INTRODUCTION Amylases are a group of hydrolases that split complex carbohydrates constituted of α-D-glucose units linked through carbon atoms 1 and 4 located on adjacent glucose residues. Both straight-chain (linear) polyglucans, such as amylose, and branched polyglucans, such as amylopectin and glycogen, are hydrolyzed, but at different rates. In the case of amylose, the enzyme splits the chains at alternate α-1, 4-hemiacetal (-C-O-C-) links, forming maltose and some residual glucose; maltose, glucose, and a residue of limit dextrins are formed if branched –chain polyglucans are used as substrate. The α-1, 6- linkages at the branch points are not attacked by the enzyme. Two types of amylases are recognized. Beta-amylase (e.g. plant and bacterial exoamylase) acts only at the terminal-reducing end of polyglucan chain; it splits off two glucose units (maltose) at a time. Animal amylases, including those present in human tissues, are α-amylases. They are also called endoamylases because they attack α-1, 4-linkages in a random manner anywhere along the polyglucan chain. Linear starch chains in helical form react with molecular iodine to form the well-known deep blue starch-iodine complex. The enzyme present in normal serum and urine is predominantly of pancreatic (p-type) and salivary gland (S-type) origin. These Isoenzymes are products of two closely linked loci on chromosomes1. Each gene is allelic; thus there are 12 distinct phenotypes for the salivary Isoenzyme and 6 for the pancreatic Isoenzyme.
3.2 CLINICAL SIGNIFICANCE Assays of Amylase activity in serum and urine are largely of use in the diagnosis of disease of the pancreas and in the investigations of pancreatic function in acute pancreatitis. A transient rise in serum amylase activity occurs in 2- 12 hours of onset; levels return to normal by the 3 rd or 4th day. A 4-6 fold elevation of amylase activity above reference limit is usually with maximum level attained in 12-72 hours. The magnitude of elevation of serum enzyme activity is not related to the severity of pancreas involvement. However the greater the rise, grater the probability of acute pancreatitis. A significant amount of serum amylase is excreted in urine and therefore elevation of serum activity is reflected in rise of urine amylase activity. Urine amylase as compared on serum amylase appears to be more frequently elevated, reaches higher level and pursuit for longer periods. In quiescent chronic pancreatitis both serum and urine activity are usually subnormal. Acute pancreatitis is sometimes difficult to diagnose because it must be differentiate from other acute intra abdominal disorders and because an increase serum amylase activity may not necessary due to acute pancreatitis.
3.3 PRINCIPLE OF THE METHOD In solution iodine reacts with starch to give an intense blue – violet complex. Amylase hydrolyses starch, forming maltose and other fragments which do not react with iodine. After incubation of serum with buffered starch solution, the amount of starch remaining is assayed by measuring the absorbance at 660 nm after the addition of iodine
3.4 SPECIMEN TYPE, COLLECTION AND STORAGE 3-5 ml clotted blood in a clean dry bottle, avoid haemolysis. Separate serum as early as possible. Enzyme activity loss is negligible in sterile serum store at 2-8 0C for a week (free of bacterial contamination).
3.5 APPARATUS AND CHEMICALS APPARATUS: Hot plate or Bunsen burner

8 Water bath at 37 0C pH meter Visible Spectrometer wavelength at 660nm or Colorimeter with red filter Ilford No: 608 (680 nm) GLASSWARE: Volumetric flasks (1litre volume) Automatic micro pipette 20 µl Graduated pipettes (1ml, 5ml, 10 ml and 0.1 ml) Beakers (50ml, 1 litre) Graduated cylinders (100 ml and 1 litre) Amber colour reagents bottles (100 ml and 1 litre)
CHEMICALS: Soluble starch pharmaceutical grade Potassium iodide AR Potassium iodate AR Disodium hydrogen ortho-phosphate (anhydrous) AR Sodium chloride AR Benzoic acid AR Hydrochloric acid (concentrated (37 % w/v) caution: highly corrosive) Buffers for pH meter
REAGENTS 1. Buffered starch substrate: Dissolve 26.6 g of anhydrous disodium hydrogen phosphate,
1.75 g of sodium chloride and 8.6 g of benzoic acid in about 500 ml of distilled water in a large beaker. Heat to boiling. In 50 ml of beaker, mix separately 0.4 g of soluble starch in 10 ml of cold distilled water to form a paste. Add the paste with stirring to the boiling mixture, rinsing the beaker with distilled water. Continue to boil for one minute. Cool to room temperature, and transfer to volumetric flask and dilute to 1 litre with distilled water. This solution is stable for at least one year at 20- 25 0C and should have a pH of 6.9-7.1; the stability is monitored by noting the absorbance of the reagent blank with each set of tests. We recommend that the solution is stored at 4-8 0C in the refrigerator. Aliquot the required amount for daily use. If 1 litre substrate is excess then prepare 500 ml for use.
2. Stock iodine solution 50 mmol/l: Dissolve 3.57 g of potassium iodate and 45 g of potassium iodide in about 800 ml of water in a volumetric flask. Slowly and with mixing add 9.0 ml of concentrated hydrochloric acid. Dilute to 1 litre with distilled water. This solution should be stored in a dark bottle and is stable for a year at 4 -8 0C.
3. Working iodine solution: Dilute 10 ml of stock iodine solution with 90 ml distilled water in a graduated 100 ml volumetric flask. This solution should be stored in a dark bottle and is stable for 2 months at 2-8 0C.
3.6 PROCEDURE 1. Pipette 1.0 ml of buffered starch substrate into 150 x 16 mm test tubes. You will need
1 tube for each patient and control sample and 1 tube for a reagent blank. 2. Place all of the tubes in a water bath at 37 0C for 5 minutes to warm the contents. 3. Pipette 20 µl of patient’s or control serum into the bottom of the test tubes, mix and
incubate at 37 0C for exactly 7 minutes and 30 seconds. (No serum is added to the reagent blank).
4. After 7 minutes and 30 seconds remove the test tubes from the water bath immediately add 1.0 ml of working iodine solution to each tube (samples and reagent blank) then add 8 ml of distilled water.
5. Mix the contents of each tube well then measure the absorbance without delay at 660 nm (red filter Ilford No. 608) setting the spectrometer to zero with distilled water.
NOTE: Avoid contamination of the pipette with saliva
3.7 CALCULATION Amylase activity U/L = B-T x 1470 B B = absorbance of reagent blank
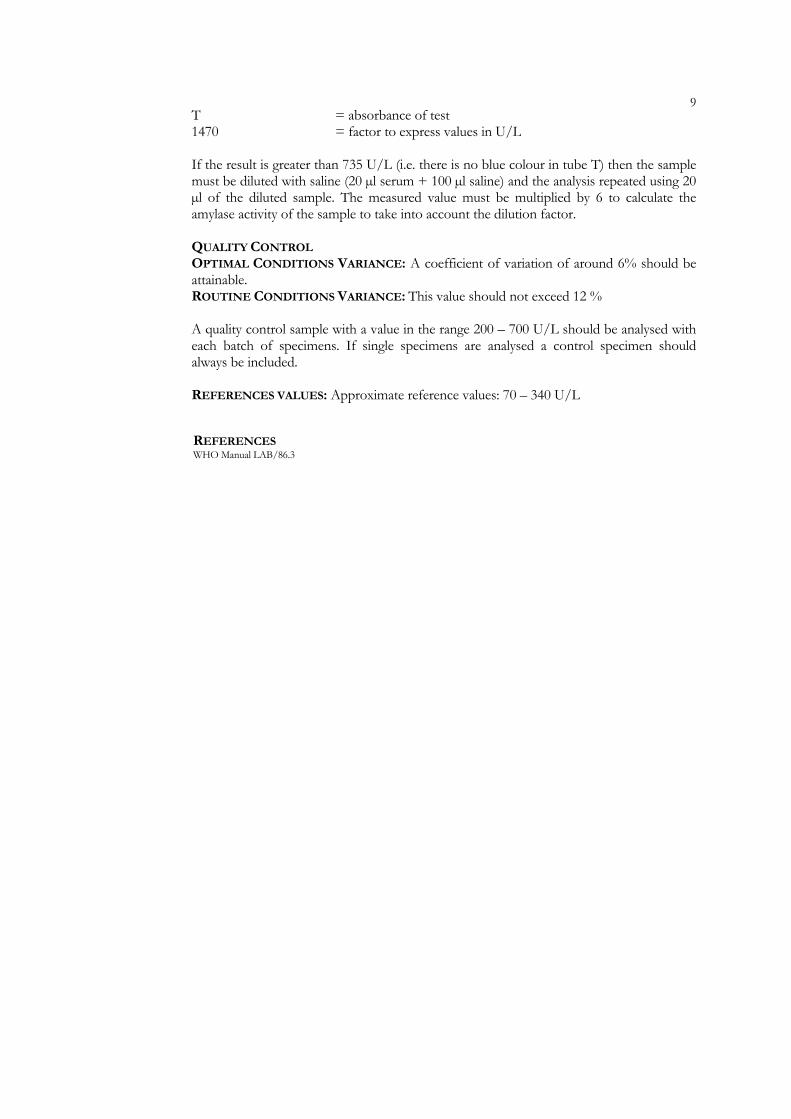
9T = absorbance of test 1470 = factor to express values in U/L If the result is greater than 735 U/L (i.e. there is no blue colour in tube T) then the sample must be diluted with saline (20 µl serum + 100 µl saline) and the analysis repeated using 20 µl of the diluted sample. The measured value must be multiplied by 6 to calculate the amylase activity of the sample to take into account the dilution factor. QUALITY CONTROL OPTIMAL CONDITIONS VARIANCE: A coefficient of variation of around 6% should be attainable. ROUTINE CONDITIONS VARIANCE: This value should not exceed 12 % A quality control sample with a value in the range 200 – 700 U/L should be analysed with each batch of specimens. If single specimens are analysed a control specimen should always be included. REFERENCES VALUES: Approximate reference values: 70 – 340 U/L
REFERENCES WHO Manual LAB/86.3

10 4. ALKALINE PHOSPHATASE
4.1 INTRODUCTION The alkaline phosphatases (ALP) are a group of glycoprotein enzymes that act as phosphotransferases by hydrolysing various types of monophosphate bond at alkaline pH. ALP activity is found in virtually all tissues, particularly bone, liver, kidney, intestine, adrenal, placenta. The protein moieties comprise about 510 amino acid residues, to which is attached various amounts of carbohydrate and sialic acid. Tissue-specific posttranslational modifications occur to the carbohydrate content, leading to the formation of isoforms, e.g. bone, liver and kidney ALP, each of which contains the same tissue non-specific protein. ALP is found attached to the outer lipid bilayer of cell membranes by a glycosyl-phosphatidylinositol group, in the case of liver ALP possibly as a tetramer of identical subunits; if released from cell membranes, ALP is dimeric. Liver ALP is located in the cell membranes of the hepatcoyte, and particularly in the outer layer of the cells adjacent to the bile canaliculi and also in the cells lining the sinusoids. Adult intestinal ALP lacks sialic acid and is found in the epithelial cells of the intestinal brush border. The placental enzyme is formed by the syncitiotrophoblast cells lining the microvilli that interface the placental and fetal blood circulations but the placental ALP does not cross into the fetal circulation.
4.2 CLINICAL SIGNIFICANCE Serum ALP measurements are of particular interest in the investigation of two groups of conditions: hepatobiliary and bone disease associated with increased osteoblastic activity. The response of the liver to any form of biliary tree obstruction is to synthesize more ALP. The main site of new enzyme synthesis is the hepatocytes adjacent to the biliary canaliculi. Some of the newly formed enzyme enters the circulation to raise the enzyme level in serum. The elevation tends to be more marked (more than three-fold) in extrahepatic obstruction (e.g. by stone or by cancer of the head of the pancreas) than in intrahepatic obstruction and is greater the more complete the obstruction. Serum enzyme activities may reach 10 to 12 times the upper limit of normal, returning to normal on surgical removal of the obstruction.
4.3 PRINCIPLE OF THE METHOD 4 - Nitophenylphosphate is hydrolysed by alkaline phosphatase at pH 10.3 at 37 C and 4 -Nitrophenol is liberated. Alkali is added to stop the enzyme activity at the end of the timed incubation period and the increase in absorbance due to the 4-Nitrophenol released is measured at 410 nm.
4.4 SPECIMEN TYPE, COLLECTION AND STORAGE Collect about 2-3 ml blood, separate serum as soon as possible, avoid haemolysis. Freshly collected serum sample should be kept at room temperature and assayed as soon as possible. If there is a delay in the assay store the serum at -20 C. Sample should be completely thawed before the assay. Refrigeration of the serum at 4 C will increase the ALP activity.
4.5 APPARATUS AND CHEMICALS APPARATUS: Water bath at 37 0C pH meter Spectrometer wavelength at 410 nm or Colorimeter with violet filter, Ilford 600 (410 nm)

11 GLASSWARE: Volumetric flasks (100 ml and 1 litre volumes) Beakers (1 litre) Measuring cylinders (100 ml and 1 litre) Test tubes (125 mm x 16 mm or 150 mm x 16 mm) Volumetric pipettes (5 ml in 0.1 ml) Polyethylene reagent bottles (1 litre) Amber colour bottles Graduated pipettes (1ml, 5ml, 10ml)
Automatic pipette (50µl and 100µl) CHEMICALS: All chemicals must be analar grade Standard buffer solutions for pH meter Hydrochloric acid (Concentrated (37% w/v); caution: highly corrosive) 2-Amino-2-methyl-1-propanol Magnesium chloride hexahydrate- Disodium 4 – Nitrophenyl phosphate hexahydrate Sodium hydroxide pellets 4 - Nitrophenol
REAGENTS 1. AMP Buffer pH 10.3: Dissolve 78.5 g of 2-amino-2-methyl-1-propanol (CH3)2 C (NH2)
CH2 OH in about 900 ml of distilled water. Adjust to pH 10.3 with concentrated hydrochloric acid (about 18 ml) and make up to 1 litre with distilled water. Store in an Amber colour reagent bottle. This solution is stable for 1 month at 20-25 0C. Suggestive procedure method done at MRI: Use the chemical with the specification 95 % (CH3)2 C(NH2) CH2OH with MW of 89.14 and specific gravity of 0.93 g/ml (BDH). Add 84.4 ml of the above liquid to 800 ml of distilled water.
2. Magnesium chloride solution 1.5mmol/l: Dissolve 300 mg of magnesium chloride hexahydrate in water and make up to 1 litre. This solution is stable indefinitely at 20 -250C. MgCl2.6H2O chemical and the solution (1.5mmol/l) is best stored in refrigerator.
3. Substrate solution 225 mmol/l in the magnesium chloride solution: Dissolve 83.5 mg of disodium 4 -Nitrophenyl phosphate hexahydrate (store the chemical in freezing compartment) in 1.0 ml of magnesium chloride solution as required. This solution is stable for one working day. It’s best to keep the solution in refrigerator since at room temperature colour development may occur.
4. Sodium hydroxide solution 250 mmol/l: Dissolve 10 g of sodium hydroxide in distilled water and make up to 1 litre. Store in a tightly Stopperd polyethylene bottle. This solution is stable indefinitely at 20-25 0C. We have observed that this solution is stable even at room temperature at 20-30 0C.
5. 4 – Nitrophenol stock solution 10.8 mmol/l: Weigh out 150 mg of 4 – Nitrophenol accurately in a beaker & transfer the chemical from beaker to a 100 ml volumetric flask using a funnel and wash any chemical remaining in the container into the volumetric flask with distilled water. Make up to the mark with distilled water. This solution is stable for about 6 months in an amber colour bottle at 4 0C.
6. 4 – Nitrophenol working solution 54 µmol/l: Pipette 0.5 ml of the 4 – Nitrophenol stock solution into a 100 ml volumetric flask, makes up to 100 ml with sodium hydroxide solution (250mmol/l) Prepare this solution freshly before use.
Note: The quality of the disodium 4 – Nitrophenyl phosphate should be checked to ensure that it does not contain excessive amounts of free 4 – Nitrophenol. Prepare sodium hydroxide solution (10mmol/l) by diluting 4.0 ml of sodium hydroxide solution (250mmol/l) to 100 ml with distilled water. Add 200 µl of substrate solution (reagent 3 above) to 3.8 ml of sodium hydroxide solution (10 mmol/l) Mix and measure the absorbance at 410 nm after setting the spectrometer to zero with sodium hydroxide solution (10 mmol/l). The quality of the substrate is satisfactory if its absorbance after dilution in sodium hydroxide solution is less than 0.25 (10 mm light path cuvette at room

12 temperature and 410 nm) In a colorimetric the absorbance should be less than 0.12 (10mm light path and Ilford filter No 600) This procedure should be carried out when a new batch of chemical/bottle is introduced to the bench.
4.6 PROCEDURE 1. Pipette 1.4 ml of AMP buffer into sufficient test tubes for patients’ samples, controls
and reagent blank and preincubate in the water bath at 37 0C for about 5 minutes. 2. To each tube add 50 µl of serum, to the blank; add 50 µl of distilled water .Mix well. 3. To each tube in sequence add 100 µl of substrate solution at timed intervals. Mix well. 4. Incubate for exactly 15 minutes at 37 0C then add 4.0 ml of sodium hydroxide solution
(250mmol/l) to each tube in sequence, maintaining timed intervals. Mix each tube and allow them to cool to room temperature.
5. Measure the absorbance of each test solution at 410 nm ( violet filter ,Ilford No :600) setting the spectrometer to zero with the blank
6. If the absorbance is greater than the absorbance of a 400 U/L standard, then repeat the procedures, but at step 4, incubate for exactly 5 minutes (instead of 15 minutes) then add 4.0 ml sodium hydroxide solution (250mmol/l) and complete the procedure described in steps 4 and 5. Do not forget to multiply the activity by 3 before reporting the result.
PREPARATION OF CALIBRATION GRAPH Tube No (1) (2) (3) (4) (5) (6)
4 – Nitrophenol solution 54 µmol/l (ml) 1 2 4 6 8 10 Sodium hydroxide 250 mmol/l (ml) 9 8 6 4 2 0 Activity (U/L) 40 80 160 240 320 400 Mix well and measure the absorbance of each tube at 410 nm (violet filter Ilford No 600) setting the spectrometer to zero with sodium hydroxide solution (250mmol/l) Plot the absorbance of each tube on the graph. Prepare a new calibration graph every 3 months.
4.7 CALCULATION Read off the activities of alkaline phosphatase in the unknown and control samples from the calibration graph. Remember to multiply by 3 if you used 5 minute incubation instead of 15 minutes incubation. QUALITY CONTROL At least two serum control specimens, having stated values in the range 20-350 U/L, one of which is unknown to the operator should be included with each batch of specimens. If single specimens are analysed a control specimen should always be included. OPTIMAL CONDITIONS VARIANCE: A coefficient of variation of around 10% should be ROUTINE CONDITIONS VARIANCE: The value should be less than 20%
APPROXIMATE REFERENCE VALUES
Males (age 20 -60 years) : 20- 90 U/L Females (age 15-60 years) : 20-90 U/L Children (age 1-12 years) : up to 350 U/L During the growth spurt of puberty: up to 500 U/L
REFERENCES LAB/86.3 A guide to diagnostic clinical chemistry By R.N. Walmsley and G.H. White -page 312 TIETZ TEXTBOOK OF Clinical chemistry page 831-832
13
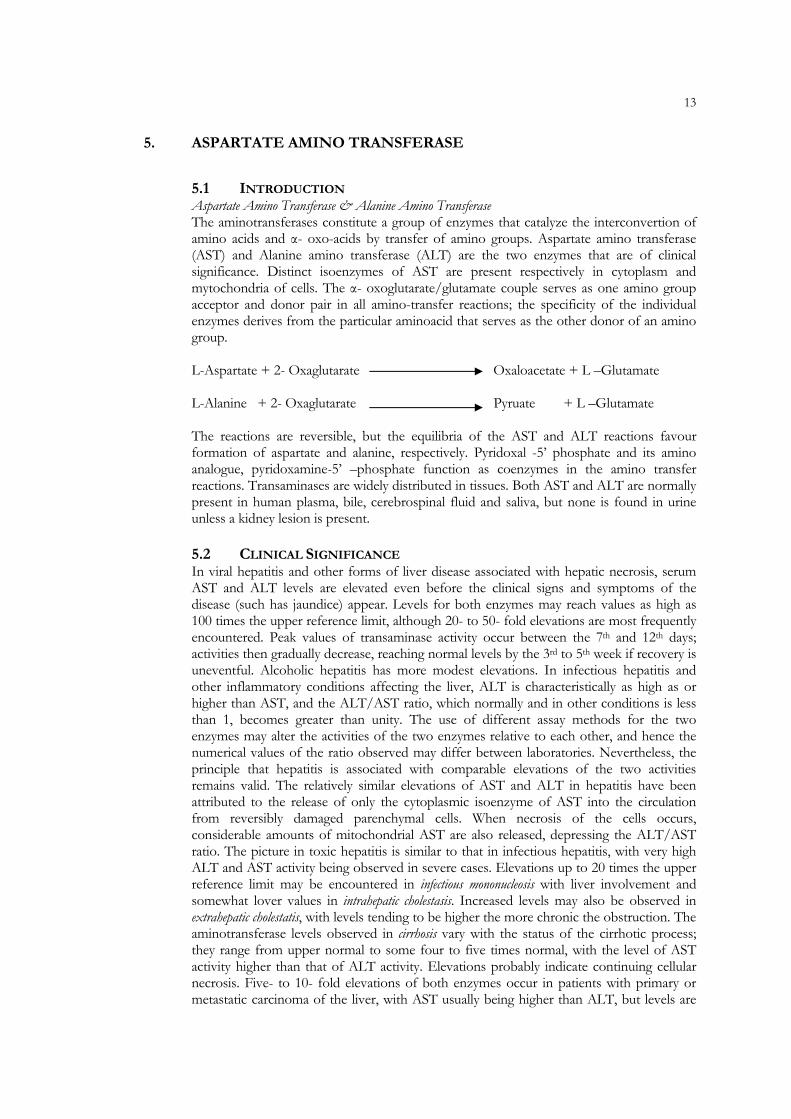
5. ASPARTATE AMINO TRANSFERASE
5.1 INTRODUCTION Aspartate Amino Transferase & Alanine Amino Transferase The aminotransferases constitute a group of enzymes that catalyze the interconvertion of amino acids and α- oxo-acids by transfer of amino groups. Aspartate amino transferase (AST) and Alanine amino transferase (ALT) are the two enzymes that are of clinical significance. Distinct isoenzymes of AST are present respectively in cytoplasm and mytochondria of cells. The α- oxoglutarate/glutamate couple serves as one amino group acceptor and donor pair in all amino-transfer reactions; the specificity of the individual enzymes derives from the particular aminoacid that serves as the other donor of an amino group. L-Aspartate + 2- Oxaglutarate Oxaloacetate + L –Glutamate
L-Alanine + 2- Oxaglutarate Pyruate + L –Glutamate
The reactions are reversible, but the equilibria of the AST and ALT reactions favour formation of aspartate and alanine, respectively. Pyridoxal -5’ phosphate and its amino analogue, pyridoxamine-5’ –phosphate function as coenzymes in the amino transfer reactions. Transaminases are widely distributed in tissues. Both AST and ALT are normally present in human plasma, bile, cerebrospinal fluid and saliva, but none is found in urine unless a kidney lesion is present.
5.2 CLINICAL SIGNIFICANCE In viral hepatitis and other forms of liver disease associated with hepatic necrosis, serum AST and ALT levels are elevated even before the clinical signs and symptoms of the disease (such has jaundice) appear. Levels for both enzymes may reach values as high as 100 times the upper reference limit, although 20- to 50- fold elevations are most frequently encountered. Peak values of transaminase activity occur between the 7th and 12th days; activities then gradually decrease, reaching normal levels by the 3rd to 5th week if recovery is uneventful. Alcoholic hepatitis has more modest elevations. In infectious hepatitis and other inflammatory conditions affecting the liver, ALT is characteristically as high as or higher than AST, and the ALT/AST ratio, which normally and in other conditions is less than 1, becomes greater than unity. The use of different assay methods for the two enzymes may alter the activities of the two enzymes relative to each other, and hence the numerical values of the ratio observed may differ between laboratories. Nevertheless, the principle that hepatitis is associated with comparable elevations of the two activities remains valid. The relatively similar elevations of AST and ALT in hepatitis have been attributed to the release of only the cytoplasmic isoenzyme of AST into the circulation from reversibly damaged parenchymal cells. When necrosis of the cells occurs, considerable amounts of mitochondrial AST are also released, depressing the ALT/AST ratio. The picture in toxic hepatitis is similar to that in infectious hepatitis, with very high ALT and AST activity being observed in severe cases. Elevations up to 20 times the upper reference limit may be encountered in infectious mononucleosis with liver involvement and somewhat lover values in intrahepatic cholestasis. Increased levels may also be observed in extrahepatic cholestatis, with levels tending to be higher the more chronic the obstruction. The aminotransferase levels observed in cirrhosis vary with the status of the cirrhotic process; they range from upper normal to some four to five times normal, with the level of AST activity higher than that of ALT activity. Elevations probably indicate continuing cellular necrosis. Five- to 10- fold elevations of both enzymes occur in patients with primary or metastatic carcinoma of the liver, with AST usually being higher than ALT, but levels are

14 often normal in the early stages of malignant infiltration of the liver. Slight or moderate elevations of both AST and ALT activities may be observed after the intake of alcohol, in delirium tremens, and after administration of various drugs, such as opiates, salicylates, or ampicillin. Although serum levels of both AST and ALT become elevated whenever disease processes affect liver cell integrity. ALT is the more liver-specific enzyme. Serum elevations of ALT activity are rarely observed in conditions other than parenchymal liver disease. Moreover, elevations of ALT activity persist longer than do those of AST activity. Measurement of both AST and ALT has some value in distinguishing hepatitis from other parenchymal lesions. After myocardial infarction, increased AST activity appears in serum, as might be expected from the relatively high AST concentration in heart muscle. On average, serum levels do not become abnormal, however, until 6 to 8 h has elapsed after the onset of the chest pain. Abnormal AST levels are observed in more than 97% of cases of myocardial infarction when correctly timed blood specimens are analyzed. Peak values of AST activity are reached after 18 to 24 h, and the activity values fall within the normal range by the fourth of fifth day, provided no new infarct has occurred. The peak values of AST activity are roughly proportional to the extent of cardiac damage. Average increases are of the order of four to five times the upper limit of normal; levels of 10 to 15 times normal are frequently associated with fatal infarct. However, small elevations in serum levels do not necessarily indicate a favorable prognosis. ALT levels are within normal limits or are only marginally increased in uncomplicated myocardial infraction, because the concentration of ALT activity in heart muscle is only a fraction of that of AST activity. AST (and occasionally ALT) activity levels are increase in progressive muscular dystrophy and dermatonyositis, reaching levels up to 8 times normal; they are usually normal in other types of muscle diseases, especially in those of neurogenic origin. Pulmonary emboli can raise AST levels to two to thee times normal, and slight to moderate elevations (two to five times normal) are noted in acute pancreatitis, crushed muscle injuries, gangrene, and hemolytic disease.
5.3 PRINCIPLE OF THE METHOD Aspartate aminotransferase (AST or SGOT) effects the conversion of alpha keto - glutarate and Aspartate to glutamate and oxaloacetate respectively, by amino group transfer. The oxaloacetate thus formed is coupled with 2, 4 - dinitrophenylhydrazine to produce a coloured complex whose absorbance in alkaline solution is measured at 505 nm
5.4 SPECIMEN TYPE, COLLECTION AND STORAGE 3-5 ml clotted blood, avoid haemolysis. Separate serum as soon as possible and performed the assay or keep in the refrigerator, it is stable up to 24 hours at 4 C. Minimal loss of activity occurs at 0-4 0C over 1-3 days. Specimen is best stored frozen if they are to be kept more than 3-4 days
5.5 APPARATUS AND CHEMICALS APPARATUS: Water bath at 37 0C
pH meter Visible spectrometer wavelength at 505 nm or Colorimeter with green filter Ilford No 604 (520 nm)

15 GLASSWARE: Volumetric flasks (100 ml and 1 litre volumes) Measuring cylinders (1 litre) Automatic micro pipette (100 µl) Graduated pipettes (1ml, 2 ml, 5ml, 10 ml in 0.1 ml) Test tubes (150 x16 mm), Beakers (5ml, 10ml, 100ml and 1 litre) Reagents bottles clear and amber coloured (250 ml and 1 litre) Polypropylene bottle CHEMICALS: Disodium hydrogen ortho-phosphate-anhydrous, analytical grade Potassium dihydrogen phosphate-anhydrous, analytical grade Alpha – ketoglutaric acid -analar DL- aspartic acid -analar, Sodium hydroxide pellets analar 2, 4- dinitrophenylhydrazine-AR; caution: may explode violently when dry, Hydrochloric acid concentrated-AR (37% w/v), caution: highly corrosive Sodium pyruvate (analytical grade) REAGENTS 1. Phosphate buffer pH 7.4: Dissolve 11.9 g of disodium hydrogen phosphate (anhydrous)
and 2.2 g of potassium dihydrogen phosphate (anhydrous) in distilled water and make up to 1 litre. Check the pH adjust to pH 7.4 if necessary using small amounts of the appropriate phosphate (e.g. if the pH is more than 7.4 add potassium dihydrogen phosphate). This solution is stable for about 2 months at 2-8 0C.
2. Sodium hydroxide solution 1 mol/l: Weigh 40 g of sodium hydroxide in beaker, slowly dissolve in distilled water, transfer into a volumetric flask and make up to 1 litre. Store in a tightly Stopperd polypropylene bottle. This solution is stable indefinitely at 20 - 250C, which can be achieved by air condition system. However we have observed that this solution is stable in our room temperature (20-30 0C) for about 2 months.
3. Buffered substrate reagent: Weigh 29.2 mg of alpha- ketoglutaric acid 2.66 g of DL-aspartic acid into a small beaker. Dissolve in 20 ml of sodium hydroxide solution (1 mol/l) then adjust to pH 7.4 with more sodium hydroxide solution. Transfer to a 100 ml volumetric flask and make up to 100 ml with phosphate buffer and mix well. Store the reagent frozen in screw capped bottles; the volume should be the amount need for a day analysis.
4. Hydrochloric acid 1 mol/l: Dilute 9 ml of hydrochloric acid (concentrated (37% w/v)) to 100 ml with distilled water.
5. Colour reagent 2,4 –dinitrophenylhydrazine 1 mmol/l: Dissolve the equivalent of 19.8 mg of dry 2,4-dinitrophenylhydrazine in 100 ml of hydrochloric acid ( 1mol/l)and transfer into a amber colour bottle; Note that the weight of 2, 4 – dinitrophenylehydrazine must be adjusted to take into account the water content. e.g. If the label reads as 33% by weight of water is added to ensure safety in transit the calculation is as follows.100/67 x 19.8 = 29.55 mg. The prepared solution is stable for 2 months at 2 - 8 0C.
6. Sodium hydroxide solution 400 mmol/l: Dissolve 16.0 g of sodium hydroxide in distilled water in a beaker and make up to 1 litre. Store in a tightly stoppered polypropylene reagent bottle. This solution is stable indefinitely at 20- 25 0C. We have observed that this solution is stable at our room temperature at 20-30 0 C for 2 months.
7. Pyruvate standard solution 4 mmol/l: Weigh out 44 mg of sodium pyruvate in a beaker, transfer into a 100 ml volumetric flask and make up to the mark with phosphate buffer. Mix well, divide into small portions (about 1ml) and store in the freezer compartment of the refrigerator. The standard solution is stable for 6 months in the freezer.
16 5.6 PROCEDURE 1. Two test tubes are required for each serum or control sample( one for the “Test” and
one for a sample blank) one for a reagent blank and one for the standard 2. Transfer 0.5 ml buffered substrate to each tube and pre-incubate in the water bath (37 0 C) for 5 minutes 3. Add 100 µl of patient’s or control serum to the “Test” tubes or 100 µl distilled
water(reagent blank) or 100 µl pyruvate standard (standard) mix and incubate at 37 0C. 4. After exactly 60 minutes add 0.5 ml colour reagent to each tube, mix and remove from
the water bath. 5. Add 100 µl of patient’s or control serum to the sample blank tubes and mix well. 6. Leave for 20 minutes at room temperature and then add 5.0 ml of sodium hydroxide
solution (400mmol/l) and mix thoroughly. 7. Leave the tubes at room temperature for at least 5 minutes, but not longer than 30
minutes, and then read the absorbance at 505 nm. Set the spectrometer to zero with the reagent blank.
CALIBRATION In this method the amount of pyruvate formed is calculated by comparing the absorbance of the samples (Test- Blank absorbance) with that of the pyruvate standard (4mmol/l). However alpha - ketoglutarate also contributes to the absorbance and the change in absorbance is not linearly related to enzyme activity expressed in U/L. The table must therefore be used to convert the amount of pyruvate formed into U/L.
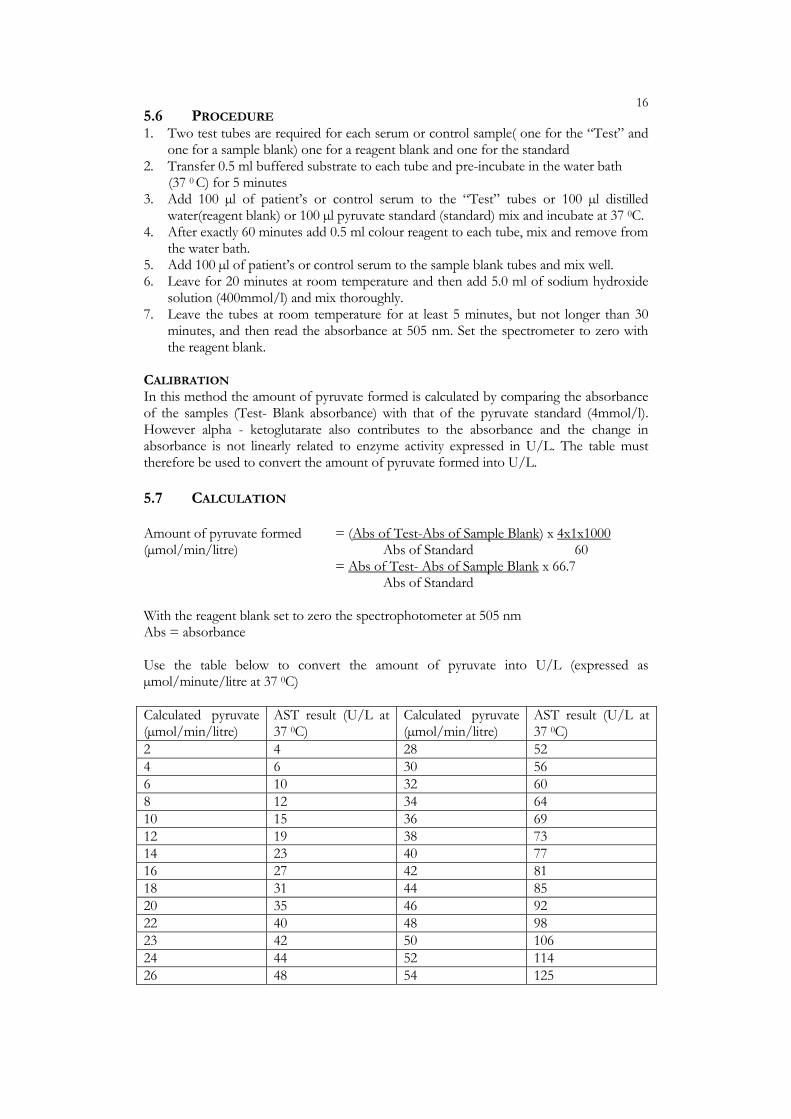
5.7 CALCULATION Amount of pyruvate formed = (Abs of Test-Abs of Sample Blank) x 4x1x1000(µmol/min/litre) Abs of Standard 60 = Abs of Test- Abs of Sample Blank x 66.7 Abs of Standard With the reagent blank set to zero the spectrophotometer at 505 nm Abs = absorbance Use the table below to convert the amount of pyruvate into U/L (expressed as µmol/minute/litre at 37 0C) Calculated pyruvate (µmol/min/litre)
AST result (U/L at 37 0C)
Calculated pyruvate (µmol/min/litre)
AST result (U/L at 37 0C)
2 4 28 52 4 6 30 56 6 10 32 60 8 12 34 64 10 15 36 69 12 19 38 73 14 23 40 77 16 27 42 81 18 31 44 85 20 35 46 92 22 40 48 98 23 42 50 106 24 44 52 114 26 48 54 125
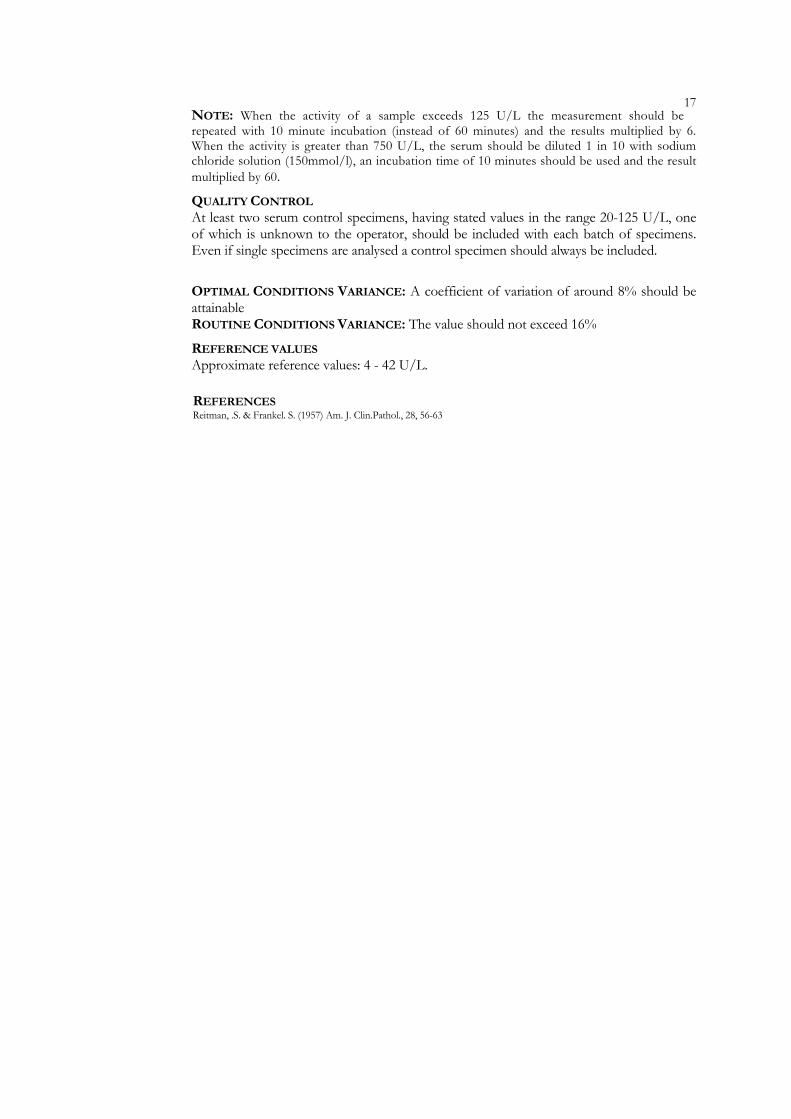
17NOTE: When the activity of a sample exceeds 125 U/L the measurement should be repeated with 10 minute incubation (instead of 60 minutes) and the results multiplied by 6. When the activity is greater than 750 U/L, the serum should be diluted 1 in 10 with sodium chloride solution (150mmol/l), an incubation time of 10 minutes should be used and the result multiplied by 60.
QUALITY CONTROL At least two serum control specimens, having stated values in the range 20-125 U/L, one of which is unknown to the operator, should be included with each batch of specimens. Even if single specimens are analysed a control specimen should always be included.
OPTIMAL CONDITIONS VARIANCE: A coefficient of variation of around 8% should be attainable ROUTINE CONDITIONS VARIANCE: The value should not exceed 16%
REFERENCE VALUES Approximate reference values: 4 - 42 U/L.
REFERENCES
Reitman, .S. & Frankel. S. (1957) Am. J. Clin.Pathol., 28, 56-63

18
6. ALANINE AMINOTRANSFERASE
6.1 PRINCIPLE OF THE METHOD Alanine aminotransferase (ALT or SGPT) effects the conversion of alpha-ketoglutarate and Alanine to pyruvate. Pyruvate formed is coupled with 2, 4-dinitrophenylhydrazine to produce a coloured complex. The absorbance in alkaline solution is measured at 505 nm.
6.2 SPECIMEN TYPE, COLLECTION AND STORAGE 3-5 ml clotted blood, avoid haemolysis. Separate serum as soon as possible and performed the assay or keep in the refrigerator, it is stable up to 24 hours at 4 0C. Minimal loss of activity occurs at 0-4 0C over 1-3 days. Specimen is best stored frozen if they are to be kept more than 3-4 days
6.3 APPARATUS AND CHEMICALS APPARATUS: Water bath at 37 0C pH meter Visible spectrometer wavelength at 505 nm or Colorimeter with green filter Ilford No 604 (520 nm) GLASSWARE: Volumetric flasks (100 ml and 1 litre volumes) Automatic micro pipette (100 µl) Graduated pipettes (1ml, 2ml, 5ml and 10 ml in 0.1 ml) Test tubes (150 x16 mm), Beakers (5ml, 50ml, 100ml and 1 litre) Reagents bottles amber coloured (250 ml and 1 litre)
Polypropylene bottle CHEMICALS: Disodium hydrogen phosphate-Anhydrous analytical grade Potassium dihydrogen phosphate-Anhydrous analytical grade Alpha ketoglutaric acid AR DL Alanine AR Sodium hydroxide pellets analytical grade 2, 4-dinitrophenyl hydrazine AR Hydrochloric acid AR Sodium pyruvate analytical grade REAGENTS 1. Phosphate buffer pH 7.4: Dissolve 11.9 g of disodium hydrogen phosphate (anhydrous)
and 2.2 g of potassium dihydrogen phosphate (anhydrous) in distilled water and make up to 1 litre. Check the p H and adjust to pH 7.4 if necessary using small amounts of the appropriate phosphate (e.g. if the pH is more than 7.4 add potassium dihydrogen phosphate). This solution is stable for about 2 months at 2-8 0C.
2. Sodium hydroxide solution 1 mol/l: Slowly dissolve 40.0 g of sodium hydroxide in distilled water in a beaker and make up to 1 litre. Store in a tightly stopperd reagent bottle. This solution is stable indefinitely at 20-25 0C. we have observed this solution is even stable at our room temperature 20-30 0C
3. Buffered substrate reagent: Weigh out 3.56 g of DL Alanine in a beaker and weigh 30 mg of alpha ketoglutaric acid accurately in another small beaker. Transfer it to same beaker by dissolving in the phosphate buffer. Add 0.5 ml of sodium hydroxide (1mol/l) solution. Check the pH. The pH should be at 7.4.Make up to 100 ml with phosphate buffer and mix. Divide the prepared substrate into small volumes and store

19in the freezing compartment or in the freezer. Discard the remaining substrate after use. Do not freeze the remaining substrate again.
4. Hydrochloric acid 1 mol/l: Dilute 9 ml of hydrochloric acid (concentrated (37% w/v)) to 100 ml with distilled water.
5. Colour reagent 2,4 –dinitrophenylhydrazine 1 mmol/l: Dissolve the equivalent of 19.8 mg of dry 2,4-dinitrophenylhydrazine in 100 ml of hydrochloric acid ( 1mol/l); Note that the weight of 2, 4 – dinitrophenylehydrazine must be adjusted to take into account the water content. e.g. If the label reads as 33% by weight of water is added to ensure safety in transit the calculation is as follows.100/67 x 19.8 = 29.55 mg. The prepared solution is stable for 2 months at 2-8 0C.
6. Sodium hydroxide solution 400 mmol/l: Dissolve 16.0 g of sodium hydroxide in distilled water in a beaker and make up to 1 litre. Store in a tightly stoppered polypropylene reagent bottle. This solution is stable indefinitely at 20- 25 0C. We have observed that this solution is stable at our room temperature (20-30 0C) for 2 months.
7. Pyruvate standard solution 4 mmol/l: Weigh out 44 mg of sodium pyruvate in a beaker, transfer into 100 ml volumetric flask and make up to the mark with phosphate buffer. Mix well, divide into small portions (about 1ml) and store in the freezer compartment of the refrigerator. The standard solution is stable for 6 months in the freezer.
6.4 PROCEDURE 1. Two test tubes are required for each serum or control sample( one for the “Test” and
one for a sample blank) one for a reagent blank and one for the standard 2. Transfer 0.5 ml buffered substrate to each tube and pre-incubate in the water bath (37
0C) for 5 minutes 3. Add 100 µl of patient’s or control serum to the “Test” tubes or 100 µl water(reagent
blank) or 100 µl pyruvate standard (standard) mix and incubate at 37 0C 4. After exactly 30 minutes add 0.5 ml colour reagent to each tube, mix and remove from
the water bath. 5. Add 100 µl of patient’s or control serum to the sample blank tubes. 6. Leave for 20 minutes at room temperature and then add 5.0 ml of sodium hydroxide
solution (400mmol/l) and mix thoroughly. 7. Leave the tubes at room temperature for at least 5 minutes, but not longer than 30
minutes, and then read the absorbance at 505 nm. Set the spectrometer to zero with the reagent blank.
PREPARATION OF CALIBRATION GRAPH In this method the amount of pyruvate formed is calculated by comparing the absorbance of the samples (Test- Blank absorbance) with that of the pyruvate standard (4mmol/l). However alpha - ketoglutarate also contributes to the absorbance and the change in absorbance is not linearly related to enzyme activity expressed in U/L. The table must therefore be used to convert the amount of pyruvate formed into U/L.
6.5 CALCULATION Amount of pyruvate formed = (Abs of Test-Abs of Sample Blank) x 4x1x1000(µmol/min/litre) Abs of Standard 30
= Abs of Test- Abs of Sample Blank x 133 Abs of Standard With the reagent blank set to zero the spectrophotometer at 505 nm Abs=absorbance
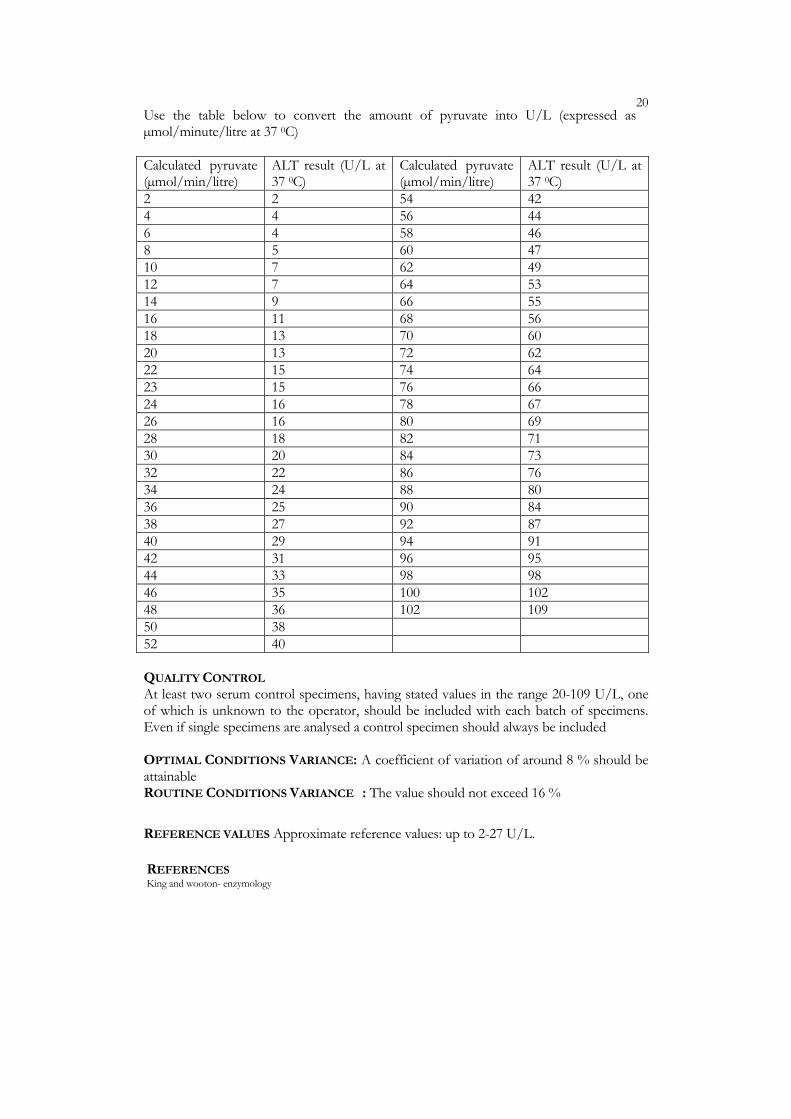
20 Use the table below to convert the amount of pyruvate into U/L (expressed as µmol/minute/litre at 37 0C)
Calculated pyruvate (µmol/min/litre)
ALT result (U/L at 37 0C)
Calculated pyruvate (µmol/min/litre)
ALT result (U/L at 37 0C)
2 2 54 42 4 4 56 44 6 4 58 46 8 5 60 47 10 7 62 49 12 7 64 53 14 9 66 55 16 11 68 56 18 13 70 60 20 13 72 62 22 15 74 64 23 15 76 66 24 16 78 67 26 16 80 69 28 18 82 71 30 20 84 73 32 22 86 76 34 24 88 80 36 25 90 84 38 27 92 87 40 29 94 91 42 31 96 95 44 33 98 98 46 35 100 102 48 36 102 109 50 38 52 40 QUALITY CONTROL At least two serum control specimens, having stated values in the range 20-109 U/L, one of which is unknown to the operator, should be included with each batch of specimens. Even if single specimens are analysed a control specimen should always be included OPTIMAL CONDITIONS VARIANCE: A coefficient of variation of around 8 % should be attainable ROUTINE CONDITIONS VARIANCE : The value should not exceed 16 %
REFERENCE VALUES Approximate reference values: up to 2-27 U/L.
REFERENCES
King and wooton- enzymology

217. BILIRUBIN
7.1 INTRODUCTION Haem, released from aged red cells and maturing cells during erythropoiesis, or from degraded haemoproteins is converted to biliverdin in the reticuloendothelial system. Biliverdin is reduced to bilirubin which is secreted into the plasma where it is transported to the liver reversibly bound to albumin. The hepatocytes take the bilirubin up from the plasma, conjugate it to glucuronic acid and excrete it in the bile. There are six steps in this process namely; production, transport to the liver, hepatocyte uptake, conjugation, biliary secretion, gut degradation and excretion. The total bilirubin produced is around 250-350 mg/day (4 – 6 mmol/day). 15% to 20% is derived from immature red cell and haemoproteins (early labelled fraction) whilst the remainder comes from senescent red cells ( 1g of haemoglobin produces 620µmol of bilirubin ) Haem is converted to bilirubin in the reticuloendothelial system by two enzymes, haem oxygenase and biliverdin reductase. Haem oxygenase breakes the alpha – CH bridge of protoporphyrin IX to produce biliverdin IX alpha, which is then reduced to bilirubin IX alpha by biliverdin reductase. Some cleavage occurs at the ß, gamma and delta bridges, but insignificant amounts of these isomers are produced. Although bilirubin IX alpha has two polar propionic acid side chains it is poorly soluble in water because of intramolecular hydrogen bonding between the propionic acid residues and other parts of the molecule. This bonding may also account for the necessity for conjugation with glucuronic acid prior to biliary excretion. Bilirubin is transported to the liver reversibly bound to albumin. This protein has one high – affinity binding site and an additional low – affinity site which is activated at high concentrations of bilirubin. The amount of unbound bilirubin is low, =4 nmol/l at a total plasma concentration of 20 µmol/L. Compounds such as free fatty acids, sulphonamides, salicylate and ampicillin will displace bilirubin from its binding sites. This species of bilirubin is called unconjugated bilirubin or indirect reacting bilirubin. The bilirubin – albumin complex dissociates in the liver and the bilirubin is transported across the hepatocyte membrane into the cell where it is reversibly bound to cytosolic proteins; one such protein being ligandin. The function of these proteins appears to be prevention of efflux of bilirubin from the cell. Bilirubin is conjugated in the endoplasmic reticulum with glucuronic acid and to a lesser extent with glucose and xylose. The enzyme responsible is UDP – glucuronosyltransferase which esterifies one or both propionic acid side chains to produce di – and monoglucuronides. In man the product is predominantly bilirubin diglucuronide with lesser amounts of the monoglucuronide. The bilirubin conjugates are secreted into the biliary passages by an activ eprocess which is yet to be clarified. This transport mechanism differs from that responsible for the biliary excretion of bile acids. In the gut the bacterial flora reduce the bilirubin conjugates to urobilinogens which are excreted in the faeces as such. Some of the urobilinogens are reabsorbed from the gut to be re – excreted by the liver ( enterohepatic circulation ) ; as these compounds are water soluble they will also be excreted by the kidney, but this is an unimportant excretory route. Two points worthy of note are; conjugated bilirubin is more prone to reductive processes than unconjugated bilirubin. Unconjugated bilirubin can be reabsorbed from the gut. Thus, if bacterial flora are absent ( eg: neonate, antibiotic therapy ) deconjugation of bilirubin glucuronides by intestinal mucosal ß – glucuronidase may occur and reabsorption of the unconjugated compound result in an increase in the plasma unconjugated bilirubin level. The total plasma bilirubin concentration in the normal subject is usually less than 20 µmol/L. The clinical sign of jaundice appears when the plasma total bilirubin rises beyond 40 µmol/L. When normal plasma is evaluated by high performance liquid chromatography techniques four bilirubin fractions alpha, beta, gamma and delta are obtained.
22 Alpha fraction This fraction is unconjugated bilirubin which is water insoluble and bound to albumin. It is also called indirect reacting bilirubin because the diazo reaction used to measure the plasma level occurs only after the addition of accelerators. It is the major bilirubin fraction in normal plasma (> 90%). It does not appear in the urine because of its attachment to albumin and can only be cleared by the liver. Beta and gamma fractions The beta fraction is composed of bilirubin monoglucuronide whilst diglucuronide constitutes the gamma fraction. These bilirubins (< 10% in normal plasma) are water soluble and will appear in the urine if present in the blood in excess. They are called direct reacting bilirubins as they react with the diazo reagent without the addition of accelerations. Delta fraction The delta fraction, usually referred to as ‘delta’ bilirubin – not to be confused with bilirubin IX delta –is an interesting compound with the following characteristics:
− it is direct reacting − it is tightly bound to albumin − its plasma level is increased in diseases associated with high plasma levels of
conjugated Bilirubin It appears to be derived from conjugated Bilirubin as it can be produced by incubating Bilirubin glucuronides with plasma albumin. It is thought that the Bilirubin migrates from the glucuronic acid residues and becomes covelantly bound to albumin. As noted above this fraction increases in conditions associated with chronic conjugated hyperbilirubinaemia (eg: cholestasis) and, as it is tightly bound to albumin, it has a t1/2 comparable to that of protein (=20 days) .Thus, after formation delta Bilirubin ‘hangs around ‘as it is not cleared by the liver or the kidney. The bile pigments that may be found in the urine are Urobilinogen and conjugated Bilirubin. Unconjugated Bilirubin is water insoluble and bound to albumin, and is thus not available for urinary excretion. The normal subject excretes 1 – 4 mg (2 – 7 µmol) of Urobilinogen daily (derived from the enterohepatic circulation) Increased values occur in liver disease (inability to excrete the small amounts reabsorbed from the gut) and in haemolytic disease (increased Bilirubin production). Decreased excretion occurs in bile duct obstruction. (cholestasis) Bilirubin appears in the urine when the plasma level of conjugated Bilirubin rises as in hepatocellular disease and cholestasis.
7.2 CLINICAL SIGNIFICANCE The earliest clinical manifestation of hepatobiliary disease is often jaundice, but jaundice need not necessarily indicate liver pathology (eg: haemolysis) and liver pathology can present without jaundice (e.g.: space-occupying lesions). However, it is convenient to classify liver disease in terms of jaundice and to this end it is helpful to divide hyperbilirubinaemia into three categories: Prehepatic: liver disease not present, Hepatic: hepatocellular disease, Post hepatic: cholestasis (obstruction)
7.3 PRINCIPLE OF THE METHOD Sulfanilic acid is diazotized by the nitrous acid produced from the reaction between sodium nitrite and hydrochloric acid. Both conjugated and unconjugated Bilirubin reacts with diazotized sulfanilic acid (Diazo reagent) to produce azobilirubin. Caffeine is an accelerator by splitting the unconjugated Bilirubin protein complex and gives a rapid and complete conversion to azobilirubin. The pink acid azobilirubin is converted to blue azobilirubin by an alkaline tartrate reagent and the absorbance of the blue green solution is measured at 600 nm. Measurement of the azobilirubin in an alkaline medium removes turbidity and increases specificity. There is very little interference by other pigments at 600

23nm wavelength. Conjugated Bilirubin is determined by diazotization at an acidic pH, only the conjugated forms of Bilirubin react with the diazo reagent in the absence of the accelerator caffeine benzoate. The reaction is stopped by the addition of ascorbic acid minimizes the effect of haemolysis.
7.4 SPECIMEN TYPE, COLLECTION AND STORAGE Clear non haemolysed serum or collect 3-5 ml of blood in a clear dry container. A fasting specimen is preferred to avoid lipaemia. Haemolysis should be avoided because it produces falsely low values. Specimens should be protected from direct exposure to either artificial light or sunlight as soon as they drawn because conjugated and unconjugated Bilirubin is photosensitive. The sensitivity to light is temperature dependent for optimal stability. Serum separation should be done as early as possible and assay should be carried out within 2 hours of sample collection if not storing the serum in the dark and at low temperature (2-8 0C) is essential.
APPARATUS AND CHEMICALS APPARATUS: Spectrophotometer, wavelength at 600 nm or Colorimeter, orange filter, Ilford 607 GLASSWARE: Volumetric flasks (100 ml, 500 ml and 1 litre volumes) Beakers (5ml, 100 ml and 1 litre) Automatic micro pipettes (50 and 100 µl) Graduated pipettes (1ml and 10 ml in 0.1 ml) Test tubes (100 x 13mm) & Rubber bulb Reagent bottle, clear and amber coloured CHEMICALS: (ANALYTICAL GRADE) Bilirubin powder (or commercial Bilirubin standards) Caffeine Sodium benzoate Sodium acetate trihydrate Sulphanilic acid Hydrochloric acid, concentrated (37% w/v) caution: highly corrosive Sodium nitirite Sodium hydroxide pellets Potassium sodium tartrate tetra hydrate Ethylenediamine tetra – acetic acid disodium salt dehydrate Ascorbic acid Sodium carbonate anhydrous REAGENTS 1. Caffeine- benzoate reagent: Dissolve 93 g of sodium acetate trihydrate, 56 g of sodium
benzoate and 1 g of disodium EDTA in approximately 500ml of distilled water. Add 38 g of caffeine. Dissolve and dilute to 1 litre in a volumetric flask. Mix well and filter. This solution is stable for at least 6 months at 20-25 0C (Room temperature)
2. Sulfaninlic acid reagent: Add 2.5 g of sulfanilic acid to about 200 ml of distilled water in a 500 ml volumetric flask. Using a rubber bulb carefully pipette 7.5 ml of concentrated hydrochloric acid into the flask. Dissolve and make up to 500 ml. This solution is stable for up to 6 months at 20-25 0C (Room temperature)
3. Sodium nitrite solution: Dissolve 500 mg of sodium nitrite in distilled water and make up to 100 ml. This solution should be stored at 2-8 0C in an amber coloured bottle and must be renewed every month. Prepare about 25ml or 50 ml.
4. Diazo reagent: Mix 4 ml of sulfanilic acid reagent with 0.1 ml of sodium nitrite solution, leave for 2 minutes, then use within 5 hours. Keep at 2-8 0C in an amber coloured bottle.

24 5. Alkaline tartrate reagent: Dissolve 75 g of sodium hydroxide and 350 g of potassium
sodium tartrate in about 800 ml of distilled water. Transfer to a volumetric flask and make up to 1 litre. This reagent is stable for at least 6 months at 20- 25 0C. Store in a polypropylene bottle.
6. Hydrochloric acid 50 mmol/l: Using a rubber bulb, carefully pipette 4.2 ml of hydrochloric acid (concentrated) and dilute to 1 litre with distilled water, require only for conjugated Bilirubin method.
7. Ascorbic acid 40 g/l: Dissolve 0.2 g in 5 ml of water, this solution must be prepared daily. Required only for the conjugated Bilirubin method.
8. Sodium carbonate 100mmol/l: Weigh out 1.06 g of sodium carbonate anhydrous very accurately and transfer quantitatively to a 100 ml volumetric flask, containing about 50 ml distilled water. Mix well and make up to 100 ml with distilled water.(Prepare about 50 ml for use)
9. Sodium hydroxide 100 mmol/l: Weigh out rapidly 2.0 g of sodium hydroxide in a beaker, dissolve and make up to 500 ml with distilled water. ( prepare about 100 ml for use)
10. Tris buffer(0.1 mol/l) pH 7.4 : Tris(hydoxymethyl) amino methane 1.21 g, distilled water 80 ml, adjust pH 7.4 ±0.05, with hydrochloric acid 2 N, make up to 100 ml with distilled water stable for about 1 month at 4 0C
11. Bovine serum albumin (BSA) diluent 40 g/l: Weigh out 4 g of Bovine albumin powder in a beaker. Dissolve in the Tris buffer and transfer into 100 ml volumetric flask and make up to the mark with Tris buffer. This solution is stable for one week at 4 0C
12. Bilirubin standard 342µmol/l: Weigh out 20 mg of Bilirubin powder accurately in a small beaker or in a weighing bottle. Cover the beaker with aluminium foil or black paper to protect from sunlight. Add 2 ml of sodium carbonate solution and 1.5 ml of sodium hydroxide solution and dissolve it .This solution must be red and clear. This procedure must not be carried out in strong sunlight. Transfer the solution quantitatively to a 100 ml volumetric flask. (This should be protecting form direct sunlight by wrapping around with an aluminium foil or with a black carbon paper). Make up to 100 ml with BSA diluent mix the solution carefully without forming froth. Divide into small volumes in clean bottles keep in a box to protect from light. Kept store deep frozen. Do not reuse the standard once it has been used.
7.6 PROCEDURE (TOTAL BILIRUBIN) 1. For the standard, patient specimen, control and their blanks (SB, TB, and CB) pipette
1.0 ml of caffeine benzoate reagent into each of two test tubes. 2. Add 100 µl of standard or patient or control serum to each pair of tubes 3. Add 0.5 ml of diazo reagent to the test, standard, control and 0.5 ml of sulfanilic acid
to the entire blank. 4. Mix well and let stand for 10 minutes at room temperature. 5. Add 1.0 ml of alkaline tartrate reagent to each tube and mix thoroughly 6. Read the absorbance at 600 nm (Ilford filter No: 607) immediately, setting the
spectrometer to zero with distilled water.
7.61 PROCEDURE (CONJUGATED BILIRUBIN) 1. For each patient or control specimen label two tubes: one test one blank. 2. Add 100 µl of serum to each tube. 3. Add 1.0 ml of hydrochloric acid (50mmol/l) to each tube. 4. Add 0.5 ml of diazo reagent to the tube marked test and 0.5 ml of sulfanilic acid to the
tube marked blank, mix well. 5. After 5 minutes add 50 µl of ascorbic acid solution to each tube. 6. Add 1.0 ml of alkaline tartrate reagent to each tube. Mix well and read the absorbance
of each solution at 600 nm immediately, setting the spectrometer to zero absorbance with distilled water.
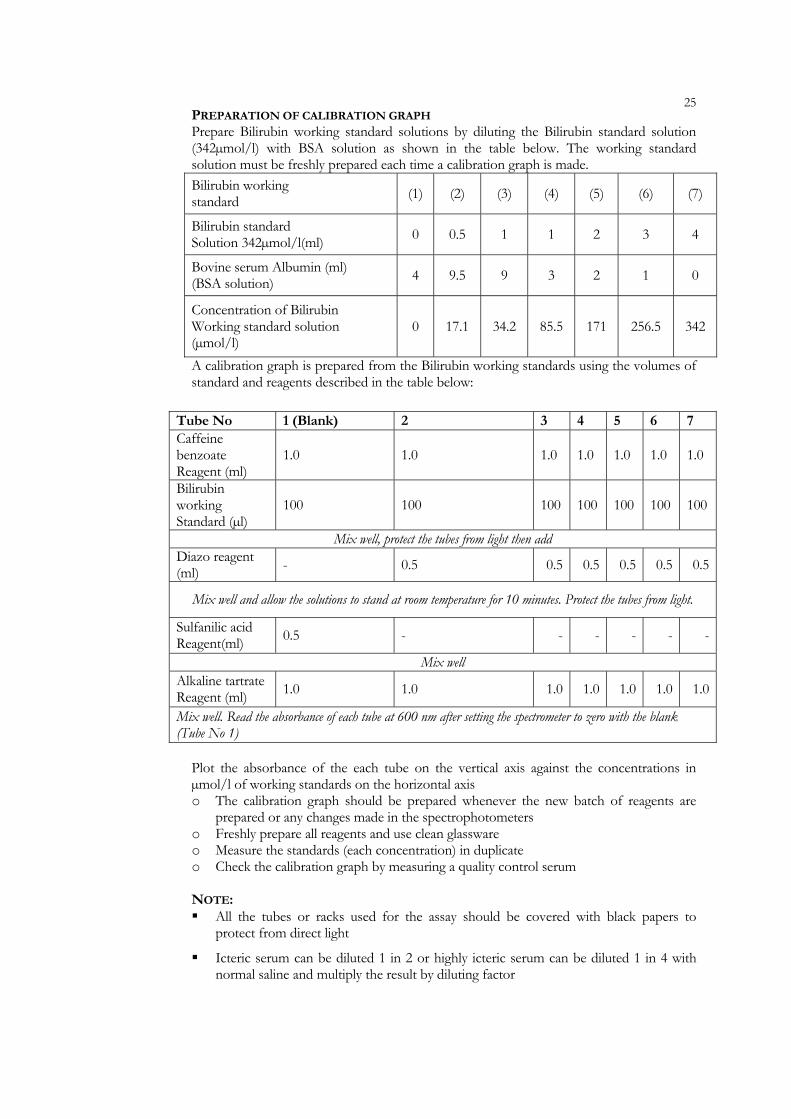
25PREPARATION OF CALIBRATION GRAPH Prepare Bilirubin working standard solutions by diluting the Bilirubin standard solution (342µmol/l) with BSA solution as shown in the table below. The working standard solution must be freshly prepared each time a calibration graph is made. Bilirubin working standard (1) (2) (3) (4) (5) (6) (7)
Bilirubin standard Solution 342µmol/l(ml) 0 0.5 1 1 2 3 4
Bovine serum Albumin (ml) (BSA solution) 4 9.5 9 3 2 1 0
Concentration of Bilirubin Working standard solution (µmol/l)
0 17.1 34.2 85.5 171 256.5 342
A calibration graph is prepared from the Bilirubin working standards using the volumes of standard and reagents described in the table below:
Tube No 1 (Blank) 2 3 4 5 6 7 Caffeine benzoate Reagent (ml)
1.0 1.0 1.0 1.0 1.0 1.0 1.0
Bilirubin working Standard (µl)
100 100 100 100 100 100 100
Mix well, protect the tubes from light then add Diazo reagent (ml) - 0.5 0.5 0.5 0.5 0.5 0.5
Mix well and allow the solutions to stand at room temperature for 10 minutes. Protect the tubes from light.
Sulfanilic acid Reagent(ml) 0.5 - - - - - -
Mix well Alkaline tartrate Reagent (ml) 1.0 1.0 1.0 1.0 1.0 1.0 1.0
Mix well. Read the absorbance of each tube at 600 nm after setting the spectrometer to zero with the blank (Tube No 1)
Plot the absorbance of the each tube on the vertical axis against the concentrations in µmol/l of working standards on the horizontal axis o The calibration graph should be prepared whenever the new batch of reagents are
prepared or any changes made in the spectrophotometers o Freshly prepare all reagents and use clean glassware o Measure the standards (each concentration) in duplicate o Check the calibration graph by measuring a quality control serum NOTE: All the tubes or racks used for the assay should be covered with black papers to
protect from direct light
Icteric serum can be diluted 1 in 2 or highly icteric serum can be diluted 1 in 4 with normal saline and multiply the result by diluting factor
26 Carryover is minimized by measuring the absorbance of all the serum blank
solutions first, followed by all the test solutions. The colour of the azobilirubin is stable for about 30 minutes. After 30 minutes turbidity may occur and the absorbance of the serum blank increases
7.7 CALCULATION If the calibration graph is linear, calculate the results using the following formula: Concentration of Bilirubin (µmol/l) = T – TB x 342 S – SB Where: T =Absorbance reading of sample or control TB =Absorbance reading of control or patient sample blank S =Absorbance reading of Bilirubin standard (342 µml/l) SB =Absorbance reading of standard blank If the calibration graph is not linear, then results should be read from a calibration curve prepared using working standards 1, 2, 3, 5 and 6. QUALITY CONTROL At least two serum control specimens having stated values in the range 20 – 200 µmol/l, one of which should be unknown to the operator, should be included with each batch of specimens. If single specimens are analysed a control specimen should always be included. OPTIMAL CONDITIONS VARIANCE: A coefficient of variation of around 6% should be attainable. ROUTINE CONDITIONS VARIANCE: The value obtained for the RCV should not exceed 12% REFERENCE VALUES For adults: 3 – 21 µmol /l Conversion from SI units into ‘old’ units: µmol/l x 0.0585=mg/dl
REFERENCES
WHO manual LAB /86.3

278. CALCIUM
8.1 INTRODUCTION Calcium is the fifth most common element and the most prevalent cation found in the body. For example, an average human body contains approximately 1kg (24.95 mol) of calcium. Calcium is found in three main compartments: the skeleton, soft tissues, and the extra cellular fluid. The skeleton contains 99% of the body’s calcium, predominantly as extra cellular crystals of unknown structure with a composition approaching that of hydroxyapatite. Soft tissues and extra cellular fluid contain about 1% of the body’s calcium. In blood, virtually all of the calcium is in serum or plasma, which has a mean normal calcium concentration of approximately 9.5mg/dL (2.37 mmol/L). Calcium exists in three physiochemical states in plasma, of which approximately 50% is free or ionised. Another 40%is bound to plasma proteins, chiefly albumin. Because calcium binds to negatively charged or anionic sties on albumin, it’s binding in pH-dependant. Alkalosis leads to an increase in binding and a decrease in free calcium; conversely, acidosis leads to a decrease in binding and an increase in free calcium. For each 0.1-unit change in pH, approximately 0.2-mg/dL (0.05mmol/L) of inverse change occurs in the serum free calcium concentration. Approximately 20% of protein-bound calcium in serum is associated with globulins. In some patients with multiple myeloma, the high concentrations of serum globulin may bind sufficient calcium, about 10%, is complexed with small diffusible anions including bicarbonate, lactate, phosphate and citrate. Calcium can be redistributed among the three plasma pools, acutely of chronically, independently affecting the quantities of free calcium and total calcium in the serum. The skeleton is a major storehouse for providing calcium for the extra cellular and intracellular pool. Approximately 5g of calcium is rapidly available from the skeletal exchangeable pool, which is accessible for maintaining normal physiological functions. Intracellular calcium has many important physiological functions within the cells, including muscle contraction, hormone secretion, glycogen metabolism and cell division. Extra cellular calcium provides a source for maintenance of intracellular calcium. In addition, it has an important role in providing calcium ions for bone mineralization, coagulation cascade and maintaining plasma membrane potential. Calcium stabilises the plasma membranes and influences permeability and excitability. A decrease in serum free calcium concentration increases neuromuscular excitability and tetany. An elevated free calcium concentration results in reduced neuromuscular excitability.
8.2 CLINICAL SIGNIFICANCE Hypercalcaemia is found commonly in clinical practice. It may be uncovered as a biochemical abnormality in an otherwise asymptomatic patient or in association with severe illness. Hypercalcaemia occurs when the flux of calcium into the extra cellular fluid is greater than the efflux of calcium out of this compartment. For example, when excessive resporption of bone mineral occurs in malignancy, hypercalciuria develops. When the capacity of the kidneys to excrete filtered calcium is exceeded, Hypercalcaemia develops. Hypercalcaemia can be due to increased intestinal absorption of calcium (vitamin D intoxication), enhanced renal retention of calcium (thiazide diuretics), increased skeletal resorption (immobilization), or a combination of these mechanisms (primary parathyroidism). The pathogenesis, clinical presentation, and differential diagnosis therefore vary widely. Primary hyperthyroidism is the most common cause of Hypercalcaemia in outpatients, and malignancy is the most common cause in hospitalized patients. Together these two account for 90 to 95% of all cases if Hypercalcaemia. Hypoalbuminemia is probably the most common cause of reduction in the concentration of total serum calcium. Common clinical conditions associated with low serum albumin concentrations include chronic liver disease, nephritic syndrome, congestive heart failure, and malnutrition. Chronic renal failure is also frequently associated with hypocalcaemia. Contributing reasons for the low calcium values are hyperphosphatemia, impaired synthesis of 1, 25(OH)2D due to inadequate renal mass, and skeletal resistance to the

28 action of Parathyroid hormone..(PTH) Magnesium deficiency is the other common clinical cause of hypocalcemia. Magnesium deficiency impairs PTH secretion as well as the action of PTH of bone and kidneys. Acute symptomatic hypocalcaemia may be noted in hospitalized patients for various reasons. Patients undergo surgical treatment for hyperthyroidism or primary hyperparathyroidism of receiving therapy for haematological malignancies may have rapid remineralisation of bone (hungry bone syndrome) causing a drop in serum calcium. Acute hemorrhagic and edematous pancreaitis is frequently complicated by hypocalcaemia. Ostomalacia of rickets secondary to vitamin D deficiency may also be associated with hypocalcaemia. The hypocalcaemia may be due in part to impaired intestinal absorption of calcium. In addition, vitamin D deficiency renders the skeleton resistant to PTH and thereby limits calcium resorption from bone.
8.3 PRINCIPLE OF THE METHOD Serum or plasma calcium is measured with o-cresolphthalein complexone reagent containing ethanediol which maintains a clear solution in the presence of proteins and suppresses the ionization of o-cresolphthalein complexone in the reagent. Interference by magnesium is eliminated by the inclusion of 8-hydroxyquiline.
8.4 SPECIMEN TYPE, COLLECTION AND STORAGE 2-3 ml clotted blood, fasting specimen without tourniquet and haemolysed free sample is collected into acid washed bottles. Separate the serum from red cells as early as possible. Pyrex vials with Teflon lined screw caps are recommended for specimen storage. Specimen may stored at 4 0C for several weeks or months
8.5 APPARATUS AND CHEMICALS APPARATUS: Spectrometer with wavelength 575 nm or colorimeter with yellow filter-Ilford 606(580nm), Safety bulb GLASSWARE: Volumetric flask class A (100ml, 500ml and 1 litre volumes) Automatic micro pipettes (50 µl200 µl 5ml and 10ml) Graduated pipettes (1 ml, 2 ml, 5ml and 10 ml in 0.1ml) Beaker (5ml, 250 ml) Measuring cylinder (50ml), Test tubes (125 x 16 mm) CHEMICALS: Hydrochloric acid concentrated (37% w/v); caution: highly corrosive O-cresolphthalein complexone-AR Ethanediol-AR 2-amino-2-methyl-1-propanol-AR 8-hydroxyquinoline-AR Calcium carbonate-AR NOTES: All glassware must be thoroughly cleaned then soaked overnight in hydrochloric acid (0.5mol/l) to remove traces of calcium then thoroughly rinsed with distilled or deionised water and finally dried before use. REAGENTS 1. Hydrochloric acid 0.5 mol/l: Adding the acid to the distilled water, dilute about 45 ml of
hydrochloric acid (concentrated) to 1 litre with distilled water. Use this solution for soaking glassware as described above.
2. Stock CPC reagent: Add 38 ml ethanediol and 13 ml of 2- amino-2-methyl-1-propanol to a 500 ml volumetic flask containing about 400 ml of distilled water. Weigh out 15 mg of o-cresolphthalien complexone and add it to the volumetric flask, mix until the all the chemicals are completely dissolved, make up to the mark with distilled water and

29transfer the reagent into a clean brown bottle. This solution is stable for 3 weeks at 4 -6 0C
3. Working CPC reagent: Weigh out 100 mg of 8-hydroxyquinoline and transfer into a 100 ml volumetric flask using small volumes of stock CPC solution. Add about 80 ml of stock CPC solution mix until the chemical is completely dissolved and make up the volume to 100ml of stock CPC reagent. The 8-hydroxyquinoline dissolves quite slowly. This solution is stable for 1 week at 4-6 0C and should have and absorbance at 575 nm of about 0.2 when measured with the spectrometer set to zero with distilled water. An absorbance higher than 0.2 indicates either that the reagent has deteriorated or that it is contaminated with calcium
4. Calcium stock standard 25mmol/l: Dry about 300 mg of calcium carbonate in a dry container in an oven for 4 hours at 80-100 0C. After heating remove it from the oven and immediately close the container with a lid. When it has cooled to room temperature weigh out exactly 250 mg and transfer to a 100 ml volumetric flask. Dissolve the calcium carbonate in a minimum volume of hydrochloric acid (concentrated) approximately 0.5 ml is require, then make up to100 ml with distilled water.
5. Calcium working standard 2.5mmol/l: Using a volumetric pipette transfer 10.0 ml of the stock standard to a 100 ml volumetric flask. Make up to 100 ml with distilled water.
8.6 PROCEDURE 1. The analysis must be performed in duplicate. Transfer 50 µl of serum or plasma to
each of two clean tubes, add 5.0 ml working CPC reagent to each tube, mix well. 2. Transfer 50 µl of working calcium standard (2.5mmol/l) to each of 2 clean tubes; add
5.0 ml working CPC reagent to each tube, mix well. 3. Transfer 50 µl of distilled water to a clean tube, add 5.0 µl working CPC reagent, Mix
well. This is the reagent blank. 4. Set the spectrometer to zero at 575 nm with distilled water and measure the
absorbance of the reagent blank which should be about 0.2. 5. Measure the absorbance of the standards (2.5mmol/l) and serum sample If the absorbance of duplicate readings varies by more than 0.015 then precision is unsatisfactory. Check that the test tubes and pipettes are clean. Check the precision of the 50 µl volumetric pipette. Use a 5.0 ml volumetric pipette for the working CPC reagent. Check that the spectrometer cuvettes (cells) are clean. PREPARATION OF CALIBRATION GRAPH The calibration graph must be prepared in order to confirm the linearity of the method and should be checked monthly. The calibration graph should not be used for calculating patients’ results. Prepare the calibration graph standards from the calcium stock standard as described in the table below in clean test tubes as accurately as possible using 1, 2 and 10 ml graduated pipettes
Tube Number 1 2 3 4 5
Calcium stock standard ( 25mmol/l) ml 0.2 0.7 1.0 1.2 1.5
Distilled water (ml) 9.8 9.3 9.0 8.8 8.5
Calcium concentrated (mmol/l) 0.5 1.75 2.5 3.0 3.75
30 Transfer 50 µl of distilled water into a clean test tube for the reagent blank and transfer 50 µl of each calibration graph standard to 5 other test tubes. Add 5.0 ml of working CPC reagent to each tube using a 5 ml volumetric pipette and safety bulb. Mix and measure the absorbance of each tube at 575 nm setting the spectrometer to zero with distilled water. Plot the absorbance of each tube on the vertical axis against the calcium concentration of the calibration graph standards in mmol/l on the horizontal axis. The purpose of preparing the calibration graph is to confirm the linearity of the method. If this is not linear beyond 3.0 mmol/l, then patients’ samples with calcium concentrations greater than 3.0 mmol/l should be diluted two-fold with distilled water before analyse. If the graph is linear up to 3.75 mmol/l then samples with calcium concentrations greater than 3.75 mmol/l should be diluted two-fold with distilled water before analysis.
8.7 CALCULATION Calculate the results using the following formula: Concentration of calcium (mmol/l) = T-B x 2.5 S-B Where: T = Absorbance reading of sample or control S = Absorbance reading of working calcium standard (2.5 mmol/l) B = Absorbance reading of reagent blank If the sample or control result is above the linearity of the method then repeat the analysis after accurately diluting 200 µl of sample with 200 µl of distilled water in a clean tube. Use 50 µl of the diluted sample for the analysis. Remember to multiply the result by 2 to obtain the calcium concentration of the sample. QUALITY CONTROL At least two serum control specimens, having stated values in the range 2.00-2.90 mmol/l one of which is unknown to the operator, should be included with each batch of specimens. If single specimens are analysed a control specimen should always be included. OPTIMAL CONDITIONS VARIANCE: A coefficient of variation of around 1.5% should be attainable. ROUTINE CONDITIONS VARIANCE : The value obtained for the RCV should not exceed 4% REFERENCE VALUES The reference interval for healthy ambulant adults is 2.25-2.60 mmol/l. Conversion of SI units into “old” units: mmol/l x 4 = mg/dl. The reference values are only appropriate if the patient has a normal serum albumin concentration. If the patient has a low serum albumin then it may be helpful to report the albumin corrected calcium as well as the measured calcium. The albumin corrected calcium is calculated in this way: (40 – Patient’s albumin) + measured calcium = albumin corrected calcium 40 For example if the patient has an albumin of 20 g/l and a measured calcium of 1.90mmol/l, then the albumin corrected calcium is 2.40mol/l (40-20) + 1.90 = 2.40 mmol/l 40 The albumin corrected calcium will be approximately 2.20-2.60 mmol/l if low measured calcium is a consequence of a low serum albumin.

31Note: The estimation of calcium is difficult, particularly because of the possibility of contamination by calcium. It is essential that high quality chemicals are used and that the recommendations regarding cleaning of glassware are strictly followed. It may be found helpful to keep separate test tubes, pipettes etc, only for the analysis of calcium When preparing the reagents, be careful not to contaminate other chemicals or glassware with calcium carbonate. PRECAUTIONS Use dry glass container which must be chemically cleaned and acid washed Avoid use of plastic containers and use of rubber stoppers Avoid use of acid etched glassware. It may lead either to calcium loss because
adsorption of calcium on to the damage surface or to contamination with calcium because the etched areas cannot be cleaned thoroughly.
REFERENCES LAB/86.3
CALCIUM IN URINE
SPECIMENS: a 24 hour urine collection in an acid washed 2.5 L bottle; 10 ml of 1 N HCl is added as the preservative. Acid washed beaker and a funnel should be issued from the laboratory along with collection bottle. PROCEDURE: Mix the 24 hour urine collection and measure the total urine volume Follow the procedure as for serum calcium analysis
Calcium samples with calcium concentration greater than 3.75 mmol/l should be diluted with distilled water before analysis. Multiply the results by the dilution factor

32 9. CREATININE
9.1 INTRODUCTION Creatine is synthesized in the kidneys, liver and pancreas by two enzymatically mediated reactions. In the first, transamidination of arginine and glycine forms guanidiniacetic acid: the second methelation of guanidinoacetic acid occurs with S- adenosylmethionine as methyl donor. Creatine is then transported in blood to other organs such as muscle and brain, where it is phosphorylated to phosphocreatine a high energy compound. Interconversion of phosphocreatine and creatine is a particular feature of metabolic processes of muscle contration; some of the free creatine in muscle spontaneously converts to creatinine, its anhydride. Between 1 and 2% of muscle creatine is converted to creatinine daily. Because the amount of endogenous creatinine produced is propotional to muscle mass, the production varies with age and sex; non obese men excrete about 1.5 g/day, women 1.2 g/day. Daily excretion of creatinine can be 10% to 30% greater as a result of dietary intake of creatine and creatinine in meats. On the whole however, dietary fluctuations of creatinine intake cause only minor variation in daily creatinine excretion on the same individual. The excretion rate in one individual, in the absence of renal disease, is relatively constant and parallels endogenous production. Most of the interindividual variations of creatinine excretion in healthy persons are attributable in the main to age, sex, and lean body mass. The interindividual variation tends to be less than 15% from day to day.
9.2 CLINICAL SIGNIFICANCE Because creatinine is endogenously produced and released into body fluids at a constant rate and its plasma levels maintained within narrow limits, its clearance may be measured as an indicator of GFR. However, a small quantity of creatinine is reabsorbed by the tubules and as a result; creatinine clearance (if creatinine is measured with an accurate method) is approximately 7 & greater than inulin clearance. Some methods for creatinine used in clinical laboratories are nonspecific, however, and thus this difference is often smaller. The creatinine clearance is performed by obtaining a 4-, 12- or 24-h urine specimen and also a blood specimen sometime within the period of urine collection. The volume of the urine is measured, urine flow rate is calculated (millimetres per minute), and the assay for creatinine is performed on plasma and urine to obtain the concentration in milligrams per decilitre or per millilitre. Two factors influence measurement of creatinine clearance and thus its interpretation. First, the most common methods for measuring creatinine use the nonspecific alkaline picarate reaction, and thus noncreatinine chromogens in plasma increase the apparent plasma concentration by as much as 30% if serum values are less than 1.0mg/dL, and by approximately 10% is values exceed 1.0mg/dL. The percent increase is progressively less with higher creatinine concentrations. (Urine contains considerably fewer noncreatinine chromogens.) this overestimation of plasma creatinine concentration result in underestimation of creatinine clearance and partially offsets the apparent high clearance of creatinine that is due to tubular secretion. As a result, the endogenous creatinine clearance agrees closely with the inulin clearance throughout a substantial range of clearances. However, if accurate emethods are used for assay of plasma creatinine, the GFR estimated by creatinine clearance may not correlate with the GFR estimated by inulin clearance. Secondly, GFR measured by creatinine clearance and GFR measured by inulin clearance in the same patient progressively diverge as renal failure progresses and plasma creatinine level rises. The greater apparent GFR found by creatinine clearance may be due to an increase in tubular secretory activity for creatinine when plasma levels increase much above normal and to the relatively smaller contribution of noncreatinine chromogens in the nonspecific assay of plasma creatinine. In clinical practice, it is now accepted that, by the time patients have lose one half to two thirds theirs normal renal function, as demonstrated by creatinine clearance, it is more reliable and prudent to monitor their subseqnet renal function and response to therapeutic initiatives by using radioisotopic markers of glomerular filtration and renal plasma flow.
339.3 PRINCIPLE OF THE METHOD Protein free filtrate is mixed with an alkaline picrate solution which forms a yellow –red complex with Creatinine. The absorbance of the complex is measured at 500 nm.
9.4 SPECIMEN TYPE, COLLECTION AND STORAGE Non haemolysed serum; collect about 4 - 5 ml blood into a clean dry bottle. Avoid haemolysis. Separate the serum as early as possible from the cells within 12 hours of collection. Serum is stable at 2-8 0C up to 24 hours Referral: Send about 1.0 ml serum kept cool to reach destinations within 18 hours
9.5 APPARATUS AND CHEMICALS APPARATUS: pH meter Spectrophotometer at wavelength 490 nm or Colorimeter with blue green filter, Ilford 603(490 nm) GLASSWARE: Volumetric flask (100 ml and 500 ml volumes) Automatic micro pipettes (50, 200 and 500 µl) Graduated pipettes (10 ml in 0.1 ml) Measuring cylinders (50 ml and 100 ml) Beakers (100ml, 500 ml) Test tubes (125 mm x 13mm) Reagent bottles, clear and amber coloured (500 ml), Rubber bulb
Conical centrifuge tubes 15 ml CHEMICALS: Sodium hydroxide pellets Picric acid; Note: water is added to picric acid to ensure safety in transit Standard buffers for pH meter Creatinine anhydrous (pure) Hydrochloric acid concentrated (37% w/v) caution: highly corrosive Benzoic acid Sodium tungstate dihydrate Polyvinyl alcohol REAGENTS 1. Saturated picric acid solution: Picric acid is supplied as a moist chemical. Weigh out the
equivalent of 7 g of picric acid i.e. mix well the bottle and weigh out about 10.5 – 11 g if your picric acid container states that 50 % by weight of water has been added. Add 11 g of moist picric acid to 500 ml distilled water, stir for several hours to ensure that a saturated solution is produced. Transfer in to a brown bottle. This solution is stable indefinitely at room temperature. Note: the amount of picric acid weighed out will depend on the water content of the chemical
2. Picric acid 0.036 mol/l: Measure 705 ml of saturated picric acid solution in to volumetric flask and make up to 1 litre with distilled water store in a brown bottle. This solution is stable indefinitely
3. Acid tungstate solution: Weigh out 11.1 g of sodium tungstate dihydrate (9.8 g anhydrous salt) and dissolve in about 300 ml of distilled water in a 1 litre volumetric flask. Dissolve 1 g of polyvinyl alcohol in about 100 ml of dish water with heating (do not boil) Allow to cool to room temperature then transfer into the volumetric flask containing sodium tungstate. Measure 2.1 ml of concentrated sulphuric acid in to 300 ml of distilled water in a beaker mix well. Add this solution also-in to the same volumetric flask containing tungstate solution. Dilute to 1 litre with distilled water when the solution is cool to room temperature. Store in a brown bottle.
4. Sodium hydroxide solution 1.4mmol/l: Dissolve 56 g of sodium hydroxide in distilled water and dilute to 1 litre, store in a polypropylene bottle.
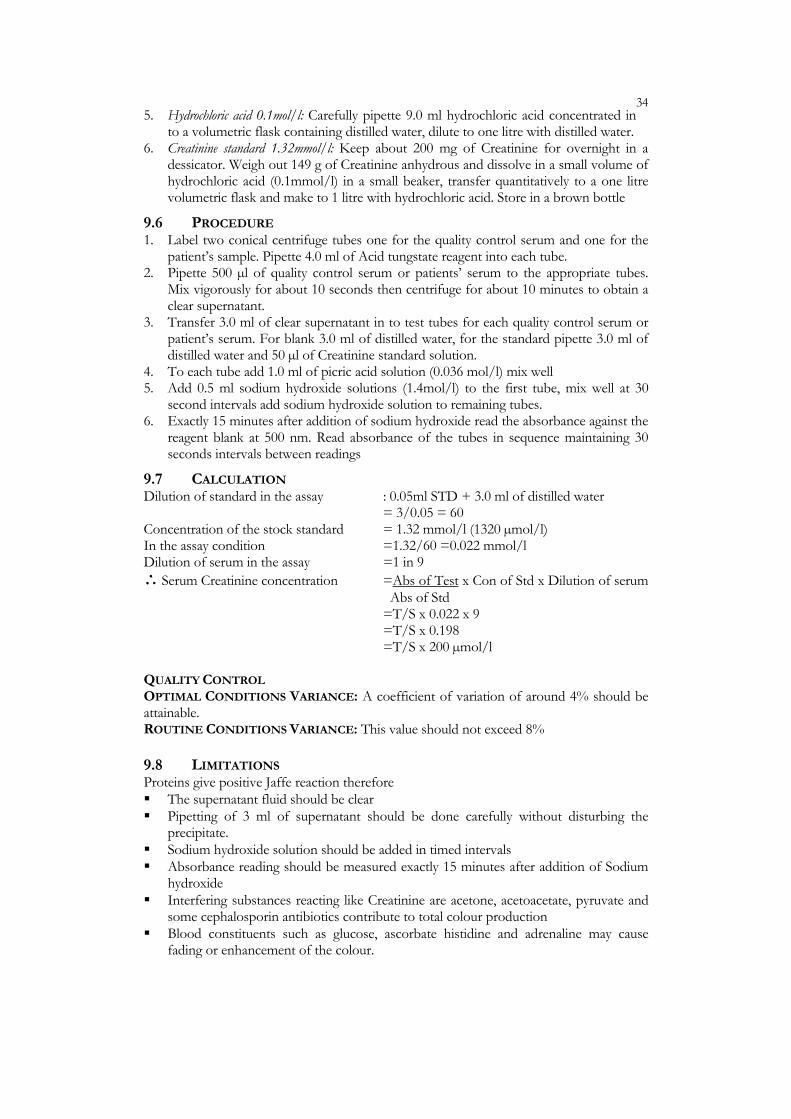
34 5. Hydrochloric acid 0.1mol/l: Carefully pipette 9.0 ml hydrochloric acid concentrated in
to a volumetric flask containing distilled water, dilute to one litre with distilled water. 6. Creatinine standard 1.32mmol/l: Keep about 200 mg of Creatinine for overnight in a
dessicator. Weigh out 149 g of Creatinine anhydrous and dissolve in a small volume of hydrochloric acid (0.1mmol/l) in a small beaker, transfer quantitatively to a one litre volumetric flask and make to 1 litre with hydrochloric acid. Store in a brown bottle
9.6 PROCEDURE 1. Label two conical centrifuge tubes one for the quality control serum and one for the
patient’s sample. Pipette 4.0 ml of Acid tungstate reagent into each tube. 2. Pipette 500 µl of quality control serum or patients’ serum to the appropriate tubes.
Mix vigorously for about 10 seconds then centrifuge for about 10 minutes to obtain a clear supernatant.
3. Transfer 3.0 ml of clear supernatant in to test tubes for each quality control serum or patient’s serum. For blank 3.0 ml of distilled water, for the standard pipette 3.0 ml of distilled water and 50 µl of Creatinine standard solution.
4. To each tube add 1.0 ml of picric acid solution (0.036 mol/l) mix well 5. Add 0.5 ml sodium hydroxide solutions (1.4mol/l) to the first tube, mix well at 30
second intervals add sodium hydroxide solution to remaining tubes. 6. Exactly 15 minutes after addition of sodium hydroxide read the absorbance against the
reagent blank at 500 nm. Read absorbance of the tubes in sequence maintaining 30 seconds intervals between readings
9.7 CALCULATION Dilution of standard in the assay : 0.05ml STD + 3.0 ml of distilled water
= 3/0.05 = 60 Concentration of the stock standard = 1.32 mmol/l (1320 µmol/l) In the assay condition =1.32/60 =0.022 mmol/l Dilution of serum in the assay =1 in 9 ∴ Serum Creatinine concentration =Abs of Test x Con of Std x Dilution of serum Abs of Std =T/S x 0.022 x 9 =T/S x 0.198 =T/S x 200 µmol/l QUALITY CONTROL OPTIMAL CONDITIONS VARIANCE: A coefficient of variation of around 4% should be attainable. ROUTINE CONDITIONS VARIANCE: This value should not exceed 8%
9.8 LIMITATIONS Proteins give positive Jaffe reaction therefore The supernatant fluid should be clear Pipetting of 3 ml of supernatant should be done carefully without disturbing the
precipitate. Sodium hydroxide solution should be added in timed intervals Absorbance reading should be measured exactly 15 minutes after addition of Sodium
hydroxide Interfering substances reacting like Creatinine are acetone, acetoacetate, pyruvate and
some cephalosporin antibiotics contribute to total colour production Blood constituents such as glucose, ascorbate histidine and adrenaline may cause
fading or enhancement of the colour.

3510. URINE CREATININE
10.1 SPECIMEN TYPE, COLLECTION AND STORAGE 24 hours collection of urine, empty the bladder first and note the time, from that time onward collect the sample into amber colour preservative added 2 litre bottle till 24th hour and keep the bottle in the refrigerator during collection period, after completion of 24 hours collection, bring the bottle to the laboratory
10.2 PRINCIPLE OF THE METHOD After dilution, the urine is mixed with picric acid and sodium hydroxide solution which forms a yellow red complex with Creatinine. The absorbance of the complex is measured at 500 nm.
10.3 APPARATUS AND CHEMICALS Same as for serum Creatinine estimation. PRESERVATIVE One Normal hydrochloric acid- 10ml or Few crystals of thymol or 5 ml of a 100g/l solution in isopropanol
10.4 PROCEDURES 1. Mix the 24 hours urine collection. Measure the total urine volume. 2. Pipette 1 ml of urine into a 100 ml volumetric flask. Make up to 100 ml with distilled
water. Mix well (1:100 dilution) 3. Three test tubes are required. One for the Test, one for a reagent blank, and one for
the standard 4. Transfer 3.0 ml of diluted urine into the Test. 3.0 ml of distilled water into the reagent
blank. 3ml of distilled water and 0.1 ml of standard solution into the standard. 5. To each tube add 1.0 ml picric acid solution (0.036mol/l). Mix well. 6. Add 0.5 ml sodium hydroxide solution (1.4mol/l) solution to the first tube, mix well at
30 seconds intervals, and add sodium hydroxide solution to the remaining tubes. 7. Exactly 15 minutes after adding sodium hydroxide read the absorbance against the
reagent blank at 500 nm. Read the tubes in sequence maintaining 30 seconds intervals between readings.
10.5 CALCULATION Same method as serum Creatinine but 3 ml of diluted urine (1:100 with distilled water) is used for the filtrate No protein precipitation is needed
Concentration of standard = 1.32 mmol/l (1320 µmol/l) Standard dilution is = 1 in 30 (i.e. 0.1 ml standard diluted with 3.0
ml of distilled water) ∴standard concentration = 1.32 mmol/l = 0.044 mmol/l
30 urine dilution is = 1: 100 ∴ urine Creatinine = Test x 0.044 x 100 mmol/l
Standard 24 hour Urine Creatinine = Test(T) x 4.4 x Total volume in litre(TV)
(mmol/24 hour) Standard(S)
REFERENCES VALUES: 8.84 to 17.6 mmol/24 hours CHILDREN Urine Creatinine = T/S x 4.4 x Total volume x 1000/B.W
= x µmol/kg/24 hours

36 10.6 CREATININE CLEARANCE The following details of the patients are required for calculation of Creatinine
Clearance Height Body weight(BW) Age Total volume of urine collection over timed period (over 24 hours)
Blood sample should be collected during the 24 hours urine collection Serum Creatinine and 24 hours urine Creatinine should be done for calculation of
Creatinine clearance Creatinine Clearance =UV/P U-Urine Creatinine in mmol/l V-Rate of urine flow in ml/minute P-Serum Creatinine in mmol/l V= 24 hours urine volume in ml
24 x 60
Creatinine Clearance=Concentration of urine Creatinine in mmol/l x 24 hour urine volume in ml Concentration of serum Creatinine in mmol/l 24 x 60
Clearance varies with body size and is proportional to the body area (A) where this varies much from the normal in adults and in all cases in all cases in children. The determined clearance is corrected to a standard surface area of 1.73 m2 by multiplying by 1.73/A. The A (Body surface area can be calculated using a nomogram. From height and weight) Corrected Creatinine Clearance= Creatinine clearance x 1.73 A REFERENCES VALUES: Refer the appendix 2
REFERENCES WHO manual Varley’s practical clinical Biochemistry sixth edition

3711. CHOLESTEROL
11.1 INTRODUCTION Although every living organism examined has been found to contain sterols, cholesterol is found almost exclusively in animals and humans, in which it is also the main sterol.Virtually all cells and body fluids contain some cholesterol.Like other sterols,cholesterol is a solid alcohol of high molecular weight and possesses the tetracyclic perhydrocyclopentanophenanthrene skeleton. The molecule contains 27 carbon atoms.Cholesterol is the initial starting point in many metabolic pathways. These include vitamin D synthesis, steroid hormone synthesis, and bile acid metabolism.
Cholesterol is presented to the intestinal wall from three sources: the diet, bile and intestinal secretions and cells. Animal products, especially meat, egg yolk, seafood, and whole-fat dairy products, provide the bulk of dietary cholesterol. Cholesterol intake varies considerably according to the dietary intake of animal products. A similar amount of cholesterol is present in the gut from biliary secretion and the turnover of mucosal cells. Practically all cholesterol in the intestine is present in the unesterified (free) form. Esterified cholesterol in the diet is rapidly hydrolyzed in the intestine to free cholesterol and free fatty acids (FFA) by cholesterol esterase in pancreatic and small intestinal secretions.
Although portion of the body’s cholesterol is derived from dietary intake, most tissue and plasma cholesterol is synthesized endogenously by the liver and other tissues from simpler molecules, particularly acetate.
Once synthesized cholesterol is released into the circulation for transport in combination with specific apoproteins, the apolipoproteins, in complexes known as lipoproteins. Minimal cholesterol esterification occurs within the liver before its release, and cholesterol is mainly esterified within the vascular compartment. Esterification is important because it serves to enhance the lipid carrying capacity of the lipoproteins. The reaction is catalyzed by the enzymes lecithin-cholesterol acyltransferase (LCAT) in the plasma and acyl-cholesterol acyltransferase (ACAT) intracellularly.The intracellular ACAT pathway is the major pathway in the liver, intestine, adrenal cortex, and probably in the arterial wall.
Once cholesterol enters the cell, the esters are hydrolyzed by the action of specific esterases and enters into specific metabolic pathways.
Cholesterol reaching the liver is either secreted unchanged into bile or metabolized to bile acids. Approximately one third of the daily production of cholesterol is catabolized into bile acids. The first step in the bile acid synthesis involves the rate limiting step, 7 alpha hydroxylation. Two bile acids, cholic and chenodeoxycholic, constitute the primary bile acids.They are conjugated with either glycine or taurine and enter the bile canaliculi. Some of the bile acids are deconjugated and converted by bacteria in the intestine to secondary bile acids. Cholic acid is converted to deoxycholic acid, and chenodeoxycholic acid is metabolized to lithocholic acid.Virtually all bile acids except lithocholic are reabsorbed in the lower third of the ileum and returned to the liver via the portal vein, thus completing the enterohepatic circulation.
11.2 CLINICAL SIGNIFICANCE High prevalence of atherosclerosis and ischaemic heart disease is seen where dietary fat intake is relatively high. High plasma levels of LDL, IDL and possibly VLDL are associated with an increased risk of premature atherosclerosis and ischaemic heart disease. This relationship appears to be a continuous (curvilinear) one, i.e. there is no threshold above which risk abruptly appears. Plasma HDL cholesterol concentration is a negative risk factor, so that high levels appear to protect against ischaemic heart disease and low levels are associated with an increased risk of ischaemic heart disease.

38 11.3 PRINCIPLE OF THE METHOD The cholesterol is determined after enzymatic hydrolysis and oxidation. The indicator quinoneimine is formed from hydrogen peroxide and 4 – aminophenazone in the presence of phenol and peroxidase.
11.4 PATIENT PREPARATION No change in dietary habits for at least 3 weeks To analyze cholesterol alone 12 hours fasting is preferred.
BLOOD DRAWING TECHNIQUE Patient should be seated. Blood is drawn from antecubital vein. Patient should be subjected to minimum amount of stress during blood drawing.
11.5 SPECIMEN TYPE, COLLECTION AND STORAGE 12 hours fasting, 2-3 ml clotted blood or 2 ml EDTA blood without tourniquet avoid haemolysis. Serum should be separated from cells as early as possible. Specimen preferably be analysed on the day of collection. Serum is stable for 4 days at 4 0C, for 3 months at -20 0C and for many years at -70 0C. As referral sample send about 0.5 ml clear serum, kept cool, to reach destination within 24 hours.
11.6 APPARATUS AND CHEMICALS
APPARATUS: Spectrophotometer at wavelength 500 nm Water bath at 37 0C Vortex mixer GLASSWARE: Test tubes 100mm x 13mm Automatic micropipette 10 µl Automatic pipette 1000µl Semi micro cuvette (capacity =1ml)
REAGENTS There are various reagents and standard are commercially available for cholesterol estimation , evaluate the kits using Quality Control sample with low, high, normal value and consider following to choose commercially available kits a. Reagent stability b. Expiry date c. Test procedure d. Interfering substances e. Other related factors
11.7 PROCEDURE 1. label tubes for Blank, Standard, Quality control and test 2. Add 10 µl of distilled water to Blank , 10 µl of standard solution to Standard, 10µl of
QC sample to Quality control and 10µl of patients serum to test 3. Add 1000 µl of cholesterol reagent to all the tubes 4. Mix well and incubate all the tubes at 37 0C for 5 minutes in water bath 5. Mix well, zero the spectrophotometer with reagent blank and read the absorbance at
500 nm Strict to the test procedure available with the reagent kits that is being used
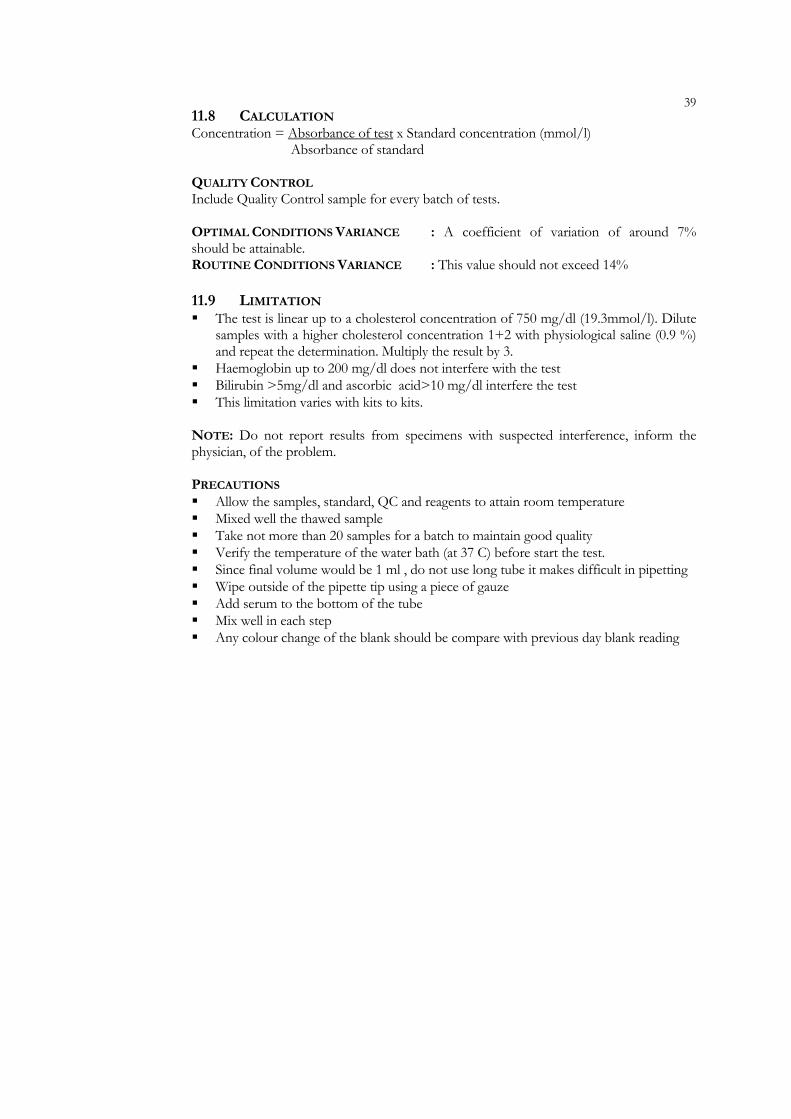
3911.8 CALCULATION Concentration = Absorbance of test x Standard concentration (mmol/l) Absorbance of standard QUALITY CONTROL Include Quality Control sample for every batch of tests. OPTIMAL CONDITIONS VARIANCE : A coefficient of variation of around 7% should be attainable. ROUTINE CONDITIONS VARIANCE : This value should not exceed 14%
11.9 LIMITATION The test is linear up to a cholesterol concentration of 750 mg/dl (19.3mmol/l). Dilute
samples with a higher cholesterol concentration 1+2 with physiological saline (0.9 %) and repeat the determination. Multiply the result by 3.
Haemoglobin up to 200 mg/dl does not interfere with the test Bilirubin >5mg/dl and ascorbic acid>10 mg/dl interfere the test This limitation varies with kits to kits.
NOTE: Do not report results from specimens with suspected interference, inform the physician, of the problem. PRECAUTIONS Allow the samples, standard, QC and reagents to attain room temperature Mixed well the thawed sample Take not more than 20 samples for a batch to maintain good quality Verify the temperature of the water bath (at 37 C) before start the test. Since final volume would be 1 ml , do not use long tube it makes difficult in pipetting Wipe outside of the pipette tip using a piece of gauze Add serum to the bottom of the tube Mix well in each step Any colour change of the blank should be compare with previous day blank reading

40 12. GLUCOSE
12.1 INTRODUCTION Glucose is the primary energy source for the human body. It is derived from the breakdown of carbohydrates in the diet (grains, starchy vegetables and legumes) and in the body stores (glycogen), as well as by endogenous synthesis from protein or the glycerol moiety of triglycerides. When energy intake exceeds expenditure, the excess is converted to fat and glycogen for storage in adipose tissue and liver or muscle respectively. When energy expenditure exceeds caloric intake, endogenous glucose formation occurs from the breakdown of carbohydrate stores and from non carbohydrate sources.(amino acids, lactate, and glycerol) The glucose level in blood is maintained within a fairly narrow range under diverse conditions (feeding, prolonged fasting or severe exercise) by regulatory hormones. These include insulin, which decreases blood glucose, and the counter regulatory hormones (glucagon, cortisol, noradrenalin and growth hormone) which increase blood glucose levels.
12.2 CLINICAL SIGNIFICANCE Diabetes mellitus is a group of metabolic disorders of carbohydrate metabolism in which glucose is underutilized, producing hyperglycemia. Some patients may develop acute life threatening hyperglycemic episodes, such as ketoacidosis or hyperosmolar coma. As the disease progresses the patients are at increased risk of developing specific complications including retinopathy leading to blindness, renal failure, neuropathy(nerve damage),and atherosclerosis.The last may result in stroke, gangrene or coronary disease. (Please refer the article in annexure for current World Health Organization recommended criteria for diagnosis of Diabetes Mellitus.) Hypoglycemia is a blood glucose concentration below the fasting range, but it is difficult to define specific limits. No symptoms are specific for hypoglycemia. A rapid decrease in plasma glucose to hypoglycemic levels usually triggers a sympathetic response, with the release of nor adrenaline, which produces classical signs and symptoms of hypoglycemia: weakness. Sweating, nausea, rapid pulse, lightheadedness and hunger. The brain is totally dependent on blood glucose, and very low levels of plasma glucose(less than 20 or 30 mg /dl cause severe central nervous system dysfunction. Neonatal blood glucose concentrations are much lower than adults and decline shortly after birth when live glycogen stores are depleted. Glucose levels as low as 30 mg/dl in a term infant and 20mg/dl in a premature infant may occur without any clinical evidence of hypoglycemia. The more common causes in the neonatal period include prematurity , maternal diabetes and maternal toxemia. These are usually transient. Hypoglycemia with onset in early infancy is usually less transitory and may be due to inborn errors of metabolism or ketotic hypoglycemia, which usually develop after fasting or febrile illness.
12.3 PRINCIPLE OF THE METHOD The aldehyde group of β - D – Glucose present in the plasma is oxidized by the enzyme Glucose oxidase to gluconic acid with liberation of hydrogen peroxide. The hydrogen peroxide is converted to water and molecular oxygen by the enzyme peroxidase. In the presence of an oxygen acceptor or 4 - aminophenazone together with phenol, a pink colour is formed which is measured at 510 nm. SPECIMEN CONTAINERS Blood containers should be leak proof and be easy to close and open without
contaminating the fingers.
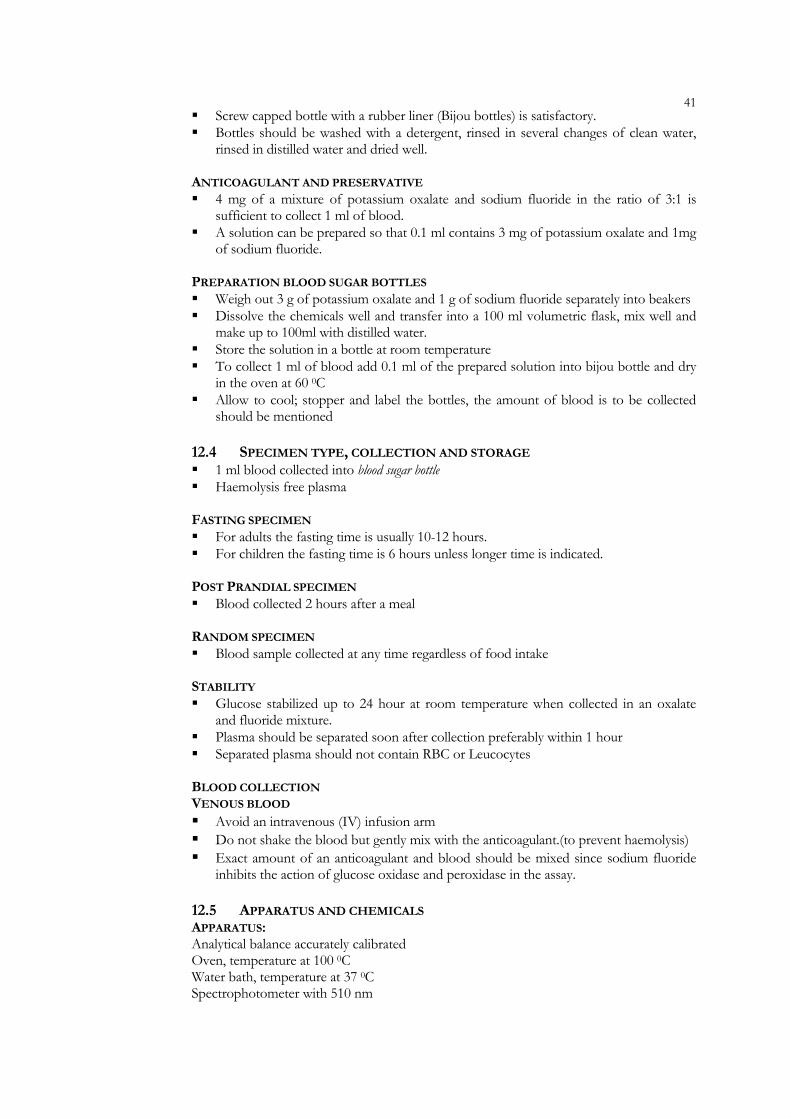
41 Screw capped bottle with a rubber liner (Bijou bottles) is satisfactory. Bottles should be washed with a detergent, rinsed in several changes of clean water,
rinsed in distilled water and dried well. ANTICOAGULANT AND PRESERVATIVE 4 mg of a mixture of potassium oxalate and sodium fluoride in the ratio of 3:1 is
sufficient to collect 1 ml of blood. A solution can be prepared so that 0.1 ml contains 3 mg of potassium oxalate and 1mg
of sodium fluoride. PREPARATION BLOOD SUGAR BOTTLES Weigh out 3 g of potassium oxalate and 1 g of sodium fluoride separately into beakers Dissolve the chemicals well and transfer into a 100 ml volumetric flask, mix well and
make up to 100ml with distilled water. Store the solution in a bottle at room temperature To collect 1 ml of blood add 0.1 ml of the prepared solution into bijou bottle and dry
in the oven at 60 0C Allow to cool; stopper and label the bottles, the amount of blood is to be collected
should be mentioned
12.4 SPECIMEN TYPE, COLLECTION AND STORAGE 1 ml blood collected into blood sugar bottle Haemolysis free plasma
FASTING SPECIMEN For adults the fasting time is usually 10-12 hours. For children the fasting time is 6 hours unless longer time is indicated.
POST PRANDIAL SPECIMEN Blood collected 2 hours after a meal
RANDOM SPECIMEN Blood sample collected at any time regardless of food intake
STABILITY Glucose stabilized up to 24 hour at room temperature when collected in an oxalate
and fluoride mixture. Plasma should be separated soon after collection preferably within 1 hour Separated plasma should not contain RBC or Leucocytes
BLOOD COLLECTION VENOUS BLOOD Avoid an intravenous (IV) infusion arm Do not shake the blood but gently mix with the anticoagulant.(to prevent haemolysis) Exact amount of an anticoagulant and blood should be mixed since sodium fluoride
inhibits the action of glucose oxidase and peroxidase in the assay.
12.5 APPARATUS AND CHEMICALS APPARATUS: Analytical balance accurately calibrated Oven, temperature at 100 0C Water bath, temperature at 37 0C Spectrophotometer with 510 nm
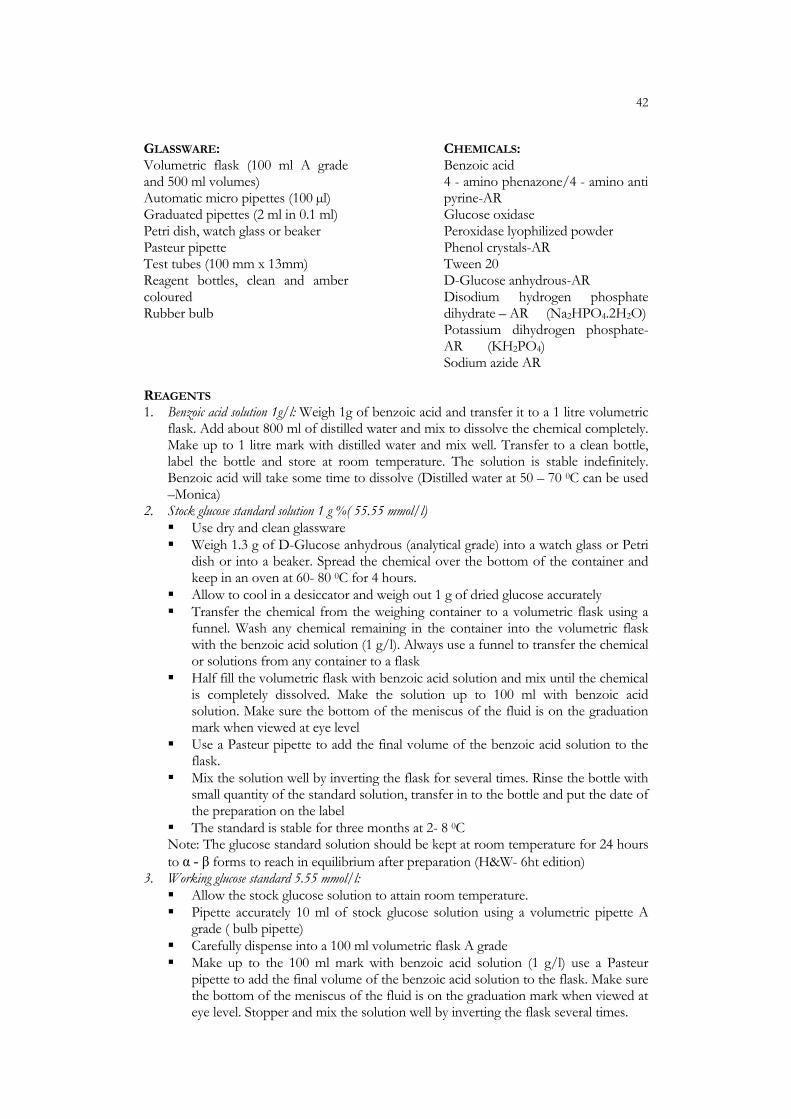
42
GLASSWARE: Volumetric flask (100 ml A grade and 500 ml volumes) Automatic micro pipettes (100 µl) Graduated pipettes (2 ml in 0.1 ml) Petri dish, watch glass or beaker Pasteur pipette Test tubes (100 mm x 13mm) Reagent bottles, clean and amber coloured Rubber bulb
CHEMICALS: Benzoic acid 4 - amino phenazone/4 - amino anti pyrine-AR Glucose oxidase Peroxidase lyophilized powder Phenol crystals-AR Tween 20 D-Glucose anhydrous-AR Disodium hydrogen phosphate dihydrate – AR (Na2HPO4.2H2O) Potassium dihydrogen phosphate-AR (KH2PO4) Sodium azide AR
REAGENTS 1. Benzoic acid solution 1g/l: Weigh 1g of benzoic acid and transfer it to a 1 litre volumetric
flask. Add about 800 ml of distilled water and mix to dissolve the chemical completely. Make up to 1 litre mark with distilled water and mix well. Transfer to a clean bottle, label the bottle and store at room temperature. The solution is stable indefinitely. Benzoic acid will take some time to dissolve (Distilled water at 50 – 70 0C can be used –Monica)
2. Stock glucose standard solution 1 g %( 55.55 mmol/l) Use dry and clean glassware Weigh 1.3 g of D-Glucose anhydrous (analytical grade) into a watch glass or Petri
dish or into a beaker. Spread the chemical over the bottom of the container and keep in an oven at 60- 80 0C for 4 hours.
Allow to cool in a desiccator and weigh out 1 g of dried glucose accurately Transfer the chemical from the weighing container to a volumetric flask using a
funnel. Wash any chemical remaining in the container into the volumetric flask with the benzoic acid solution (1 g/l). Always use a funnel to transfer the chemical or solutions from any container to a flask
Half fill the volumetric flask with benzoic acid solution and mix until the chemical is completely dissolved. Make the solution up to 100 ml with benzoic acid solution. Make sure the bottom of the meniscus of the fluid is on the graduation mark when viewed at eye level
Use a Pasteur pipette to add the final volume of the benzoic acid solution to the flask.
Mix the solution well by inverting the flask for several times. Rinse the bottle with small quantity of the standard solution, transfer in to the bottle and put the date of the preparation on the label
The standard is stable for three months at 2- 8 0C Note: The glucose standard solution should be kept at room temperature for 24 hours to α - β forms to reach in equilibrium after preparation (H&W- 6ht edition)
3. Working glucose standard 5.55 mmol/l: Allow the stock glucose solution to attain room temperature. Pipette accurately 10 ml of stock glucose solution using a volumetric pipette A
grade ( bulb pipette) Carefully dispense into a 100 ml volumetric flask A grade Make up to the 100 ml mark with benzoic acid solution (1 g/l) use a Pasteur
pipette to add the final volume of the benzoic acid solution to the flask. Make sure the bottom of the meniscus of the fluid is on the graduation mark when viewed at eye level. Stopper and mix the solution well by inverting the flask several times.

43 Rinse a clean dry bottle with small quantity of standard solution and transfer the
solution into the bottle. Store in the refrigerator at 2- 08 C. This solution is stable for three months at 2- 08 C
4. Phosphate buffer 100 mmol/l pH 7.0 : Disodium hydrogen phosphate dihydrate [Na2HPO4.2H2O] 12.95 g Anhydrous Potassium dihydrogen phosphate [KH2PO4 ] 4.95 g Sodium azide [NaN3 ] 0.50 g Distilled water to 1 litre Measure about 800 ml of distilled water into a 1 litre volumetric flask Weigh out chemicals and add one by one in the order into the flask. Mix to
dissolve the chemicals Check that the pH is 7.0 ± 0.05 with a pH meter, make up to 1 litre mark with
distilled water and mix well. Transfer the reagent to a clean bottle and label. The reagent is stable for 3-4
months at 2-8 0C 5. Colour reagent(100ml)
4 – Amino phenazone 16 mg Glucose oxidase 1800 units Peroxidase 100 units Phenol 105 mg Tween 20 50 µl Phosphate buffer to 100 ml
To prepare 500 ml of colour reagent:
i. Glucose oxidase (GOD): Available as lyophilised powder and as liquid form. Different products are found in different definitions for units of activity of glucose oxidase. Read the label for the activity. E.g. 250 units/mg Therefore the amount of GOD powder to be weighed to contain 1800 units of GOD is 1800/250=7.2 mg To prepare 500 ml of colour reagent 7.2 x 5 =36 mg is required, weigh out 36 mg of GOD lyophilized powder accurately in a small beaker and dissolve in 10 ml of phosphate buffer carefully.
ii. Peroxidase (POD): Read the label for the activity. E.g. 63 units/mg Therefore the amount of peroxidase powder to be weighed to contain 100 units of POD is 100/63 = 1.58 mg To prepare 500 ml colour reagent 1.58 x 5 = 7.9 mg is required; weigh out 7.9 mg of POD in a small beaker and dissolve in about 10 ml of phosphate buffer.
iii. Transfer about 400 ml of phosphate buffer into a 500 ml volumetric flask iv. Add the glucose oxidase solution into the flask using a funnel. Rinse out the
beaker into the flask with a little of the phosphate buffer to make sure all the GOD is transferred to the flask
v. Add the POD solution into the flask described above ( iv) vi. Weigh out 80 mg of 4 – aminophenazone in a small beaker and transfer into the
flask with rinsing with the phosphate buffer. vii. Weigh rapidly 525 mg of crystalline phenol in a beaker. Transfer into the flask
carefully using the funnel. Rinse the beaker into the flask with phosphate buffer and mix well. Note: Phenol is highly corrosive, toxic and hygroscopic chemical. Therefore handle it with great care. To avoid damaging the balance pan, always remove the beaker when adding or subtracting the chemical. Make sure the stock bottle of phenol is tightly stopperd after use.
viii. Measure 250 µl (0.25 ml) of Tween 20 and add into the flask. Make up to the 500 ml of mark with phosphate buffer, stopper and mix well.
ix. Transfer to a clean brown bottle, label and store at 2-8 C. The reagent is stable for about one month.
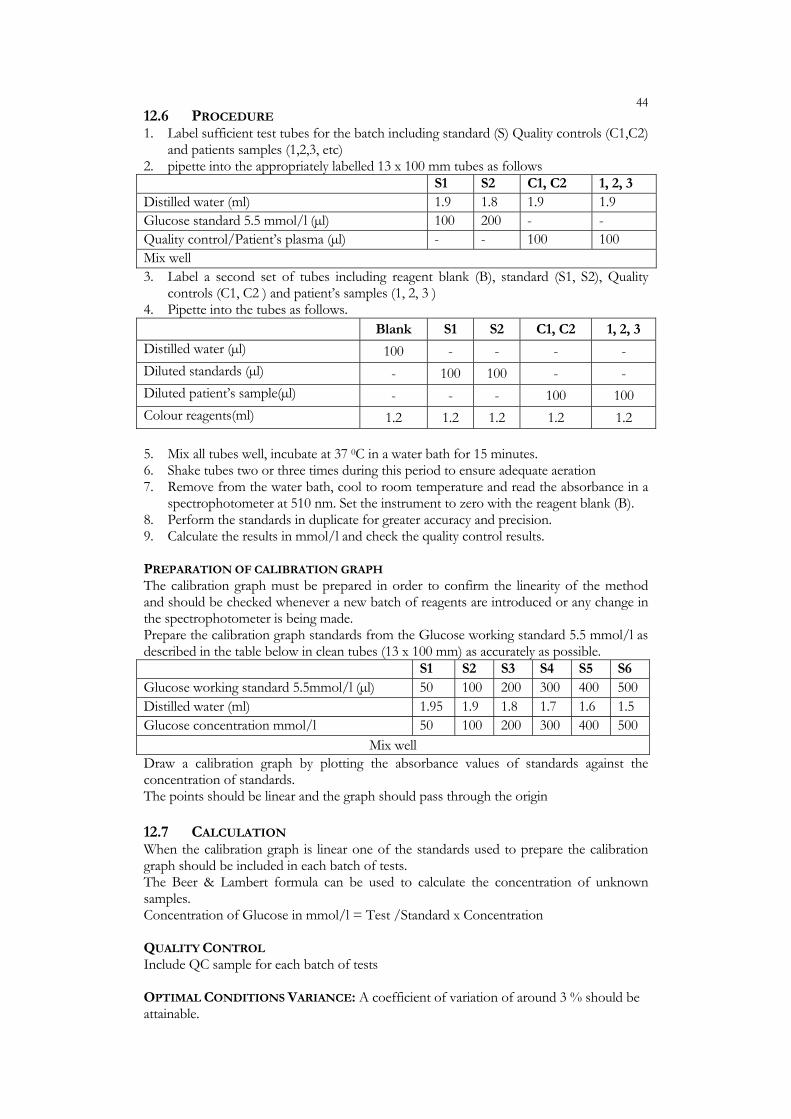
44 12.6 PROCEDURE 1. Label sufficient test tubes for the batch including standard (S) Quality controls (C1,C2)
and patients samples (1,2,3, etc) 2. pipette into the appropriately labelled 13 x 100 mm tubes as follows S1 S2 C1, C2 1, 2, 3 Distilled water (ml) 1.9 1.8 1.9 1.9 Glucose standard 5.5 mmol/l (µl) 100 200 - - Quality control/Patient’s plasma (µl) - - 100 100 Mix well 3. Label a second set of tubes including reagent blank (B), standard (S1, S2), Quality
controls (C1, C2 ) and patient’s samples (1, 2, 3 ) 4. Pipette into the tubes as follows. Blank S1 S2 C1, C2 1, 2, 3 Distilled water (µl) 100 - - - - Diluted standards (µl) - 100 100 - - Diluted patient’s sample(µl) - - - 100 100 Colour reagents(ml) 1.2 1.2 1.2 1.2 1.2 5. Mix all tubes well, incubate at 37 0C in a water bath for 15 minutes. 6. Shake tubes two or three times during this period to ensure adequate aeration 7. Remove from the water bath, cool to room temperature and read the absorbance in a
spectrophotometer at 510 nm. Set the instrument to zero with the reagent blank (B). 8. Perform the standards in duplicate for greater accuracy and precision. 9. Calculate the results in mmol/l and check the quality control results. PREPARATION OF CALIBRATION GRAPH The calibration graph must be prepared in order to confirm the linearity of the method and should be checked whenever a new batch of reagents are introduced or any change in the spectrophotometer is being made. Prepare the calibration graph standards from the Glucose working standard 5.5 mmol/l as described in the table below in clean tubes (13 x 100 mm) as accurately as possible. S1 S2 S3 S4 S5 S6 Glucose working standard 5.5mmol/l (µl) 50 100 200 300 400 500 Distilled water (ml) 1.95 1.9 1.8 1.7 1.6 1.5 Glucose concentration mmol/l 50 100 200 300 400 500
Mix well Draw a calibration graph by plotting the absorbance values of standards against the concentration of standards. The points should be linear and the graph should pass through the origin
12.7 CALCULATION When the calibration graph is linear one of the standards used to prepare the calibration graph should be included in each batch of tests. The Beer & Lambert formula can be used to calculate the concentration of unknown samples. Concentration of Glucose in mmol/l = Test /Standard x Concentration QUALITY CONTROL Include QC sample for each batch of tests OPTIMAL CONDITIONS VARIANCE: A coefficient of variation of around 3 % should be attainable.

45ROUTINE CONDITIONS VARIANCE: This value should not exceed 6 % REFERENCE VALUES Random plasma Glucose level ≤7.8 mmol/l Fasting plasma Glucose level 3.3-6.1 mmol/l Post prandial plasma Glucose level ≤11.1mol/l
12.8 LIMITATION Any sample that gives a glucose value >450 mg/dl should be diluted 1:2 with 0.9 %
Sodium chloride solution and the correct value obtained by multiplying the result by 3. At high plasma levels of uric acid, glutathione and Bilirubin may interfere with the
assay by causing a decrease in glucose values. Ascorbic acid will decrease glucose values by retarding colour development. Do not report results from specimens with suspected interference. Inform the requesting physician of the problem.
PROBLEMS AND PRECAUTIONS In preparation of sugar bottle add correct volume of anticoagulant since NaF inhibit
enzyme activity , excess NaF may lead to falsely low glucose level As the glucose oxidase is enzymatic method the pH of buffer should be 7.0 ,
temperature should be 37 0C and the period of incubation also be accurate as mentioned in the technique
No colour development or low colour development may be due to o Expired colour reagent o Unsuitable or expired glucose oxidase or any other chemicals o Check incubation time and temperature of water bath o Pipetting errors o If the problem is with glucose oxidase chemical then increase the amount of
glucose oxidase in colour reagent preparation and compare the previous standard reading
End product volume is 1.3 ml , ∴ use semi micro cuvette , do not use macro cuvette
12.9 OTHER METHODS COPPER REDUCTION
1. Phosphomolybdate (Folin wu) 2. Arsenomolybdate (Somogyi-Nelson) 3. Neocuproine 4. Alkaline fericyanide method 5. O-Toluidine method
ENZYMATIC 6. Hexo kinase (HK) 7. Glucose oxidase (GOD)-oxygen consumption 8. Glucose dehydrogenase 9. Radiation energy attenuation
OTHER 1. Isotope dilution mass fragmentography
REFERENCES Trinder,p. (1969).Annals of Clin.Biochem.6:24-27 Barham D and Trinder P. (1972). Analyst 97:142-145

46
13. INORGANIC PHOSPHATE
13.1 INTRODUCTION Phosphorus in the form of inorganic or organic phosphate is an important and widely distributed element in the human body. An adult human has approximately 600g (19.4 mol) of phosphate expressed as phosphorus, of which about 85% is in the skeleton and the rest principally in soft tissues. In the soft tissues most phosphate is cellular. Although both inorganic and organic phosphate are present in cells, most is organic and incorporated into nucleic acids, phospholipids and high energy compounds involved in cellular integrity and metabolism. Serum phosphate has a diurnal variation. It is higher in the afternoon and evening. The serum phosphate level is dependent on meals and variation in the secretion of hormones such as parathyroid hormone. Serum calcium and phosphate levels are regulated by the kidneys. The most important intracellular function of phosphate is the high energy bond in adenosine triphosphate. These energy sources maintain many physiological functions such as muscle contractility, neurological functions and electrolyte transport. Phosphate is a constituent of cyclic adenine and guanine nucleotides as well as nicotinamide adenine dinucleotide phosphate, which is important in many enzyme systems. It is an element in phospholipid cell membranes, nucleic acids and phosphoproteins. It is also involved in the regulation of intermediary metabolism of proteins, fats and carbohydrates, as well as in gene transcription and cell growth. Extra cellular phosphate maintains the critical intracellular concentration and provides substrate for bone mineralization. The skeleton serves as a store house for phosphate. The cellular demands for metabolic function in bone cells are similar to those in other cells.
13.2 CLINICAL SIGNIFICANCE Hypophosphataemia is defined as the concentration of inorganic phosphate in the serum below the normal reference interval. Hypophosphatemia does not necessarily imply intracellular phosphate depletion. Hypophosphataemia may be present when cellular levels are normal, and cellular phosphate depletion may exist when serum concentrations are normal or even high. Phosphate depletion may have four general causes Intra cellular shift (A high carbohydrate diet stimulates insulin secretion, increasing the transport of glucose and phosphate into the cell.) Renal Phosphate wasting (Any cause of excessive parathyroid hormone secretion may result in hypophosphataemia due to phosphaturia Decreased intestinal phosphate absorption (Increased loss due to vomiting, diarrhoea and phosphate binding antacids: Decreased absorption in malabsorption syndromes.) Cellular phosphate loss (Acidosis results in catabolism of organic compounds within the cell so that inorganic phosphate shifts into the plasma and excreted in the urine. Hyperphosphatemia is usually due to acute or chronic renal failure because the kidneys fail to excrete the amount taken in the diet. Lack of Parathyroid hormone and increased growth hormone causes increased tubular reabsorption of phosphate results in increased phosphate levels in blood. Increased phosphate intake, increased extra cellular phosphate load in acidosis and any cause leading to cell lysis causes hyperphostaemia

4713.3 PRINCIPLE OF THE METHOD The filtrate obtained after removing proteins by means of trichloro acetic acid is treated with an acid molybdate reagent which reacts with inorganic phosphate to form phosphomolybdic acid. The molybdenum of the phosphomolybdic acid is reduced by means of 1, 2, 4 amino naphtholsulphonic acid to give a blue compound which is measured colorimetrically at 700 nm.
13.4 SPECIMEN TYPE, COLLECTION AND STORAGE Clear, non haemolysed serum is suitable, collect about 4-5 ml blood without haemolysis into a clean container. Ideally specimens should be obtained without the tourniquet from a recumbent fasting patient. Serum should be separated from erythrocytes as soon as possible within 1 hour of collection, as organic phosphate present in erythrocytes are hydrolysed with formation of inorganic phosphate causing the serum concentration to rise. Hydrolysis proceeds more rapidly at room temperature and at 37 0C. Haemolysed samples are unsuitable because erythrocyte contain high concentration of organic phosphates which can be hydrolysed to inorganic phosphate during storage.
13.5 APPARATUS AND CHEMICALS APPARATUS: Centrifuge Spectrophotometer GLASSWARE: Volumetric flasks (100 ml, 200ml, 500 ml) Beakers (5ml, 200 ml, 500ml) Automatic pipette (500 µl, 1000 µl) Graduated pipette (0.5 ml, 1ml, 5ml, 10 ml) Centrifuge tubes 15 ml Test tubes CHEMICALS: Ammonium molybdate-AR 1, 2,4Aminonapthol sulphonic acid Perchloric acid AR Sodium metabisulphite-AR Sodium sulphite-AR Potassium dihydrogen phosphate KH2 PO4 - AR Trichloro acetic acid - AR REAGENTS 1. Reducing agent: Dissolve 12 g of sodium Meta bisulphite and 2.4 g of sodium sulphite in
about 80 ml of distilled water. Add 0.2 g of 1.2.4 amino naphthol sulphonic acid. Dissolve and dilute to 100 ml in volumetric flask. Store in the refrigerator in a brown bottle. The solution keeps up to 4 weeks. It is better prepare fresh reagent ( about 10 ml)
2. Trichloroacetic acid 10 %: Dissolve 10 g of Trichloroacetic acid in water and make up to 100 ml with distilled water. Store in the refrigerator.
3. Perchloric acid AR 4. Ammonium Molybdate 5%: Dissolve 5 g of Ammonium molybdate in distilled water and
make up to 100 ml with distilled water. Store at room temperature. Discard the solution when a precipitate appears.
5. Stock phosphate standard solution 32mmol/l: Keep about 2.5 g of pure potassium dihydrogen phosphate in a dessicator to dry, weigh exactly 2.194 g of potassium dihydrogen phosphate and transfer into a 500 ml flask. Dissolve in distilled water and make up to 500 ml with distilled water. Store at room temperature.
6. Working phosphate standard solution 0.128 mmol/l: Dilute 2 ml of stock phosphate standard to 500 ml with distilled water. Store at room temperature

48 13.6 PROCEDURE 1. Label sufficient centrifuge tubes for quality control (C) and patient’s samples (1, 2, 3) 2. Pipette into tubes as follows C 1, 2, 3
Trichloroacetic acid 10 % (ml) 9.0 9.0 Quality control serum (ml) 1.0 - Patient’s sample (ml) - 1.0 3. Mix well and leave for about 5 minutes. And centrifuge for about 10 minutes 4. Label a set of tubes including reagent blank (B) Standard (S) Quality control (C1, C2)
and patient’s samples (1, 2, 3 …) 5. Pipette into the tubes as follows B S C 1, 2, 3 Trichloro acetic acid 10% (ml) 5.0 - - - Working standard solution (ml) - 5.0 - - Supernatants from tubes above(ml) - - 5.0 5.0 Perchloric acid (ml) 0.4 0.4 0.4 0.4 Ammonium Molybdate 5% (ml) 0.4 0.4 0.4 0.4 Reducing reagent (ml) 0.2 0.2 0.2 0.2 6. Mix the tubes after each addition of reagents. 7. Leave at room temperature for 10 minutes 8. Read the absorbance at 700 nm , set the instrument to zero with tube B
13.7 CALCULATION Concentration of standard is 0.128 mmol/l, serum dilution is 1:10 ∴Concentration of phosphorus = T x 0.128 x 10 S = T x 1.28 mmol/l S
13.8 LIMITATION Glucose phosphate, CPK and other organic phosphates may also be hydrolyzed by assay conditions, resulting in overestimation of inorganic specimens. PRECAUTIONS Glass ware should be properly cleaned and rinsed because phosphate is a common
component of many detergents Discard Ammonium Molybdate solution when a precipitation formed as the bottom
of the container Prepare about 10 ml of reducing agent as it last only for about 1 month

4914. INORGANIC PHOSPHATE IN URINE
14.1 INTRODUCTION Urinary phosphate excretion is more influenced by diet, because a higher proportion of phosphate intake is absorbed from the gut, Over 96 % of the total phosphorus compounds excreted is inorganic, present mostly as a mixture of HPO42- , the proportion varying with the urinary pH. Dihydrogen salts are acidic and monohydrogen alkaline. Dihydrogen salts of calcium and magnesium are more soluble than monohydrogen forms so that the latter precipitate more readily if the urine becomes alkaline.
14.2 PRINCIPLE OF THE METHOD Urine is diluted with distilled water and mixed with ammonium molybdate in acid solution to form ammonium phosphomolybdate a reducing agent containing 1-2-4 amino naphthol salphonic acid, sodium bisulphite and sodium sulphate is then added to reduce the molybdenum phosphate complex to the blue coloured complex. The intensity of the blue colour is measured spectrophotometrically.
14.3 SPECIMEN TYPE, COLLECTION AND STORAGE A 24 hours collection of urine is need. 10 ml of 1 N HCl is added as the preservative APPARATUS, CHEMICALS, GLASSWARE AND REAGENTS ARE AS FOR SERUM
PHOSPHATE ESTIMATION
14.4 PROCEDURE 1. Mix the 24 hours urine collection 2. Measure the total volume of urine 3. Pipette 1 ml of urine into a 100 ml volumetric flask. Make up to 100 ml with distilled
water. 4. Label 3 test tubes for Blank (B), Standard (S) and Test (T) 5. Pipette 5 ml of distilled water into the tube B, 5 ml of standard into the tube S and 5
ml of diluted urine into the tube T 6. Add 0.4 ml of Perchloric acid into each tube, Mix well 7. Then add 0.4 ml of Ammonium Molybdate 5% solution to each tube and mix well 8. Add 0.2 ml of reducing agent to each tube, Mix well and leave for 10 minutes at room
temperature 9. Read the absorbance at 700 nm, setting the spectrophotometer to zero with blank
solution
14.5 CALCULATION Concentration of the Standard = 0.128 mmol/l Urine phosphate = T x 0.128 x 100 mmol/l S = T x 12.8 mmol/l S 24 hour urine phosphate = T x 12.8 x V (24 hour urine volume in litre) mmol/24 hrs
S

50 15. TOTAL PROTEIN
15.1 INTRODUCTION The term ‘ plasma proteins’ describes the very large number of complex molecules that share a common primary structure ; but have an enormous diversity of function .Many of the plasma proteins are classified according to function, e.g. enzymes, clotting factors, acute phase proteins, immunoglobulins complement components, protease inhibitors, apolipoproteins, transport proteins , etc. In addition to special functions the plasma proteins contribute general properties such as buffer capacity and oncotic pressure. Apart from those groups of proteins that have formed the diagnosis and research base for separate disciplines of laboratory medicine. E.g. immunology, relatively few plasma proteins are routinely measured by the diagnostic clinical chemistry laboratory. Some proteins are also measured in ot her body fluids , such as cerebrospinal fluid [CSF], ,and pleural and ascitic fluids. Acute Phase Proteins The term ‘acute phase proteins’ describes a groups of 20 or more apparently unrelated plasma proteins [excluding immunoglobulins] whose concentrations significantly alter in a characteristic fashion following cell injury, e.g. infection, surgery, trauma, tumor growth, tissue necrosis, etc. The acute phase proteins represent part of the complex physiological and metabolic responses by the body to limit further tissue damage [e.g. by proteases free radicals] and to initiate and maintain repair. Most of the proteins rise in plasma concentrations by up to twofold in the days following significant cell injury. Plasma C-reactive protein [CRP] is normally barely detectable and is not stored in the liver, but plasma levels can rise within 5-6h of injury to many hundredfold within 1-2 days [t1/2 2 h] CRP] is able to bind to nuclear material and other debris from damaged cells ,and activates the complement system that leads to inflammation and phagocytosis. The concentration of some plasma proteins often fall during the acute phase response (e.g. albumin by up to 20%, transport proteins: transferrin, thyroxin-binding globulin (TBG), pre albumin) reflecting an increased capillary wall permeability, the shift by hepatocytes to synthesizing acute phase protein and the mobilization of repair mechanisms. ALBUMIN Some 10-15 g/day of albumin [=66.5 kDa] is synthesized by the adult liver, but production can be doubled if severe loss occurs: the liver stores very little albumin .Albumin synthesis is reduced if the plasma concentration of other plasma proteins raises, e.g. acute phase proteins, myeloma. Albumin is distributed mainly in the extra cellular fluid [ECF], with about 40% located in the intravascular compartment. Vascular permeability allows up to 150 g/day to be lost into the ECF, which is then returned via the lymphatic system; losses are more severe in inflammatory conditions. Albumin is mainly catabolized by endothelial tissue, with small losses into the gut [=1g/day] and urine [less than =20 mg /day. Water content of the intravascular compartment affects albumin concentration, e.g. plasma volume expansion in pregnancy, congestive cardiac failure, and liver failure posture. In the latter case plasma albumin concentration can raise 10-15% on standing as water in the lower extremities is lost from vessels due increased hydrostaic pressure; separate reference intervals are advisable for inpatients and ambulant patients. Aprolonged application of a tourniquet for venepuncrure can cause blood stasis and water loss from the distal vein and a rise in albumin concentration of 5-10g/L.
GLOBULINS Electrophoresis of normal serum performed on a carrier such as cellulose acetate reveals four major non-albumin band s staining for protein/lipoprotein, designated by mobility as α1,β1, γ

51Band Concentration (g/L) Major components
α1-globulin 2-5 α1- antitrypsin, Apolipoprotein
α2 –globulins 4-10 Caeruloplasmin, α2macroglobulins,
Haptoglobins
β-globulin 6-12 Transferrin β-lipoproteins
γ-globulins8-16 Immunoglobulins
α1-Antitripsin 1.5 –3.5 g/L
A protease inhibitor [54kDa], a positive acute phase reactant also being increased in liver disease ,pregnancy and by anabolic steroids ,The major diagnostic use is the detection of hereditary deficiency ,low plasma concentrations [homozygotes are 10-15 % of normal heterozygotes are 50-60 %] predisposing individuals to neonatal jaundice ,childhood hepatities , hepatoma. Adult emphysema.
Caeruloplasmin
Caeruloplasmin [copper oxidase, 135k binds up to eight copper atoms which are necessary for the hepatic release of the protein and for oxidase activity]
Apolipoprotein A
α2-Macroglobulin [1.5 –4.0.g/L]
Haptoglobulins [0.5 –3.0 g/L]
Transferrin
Apolipoprotein B
Immunoglobulin
Class MW Concentration (g/L) Antibody function
Ig G 150000 8 -15 Viruses, bacteria, Protects body
spaces, crosses placenta
IgA 160000 1-5 Protects tissue surfaces: gut,
Respiratory tract; in
tears, sweat, saliva
IgM 950000 0.5-2.0 First Ig class to respond to antigens
bacterial, viral
IgD 175000 <150 mg Ag recepter on B Lymphocytes,
antibodies
IgE 190000 =0.3 mg Allergic hypersensitivity
15.2 CLINICAL SIGNIFICANCE
15.3 PRINCIPLE OF THE METHOD Serum proteins form a violet- blue complex with copper ions in alkaline solution. The absorbance of the complex is measured at 540 nm. A method using a sample blank is recommended in order to avoid errors due to turbidity.

52 15.4 SPECIMEN TYPE, COLLECTION AND STORAGE 3 ml clotted blood collected into dry clean glass bottle without applying tourniquet, avoid haemolysis, fasting specimen is desired to decrease lipaemia. Separate the serum from cells as early as possible. Serum is stable at 4 0C
15.5 APPARATUS AND CHEMICALS APPARATUS: Spectrophotometer at wavelength 540 nm or colorimeter with yellow-green filter, Ilford 605(550 nm) GLASSWARE: Volumetric flasks (500 ml and 1 litre volumes) Automatic micro pipettes (50 µl) Graduated pipette (5 ml in 0.1 ml) Measuring cylinders (100ml and 500 ml) Test tubes (150 mm x16 mm) Beaker (250 ml) Polyethylene reagent bottles (I litre) CHEMICALS: Sodium chloride-AR Sodium azide-AR caution: handle with care Sodium hydroxide pellets-AR Copper sulphate pentahydrate-AR Potassium sodium tartrate tetrahydrate-AR Potassium iodide-AR Albumin bovine, a fraction v powder is suitable REAGENTS 1. Sodium hydroxide solution 6 mol/: Dissolve 120 g of sodium hydroxide little by little in
about 400 ml of distilled water. After cooling dilute to 500 ml. Store in a tightly- closed polyethylene bottle. This solution is stable indefinitely at 20 -25 0C(room temperature)
2. Biuret reagent: Dissolve 3.0 g of copper sulphate in about 500 ml of distilled water. Add 9.0 g of potassium sodium tartrate and 5.0 g of potassium iodide. When they have completely dissolved add 100 ml of sodium hydroxide solution ( 6 mol/l) and make up to solution is stable indefinitely at 20 -25 0C(room temperature) store in a tightly closed polyethylene bottle
3. Blank Biuret reagent: Dissolve 9.0 g of potassium sodium tartrate and 5.0 g of potassium iodide in distilled water. Add 100 ml of sodium hydroxide solution (6mol/l) and make up to 1 litre with distilled water. When kept in a tightly-stoppered polyethylene bottle this solution is stable indefinitely at 20 -25 0C(room temperature)
4. Sodium chloride/Sodium azide solution: Weigh out 9.0 g of sodium chloride and 1.0 g of sodium azide, dissolve and make up to 1 litre with distilled water. This solution is stable indefinitely at 20 -25 0C (room temperature)
5. Protein standard 80 g/l: Weigh out about 4.3 g of bovine albumin powder and dry it overnight in the oven at about 60 C. After drying weigh out exactly 4.0 g of dry bovine albumin powder. Float the powder on the surface of about 30 ml of sodium chloride/sodium azide solution in a small beaker. When the albumin has dissolved transfer the solution into a 50 ml volumetric flask (pour slowly down the side of the flask to avoid frothing). Rinse the beaker with small volumes of sodium chloride/sodium azide solution. This solution is stable for 6 months at 2-8 0C. Store in a clean sterile bottle.
15.6 PROCEDURE 1. For the standard and each patient or control sample, pipette into test tubes 2.5 ml of
Biuret reagent (standard and test) and 2.5 ml of blank Biuret reagent (standard and sample blanks)
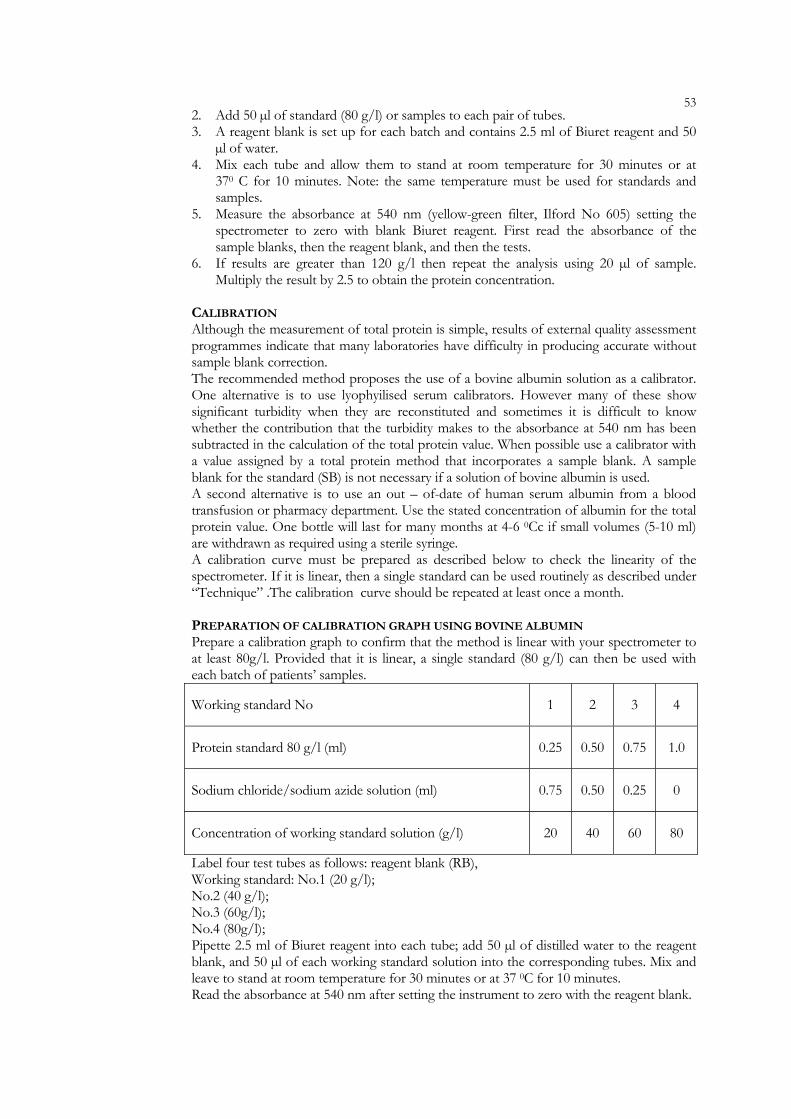
532. Add 50 µl of standard (80 g/l) or samples to each pair of tubes. 3. A reagent blank is set up for each batch and contains 2.5 ml of Biuret reagent and 50
µl of water. 4. Mix each tube and allow them to stand at room temperature for 30 minutes or at
370 C for 10 minutes. Note: the same temperature must be used for standards and samples.
5. Measure the absorbance at 540 nm (yellow-green filter, Ilford No 605) setting the spectrometer to zero with blank Biuret reagent. First read the absorbance of the sample blanks, then the reagent blank, and then the tests.
6. If results are greater than 120 g/l then repeat the analysis using 20 µl of sample. Multiply the result by 2.5 to obtain the protein concentration.
CALIBRATION Although the measurement of total protein is simple, results of external quality assessment programmes indicate that many laboratories have difficulty in producing accurate without sample blank correction. The recommended method proposes the use of a bovine albumin solution as a calibrator. One alternative is to use lyophyilised serum calibrators. However many of these show significant turbidity when they are reconstituted and sometimes it is difficult to know whether the contribution that the turbidity makes to the absorbance at 540 nm has been subtracted in the calculation of the total protein value. When possible use a calibrator with a value assigned by a total protein method that incorporates a sample blank. A sample blank for the standard (SB) is not necessary if a solution of bovine albumin is used. A second alternative is to use an out – of-date of human serum albumin from a blood transfusion or pharmacy department. Use the stated concentration of albumin for the total protein value. One bottle will last for many months at 4-6 0Cc if small volumes (5-10 ml) are withdrawn as required using a sterile syringe. A calibration curve must be prepared as described below to check the linearity of the spectrometer. If it is linear, then a single standard can be used routinely as described under “Technique” .The calibration curve should be repeated at least once a month. PREPARATION OF CALIBRATION GRAPH USING BOVINE ALBUMIN Prepare a calibration graph to confirm that the method is linear with your spectrometer to at least 80g/l. Provided that it is linear, a single standard (80 g/l) can then be used with each batch of patients’ samples.
Working standard No 1 2 3 4
Protein standard 80 g/l (ml) 0.25 0.50 0.75 1.0
Sodium chloride/sodium azide solution (ml) 0.75 0.50 0.25 0
Concentration of working standard solution (g/l) 20 40 60 80
Label four test tubes as follows: reagent blank (RB), Working standard: No.1 (20 g/l); No.2 (40 g/l); No.3 (60g/l); No.4 (80g/l); Pipette 2.5 ml of Biuret reagent into each tube; add 50 µl of distilled water to the reagent blank, and 50 µl of each working standard solution into the corresponding tubes. Mix and leave to stand at room temperature for 30 minutes or at 37 0C for 10 minutes. Read the absorbance at 540 nm after setting the instrument to zero with the reagent blank.

54 Prepare the calibration graph by plotting the absorbance against the protein concentration for each tube.
15.7 CALCULATION S= A standard - A standard blank – A reagent blankT= A sample - A sample blank- A reagent blank The serum protein concentration of sample=T/S x 80 g/l Where 80 is the concentration of the standard (g/l) Conversion from SI to “old” units g/l x 0.1=g/100 ml QUALITY CONTROL At least two quality control specimens, having stated values in the range 40-80 g/l, one of which is unknown to the operator, should be included with each batch of specimens. If single specimens are analysed a control specimen should always be included. OPTIMAL CONDITIONS VARIANCE: A coefficient of variation of around 2% should be attainable. ROUTINE CONDITIONS VARIANCE: The value obtained for the RCV should not exceed 4% REFERENCE VALUES Approximate reference values are 60-80 g/l
REFERENCES Doumas, B.T. (1975) Clin. Chem.., 1159-1166.

5516. UREA
DIACETYLE MONOXIME METHOD
16.1 INTRODUCTION Urea is the major nitrogen containing metabolic product of protein catabolism in humans, accounting for more than 75% of the non protein nitrogen eventually excreted. The biosynthesis of urea from amino nitrogen-derived ammonia is carried out exclusively by hepatic enzymes of the urea cycle. More than 90% of urea is excreted through the kidneys, with losses through the gastrointestinal tract and skin accounting for most of the remaining minor fraction. Urea is neither actively reabsorbed nor secreted by the tubules but is filtered freely by the glomeruli. In a normal kidney, 40 to 70% of the highly diffusible urea moves passively out of the renal tubule and into the interstitium, ultimately to re-enter plasma. The back diffusion of urea is also dependent on urine flow rate; with more entering the interstitium in slow-flow states. Urea production is dependent on several non renal variables such as diet and hepatic synthesis.
16.2 CLINICAL SIGNIFICANCE A wide variety of renal diseases with different permutations of glomerular, tubular, interstitial or vascular damage can cause an increase in plasma urea concentration. The usefulness of urea as an independent indicator of renal function is limited by the variability of its blood levels as a result of non renal factors. Mild dehydration, high protein diet, the increased protein catabolism, muscle wasting as in starvation, reabsorption of blood proteins after a gastrointestinal haemorrhage, treatment with cortisol, and decreased perfusion of kidneys may cause increased blood urea that is called pre renal ureamia. Impaired perfusion may be due to decreased cardiac output or shock secondary to blood loss or other causes.
16.3 PRINCIPLE OF THE METHOD Proteins in whole blood, plasma or serum are precipitated with trichloroacetic acid. The urea in the supernatant reacts with diacetyle monoxime in the presence of thiosemicarbazide and cadmium ions under acid conditions. The absorbance of the resulting rose-purple solution is measured at 530 nm.
16.4 SPECIMEN TYPE, COLLECTION AND STORAGE 3 ml of clotted blood collected into clean dry bottle avoid haemolysis. Separate serum from cells. Urea is stable for 24 hours at room temperature (250C), for 7 days at 2-60C, for longer duration (2-3 months) when frozen. As referral sample send about 0.5 ml clear serum, kept cool, to reach correct destination within 24 hours.
16.5 APPARATUS AND CHEMICALS APPARATUS: Water bath or heating block (temperature range 10- 110 0C) Spectrophotometer wavelength 530 nm Colorimeter green filter, Ilford 604 (520nm) Rack for boiling tubes GLASSWARE: Amber coloured reagent bottles (500 ml volume) Graduated pipettes (5 and 10 ml in 0.1 ml) Graduated cylinders (50 ml, 100 ml and 500 ml) Volumetric flasks (50 and 100 ml and 500 ml volumes) Automatic micro pipettes (50 and 100 µl) Glass stoppered boiling tubes (160 x 18 mm)
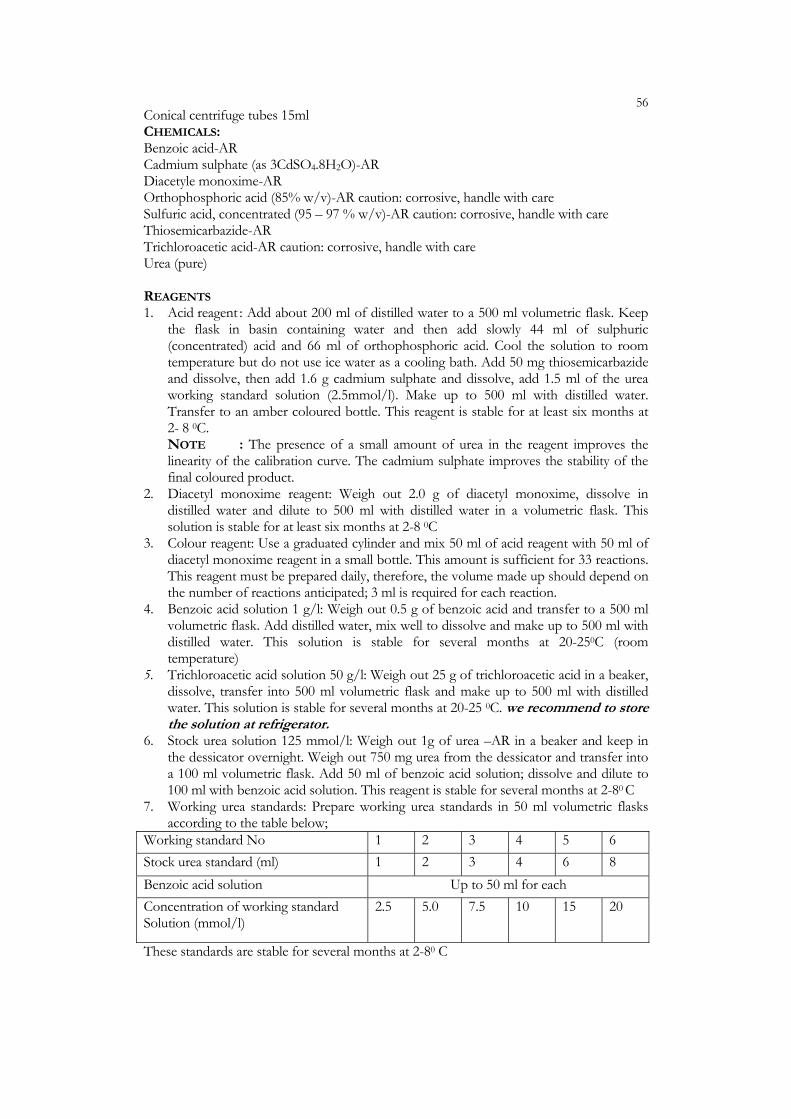
56
t
Conical centrifuge tubes 15ml CHEMICALS: Benzoic acid-AR Cadmium sulphate (as 3CdSO4.8H2O)-AR Diacetyle monoxime-AR Orthophosphoric acid (85% w/v)-AR caution: corrosive, handle with care Sulfuric acid, concentrated (95 – 97 % w/v)-AR caution: corrosive, handle with care Thiosemicarbazide-AR Trichloroacetic acid-AR caution: corrosive, handle with care Urea (pure) REAGENTS 1. Acid reagent : Add about 200 ml of distilled water to a 500 ml volumetric flask. Keep
the flask in basin containing water and then add slowly 44 ml of sulphuric (concentrated) acid and 66 ml of orthophosphoric acid. Cool the solution to room temperature but do not use ice water as a cooling bath. Add 50 mg thiosemicarbazide and dissolve, then add 1.6 g cadmium sulphate and dissolve, add 1.5 ml of the urea working standard solution (2.5mmol/l). Make up to 500 ml with distilled water. Transfer to an amber coloured bottle. This reagent is stable for at least six months at 2- 8 0C. NOTE : The presence of a small amount of urea in the reagent improves the linearity of the calibration curve. The cadmium sulphate improves the stability of the final coloured product.
2. Diacetyl monoxime reagent: Weigh out 2.0 g of diacetyl monoxime, dissolve in distilled water and dilute to 500 ml with distilled water in a volumetric flask. This solution is stable for at least six months at 2-8 0C
3. Colour reagent: Use a graduated cylinder and mix 50 ml of acid reagent with 50 ml of diacetyl monoxime reagent in a small bottle. This amount is sufficient for 33 reactions. This reagent must be prepared daily, therefore, the volume made up should depend on the number of reactions anticipated; 3 ml is required for each reaction.
4. Benzoic acid solution 1 g/l: Weigh out 0.5 g of benzoic acid and transfer to a 500 ml volumetric flask. Add distilled water, mix well to dissolve and make up to 500 ml with distilled water. This solution is stable for several months at 20-250C (room temperature)
5. Trichloroacetic acid solution 50 g/l: Weigh out 25 g of trichloroacetic acid in a beaker, dissolve, transfer into 500 ml volumetric flask and make up to 500 ml with distilled water. This solution is stable for several months at 20-25 0C. we recommend to storehe solution at refrigerator.
6. Stock urea solution 125 mmol/l: Weigh out 1g of urea –AR in a beaker and keep in the dessicator overnight. Weigh out 750 mg urea from the dessicator and transfer into a 100 ml volumetric flask. Add 50 ml of benzoic acid solution; dissolve and dilute to 100 ml with benzoic acid solution. This reagent is stable for several months at 2-80 C
7. Working urea standards: Prepare working urea standards in 50 ml volumetric flasks according to the table below;
Working standard No 1 2 3 4 5 6 Stock urea standard (ml) 1 2 3 4 6 8 Benzoic acid solution Up to 50 ml for each Concentration of working standard Solution (mmol/l)
2.5 5.0 7.5 10 15 20
These standards are stable for several months at 2-80 C

57PREPARATION OF CALIBRATION GRAPH In this method the formation of the coloured product depends on the composition of the colour reagent and the period of heating at 100 0C. Small variations may occur from day to day and it is therefore essential to check the calibration each time that patients’ samples are analysed. When you are familiar with the shape of the calibration graph on your spectrometer you may find that you can omit some of the standards, e.g. prepare your daily calibration using for example the 5, 10 and 20 mmol/l standards, or use the 10 mmol/l standards should be prepared when the acid reagent and diacetyl monoxime reagent are renewed to check that the reagents are correct. Follow the procedure described under “Procedure”. Plot the absorbance of each tube on the vertical axis against the concentration of the working urea standard solutions in mmol on the horizontal axis.
16.6 PROCEDURE 1. Pipette 0.5 ml of trichloroacetic acid solution using a rubber bulb into centrifuge tubes
for each standard, control serum and patient’s sample. Add 50 µl of standard, control serum or patient’s sample to the appropriate tube, mix and leave at room temperature for 5 minutes, then centrifuge to obtain a clear supernatant.
2. Label another set of tubes (18 x 160mm) and pipette 3.0 ml of colour reagent into test tubes for each standard, blank, control serum and sample.
3. Add 100 µl of trichloroacetic acid solution to the blank tube, and 100 µl of supernatants form the standards, controls or samples to the appropriate tube.
4. Mix well and heat at 100 0C for 15 minutes exactly. 5. Cool the tubes to room temperature in a bowl of water (about 5 min) mix and read the
absorbance at 530 nm (green filter, Ilford No 604) first read the absorbance of the blank against distilled water and note down the reading, then set to zero with the blank and read the standards and unknowns. The absorbance measurements should be made as soon as possible and not more than 30 minutes after the end of step 4.
16.7 CALCULATION Read the results from the calibration curve or use the following formula if your calibration graph is linear. Concentration of urea in mmol/l = T x C S Where: T = Absorbance reading of patient’s test S = Absorbance reading working standard (10 mmol/l) C = Concentration of working standard (10 mmol/l) If the result is greater than 20mmol/l, dilute 50 µl of supernatant from that sample with 100 µl of trichloroacetic acid solution. Mix well. Repeat the analysis using 3 ml of colour reagent and 100 µl of the diluted supernatant. Remember to multiply the result by 3 to obtain the urea concentration in the patient’s sample. QUALITY CONTROL At least two serum control specimens, having stated values in the range 3-20 mmol/l, one of which is unknown to the operator, should be included with each batch of specimens. If single specimens are analysed, a control specimen should always be included. OPTIMAL CONDITIONS VARIANCE: A coefficient of variation of around 3% should be attainable. ROUTINE CONDITIONS VARIANCE: The value obtained for the RCV should not exceed 6%
58 REFERENCE VALUES Approximate reference intervals for “healthy” ambulant adults: 2.1-7.1 mmol/l Conversion of SI units into “old” units: mmol/l x 6 = mg/100 ml
NOTE: The method recommended uses the reagents described in the above references. However a protein precipitant has been included because the direct method (No protein precipitation) gave results on patients’ samples which were significantly higher than other methods.
16.8 LIMITATION Cadmium sulphate has been included as recommended by Wybenga et al. In the absence of cadmium ions, the absorbance decreased by about 7 % in 30 minutes; when the colour reagent is prepared as described, then the absorbance decreased by about 4% in 30 minutes. Provided that the batch size is kept small, so that the absorbance readings can be made over a period of a few minutes, the presence or absence of cadmium ions has little, if any effect on the results.
REFERENCES WHO Manual LAB/86.3
5917. URIC ACID
PHOSPHOTUNGSTATE REDUCTION –CARAWAY METHOD
17.1 INTRODUCTION Uric acid is the end product of purine metabolism (adenine,guanine) in the human. On a normal diet some 5-6 mmol of urate is produced daily.Of this amount about 3-4 mmol is produced from purines synthesized in the body (de novo synthesis), whilst the remaining 1-2 mmol are contributed by dietary purines. The purine base (adenine,guanine,hypoxanthine,etc.) is a double ring structure assembled from a variety of precursors: glutamine, glycine, aspartate, tetrahydrofolate and bicarbonate. A base attached to a pentose (ribose) is a nucleoside (e.g. adenosine), while a phosphate ester of a nucleoside is termed a nucleotide (e.g. adenosine monophosphate, AMP). Purine ring is assembled on ribose phosphate; the committed step being the formation of 5 – phosphoribosylamine from 5- phosphoribosylpyrophosphate(PRPP) and glutamine by the enzyme PRPP amidotransferase(PRPP-AT) –the PRPP being previously synthesized from ribose 5- phosphate by PRPP synthetase. The enzyme PRPP-AT is subjected to negative feedback control by inosine monophosphate(IMP), guanosine monophosphate(GMP) and AMP, and is stimulated by PRPP(IMP,AMPand GMP also inhibit PRPPsynthetase). After a number of intermediate reactions, which utilize adenosine triphosphate (ATP), AMP is formed. GMP and AMP are formed from IMP. In addition to this de novo synthesis, free purine bases are also formed by hydrolytic degradation of nucleic acids and nucleotides; and purine nucleotides can be synthesized from these bases by a salvage pathway involving two enzymes: hypoxanthine-guanine phosphoribosyl transferase(HGPRT) and adenine phosphoribosyl transferase (APRT). HGPRT synthesizes IMP and GMP from guanine and hypoxanthine and APRT synthesize AMP from adenine- the other sbstrate in both cases is PRPP. These two pathways do not require ATP and thus there is an energy saving compared with de novo synthesis (PRPP to IMP utilizes four molecules of ATP) Urate, the end product of purine base degradation, is formed from xanthine by the enzyme xanthine oxidase.Xanthine is in turn formed from hypoxanthine(purine base of inosine) by xanthine oxidase and from guanine by guanase.Adenosine enters the degradation cycle by convertion to inosine by adenosine deaminase(ADA). Xanthine oxidase also acts on adinine to form 2, 8-dioxyadenine. Around 25-30% of the 5-6mmol of urate produced daily is eliminated via the gastrointestinal tract, where it is degraded by bacterial uricases. The remainder is excreted by the kidney. In renal failure the intestinal excretion can be markedly increased. The renal clearance of urate is of the order of 5-10% of inulin clearance. Some 98% of the filtered urate is reabsorbed in the proximal tubule. The 2% that escapes reabsorption contributes around 20% of the total excreted, proximal tubular secretion accounting for the remainder. Minor reabsorption also occurs in the distal nephron Renal clearance is influenced by various drugs and metabolic products.
17.2 CLINICAL SIGNIFICANCE Hyperuricemia is most commonly defined by serum or plasma uric acid concentrations greater than 7.0 mg/dL (0.42 mmol/L) in men or greater than 6.0 mg/dl (0.36 mmol/l) in women (if specific methods are used to measure the uric acid). Asymptomatic hyperuricemia is frequently detected through biochemical screening; Long term follow up of asymptomatic hyperuricemic patients is undertaken because many are at risk for renal

60 disease that may develop as a result of hyperuricemia or hyperuricosuria; few of these patients ever develop the clinical syndrome of gout. Gout occurs when monosodium urate precipitates from supersaturated body fluids;the deposits of urate are responsible for the clinical signs and symptoms.Gouty arthritis may be associated with urate crystals in joint fluid as well as with deposits of crystals(tophi) in tissues surrounding the joint. The deposits may occur in soft tissues as well , and wherever they occur they elicit an intense inflammatory response consisting of polymorphonuclear leukocytes and macrophages.Renal disease associated with hyperuricemia may take one or more of several forms: (1)gouty nephropathy with urate deposition in renal parenchyma,(2)acute intratubular deposition of urate crystals, and (3) urate nephrolithiasis Hyperuricemia is also attributable to primary defects of enzymes in the pathways of purine metabolism.
17.3 PRINCIPLE OF THE METHOD Serum proteins are precipitated with acid tungstate and a clear supernatant is obtained after centrifugation. A portion of the supernatant is added to alkaline phosphotungstate. Phosphotungstate reagent oxidizes the urate to allantoin and it self reduced to tungsten blue which is measured by its absorbance at 700 nm
17.4 SPECIMEN TYPE, COLLECTION AND STORAGE 4ml of clotted blood, collected into clean dry bottle, avoid haemolysis. Separate the serum from cells as early as possible. Uric acid in serum is stable for 48-72 hours at room temperature (250C), for 3-7 days at 4-6 0C and for 6-7 months when frozen. As referral sample send about 1 ml of clear serum, kept cool, to reach the correct destination within 24 hours
17.5 APPARATUS AND CHEMICALS APPARATUS: Water bath at 25 0C or Basin with water temperature maintained at 250C GLASSWARE: Conical centrifuge tubes (15ml) Test tubes 16 x 150 mm Quick fit complete assembly (round bottom flask and condenser) for refluxing Volumetric flask 100 ml, 200 ml and 1 L Graduated pipettes 1 ml, 5 ml and 10 ml Automatic micro pipette 500 µl CHEMICALS: Molybdate free sodium tungstate dihydrate-AR Orthophosphoric acid-AR Sodium carbonate-AR Sulphuric acid-AR Uric acid –AR REAGENTS 1. Stock Phosphotungstic acid reagent: Weigh out 50 g of molybdate free sodium tungstate
dihydrate or 44.5 g anhydrous salt and dissolve in about 400 ml of distilled water in refluxing flask. Add 40 ml of Orthophosphoric acid (concentrated). Mix well and reflux gently for 2 hours. Allow the solution to cool. Then transfer with rinsing to a 500 ml volumetric flask. Make up to 500 ml with distilled water. Mix well. Transfer this solution into a clean dry brown bottle. This solution is stable in the refrigerator for about one year.
2. Working Phosphotungstic acid reagent: Dilute 10 ml of stock phosphotungstic acid reagent to 100 ml with distilled water. Transfer in to a clean, dry brown bottle. Stable in the Refrigerator for two weeks.

61 3. Sodium carbonate 10g/dl: Weigh 10 g of Sodium carbonate anhydrous, dissolve in distilled
water and make up to 100 ml with distilled water. Store in a poly propylene bottle. 4. Sodium tungstate 10g/dl: Weigh out 10 g Sodium tungstate dihydrate, transfer into a
100ml volumetric flask, dissolve and make up to 100 ml with distilled water. Store in a brown bottle.
5. Sulphuric acid (2/3 N) 0.33mol/l: Add slowly 3.7 ml of sulphuric acid concentrated in to 150 ml distilled water in a beaker. Cool and stir well. Transfer in to a 200 ml volumetric flask and make up to 200 ml distilled water. Transfer in to a brown bottle.
6. Acid tungstate reagent: To 80 ml of distilled water while mixing add 5 ml of sodium tungstate solution, 0.05 ml of phosphoric acid (concentrated), 5 ml of 2/3 N sulphuric acid solution. Transfer in to a brown bottle. Keep at room temperature.
7. Stock Uric acid standard solution 1.5mmol/l: Keep about 300 mg of uric acid analytical grade chemical in a desiccator overnight. Weigh out 252.2 mg of uric acid and transfer in to a one litre volumetric flask. Weigh out 150 mg of Lithium carbonate; dissolve in about 50 ml of distilled water. Filter, heat the filtrate to 60 0C. Add this warm solution to the volumetric flask containing uric acid. Mix until the uric acid completely dissolved. Allow the flask to cool. Then add 20 ml formaldehyde 40 % solution. Add 500 ml of distilled water .Then add slowly 25 ml of sulphuric acid solution. (Prepared by adding 1 ml of sulphuric acid (concentrated) to 35 ml of water) Make up to one litre with distilled water. Mix and store in a brown bottle. This solution is stable for about one year at 4- 6 0C.
8. Working uric acid standard: Allow the stock uric acid standard solution to attain the room temperature. Pipette 2 ml of stock standard solution in to 100 ml volumetric flask. Make up to 100 ml with distilled water. This standard is equivalent to 300 µmol/l under the assay conditions employed. Solution is stable for one week at 4-6 0C.
9. Working Uric acid standard series for calibration: Prepare working standard series by quantitative transfer of 1ml, 2ml, 3ml and 4 ml of stock solution to each of four 100 ml volumetric flasks. Dilute to 100 ml with distilled water. Mix well. These standards are equivalent to 150µmol/l, 300µmol/l, 450µmol/l and 600µmol/l under the employed assay condition.
17.6 PROCEDURE 1. Pipette 4.5 ml of acid tungstate regent in to centrifuge tubes for each quality control
sample and patient’s sample. 2. Pipette 0.5 ml of quality control serum or patients sample to the appropriate tube with
mixing. 3. Leave at room temperature for 10 minutes and centrifuge for 10 minutes at 3000 rpm
to obtain a clear supernatant. 4. Label a set of test tubes for each blank, standard, quality control sample and patient’s
samples. 5. Pipette 2.5ml of distilled water to the tube marked blank, 2.5ml of working standard to
the tube marked Standard, and 2.5 ml supernatants from the quality control sample or patients’ samples to the appropriate tube.
6. Add 0.5 ml of Sodium carbonate solution to all tubes, mix well and allow standing for 10 min at 25 0C.
7. Then add 0.5 ml of working phosphotungstic acid reagent to all tubes. Mix immediately. Allow to stand at 250C for 30 min.
8. Measure the absorbance at 700 nm, setting the spectrophotometer to zero with blank solution.
PREPARATION OF CALIBRATION GRAPH Run the uric acid working standards together with the regent blank exactly in the same manner as describe under technique. Plot the absorbance values of standards against the

62 concentration of standards. The points should be linear and the graph should pass through the origin.
17.7 CALCULATION Calculate the uric acid concentration in the patient’s specimens from the absorbance of the standard as follows Concentration of Uric acid in µmol/l= T/S x C=T/S x 30 x 10=T/S x 300 µmol/l Where T= Absorbance of patient’s test S=Absorbance of working standard C=Concentration of working standard (30µmol/l) Serum dilution 1:10 QUALITY CONTROL Include Quality control sera for each batch of test
17.8 LIMITATION Haemolysed sera interfere with the measurement of uric acid. Supernatants should be clear as turbidity may interfere with colour development
18. URINE URIC ACID
Method similar to used for serum uric acid can be applied to urine uric acid estimation
18.1 SPECIMEN TYPE, COLLECTION AND STORAGE Collect 24 hour urine into a clean, dry, sterile 2.5 L bottle and keep in the refrigerator during the collection.
18.2 PROCEDURE 1. Mix the urine collection well. Measure the total volume. Warm an aliquot of
urine for a few minutes to 600C to dissolve any urates in the deposit. Add 1ml of urine in to a 100ml volumetric flask. Make up to 100ml with distilled water. Mix well. (Dilution 1in 100)
2. Pipette 2.5 ml of distilled water to the tube marked B for blank , 2.5 ml of working standard to the tube marked S as standard and pipette 2.5 ml of diluted urine in to the tube marked T for test.
3. Carry out the same procedure as for serum uric acid estimation.
18.3 CALCULATION Calculate urine uric acid concentration in the sample using the absorbance of the standard as follows. Urine uric acid concentration µmol/l = T/S x C Where T = Absorbance of patients test
S = Absorbance of working standard C = Concentration of working standard Urine dilution 1:100
Urine Uric acid µmol/l = T/S x 30 x 100 Urine Uric acid (mmol/l) = T/S x 30 x 100 1000 24 hour urine uric acid =T/S x 30 x100 x 24 hour urine volume in litre (mmol/24 hour) 1000

6319. ELECTROLYTES
DETERMINATION OF SERUM SODIUM AND POTASSIUM BY FLAME PHOTOMETRY
[FLAME EMISSION SPECTROSCOPY]
19.1 INTRODUCTION SODIUM In a normal adult the total body sodium is about 55mmol/kg of body weight; about 30% is tightly bound in the crystalline structure of bone and thus is nonexchangeable. Thus only 40 mEq/kg is exchangeable among the various compartments and accessible to measurements. The exchangeable sodium is distributed primarily in the extra cellular space. About 97% to 98% of the exchangeable sodium is found in the extra cellular water space and only 2% to 3% in the intracellular water space. Approximately 16% of exchangeable sodium is in plasma, 41% is in interstitial fluid (ISF) that is readily accessible to the plasma compartment, 17% is in ISF of dense connective tissue and cartilage, 20% is in ISF of bone and 3% to 4% in the transcellular water compartment. Total bone sodium (exchangeable and nonexchangeable) accounts for the 40% to 45% of the total body sodium. The amount of sodium in the body is a reflection of the balance between sodium intake and output. Sodium intake depends on the quantity and type of food intake. Under normal conditions, the average adults takes in about 50 – 200 mmol of sodium/ day. Sodium output occurs through three primary routes; the gastrointestinal tract, the skin and the urine. Under normal circumstances loss of sodium through the GIT is very small. Faecal water excretion is only 100- 200 ml/day for a normal adult and faecal sodium excretion only 1 to 2 mmol/ day. However, one should bear in mind that although losses of water and electrolytes are normally small, the total volume of GIT fluid secreted is large, averaging about 8 L/day. Almost all this volume is normally reabsorbed. However, with impaired GIT reabsorption, loss of water and electrolytes are large. Thus with severe diarrhoea or with gastric or intestinal drainage tubes, sodium loss via the GIT may exceed 100mmol/ day. The sodium content of sweat averages about 50 mmol/ L but is somewhat variable. The sweat sodium concentration is decreased by aldosterone and increased in cystic fibrosis. The rate of sweat production is highly variable, increasing in hot environments, during exercise, and with fever. Under extreme conditions sweat production can exceed 5 L/ day, accounting for a loss of more than 250 mmol of sodium .Under normal conditions, in a cool environment; sodium losses from the skin are small. With extensive burns or exudative skin lesions there is great loss of sodium and water. Major route of sodium excretion is through the kidney. Furthermore, urinary excretion of sodium is carefully regulated to maintain body sodium homeostasis, which in turn is critical to control of extra cellular volume. Sodium is freely filtered by the glomerulus. Approximately 70% of the filtered sodium is reabsorbed by the proximal tubule, about 15% by the loop of henle, 5% by the distal tubule, 5% by the cortical collecting tubule, and another 5% by the medullary collecting duct; thus normally less than 1% of the filtered sodium is excreted. POTASSIUM Approximately 98% of the total body potassium is found in the intracellular water space (ICW),reaching a concentration there of about 150 to 160 mmol/ l .In the ECW space ,the concentration of potassium is only 3.5 to 5 mmol/l . Total body potassium in an adult male is about 50 mmol/kg of body weight and is influenced by age, sex, and very importantly muscle mass, since most of the body’s potassium is contained in muscle. The difference in potassium concentration between plasma and ISF is attributable to the Gibbs-Donnan equilibrium. The difference in potassium concentration in ISF and ICF is
64 the result of active transport potassium into the cell in exchange for sodium. Factors that enhance potassium transport into the cell and there by increase the ratio of IC to EC potassium are insulin, aldosterone, alkalosis, and beta – adrenergic stimulation. Factors that decrease potassium transport into the cell or enhance leakage out of the cell include acidosis, alfa- adrenergic stimulation and, tissue hypoxia. The amount of potassium in the body is a reflection of the balance between potassium intake and output. Potassium intake depends on the quantity and type of food intake. Under normal conditions the average adult takes in about 50 to 100 mmol/ day, about the same amount as sodium. Potassium output occurs through three primary routes; the gastrointestinal tract, the skin and the urine. Under normal circumstances loss of potassium through the GIT is very small, amounting to less than 5mmol/day for an adult. The concentration of potassium in the sweat is less than that of sodium, and so potassium losses via the skin are usually small. The major means of potassium excretion is by the kidney. The kidney is capable of regulating the excretion of potassium to maintain body potassium homeostasis.
19.2 CLINICAL SIGNIFICANCE SODIUM Hyponatremia occurs when there is a greater excess of extra cellular water than of sodium or a greater deficit of sodium than water. The symptoms of hyponatremia depend on the cause, magnitude, and rate of fall in serum sodium. With acute, pronounced hyponatremia caused by water intoxication,nausea, vomiting, seizures, and coma occur. Symptoms are less fulminant with chronic hyponatremia caused by salt depletion. With progressively severe degrees of chronic hyponatremia, constant thirst, muscle cramps, nausea, vomiting, weakness, lethargy, and finally delirium and impaired consciousness occur. Hypernatremia occurs when there is greater deficit of extra cellular water than of sodium. Greater excess of sodium than of water rarely occurs. Hypernatremia usually occurs as a chronic process secondary to loss of water in excess of sodium. Symptoms are therefore those of dehydration. POTASSIUM POTASSIUM EXCESS Potassium accumulates in the body when the intake of potassium exceeds output because of some abnormality of the potassium homeostatic mechanism. It should be noted that under most conditions the normal kidney is capable of excreting a great deal of potassium, and a high potassium intake leads to potassium retention only when kidney function is compromised. POTASSIUM DEPLETION This occurs when potassium output exceeds intake. Only small amount of potassium is loss in the faeces under normal conditions. GIT loss of potassium during diarrhoea and drainage of GIT secretions can be large. Alkalosis results in the total body potassium depletion. With alkalosis, potassium moves from the EC to the IC space. In the cells of the distal nephrone of the kidney, this increase in IC potassium stimulates potassium secretion and therefore increases renal excretion of potassium.
19.3 PRINCIPLE OF THE METHOD Using compressed air diluted serum is sprayed as a fine mist of droplets in to a non luminous flame. In the flame the elements in the compound are converted in to the atomic state. As the temperature rises due to the thermal energy of the flame, a small portion of these atoms excited and the electrons moves to higher energy level. When atoms excited they emit light in the form of a fixed wavelength to produce a spectrum. Light emitted
65from the thermally excited ions is directed to photo sensitive detector system. The amount of light emitted depends on the concentration of metallic ions present. The response compared with those obtained from standards.
19.4 SPECIMEN TYPE, COLLECTION AND STORAGE Sample suitable is Haemolysis free serum. Blood collected into Clean, dry bottle or commercially available evacuated tubes or capillary blood collected in either micro tube or capillary tubes. Blood should not be collected from the arm receiving an electrolyte or intravenous infusion. Avoid muscle activity (clenching the fist) when collecting the blood sample as this can artificially increase the potassium values. Blood specimens should not chilled before separation of serum, false increase in potassium level occurs as a result of K+ leakage from erythrocytes and other cells. Serum should be separated from cells immediately within 1 h of collection at room temperature. Blood samples should not be centrifuge for longer time. Grossly lipaemic serum samples are unsuitable for electrolyte estimation and should be ultra centrifuged. Serum samples should be stored at 20C to 40C or frozen for delayed analysis.
19.5 APPARATUS AND CHEMICALS APPARATUS: Analytical balance Flame photometer Automatic micro pipette 100µl GLASSWARE: Conical flasks 50 ml Graduated pipette 25 ml Disposable sample cups (plastic) CHEMICALS: Sodium chloride (Analytical grade) Potassium chloride (Analytical grade) REQUIREMENTS (ENVIRONMENTAL CONDITIONS) TEMPERATURE : Operating 100C to 35 0C HUMIDITY : Operating 85% maximum at 350 C FUEL : High grade propane should be free of heavy hydrocarbon deposits and
regulated at the cylinder to approximately 2.1 kg/cm2 (30 psig) AIR : A supply of clean air at a minimum pressure of 1 kg/cm2 (14 psig) at 6
litres /minute, as supplied by a Corning 850 Air Compressor. Maximum inlet pressure 2.1 kg/cm2 (30 psig).If condensation problems arises a ‘Corning 856 Air Compressor’ should be used, which has a water separator fitted.
VOLTAGE : 90V to 127V or 198V to 264 V, 50/60Hz POWER : 20VA, 410 only REAGENTS All glassware used to prepare standard solutions should be chemically cleaned and finally rinsed with distilled water. Weigh out separately in to two watch glasses or in to two Petri dishes about 15 g of analytical grade Sodium chloride and about 1 g of Potassium chloride. Dry for 6 hours at 100 0C in an oven and allowed to cool to room temperature in a desiccator. 1. Stock Sodium solution 1000 mmol/l: To prepare 200ml, weigh accurately 11.7 g of
dried Sodium chloride in a weighing bottle or in a beaker. Transfer it in to an ‘A grade’ 200 ml volumetric flask using a funnel. Wash in any chemical remaining in the weighing bottle or in the beaker in to the flask with a little amount of distilled water (glass distilled water) or deionised water. Dissolve in about 150 ml of distilled water

l t
l
i i
66 and make up to 200 ml with distilled water. Use a pasture pipette or a wash bottle to add the final volume of distilled water to the flask. Mix the solution well by inverting the flask for several times.
2. Stock Potassium so u ion 100 mmol/l: Weigh accurately 0.746 g of dried Potassium chloride in a weighing bottle or beaker. Transfer it in to an ‘A grade’ 100 ml volumetric flask using a funnel. Wash any remaining in the weighing container in to the flask with distilled water. Dissolve in about 80 ml of distilled water. Make up to 100 ml with distilled water. Use a Pasture pipette or a wash bottle to add the final volume of distilled water to the flask. Mix the solution well by inverting the flask for several times.
3. F ame photometry deproteinising solution: The pack of deproteinising solution contains Deproteinising base solutions and Sacher of catalyst. For use add the catalyst into base solution and mix thoroughly. This solution is stable for 4 weeks at 2-80 C.
4. Working Standard solution (Sodium-140 mmol/l, Potassium-5.0 mmol/l): Into a clean 500 ml ‘A grade’ volumetric flask, add 70 ml of stock solution-1(Stock sodium solution) and 25 ml of stock solution-2 (Stock potassium solution) Make up to 500 ml with good quality distilled water or deionised water. Use a pasture pipette or a wash bottle to add the final volume of distilled water to the flask. Mix the solution well by inverting the flask for several times. Rinse a prolypropylene bottle with little of the prepared solution. Then transfer the standard solution into the bottle. Label and keep at room temperature. (Contamination with sodium may occur if a glass bottle is used) Stopper the bottle tightly to avoid evaporation.
5. Working diluent concentrate: Diluent concentrate recommended by the manufacturer should be used. For ‘Corning 410 C’ Corning diluent concentrate is used. Pipette 0.5 ml diluents concentrate in to clean 500 ml volumetric flask. Dilute up to 500 ml with good quality distilled water or deionised water. Store the working diluent concentrate in a polypropylene bottle. This solution is stable for 5 days at room temperature.
19.6 PROCEDURE The details of the operation vary from one instrument to another. Following steps are related to ‘Corning 410’ clinical model flame photometer. 1. Sample d lut on: Dilute each serum, quality control sample and working standard
solution 1:200 with working diluent concentrate. Into 50 ml conical flasks pipette 19.9 ml of working diluent concentrate and 0.1 ml of working standard solution or quality control sample or patient’s serum and mix well.
2. Turn on the fuel supply at source 3. Depress the ‘power’ switch to switch on the instrument 410. The ‘power on’ LED will
be illuminated, the air compressor will start an ignition cycle will commence. 4. If the flame on LED is not illuminated at the end of the ignition cycle, (Refer the
operator’s manual available with the instrument) check that the air pressure gauge indicates a reading between 11 and 13 psig, if it does not, lower the air regulator locking ring and adjust the regulator for a reading of 12 psig on the air pressure gauge. Raise the locking ring to lock the air regulator adjuster.
5. Set the filter selector to the required position. Non luminous blue flame with distinct cones can be seen, if does not; adjust the fuel to get distinct blue cone flame.
6. Insert the nebulizer inlet tube in a beaker containing approximately 100 ml of diluent and allow 15 minutes for the operating temperature to stabilize. This will ensure a stable burner temperature when solutions are aspirated, after the warm up period.
7. While aspirating the diluent, adjust the ‘blank’ control so that the display reads zero 8. Aspirate a pre diluted standard solution 9. Allow 20 seconds for a stable reading and then adjust ‘coarse’ and ‘fine’ controls for a
convenient reading (if a 140 mmol/l Sodium standard is aspirated, set the display to 140)
6710. Carefully adjust the ‘fuel’ control for a maximum reading on the display, ensuring
that only small adjustments are made, with a pause of several seconds between adjustments.
11. Remove the standard solution, wait 10 seconds, then aspirate a blank solution of diluent for 20 seconds. Adjust the ‘blank’ control for a zero reading. Remove the blank solution and wait 10 seconds.
12. Repeat paragraphs 8, 9 and 11 until the blank reading is zero (within ± 0.2) and the calibration reading is within ± 1%.
13. Aspirate each of the unknown solutions for 20 seconds, then note the reading in mmol/l
14. Check the calibration frequently 15. When analyzing large batches of samples, recheck instrument calibration every 10
samples with a single standard solution. NOTE:
Always use same batch of diluent for the blank, dilution of samples and standard, alternatively the corning dilutor can be used.
In any difficulty of obtaining a maximum sodium reading proceed as follows: Open the inspection flap and adjust the ‘fuel’ control until the flame just starts to lift off the burner. Then turn the ‘fuel’ control back, counter clockwise, until the cones of the flame are on the burner. Close the flap and proceed with paragraph 11.
PRECAUTIONS A diluent recommended by the manufacturer of instrument should be used. Deionised or high quality distilled water should be used to prepare the diluent. Deionised or distilled water must be free from contaminative elements (bacteria or moulds can cause inaccuracies by interrupting or blocking the flow of sample through the neubuliser always use the same batch of diluent for the blank and the dilution of samples and standards. 1. Anticoagulants containing sodium or potassium salts must not be used. Use serum for
measurement of sodium and potassium 2. Dilute the sera with care. Good quality calibrated pipette or a sensitive diluter must be
used. Use the same pipette or dilution equipment for both standard and sample 3. Accuracy of the results depends on the accuracy and purity of the calibration standard.
Always use accurately prepared standards. 4. Both the accuracy and precision of results depends on maintenance and adherence to
operating instructions provided by the manufacturer. Careful cleaning of the atomizer-burner, cleanliness of sample containers, the aspirating systems, proper adjustment of flame size, (blue flame with distinct cone) aspiration rate, and geometry of the flame and uniform entry of atomized, diluted sample into the flame are also critical for accuracy and precision. Thermal equilibrium must be established before analysis of unknown samples. Warm up period is necessary because the initial evaporation of water in the flame decreases the temperature of the burner and the entire burner chamber.
5. Safety: Propane is highly inflammable and potentially explosive and commonly supplied as a liquid under pressure in a cylinder for use with the 410. Cylinder should never be subjected to heat or mechanical shock. Leakage of propane from tank, instrument fittings or from values may be detected with the aid of soap solutions.
6. Site conditions:
Never install the flame photometer beneath overhanging cupboards. There must be at least 1 metre of clear space above the 410 chimney
The environment must be clean and free from dust The instrument must be placed on a strong, level work stop, free from vibration Avoid the instrument to direct sunlight or draughts
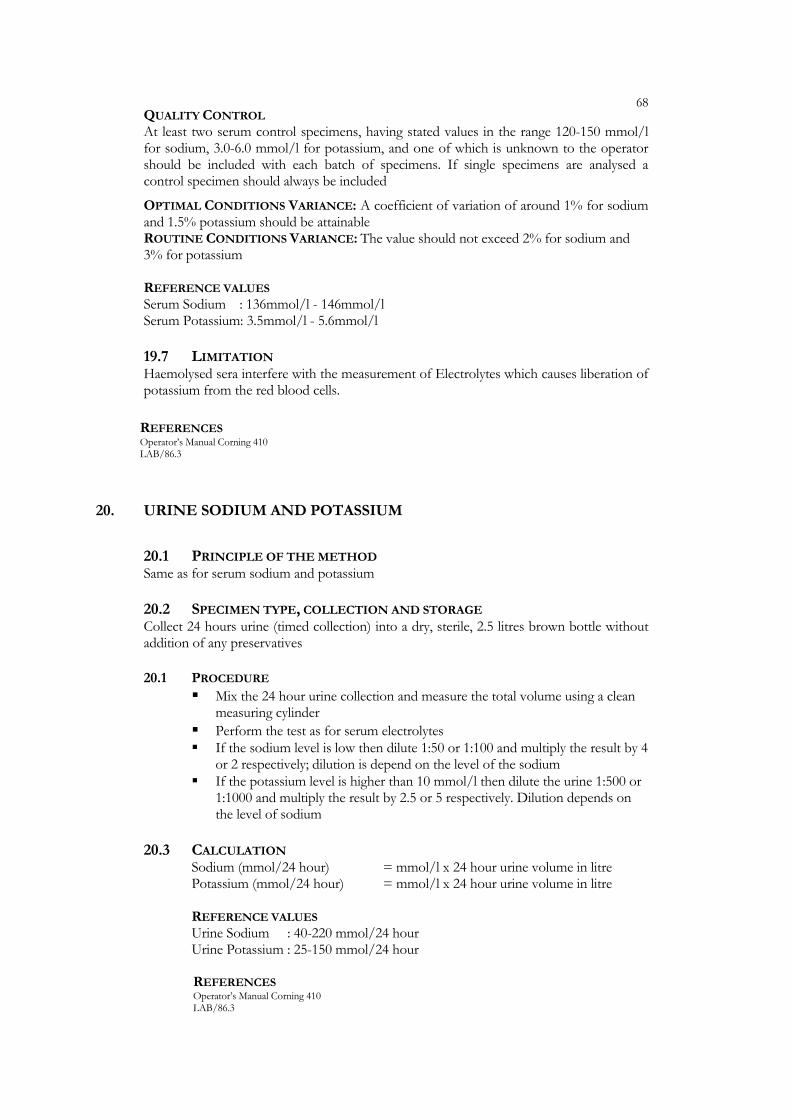
68 QUALITY CONTROL At least two serum control specimens, having stated values in the range 120-150 mmol/l for sodium, 3.0-6.0 mmol/l for potassium, and one of which is unknown to the operator should be included with each batch of specimens. If single specimens are analysed a control specimen should always be included
OPTIMAL CONDITIONS VARIANCE: A coefficient of variation of around 1% for sodium and 1.5% potassium should be attainable ROUTINE CONDITIONS VARIANCE: The value should not exceed 2% for sodium and 3% for potassium REFERENCE VALUES Serum Sodium : 136mmol/l - 146mmol/l Serum Potassium: 3.5mmol/l - 5.6mmol/l
19.7 LIMITATION Haemolysed sera interfere with the measurement of Electrolytes which causes liberation of potassium from the red blood cells.
REFERENCES Operator’s Manual Corning 410 LAB/86.3
20. URINE SODIUM AND POTASSIUM
20.1 PRINCIPLE OF THE METHOD Same as for serum sodium and potassium
20.2 SPECIMEN TYPE, COLLECTION AND STORAGE Collect 24 hours urine (timed collection) into a dry, sterile, 2.5 litres brown bottle without addition of any preservatives
20.1 PROCEDURE Mix the 24 hour urine collection and measure the total volume using a clean
measuring cylinder Perform the test as for serum electrolytes If the sodium level is low then dilute 1:50 or 1:100 and multiply the result by 4
or 2 respectively; dilution is depend on the level of the sodium If the potassium level is higher than 10 mmol/l then dilute the urine 1:500 or
1:1000 and multiply the result by 2.5 or 5 respectively. Dilution depends on the level of sodium
20.3 CALCULATION Sodium (mmol/24 hour) = mmol/l x 24 hour urine volume in litre Potassium (mmol/24 hour) = mmol/l x 24 hour urine volume in litre REFERENCE VALUES Urine Sodium : 40-220 mmol/24 hour Urine Potassium : 25-150 mmol/24 hour
REFERENCES Operator’s Manual Corning 410 LAB/86.3
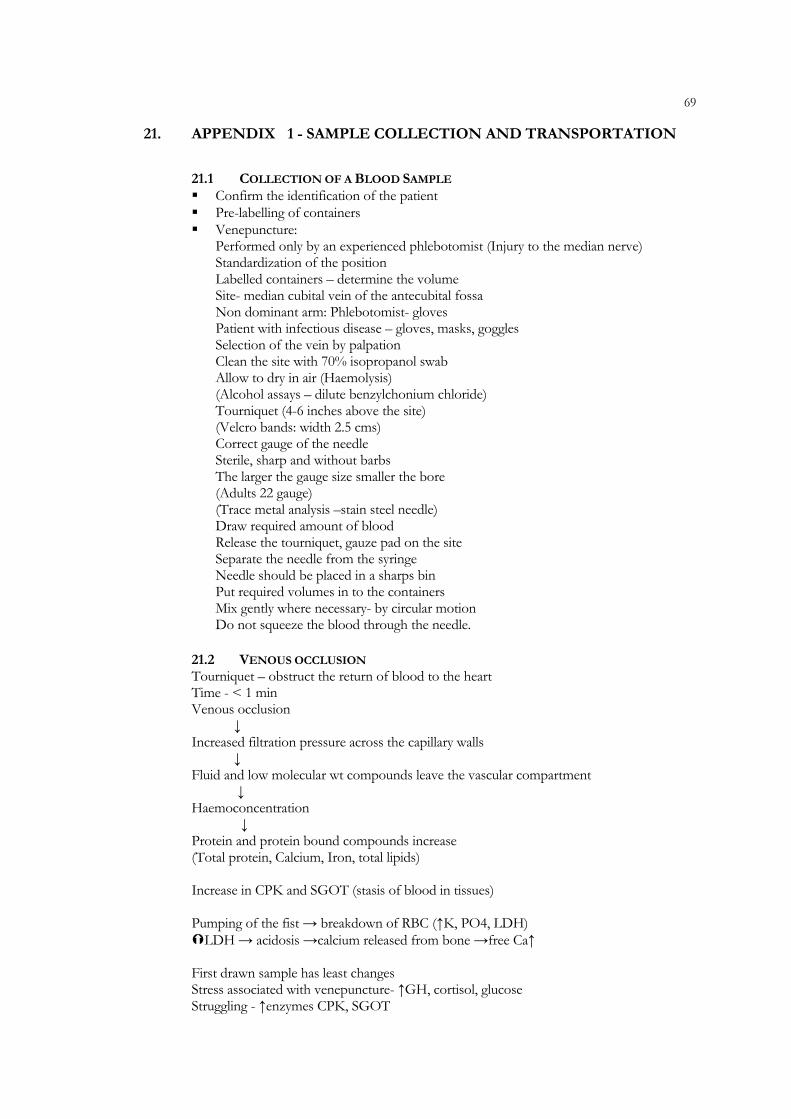
69 21. APPENDIX 1 - SAMPLE COLLECTION AND TRANSPORTATION
21.1 COLLECTION OF A BLOOD SAMPLE Confirm the identification of the patient Pre-labelling of containers Venepuncture:
Performed only by an experienced phlebotomist (Injury to the median nerve) Standardization of the position Labelled containers – determine the volume Site- median cubital vein of the antecubital fossa Non dominant arm: Phlebotomist- gloves Patient with infectious disease – gloves, masks, goggles Selection of the vein by palpation Clean the site with 70% isopropanol swab Allow to dry in air (Haemolysis) (Alcohol assays – dilute benzylchonium chloride) Tourniquet (4-6 inches above the site) (Velcro bands: width 2.5 cms) Correct gauge of the needle Sterile, sharp and without barbs The larger the gauge size smaller the bore (Adults 22 gauge) (Trace metal analysis –stain steel needle) Draw required amount of blood Release the tourniquet, gauze pad on the site Separate the needle from the syringe Needle should be placed in a sharps bin Put required volumes in to the containers Mix gently where necessary- by circular motion Do not squeeze the blood through the needle.
21.2 VENOUS OCCLUSION Tourniquet – obstruct the return of blood to the heart Time - < 1 min Venous occlusion ↓ Increased filtration pressure across the capillary walls ↓ Fluid and low molecular wt compounds leave the vascular compartment ↓ Haemoconcentration ↓ Protein and protein bound compounds increase (Total protein, Calcium, Iron, total lipids)
Increase in CPK and SGOT (stasis of blood in tissues)
Pumping of the fist → breakdown of RBC (↑K, PO4, LDH)
LDH → acidosis →calcium released from bone →free Ca↑
First drawn sample has least changes Stress associated with venepuncture- ↑GH, cortisol, glucose Struggling - ↑enzymes CPK, SGOT

70
i r i
21.3 BLOOD COLLECTION WITH SYRINGE Avoid vigorous suction and forceful transfer to the container (Haemolysis)
21.4 BLOOD COLLECTION WITH AN EVACUATED TUBE PROCEDURE: Needle screwed into the holder Tap the tube gently to dislodge any additive from the stopper Gently insert the tube into the holder Clean the skin and apply the tourniquet Guide the needle into the vein and once the needle is in place, press the tube forwards into the holder to puncture the stopper and release the vacuum. When blood is drawn into the vein release the tourniquet. The tube is filled until the vacuum is exhausted Withdraw the tube from the holder Replace another tube if necessary Evacuated tube with or without serum separating material Different additives Stoppers with out glycerin coat –lipid analysis Gel (serum separating material) inert Allow the sample to clot/ separation of plasma Centrifuge Gel will place between the serum and blood cells Primary tube –directly into the analyzers Gel might aspirate into the ion selective electrodes (avoid) Glass or plastic Special tubes with metal contamination –Trace metals Expiry date
21.5 SKIN PUNCTURE Adults and grown up children Pre warm if necessary with a slightly warm cloth Third or fourth finger of the non dominant hand Clean the centre of the palmer side of the tip (distal phalanx) Allow it to air dry (avoid Haemolysis) Quickly puncture with a sharp stab with a lancet Depth should be < 2.5 mm to avoid contact with bone Hold the hand downwards to collect the blood by gravity First drop should be wiped off Transfer to appropriate capillary tube/card Do not massage the finger Infant < 1 year- lateral or medial planter surface of the foot Patients who are ambulatory (diabetic) foot puncture should be avoided Neonatal screening –Special filter paper with circles Touch the paper against a blood drop to fill the circle Airs dry the paper
21.6 ARTERIAL PUNCTURE Only performed by an experienced med cal officer who had t ain ng on the technique. Sites: femoral artery of the leg, radial artery of the wrist
71 Blood gas analysis:
Needle and syringe flushed with heparin solution to ensure adequate anticoagulation and to eliminate trapped air in the needle and in the dead space of the nozzle. Excess heparin causes reduction of p CO2 Glass syringes Evacuated tubes should not be used (residual air in the tube will give erroneous results) Apply pressure after the sample is drawn. The nozzle should be sealed; syringe placed in a plastic bag and placed in melting ice (to inhibit the metabolic activity of white cells; prevent change in p H) for immediate transportation.Analysis should be performed immediately. Children – arterialized capillary blood –ear lobe Young child, Infant – heel Heparinised capillary tubes Types –Whole blood- blood gas, ammonia, trace metals
Serum – preferred specimen Plasma – Obtain by including an anticoagulant Repeated thawing and freezing –fibrin clots (Block the probes of analyzers.)
Anticoagulants and preservatives
Heparin- least interference with tests Available in Na, K, NH4, Li Prevent prothrombin into thrombin 20 units /1ml of blood Na and K salts avoided in electrolyte estimation Lithium salt is preferred (Insignificant effect on flame photometers with Lithium internal standard) Heparin inhibit - acid phosphatase and LDH activity, Binding of thyroid hormones to globulins (↑free hormone) EDTA -Chelating agent: binds Ca- prevent clotting Preserves cellular components of blood 1-2 mg/ml Potassium salt more soluble than sodium Unsuitable for ALP, CPK, Ca and Iron Sodium fluoride – Preservative for blood glucose Weak anticoagulant Enzyme inhibitor of the glycolytic pathway In high concentrations inhibit glucose oxidase and urease 2mg/ml
Oxalate –Na, K, Li, NH4 oxalate inhibit coagulation by forming Insoluble complexes with Ca ions Potassium oxalate 1-2mg/ml blood Drying temperature should not exceed 100 C (Avoid decomposition of oxalate to carbonate which Has no anticoagulant activity)
3mg/ml oxalate – Haemolysis Inhibit –acid and alkaline; phosphate, amylase and LDH
72 Influence of the site of collection
Capillary value> venous (Glucose, Potassium) Capillary < Venous (Bilirubin, calcium, chloride, Sodium, T.P)
21.7 COLLECTION OF BLOOD FROM IV LINES Direct from IV line shows increased analytes conc.; of the infusion Draw the sample from the arm below the IV line.
Haemolysis ↑aldolase, acid phosphatase, LDH, potassium, phosphate, SGOT Other tests- ↑absorbance; Blanking required Sample preservation in transit
Transport without delay Blood gas-melting ice Hormones – PTH, ACTH –Prechilled tubes (plastic –ACTH) Melting ice, refrigerated centrifuge, freeze-20C Other hormones – plaintubes, separate after 2 hours, freeze -20C Bilirubin- protect from light and heat Na/k – plain bottle – Do not refrigerate Calcium – acid washed tubes, no tourniquet Enzymes – heat labile ALP – Do not refrigerate
Separation and storage Plasma or serum separation from cells should be carried out 2 hours after collection unless specified Immediate analysis Refrigerate at 4C for the analytes that are stable for 24 hours Freeze -20C or -70C DO NOT CONTAMINATE THE SAMPLES Multiple aliquots –Prevent freezing and thawing
Method to maintain the identity of samples Physiological factors that affect results
Posture –upright - ↑↑protein and protein bound compounds Physical training - ↑ Enzymes of skeletal muscle Circadian Variation- cortisol - ↑8.00 am ↓mid night Age, gender, race Childhood to puberty Adult, Elderly Adult, Menopause Food ingestion- lipaemia –interference in assays

73
22. APPENDIX 2 – DIABETES MELLITUS
Definition: A group of diseases characterized by elevated blood glucose level (hyperglycaemia) resulting from defects in insulin secretion, in insulin action or both. Classification Type 1 Diabetes mellitus
(Insulin dependent, juvenile D.M.) Immune mediated Autoimmune destruction of β cells of the pancreas Age of onset: childhood and adolescence; any age Antibodies against islet cells Idiopathic Asian /African: permanent low insulin
Type 2 Diabetes mellitus
Maturity onset; non insulin dependent Due to insulin insensitivity hyper secretion of insulin Relative insulin deficiency
characteristics Type 1 Type 2 Age of onset <35 years >35years Genetic predisposition low high Antibodies to β cells yes No Body habitus Normal/wasted Obese Plasma insulin C -peptide
Low /absent High
Metabolic feature Insulin deficiency Insulin insensitivity
Specific types of Diabetes Genetic defects of islet cell function Endocrinopathies Drug induced
Gestational D.M
Any degree of clinical glucose intolerance with onset or first recognition during pregnancy.
Symptoms
Polyuria Polydypsia Blurring of vision Weight loss Diagnostic Strategy for Diabetes (Refer annexure 1)W.H.O 2002 – pg 17 Corrections – Fasting plasma glucose and random plasma glucose
Fasting plasma glucose without symptoms
Fasting plasma glucose on 2 occasions Normal fasting plasma glucose 3.3 - 6.1 mmol/L Impaired fasting glycaemia > 6.1 <6.9 mmol/L Diabetes >7.0 mmol/L FPG = 7.0 mmol/l →repeat →7.0 mmol/L→DM
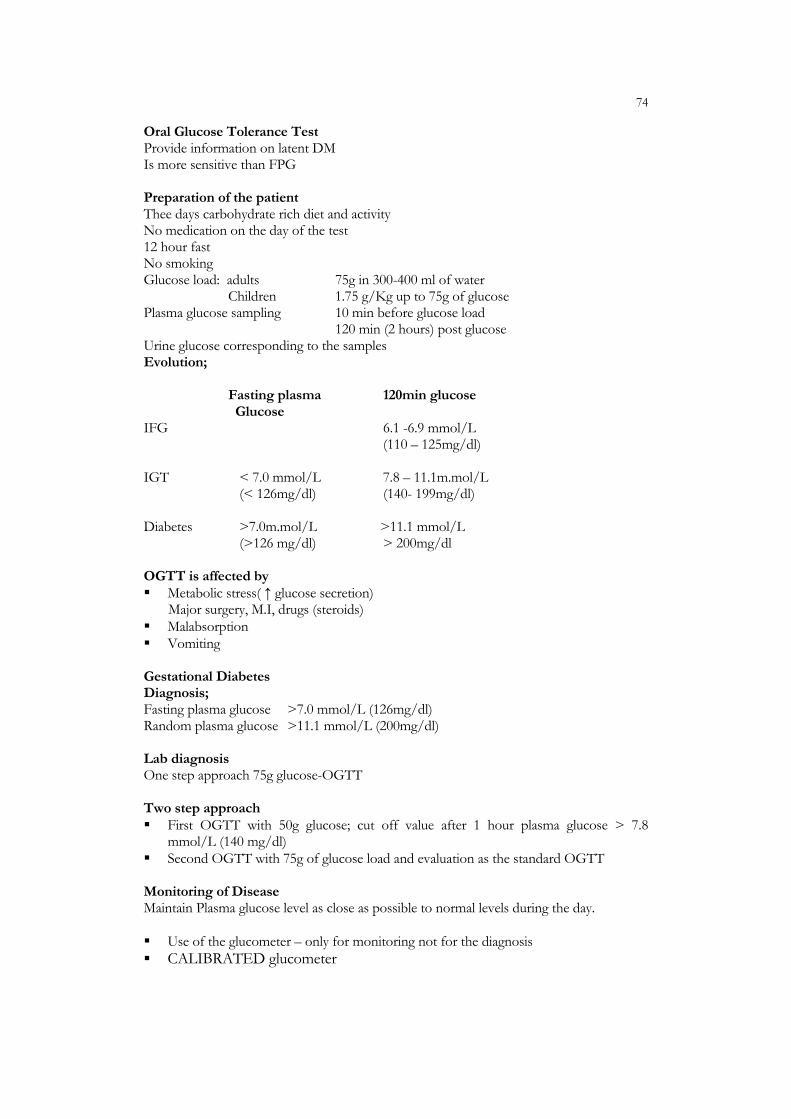
74 Oral Glucose Tolerance Test Provide information on latent DM Is more sensitive than FPG Preparation of the patient Thee days carbohydrate rich diet and activity No medication on the day of the test 12 hour fast No smoking Glucose load: adults 75g in 300-400 ml of water Children 1.75 g/Kg up to 75g of glucose Plasma glucose sampling 10 min before glucose load 120 min (2 hours) post glucose Urine glucose corresponding to the samples Evolution; Fasting plasma 120min glucose Glucose IFG 6.1 -6.9 mmol/L (110 – 125mg/dl) IGT < 7.0 mmol/L 7.8 – 11.1m.mol/L (< 126mg/dl) (140- 199mg/dl) Diabetes >7.0m.mol/L >11.1 mmol/L (>126 mg/dl) > 200mg/dl OGTT is affected by Metabolic stress( ↑ glucose secretion)
Major surgery, M.I, drugs (steroids) Malabsorption Vomiting
Gestational Diabetes Diagnosis; Fasting plasma glucose >7.0 mmol/L (126mg/dl) Random plasma glucose >11.1 mmol/L (200mg/dl)
Lab diagnosis One step approach 75g glucose-OGTT
Two step approach First OGTT with 50g glucose; cut off value after 1 hour plasma glucose > 7.8
mmol/L (140 mg/dl) Second OGTT with 75g of glucose load and evaluation as the standard OGTT
Monitoring of Disease Maintain Plasma glucose level as close as possible to normal levels during the day.
Use of the glucometer – only for monitoring not for the diagnosis CALIBRATED glucometer
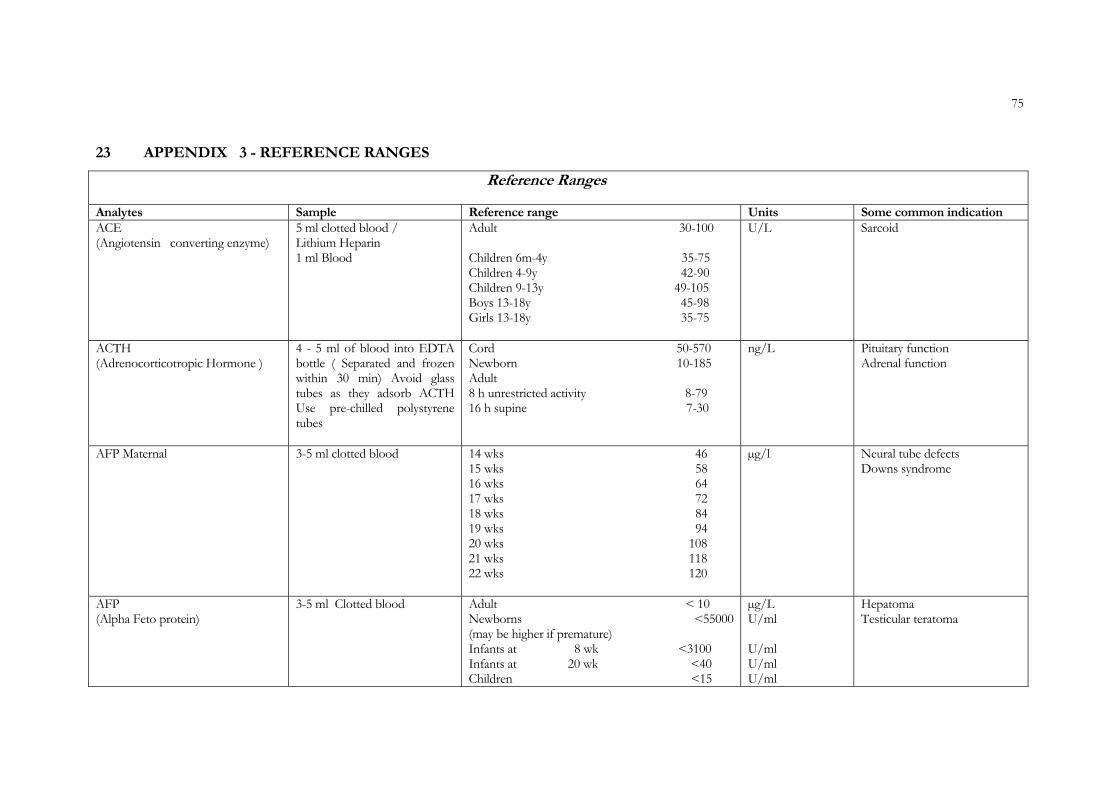
75
23 APPENDIX 3 - REFERENCE RANGES
Reference Ranges Analytes Sample Reference range Units Some common indication ACE (Angiotensin converting enzyme)
5 ml clotted blood / Lithium Heparin 1 ml Blood
Adult 30-100 Children 6m-4y 35-75 Children 4-9y 42-90 Children 9-13y 49-105 Boys 13-18y 45-98 Girls 13-18y 35-75
U/L Sarcoid
ACTH (Adrenocorticotropic Hormone )
4 - 5 ml of blood into EDTA bottle ( Separated and frozen within 30 min) Avoid glass tubes as they adsorb ACTH Use pre-chilled polystyrene tubes
Cord 50-570 Newborn 10-185 Adult 8 h unrestricted activity 8-79 16 h supine 7-30
ng/L Pituitary functionAdrenal function
AFP Maternal 3-5 ml clotted blood 14 wks 46 15 wks 58 16 wks 64 17 wks 72 18 wks 84 19 wks 94 20 wks 108 21 wks 118 22 wks 120
µg/l Neural tube defects Downs syndrome
AFP (Alpha Feto protein)
3-5 ml Clotted blood Adult < 10 Newborns <55000 (may be higher if premature) Infants at 8 wk <3100 Infants at 20 wk <40 Children <15
µg/L U/ml U/ml U/ml U/ml
Hepatoma Testicular teratoma

76
Albumin 2 ml of Clotted Blood
New borne 25-50 1 Year 35-50 2-3 Year 36-50 4th Year and after 37-50 Adult 30-45
g/l Malabsorption and malnutrition Protein losing states Chronic liver disease
Aldosterone 4 -5 ml EDTA / Heparin or Clotted Blood
Newborn 0.14-1.66 1wk -1 y 0.03-4.43 1 – 3 y 0.14-1.66 3-5 y <0.14-2.22 5-7 y <0.14-1.39 7-11 y 0.14-1.94 11-15 y <0.14-1.39 Adult, average Sodium diet (100-200 nmol/day) Supine 0.08-0.27 Upright (At least 2 hours) Female 0.14-0.83 Male 0.166-0.609
nmol/L Adreno cortical function
Alkaline Phosphatase Isoenzymes (Only analysed if patient has alkaline phosphatase >250 U/L)
5 ml clotted blood Reference range available in text books Qualitative by electrophoresis
Differentiation of increased ALP (Liver , Bone disorders)
ALP ( Alkaline Phosphatase)
3 ml clotted blood Males (age 20-60 Years) 20-90 Females (age 15-60 Years) 20-90 Children (age 1-12 Years) up to 350 During the growth spurt of puberty up to 500
IU/L 37C Bone and Liver diseases
Alpha-1 Antitrypsin (Phenotyping performed if <1.4 g/L)
4 -5ml Lithium Heparin or 5 ml clotted blood
Newborn 1.45-2.7 Adult 0.78-2.00 >60 years 1.15-2.00
g/L α 1- antitrypsin deficiency

77
ALT (Alanin Aminotransferase)
3 ml clotted blood Adults 2-27 Infants 10-80 Children 10-40
IU/L 37C
Liver disease
Amino Acids (Plasma) 4.ml Lithium Heparin or 5 ml clotted blood
Reference ranges are available in text books µmol/L Metabolic diseases
Amino Acids (Urine) Early morning first urine sample. Sample should be frozen and a control sample should be provided
This is a special test, contact the reference laboratory Metabolic diseases
Ammonia 4 ml EDTA in pre chilled tubes. Must reach the lab within 20 minutes. A control sample should be provided. Contamination from environment, smoking, contamination of the glass ware should be avoided. For specific instructions contact the Reference laboratory
Adult <40 Newborn 53-88 Infants and older children 21-47
µmol/L Acute hepatic failure Urea cycle defects
Amylase 3 ml Clotted blood 70 – 340 IU/L 37C Acute Pancreatitis Androstenedione (plasma) 3 ml clotted blood Pre pubertal 0.3-1.7
Puberty (10-17 y) 0.3-8.4 Adult Male 2.6-7.2 Female 3-9.6
nmol/L Congenital adrenal cortical disease
Apo- Lipoprotein B
3 ml clotted blood Male 0.63-1.33 Female 0.60-1.26
g/L Investigation of lipid disorders
Apo-Lipoprotein A-1
3ml clotted blood Male 0.94-1.78 Female 1.01-1.99
g/L Investigation of lipid disorders
AST (Aspartate aminotransferase)
3 ml Clotted blood, avoid haemolysis
Newborn 10-75 Children 10-45 Adult 4-42
IU/L 37C Hepatocellular disease Cardiac disease

78
Bicarbonate 5 ml clotted blood Newborn 18-23
Adult 23-31
mmol/l Acid base disorders
Bilirubin (Urine) Random Urine Not normally detectable
Qualitative Liver disease
Bilirubin (Total) 3 ml clotted blood Protect from light
Cord blood < 50 Cord blood premature infants < 58 First 24 h <103 2-5 days <205 >1 month 1.7-26 Adult 3-21
µmol/l Liver disease
Bilirubin-Direct 3 ml clotted blood Protect from light
Adults and Children 0-3.4 µmol/l Neonatal jaundice Liver disease
CA 125 5 ml clotted blood < 35 (Refer the analytical method)
kU/L Ovarian cancer
CA 15-3 5 ml clotted blood Non pregnant < 28 Pregnant 1 & 2 Trimester < 50
kU/L Raised in cirrhosis Breast cancer
CA 19-9 5 ml clotted blood < 37
kU/L Pancreatic cancers
Calcium (Urine) 24 hours Urine Collected into acid washed bottle
New Born 0-17.5 Infants up to 1000 Older Children up to100 Or 750-3750 Adults Calcium in diet Calcium free 0.13-1.0 Low –average 1.25-3.75 Average( 800mg/day) 2.5-7.5
µmol/kg/24 hours µmol/kg/24 hours µmol/kg/24 hours µmol/24 hours mmol/24 hours mmol/24 hours mmol/24 hours
Disorders of calcium metabolism
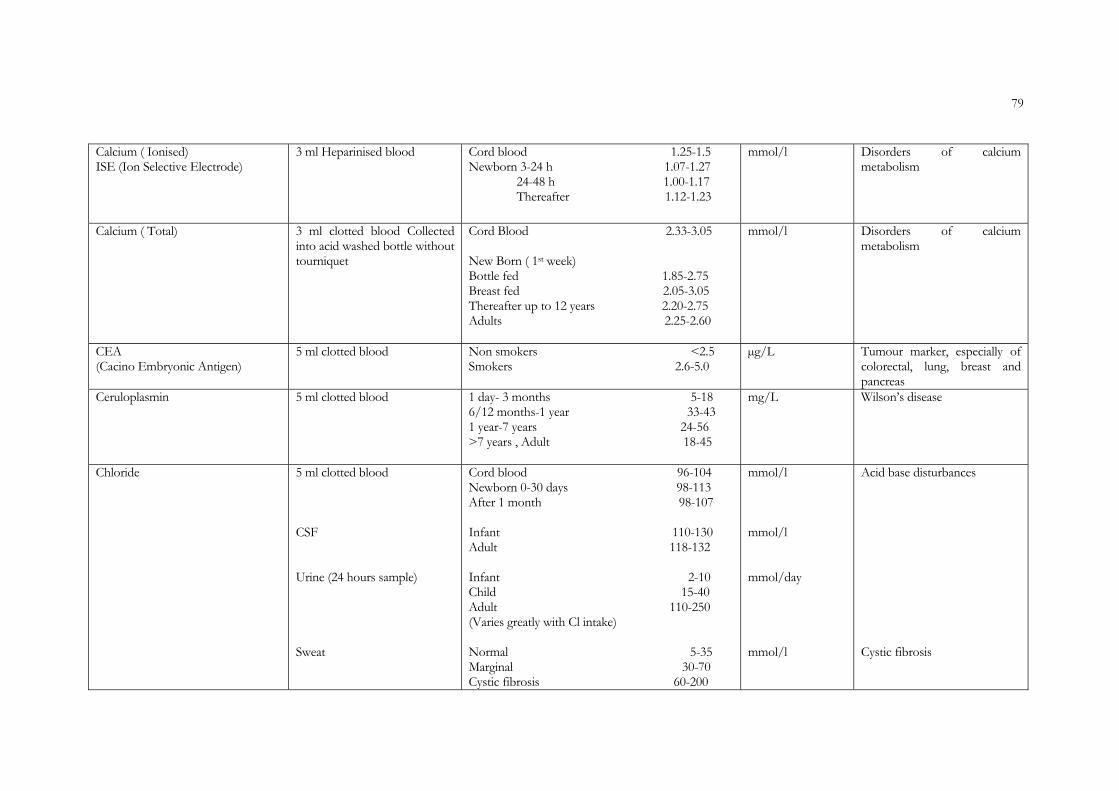
79
Calcium ( Ionised) ISE (Ion Selective Electrode)
3 ml Heparinised blood
Cord blood 1.25-1.5 Newborn 3-24 h 1.07-1.27 24-48 h 1.00-1.17 Thereafter 1.12-1.23
mmol/l
Disorders of calcium metabolism
Calcium ( Total) 3 ml clotted blood Collected
into acid washed bottle without tourniquet
Cord Blood 2.33-3.05 New Born ( 1st week) Bottle fed 1.85-2.75 Breast fed 2.05-3.05 Thereafter up to 12 years 2.20-2.75 Adults 2.25-2.60
mmol/l
Disorders of calcium metabolism
CEA (Cacino Embryonic Antigen)
5 ml clotted blood Non smokers <2.5 Smokers 2.6-5.0
µg/L Tumour marker, especially of colorectal, lung, breast and pancreas
Ceruloplasmin 5 ml clotted blood 1 day- 3 months 5-18 6/12 months-1 year 33-43 1 year-7 years 24-56 >7 years , Adult 18-45
mg/L Wilson’s disease
Chloride 5 ml clotted blood CSF Urine (24 hours sample) Sweat
Cord blood 96-104 Newborn 0-30 days 98-113 After 1 month 98-107 Infant 110-130 Adult 118-132 Infant 2-10 Child 15-40 Adult 110-250 (Varies greatly with Cl intake) Normal 5-35 Marginal 30-70 Cystic fibrosis 60-200
mmol/l mmol/l mmol/day mmol/l
Acid base disturbances Cystic fibrosis

80
Cholesterol 3 ml Clotted blood Cord Blood 0.60-3.50
1-6 week 2.40-5.60 up to 1 year 3.50-6.80 1-3 years 1.15-4.70 4-6 years 2.80-4.80 Male Female 6 - 9 years 3.26-4.94 3.16-5.41 10-14 years 3.36-5.28 3.21-5.61 15-19 years 2.95-5.12 3.23-5.48 22-24 years 3.21-5.64 3.16-5.59 25-29 years 3.44-6.32 3.33-5.75 30-34 years 3.57-6.58 3.37-5.96 35-39 years 3.78-6.99 3.63-6.27 40-44 years 3.91-6.94 3.81-6.53 45-49 years 4.09-7.15 3.94-6.86 50-54 years 4.09-7.17 4.20-7.38 55-59 years 4.04-7.15 4.45-7.77 60-64 years 4.12-7.15 4.45-7.69 65-69 years 4.09-7.10 4.43-7.85 > 70 years 3.73-6.86 4.48-7.25
mmol/l mmol/l
Lipid disorders
Cholinesterase phenotype (Pseudo cholinesterase)
5 ml clotted blood of family members of patient and control sample
Dibucaine 77-83 Fluoride 56-64
% Scoline apnoeaOrganophosphorus pesticide exposure
Cholinesterase screen (Pseudo cholinesterase)
5 ml clotted blood of family members of patient and control sample
0.6-1.4 1.08-2.4
kU/l at 25 C kU/l at 37 C
Scoline apnoea Organophosphorus pesticide exposure
CK (Total) (Creatine kinase)
3 ml clotted blood New Born <300 Children <200 Male 38-174 Female 26-140
IU/L 37 C MI Skeletal muscle disease
CK-MB 3 ml clotted blood < 12 or < 2.8 % of Total CK IU/L 37C Myocardial infarction
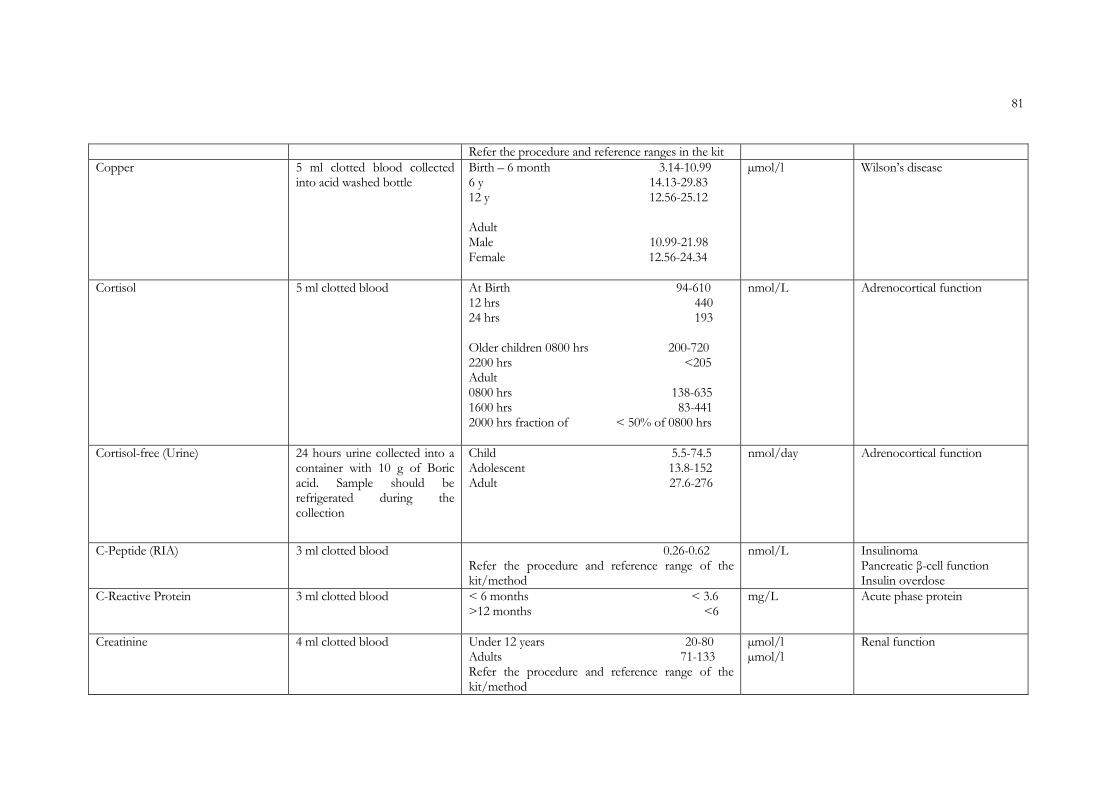
81
Refer the procedure and reference ranges in the kit Copper 5 ml clotted blood collected
into acid washed bottle Birth – 6 month 3.14-10.99 6 y 14.13-29.83 12 y 12.56-25.12 Adult Male 10.99-21.98 Female 12.56-24.34
µmol/l Wilson’s disease
Cortisol 5 ml clotted blood At Birth 94-610 12 hrs 440 24 hrs 193 Older children 0800 hrs 200-720 2200 hrs <205 Adult 0800 hrs 138-635 1600 hrs 83-441 2000 hrs fraction of < 50% of 0800 hrs
nmol/L Adrenocortical function
Cortisol-free (Urine) 24 hours urine collected into a container with 10 g of Boric acid. Sample should be refrigerated during the collection
Child 5.5-74.5 Adolescent 13.8-152 Adult 27.6-276
nmol/day
Adrenocortical function
C-Peptide (RIA) 3 ml clotted blood 0.26-0.62 Refer the procedure and reference range of the kit/method
nmol/L InsulinomaPancreatic β-cell function Insulin overdose
C-Reactive Protein 3 ml clotted blood < 6 months < 3.6 >12 months <6
mg/L Acute phase protein
Creatinine 4 ml clotted blood Under 12 years 20-80 Adults 71-133 Refer the procedure and reference range of the kit/method
µmol/l µmol/l
Renal function
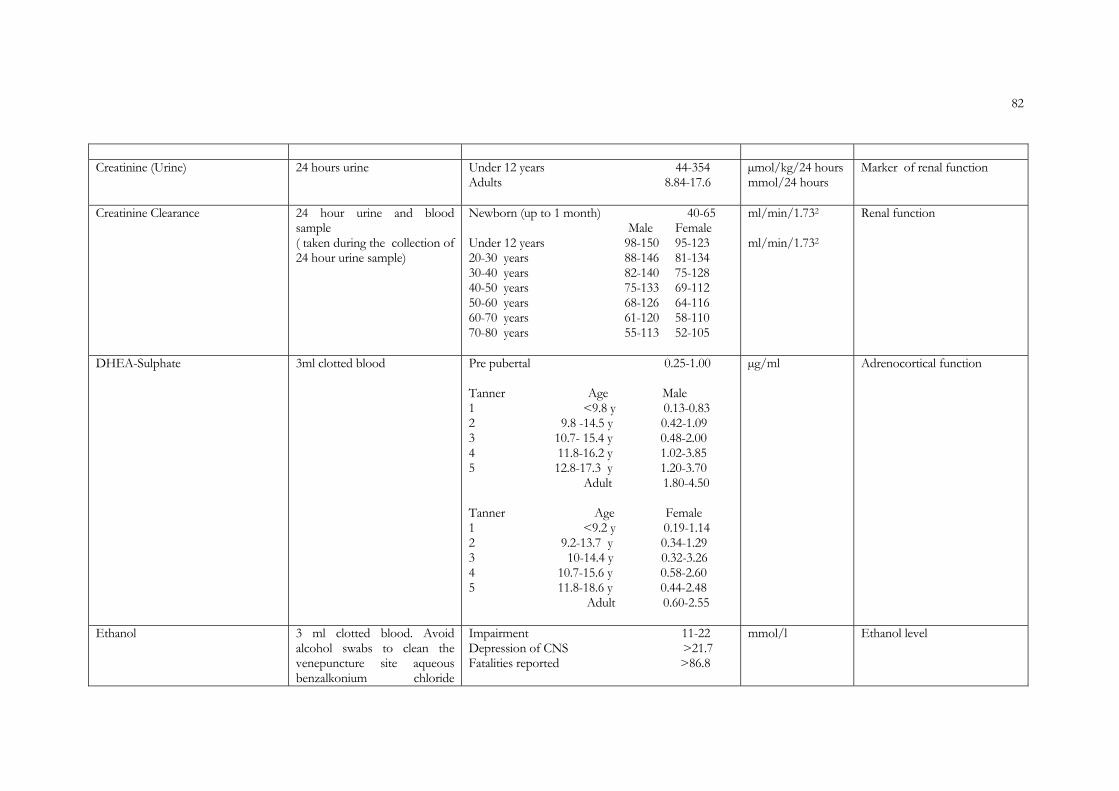
82
Creatinine (Urine) 24 hours urine Under 12 years 44-354
Adults 8.84-17.6
µmol/kg/24 hours mmol/24 hours
Marker of renal function
Creatinine Clearance 24 hour urine and blood sample ( taken during the collection of 24 hour urine sample)
Newborn (up to 1 month) 40-65 Male Female Under 12 years 98-150 95-123 20-30 years 88-146 81-134 30-40 years 82-140 75-128 40-50 years 75-133 69-112 50-60 years 68-126 64-116 60-70 years 61-120 58-110 70-80 years 55-113 52-105
ml/min/1.732
ml/min/1.732
Renal function
DHEA-Sulphate 3ml clotted blood Pre pubertal 0.25-1.00 Tanner Age Male 1 <9.8 y 0.13-0.83 2 9.8 -14.5 y 0.42-1.09 3 10.7- 15.4 y 0.48-2.00 4 11.8-16.2 y 1.02-3.85 5 12.8-17.3 y 1.20-3.70 Adult 1.80-4.50 Tanner Age Female 1 <9.2 y 0.19-1.14 2 9.2-13.7 y 0.34-1.29 3 10-14.4 y 0.32-3.26 4 10.7-15.6 y 0.58-2.60 5 11.8-18.6 y 0.44-2.48 Adult 0.60-2.55
µg/ml
Adrenocortical function
Ethanol 3 ml clotted blood. Avoid alcohol swabs to clean the venepuncture site aqueous benzalkonium chloride
Fatalities reported >86.8
Impairment 11-22 Depression of CNS >21.7
mmol/l Ethanol level

83
preferred
Faecal Fat Minimum 3 day collection-patient must be on a normal diet(Collected between two markers)
Infant breast fed <1 0-6 years <2 Adult <7 Adult (fat free diet) <4
g/day Gastrointestinal malabsorption
Faecal Reducing substances Fresh faeces (send to lab within 20 minutes or freeze)
Undetectable
Qualitative test Gut sugar malabsorption
Ferritin 5 ml clotted blood Newborn 25-200 1 month 200-600 2- 5 month 50-200 6 month -15 years 7-140 Adult Male 20-250 Female 10-120
µg/L
Iron status
Folate 5 ml clotted blood 2-16 y 11-48 >16 7-36
nmol/L Megaloblastic anaemia
Fructosamine 3 ml clotted blood Adult 205-285 Child 5% below adult level
µmol/L Glycaemic control
FSH 3 ml clotted blood Pre pubertal 0-6 months <1-4 6 months – 1 year <1-13 Children <10 years <1-3 Tanner Age Male 1 <9.8 y 0.26-3.0 2 9.8 -14.5 y 1.8-3.2 3 10.7- 15.4 y 1.2-5.8 4 11.8-16.2 y 2.0-9.2
mIU/ml mIU/ml
Pituitary-Gonadal axis

84
5 12.8-17.3 y 2.6-11.0 Adult 2.0-9.2 Tanner Age Female 1 <9.2 y 1.0-4.2 2 9.2-13.7 y 1.0-10.8 3 10-14.4 y 1.5-12.8 4 10.7-15.6 y 1.5-11.7 5 11.8-18.6 y 1.0-9.2 Adult Follicular 1.8-11.2 Mid cycle 6.0-35.0 Luteal 1.8-11.2 Post menopausal 30-120
Gamma GT (Gamma Glutamyl Transferase)
3 ml clotted blood Newborn <200 Infants <120 Children <35 Adult Male ≤50 Female ≤30
IU/L 37 C Liver function Alcohol abuse
Gastrin 3 clotted blood. (12 hour fasting) Serum should be centrifuged, separated & frozen at -20 C without delay. Samples must not be haemolysed and lipaemia should be avoided
Child < 10-125 Adult 16-60 y Male <100 Female <75 >60 y <100
ng/L Zollinger-Ellison syndrome
Glucose 2 ml Blood collected into sodium fluoride and potassium
Plasma Glucose level Cord blood 2.5-5.3
mmol/l

85
oxalate in 1:3 ratio (Refer the volume of blood to be included in the sugar bottle from the local laboratory)
Premature 1.1-3.3 Neonate 1.7-3.3 Newborn
1 day 2.20-3.30 >1 day 2.80-5.00
Child 3.30-5.50
Glucose Fasting Plasma Glucose level (10-12 hours fasting) Adult 3.3-6.1 Random Plasma Glucose level ≤7.8 Post Prandial Plasma Glucose level ≤11.1 Oral Glucose Tolerance Test Fasting < 6.1 After 2 hours < 7.8 (Refer recent WHO criteria for diagnosis of diabetes mellitus)
mmol/l Diagnosis of Diabetes Mellitus
Glucose (CSF) 1 ml of CSF into Fluoride/ Oxalate bottle (accompanied with the blood sample into fluoride oxalate)
70 % of plasma glucose
mmol/l Meningitis (Bacterial/Viral)
Growth Hormone (serum) 3 ml clotted blood Newborn 1st day 5-53 1 week 5-27 1 month – 1 year 2-10 Child fasting at rest 0.7-6.0 Adult 0.7-6.0
ng/ml Pituitary function
HBA1c (Glycated haemoglobin A 1c)
5 ml blood in EDTA bottle 1-5 years 2.1-7.7 5-16 years 3.0-6.2 Adult (Column chromatography, Cation exchange ) 4.5-8.5
% Glycaemic control
HCG 5 ml clotted blood Male and non pregnant female <5 IU/L Pregnancy

86
(Human Chorionic Gonadotrohpin) Female After After LMP fertilization 2 wk 4 wk 5-100 3 wk 5 wk 200-3000 4 wk 6 wk 10000-80000 5-12 wk 7-14 wk 90000-500000 13-24 wk 15-26 wk 5000-80000 26-38 wk 27-40 wk 3000-15000 Trophoblastic disease >100000
Germ cell tumours
HDL Cholesterol 4 ml of clotted blood colleted without tourniquet
Age Male Female Cord blood 0.16-1.37 0.34-1.45 5-9 y 0.98-1.94 0.93-1.89 10-14 y 0.96-1.91 0.96-1.81 15-19 y 0.78-1.63 0.91-1.91 20-24 y 0.78-1.63 0.85-2.04 25-29 y 0.80-1.63 0.96-2.15 30-34 y 0.72-1.63 0.93-1.99 35-39 y 0.75-1.60 0.88-2.12 40-44 y 0.70-1.73 0.88-2.28 45-49 y 0.78-1.66 0.88- 2.25 50-54 y 0.72-1.63 0.96-2.38 55-59 y 0.72-1.84 0.96-2.35 60-64 y 0.78-1.91 0.98-2.38 65-69 y 0.78 -1.94 0.91-2.48 >70 y 0.80-1.94 0.85-2.38
mmol/l Lipid disorders
Homocystine Plasma <15 Refer the procedure and reference range of the kit/method
mmol/l Cardiac risk
Hydroxy progesterone(17 OHP) Serum 3 ml clotted Blood Male, Puberty stage -1 0.1-2.7 Adult 1.5-7.5 Female, Puberty stage -1 0.1-2.5 Follicular 0.6-3.0 Luteal 3.0-15.5 Postmenopausal ≤2.1
nmol/L Adrenal status
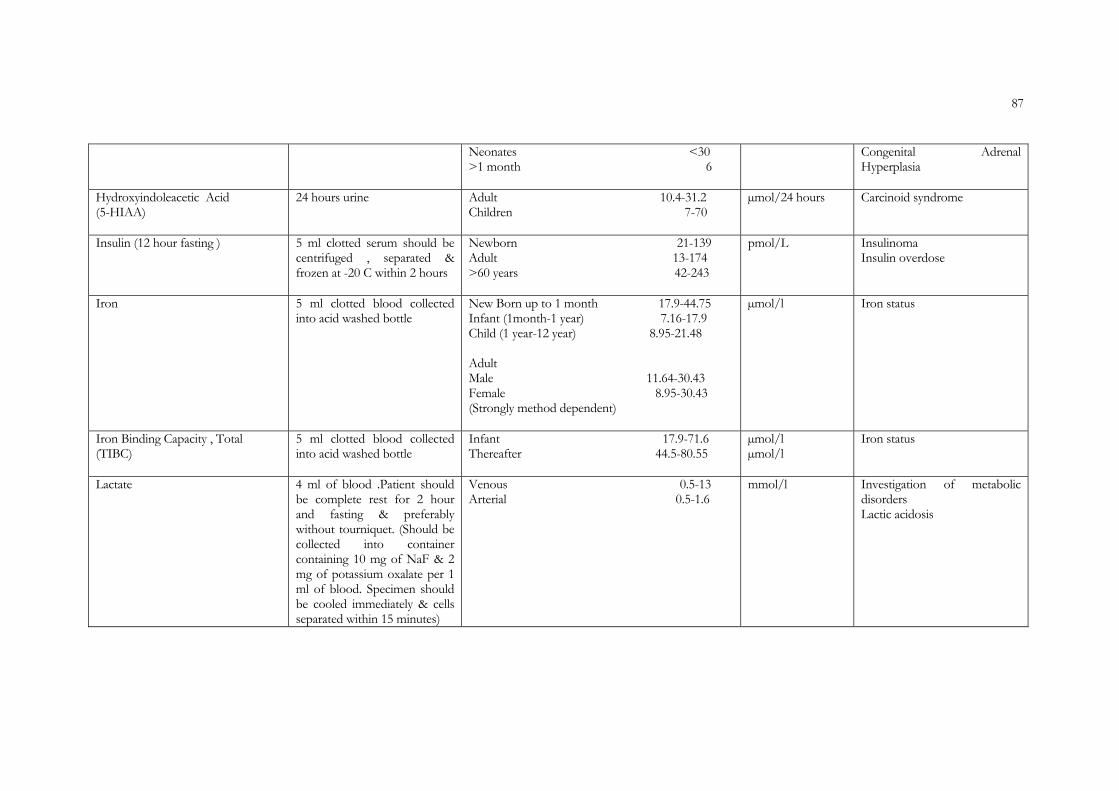
87
Neonates <30 >1 month 6
Congenital Adrenal Hyperplasia
Hydroxyindoleacetic Acid (5-HIAA)
24 hours urine Adult 10.4-31.2 Children 7-70
µmol/24 hours Carcinoid syndrome
Insulin (12 hour fasting ) 5 ml clotted serum should be centrifuged , separated & frozen at -20 C within 2 hours
Newborn 21-139 Adult 13-174 >60 years 42-243
pmol/L InsulinomaInsulin overdose
Iron 5 ml clotted blood collected into acid washed bottle
New Born up to 1 month 17.9-44.75 Infant (1month-1 year) 7.16-17.9 Child (1 year-12 year) 8.95-21.48 Adult Male 11.64-30.43 Female 8.95-30.43 (Strongly method dependent)
µmol/l Iron status
Iron Binding Capacity , Total (TIBC)
5 ml clotted blood collected into acid washed bottle
Infant 17.9-71.6 Thereafter 44.5-80.55
µmol/l µmol/l
Iron status
Lactate 4 ml of blood .Patient should be complete rest for 2 hour and fasting & preferably without tourniquet. (Should be collected into container containing 10 mg of NaF & 2 mg of potassium oxalate per 1 ml of blood. Specimen should be cooled immediately & cells separated within 15 minutes)
Venous 0.5-13 Arterial 0.5-1.6
mmol/l Investigation of metabolic disorders Lactic acidosis

88
LDH (Lactate dehydrogenase) Total(L P)
5 ml clotted blood 0-4 days 290-775 4-10 days 545-2000 10days -2 years 180-430 2 years -12 years 110-295 12 -60 years 100-190 >60 years 110-210
IU/L 37 C Haematological abnormalities Liver disease
LDL Cholesterol (Calculated)
Male Female Cord blood 0.5-1.45 0.54-1.50 5-9 y 1.63-3.34 1.76-3.63 10-14 y 1.66-3.44 1.76-3.52 15-19 y 1.61-3.37 1.53-3.55 20-24 y 1.71-3.81 1.48-4.12 25-29 y 1.81-4.27 1.84-4.25 30-34 y 2.02-4.79 1.81-4.04 35-39 y 2.10-4.90 1.94-4.45 40-44 y 2.25-4.82 1.92-4.51 45-49 y 2.51-5.23 2.05-4.82 50-54 y 2.31-5.10 2.28-5.21 55-59 y 2.28-5.26 2.31-5.44 60-64 y 2.15-5.44 2.59-5.80 65-69 y 2.54-5.44 2.38-5.72 >70 y 2.28-4.82 2.49-5.34
mmol/l
Lipid status
LH (Luteinizing Hormone)
5 ml clotted blood Pre pubertal 0-6 month 1-18 6 month -10 year <1-5 Tanner Age Male 1 <9.8 y 0.02-0.3 2 9.8-14.5 y 0.2-4.9 3 10.7-15.4 y 0.2-5.0 4-5 11.8-17.3 y 0.4-7.0 Adult 1.5-9.0 Tanner Age Female 1 <9.2 y 0.02-0.18 2 9.2-13.7 y 0.02-4.7
mIU/L Pituitary- gonadal axis
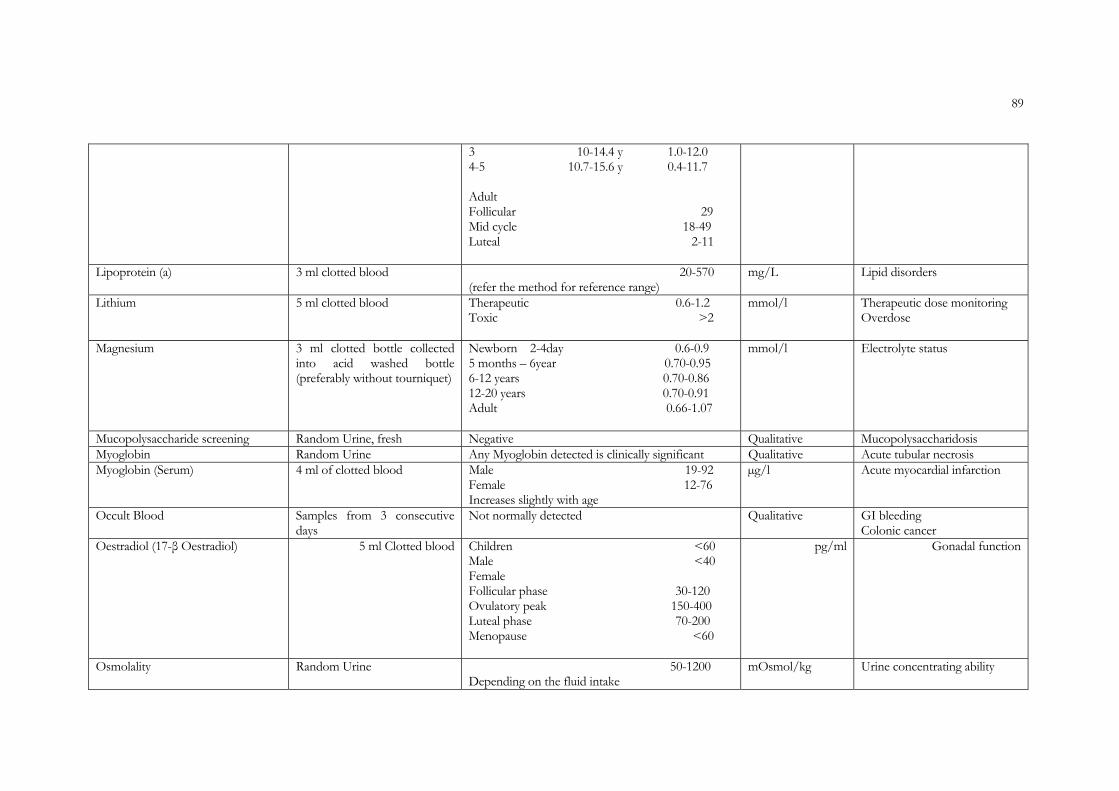
89
3 10-14.4 y 1.0-12.0 4-5 10.7-15.6 y 0.4-11.7 Adult Follicular 29 Mid cycle 18-49 Luteal 2-11
Lipoprotein (a) 3 ml clotted blood 20-570 (refer the method for reference range)
mg/L Lipid disorders
Lithium 5 ml clotted blood Therapeutic 0.6-1.2 Toxic >2
mmol/l Therapeutic dose monitoring Overdose
Magnesium 3 ml clotted bottle collected into acid washed bottle (preferably without tourniquet)
Newborn 2-4day 0.6-0.9 5 months – 6year 0.70-0.95 6-12 years 0.70-0.86 12-20 years 0.70-0.91 Adult 0.66-1.07
mmol/l Electrolyte status
Mucopolysaccharide screening Random Urine, fresh Negative Qualitative MucopolysaccharidosisMyoglobin Random Urine Any Myoglobin detected is clinically significant Qualitative Acute tubular necrosis Myoglobin (Serum) 4 ml of clotted blood Male 19-92
Female 12-76 Increases slightly with age
µg/l Acute myocardial infarction
Occult Blood Samples from 3 consecutive days
Not normally detected Qualitative GI bleeding Colonic cancer
Oestradiol (17-β Oestradiol) 5 ml Clotted blood Children <60 Male <40 Female Follicular phase 30-120 Ovulatory peak 150-400 Luteal phase 70-200 Menopause <60
pg/ml Gonadal function
Osmolality Random Urine 50-1200 Depending on the fluid intake
mOsmol/kg Urine concentrating ability
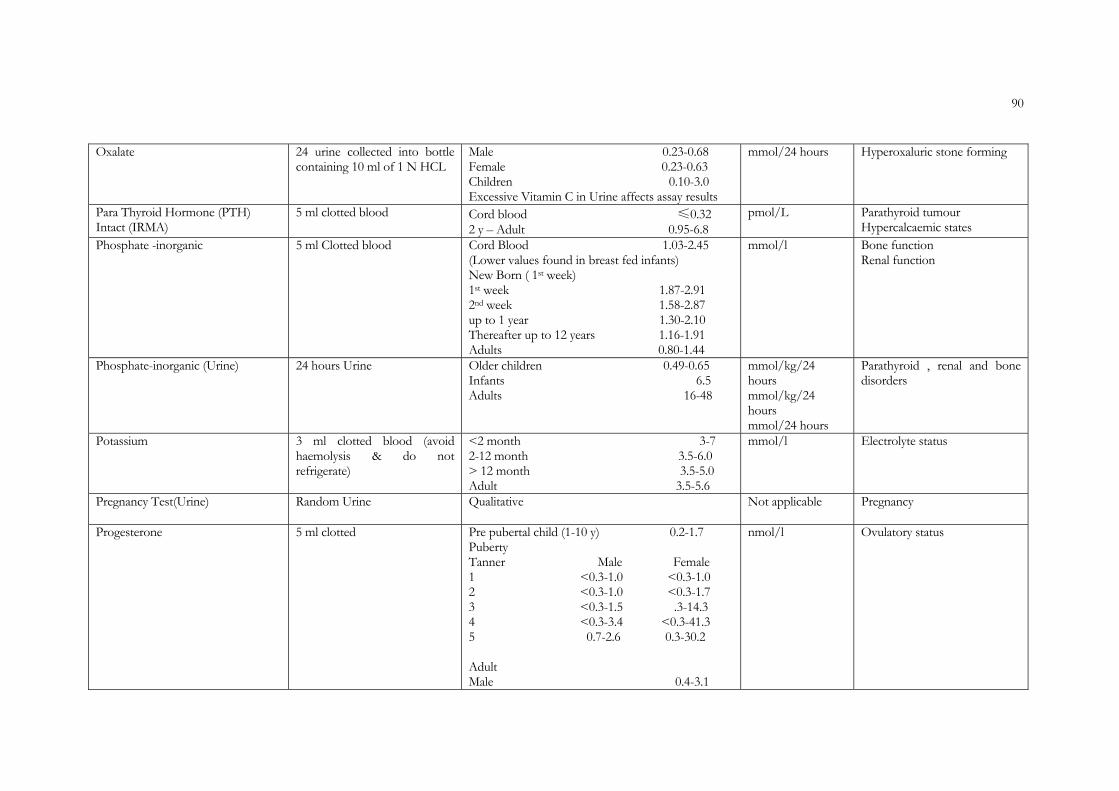
90
Oxalate 24 urine collected into bottle containing 10 ml of 1 N HCL
Male 0.23-0.68 Female 0.23-0.63 Children 0.10-3.0 Excessive Vitamin C in Urine affects assay results
mmol/24 hours Hyperoxaluric stone forming
Para Thyroid Hormone (PTH) Intact (IRMA)
5 ml clotted blood Cord blood ≤0.32 2 y – Adult 0.95-6.8
pmol/L Parathyroid tumour Hypercalcaemic states
Phosphate -inorganic 5 ml Clotted blood Cord Blood 1.03-2.45 (Lower values found in breast fed infants) New Born ( 1st week) 1st week 1.87-2.91 2nd week 1.58-2.87 up to 1 year 1.30-2.10 Thereafter up to 12 years 1.16-1.91 Adults 0.80-1.44
mmol/l Bone function Renal function
Phosphate-inorganic (Urine) 24 hours Urine Older children 0.49-0.65 Infants 6.5 Adults 16-48
mmol/kg/24 hours mmol/kg/24 hours mmol/24 hours
Parathyroid , renal and bone disorders
Potassium 3 ml clotted blood (avoid haemolysis & do not refrigerate)
<2 month 3-7 2-12 month 3.5-6.0 > 12 month 3.5-5.0 Adult 3.5-5.6
mmol/l Electrolyte status
Pregnancy Test(Urine) Random Urine Qualitative Not applicable Pregnancy
Progesterone 5 ml clotted
Pre pubertal child (1-10 y) 0.2-1.7 Puberty Tanner Male Female 1 <0.3-1.0 <0.3-1.0 2 <0.3-1.0 <0.3-1.7 3 <0.3-1.5 .3-14.3 4 <0.3-3.4 <0.3-41.3 5 0.7-2.6 0.3-30.2 Adult Male 0.4-3.1
nmol/l Ovulatory status

91
Female Follicular 0.5-2.2 Luteal 6.4-79.5 Pregnancy 7-13 wk 32.6-139.9 4-37 wk 62-262.4 30-42 wk 206.7-728.2
Prolactin 5 ml of clotted blood Cord blood 45-539 Newborn 5-3 d 30-495 Children Tanner Male Female
1 <10 3.6-12 2-3 <6.1 2.6-18 4-5 2.8-11 3.2-20 Adult Male 3-14.7 Female 3.8-23.2 Pregnancy 3rd trimester 95-473
µg/L Pituitary function
Prostate Specific Antigen (PSA) 5 ml clotted blood < 4 µg/L Prostate cancerProtein (CSF), Lumbar CSF in plain container Premature 15-130
Full term newborn 40-120 <1 month 20-80 Thereafter 15-40
mg/dl Inflammatory conditions of the meninges
Protein(Total) 3 ml clotted blood New borne 46-77 1 Year 56-73 2-3 Year 58-76 4th Year and after 60-80 Adult 60-80 Body Fluid (Transudates) <3
g/l
Malnutrition , liver disease and protein losing conditions

92
(Exudates) >3
Renin 5 ml blood taken into a bottle containing EDTA ,must be separated at room temperature and frozen at -20 C or lower(Contact the reference lab before collection of blood)
0-3 y <16.6 3-6 y <6.7 6-9 y <4.4 9-12 y <5.9 12-15 y <4.2 15-18 y 4.3 Normal sodium diet Supine 0.2-1.6 Upright (4 hours) 0.7-3.3 Low sodium diet Supine 1.0-5.4 Upright (4 hours) 0-19.0
µg/L/hr Hypertensive states
SHBG (Sex Hormone Binding Globulin)
5 ml clotted blood Male 10-50 Female 30-90 Pre pubertal 55-120
nmol/L Gonadal function
Sodium 3 ml clotted blood Newborn 134-146 Infant 139-146 Child 138-145 Thereafter 136-146
mmol/l Electrolyte status
Somatomedin C ( IGF-1) 4 ml blood collected into EDTA bottle
400-2000 IU/L Growth Hormone disorder investigation
Stone analysis Renal Calculus Not applicable Qualitative Quantitative
Investigation of Nephrolithiasis
Sugar Chromatography (Urine) Random urine, Fresh early morning sample preferable
Not detectable Qualitative Gut sugar malabsorption
T3 (Free) 3 ml clotted blood Child 2.6-4.8 Adult 2.08-6.74
pg/ml Thyroid function
T4(Free) 3 ml clotted blood Premature infant (Gestational age in week) 25-27 0.6-2.2 28-30 0.6-3.4 31-33 1.0-3.8 34-36 1.2-4.4
ng/dl Thyroid function
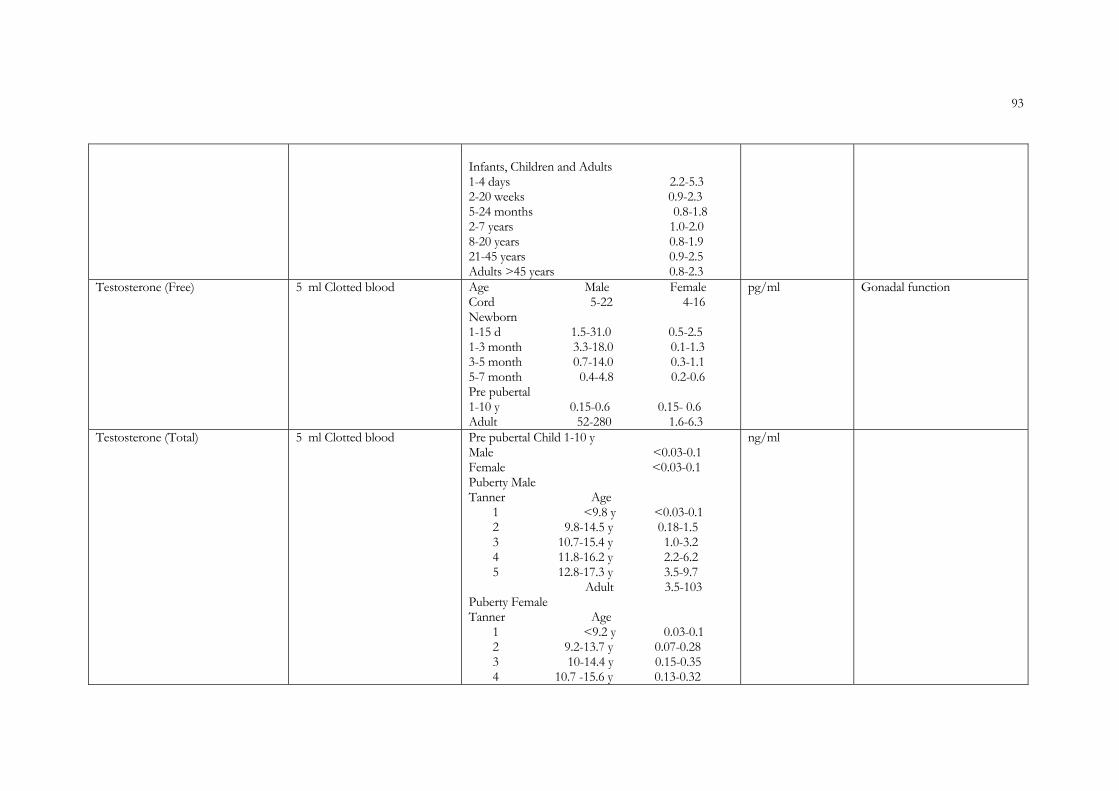
93
Infants, Children and Adults 1-4 days 2.2-5.3 2-20 weeks 0.9-2.3 5-24 months 0.8-1.8 2-7 years 1.0-2.0 8-20 years 0.8-1.9 21-45 years 0.9-2.5 Adults >45 years 0.8-2.3
Testosterone (Free) 5 ml Clotted blood Age Male Female Cord 5-22 4-16 Newborn 1-15 d 1.5-31.0 0.5-2.5 1-3 month 3.3-18.0 0.1-1.3 3-5 month 0.7-14.0 0.3-1.1 5-7 month 0.4-4.8 0.2-0.6 Pre pubertal 1-10 y 0.15-0.6 0.15- 0.6 Adult 52-280 1.6-6.3
pg/ml Gonadal function
Testosterone (Total) 5 ml Clotted blood Pre pubertal Child 1-10 y Male <0.03-0.1 Female <0.03-0.1 Puberty Male Tanner Age
1 <9.8 y <0.03-0.1 2 9.8-14.5 y 0.18-1.5 3 10.7-15.4 y 1.0-3.2 4 11.8-16.2 y 2.2-6.2 5 12.8-17.3 y 3.5-9.7 Adult 3.5-103
Puberty Female Tanner Age
1 <9.2 y 0.03-0.1 2 9.2-13.7 y 0.07-0.28 3 10-14.4 y 0.15-0.35 4 10.7 -15.6 y 0.13-0.32
ng/ml

94
5 11.8 -18.6 y 0.20-0.38 Adult 0.1-0.5
Thyroglobulin 5ml Clotted blood 3.0- 42
µg/L Medullary carcinoma of thyroid
Total Protein (Urine) 24 hours urine preservative:1ml of 10% Thymol in isopropanol solution
20-150 mg/24hours Renal function Protein losing status
Transferrin saturation (calculated) Male 20-55 Female 15-54
% %
Triglycerides 3 ml of clotted blood. 14 hours fasting is necessary
Male Female Cord Blood 0.15-1.07 0.12-0.86 0-9 years 0.34-1.13 0.40-1.24 10-14 y 0.36-1.41 0.42-1.48 15-19 y 0.42-1.67 0.44-1.40 20-29 y 0.50-2.81 0.41-1.63 30-39y 0.56-3.62 0.44-1.99 40-49 y 0.62-3.70 0.51-2.42 50-59 y 0.65-3.23 0.59-2.62
mmol/l
Lipid disorders
Troponin I 2 ml lithium Heparin or 5 ml clotted
Normal < 0.5 MI > 3 (Refer the method for reference range)
µg/L Myocardial infarctionUnstable angina
Troponin T 2 ml lithium Heparin or 5 ml clotted
Refer the method for reference range Myocardial infarctionUnstable angina
TSH (Thyroid Stimulating Hormone)
5m Clotted blood Premature infants (Gestational age in weeks) 25-27 0.2-30.3 28-30 0.2-30.6 31-33 0.7-27.9 34-36 1.1-21.6 Infants , children and adults 1-4 days 1-39
mIU/L Thyroid function
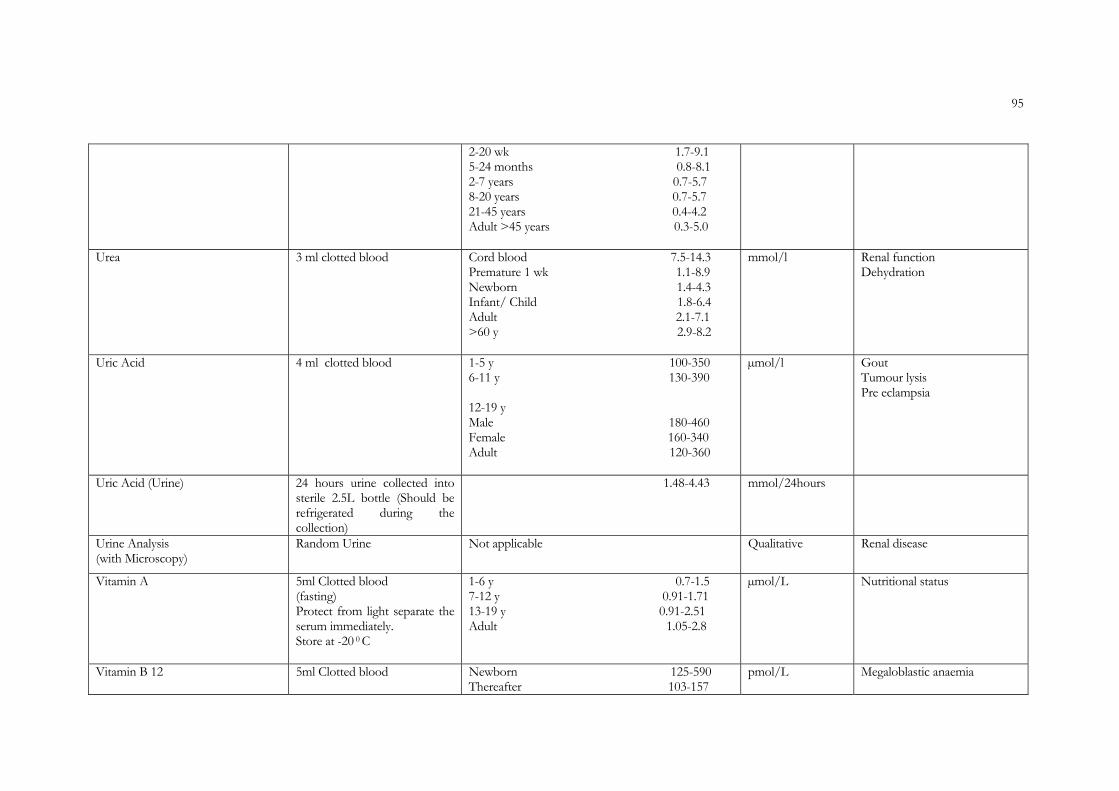
95
2-20 wk 1.7-9.1 5-24 months 0.8-8.1 2-7 years 0.7-5.7 8-20 years 0.7-5.7 21-45 years 0.4-4.2 Adult >45 years 0.3-5.0
Urea 3 ml clotted blood Cord blood 7.5-14.3 Premature 1 wk 1.1-8.9 Newborn 1.4-4.3 Infant/ Child 1.8-6.4 Adult 2.1-7.1 >60 y 2.9-8.2
mmol/l Renal functionDehydration
Uric Acid 4 ml clotted blood 1-5 y 100-350 6-11 y 130-390 12-19 y Male 180-460 Female 160-340 Adult 120-360
µmol/l GoutTumour lysis Pre eclampsia
Uric Acid (Urine) 24 hours urine collected into sterile 2.5L bottle (Should be refrigerated during the collection)
1.48-4.43 mmol/24hours
Urine Analysis (with Microscopy)
Random Urine Not applicable Qualitative Renal disease
Vitamin A 5ml Clotted blood (fasting) Protect from light separate the serum immediately. Store at -20 0 C
1-6 y 0.7-1.5 7-12 y 0.91-1.71 13-19 y 0.91-2.51 Adult 1.05-2.8
µmol/L Nutritional status
Vitamin B 12 5ml Clotted blood Newborn 125-590 Thereafter 103-157
pmol/L Megaloblastic anaemia

96
>60 years 81-590
Vitamin D (25 OHD3) (25 Hydroxy cholecalciferol)
5ml Clotted blood Children 1-30 d 1.9-33.4 31d - 1 y 7.4-53.3 Adult 14-60
ng/ml
Vitamin D metabolism and Calcium metabolism
Vitamin D(1,25 OHD3) (1,25-dihydroxy cholecalciferol)
5ml Clotted blood 43-154 pmol/L Vitamin D metabolism and Calcium metabolism
Vitamin E 5ml Clotted blood 11.6-46.4 µmol/l Nutritional status
REFERENCE:
1. Teitz text book of clinical chemistry by Carl A.Burtis, Edward R.Ashwood; 2nd and 3rd Edition 2. Clinical chemistry – theory , analysis, correlation by Lawrence A.Kaplan, Amadeo J. Pesce; 3rd Edition 1996 3. WHO Guidelines on standard operating procedures for clinical chemistry, Sep 2000 4. Nelson text book of paediatrics by Behrman, Kliegman, Jenson; 16th Edition 2000 5. Forfar and Arneil’s Text book of paediatrics 6. Biochemical basis of paediatric disease by Steven J Soldin,Nader Rifai,Jocelyn M. Hicks ;3rd Edition 1998

97
WE SINCERELY THANK THE FOLLOWING COLLEAGUES / MEMBERS OF MRI AND WHO COUNTRY OFFICE
Administrative staff
Ms. Kumuduni Ragel Secretary WHO country office Sri Lanka
Mrs. G. Subramanium Accountant MRI Mr. A. Ravichandran Financial staff Mrs. Margret Prera Planning unit Ministry of Health Miss. Nilakshi Devindi Gunatillaka
Members of staff and NEQAS team
Ms. Manjula Subashini Mr. K. S. T. Karunapala Ms. E.A.N.S. Peiris Mr. B. D. Lankananda Ms. S.K. Nanayakkara Ms. N. D. Wijekoon
Support staff
Mr. N. A. H. H. Nissanka Mr. J. M. Wijesinghe Mr. D. L. Upasena Mr. T. V. Anton Ms. W. Pushpika Perera