Clin Cancer Res-2012-Peer-1078-0432.CCR-11-2484
36
Published OnlineFirst February 3, 2012. Clin Cancer Res Cody J Peer, Tristan M Sissung, AeRang Kim, et al. and Hyperbilirubinemia UGT1A9: Implications of Genetic Variants on Pharmacokinetics Sorafenib is an Inhibitor of UGT1A1 but is Metabolized by Updated Version 10.1158/1078-0432.CCR-11-2484 doi: Access the most recent version of this article at: Material Supplementary ml http://clincancerres.aacrjournals.org/content/suppl/2012/02/03/1078-0432.CCR-11-2484.DC1.ht Access the most recent supplemental material at: Manuscript Author been edited. Author manuscripts have been peer reviewed and accepted for publication but have not yet E-mail alerts related to this article or journal. Sign up to receive free email-alerts Subscriptions Reprints and . [email protected] Department at To order reprints of this article or to subscribe to the journal, contact the AACR Publications Permissions . [email protected] Department at To request permission to re-use all or part of this article, contact the AACR Publications American Association for Cancer Research Copyright © 2012 on March 15, 2012 clincancerres.aacrjournals.org Downloaded from Author manuscripts have been peer reviewed and accepted for publication but have not yet been edited. Author Manuscript Published OnlineFirst on February 3, 2012; DOI:10.1158/1078-0432.CCR-11-2484
description
j
Transcript of Clin Cancer Res-2012-Peer-1078-0432.CCR-11-2484

Published OnlineFirst February 3, 2012.Clin Cancer Res Cody J Peer, Tristan M Sissung, AeRang Kim, et al. and HyperbilirubinemiaUGT1A9: Implications of Genetic Variants on Pharmacokinetics Sorafenib is an Inhibitor of UGT1A1 but is Metabolized by
Updated Version 10.1158/1078-0432.CCR-11-2484doi:
Access the most recent version of this article at:
MaterialSupplementary
mlhttp://clincancerres.aacrjournals.org/content/suppl/2012/02/03/1078-0432.CCR-11-2484.DC1.htAccess the most recent supplemental material at:
ManuscriptAuthor
been edited.Author manuscripts have been peer reviewed and accepted for publication but have not yet
E-mail alerts related to this article or journal.Sign up to receive free email-alerts
SubscriptionsReprints and
[email protected] atTo order reprints of this article or to subscribe to the journal, contact the AACR Publications
To request permission to re-use all or part of this article, contact the AACR Publications
American Association for Cancer Research Copyright © 2012 on March 15, 2012clincancerres.aacrjournals.orgDownloaded from
Author manuscripts have been peer reviewed and accepted for publication but have not yet been edited.Author Manuscript Published OnlineFirst on February 3, 2012; DOI:10.1158/1078-0432.CCR-11-2484

1
Sorafenib is an Inhibitor of UGT1A1 but is Metabolized by UGT1A9: Implications
of Genetic Variants on Pharmacokinetics and Hyperbilirubinemia
Cody J. Peer,1* Tristan M. Sissung,1* AeRang Kim2, Lokesh Jain,1 Sukyung Woo,1 Erin
R. Gardner,1 C. Tyler Kirkland,3 Sarah M. Troutman,3 Bevin C. English,3 Emily D.
Richardson,3 Joel Federspiel,1 David Venzon,4 William Dahut,5 Elise Kohn,5 Shivaani
Kummar,5 Robert Yarchoan,6 Giuseppe Giaccone,5 Brigitte Widemann,2 William D.
Figg1,3.
From the: 1Clinical Pharmacology Program, 2Pharmacology and Experimental
Therapeutics Section, 3Molecular Pharmacology Section, 4Biostatistics and Data
Management Branch, 5Medical Oncology Branch, and 6HIV/AIDS Malignancy Branch,
National Cancer Institute, Bethesda, MD; * Authors had an equal contribution.
American Association for Cancer Research Copyright © 2012 on March 15, 2012clincancerres.aacrjournals.orgDownloaded from
Author manuscripts have been peer reviewed and accepted for publication but have not yet been edited.Author Manuscript Published OnlineFirst on February 3, 2012; DOI:10.1158/1078-0432.CCR-11-2484

2
Corresponding author: William D. Figg, Medical Oncology Branch, CCR, NCI/NIH,
9000 Rockville Pike, Building 10, Room 5A01, Bethesda, Maryland, 20892 Tel: +1-301-
402-3622 Fax: +1 301-402-8606 Email: [email protected]
Key words: Sorafenib, glucuronidation,hyperbilirubinemia, pharmacokinetics,
pharmacogenetics. Number of words: Abstract: 248 Translational Relevance: 149
Text: 4,005 Number of references: 32 Number of tables: 1 Number of figures: 3 Journal Category: Research Article
Disclaimer
The content of this publication does not necessarily reflect the views or policies of the
Department of Health and Human Services, nor does mention of trade names,
commercial products, or organization imply endorsement by the U.S. Government.
Abbreviations: UGT, UDP-glucuronysltransferease; AUC, area under the plasma-
concentration time curve; VEGF, vascular endothelial growth factor; CYP, cytochrome
P450; MTD, maximum tolerated dose; CrCL, creatinine clearance; SGOT, serum
glutamic oxaloacetic transaminase; CTEP, Cancer Therapy Evaluation Program;
NADPH, nicotinamide adenine dinucleotide phosphate; DMSO, dimethyl sulfoxide;
LC/MS, liquid chromatography/mass spectrometry.
American Association for Cancer Research Copyright © 2012 on March 15, 2012clincancerres.aacrjournals.orgDownloaded from
Author manuscripts have been peer reviewed and accepted for publication but have not yet been edited.Author Manuscript Published OnlineFirst on February 3, 2012; DOI:10.1158/1078-0432.CCR-11-2484

3
Translational Relevance
We investigated UGT1A-mediated sorafenib glucuronidation in vitro, inhibition
of UGT1A1 bilirubin conjugation by sorafenib, and ascertained whether patients carrying
UGT1A1*28 treated with sorafenib had increased sorafenib exposure or increased risk of
developing hyperbilirubinemia. We also investigated genetic variation in genes encoding
sorafenib metabolizing enzymes (UGT1A9, CYP3A4/5) and the glucuronide transporter,
ABCC2. In vitro data demonstrate that sorafenib inhibits UGT1A1. Patients carrying
UGT1A1*28/*28 had abnormally low exposure to sorafenib if they also carried the -
24C>T variant in ABCC2, but had abnormally high exposure to sorafenib if they were
wild-type for ABCC2. Patients carrying UGT1A1*28/*28 also had greater increases in
total bilirubin if sorafenib exposure was high. The clinical data suggest that sorafenib
can cause hyperbilirubinemia in patients with Gilbert’s syndrome, which can lead to
abnormally high or low sorafenib exposure. Therefore, patients with Gilbert’s syndrome
must be carefully monitored when treated with sorafenib or alternative treatment options
should be considered.
American Association for Cancer Research Copyright © 2012 on March 15, 2012clincancerres.aacrjournals.orgDownloaded from
Author manuscripts have been peer reviewed and accepted for publication but have not yet been edited.Author Manuscript Published OnlineFirst on February 3, 2012; DOI:10.1158/1078-0432.CCR-11-2484

4
ABSTRACT
Purpose: Several case reports suggest sorafenib exposure and sorafenib-induced
hyperbilirubinemia may be related to a (TA)5/6/7 repeat polymorphism in UGT1A1*28.
We hypothesized that sorafenib inhibits UGT1A1 and individuals carrying UGT1A1*28
and/or UGT1A9 variants experience greater sorafenib exposure and greater increase in
sorafenib-induced plasma bilirubin concentration.
Experimental Design: Inhibition of UGT1A1-mediated bilirubin glucuronidation by
sorafenib was assessed in vitro. UGT1A1*28 and UGT1A9*3 genotypes were ascertained
using fragment analysis or direct sequencing in 120 cancer patients receiving sorafenib
on five different clinical trials. Total bilirubin measurements were collected in prostate
cancer patients prior to receiving sorafenib (n=41) and 19-30 days following treatment
and were compared to UGT1A1*28 genotype.
Results: Sorafenib exhibited mixed-mode inhibition of UGT1A1-mediated bilirubin
glucuronidation (IC50=18μM; Ki=11.7μM) in vitro. Five patients carrying
UGT1A1*28/*28 (n=4) or UGT1A9*3/*3 (n=1) genotypes had first-dose, dose-
normalized sorafenib AUCs that were in the 93rd percentile, while three patients carrying
UGT1A1*28/*28 had AUCs in the bottom quartile of all genotyped patients. DMET
genotyping on six patients revealed the ABCC2-24C>T genotype cosegregated with
sorafenib AUC phenotype. Sorafenib exposure was related to plasma bilirubin increases
in patients carrying 1 or 2 copies of UGT1A1*28 alleles (n=12 and n=5; R2=0.38 and
R2=0.77; P=0.032 and P=0.051, respectively). UGT1A1*28 carriers demonstrated two
distinct phenotypes that could be explained by ABCC2-24C>T genotype and are more
American Association for Cancer Research Copyright © 2012 on March 15, 2012clincancerres.aacrjournals.orgDownloaded from
Author manuscripts have been peer reviewed and accepted for publication but have not yet been edited.Author Manuscript Published OnlineFirst on February 3, 2012; DOI:10.1158/1078-0432.CCR-11-2484
5
likely to experience plasma bilirubin increases following sorafenib if they had high
sorafenib exposure.
Conclusions: This pilot study indicates that genotype status of UGT1A1, UGT1A9, and
ABCC2 and serum bilirubin concentration increases reflect abnormally high AUC in
patients treated with sorafenib.
American Association for Cancer Research Copyright © 2012 on March 15, 2012clincancerres.aacrjournals.orgDownloaded from
Author manuscripts have been peer reviewed and accepted for publication but have not yet been edited.Author Manuscript Published OnlineFirst on February 3, 2012; DOI:10.1158/1078-0432.CCR-11-2484

6
INTRODUCTION
Sorafenib tosylate inhibits VEGF receptors and several tyrosine kinases and thus
is considered an antiangiogenic agent with dual multikinase activity (1). Although
sorafenib is currently approved for the treatment of renal cell and unresectable
hepatocellular carcinomas, it may also have activity in other solid tumors, which led to
the initiation of several sorafenib-based clinical trials (2-5). There is wide variation in
the response and toxicity between patients following sorafenib treatment that appears to
be, at least in part, related to cumulative drug exposure (3). For this reason, studies
investigating the sources of inter-individual variation in sorafenib exposure are needed.
In humans, the majority (77%) of the sorafenib dose is either not absorbed or is
eliminated through the hepatobiliary route (50% unchanged), while 19% of the dose
(mostly glucuronides) is excreted in urine (6). Both routes of elimination require
glucuronidation catalyzed by UGT1A9 (7, 8), although it remains unclear if other UGTs
are responsible for glucuronidation of oxidized sorafenib metabolites formed through
CYP3A4/5 metabolism. Moreover, these enzymes demonstrate phenotypic variability
based on multiple polymorphisms, (i.e., UGT1A9*3, UGT1A9 -118dT9/10, UGT1A9 IVS+1
399 C>T (9); CYP3A4*1b and CYP3A5*3C (10). Once in the gut, intestinal microflora
deglucuronidate and reduce sorafenib resulting in enterohepatic circulation allowing
systemic re-exposure (10, 11). However, renal elimination appears to be irreversible and
individuals with low creatinine clearance (CrCl<60mL/min) require more sorafenib dose
reductions than patients with normal renal function (12). Thus, sorafenib glucuronidation
is a significant route of sorafenib metabolism (6, 8) and can potentially alter sorafenib
exposure.
American Association for Cancer Research Copyright © 2012 on March 15, 2012clincancerres.aacrjournals.orgDownloaded from
Author manuscripts have been peer reviewed and accepted for publication but have not yet been edited.Author Manuscript Published OnlineFirst on February 3, 2012; DOI:10.1158/1078-0432.CCR-11-2484
7
It is known that seven TA nucleotide repeats in the (TA)nTAA promoter region of
UGT1A1 (UGT1A1*28) leads to decreased expression of UGT1A1, resulting in high
plasma bilirubin levels and is often diagnosed as Gilbert’s syndrome (13). Previous
reports suggested that bilirubin concentrations were elevated by sorafenib (14, 15).
Interestingly, one report suggested that sorafenib induced jaundice in individuals carrying
UGT1A1*28 alleles due to a proposed UGT1A1 inhibition (14). This is consistent with
three additional reports that also suggested sorafenib might inhibit UGT1A1-mediated
bilirubin glucuronidation resulting in elevated bilirubin concentration (14-17). Another
study profiled a patient receiving sorafenib who had yellow skin coloration despite a
normal serum concentration of bilirubin and determined that the outcome was likely, if
not definitely, attributable to sorafenib treatment (18). Furthermore, a phase I dose-
escalation trial (n=34) of sorafenib with irinotecan, a UGT1A1 and UGT1A9 substrate,
resulted in elevated irinotecan and SN-38 exposure with the highest sorafenib dose (400
mg BID) (17). In that study, sorafenib was reported to have an in vitro inhibitor constant
(Ki) of 2.7 μM in human liver microsomes. This suggested that the increased SN-38
exposure was due to sorafenib-induced inhibition of UGT1A1- and/or UGT1A9-
mediated SN-38 glucuronidation. However, none of the above case reports evaluated
sorafenib plasma concentration in these patients, thus further confirmation of these results
in larger patient cohorts undergoing sorafenib treatment is needed.
Herein, we present a case report of a child with Gilbert’s syndrome who
underwent sorafenib treatment and experienced abnormally high sorafenib exposure.
Based on this observation and the aforementioned case studies, we hypothesized that
sorafenib and/or CYP3A4/5-mediated sorafenib oxide may be glucuronidated by
American Association for Cancer Research Copyright © 2012 on March 15, 2012clincancerres.aacrjournals.orgDownloaded from
Author manuscripts have been peer reviewed and accepted for publication but have not yet been edited.Author Manuscript Published OnlineFirst on February 3, 2012; DOI:10.1158/1078-0432.CCR-11-2484
8
UGT1A1 and/or UGT1A9, and that sorafenib acts as an inhibitor of UGT1A1-mediated
bilirubin glucuronidation. Additionally, sorafenib AUC and sorafenib-induced
hyperbilirubinemia might be related to the UGT1A1*28 allele that is responsible for most
cases of Gilbert’s syndrome. Since UGT1A9 and CYP3A4/5 are known to metabolize
sorafenib (6, 8), we hypothesized that sorafenib exposure would also be related to allelic
variation in the genes encoding these enzymes (19). To this end, we compared sorafenib
AUC with genetic variation in CYP3A4/5 and UGT1A1/9 in patients with various solid
tumors undergoing sorafenib therapy, as well as with sorafenib-related toxicities (hand-
foot skin reaction; HFSR) and clinical outcome.
American Association for Cancer Research Copyright © 2012 on March 15, 2012clincancerres.aacrjournals.orgDownloaded from
Author manuscripts have been peer reviewed and accepted for publication but have not yet been edited.Author Manuscript Published OnlineFirst on February 3, 2012; DOI:10.1158/1078-0432.CCR-11-2484

METHODS
Materials
The following chemicals were purchased from their respective suppliers:
Sorafenib tosylate (CTEP, c/o Bayer Schering Pharma, Berlin, Germany), Human
CYP3A4 supersomes containing CYP450 oxidoreductase and NADPH generating
system, 0.5 M potassium phosphate, pH 7.4, 100 mM Tris buffer, pH 7.4, Human
UGT1A1 and UGT1A9 Supersomes and UGT Reaction Mix (BD Biosciences, San Jose,
CA), methanol and acetonitrile (Optima grade, Fisher Scientific, Pittsburgh, PA), formic
acid and acetic acid (Sigma-Aldrich, St. Louis, MO). β-Glucuronidase was purchased
from Roche (Roche Diagnostics, Indianapolis, IN). All water used was deionized and
purified using a Millipore system.
In vitro studies
Sorafenib and cytochrome P450 (CYP)-mediated oxidized sorafenib (sorafenib-
N-oxide; M-2) were subjected to uridine glucuronosyl transferase (UGT)-catalyzed
glucuronidation by members of the UGT1A family, UGT1A1 and UGT1A9.
Furthermore, the role of sorafenib as an inhibitor of UGT1A1-mediated bilirubin
glucuronidation was also studied. Details are discussed in Supplemental Methods.
Patients and Treatment
Patients (n=120) from five clinical trials involving sorafenib treatment were used
for subsequent pharmacogenetic analysis, consisting of two phase I trials and three phase
II trials. The phase I trials were BAY-BEV (200 mg bid sorafenib with bevacizumab;
American Association for Cancer Research Copyright © 2012 on March 15, 2012clincancerres.aacrjournals.orgDownloaded from
Author manuscripts have been peer reviewed and accepted for publication but have not yet been edited.Author Manuscript Published OnlineFirst on February 3, 2012; DOI:10.1158/1078-0432.CCR-11-2484

10
n=27) (3), and BAY-KS (200 mg qd or 200-400 mg bid sorafenib with ritonavir in
Kaposi’s sarcoma; n=8; data not yet published), AUC data from patients on the BAY-KS
trial who received ritonavir were not available; thus potential AUC-influencing drug-drug
interactions between ritonavir and sorafenib were not accounted for in future analyses.
The phase II trials were BAY-CRPC (400 mg bid sorafenib in castration resistant prostate
cancer; n=46) (2, 4), BAY-NSCLC (400 mg bid sorafenib in non small-cell lung cancer;
n=22) (20, 21), and BAY-CRC (400 mg bid sorafenib with cetuximab in colorectal
cancer; n=17; data not yet published). Written informed consent was obtained from all
patients before enrollment on the trials and genotyping was approved by the Institutional
Review Board of the National Cancer Institute. All inclusion/exclusion criteria and
genotyping methods are detailed in the Supplemental Methods.
Sorafenib Exposure
Exposure (AUC) data were represented as day 1 dose-normalized AUC0-12h
(ng·h/mL/mg), as previously reported (22). Steady-state exposures were not available for
all 120 patients. Furthermore, exposure values were dose-normalized to compare AUC
from the five different trials with patients administered different doses. Linear
pharmacokinetics were not assumed from first-dose AUC values, rather individual patient
exposures were correlated to physiological changes (i.e. HFSR, PFS, and plasma
bilirubin concentration).
Statistical considerations
American Association for Cancer Research Copyright © 2012 on March 15, 2012clincancerres.aacrjournals.orgDownloaded from
Author manuscripts have been peer reviewed and accepted for publication but have not yet been edited.Author Manuscript Published OnlineFirst on February 3, 2012; DOI:10.1158/1078-0432.CCR-11-2484

11
Hardy-Weinberg equilibrium was tested using the chi-squared test. Genetic
linkage statistics were obtained using Haploview (Broad Institute, Cambridge, MA).
Comparisons of genotype versus demographics, preclinical measures, and
pharmacokinetics were conducted with nonparametric statistical tests including the
Wilcoxon Rank-Sum test or Kruskal Wallis ANOVA. Kruskal Wallis ANOVA was also
used to compare sorafenib AUC to the clinical grade of hand-foot skin reactions (HFSR).
Fisher’s Exact Test was used to compare between different AUC percentiles and
genotype. Linear regression was conducted to compare the creatinine clearance (CrCl)
and serum glutamic oxaloacetic transaminase (SGOT) to sorafenib AUC and was also
utilized in comparisons between AUC and the bilirubin change from baseline in the
different genotype groupings. Cox model analysis was conducted to compare genotypes
versus progression-free survival (PFS). Statistical significance was assigned if P<0.05 as
this study was conducted in an exploratory mode for potential confirmation in
independent data.
American Association for Cancer Research Copyright © 2012 on March 15, 2012clincancerres.aacrjournals.orgDownloaded from
Author manuscripts have been peer reviewed and accepted for publication but have not yet been edited.Author Manuscript Published OnlineFirst on February 3, 2012; DOI:10.1158/1078-0432.CCR-11-2484

12
RESULTS
Case Report
The patient was a 12 year-old boy who enrolled on a phase I trial of sorafenib for
children with neurofibromatosis type 1 and inoperable plexiform neurofibromas (23).
Prior to treatment, he had a total elevated bilirubin of 2.0 mg/dL with a direct of 0.3
mg/dL, normal serum ALT and AST, and was clinically diagnosed with Gilbert’s
syndrome. This was later confirmed with genetic testing as he was found to be
homozygous for the A(TA)7TAA allele of the UGT1A1 gene (i.e., UGT1A1*28/*28). The
protocol required a bilirubin concentration within normal limits for study entry, except
for patients with Gilbert’s syndrome. He was treated with a dose of 115 mg/m2 twice
daily (approximately 50% of the adult maximum tolerated dose (MTD) based on an
average adult body surface area of 1.8 m2).
The patient had day 1 pharmacokinetics performed, and his AUC0-24h was noted to
be 81 µg·h/mL, which is greater than the average AUC0-24h of 28 ± 17 µg·h/mL observed
in children treated at the MTD of 200 mg/m2 on the refractory solid tumor phase I trial
(24). The patient came off treatment after 9 days due to dose limiting grade 3 tumor pain.
The protocol was subsequently amended to exclude patients with known Gilbert’s
syndrome from trial participation.
Based on this case observation and the published case reports that sorafenib
induced hyperbilirubinemia in a small number of patients who carry a UGT1A1*28 allele
(14, 15), we hypothesized that genetic variation in UGT1A1 was a potential source of
alterations in sorafenib exposure and sorafenib-induced hyperbilirubinemia. Moreover,
since UGT1A9 is known to primarily glucuronidate sorafenib (8), we hypothesized that
American Association for Cancer Research Copyright © 2012 on March 15, 2012clincancerres.aacrjournals.orgDownloaded from
Author manuscripts have been peer reviewed and accepted for publication but have not yet been edited.Author Manuscript Published OnlineFirst on February 3, 2012; DOI:10.1158/1078-0432.CCR-11-2484
13
UGT1A9 alleles might also contribute to both endpoints; thus, we studied sorafenib and
sorafenib-N-oxide glucuronidation by UGT1A1 and UGT1A9 in vitro (Supplemental
Methods and Results), and ascertained UGT1A1 and UGT1A9 genotypes in patients
treated with sorafenib for comparison with pharmacokinetics and sorafenib-induced
hyperbilirubinemia endpoints. Patient characteristics are reported in Table 1.
In Vitro Sorafenib Glucuronidation
Sorafenib glucuronidation by UGT1A9 was confirmed via in vitro metabolism
experiments with recombinant UGT1A9 via liquid chromatography-mass spectrometry
(LC-MS), whereas a similar experiment using UGT1A1 did not metabolize sorafenib (see
Supplemental Results). This is in agreement with literature (7, 8). Based on exploratory
studies, neither UGT1A1 not UGT1A9 glucuronidated the CYP3A4-mediated sorafenib-
N-oxide (M-2) (data not shown).
Based on previous reports (14, 15, 17), we hypothesized that UGT1A1 could bind
sorafenib and that this binding event could inhibit bilirubin glucuronidation. Increasing
amounts of sorafenib were added to an in vitro UGT1A1-catalyzed bilirubin
glucuronidation enzyme activity assay to determine the extent and mechanism of
inhibition by sorafenib. Bilirubin concentrations used were based on literature reports of
its Km for UGT1A1-mediated glucuronidation, ranging between 0.2-26 μM (25-28).
Graphical modeling suggested sorafenib best fits a mixed-mode (mixed-type) inhibitor of
UGT1A1 (model correlation r=0.96), which demonstrates properties of both a
competitive and noncompetitive inhibitor (Supplemental Results). Based on model
correlations (noncompetitive r=0.93; competitive r=0.88), it was suggested that while
American Association for Cancer Research Copyright © 2012 on March 15, 2012clincancerres.aacrjournals.orgDownloaded from
Author manuscripts have been peer reviewed and accepted for publication but have not yet been edited.Author Manuscript Published OnlineFirst on February 3, 2012; DOI:10.1158/1078-0432.CCR-11-2484

14
sorafenib is a mixed-type inhibitor, it exhibits more noncompetitive-type inhibitor
characteristics than competitive.
A bilirubin Km of 5.9 μM and an inhibitor constant (Ki) of 11.8 μM were
determined empirically through the mixed-type model. The IC50 of sorafenib for
UGT1A1-mediated bilirubin glucuronidation was determined to be 18 μM following a
separate experiment (see Supplemental Methods). These values were slightly higher than
the literature values obtained by studying the mixed-type sorafenib-mediated inhibition of
SN38 glucuronidation by UGT1A1, where Ki was found to be 2.7 μM (17). The most
likely reason for this discrepancy from literature is due to the different substrates used in
the experiment (SN38 vs bilirubin). Since sorafenib demonstrates a competitive
inhibition factor (model correlation 0.88), the substrate likely has an affect on inhibitor
Ki.
Genotype versus sorafenib exposure
Based on the case report presented above, data indicating that sorafenib is
glucuronidated by UGT1A9 (Supplemental Results), and the sorafenib-mediated
inhibition of bilirubin glucuronidation through UGT1A1 (Supplemental Results), we next
hypothesized that genetic variants in UGT1A1 and UGT1A9 would affect sorafenib
pharmacokinetics and bilirubin metabolism in patients with solid tumors who received
sorafenib.
We excluded patients with low CrCl (<60mL/min) and a single patient with
abnormally high SGOT (90U/L) given the importance of hepatic and renal function in
sorafenib PK (Supplemental Results). Carriers of UGT1A1*28/*28 tended to be younger
American Association for Cancer Research Copyright © 2012 on March 15, 2012clincancerres.aacrjournals.orgDownloaded from
Author manuscripts have been peer reviewed and accepted for publication but have not yet been edited.Author Manuscript Published OnlineFirst on February 3, 2012; DOI:10.1158/1078-0432.CCR-11-2484

15
and have higher median total bilirubin. Patients with wild-type CYP3A4 and CYP3A5
alleles had lower median SGOT and median CrCl than variant allele carriers,
respectively. A more detailed summary can be found in the Supplemental Results
section. None of the above associations are likely to have altered the results presented in
later sections.
Initial analysis of UGT1A1 A(TA)nTAA and UGT1A9*3 genotypes versus day 1
dose-normalized sorafenib AUC0-12h revealed five patients carrying UGT1A1*28/*28
(n=4) and UGT1A9*3/*3 (n=1) have higher AUCs than those patients corresponding to
any other genotypes with normal creatinine clearance (CrCl) and SGOT (i.e., all > 93rd
percentile; range = 109.9 – 198.6 ng·h/mL/mg), and one patient carrying
UGT1A1*28/*28 had an AUC in the 76th percentile (AUC = 72.5 ng·h/mL/mg).
Interestingly, of the three remaining patients carrying UGT1A1*28/*28, two had the
lowest AUCs (i.e. < 3rd percentile; range = 2.7 – 6.3 ng·h/mL/mg) while one had an AUC
in the 21st percentile (AUC = 18.0 ng·h/mL/mg). For this reason, UGT1A1*28 status was
considered to confer different phenotypes: those having an abnormally high exposure,
those having exposures matching the rest of the cohort, and those having low exposure
(Figure 1). Analysis of UGT1A1 and UGT1A9 genotypes versus sorafenib AUC in the
different genotype groupings did not lead to a statistically significant result due to the
wide variability in phenotype in the UGT1A1*28/*28 genotype grouping (P = 0.32;
Kruskal-Wallis ANOVA; Figure 1); however, there were strongly significant differences
in the odds of having AUCs >93rd percentile (i.e., ≥107 ng·h/mL/mg) and also carrying
UGT1A1*28/*28 (n=4) or UGT1A9*3/*3 (n=1) (OR (95%CI) = 179.7 (8.5 – 3787);
P<0.0001; Fisher’s Exact Test). In addition, there was a strongly significant difference in
American Association for Cancer Research Copyright © 2012 on March 15, 2012clincancerres.aacrjournals.orgDownloaded from
Author manuscripts have been peer reviewed and accepted for publication but have not yet been edited.Author Manuscript Published OnlineFirst on February 3, 2012; DOI:10.1158/1078-0432.CCR-11-2484

16
the odds of carrying UGT1A1*28/*28 and also having AUCs ≤ 3rd percentile (OR
(95%CI) = 57.3 (2.5 – 1326); P = 0.0084; Fisher’s Exact Test), further justifying
consideration of UGT1A1*28 alleles as conferring different phenotypes. Although
UGT1A9 IVS+1 (399C>T) and -118dT9/10 were in linkage disequilibrium with UGT1A1
A(TA)nTAA (Supplementary Results), these polymorphisms were not associated with
alterations in AUC (P≥0.39; data not shown). Neither CYP3A4*1B (P = 0.42) nor
CYP3A5*3C (P = 0.52) status was associated with increased sorafenib exposure.
Therefore, UGT1A1*28 and possibly the UGT1A9*3 SNP appeared to be the major
predictive alleles associated with phenotype.
To further study the apparently different phenotypes for patients carrying only
UGT1A1*28 alleles (n=8), we genotyped 1,936 polymorphisms in 225 genes involved in
clinical pharmacology using the DMET Plus panel (Coriell Institute, N.J., USA). DMET
genotyping was only successful (≥90% call rate) in a total of 6 patients with the
following AUCs (ng·h/mL/mg): 2.7, 6.3, 18.0, 109.9, 116.2, 139.6. DMET analysis
revealed that only the ABCC2 -24C>T SNP cosegregated with sorafenib metabolism
phenotype. After sequencing the ABCC2 -24C>T SNP in all patients carrying
UGT1A1*28/*28, it was determined that the patient with the lowest observed AUC (i.e.
2.7 ng·h/mL/mg) was double variant, whereas patients with the next lowest AUCs (6.3,
18.0, and 72.5 ng·h/mL/mg) were heterozygous followed by those with the highest AUCs
(109.9, 116.2, and 139.6) who carried homozygous wild-type alleles. A single patient
with AUC = 198.6 ng·h/mL/mg was not ascertainable as ABCC2 genotyping by direct
sequencing was not successful. Upon sequencing the whole population for ABCC2 -
24C>T, it was determined that individuals carrying only variant alleles in this SNP
American Association for Cancer Research Copyright © 2012 on March 15, 2012clincancerres.aacrjournals.orgDownloaded from
Author manuscripts have been peer reviewed and accepted for publication but have not yet been edited.Author Manuscript Published OnlineFirst on February 3, 2012; DOI:10.1158/1078-0432.CCR-11-2484
17
tended to have lower median AUC (29.8 versus 40.5 ng·h/mL/mg) compared to
individuals carrying one or two copies of wild-type allele, but this was not statistically
significant (P=0.21). Therefore, the ABCC2 -24C>T SNP only appears to modify AUC
phenotype in those carrying only UGT1A1*28 alleles.
Genotype versus bilirubin change following sorafenib
Since previous case-report data indicated that sorafenib might induce bilirubin
changes in patients based on UGT1A1 allele status (14, 15), we hypothesized that
sorafenib exposure would correspond to greater increases in post-sorafenib bilirubin
concentration in those patients with low-functioning UGT1A1 alleles (i.e., UGT1A1*28).
Analysis of bilirubin versus genotype was only conducted in men with prostate cancer
receiving sorafenib as comprehensive bilirubin data were not obtained in other trials. The
median change in bilirubin plasma concentration was 0 mg/dL (range = -0.3 to 0.5
mg/dL; n=45). A total of 3 patients with normal CrCL developed hyperbilirubinemia
(i.e., bilirubin concentration ≥1.0mg/dL) following sorafenib (UGT1A1 (TA)5/(TA)6 n=1,
(TA)6/(TA)7 n=2), and 2 patients that presented with hyperbilirubinemia prior to the
sorafenib dose had a further rise in bilirubin concentration following sorafenib (UGT1A1
(TA)6/(TA)7 n=1, (TA)7/(TA)7 n=1; the latter patient had a 0.4mg/dL increase).
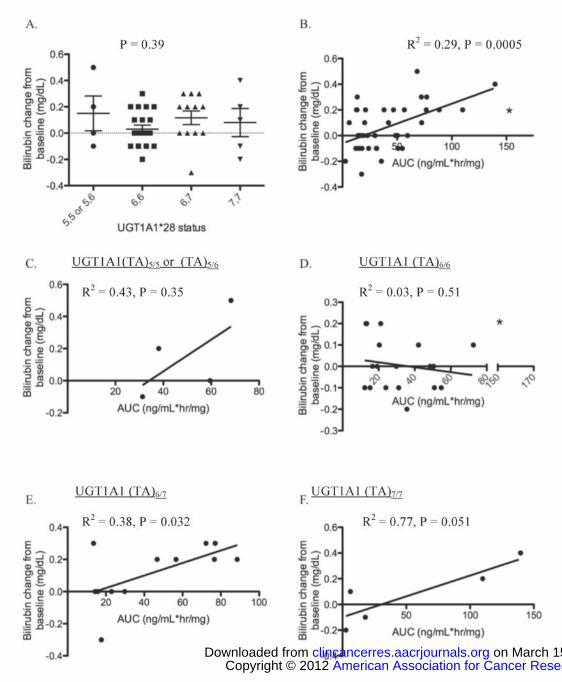
UGT1A1 A(TA)nTAA status was not related to change in bilirubin from baseline
(P = 0.39; Figure 2A). However, regression analysis indicated that sorafenib exposure
was related to bilirubin serum concentration in patients with normal CrCl (R2 = 0.29; P =
0.0005; Figure 2B). When regression analyses were stratified on the basis of UGT1A1
A(TA)nTAA genotype status, this analysis revealed that sorafenib exposure was not
American Association for Cancer Research Copyright © 2012 on March 15, 2012clincancerres.aacrjournals.orgDownloaded from
Author manuscripts have been peer reviewed and accepted for publication but have not yet been edited.Author Manuscript Published OnlineFirst on February 3, 2012; DOI:10.1158/1078-0432.CCR-11-2484
18
related to bilirubin increases in patients carrying either UGT1A1 (TA)5/5 or (TA)5/6, or
UGT1A1 (TA)6/6 genotypes (R2 = 0.43 and R2 = 0.030 respectively; P = 0.35 and P =
0.51, respectively; Figure 2C-D). However, only 4 individuals carried a copy of
UGT1A1 (TA)5, and there is an apparent (albeit non-significant) proportional increase in
both AUC and sorafenib-induced bilirubin changes consistent with the rather high R2 for
this genotype grouping. When the data were stratified by UGT1A1 (TA)6/7 and UGT1A1
(TA)7/7 genotypes, a significant (or marginally non-significant) relationship was observed
in both cases with a relatively high correlation (R2 = 0.38 and R2 = 0.77 respectively; P =
0.032 and P = 0.051, respectively; Figure 2E-F). For patients with the UGT1A1 (TA)6/7
genotype, the data indicate that bilirubin increased by 0.1 mg/dL for every 25.7
(ng/mL*hr/mg) unit increase in sorafenib AUC. Carriers of UGT1A1 (TA)7/7 had a
similar relationship between bilirubin and AUC (i.e., a 30.9 ng/mL*hr/mg unit increase in
AUC corresponded to a 0.1 mg/dL increase in bilirubin). These data are consistent with
previous case reports where UGT1A1 (TA)6/7 carriers developed jaundice following
sorafenib treatment and are also consistent with our results that sorafenib is a mixed
inhibitor of UGT1A1.
Genotype versus progression-free survival and toxicity
The CYP3A4*1B allele was weakly associated with PFS according to a Cox
model analysis accounting for the multiple clinical trials where the present patient cohort
was ascertained (data not shown). Those patients carrying variant alleles at CYP3A4*1B
(n=19) tended to have shorter PFS than those patients carrying homozygous wild-type
alleles (n=99; P=0.034). None of the other alleles studied herein were related to PFS
American Association for Cancer Research Copyright © 2012 on March 15, 2012clincancerres.aacrjournals.orgDownloaded from
Author manuscripts have been peer reviewed and accepted for publication but have not yet been edited.Author Manuscript Published OnlineFirst on February 3, 2012; DOI:10.1158/1078-0432.CCR-11-2484

19
(P>0.05); however, the small numbers of variants within each trial led to wide confidence
intervals for the individual hazard ratio estimates and the present results with respect to
PFS should be interpreted with caution.
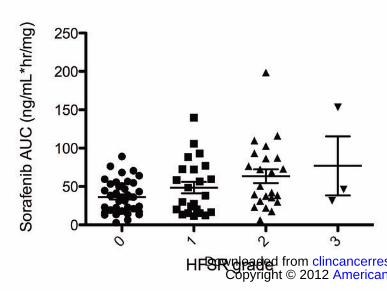
Consistent with previous literature (22), the incidence of HFSR was associated
with increases in sorafenib AUC (P=0.0054; Figure 3). However, all patients who had
AUC>100 ng·h/mL/mg (n=7) developed HFSR regardless of genotype (P=0.0085); thus,
while UGT1A genotypes were not associated with HFSR in the present study (due to
heterogeneity of phenotype and low allele frequency), it is likely that UGT1A1*28/*28
and UGT1A9*3 carriers are subject to increased incidence of HFSR as they likely have
higher exposure to sorafenib, and this should be confirmed by future studies.
American Association for Cancer Research Copyright © 2012 on March 15, 2012clincancerres.aacrjournals.orgDownloaded from
Author manuscripts have been peer reviewed and accepted for publication but have not yet been edited.Author Manuscript Published OnlineFirst on February 3, 2012; DOI:10.1158/1078-0432.CCR-11-2484
20
DISCUSSION
The case report presented here involved a child with Gilbert’s syndrome
(UGT1A1*28/*28) who upon receiving sorafenib for treatment of a neurofibroma had
higher than expected sorafenib exposure. Based on this and previously published
observations (14-17), we hypothesized and assessed if UGT1A1 genotype was associated
with sorafenib systemic exposure and serum bilirubin concentrations in patients treated
with sorafenib. We confirmed previous hypotheses and findings (14-17) that sorafenib is
an inhibitor of, but is not metabolized by, UGT1A1; rather, UGT1A9 is involved in
sorafenib glucuronidation, which also confirms another report (8). It is unclear as to the
exact reason for the approximately 4-10-fold difference in Ki values, however there is
one plausible reason. Both this study and literature described sorafenib as a mixed-type
inhibitor of UGT1A1, and although sorafenib demonstrates more noncompetitive
characteristics (based on higher model correlation), there is a competitive inhibitor
portion to the Ki calculation that is potentially altered based on the substrate used. The
UGT1A1 substrate used in the literature was SN38, whereas bilirubin was used in this
study, and the affinity of that substrate may affect the Ki of sorafenib. SN38 has a Km of
11 μM for UGT1A1 (29), whereas bilirubin has a reported Km range of 0.2-26 μM (25-
28) due to the numerous stereoisomers present. Furthermore, the Ki of 11 μM and IC50 of
18 μM are clinically-relevant plasma concentrations following 400 mg BID dosing,
which typically result in maximum plasma concentrations between 11-21 μM after a
cycle lasting either 7 or 28 days (30). Although sorafenib is >99% plasma protein bound,
there is a high enough intra-hepatic sorafenib concentration in patients to inhibit the
UGT1A1-mediated bilirubin glucuronidation. From our data, patients carrying at least
American Association for Cancer Research Copyright © 2012 on March 15, 2012clincancerres.aacrjournals.orgDownloaded from
Author manuscripts have been peer reviewed and accepted for publication but have not yet been edited.Author Manuscript Published OnlineFirst on February 3, 2012; DOI:10.1158/1078-0432.CCR-11-2484

21
one allele of UGT1A1*28 and having sorafenib AUC >60 ng*h/mL, or 130 nM*h, were
related to increases in serum bilirubin following sorafenib treatment (Figure 2E-F). This
provides clinical evidence that intra-hepatic sorafenib concentrations can be achieved in
high enough levels to inhibit UGT1A1.
The present results suggest that patients carrying only UGT1A1*28, and possibly
UGT1A9*3, alleles are at an increased risk of elevated sorafenib concentrations, as well
as a greater incidence of HFSR. However, there remained a group of patients carrying
UGT1A1*28/*28 and ABCC2 -24C>T that had abnormally low sorafenib AUC, thereby
complicating the present analysis. Nonetheless, sorafenib AUC was well correlated with
change in bilirubin concentrations in patients carrying at least a single UGT1A1*28
allele; conversely, it was not correlated with AUC in patients who carried only wild-type
genotypes at this site.
The mechanism underlying the observation that individuals carrying
UGT1A1*28/*28 also have high AUC, a phenotype that appears to be modified by
ABCC2 -24C>T, is currently unclear. We tested the hypothesis that UGT1A1*28 alleles
were merely in linkage disequilibrium with UGT1A9 alleles (i.e., UGT1A9*3, UGT1A9
IVS+1 (399C>T) and -118dT9/10) that were truly responsible for the observed differences
in AUC. While linkage was observed, the current UGT1A9 alleles did not explain the
association between UGT1A1*28/*28 and AUC. We also tested whether or not ABCC2 -
24C>T was itself related to AUC regardless of UGT1A1 genotype; this also revealed no
apparent association outside of those patients carrying UGT1A1*28/*28. Only parent
sorafenib pharmacokinetics were analyzed, however no bias was expected through
American Association for Cancer Research Copyright © 2012 on March 15, 2012clincancerres.aacrjournals.orgDownloaded from
Author manuscripts have been peer reviewed and accepted for publication but have not yet been edited.Author Manuscript Published OnlineFirst on February 3, 2012; DOI:10.1158/1078-0432.CCR-11-2484

22
analysis of metabolites, since it has previously been demonstrated that altering one
metabolic pathway of sorafenib does not alter parent drug pharmacokinetics (6).
The present results demonstrate that UGT1A1 binds sorafenib; others
demonstrated that sorafenib binds to ABCC2 and inhibits transport of other substrates but
is not transported by ABCC2 (31). Elimination of sorafenib glucuronides through
ABCC2 may also be involved, however it is unclear if sorafenib glucuronides are actually
transported by ABCC2. One previous report has also shown that the liver contains
binding sites for drugs that act as “sinks” to slowly dissociate bound drug that is
subsequently metabolized by liver enzymes (32). It is therefore possible that given the
extensive enterohepatic circulation of sorafenib (10, 11), individuals expressing relatively
high levels of liver UGT1A1 (i.e., those not carrying UGT1A1*28) and possibly other
proteins that bind sorafenib have a greater propensity to extrude sorafenib from the serum
and hold sorafenib in the liver where it can be metabolized more extensively prior to
hepatobiliary elimination. This may explain the significantly higher sorafenib AUCs of
individuals who have reduced expression of UGT1A1 due to genetic polymorphisms.
Still, our hypothesis does not explain why individuals carrying both UGT1A1*28 and
ABCC2 -24C>T variants have some of the lowest AUCs. As both proteins are involved
in bilirubin elimination (19), we expected that patients carrying both UGT1A1*28 and
ABCC2 -24C>T would have less ability to glucuronidate and eliminate bilirubin due to
decreased sorafenib-mediated UGT1A1 inhibition; however, this was not the case in the
present patient cohort (data not shown). Therefore, the fact that both proteins regulate
bilirubin concentrations that could in turn influence binding of sorafenib to UGT1A1 in
American Association for Cancer Research Copyright © 2012 on March 15, 2012clincancerres.aacrjournals.orgDownloaded from
Author manuscripts have been peer reviewed and accepted for publication but have not yet been edited.Author Manuscript Published OnlineFirst on February 3, 2012; DOI:10.1158/1078-0432.CCR-11-2484

23
the liver is not likely to be the cause of ABCC2 -24C>T modifying the sorafenib exposure
phenotype of patients carrying UGT1A1*28/*28.
Although our data did not point to a specific mechanism underlying associations
between UGT1A1*28/*28 and AUC, we observed a clear relationship between sorafenib
exposure and bilirubin concentration. We demonstrated that sorafenib inhibits bilirubin
glucuronidation as a mixed inhibitor in vitro. Based on this observation and the
aforementioned case reports, we assessed whether or not sorafenib inhibited bilirubin
glucuronidation in patients and whether or not this depended on UGT1A1 A(TA)nTAA
status. The results indicated that sorafenib exposure was not correlated with total
bilirubin concentration in patients that do not carry UGT1A1*28; however, there was an
increasingly strong correlation between sorafenib AUC and total bilirubin in patients
carrying a single copy or two copies of UGT1A1*28. Therefore, hyperbilirubinemia
appears to be a marker of high sorafenib exposure in patients expressing low levels of
UGT1A1 and care should be taken in monitoring patients carrying UGT1A1*28 that are
known to have high sorafenib exposure. Nonetheless, none of the genes studied in this
investigation were related to the PFS of the various sorafenib studies with the exception
of the weak association with the CYP3A4*1B allele. The results of the present Cox model
should be interpreted with caution.
To our knowledge, the present pilot study represents the first exploration of
sorafenib AUC in patients based on UGT1A1 and UGT1A9 genotype status and suggests
that future studies should focus on the UGT1A1 A(TA)nTAA and UGT1A9*3 alleles and
bilirubin increases in relation to sorafenib exposure, and HFSR.
American Association for Cancer Research Copyright © 2012 on March 15, 2012clincancerres.aacrjournals.orgDownloaded from
Author manuscripts have been peer reviewed and accepted for publication but have not yet been edited.Author Manuscript Published OnlineFirst on February 3, 2012; DOI:10.1158/1078-0432.CCR-11-2484

24
Acknowledgements
The authors thank Kathleen M. Wyvill and Thomas S. Uldrick for their
contributions to the BAY-KS trial. The authors also thank all participating patients in
each of the trials.
American Association for Cancer Research Copyright © 2012 on March 15, 2012clincancerres.aacrjournals.orgDownloaded from
Author manuscripts have been peer reviewed and accepted for publication but have not yet been edited.Author Manuscript Published OnlineFirst on February 3, 2012; DOI:10.1158/1078-0432.CCR-11-2484
25
Authorship Contributions
Participated in research design: Peer, Sissung, Jain, Gardner, Dahut, Giaccone,
Kummar, Kohn, Yarchoan
Conducted experiments: Peer, Kirkland, Troutman, English, Richardson, Federspiel
Performed data analysis: Peer, Sissung, Venzon, Jain, Woo
Wrote or contributed to the writing of the manuscript: Peer, Sissung, Kim, Woo,
Widemann, Kirkland, Troutman, Richardson, Venzon, Yarchoan, Figg
American Association for Cancer Research Copyright © 2012 on March 15, 2012clincancerres.aacrjournals.orgDownloaded from
Author manuscripts have been peer reviewed and accepted for publication but have not yet been edited.Author Manuscript Published OnlineFirst on February 3, 2012; DOI:10.1158/1078-0432.CCR-11-2484
26
REFERENCES 1. Jain L, Sissung TM, Danesi R, Kohn EC, Dahut WL, Kummar S, et al. Hypertension and hand-foot skin reactions related to VEGFR2 genotype and improved clinical outcome following bevacizumab and sorafenib. J Exp Clin Cancer Res 2010; 29:95. 2. Aragon-Ching JB, Jain L, Gulley JL, Arlen PM, Wright JJ, Steinberg SM, et al. Final analysis of a phase II trial using sorafenib for metastatic castration-resistant prostate cancer. BJU Int 2009; 103:1636-40. 3. Azad NS, Posadas EM, Kwitkowski VE, Steinberg SM, Jain L, Annunziata CM, et al. Combination targeted therapy with sorafenib and bevacizumab results in enhanced toxicity and antitumor activity. J Clin Oncol 2008; 26:3709-14. 4. Dahut WL, Scripture C, Posadas E, Jain L, Gulley JL, Arlen PM, et al. A phase II clinical trial of sorafenib in androgen-independent prostate cancer. Clin Cancer Res 2008; 14:209-14. 5. Jain L, Venitz J, Figg WD. Randomized discontinuation trial of sorafenib (BAY 43-9006). Cancer Biol Ther 2006; 5:1270-2. 6. Lathia C, Lettieri J, Cihon F, Gallentine M, Radtke M, Sundaresan P. Lack of effect of ketoconazole-mediated CYP3A inhibition on sorafenib clinical pharmacokinetics. Cancer Chemother Pharmacol 2006; 57:685-92. 7. Keating GM, Santoro A. Sorafenib: a review of its use in advanced hepatocellular carcinoma. Drugs 2009; 69:223-40. 8. Nexavar (Sorafenib) Prescribing Information, Bayer Pharmaceuticals. 2009 [cited; Available from: http://www.nexavar.com/html/download/Nexavar_PI.pdf 9. Girard H, Villeneuve L, Court MH, Fortier LC, Caron P, Hao Q, et al. The novel UGT1A9 intronic I399 polymorphism appears as a predictor of 7-ethyl-10-hydroxycamptothecin glucuronidation levels in the liver. Drug Metab Dispos 2006; 34:1220-8. 10. Jain L, Woo S, Gardner ER, Dahut WL, Kohn EC, Kummar S, et al. Population Pharmacokinetic Analysis of Sorafenib in Patients with Solid Tumors. Br J Clin Pharmacol 2011. 11. European Public Assessment Reports (EPAR)-Scientific Discussion. 2009 [cited; Available from: http://www.ema.europa.eu/docs/en_GB/document_library/EPAR_-_Scientific_Discussion/human/000690/WC500027707.pdf 12. Parsa V, Heilbrun L, Smith D, Sethi A, Vaishampayan U. Safety and efficacy of sorafenib therapy in patients with metastatic kidney cancer with impaired renal function. Clin Genitourin Cancer 2009; 7:E10-5. 13. Strassburg CP. Hyperbilirubinemia syndromes (Gilbert-Meulengracht, Crigler-Najjar, Dubin-Johnson, and Rotor syndrome). Best Pract Res Clin Gastroenterol 2010; 24:555-71. 14. Meza-Junco J, Chu QS, Christensen O, Rajagopalan P, Das S, Stefanyschyn R, et al. UGT1A1 polymorphism and hyperbilirubinemia in a patient who received sorafenib. Cancer Chemother Pharmacol 2009; 65:1-4.
American Association for Cancer Research Copyright © 2012 on March 15, 2012clincancerres.aacrjournals.orgDownloaded from
Author manuscripts have been peer reviewed and accepted for publication but have not yet been edited.Author Manuscript Published OnlineFirst on February 3, 2012; DOI:10.1158/1078-0432.CCR-11-2484

27
15. Miller AA, Murry DJ, Owzar K, Hollis DR, Kennedy EB, Abou-Alfa G, et al. Phase I and pharmacokinetic study of sorafenib in patients with hepatic or renal dysfunction: CALGB 60301. J Clin Oncol 2009; 27:1800-5. 16. Abou-Alfa GK, Amadori D, Santoro A, Figer A, De Greve J, Lathia C, et al. Safety and Efficacy of Sorafenib in Patients with Hepatocellular Carcinoma (HCC) and Child-Pugh A versus B Cirrhosis. Gastrointest Cancer Res 2011; 4:40-4. 17. Mross K, Steinbild S, Baas F, Gmehling D, Radtke M, Voliotis D, et al. Results from an in vitro and a clinical/pharmacological phase I study with the combination irinotecan and sorafenib. Eur J Cancer 2007; 43:55-63. 18. Dasanu CA, Alexandrescu DT, Dutcher J. Yellow skin discoloration associated with sorafenib use for treatment of metastatic renal cell carcinoma. South Med J 2007; 100:328-30. 19. Jedlitschky G, Hoffmann U, Kroemer HK. Structure and function of the MRP2 (ABCC2) protein and its role in drug disposition. Expert Opin Drug Metab Toxicol 2006; 2:351-66. 20. Kelly RJ, Rajan A, Force J, Keen C, Cao L, Yu Y, et al. Evaluation of KRAS mutations, angiogenic biomarkers and DCE-MRI in patients with advanced non-small cell lung cancer receiving sorafenib. Clin Cancer Res 2011. 21. M Gutierrez SK AD, Turkbey B, Choyke P, Wright JJ, Kurkjian C, Giaccone G, Doroshow JH, Murgo AJ. A phase II study of multikinase inhibitor sorafenib in patients with relapsed non-small cell lun cancer (NSCLC). American Society of Clinical Oncology (ASCO) 2008. 22. Azad NS, Aragon-Ching JB, Dahut WL, Gutierrez M, Figg WD, Jain L, et al. Hand-foot skin reaction increases with cumulative sorafenib dose and with combination anti-vascular endothelial growth factor therapy. Clin Cancer Res 2009; 15:1411-6. 23. Kim A DE, Tepas K, Fox E, Balis FM, Korf B, and Widemann BC. Phase I trial of sorafenib in children with neurofibromatosis Type I and inoperable plexiform neurofibromas. Neuro-Oncology; 2010. 24. Widemann BC, Fox E, Adamson PC, Baruchel S, Kim A, Ingle AM, et al. Phase I study of sorafenib in children with refractory solid tumors: A Children's Oncology Group Phase I Consortium Trial. Proc Am Soc Clin Oncology 2009. 25. Senafi SB, Clarke DJ, Burchell B. Investigation of the substrate specificity of a cloned expressed human bilirubin UDP-glucuronosyltransferase: UDP-sugar specificity and involvement in steroid and xenobiotic glucuronidation. Biochem J 1994; 303 ( Pt 1):233-40. 26. Seppen J, Bosma PJ, Goldhoorn BG, Bakker CT, Chowdhury JR, Chowdhury NR, et al. Discrimination between Crigler-Najjar type I and II by expression of mutant bilirubin uridine diphosphate-glucuronosyltransferase. J Clin Invest 1994; 94:2385-91. 27. Zhang D, Chando TJ, Everett DW, Patten CJ, Dehal SS, Humphreys WG. In vitro inhibition of UDP glucuronosyltransferases by atazanavir and other HIV protease inhibitors and the relationship of this property to in vivo bilirubin glucuronidation. Drug Metab Dispos 2005; 33:1729-39. 28. Udomuksorn W, Elliot DJ, Lewis BC, Mackenzie PI, Yoovathaworn K, Miners JO. Influence of mutations associated with Gilbert and Crigler-Najjar type II American Association for Cancer Research Copyright © 2012
on March 15, 2012clincancerres.aacrjournals.orgDownloaded from
Author manuscripts have been peer reviewed and accepted for publication but have not yet been edited.Author Manuscript Published OnlineFirst on February 3, 2012; DOI:10.1158/1078-0432.CCR-11-2484

28
syndromes on the glucuronidation kinetics of bilirubin and other UDP-glucuronosyltransferase 1A substrates. Pharmacogenet Genomics 2007; 17:1017-29. 29. Jinno H, Tanaka-Kagawa T, Hanioka N, Saeki M, Ishida S, Nishimura T, et al. Glucuronidation of 7-ethyl-10-hydroxycamptothecin (SN-38), an active metabolite of irinotecan (CPT-11), by human UGT1A1 variants, G71R, P229Q, and Y486D. Drug Metab Dispos 2003; 31:108-13. 30. Strumberg D, Clark JW, Awada A, Moore MJ, Richly H, Hendlisz A, et al. Safety, pharmacokinetics, and preliminary antitumor activity of sorafenib: a review of four phase I trials in patients with advanced refractory solid tumors. Oncologist 2007; 12:426-37. 31. Hu S, Chen Z, Franke R, Orwick S, Zhao M, Rudek MA, et al. Interaction of the multikinase inhibitors sorafenib and sunitinib with solute carriers and ATP-binding cassette transporters. Clin Cancer Res 2009; 15:6062-9. 32. Rubin GM, Tozer TN. Hepatic binding and Michaelis-Menten metabolism of drugs. J Pharm Sci 1986; 75:660-3.
American Association for Cancer Research Copyright © 2012 on March 15, 2012clincancerres.aacrjournals.orgDownloaded from
Author manuscripts have been peer reviewed and accepted for publication but have not yet been edited.Author Manuscript Published OnlineFirst on February 3, 2012; DOI:10.1158/1078-0432.CCR-11-2484
29
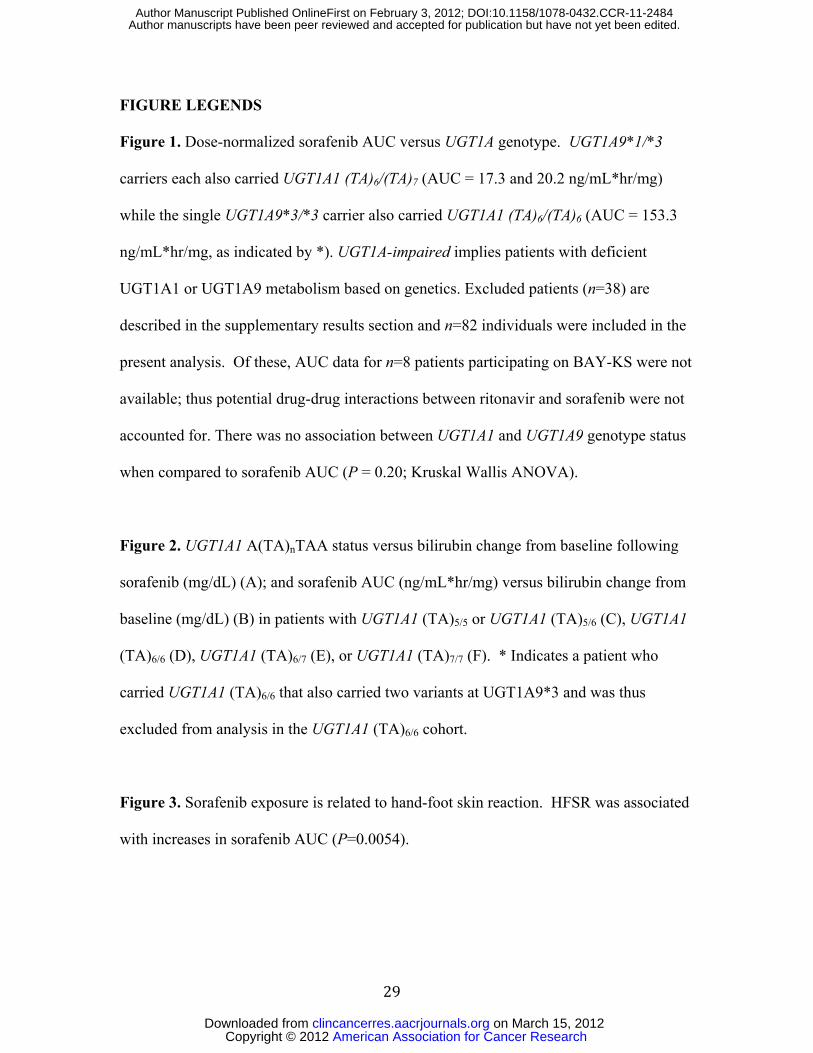
FIGURE LEGENDS
Figure 1. Dose-normalized sorafenib AUC versus UGT1A genotype. UGT1A9*1/*3
carriers each also carried UGT1A1 (TA)6/(TA)7 (AUC = 17.3 and 20.2 ng/mL*hr/mg)
while the single UGT1A9*3/*3 carrier also carried UGT1A1 (TA)6/(TA)6 (AUC = 153.3
ng/mL*hr/mg, as indicated by *). UGT1A-impaired implies patients with deficient
UGT1A1 or UGT1A9 metabolism based on genetics. Excluded patients (n=38) are
described in the supplementary results section and n=82 individuals were included in the
present analysis. Of these, AUC data for n=8 patients participating on BAY-KS were not
available; thus potential drug-drug interactions between ritonavir and sorafenib were not
accounted for. There was no association between UGT1A1 and UGT1A9 genotype status
when compared to sorafenib AUC (P = 0.20; Kruskal Wallis ANOVA).
Figure 2. UGT1A1 A(TA)nTAA status versus bilirubin change from baseline following
sorafenib (mg/dL) (A); and sorafenib AUC (ng/mL*hr/mg) versus bilirubin change from
baseline (mg/dL) (B) in patients with UGT1A1 (TA)5/5 or UGT1A1 (TA)5/6 (C), UGT1A1
(TA)6/6 (D), UGT1A1 (TA)6/7 (E), or UGT1A1 (TA)7/7 (F). * Indicates a patient who
carried UGT1A1 (TA)6/6 that also carried two variants at UGT1A9*3 and was thus
excluded from analysis in the UGT1A1 (TA)6/6 cohort.
Figure 3. Sorafenib exposure is related to hand-foot skin reaction. HFSR was associated
with increases in sorafenib AUC (P=0.0054).
American Association for Cancer Research Copyright © 2012 on March 15, 2012clincancerres.aacrjournals.orgDownloaded from
Author manuscripts have been peer reviewed and accepted for publication but have not yet been edited.Author Manuscript Published OnlineFirst on February 3, 2012; DOI:10.1158/1078-0432.CCR-11-2484
30
Tables
American Association for Cancer Research Copyright © 2012 on March 15, 2012clincancerres.aacrjournals.orgDownloaded from
Author manuscripts have been peer reviewed and accepted for publication but have not yet been edited.Author Manuscript Published OnlineFirst on February 3, 2012; DOI:10.1158/1078-0432.CCR-11-2484

31
FIGURES
American Association for Cancer Research Copyright © 2012 on March 15, 2012clincancerres.aacrjournals.orgDownloaded from
Author manuscripts have been peer reviewed and accepted for publication but have not yet been edited.Author Manuscript Published OnlineFirst on February 3, 2012; DOI:10.1158/1078-0432.CCR-11-2484