Climatic Lightning activity and its Correlations with ... International Conference on Atmospheric...
14
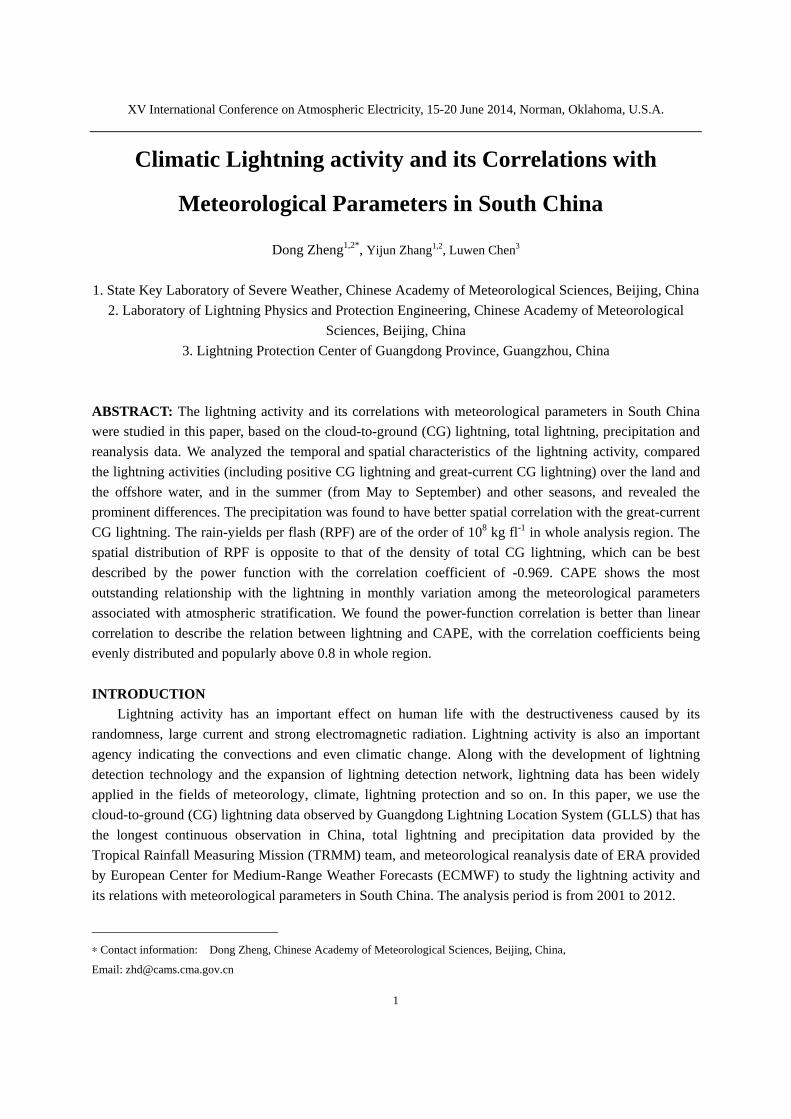
XV International Conference on Atmospheric Electricity, 15-20 June 2014, Norman, Oklahoma, U.S.A. 1 Climatic Lightning activity and its Correlations with Meteorological Parameters in South China ∗ Dong Zheng 1,2* , Yijun Zhang 1,2 , Luwen Chen 3 1. State Key Laboratory of Severe Weather, Chinese Academy of Meteorological Sciences, Beijing, China 2. Laboratory of Lightning Physics and Protection Engineering, Chinese Academy of Meteorological Sciences, Beijing, China 3. Lightning Protection Center of Guangdong Province, Guangzhou, China ABSTRACT: The lightning activity and its correlations with meteorological parameters in South China were studied in this paper, based on the cloud-to-ground (CG) lightning, total lightning, precipitation and reanalysis data. We analyzed the temporal and spatial characteristics of the lightning activity, compared the lightning activities (including positive CG lightning and great-current CG lightning) over the land and the offshore water, and in the summer (from May to September) and other seasons, and revealed the prominent differences. The precipitation was found to have better spatial correlation with the great-current CG lightning. The rain-yields per flash (RPF) are of the order of 10 8 kg fl -1 in whole analysis region. The spatial distribution of RPF is opposite to that of the density of total CG lightning, which can be best described by the power function with the correlation coefficient of -0.969. CAPE shows the most outstanding relationship with the lightning in monthly variation among the meteorological parameters associated with atmospheric stratification. We found the power-function correlation is better than linear correlation to describe the relation between lightning and CAPE, with the correlation coefficients being evenly distributed and popularly above 0.8 in whole region. INTRODUCTION Lightning activity has an important effect on human life with the destructiveness caused by its randomness, large current and strong electromagnetic radiation. Lightning activity is also an important agency indicating the convections and even climatic change. Along with the development of lightning detection technology and the expansion of lightning detection network, lightning data has been widely applied in the fields of meteorology, climate, lightning protection and so on. In this paper, we use the cloud-to-ground (CG) lightning data observed by Guangdong Lightning Location System (GLLS) that has the longest continuous observation in China, total lightning and precipitation data provided by the Tropical Rainfall Measuring Mission (TRMM) team, and meteorological reanalysis date of ERA provided by European Center for Medium-Range Weather Forecasts (ECMWF) to study the lightning activity and its relations with meteorological parameters in South China. The analysis period is from 2001 to 2012. ∗ Contact information: Dong Zheng, Chinese Academy of Meteorological Sciences, Beijing, China, Email: [email protected]
Transcript of Climatic Lightning activity and its Correlations with ... International Conference on Atmospheric...
XV International Conference on Atmospheric Electricity, 15-20 June 2014, Norman, Oklahoma, U.S.A.
1
Climatic Lightning activity and its Correlations with
Meteorological Parameters in South China∗
Dong Zheng1,2*, Yijun Zhang1,2, Luwen Chen3
1. State Key Laboratory of Severe Weather, Chinese Academy of Meteorological Sciences, Beijing, China
2. Laboratory of Lightning Physics and Protection Engineering, Chinese Academy of Meteorological
Sciences, Beijing, China
3. Lightning Protection Center of Guangdong Province, Guangzhou, China
ABSTRACT: The lightning activity and its correlations with meteorological parameters in South China
were studied in this paper, based on the cloud-to-ground (CG) lightning, total lightning, precipitation and
reanalysis data. We analyzed the temporal and spatial characteristics of the lightning activity, compared
the lightning activities (including positive CG lightning and great-current CG lightning) over the land and
the offshore water, and in the summer (from May to September) and other seasons, and revealed the
prominent differences. The precipitation was found to have better spatial correlation with the great-current
CG lightning. The rain-yields per flash (RPF) are of the order of 108 kg fl-1 in whole analysis region. The
spatial distribution of RPF is opposite to that of the density of total CG lightning, which can be best
described by the power function with the correlation coefficient of -0.969. CAPE shows the most
outstanding relationship with the lightning in monthly variation among the meteorological parameters
associated with atmospheric stratification. We found the power-function correlation is better than linear
correlation to describe the relation between lightning and CAPE, with the correlation coefficients being
evenly distributed and popularly above 0.8 in whole region.
INTRODUCTION
Lightning activity has an important effect on human life with the destructiveness caused by its
randomness, large current and strong electromagnetic radiation. Lightning activity is also an important
agency indicating the convections and even climatic change. Along with the development of lightning
detection technology and the expansion of lightning detection network, lightning data has been widely
applied in the fields of meteorology, climate, lightning protection and so on. In this paper, we use the
cloud-to-ground (CG) lightning data observed by Guangdong Lightning Location System (GLLS) that has
the longest continuous observation in China, total lightning and precipitation data provided by the
Tropical Rainfall Measuring Mission (TRMM) team, and meteorological reanalysis date of ERA provided
by European Center for Medium-Range Weather Forecasts (ECMWF) to study the lightning activity and
its relations with meteorological parameters in South China. The analysis period is from 2001 to 2012.
∗ Contact information: Dong Zheng, Chinese Academy of Meteorological Sciences, Beijing, China,
Email: [email protected]
XV International Conference on Atmospheric Electricity, 15-20 June 2014, Norman, Oklahoma, U.S.A.
2
OBSERVATION AND DATA
GLLS was first constructed in 1996 and form the network consisting of 16 time-of arrival/magnetic
direction finder in 2000 (see Figure 1). Therefore, in order to keep the consistence of the data, the initial
year of the CG data in study was chosen as 2001. The overall detection efficiency and median average
error of location accuracy of GLLS based on the data of the transmission line faults caused by lightning is
approximately equal to 86% and 1.0 km, respectively, in 1999 when there were temporarily 14 sensors in
the network [Chen S. et al. 2002]. Chen L. et al. [2012] evaluated the performance of GLLS, based on
observation data of the triggered lightning flashes obtained in Conghua, Guangdong and natural lightning
flashes to tall structures obtained in Guangzhou, Guangdong. They reported the flash detection efficiency
was about 94%, mean location error was about 710 m, and mean percentage error of peak current
estimation was 16.3%.
The original data which was associated with the return stork was combined to form lightning flash
data, according to the criterion that the adjacent return strokes in one flash should be within 0.5-s interval,
10-km distance and with same polarity. The average position of the return strokes located by the most
sensors was specified as that of the flash. The maximum peak current among the return strokes was
specified as that of the flash. In any content related to the current of flashes in this paper, the flash was
located by at least 3 sensors. Furthermore, the positive cloud-to-ground (PCG) flashes with current smaller
than 10 kA was removed from the data, due to they might be the misjudgement of cloud lightning
[Cummins et al. 1998]. The CG lightning with peak current larger than 50 kA, 75 kA, and 100 kA were
additionally taken into account as great-current CG lightning, and marked as CG50, CG75 and CG100
lightning, respectively.
TRMM satellite was launched on 28 November 1997, carrying the Lightning Imaging Sensor (LIS),
Precipitation Radar (PR), TRMM Microwave Imager (TMI), Visible and InfraRed Scanner (VIRS) and
Cloud and Earth Radiant Energy Sensor (CERES). The LIS Gridded Lightning Climatology Data was
used to demonstrate the total lightning activity in analysis region. The specific style of the data and its
feature in this dataset were described by Daniel et al. [2014]. It should be noted that this gridded
climatology data is calculated based on the LIS observation and was not consistent with the CG data in
years. The time of the data referred by LIS gridded climatology data should cover that of the CG data. But,
because we considered the climatic statistics, the spatial-temporal characteristics should be comparable.
The TRMM 3B43 dataset, i.e., TRMM and Other Data Precipitation Product, was used to exhibit the
monthly precipitation with grid size of 0.25 degree.
ERA-interim data provided the monthly means of reanalysis meteorological field and helped to
understand the correlation of the lightning activity and meteorological parameters. The data with grid size
of 0.75 degree was chosen.
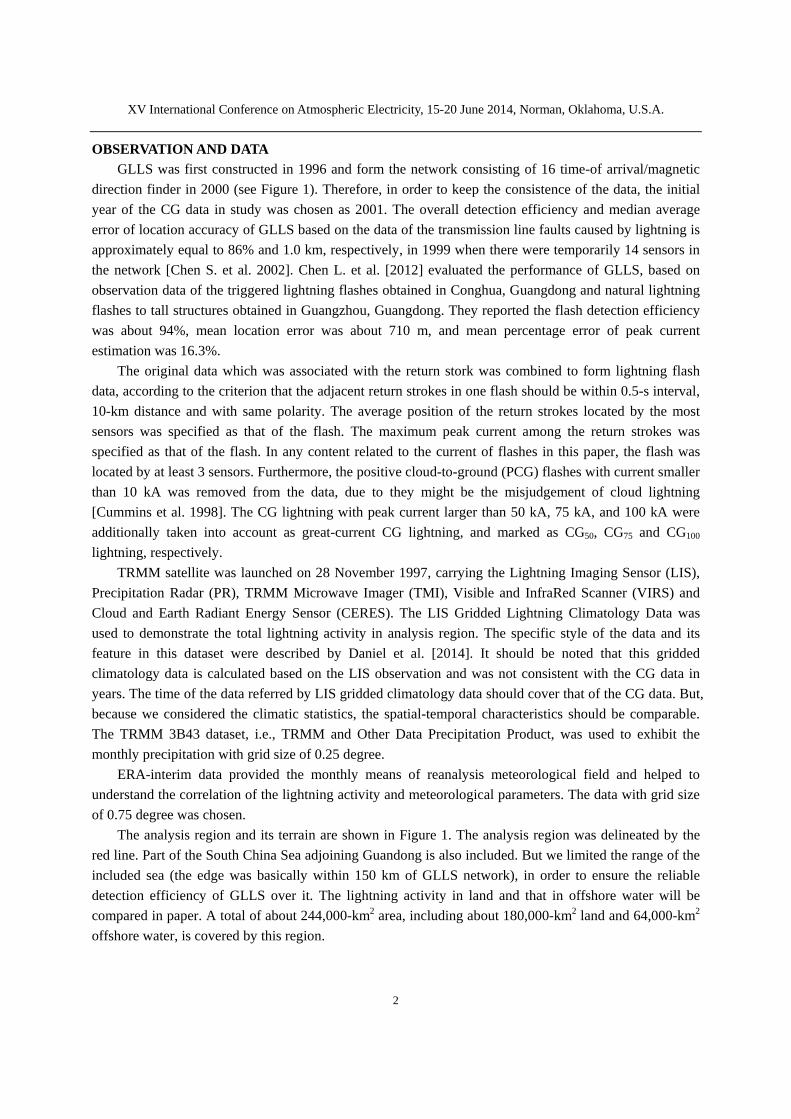
The analysis region and its terrain are shown in Figure 1. The analysis region was delineated by the
red line. Part of the South China Sea adjoining Guandong is also included. But we limited the range of the
included sea (the edge was basically within 150 km of GLLS network), in order to ensure the reliable
detection efficiency of GLLS over it. The lightning activity in land and that in offshore water will be
compared in paper. A total of about 244,000-km2 area, including about 180,000-km2 land and 64,000-km2
offshore water, is covered by this region.
XV International Conference on Atmospheric Electricity, 15-20 June 2014, Norman, Oklahoma, U.S.A.
3
Fig. 1 The analysis region (delineated by the red curve) and the positions of GLLS sensors
superposed on the color map showing the terrain. The red curve on the land describes the land part of the
Guangdong administrative boundary.
LIGHTNING ACITIVITY AND ITS LAND-SEA DIFFERENCE
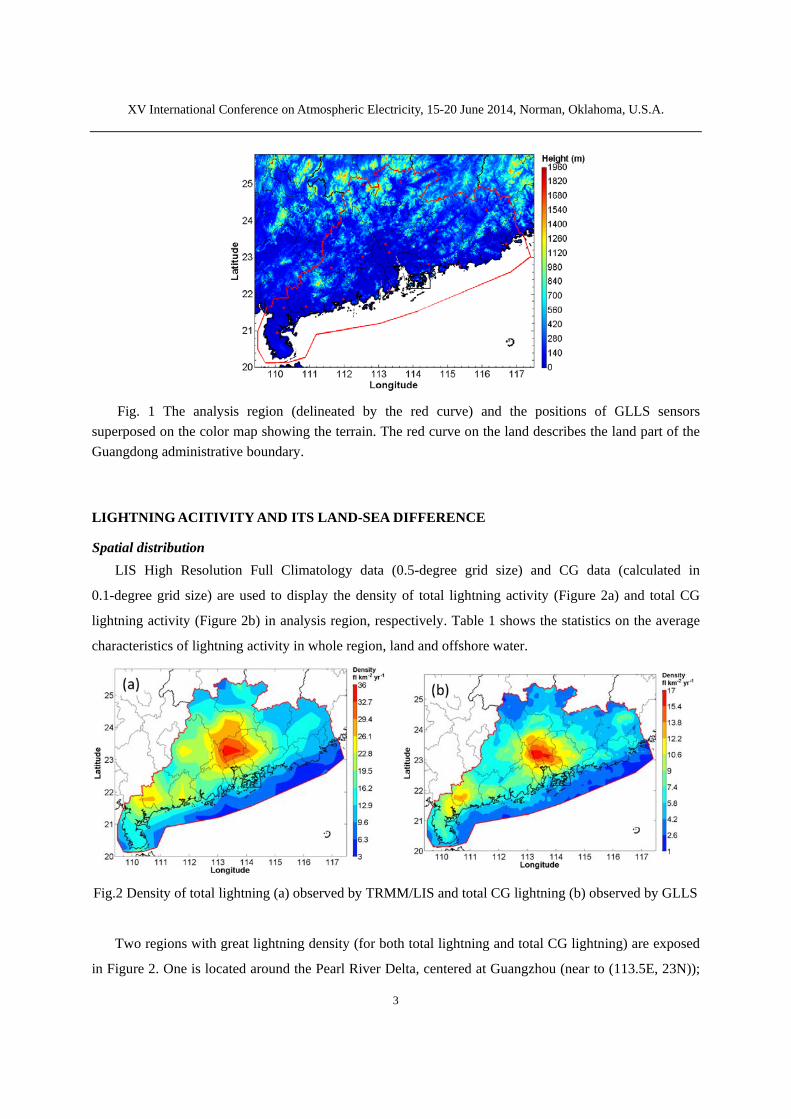
Spatial distribution LIS High Resolution Full Climatology data (0.5-degree grid size) and CG data (calculated in
0.1-degree grid size) are used to display the density of total lightning activity (Figure 2a) and total CG
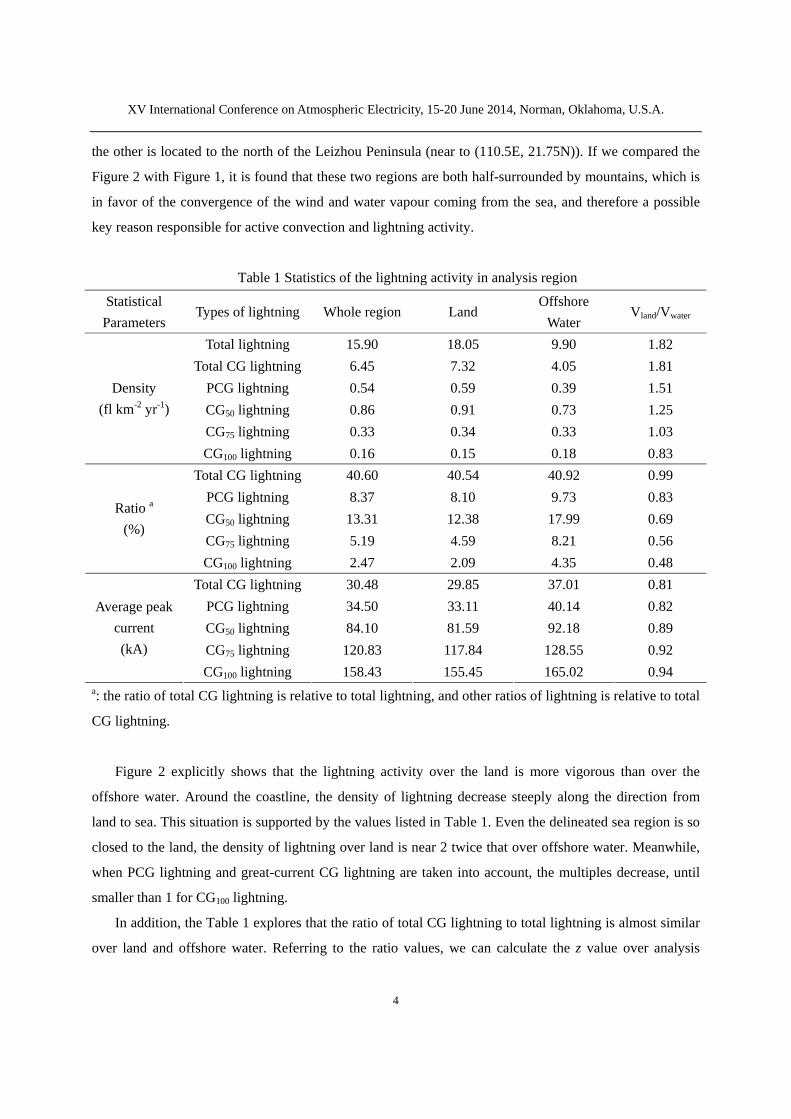
lightning activity (Figure 2b) in analysis region, respectively. Table 1 shows the statistics on the average
characteristics of lightning activity in whole region, land and offshore water.
Fig.2 Density of total lightning (a) observed by TRMM/LIS and total CG lightning (b) observed by GLLS
Two regions with great lightning density (for both total lightning and total CG lightning) are exposed
in Figure 2. One is located around the Pearl River Delta, centered at Guangzhou (near to (113.5E, 23N));
XV International Conference on Atmospheric Electricity, 15-20 June 2014, Norman, Oklahoma, U.S.A.
4
the other is located to the north of the Leizhou Peninsula (near to (110.5E, 21.75N)). If we compared the
Figure 2 with Figure 1, it is found that these two regions are both half-surrounded by mountains, which is
in favor of the convergence of the wind and water vapour coming from the sea, and therefore a possible
key reason responsible for active convection and lightning activity.
Table 1 Statistics of the lightning activity in analysis region
Statistical
Parameters Types of lightning Whole region Land
Offshore
Water Vland/Vwater
Total lightning 15.90 18.05 9.90 1.82
Total CG lightning 6.45 7.32 4.05 1.81
PCG lightning 0.54 0.59 0.39 1.51
CG50 lightning 0.86 0.91 0.73 1.25
CG75 lightning 0.33 0.34 0.33 1.03
Density
(fl km-2 yr-1)
CG100 lightning 0.16 0.15 0.18 0.83
Total CG lightning 40.60 40.54 40.92 0.99
PCG lightning 8.37 8.10 9.73 0.83
CG50 lightning 13.31 12.38 17.99 0.69
CG75 lightning 5.19 4.59 8.21 0.56
Ratio a
(%)
CG100 lightning 2.47 2.09 4.35 0.48
Total CG lightning 30.48 29.85 37.01 0.81
PCG lightning 34.50 33.11 40.14 0.82
CG50 lightning 84.10 81.59 92.18 0.89
CG75 lightning 120.83 117.84 128.55 0.92
Average peak
current
(kA)
CG100 lightning 158.43 155.45 165.02 0.94 a: the ratio of total CG lightning is relative to total lightning, and other ratios of lightning is relative to total
CG lightning.
Figure 2 explicitly shows that the lightning activity over the land is more vigorous than over the
offshore water. Around the coastline, the density of lightning decrease steeply along the direction from
land to sea. This situation is supported by the values listed in Table 1. Even the delineated sea region is so
closed to the land, the density of lightning over land is near 2 twice that over offshore water. Meanwhile,
when PCG lightning and great-current CG lightning are taken into account, the multiples decrease, until
smaller than 1 for CG100 lightning.
In addition, the Table 1 explores that the ratio of total CG lightning to total lightning is almost similar
over land and offshore water. Referring to the ratio values, we can calculate the z value over analysis
XV International Conference on Atmospheric Electricity, 15-20 June 2014, Norman, Oklahoma, U.S.A.
5
region is about 1.46, which is within the interval of 1.1—3.8 for latitude ranging from 20º to 40º reported
by Mackerras and Darvenize [1994], but greater smaller than that for approximate latitude belt suggested
by Prentice and Mackerras [1977] and Mackerras et al. [1998] (around 3—4). We further find the ratios of
PCG lightning and great-current CG lightning to the total CG lightning over land are clearly smaller than
those over offshore water. The grater of the peak current of the CG lightning, the more distinct the
difference of the ratios between over land and over offshore water is. Furthermore, all kinds of CG
lightning over the land have smaller peak current than those over offshore water.
Temporal variation
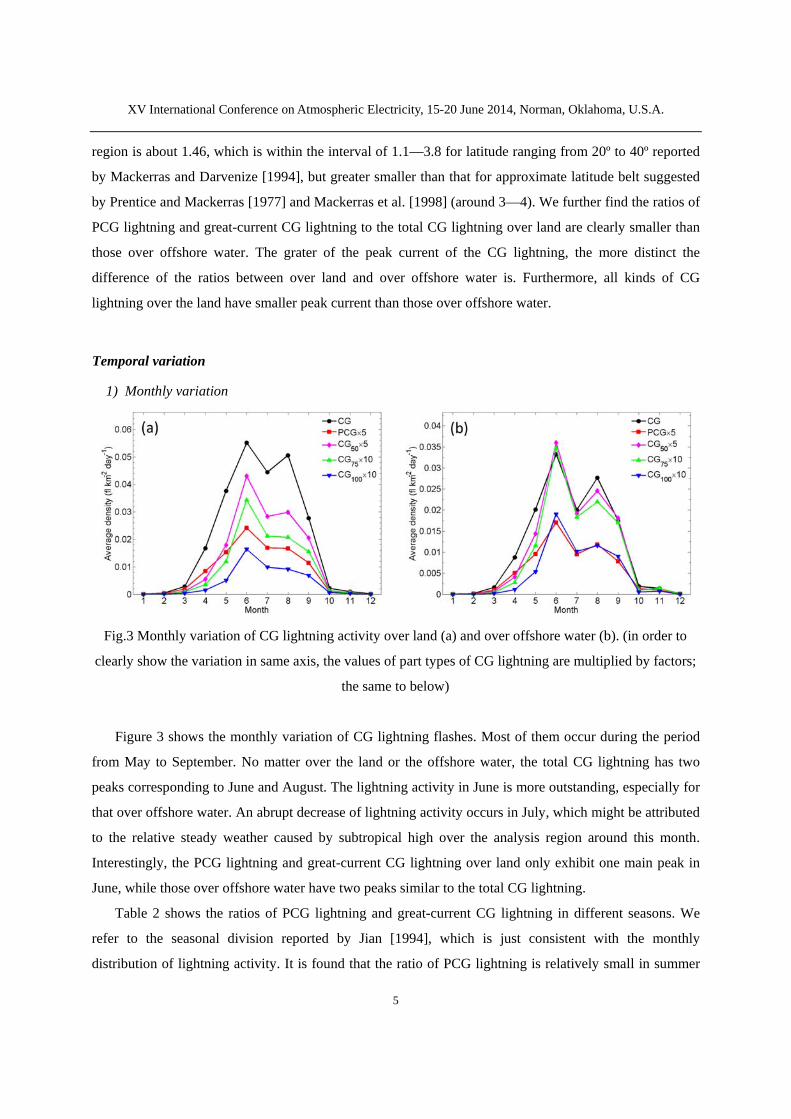
1) Monthly variation
Fig.3 Monthly variation of CG lightning activity over land (a) and over offshore water (b). (in order to
clearly show the variation in same axis, the values of part types of CG lightning are multiplied by factors;
the same to below)
Figure 3 shows the monthly variation of CG lightning flashes. Most of them occur during the period
from May to September. No matter over the land or the offshore water, the total CG lightning has two
peaks corresponding to June and August. The lightning activity in June is more outstanding, especially for
that over offshore water. An abrupt decrease of lightning activity occurs in July, which might be attributed
to the relative steady weather caused by subtropical high over the analysis region around this month.
Interestingly, the PCG lightning and great-current CG lightning over land only exhibit one main peak in
June, while those over offshore water have two peaks similar to the total CG lightning.
Table 2 shows the ratios of PCG lightning and great-current CG lightning in different seasons. We
refer to the seasonal division reported by Jian [1994], which is just consistent with the monthly
distribution of lightning activity. It is found that the ratio of PCG lightning is relatively small in summer
XV International Conference on Atmospheric Electricity, 15-20 June 2014, Norman, Oklahoma, U.S.A.
6
and large in other seasons. Meanwhile, the ratios of great-current CG lightning are relatively large in
summer and small in other seasons.
Table 2 Ratios of PCG lightning and great-current CG lightning to total CG lightning in different
seasons.
regions Types of lightning Summer
(from May to September)
Other seasons
(from October to April of the
second year)
PCG lightning 7.87% 10.43%
CG50 lightning 12.88% 7.67%
CG75 lightning 4.76% 3.26% Land
CG100 lightning 2.16% 1.56%
PCG lightning 9.35% 15.27%
CG50 lightning 18.71% 9.07%
CG75 lightning 8.59% 3.95%
Offshore
water
CG100 lightning 4.57% 1.99%
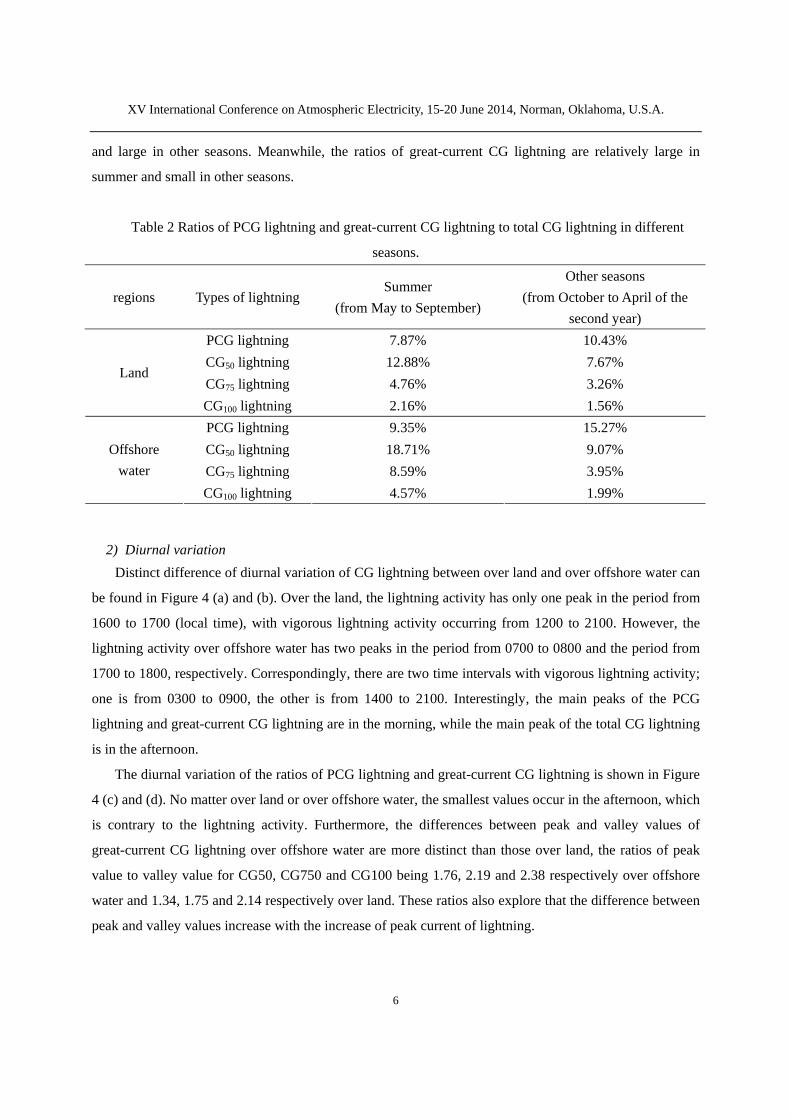
2) Diurnal variation Distinct difference of diurnal variation of CG lightning between over land and over offshore water can
be found in Figure 4 (a) and (b). Over the land, the lightning activity has only one peak in the period from
1600 to 1700 (local time), with vigorous lightning activity occurring from 1200 to 2100. However, the
lightning activity over offshore water has two peaks in the period from 0700 to 0800 and the period from
1700 to 1800, respectively. Correspondingly, there are two time intervals with vigorous lightning activity;
one is from 0300 to 0900, the other is from 1400 to 2100. Interestingly, the main peaks of the PCG
lightning and great-current CG lightning are in the morning, while the main peak of the total CG lightning
is in the afternoon.
The diurnal variation of the ratios of PCG lightning and great-current CG lightning is shown in Figure
4 (c) and (d). No matter over land or over offshore water, the smallest values occur in the afternoon, which
is contrary to the lightning activity. Furthermore, the differences between peak and valley values of
great-current CG lightning over offshore water are more distinct than those over land, the ratios of peak
value to valley value for CG50, CG750 and CG100 being 1.76, 2.19 and 2.38 respectively over offshore
water and 1.34, 1.75 and 2.14 respectively over land. These ratios also explore that the difference between
peak and valley values increase with the increase of peak current of lightning.
XV International Conference on Atmospheric Electricity, 15-20 June 2014, Norman, Oklahoma, U.S.A.
7
Fig.4 Diurnal variation of CG lightning activity over land (a) and over offshore water (b), and diurnal
variation of ratios of PCG lightning and great-current CG lightning over land (c) and over offshore water
(d). (the time labelled in x axes mean the period of an hour)
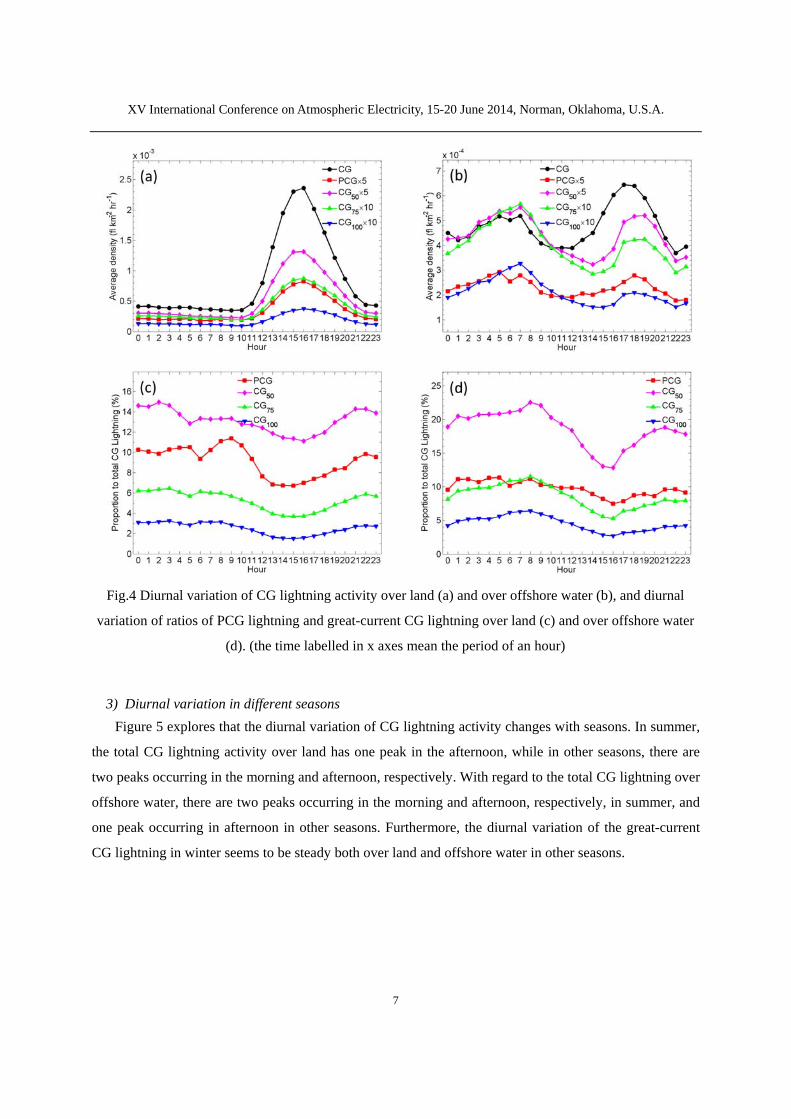
3) Diurnal variation in different seasons Figure 5 explores that the diurnal variation of CG lightning activity changes with seasons. In summer,
the total CG lightning activity over land has one peak in the afternoon, while in other seasons, there are
two peaks occurring in the morning and afternoon, respectively. With regard to the total CG lightning over
offshore water, there are two peaks occurring in the morning and afternoon, respectively, in summer, and
one peak occurring in afternoon in other seasons. Furthermore, the diurnal variation of the great-current
CG lightning in winter seems to be steady both over land and offshore water in other seasons.
XV International Conference on Atmospheric Electricity, 15-20 June 2014, Norman, Oklahoma, U.S.A.
8
Fig.5 Diurnal variation of CG lightning activity over land and offshore water in different seasons. (a1):
over land in summer; (a2) over land in other seasons; (b1): over offshore water in summer; (b2) over
offshore water in other seasons.
RELATION BETWEEN LIGHTNING AND PRECIPITATION
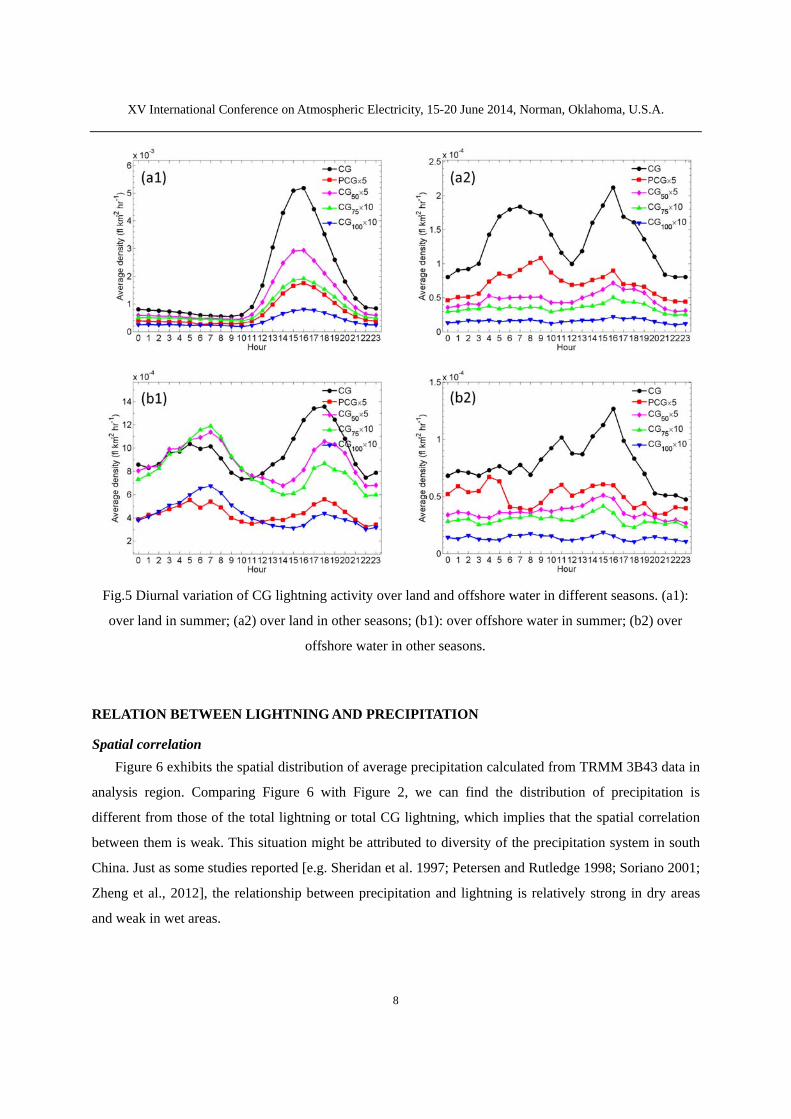
Spatial correlation Figure 6 exhibits the spatial distribution of average precipitation calculated from TRMM 3B43 data in
analysis region. Comparing Figure 6 with Figure 2, we can find the distribution of precipitation is
different from those of the total lightning or total CG lightning, which implies that the spatial correlation
between them is weak. This situation might be attributed to diversity of the precipitation system in south
China. Just as some studies reported [e.g. Sheridan et al. 1997; Petersen and Rutledge 1998; Soriano 2001;
Zheng et al., 2012], the relationship between precipitation and lightning is relatively strong in dry areas
and weak in wet areas.
XV International Conference on Atmospheric Electricity, 15-20 June 2014, Norman, Oklahoma, U.S.A.
9
Fig.6 spatial distribution of average precipitation calculated from TRMM 3B43 data in 0.25-degree grids
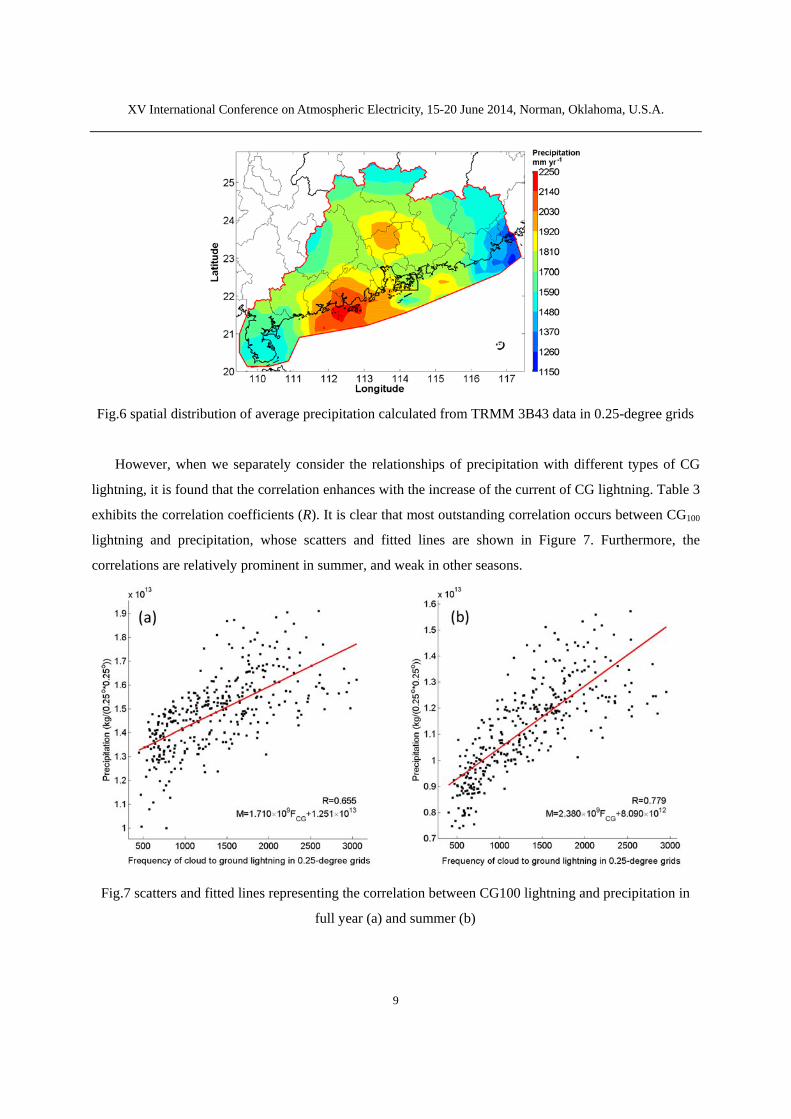
However, when we separately consider the relationships of precipitation with different types of CG
lightning, it is found that the correlation enhances with the increase of the current of CG lightning. Table 3
exhibits the correlation coefficients (R). It is clear that most outstanding correlation occurs between CG100
lightning and precipitation, whose scatters and fitted lines are shown in Figure 7. Furthermore, the
correlations are relatively prominent in summer, and weak in other seasons.
Fig.7 scatters and fitted lines representing the correlation between CG100 lightning and precipitation in
full year (a) and summer (b)
XV International Conference on Atmospheric Electricity, 15-20 June 2014, Norman, Oklahoma, U.S.A.
10
Table 3 Correlation of precipitation with different types of CG lightning
Types of CG lightning Total CG
lightning
PCG
lightning
NCG
lightning
CG50
lightning
CG75
lightning
CG100
lightning
R 0.281 0.480 0.258 0.523 0.612 0.655
R in summer 0.306 0.564 0.278 0.586 0.715 0.779
R in other seasons 0.088 -0.157 0.115 -0.077 -0.121 -0.092
Rain-yields per flash (RPF)
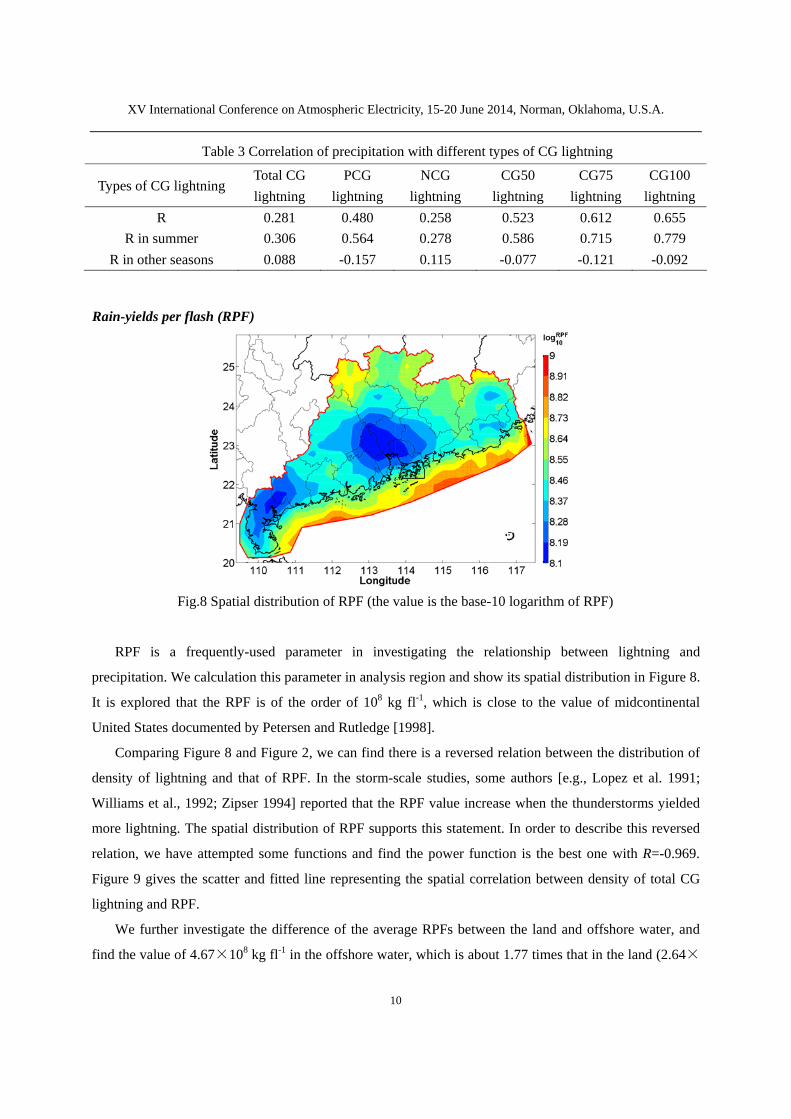
Fig.8 Spatial distribution of RPF (the value is the base-10 logarithm of RPF)
RPF is a frequently-used parameter in investigating the relationship between lightning and
precipitation. We calculation this parameter in analysis region and show its spatial distribution in Figure 8.
It is explored that the RPF is of the order of 108 kg fl-1, which is close to the value of midcontinental
United States documented by Petersen and Rutledge [1998].
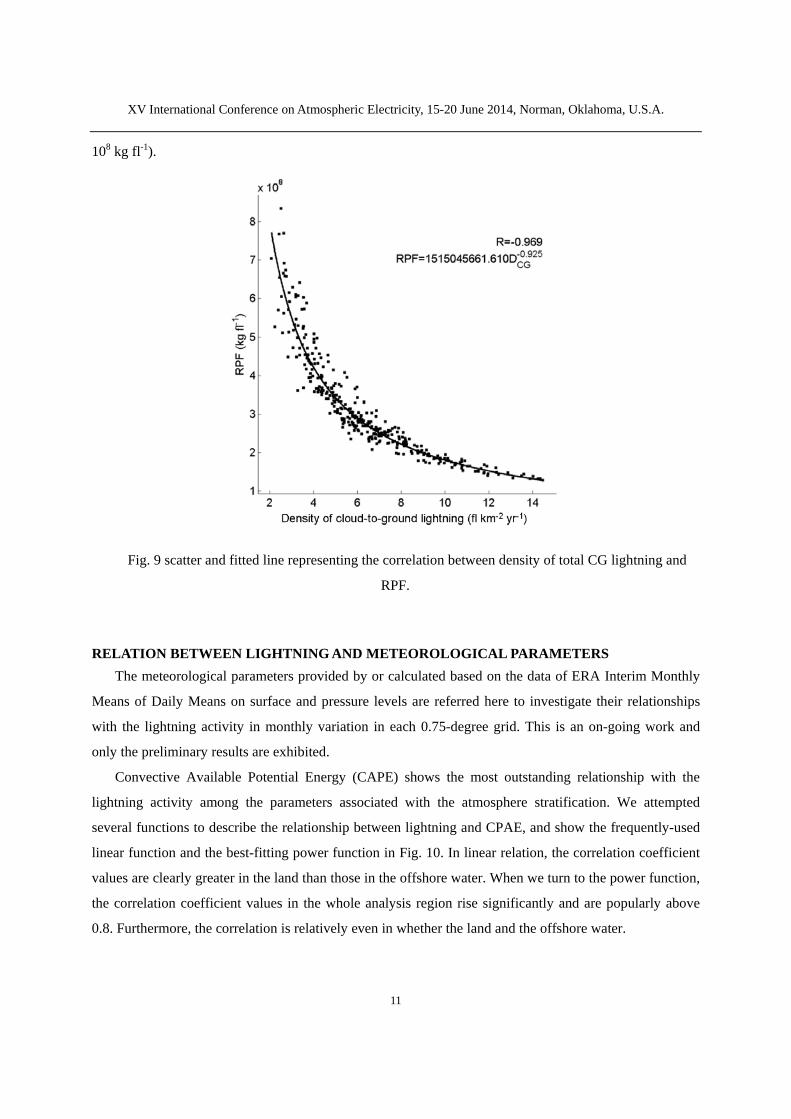
Comparing Figure 8 and Figure 2, we can find there is a reversed relation between the distribution of
density of lightning and that of RPF. In the storm-scale studies, some authors [e.g., Lopez et al. 1991;
Williams et al., 1992; Zipser 1994] reported that the RPF value increase when the thunderstorms yielded
more lightning. The spatial distribution of RPF supports this statement. In order to describe this reversed
relation, we have attempted some functions and find the power function is the best one with R=-0.969.
Figure 9 gives the scatter and fitted line representing the spatial correlation between density of total CG
lightning and RPF.
We further investigate the difference of the average RPFs between the land and offshore water, and
find the value of 4.67×10⁸ kg fl-1 in the offshore water, which is about 1.77 times that in the land (2.64×
XV International Conference on Atmospheric Electricity, 15-20 June 2014, Norman, Oklahoma, U.S.A.
11
108 kg fl-1).
Fig. 9 scatter and fitted line representing the correlation between density of total CG lightning and
RPF.
RELATION BETWEEN LIGHTNING AND METEOROLOGICAL PARAMETERS
The meteorological parameters provided by or calculated based on the data of ERA Interim Monthly
Means of Daily Means on surface and pressure levels are referred here to investigate their relationships
with the lightning activity in monthly variation in each 0.75-degree grid. This is an on-going work and
only the preliminary results are exhibited.
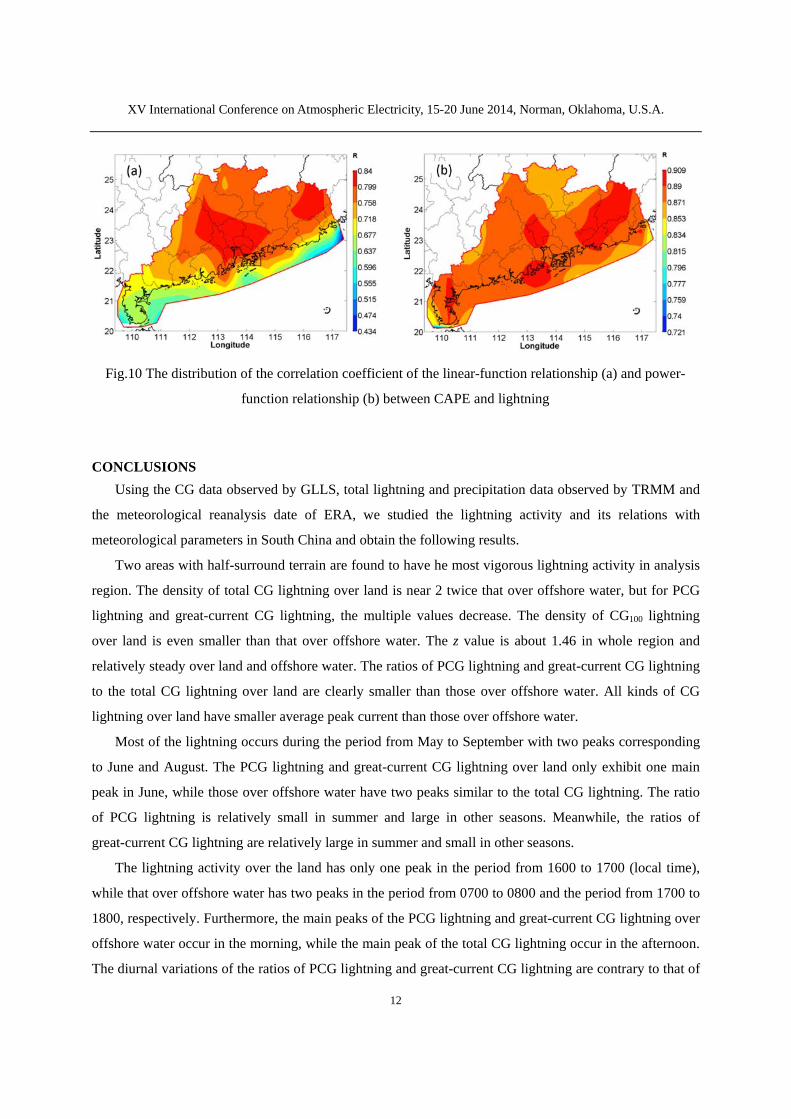
Convective Available Potential Energy (CAPE) shows the most outstanding relationship with the
lightning activity among the parameters associated with the atmosphere stratification. We attempted
several functions to describe the relationship between lightning and CPAE, and show the frequently-used
linear function and the best-fitting power function in Fig. 10. In linear relation, the correlation coefficient
values are clearly greater in the land than those in the offshore water. When we turn to the power function,
the correlation coefficient values in the whole analysis region rise significantly and are popularly above
0.8. Furthermore, the correlation is relatively even in whether the land and the offshore water.
XV International Conference on Atmospheric Electricity, 15-20 June 2014, Norman, Oklahoma, U.S.A.
12
Fig.10 The distribution of the correlation coefficient of the linear-function relationship (a) and power-
function relationship (b) between CAPE and lightning
CONCLUSIONS
Using the CG data observed by GLLS, total lightning and precipitation data observed by TRMM and
the meteorological reanalysis date of ERA, we studied the lightning activity and its relations with
meteorological parameters in South China and obtain the following results.
Two areas with half-surround terrain are found to have he most vigorous lightning activity in analysis
region. The density of total CG lightning over land is near 2 twice that over offshore water, but for PCG
lightning and great-current CG lightning, the multiple values decrease. The density of CG100 lightning
over land is even smaller than that over offshore water. The z value is about 1.46 in whole region and
relatively steady over land and offshore water. The ratios of PCG lightning and great-current CG lightning
to the total CG lightning over land are clearly smaller than those over offshore water. All kinds of CG
lightning over land have smaller average peak current than those over offshore water.
Most of the lightning occurs during the period from May to September with two peaks corresponding
to June and August. The PCG lightning and great-current CG lightning over land only exhibit one main
peak in June, while those over offshore water have two peaks similar to the total CG lightning. The ratio
of PCG lightning is relatively small in summer and large in other seasons. Meanwhile, the ratios of
great-current CG lightning are relatively large in summer and small in other seasons.
The lightning activity over the land has only one peak in the period from 1600 to 1700 (local time),
while that over offshore water has two peaks in the period from 0700 to 0800 and the period from 1700 to
1800, respectively. Furthermore, the main peaks of the PCG lightning and great-current CG lightning over
offshore water occur in the morning, while the main peak of the total CG lightning occur in the afternoon.
The diurnal variations of the ratios of PCG lightning and great-current CG lightning are contrary to that of
XV International Conference on Atmospheric Electricity, 15-20 June 2014, Norman, Oklahoma, U.S.A.
13
the CG lightning, with their smallest values occurring in afternoon. The differences of ratios between peak
and valley values of great-current CG lightning over offshore water are more distinct than those over land.
In summer, the total CG lightning activity over land has one peak in the afternoon, while in other seasons,
there are two peaks occurring in the morning and afternoon, respectively. On the contrary, the total CG
lightning over offshore water has two peaks occurring in the morning and afternoon, respectively, in
summer, and one peak occurring in afternoon in other seasons.
The total CG lightning activity has weak spatial correlation with precipitation. However, we find that
the correlation enhances with the increase of the current of CG lightning. For CG100 lightning, the
correlation coefficient is 0.779 in summer. The RPF in whole region is of the order of 108 kg fl-1, which is
close to the value of midcontinental United States. The average RPF in the offshore water (4.67×10⁸ kg
fl-1) is about 1.77 times that in the land (2.64×10⁸ kg fl-1). A prominent reversed relation between the
spatial distributions of density of lightning and that of RPF is exposed. It can be best described by the
power function with the correlation coefficient of -0.969.
CAPE shows the most outstanding relationship with the lightning in monthly variation among the
meteorological parameters associated with atmospheric stratification. When we refer to the linear
correlation, the relationship is clearly strong in the land and weak in the offshore water. The
power-function correlation is better, with the correlation coefficients being popularly above 0.8 in whole
region and relatively even in whether the land and the offshore water.
ACKNOWLEDGMENTS
This work is supported by Basic Research Fund of Chinese Academy of Meteorological Sciences
(Grant No. 2013Z006) and National Key Basic Research Program of China (2014CB441402).
The authors would like to acknowledge European Center for Medium-Range Weather Forecasts
(ECMWF) who provided the ERA-interim reanalysis data.
The data of total lightning and precipitation were acquired as part of the Tropical Rainfall Measuring
Mission (TRMM). The algorithms were developed by the TRMM Science Team. The data were processed
by the TRMM Science Data and Information System (TSDIS) and the TRMM Office; they are archived
and distributed by the Goddard Earth Sciences Data and Information Services Center (GES DISC).
TRMM is an international project jointly sponsored by the Japan National Space Development Agency
(NASDA) and the U.S. National Aeronautics and Space Admin- istration (NASA) Office of Earth
Sciences.
XV International Conference on Atmospheric Electricity, 15-20 June 2014, Norman, Oklahoma, U.S.A.
14
REFERENCES Chen, L., Y. Zhang, W. Lu, D. Zheng, Y. Zhang, S. Chen, and Z. Huang, 2012: Performance Evaluation for a
Lightning Location System Based on Observations of Artificially Triggered Lightning and Natural Lightning
Flashes. J. Atmos. Oceanic Technol., 29(12), 1835-1844.
Chen. S., Y. Du, L. Fan, H. He, and D. Zhong, 2002: Evaluation of the Guang Dong lightning-location system with
transmission line fault data. Proc. Inst. Elect. Eng., Sci. Meas. Technol., 149(1), 9-16.
Cummins, K. L., M. J. Murphy, E. A. Bardo, W. L. Hiscox, R. B. Pyle and A. E. Pifer, 1998: A combined TOA/MDF
technology upgrade of the U.S. National Lightning Detection Network. J. Geophys. Res., 103(D8), 9035-9044.
Daniel, J. C., E. B. Buechler, and J. B. Richard, 2014: Gridded lightning climatology from TRMM-LIS and OTD:
Dataset description. Atmos. Res., 135-136, 404-414.
Jian, M., 1994: The division of seasons for the South China region. Acta Scientiarum Naturalium Universitatis
Sunyatseni, 33(2), 131-133 (in Chinese).
López, R. E., R. Ortíz, W. D. Otto, and R. L. Holle, 1991: The lightning activity and precipitation yield of convective
cloud systems in central Florida. Preprints, 25th International Conf. on Radar Meteorology, Amer. Meteor. Soc.,
907-910.
Mackerras D., and M. Darveniza, 1994: Latitudinal variation of lightning occurrence characteristics. J. Geophys.
Res., 99(D5), 10813-10821.
MacKerras, D., M. Darveniza, R. E. Orville, E. R. Williams, and S. J. Goodman, 1998: Global lightning: total, cloud
and ground flash estimates. J. Geophys. Res., 103(D16), 10813-10821.
Petersen, W. A. and Rutledge S. A., 1998: On the relationship between cloud-to-ground lightning and convective
rainfall. J. Geophys. Res., 103(D12), 14025-14040.
Prentice, S. A., and Mackerras D., 1977: The ratio of cloud to cloud-ground lightning flashes in thunderstorms. J.
Appl. Meteor., 16, 545-550.
Sheridan, S. C., J. F. Griffiths, and R. E. Orville, 1997: Warm Season Cloud-to-Ground Lightning–Precipitation
Relationships in the South-Central United States. Wea. Forecasting, 12, 449–458.
Soriano, L. R., F. de Pablo, E. G. Díez, 2001: Relationship between Convective Precipitation and Cloud-to-Ground
Lightning in the Iberian Peninsula. Mon. Wea. Rev., 129, 2998–3003.
Williams, E. R., S. A. Rutledge, S. G. Geotis, N. Renno, S. A. Rutledge, E. Rasmussen, T. Rickenbach, 1992: A radar
and electrical study of tropical “hot towers”. J. Atmos. Sci., 49, 1386-1395.
Zheng, D., J. Dan, Y. Zhang, C. Wu, C. Zeng, 2012: Regional differences of relationship between cloud-to-ground
lightning and precipitation in China. J. Tropical Meteor., 28(4), 569-576.
Zipser, E. J., 1994: Deep cumulonimbus cloud systems in the tropics with and without lightning. Mon. Weather Rev.,
122, 1837-1851.