Climate variability in the region of future Tiksi ... variability in the region of future Tiksi...
31
Climate variability in the region of future Tiksi Hydrometeorological Observatory Republic Sakha (Yakutia) Russia Makshtas A., N. Ivanov, S, Shutilin Arctic and Antarctic Research Institute, Saint Petersburg, Russia T. Uttal NOAA/Earth Systems Research Laboratory, Boulder, Colorado,
-
Upload
truongkien -
Category
Documents
-
view
218 -
download
0
Transcript of Climate variability in the region of future Tiksi ... variability in the region of future Tiksi...

Climate variability in the region of future Tiksi Hydrometeorological ObservatoryRepublic Sakha (Yakutia) Russia
Makshtas A., N. Ivanov, S, ShutilinArctic and Antarctic Research Institute, Saint Petersburg, Russia
T. UttalNOAA/Earth Systems Research Laboratory, Boulder, Colorado,

Barrow
Alert
Eureka
Summit
Ny-Alesund
Abisko
Тикси
Sammultunturi (Pallas)
The Tiksi Hydrometeorological Observatory is designed for co-location of observations supporting networks such as BSRN, GAW, UV-NET, CRN, AeroNET, MPLNET and others (including permafrost and other measurements)

Полярка
Поселок Тикси
Аэропорт
Дельта Лены
MODIS “250m” data (Channel 1-3-6) from 062302, TERRA 0300 UTC
Courtesy of MODIS Rapidfire gallery
View of future Tiksi Observatory in from space
(Lena mouth)
(Airport)
(Meteorological station)
(Village Tiksi)

Existing positions of meteorological and radiosounding observations , measurements of fast ice thickness, sea level, water temperature
and salinity
Place for fast ice, water temperature, and salinity measurements
Place for meteorological observations
Pavilion for radiosoundings

Standard surface meteorological observations have been made with consistent methods since 1934

Radiosoundings in “
Polarka”
started in 1935 and continue to present
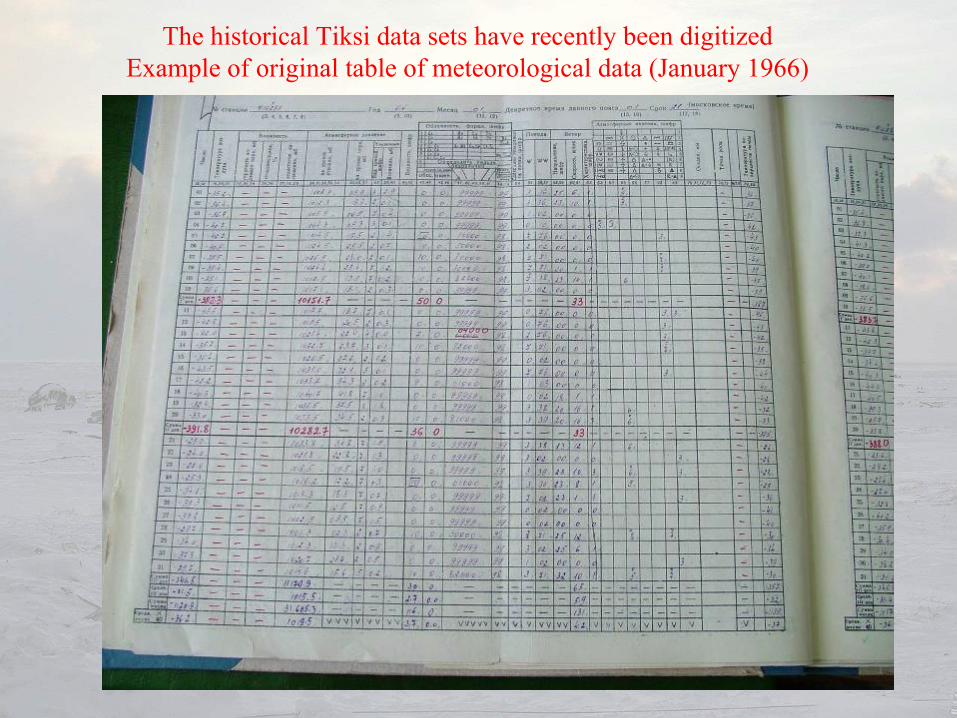
The historical Tiksi data sets have recently been digitized Example of original table of meteorological data (January 1966)

Data correction
Four steps of Archive corrections had been used for correction of about 1.23 million data prepared from hand written log books, sometimes of low quality, with a lot of improvements. For that EXEL files for each calendar month had been prepared to exclude seasonal variability.
1step.
With EXEL graphic presentations of file for each month of each meteorological parameter rough errors had been deleted.
2 step. Mean square deviations of data rows had been calculated to be sure that all rough mistakes had been deleted.
3 step.
Graphic analysis of probably wrong information had been done by
comparison of dubious
data with neighboring data in the same data row.
4 step. After 1-3 steps by number sequence
of measured data xi
, i=1,2,…,n the data rows and its sums had been calculated:
δxi
= ⎜xi -
xi-1⎜, i=1,2,…,n-1
Additional control had been executed by comparison of maximal daily variation of air surface temperature with data of maximal and minimal thermometers. Despite low accuracy of last measurements 72 mistake of air surface temperature had been found. The same procedure with comparison the values of total and low cloudiness had been made.
∑−
=
δ−
=δ1n
1kk
* x1n
1
In case δxi > D*δ the data with numbers i-1, i, i+1are assumed as doubtful and controlled by
logbooks. We used D=5 for step 4.

MISSING DATA
The number of months with more than 5 days of missing wind speed data is 3 out of 840 months.The number of months with more than 5 days of missing air temperature data during is 4. There are only 136 days missing air pressure data in entire dataset.Consequently, using the criteria that data must be present 4 times per day for more than 25 days/month, only 0.5% of the original data had been excluded from statistical calculations
Year Month1 2 3 4 5 6 7 8 9 10 11 12
1937 31 27 31 30 31 30 31 31 30 31 30 31
1938 31 27 31 30 31 30 31 31 30 31 29 31
1939 31 27 31 30 31 30 31 31 30 31 30 31
1941 31 27 31 30 31 30 31 31 30 31 30 31
1942 31 27 31 30 31 30 31 31 30 31 30 31
1943 31 27 31 30 31 30 31 31 30 31 30 31
1945 31 27 31 30 31 30 31 31 30 31 30 31
1946 31 27 31 30 31 30 31 31 30 31 29 31
1947 31 27 31 30 31 30 31 31 30 31 30 31
1949 31 27 31 30 31 30 31 31 30 31 30 31
1950 31 27 31 30 31 30 31 31 30 31 30 30
1951 31 27 31 30 31 30 31 31 30 31 30 31
1953 31 27 31 30 31 30 31 31 30 31 30 31
1954 31 27 31 30 31 30 31 31 30 31 30 31
1955 31 27 31 30 31 30 31 31 30 31 30 31
1957 31 27 31 30 31 30 31 31 30 31 30 31
1958 31 27 31 30 31 30 31 31 30 31 30 31
1959 31 27 31 30 31 30 31 31 30 31 30 31
1960 31 28 11 30 31 30 31 31 30 31 30 31
1961 31 27 31 30 31 30 31 31 30 31 30 31
1962 31 27 31 30 31 30 31 31 30 31 30 30
1964 31 29 31 30 31 30 31 31 30 31 30 28
1965 31 27 31 30 31 30 31 31 30 31 30 30
1972 31 29 31 30 31 30 29 31 30 31 30 31
1982 31 28 - 30 31 30 31 31 30 31 30 31
1994 31 28 31 30 31 30 31 31 30 - 30 -
Months with absence of wind speed data (in grey)

JULday year mnnth day Ta00 Ta03 Ta06 Ta09 Ta12 Ta15 Ta18 Ta21 Tamax Tamin
1990 1990 1 1 -24.6 -24.1 -26.1 -25.7 -26.1 -33.3 -32.5 -29.1 -23 -34.7
1990.03 1990 1 2 -28.3 -33.3 -33.9 -33.2 -33.6 -27.3 -30.3 -26.5 -25.9 -34.8
Q00 Q03 Q06 Q09 Q12 Q15 Q18 Q21 Ts00 Ts03 Ts06 Ts09 Ts12 Ts15
0.0006 0.0006 0.0005 0.0005 0.0005 0.0003 0.0003 0.0004 -27 -26 -28 -27 -28 -37
0.0004 0.0003 0.0002 0.0003 0.0003 0.0004 0.0003 0.0004 -32 -36 -36 -37 -38 -30
Ts18 Ts21 Tsmax Tsmin NT00 NT03 NT06 NT09 NT12 NT15 NT18 NT21 NL00 NL03
-36 -32 -26 -38 10 10 10 10 6 0 0 0 0 0
-34 -31 -28 -39 0 6 3 4 2 3 0 0 0 0
NL06 NL09 NL12 NL15 NL18 NL21 vi00 vi03 vi06 vi09 vi12 vi15 vi18 vi21
0 0 0 0 0 0 63 97 64 62 80 82 82 82
0 0 0 0 0 0 82 97 83 81 82 80 81 81
RV00 RV12 slp00 slp03 slp06 slp09 slp12 slp15 slp18 slp21 WD00 W00 WD03 W03
0 0.4 1019.9 1019.9 1020.5 1021 1021.9 1020 1019.7 1019.3 0 0 220 8
0 0 1020.2 1019.8 1019.7 1019.9 1019.9 1022 1021.3 1021 40 3 100 2
WD06 W06 WD09 W09 WD12 W12 WD15 W15 WD18 W18 WD21 W21 hs so00
250 6 225 6 225 6 205 2 245 2 220 4 2 8
0 0 0 0 0 0 200 3 0 0 220 4 2 8
Example of files, stored in Meteorological Archive
The meteorological archive fir Tiksi will be available on WEB in summer 2008

Climate of Tiksi observatory area

Spectral density of multi-year variability of air surface temperature (a), surface pressure (b) and wind velocity (c)
b c
a b c
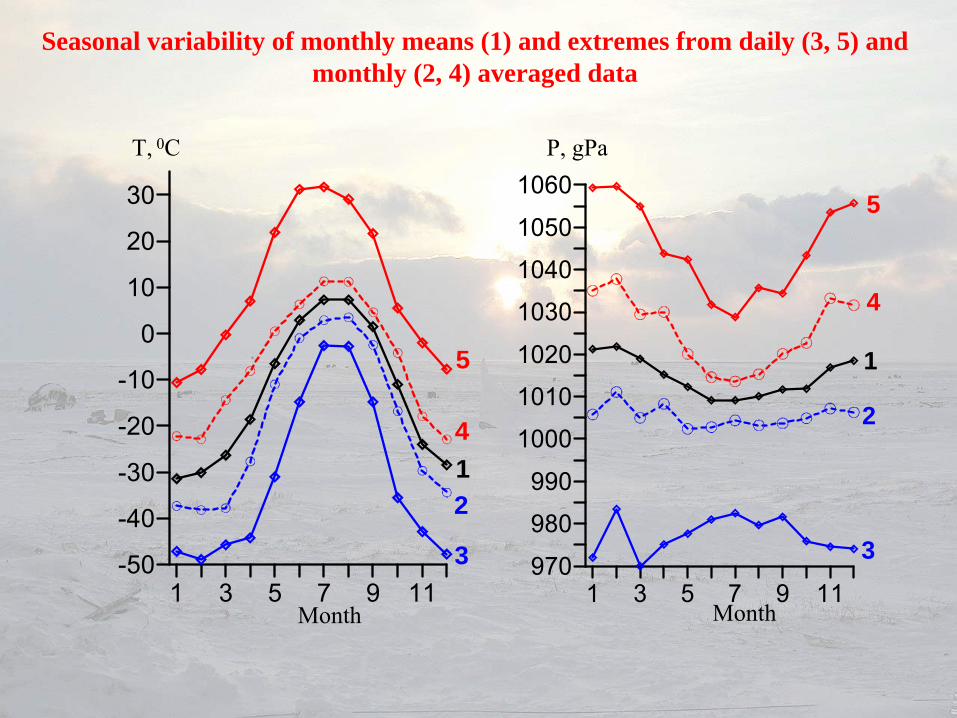
Seasonal variability of monthly means (1) and extremes from daily (3, 5) and monthly (2, 4) averaged data
1 3 5 7 9 11-50
-40
-30
-20
-10
0
10
20
30
1
5
4
2
31 3 5 7 9 11
970
980
990
1000
1010
1020
1030
1040
1050
1060
1
5
4
2
3
T,
0C P, gPa
Month Month

-50 -40 -30 -20 -10 0 10 20 300
5
10
15
20
25
30
-50 -40 -30 -20 -10 0 10 20 300
5
10
15
20
25
30
-50 -40 -30 -20 -10 0 10 20 300
5
10
15
20
25
30
35
40
-50 -40 -30 -20 -10 0 10 20 300
5
10
15
20
25
30
970 985 1000 1015 1030 10450
5
10
15
20
970 985 1000 1015 1030 10450
5
10
15
20
25
970 985 1000 1015 1030 10450
5
10
15
20
25
30
970 985 1000 1015 1030 10450
5
10
15
20
25
Distribution of air surface temperature and surface pressure (%)
T, 0C
P, gPa
January April July October

SCALE, %
VELOSITY, m/s
0 10 16 22 28 34 40 46 52 58 64 70 76 82 88 94 1 00
CALM 3 5 7 9 11 13 15 17 19 21 23 25 27 30
JANUARY FEBRUARY MARCH
APRIL MAY JUNE
JULY AUGUST SEPTEMBER
OCTOBER NOVEMBER DESEMBER
Wind roses in Tiksi (1934 –
2006)
Maximal velocity in winter 40 m/s
Maximal velocity in spring 23 m/s
Maximal velocity in summer 25 m/s
Maximal velocity in autumn 40 m/s
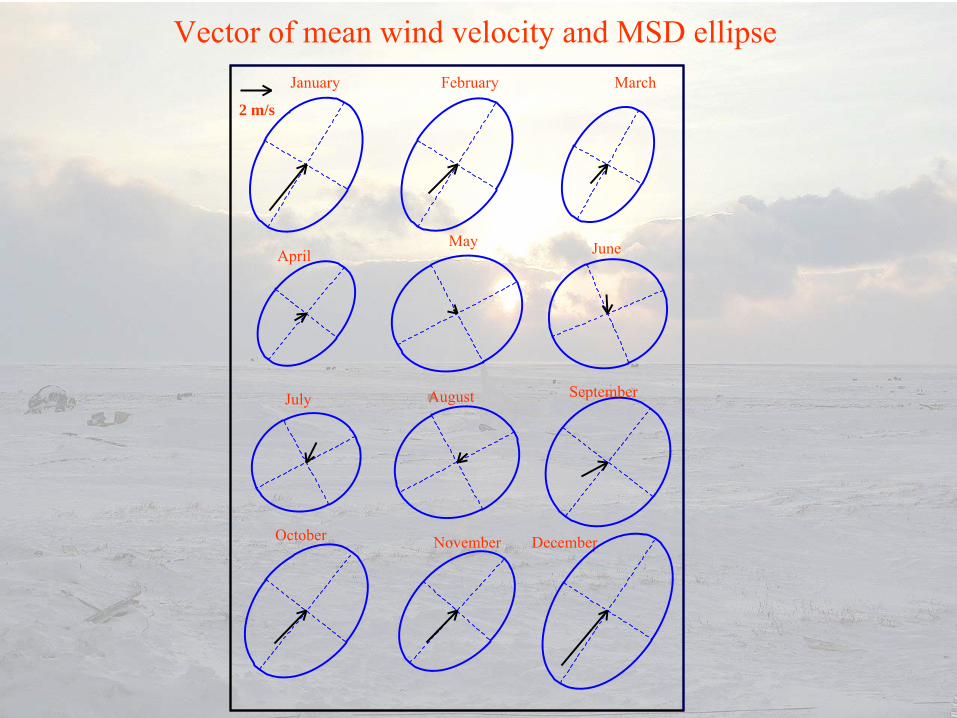
2 m/s
January February March
AprilMay June
July August September
October November December
Vector of mean wind velocity and MSD ellipse

00 03 06 09
12 15 18 21
SCALE
10 %
Diurnal variations of wind velocity in Tiksi during summer
May July
August

1 2 3 4 5 6 7 8 9 10 11 120123456789
10
1 2 3 4 5 6 7 8 9 10 11 120
10
20
30
40
50
60
70
23
4
1 2 3 4 5 6 7 8 9 10 11 12
0123456789
10
1 2 3 4 5 6 7 8 9 10 11 120
15
30
45
60
75
90 2
34
Seasonal variability of multi-year averaged characteristics of cloudiness
Total cloudiness Low cloudinessTenth Tenth
P, % P, %month month
month month
1
1
1 –
cloudiness, 2 –
occurrence 0-3 tenths, 3 –occurrence 4-7 tenths, 4 –occurrence 8-10 tenths

Climate variability of future Tiksi observatory area

1 3 5 7 9 11-0.025-0.020-0.015-0.010-0.0050.0000.0050.0100.0150.020
1 3 5 7 9 110
2
4
6
8
10
1 3 5 7 9 11-0.05-0.04-0.03-0.02-0.010.000.010.020.030.040.05
1 3 5 7 9 110
2
4
6
8
10
Monthly mean air surface temperature and surface pressure trends
0C/year
gPa/year
Dtr
/D, %
Dtr
/D, %
month
month
month
month
Contribution of trends to MSD
T
P
1935 1945 1955 1965 1975 1985 1995 2005980
985
990
995
1000
1005
1010
1015
1020
1025
1030
1035
1040
1935 1945 1955 1965 1975 1985 1995 2005-50
-45
-40
-35
-30
-25
-20
-15
-10
1935 1945 1955 1965 1975 1985 1995 2005985
990
995
1000
1005
1010
1015
1020
1025
1030
1035
1040
1045
1050
1055
1060
1935 1945 1955 1965 1975 1985 1995 2005985
990
995
1000
1005
1010
1015
1020
1025
1030
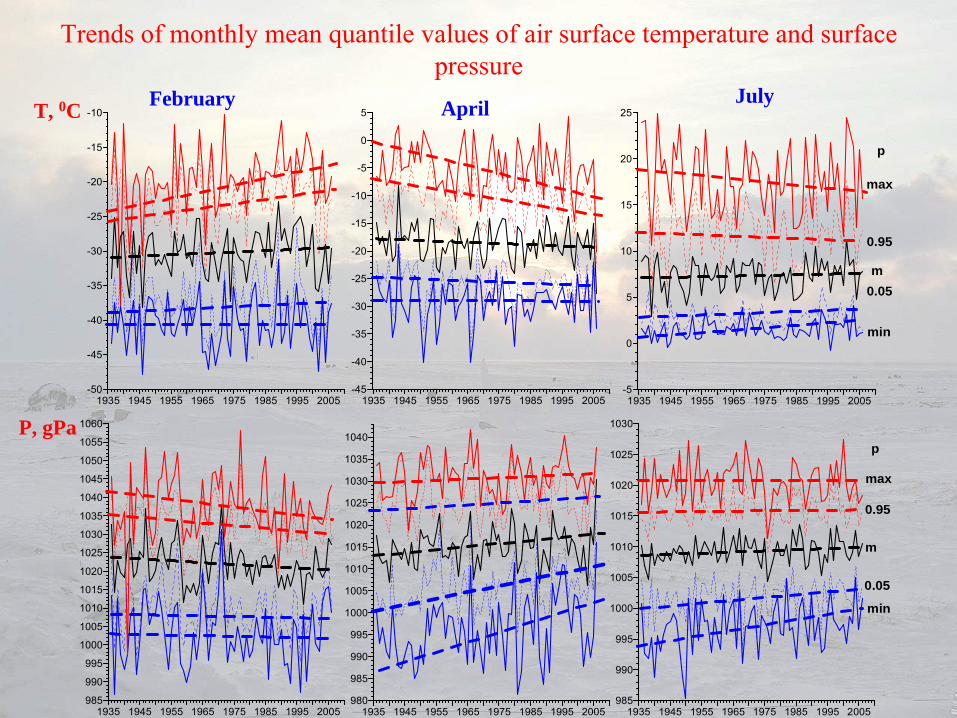
min
max
m
0.05
0.95
p
1935 1945 1955 1965 1975 1985 1995 2005-45
-40
-35
-30
-25
-20
-15
-10
-5
0
5
1935 1945 1955 1965 1975 1985 1995 2005-5
0
5
10
15
20
25
min
max
m0.05
0.95
p
Trends of monthly mean quantile
values of air surface temperature and surface pressure
February April JulyT, 0C
P, gPa

1 2 3 4 5 6 7 8 9 10 11 120.00
0.02
0.04
0.0612
1 2 3 4 5 6 7 8 9 10 11 120.00
0.02
0.04
0.06
0.08
0.101
2
Annual variations of monthly mean absolute values of air surface temperature and pressure trends (1) and corresponding trends of ranges of deviation (2)
0C/year
gPa/year

Direction Calm 1-10 m/s 11-20 m/s > 20 m/s All Mean velocity
North 0.12 -0.01 - -0.02
East 0.02 - - 0.02 -0.02
South 0.25 0.02 0.05 0.27 -0.03
West -0.08 -0.12 -0.07 -0.20 -0.05
All directions
-0.20 0.31 -0.11 -0.03
1 3 5 7 9 110
2
4
6
8
10
1 3 5 7 9 11
SCALE
0.01 m/s year -1x
Monthly mean wind trends and its relative input to MSD
Dtr /D, %
Trends of wind occurrence by direction and velocity in April(%/year)month month

1935 1945 1955 1965 1975 1985 1995 20052
3
4
5
6
7
8
9
1935 1945 1955 1965 1975 1985 1995 20051
2
3
4
5
6
7
8
1935 1945 1955 1965 1975 1985 1995 20050
0.1
0.2
0.3
0.4
0.5
0.6
0.7
0.8
0.9
1935 1945 1955 1965 1975 1985 1995 20050.1
0.2
0.3
0.4
0.5
0.6
0.7
0.8
0.9
Interannual variability of total cloudiness Relative occurrence of clear sky (blue) and overcast (red)
January
July
January
Julyyear year
year year
tenth
tenth

1 3 5 7 9 11-0.04
-0.02
0.00
0.02
0.04
1 3 5 7 9 110
10
20
30
40
50
1 3 5 7 9 11-0.04
-0.02
0.00
0.02
0.04
1 3 5 7 9 110
10
20
30
40
50
Trend coefficients of total (1) and low (2) cloudiness amount, and its relative input to MSD
Significant trendInsignificant
Tenth/year
Tenth/year
Dtr/D, %
Dtr/D, %month month
month month
1 1
22
1930 1940 1950 1960 1970 1980 1990 2000 2010
Year
-32
-30
-28
-26
-24
-22
-20
-18
T 85
0 m
b
1930 1940 1950 1960 1970 1980 1990 2000 2010
Year
-56
-54
-52
-50
-48
-46
-44
-42
T 40
0 m
b
1930 1940 1950 1960 1970 1980 1990 2000 2010
Year
2
4
6
8
10
12
14
T 10
00 m
b
1930 1940 1950 1960 1970 1980 1990 2000 2010
Year
-4
-2
0
2
4
6
8
10
12
T 85
0 m
b
1930 1940 1950 1960 1970 1980 1990 2000 2010
Year
-34
-32
-30
-28
-26
-24
-22
T 40
0 m
b
1940 1950 1960 1970 1980 1990 2000
Year
-38
-36
-34
-32
-30
-28
-26
-24
-22T
1000
mb
1950 1960 1970 1980 1990 2000 2010
Year
-80
-75
-70
-65
-60
-55
-50
-45
T 50
mb
1940 1950 1960 1970 1980 1990 2000 2010
Year
-48
-46
-44
-42
-40
-38
-36
-34
T 50
mb
January
July
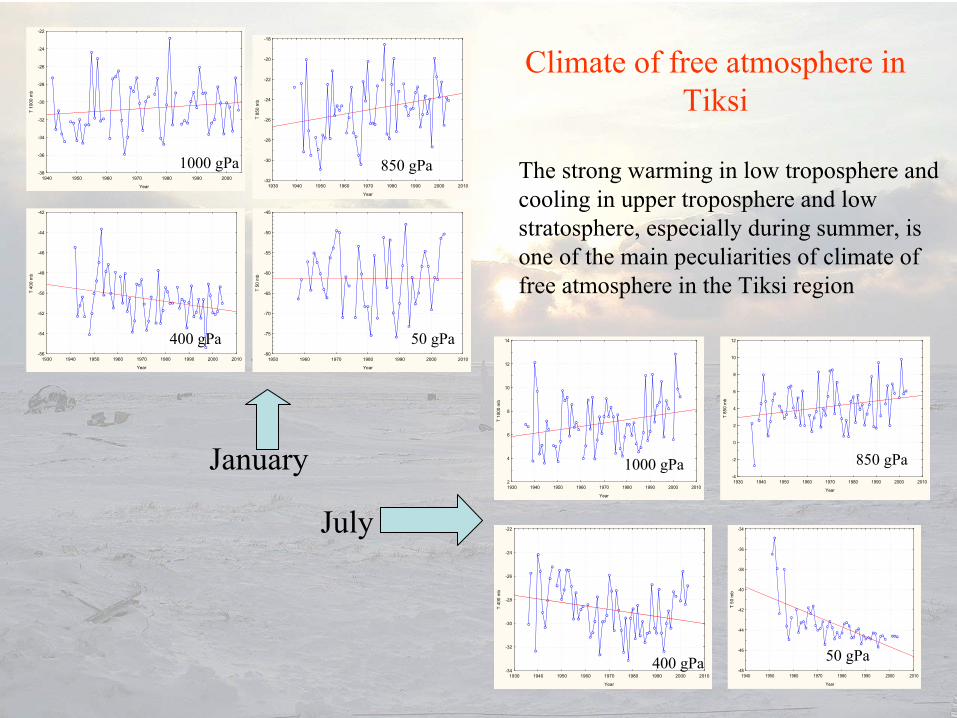
Climate of free atmosphere in Tiksi
The strong warming in low troposphere and cooling in upper troposphere and low stratosphere, especially during summer, is one of the main peculiarities of climate of free atmosphere in the Tiksi region
1000 gPa 850 gPa
400 gPa 50 gPa
1000 gPa 850 gPa
400 gPa 50 gPa

1930 1940 1950 1960 1970 1980 1990 2000 2010
Year
190
200
210
220
230
240
250
260Ic
e th
ickn
ess,
mInterannual variability of maximal fast ice thickness
1930 1940 1950 1960 1970 1980 1990 2000 2010
Year
160
180
200
220
240
260
280
300
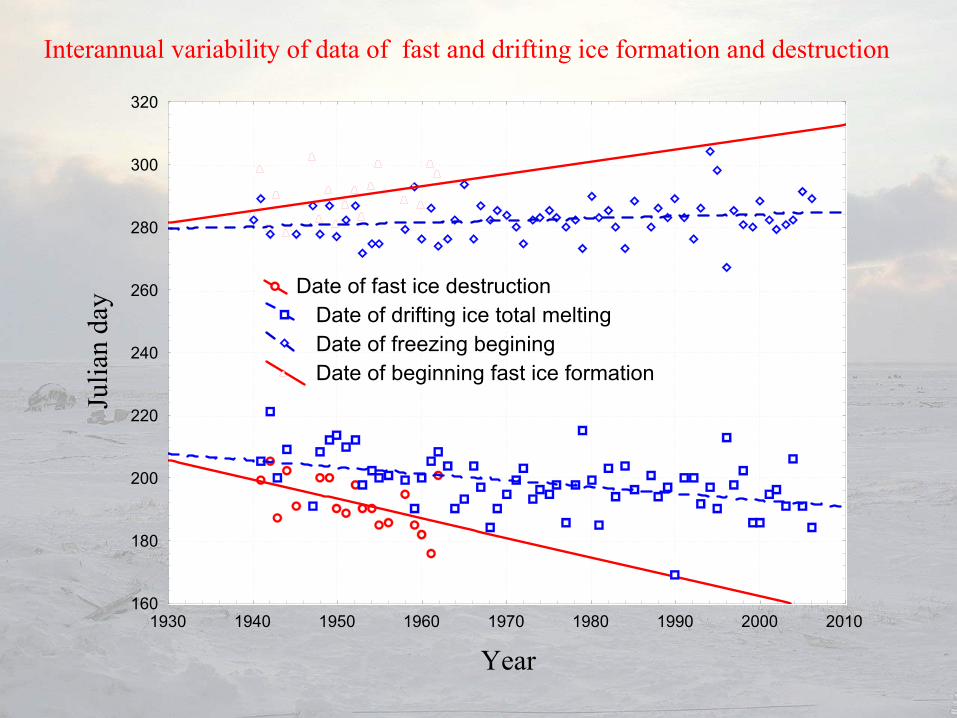
320Ju
lian
day Date of fast ice destruction
Date of drifting ice total melting Date of freezing begining Date of beginning fast ice formation
Interannual variability of data of fast and drifting ice formation and destruction

1940 1942 1944 1946 1948 1950 1952 1954 1956 1958 1960
Year
0.0
0.1
0.2
0.3
0.4
0.5
0.6
0.7Sn
ow th
ickn
ess,
m
Snow thickness calculated with data about snow precipitation
Precipitation Gauge Change

SUMMARYA digital archive has
been
created
of
the
historical
Tiksi station
data
(1934
to
present)
Quantile
analysis
suggests
that
the
influences
of
synoptic
systems
on
temperature
trends
is
significant
Wind
analysis
reveals
increased
southerly
winds
in
Fall, Winter
and
Spring
Strong
trends
in
cloudiness
(increasing
in
winter
and
decreasing
in
summer) have
been
detected. It could be the reason for positive trends of surface air temperature during these seasons
Sea
ice
cover
in
the
adjacent
Sogo
Bay
shows
significant
increase
in
the
length
of
the
ice-free
season
but
also
some increases
in
the
fast
ice
seasonal
maximum
thickness
These
historical
data
suggest
a number
of
collaborating
mechanisms
that
are
contributing
to
net
increases
in
temperature
The historical data
provides
guidance
for
detailed
process
studies
and
measurement
requirements
at
the
new
Observatory

Future plans
•
To prepare Archive of daily mean meteorological data beginning 1909 for polar stations Kazachiya and Kusur, located close to Tiksi
•
To deploy modernized meteorological and radiosounding stations
•
To organize observations in frame of the Climate Reference Network (CNR)
•
To develop procedure of intercomparison and during two years to execute in Tiksi parallel measurements with old and modern meteorological instruments