Climate-smart livestock systems: lessons and future research
25
Climate‐smart livestock systems: lessons and future research Mario Herrero 1 , Philip K. Thornton 2 , Mark van Wijk 3 , Cyrille Rigolot 1,4 , Petr Havlik 5 , Benjamin Henderson 1 , Andrew Ash 1 , Steven Crimp 1 and Stuart Mark Howden 1 1 CSIRO, Australia | 2 CCAFS | 3 ILRI, Kenya | 4 INRA France | 5 IIASA, Austria 1
Transcript of Climate-smart livestock systems: lessons and future research

Climate‐smart livestock systems: lessons and future research
Mario Herrero1, Philip K. Thornton2, Mark van Wijk3, Cyrille Rigolot1,4, Petr Havlik5, Benjamin Henderson1, Andrew Ash1 , Steven Crimp1 and
Stuart Mark Howden1
1CSIRO, Australia | 2CCAFS | 3ILRI, Kenya | 4INRA France | 5IIASA, Austria
11

– 17 billion domestic animals globally! (SOFA 2009)…almost 20 billion now!
– 30% of the Earth’s ice-free surface occupied by livestock systems (Reid et al 2008)
– 1/3 of global cropland used for feed production
– 8-18% of GHG emissions (FAO 2013 and others)
– 72% of deforestation (Nepstad et al 2011)
– 32% of global freshwater consumption (FAO 2006, de Fraitureet al. 2007; Heinke et al, 2014)
Livestock – the big numbers

The demand for livestock products to 2050
Rosegrant et al 2009
Annual per capita consumption
Total consumption
year Meat (kg) Milk (kg) Meat (Mt) Milk (Mt)
Developing 20022050
2844
4478
137326
222585
Developed 20022050
7894
202216
102126
265295

– Livestock are a significant global asset: value of at least $1.4 trillion (excluding infrastructure that supports livestock industries) (Thornton and Herrero 2008)
– Livestock industries organised in long market chains that provide incomes and/or employ at least 1.3 billion people (LID 1999)
– 1/3 protein supply, key nutrient provision for under 5s
– Livestock GDP: 20-40% of agricultural GDP but investment ratio 1:10 livestock to crops)
– Livestock support the lives of 800 million people and are key for mnaging risk in arid places
Livestock’s multiple socio-economic benefits

Climate change impacts severe in placesWhat will happen to feed resources? Diseases? Livestock Productivity?
Weindl et al submitteda) Maize b) pastures

Key interactions in farming systems
Herrero et al, Science (2010)Herrero et al Science (2010)

What have we learnt?

complex !Lesson 1: different opportunities
for different systems

Enormous within site variation in FS
Accompanied by a complete shift in farm orientation
Different types of best-bet interventions for different groups of farmers
Food security analyses: example of Lushoto, Tanzania
Van Wijk et al 2015

Enormous within site variation in FS
Accompanied by a complete shift in farm orientation
Different types of best‐bet interventions for different groups of farmers
Market options,further production intensification, diversification,Crop‐livestock integration
Food crop production intensification,opening of market options
Problem alleviation through more production,off‐farm opportunities Van Wijk et al., in prep
Ritzema et al., in prepFrelat et al., in prep
Food security analyses: intervention analysis

Lesson 2: We have focused mostly on technological solutions

Impact of alternative feeding strategies on milk, manure and methane production in Kenya (% change over the baseline) (Bryan et al 2012 Climatic Change)
District Scenario Milk production Manure production
Methane production
Methane per kg milk
Garissa
Gem
Mbeere
Njoro
Mukurweni
Othaya
Siaya
6 districts
Prosopis1.5 kg3 kg
Desmodium1 kg2 kg
Napier grass2 kg3 kgHay1 kg2 kg
Desmodium1 kg2 kgHay2 kg4 kg
Napier grass2 kg3 kg
Average
64136
2136
1217
1849
98
98
4279
36
00
510
1116
‐5‐5
1111
1111
010
6
‐2‐5
‐30
32
618
20
20
1216
4
‐40‐60
‐20‐26
‐8‐12
‐10‐21
‐7‐7
‐7‐7
‐21‐35
‐20
Introduction
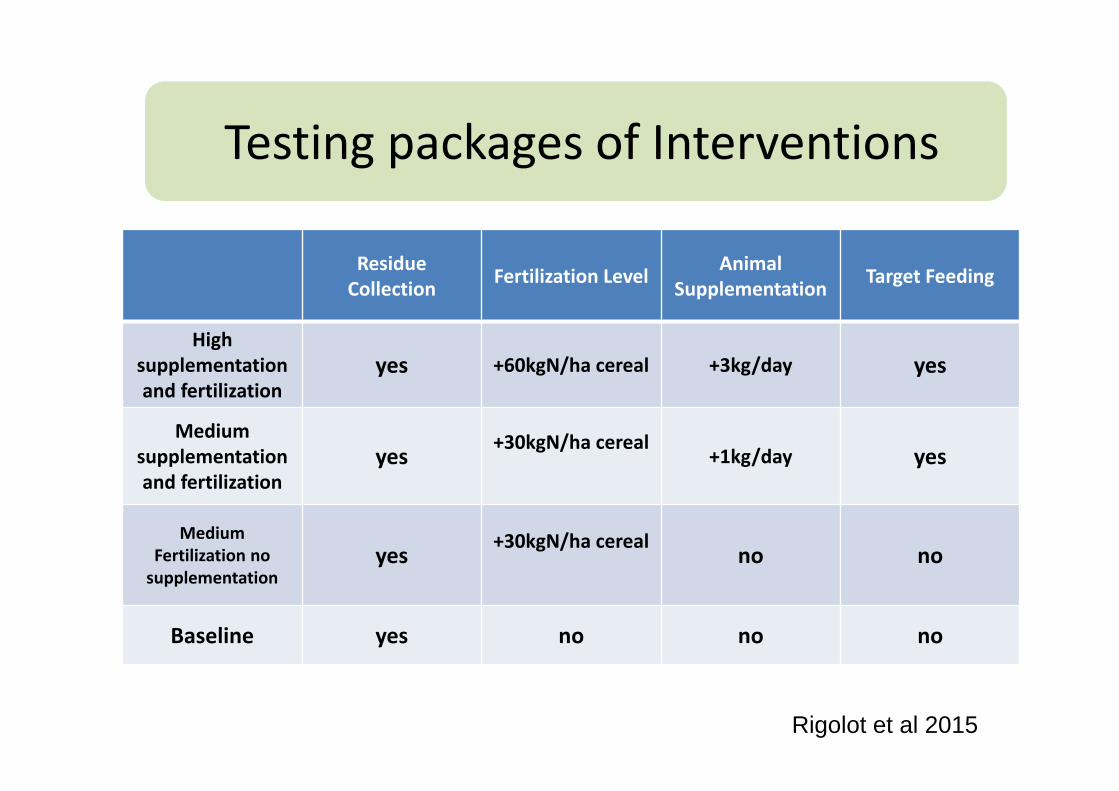
ResidueCollection Fertilization Level Animal
Supplementation Target Feeding
Highsupplementation and fertilization
yes +60kgN/ha cereal +3kg/day yes
Medium supplementationand fertilization
yes+30kgN/ha cereal
+1kg/day yes
MediumFertilization no supplementation
yes+30kgN/ha cereal
no no
Baseline yes no no no
Testing packages of Interventions
Rigolot et al 2015

0 10000 20000 30000 40000
Baseline
Medium Fertilization
Medium Input
High Input
(MJ/year)
Average household kcal production
Millet
Maize
Cow Meat
Cow Milk
SheepMeatSheepMilk
Rigolot et al 2015

Lesson 3: transformational adaptation will be essential for the livestock sector

W. Africa 1966 – pastoral system 2004 – crop-livestock system
Systems and livelihoods in transition: the target is moving!Can we ensure that the next transition is sustainable, equitable and helps
feed the world?

Australia - high rainfall zone land use:
from grazers to croppers
0
1
2
3
4
5
6
7
8
9
1985 1990 1995 2000 2005 2010 2015
Crop
ped area
(%)
Year
Cropping area increasing
0
2
4
6
8
10
1980 2000 2020
Crop
ped area
(%)
Year
Cropping area increasing
91
92
93
94
95
96
97
1985 1990 1995 2000 2005 2010 2015
Grazed area
(%)
Year
Grazing area decreasing
Data: ABARES (2012)

Opportunities: land use change
An extra 52000ha cropped: Nidumolu (2010)

0º
20º
-20º
0º 20º 40º
From croppers to livestock keepers
Areas where cropping of an indicator cereal may become unviable between now and 2050 and where farmers may have to rely more on livestock as a livelihood strategy
Jones & Thornton (2008)

Transitions from livestock systems to mixed systems could meet livestock product demands at lower GHG emissions
Relocation of production and trade could also be important
Petr Havlík et al. PNAS 2014;111:3709-3714

Lesson 4 - Transformation can be costly if not well planned
Searchinger et al NCC 2015

Concluding remarks

Lots of progress on the science
need to understand what drives adoption, incentives systems
new partnerships, new institutions, new value chains in places
more robust and realistic policy formulation and smarter scenarios
better monitoring and learning mechanisms
Multiple indicators: beyond GHG emissions intensities
Lesson 5 – agenda still too biophysical Next big step - From knowledge to action

Designing alternative livestock product demand trajectories part of the solution for health and the environment
What is a sustainable diet and what is the role of livestock?
The land sparing story is no longer enough! Towards better understood social and economic impacts is essential.
Impacts on employmentalternative options for producerseconomic impactshow to deal with profitable livestock systems in export economies effecting behavioural change – consumptionrole of policy
Towards climate and nutrition-smart livestock systems

Thank you!11