Climate Proofing ADB Investment in the Transport Sector ... · Climate Proofing ADB Investment in...
120
CLIMATE PROOFING ADB INVESTMENT IN THE TRANSPORT SECTOR INITIAL EXPERIENCE ASIAN DEVELOPMENT BANK
Transcript of Climate Proofing ADB Investment in the Transport Sector ... · Climate Proofing ADB Investment in...
Climate Proofing ADB Investment in the Transport SectorInitial Experience
The transport sector is key to the continued economic development of Asia and the Pacific. By improving connectivity and making the movement of goods and people more affordable, transport contributes to economic growth, efficiency, and competitiveness while providing poor people with access to economic opportunities and services. Various components of the transport infrastructure are exposed and vulnerable to climate change. This is of particular concern to countries in Asia and the Pacific which will experience significant adverse impacts from a changing climate. The Asian Development Bank has put in place a systematic framework guiding the conduct of climate risk and vulnerability assessments of investment projects. Ongoing initiatives will address some of the key challenges encountered when conducting climate risk and vulnerability assessments, including access to readily available climate change information.
About the Asian Development Bank
ADB’s vision is an Asia and Pacific region free of poverty. Its mission is to help its developing member countries reduce poverty and improve the quality of life of their people. Despite the region’s many successes, it remains home to approximately two-thirds of the world’s poor: 1.6 billion people who live on less than $2 a day, with 733 million struggling on less than $1.25 a day. ADB is committed to reducing poverty through inclusive economic growth, environmentally sustainable growth, and regional integration.
Based in Manila, ADB is owned by 67 members, including 48 from the region. Its main instruments for helping its developing member countries are policy dialogue, loans, equity investments, guarantees, grants, and technical assistance.
ASIAN DEVELOPMENT BANK6 ADB Avenue, Mandaluyong City1550 Metro Manila, Philippineswww.adb.org
CLIMATE PROOFINGADB INVESTMENTIN THE TRANSPORT SECTORINITIAL EXPERIENCE
ASIAN DEVELOPMENT BANK9 789292 548551
ISBN 978-92-9254-855-1
ASIAN DEVELOPMENT BANK
© 2014 Asian Development Bank
All rights reserved. Published in 2014.Printed in the Philippines.
ISBN 978-92-9254-855-1 (Print), 978-92-9254-856-8 (e-ISBN)Publication Stock No. RPT146741-2
Cataloging-in-Publication Data
Asian Development Bank. Climate proofing ADB investment in the transport sector: initial experienceMandaluyong City, Philippines; Asian Development Bank, 2014.
1. Climate change. 2. Climate proofing 3. Transport sector I. Asian Development Bank.
The views expressed in this publication are those of the authors and do not necessarily reflect the views and policies of the Asian Development Bank (ADB), or its Board of Governors, or the governments they represent.
ADB does not guarantee the accuracy of the data included in this publication and does not accept responsibility for any consequence of their use.
By making any designation of or reference to a particular territory or geographic area, or by using the term “country” in this document, ADB does not intend to make any judgments as to the legal or other status of any territory or area.
ADB encourages printing or copying information exclusively for personal and noncommercial use with proper acknowledgment of ADB. Users are restricted from reselling, redistributing, or creating derivative works for commercial purposes without the express, written consent of ADB.
Unless otherwise stated, boxes, figures and tables without explicit sources were prepared by the authors.
In this publication, “$” refers to US dollars.
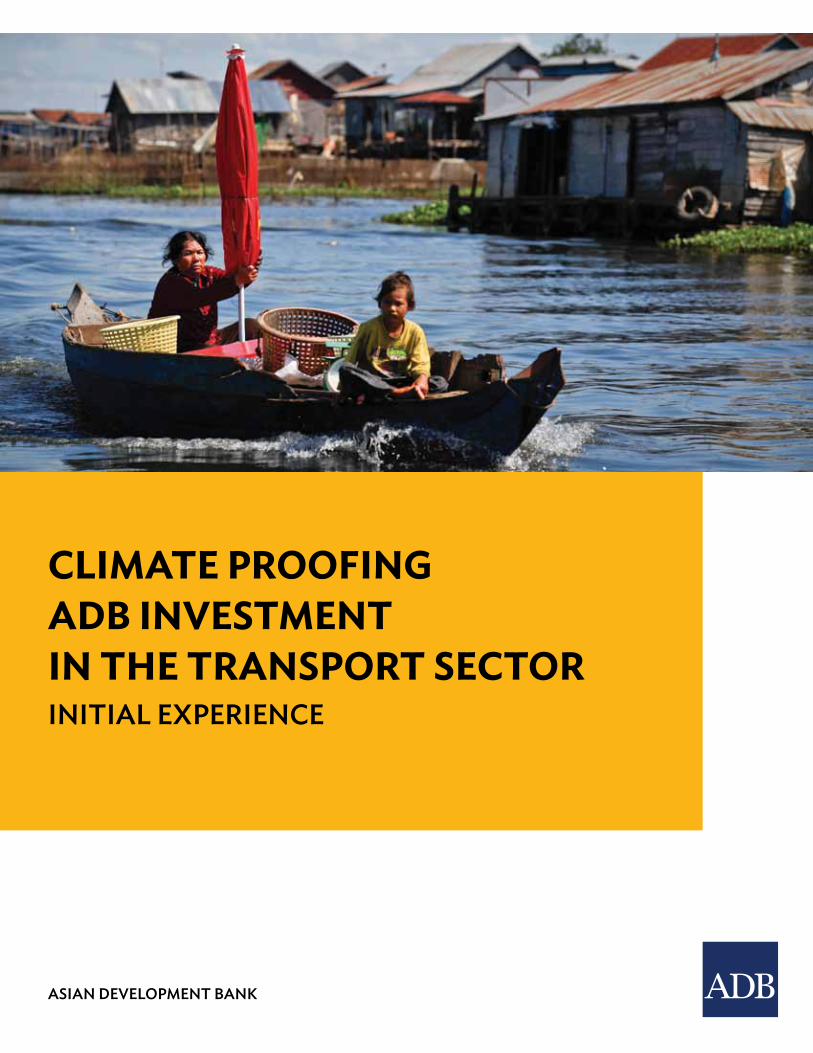
Cover photo by Kristen ElsbyA Khmer woman and child commuting through Kampong Khleang village on the Tonle Sap lake, the largest freshwater lake in Southeast Asia. This lake is unique as it expands and shrinks dramatically between seasons and changes flow direction twice a year due to changing water levels in the connecting Mekong river. Some local fishing villages have adapted to the annual flooding by building houses on stilts and commuting by boat during flooding and road during the dry season.
Asian Development Bank6 ADB Avenue, Mandaluyong City1550 Metro Manila, PhilippinesTel +63 2 632 4444Fax +63 2 636 2444www.adb.org
For orders, please contact:Public Information CenterFax +63 2 636 [email protected]
iii
Contents
Tables, Figures, and boxes vi
abbreviaTions viii
Foreword x
acknowledgemenTs xii
execuTive summary xiii
inTroducTion 1
I. ClIMATE RISK MANAGEMENT IN ADB 3 ADB’s Strategy 2020 and Priorities for Action 4 Climate Change and Transport 6 Climate Risk Screening and Vulnerability Assessment in ADB Investment Projects 10
II. ExPERIENCE wITh ClIMATE RISK AND VUlNERABIlITy ASSESSMENT IN TRANSPoRT PRojECTS 16
Main Roads and Bridges 17 Bhutan: South Asia Subregional Economic Cooperation Road Connectivity Project 17 The Project 17 Approach to Climate Risk Assessment 18 Climate Change Projections 18 Climate Change Vulnerability Assessment 20 Climate Proofing Measures 20 Climate Proofing Costs 22 Viet Nam: Central Mekong Delta Region Connectivity Project 24 The Project 24 Approach to Climate Risk and Vulnerability Assessment 26 Climate Change Impact Assessment 30 Climate Proofing Measures 30 Climate Proofing Costs 30
iv
Contents
Papua New Guinea: Bridge Replacement for Improved Rural Access Project 31 The Project 31 Climate Change Projections 31 Climate Vulnerability Assessment 33 Climate Proofing Measures 34 Uzbekistan: Central Asia Regional Economic Cooperation Corridor 2 Road Investment Program 37 The Project 37 Vulnerability to Existing Climate Conditions 37 Addressing Existing weather Extremes 38 Remote Rural Roads 39 People’s Republic of China: Inner Mongolia Road Development Project 39 The Project 39 Climate Change Projections and Impact on Permafrost 40 Climate Proofing options 41 Cambodia Rural Roads Improvement Project 44 The Project 44 Climate Risk and Vulnerability Assessment 44 Climate Proofing Measures: An Ecosystem-Based Approach 46 Cost of Climate Proofing Measures 47 Solomon Islands: Second Road Improvement Project 49 The Project 49 Climate Risk and Vulnerability Assessment 49 Climate Proofing Measures 52 Economics of Climate Proofing 52 Timor-leste Road Network Development Sector Project 55 The Project 55 Climate Risk and Vulnerability Assessment 55 Climate Proofing Measures 57 Cost of Climate Proofing Measures 57 Urban Transport 58 Viet Nam: Sustainable Urban Transport for ho Chi Minh City Mass Rapid Transit line 2 58 The Project 58 Climate Risk and Vulnerability Assessment 58 Climate Proofing Measures 60 waterways and Ports 62 People’s Republic of China: Anhui Intermodal Sustainable Transport Project 62 The Project 62 Climate Change Projections and water Discharges 64 Climate Proofing Assessment 66
v
Contents
Cook Islands: Avatiu Port Development Project 68 The Project 68 Climate Risk and Vulnerability Assessment 69 Climate Proofing Measures 69 Costs and Benefits of Climate Proofing Measures 69
III. ExPERIENCE AND oPPoRTUNITIES 71 Methods to Identify Climate Risks and Vulnerabilities 71 Experience 71 opportunity 75 Climate Risks and Vulnerabilities Identified 76 Experience 76 opportunity 77 Analysis and Selection of Climate Proofing options 79 Experience 79 opportunity 83
concluding remarks 86
reFerences 88
aPPendix 1 climate change and adaptation screening methods and Tools 91
aPPendix 2 draft Technical guidance note for integrating climate change in road Transport infrastructure development in viet nam 94
aPPendix 3 From emissions scenarios to representative concentration Pathways 99
aPPendix 4 approaches to downscaling general circulation models 101
vi
tables, Figures, and boxes
TABlES1 lending Pipeline 2015–2017 ($ millions) 62 Potential Impacts of Climate Change on Road Transport Infrastructure 93 Climate Change Projections for Bhutan 194 Climate Change Threats to the Nglanglam–Deothang Road Project 215 Good Practice and Climate Proofing Measures for the Nglanglam–Deothang Road 226 Climate Proofing Measures Retained in Project Design 297 Climate Change Projections in Papua New Guinea 318 Exposure Factors 329 Sensitivity Factors 3310 Relative Vulnerability of Assessed Bridges in Papua New Guinea 3411 Suggested Climate Proofing Measures for Bridge Design 3512 Possible Climate Proofing options for the Inner Mongolia Road Project 4313 Economics of Climate Proofing Measures in the Solomon Islands Second
Road Improvement Project 5314 Flooding in 2009 and Projection for 2050 6015 Existing and Projected 10-Day Maximum Rainfall 6516 Existing and Projected Flood Volume and
height for a 20-year Return Flood Event for xuangcheng 6617 Methods to Identify Climate Risks and Vulnerabilities 7218 Climate Risks and Vulnerabilities 7719 Analysis and Selection of Adaptation options 8020 Types of Climate Proofing Decision 8221 Estimated Costs of Climate Proofing 83A1 Examples of Climate Risk Screening and Assessment Methods and Tools 91A3 Radiative Forcing and Co2 Concentration 100
vii
Tables, Figures, and Boxes
FIGURES1 Flow Chart for Assessing Climate Risk of Projects 112 Nglanglam–Deothang Road Vulnerability Map 203 Infrastructure Components of the Central Mekong Delta Region Connectivity Project 254 Key Steps of the Climate Risk and Vulnerability Assessment Methodology 275 Structure of joint Sealant Using EPDM Rubber 386 Average Monthly Temperatures at Manzhouli and Alatanemole 407 Monthly Normal Minimum Temperature and Maximum Temperature
at Alatanemole: Baseline and Projections 428 Cambodia Rural Roads Improvement Project 459 Solomon Islands Second Road Improvement Project 5010 Assessing Climate Risk levels in Solomon Islands 5311 Climate Proofing Decision-Making Process in Solomon Islands 5412 Road Network Upgrading Sector Project 5613 ho Chi Minh City Mass Rapid Transit line 2 5914 Anhui Intermodal Sustainable Transport Project 6315 wuhu Station Monthly Rainfall: Baseline and Projection 6416 Changes in Maximum 10-Day Total Rainfall at Project location 6517 Port of Avatiu—Cook Islands 68A2.1 Specific Steps for integrating Climate Change into Transport Development Strategy and Master Plans 96A2.2 Draft Technical Guidance Note for Integrating Climate Change
in Road Transport Infrastructure Development in Viet Nam 97
BoxES1 ADB’s Transport Transformation 72 Activities and Steps Guiding the Conduct of Climate Risk and Vulnerability Assessments 133 Climate Risk and Vulnerability Assessment in operational Departments 144 The Temperature of Permafrost Model 435 outline of Personnel Inputs and Cost Estimate of Nonengineering Climate Proofing Measures 486 Climate Change Projections in the Pacific 517 Projecting wave height in 2065 with Climate Change 708 Survey Responses to Changes in Design Standards and Practices 76
viii
abbreviations
ADB Asian Development BankAR5 fifth assessment report°C degrees CelsiusClIMAP Climate Change Adaptation ProgramCRVA climate risk and vulnerability assessmentDMC developing member countryEPDM ethylene-propylene-diene monomer rubberGCM general circulation modelGIS geographic information systemhCMC ho Chi Minh CityICIMoD International Centre for Integrated Mountain DevelopmentIPCC Intergovernmental Panel on Climate Changekm kilometerkm2 square kilometerm metermm millimetermm/y millimeter per yearmasl meters above sea levelMDB multilateral development bankMRT mass rapid transitNEC National Environment Commission of BhutanPNG Papua New Guineappm parts per million RCP representative concentration pathwayRSDD Regional and Sustainable Development DepartmentRSES Environment and Social Safeguards Division
ix
Abbreviations
SASEC South Asia Subregional Economic CooperationSRES Special Report on Emissions ScenariosSTAR Sustainable Transport Appraisal RatingSTI-oP Sustainable Transport Initiative operational Plan
Note:All temperatures reported are in degrees Celsius.
x
Foreword
Investments in transport infrastructure are key to the continued economic development of Asia and the Pacific. By improving connectivity and making the movement of goods and people more affordable, transport contributes to economic growth, efficiency, and competitiveness, and provides poor people with increased
access to economic opportunities and services. Investments in the transport sector are a key form of support that the Asian Development Bank (ADB) provides to its developing member countries.
Transport infrastructure is highly vulnerable to projected climate change. Rising sea levels, increase in temperature, changes in precipitation patterns, and extreme weather events can affect the operation and safety of roads, bridges, ports, and other transport infrastructure, and significantly disrupt the flow of goods, services, and people within and across countries of the region. This is of particular concern in Asia and the Pacific, which is already experiencing significant adverse impacts from a changing climate.
ADB recognizes that development is about lasting benefits. Continued poverty reduction requires proactive efforts to address environmental sustainability, including mitigating the causes of climate change and supporting vulnerable communities in adapting to the unavoidable impacts of climate change. To rise to this challenge, ADB’s climate change adaptation program has evolved over a decade from an initial effort to promote adaptation in operations to a rigorous approach to integrate climate risk management in national planning and investment projects in all sectors. In early 2014, ADB formalized a climate risk management framework to screen all investment projects and to incorporate adaptation measures in projects at risk. ADB has produced a suite of tools and guidance materials, including guidelines for climate proofing investments in the transport, energy, and agriculture sectors, to support climate risk and vulnerability assessments (CRVAs) in investment projects and to disseminate knowledge and best practice. ADB’s Strategy 2020, along with Addressing Climate Change in Asia and the Pacific: Priorities for Action, Environment Operational Directions 2013–2020, and Sustainable Transport Initiative—Operational Plan are all aligned in committing ADB’s technical and financial support to its developing member countries to address climate change, including mainstreaming climate risk management in transport sector investment projects. The midterm review of Strategy 2020 reinforced this commitment, and indicates that ADB will scale up support for climate risk management in development planning and investment projects.
This publication reviews and documents experiences gained in transport investments over the last few years. The case studies presented in this publication, while covering only a subset of all climate risk and vulnerability assessments conducted in ADB across all sectors over recent years, capture knowledge and lessons embedded
Foreword
xi
in the operations of ADB in its support to developing member countries. It also identifies opportunities to further mainstream climate risk management in transport sector investment projects.
This publication is the first of its kind made available by ADB to its developing member countries and the wider development community. It is hoped that the initial experiences documented in this report, together with the growing experience in ADB with integrating climate resilience in all sectors, can be scaled up, replicated, and adapted to specific national and local conditions of the region.
nessim J. ahmadDeputy Director GeneralRegional and Sustainable Development Department (RSDD)Concurrently Chief Compliance officerChairperson, ADB Climate Change Adaptation and land Use working Group
Tyrrell duncanDirector, East Asia Transport and Communications Division (EATC)Concurrently Practice leader (Transport)

xii
aCknowledgements
This knowledge product was jointly produced by ADB’s Transport Community of Practice, the Environment Community of Practice, and the Environment and Safeguards Division of the Regional and Sustainable Development Department (RSDD) under the regional technical assistance project Promoting Climate
Change Adaptation in Asia and the Pacific (RETA 7608), financed by the ADB Technical Assistance Special Fund.
The report was jointly prepared by Karma yangzom (environment specialist, South Asia Department), Genevieve o’Farrell (environment specialist, East Asia Department), Cinzia losenno (senior environment specialist, climate change adaptation, RSDD), lorie Rufo (environment officer, climate change adaptation, RSDD), and Benoit laplante (economist, RSDD consultant). Ko Sakamoto (transport economist, Sustainable Infrastructure Division, RSDD) provided useful comments, guidance, and support throughout the process.
A very special thanks to the following individuals who provided the case studies and contributed accounts of ADB’s experience: Rishi Adhar (senior project officer, Pacific liaison and Coordination office in Sydney, Australia), AKM Mahfuzuddin Ahmed (advisor and concurrently practice leader—agriculture, rural development, and food security, RSDD), Chen Chen (senior transport specialist, South Asia Department), Shihiru Date (senior transport specialist, Southeast Asia Department), Pivithuru Indrawansa (senior project officer, Pacific liaison and Coordination office in Sydney, Australia), Muhammad A. Ingratubun (unit head, portfolio management, Papua New Guinea Resident Mission), Rustam Ishenaliev (transport specialist, Southeast Asia Department), Richard Phelps (principal infrastructure specialist, Special office in Timor-leste), Sharad Saxena (principal transport specialist, East Asia Department), Narendra Singru (principal transport specialist, Central and west Asia Department), lauren Sorkin (country specialist, Viet Nam Resident Mission), hanna Uusimaa (climate change specialist, Pacific Department), and Robert Valkovic (principal transport specialist, Southeast Asia Department). Contribution from the Knowledge Sharing and Services Center (RSDD) in providing budgetary and technical support is acknowledged. The Australian aid program under the Pacific–Australia Climate Change Science and Adaptation Planning (PACCSAP) program kindly contributed to the writing of the Solomon Islands case study. Any remaining errors should be attributed to the authors of this report and not to the individuals and institutions listed above.
Kristine lucero (knowledge management consultant, Transport Community of Practice), Agatha Diaz (consultant, RSDD) and Gerard Emil Gadiano (operations assistant, East Asia Department) provided valuable support. Abraham Villanueva (logistics management assistant, cartography) provided assistance with maps and figures.
xiii
exeCutive summary
Given its extensive coastlines and mountainous topography, along with its increasing urban population living in low-elevation coastal zones, the population and infrastructure of Asia and the Pacific are particularly exposed to projected changes in climate. As this region remains home to the largest number of the world’s
poor, its population is highly vulnerable to those changes.
ADB’s long-term strategic goal set out in Strategy 2020 emphasizes environmentally sustainable growth as a key pillar to achieving an Asia and Pacific region free of poverty, including adaptation to the unavoidable impacts of climate change. The midterm review of ADB’s Strategy 2020 indicates renewed commitment to infrastructure investments, as well as scaled up support for climate risk management in development planning and investment projects. ADB’s adaptation program has grown in recent years to encompass a range of interventions to help developing member countries (DMCs) reduce their vulnerability and address the impacts of climate change. Specifically, ADB is supporting the DMCs’ efforts to integrate climate change risk management and disaster risk reduction into national development strategies, sector plans, and investment projects. In this context, ADB mandates that the investment projects it finances are screened to identify risks at early stages of development and that projects at risk incorporate adaptation measures.
Investments in the transport sector are among those most vulnerable to changes in climate variables, including increased sea level and expected changes in the frequency and intensity of extreme weather events. The Sustainable Transport Initiative operational Plan (STI-oP) launched in 2010 commits ADB to the systematic integration of climate change adaptation measures into transport operations.
over the last few years, an increasing number of ADB investment projects in the transport sector have identified, assessed, and quantified climate change risk and adaptation options in both physical and economic terms. Some of these are described in the case studies presented in this publication. The case studies cover 11 projects involving highways, rural roads, waterways, and metro rail. The projects range in value from approximately $25 million to $1.9 billion, and are from all regions of Asia and the Pacific.
Building on this growing experience and the move toward systematic climate risk and vulnerability assessment (CRVA), there is increasing opportunity to mainstream climate resilience into investment projects. A number of lessons and opportunities emerge from the experience presented in this report. First, uncertainty about climate change and the lack of appropriate information and high-resolution climate projections have often limited the
Executive Summary
xiv
capacity to address climate change issues at a project level. This has been identified as a key impediment to CRVAs and to the design and implementation of effective adaptation responses.
while more information is urgently needed, sufficient capacity must also be in place to effectively use the information and facilitate decision making under uncertainty. The understanding and appropriate use of climate models and projections require capacity and expertise currently in short supply throughout the DMCs and their development partners, including ADB. A concerted effort needs to be made to address this critical gap.
An important opportunity to address this significant impediment arises with a climate projections consortium for Asia and the Pacific being established by ADB. This aims to be a regional climate consortium and data facility engaging the climate science community both within the region and internationally. It will make available a growing body of climate information and data products to support adaptation efforts. In addition to data and information, the consortium will provide thematic training, communications, and outreach as well as enhance the technical capacity of relevant agencies in DMCs and within ADB.
Second, in addition to expertise, undertaking CRVAs requires effort and resources. As a response to the lessons learned from this experience, ADB is now providing dedicated financing to undertake such assessments. It is currently expected that this financing window will support between 10 and 15 CRVAs until the end of 2015.
while this represents a significant step forward, it remains important to increase the volume of financing available for climate risk management and to put in place flexible and innovative financing modalities to access internal as well as external resources in support of climate risk management.
Finally, the CRVAs presented in this report generally indicate consideration of a large number of technically feasible climate proofing measures of both an engineering and nonengineering nature. The selection of specific climate proofing measures to be incorporated in project design, however, has not necessarily been subjected to adequate economic analysis.
ADB is currently finalizing a guideline on the economic analysis of climate proofing investment projects. Furthermore, ADB is reviewing its guidelines for the economic analysis of projects. These documents, accompanied by adequate training and capacity building, offer an important opportunity to increase the understanding of the conduct of cost–benefit analysis of investment projects in the context of risk and uncertainty introduced by climate change.
The experiences documented in this report clearly show that the transport sector has made substantial progress with the systematic integration of climate change adaption measures in investment projects. The midterm review of Strategy 2020 confirms that climate-resilient development is a core component of ADB’s long-term strategic framework. Considering that transport comprises about a third of ADB investments, progress under the sector also advances ADB’s strategic objectives to respond to climate change.
Executive Summary
xv
The experiences presented in this report, while covering only a subset of all CRVAs conducted in ADB across all sectors over recent years, clearly highlight that CRVAs
• can be undertaken within a reasonable time frame and with limited resources;
• provide a more comprehensive understanding of how an investment project may be affected by projected changes in key climate parameters;
• can offer, in most cases, a large menu of climate proofing measures, both engineering and nonengineering;
• can increase the climate resilience of an investment project without requiring significant changes to project design; and
• do not necessarily require large incremental costs to project investment.
Challenges due to inadequate information, capacity, and resources have certainly been encountered. The financing of CRVAs has often been challenging, and capacity and resource constraints have often been encountered when recommending climate proofing measures to DMCs. while some of these challenges are currently being addressed, others will best be addressed in close collaboration with other development partners. ADB remains committed to ensuring that CRVAs inform the design of investment projects at risk for the greater benefit of its DMCs. The key challenges and opportunities identified through this review provide direction for future efforts to mainstream climate adaptation for the transport and environment communities.

1
introduCtion
The long-term strategic framework of the Asian Development Bank, Strategy 2020 (ADB 2008a) and ADB’s Priorities for Action for
Addressing Climate Change (ADB 2010a) recognize that climate-resilient development requires the integration of actions and responses to the physical, social, and economic impacts of climate change into all aspects of development planning and investment. The midterm review of Strategy 2020 restates the importance of such integration (ADB 2014a).
The Sustainable Transport Initiative operational Plan (STI-oP) adopted in 2010 commits ADB to the systematic integration of climate change adaptation measures into ADB transport operations (ADB 2010b). At the United Nations Conference on Sustainable Development held in Rio in 2012 (Rio +20), ADB, along with seven other multilateral development banks (MDBs), committed to shifting more of its support to developing member countries (DMCs) toward sustainable transport projects and reporting annually on the sustainability of its portfolio. In parallel, ADB developed the Sustainable Transport Appraisal Rating (STAR) tool to assess the sustainability of ADB’s transport portfolio, which also provides the basis for the common monitoring and reporting framework adopted by MDBs (Veron-okamoto and Sakamoto 2014).
In 2011, ADB produced the Guidelines for Climate Proofing Investment in the Transport Sector: Road Infrastructure Projects (ADB 2011a) to guide project teams and DMCs on approaches to integrating climate risk management into the design and implementation of investment projects.
Three years after the approval of STI-oP, and in light of the growing attention to climate resilience, the Climate Change and Environment Advisory Team of ADB’s Transport Community of Practice initiated a review of ADB’s experience of climate change risk management in the transport sector. This publication is the outcome of this review prepared in collaboration with the Environment Community of Practice and the Environment and Safeguards Division of the Regional and Sustainable Development Department (RSES). It describes the initial experience to date with conducting climate risk and vulnerability assessment (CRVA) for investment projects in the transport sector, discusses challenges faced and lessons learned, and identifies opportunities to further facilitate mainstreaming of a climate risk management approach in investments.
The first section provides a brief description of the existing corporate approach toward managing climate risk in investment projects, including in the transport
Climate Proofing ADB Investment in the Transport Sector
2
sector. Section II presents a number of case studies where CRVA studies were carried out and/or where climate proofing measures have become an integral component of the project design.1 Section III discusses lessons emerging from the experience with CRVAs
in the transport sector and identifies opportunities for further mainstreaming such assessments in the transport sector. opportunities identified in this report may also be of relevance beyond the transport sector.
1 Note that the expression “climate proofing” does not necessarily imply a complete mitigation of the potential impacts of climate change on a project’s infrastructure or performance. An economically efficient level of adaptation may imply the presence of residual damages (ADB 2014c). In this report, the expressions “climate proofing” and “adaptation” are used interchangeably.
3
i. Climate risk management in adb
As noted in the Fifth Assessment Report (AR5) of the Intergovernmental Panel on Climate Change (IPCC), global and regional data
records clearly show that land surface air temperatures and sea surface temperatures have both increased in the course of the last century. Records also show that maximum and minimum temperatures over land have increased since the mid–20th century. Furthermore, each of the past 3 decades has been warmer than any previous decade in recorded history (IPCC 2013). As a result, glaciers worldwide, including those of the Asian mountains, have been shrinking, and snow cover has decreased. Reductions in the volume of glaciers and ice sheets combined with thermal expansion have led to a rise in global mean sea level. Records show that the mean rate of global averaged sea level rise has increased from 1.7 millimeters per year (mm/y) over the period 1901–2010, to approximately 3.2 mm/y over the period 1993–2010.
looking into the future, IPCC’s AR5 confirms many findings of earlier assessment reports: further increases in temperature, further rise in sea levels, and greater frequency and/or higher intensity of extreme weather
events.2 AR5 reassesses that near-term warming from past emissions is unavoidable (as a result of the thermal inertia of the oceans): barring major volcanic eruptions and significant changes in solar irradiance, global mean surface temperature for the period 2016–2035 is likely to be 1.0–1.5 degrees Celsius (°C) above the average temperature observed over the period 1850–1900. AR5 further notes that mitigation actions, even if they were to start now, do not produce different climate change outcomes for the next 30 years or so. Similarly, while there remains uncertainty as to the extent of sea level rise (the AR5 average sea level rise projections range from approximately 0.4 to 0.7 meters, with a maximum projection of 0.98 meters, by 2100), there remains no uncertainty as to the nature of the change: sea level will continue to rise for the forthcoming decades if not centuries.
Due to its vast and varied geography as well as being home to the largest population of the poor and vulnerable, Asia and the Pacific is at high risk from climate change and will experience most climate-related impacts. The IPCC’s AR5 (IPCC 2014) notes that climate change will
2 It is generally expected that global warming may lead to fewer but more intense tropical cyclones (Knutson et al. 2010): as sea surface temperature rises, potential intensity (the upper limit of wind speed) increases. Recent evidence suggests that storms of maximum intensities have migrated toward the poles over the past 30 years at a rate of approximately 1 degree per decade (Kossin et al. 2014). This suggests that coastal communities that have historically not been exposed to tropical cyclone hazards may be facing increasing threats.
4
Climate Proofing ADB Investment in the Transport Sector
• reduce renewable surface water and groundwater resources, exacerbating competition for water among sectors above and beyond other direct human sources of pressure such as land use change, pollution, and inadequate practices of water resource management;
• increase the risk of submergence, coastal flooding, and coastal erosion in coastal systems and low-lying areas including those of the Pacific DMCs. By 2100, hundreds of millions of people on the region’s coastlines alone are projected to be affected by climate change, with the majority of these affected people being in East, Southeast, and South Asia; and
• adversely impact human health by further exacerbating health problems associated with heat stress, extreme precipitation, flooding, drought, and water scarcity.
Partly as a result of its extensive coastlines, Asia and the Pacific is more vulnerable to coastal flooding than any other region in the world. Asia has over 750 urban settlements whose populations are located in low-elevation coastal zones. More than 60 cities of at least 100,000 persons are located within such zones (McGranahan et al. 2007). By the year 2025, 70% of Asia’s urban population is projected to live in coastal areas (Balk et al. 2009). By the year 2025, it is projected that approximately 430 million city dwellers will be at risk of coastal flooding, an increase of approximately 50% from the existing 300 million people. of the 25 most exposed cities in the world to a one-meter sea level rise, 12 are in Asia, of which 7 are in the Philippines (Brechtet al. 2012). Similarly, it is projected that 350 million urban Asians will be at risk of inland flooding by 2025, up from the existing 250 million people (Balk et al. 2012).
while mitigation must remain a priority objective to avoid catastrophic climate change, adaptation to climate change is essential. In its latest report, the IPCC noted that building resilient infrastructure systems (including transport infrastructure) could significantly reduce hazard exposure and vulnerability to climate change. There is now significant empirical evidence supporting a strong emphasis on adaptation in general, on building climate risk resilience, and on climate proofing development projects in particular.
ADB’s Strategy 2020 and Priorities for ActionADB’s long-term strategic goal set out in Strategy 2020 (ADB 2008a) emphasizes environmentally sustainable growth as a key pillar to achieving an Asia and Pacific region free of poverty, including adaptation to the unavoidable impacts of climate change:
ADB will also help DMCs adapt to the unavoidable impacts of climate change—including those related to health—through national and municipal planning, investments in defensive measures, support for insurance and other risk-sharing instruments, and “climate proofing” projects (ADB 2008a, p.19).
In 2010, ADB formalized its priorities for action in its effort to assist DMCs in addressing climate change. In particular,
Climate Risk Management in ADB
5
ADB will support country-driven climate change adaptation programs primarily by (i) promoting the mainstreaming of adaptation and disaster risk reduction into national development plans and ADB country partnership strategies; (ii) helping build the climate resilience of vulnerable sectors such as agriculture, energy, transport, and health, including preparation of climate-resilient sector road maps; and (iii) assisting the DMCs in climate proofing projects—including those financed by ADB—to ensure their outcomes are not compromised by climate change and variability or by natural hazards in general (ADB 2010a, p. 10).
To guide its adaptation interventions, ADB will support and join in the development of relevant adaptation methods, tools, practices, and cost-effective responses as well as assessments of physical, economic, and social vulnerabilities and impact (ADB 2010a, p. 11).
ADB’s Environmental Operational Directions 2013–2020 (ADB 2013) articulates the strategic agenda for pursuing environmentally sustainable growth and enhancing resilience to climate change. At the project level, it asserts ADB’s commitment to help DMCs develop climate proofed infrastructure, and to embed climate proofing in the project cycle. In line with these operational directions, ADB’s operational plan for disaster risk management (ADB 2014b) commits ADB to investing in climate risk reduction initiatives including the incorporation of cost-effective measures to strengthen resilience in engineering design.
The midterm review of Strategy 2020 (ADB 2014a) reinforces this commitment by indicating that ADB
will scale up support for mainstreaming climate risk management in investment projects and development planning:
ADB will further mainstream adaptation and climate resilience in development planning, as well as in project design and implementation. This will be pursued, for instance, through systematic screening of infrastructure projects to identify those at risk of being adversely affected by climate change, and by “climate proofing” vulnerable projects to make them resilient to climate change impacts. Partnerships will be fostered to share knowledge and good practice, and to facilitate access to expertise on climate risk and vulnerability assessments. Additional grant financing will be sought to help make DMCs more resilient to climate change, with an emphasis on low income countries, urban areas, small island states, and vulnerable sectors. Resources will be dedicated to allow climate risk management to be effectively built into project designs (ADB 2014a, p. 26).
ADB’s adaptation program has grown in recent years into a broad range of interventions to help DMCs reduce their vulnerability and address the impacts of climate change. Specifically, ADB is supporting DMCs’ efforts to (i) integrate climate change risk management and disaster risk reduction into national development strategies, sector plans, and investment projects; (ii) enhance capacity of governments, communities, and civil society to anticipate and manage climate risks; (iii) generate and disseminate climate change data, information, and knowledge; (iv) promote regional partnerships to facilitate information and knowledge sharing; and (v) leverage finance for adaptation. ADB’s total adaptation financing increased from $558
6
Climate Proofing ADB Investment in the Transport Sector
million in 2011 to $988 million in 2013, an increase of approximately 77%.3
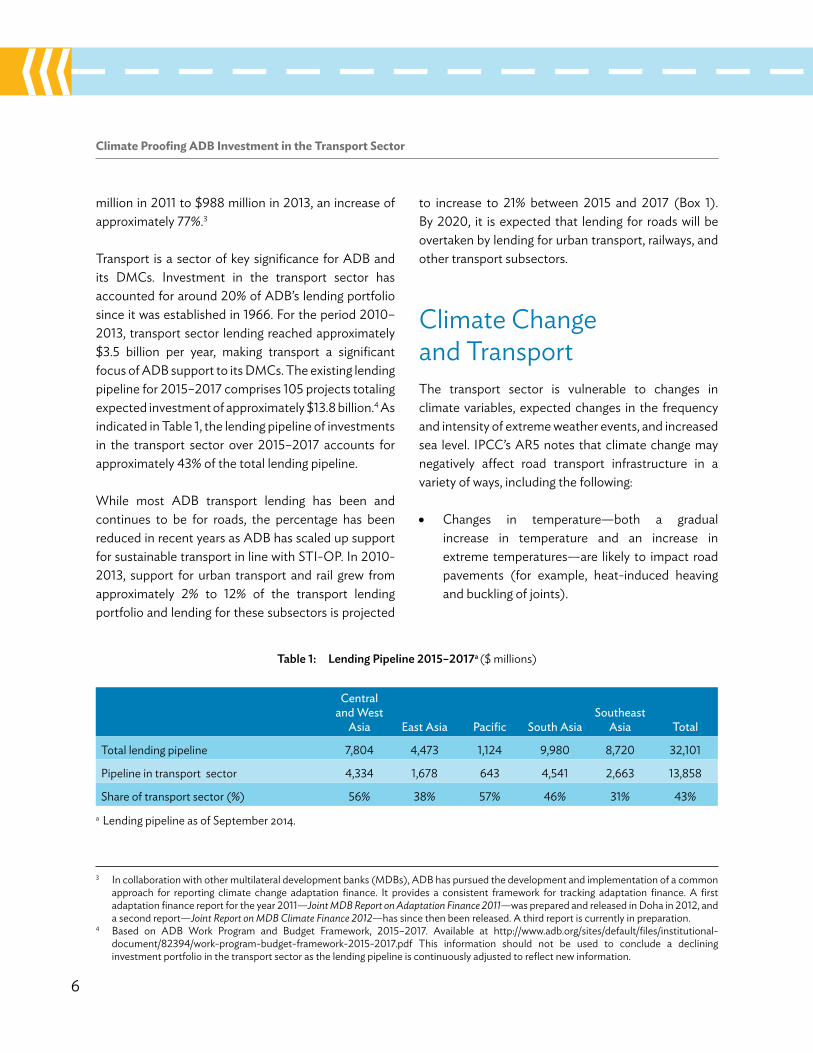
Transport is a sector of key significance for ADB and its DMCs. Investment in the transport sector has accounted for around 20% of ADB’s lending portfolio since it was established in 1966. For the period 2010–2013, transport sector lending reached approximately $3.5 billion per year, making transport a significant focus of ADB support to its DMCs. The existing lending pipeline for 2015–2017 comprises 105 projects totaling expected investment of approximately $13.8 billion.4 As indicated in Table 1, the lending pipeline of investments in the transport sector over 2015–2017 accounts for approximately 43% of the total lending pipeline.
while most ADB transport lending has been and continues to be for roads, the percentage has been reduced in recent years as ADB has scaled up support for sustainable transport in line with STI-oP. In 2010-2013, support for urban transport and rail grew from approximately 2% to 12% of the transport lending portfolio and lending for these subsectors is projected
to increase to 21% between 2015 and 2017 (Box 1). By 2020, it is expected that lending for roads will be overtaken by lending for urban transport, railways, and other transport subsectors.
Climate Change and TransportThe transport sector is vulnerable to changes in climate variables, expected changes in the frequency and intensity of extreme weather events, and increased sea level. IPCC’s AR5 notes that climate change may negatively affect road transport infrastructure in a variety of ways, including the following:
• Changes in temperature—both a gradual increase in temperature and an increase in extreme temperatures—are likely to impact road pavements (for example, heat-induced heaving and buckling of joints).
3 In collaboration with other multilateral development banks (MDBs), ADB has pursued the development and implementation of a common approach for reporting climate change adaptation finance. It provides a consistent framework for tracking adaptation finance. A first adaptation finance report for the year 2011—Joint MDB Report on Adaptation Finance 2011—was prepared and released in Doha in 2012, and a second report—Joint Report on MDB Climate Finance 2012—has since then been released. A third report is currently in preparation.
4 Based on ADB work Program and Budget Framework, 2015–2017. Available at http://www.adb.org/sites/default/files/institutional-document/82394/work-program-budget-framework-2015-2017.pdf This information should not be used to conclude a declining investment portfolio in the transport sector as the lending pipeline is continuously adjusted to reflect new information.
table 1: lending Pipeline 2015–2017a ($ millions)
central and west
asia east asia Pacific south asiasoutheast
asia Total
Total lending pipeline 7,804 4,473 1,124 9,980 8,720 32,101
Pipeline in transport sector 4,334 1,678 643 4,541 2,663 13,858
Share of transport sector (%) 56% 38% 57% 46% 31% 43%a lending pipeline as of September 2014.

Climate Risk Management in ADB
7
box 1: adb’s transport transformation
Following the adoption of its Sustainable Transport Initiative operational Plan, ADB’s portfolio in the transport sector has changed rapidly, with urban transport and railways accounting for an increasing share of the portfolio. These changes have gained further traction with a voluntary commitment by ADB (along with other multilateral development banks) made at the Rio +20 event to invest up to $175 billion for more sustainable transport over the coming decade. Under the Sustainable Transport Initiative operational Plan, ADB aims for its investment in urban transport and railways to represent approximately 55% of its transport sector lending portfolio by 2020.
78 74
61
42
17
10
11
25
2
2
12
1
1
21
1
2
12
21 30
1 3
0%
10%
20%
30%
40%
50%
60%
70%
80%
90%
100%
2000–2009 2010–2013 2015–2017 Projections
2020 Target
Perc
enta
ge o
f Por
tfolio
Multimodal logistics
Urban roads and urban public transport
Transport policies and institutional development
Air transport
Water transport (Non-Urban)
Rail transport (Non-Urban)
Road transport (Non-Urban)
Source: ADB staff estimates (unofficial). Figures for 2015–2017 are projections from the ADB. 2014. Work Program and Budget Framework, 2015–2017. Manila.
• Changes in temperature will also impact the behavior of permafrost and thus the infrastructure lying on permafrost.
• Changes in precipitation and water levels will impact road foundations.
• Extreme weather events such as stronger and/or more frequent storms will affect the capacity of drainage and overflow systems to deal with stronger or faster velocity of water flows.
• Stronger or faster velocity of water flows will also impact bridge foundations.
• Increased wind loads and storm strengths will impact long-span bridges, especially suspension and cable-stayed bridges.
• Increased storm surges will significantly impact all components of the coastal transportation infrastructure.

8
Climate Proofing ADB Investment in the Transport Sector
• Increased salinity levels will reduce the structural strength of pavements and lead to precipitated rusting of the reinforcement in concrete structures.
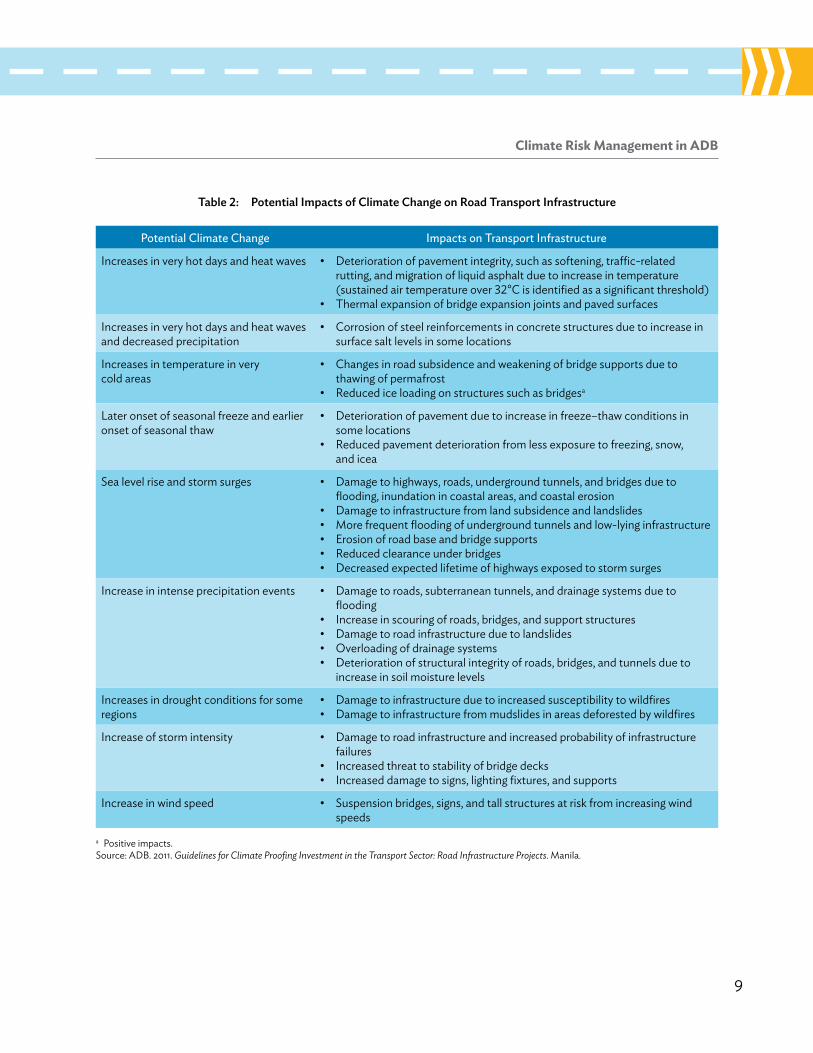
Additional potential impacts of climate change on road transport infrastructure are presented in Table 2.
Similarly, railways, urban transport, ports (inland ports and seaports), and airports may be adversely impacted by climate change (Table 2). Rail beds as well as airport runways and tarmacs may be generally vulnerable to increases in precipitation, flooding, sea level rise, and extreme events.5 Increases in high temperatures may lead to rail thermal expansion, while underground rail transport systems may be impacted by flooding. Due to their location, ports and seaports are particularly exposed to sea level rise and the expected intensification of storm surges. For example, it was recently estimated that the average annual cost to climate proof port areas in the People’s Republic of China could reach up to $350 million per year over the period 2010–2050 (Nicholls et al. 2013).
This exposure and vulnerability have been clearly recognized at a high level of management. In its priorities for action, ADB states that:
Transport infrastructure must be made resilient to the adverse impacts of climate change (ADB 2010a, page v).
Such importance and commitment have also been recognized by the Transport Community of Practice. The STI-oP, upon recognizing that transport investments are vulnerable to the effects of climate change, then asserts that:
ADB will also mainstream climate adaptation measures into its transport operations. These will include making climate adaptation adjustments to engineering specifications, alignments, and master planning; incorporating associated environmental measures; and adjusting maintenance and contract scheduling (ADB 2010b, p. 19).
In this context, the recently developed Sustainable Transport Appraisal Rating (STAR) framework includes climate resilience6 as one of the sustainable transport objectives (Veron-okamoto and Sakamoto 2014). The transport portfolio is assessed annually against the STAR framework to determine project sustainability performance ratings, to monitor progressive changes in the portfolio in line with the objectives of the STI-oP, and to contribute to the common assessment and reporting framework developed by the multilateral development banks.
The knowledge product Guidelines for Climate Proofing Investment in the Transport Sector (2011a) presents a set of 6 activities and 20 steps to integrate climate change adaptation into transport operations. Activities include screening of project exposure and vulnerability to climate change, technical and economic assessment of climate proofing measures, and monitoring and evaluation.
Ultimately, strategic and sector initiatives for climate resilience and climate proofing of investment projects are implemented by the regional departments at the project level. The next section examines the ADB-wide climate risk management process now under implementation.
5 on 25 october 2011, Don Muang Airport, Thailand’s second-largest airport (by number of passengers), was closed as a result of flooding brought about heavy monsoon rain. The airport remained closed for approximately 4 months.
6 In the STAR framework, the climate resilience objective is defined as “improving the resilience of the transport system to impacts of climate change, including climate variability and extreme weather events.”
Climate Risk Management in ADB
9
table 2: Potential impacts of Climate Change on road transport infrastructure
Potential climate change impacts on Transport infrastructure
Increases in very hot days and heat waves • Deterioration of pavement integrity, such as softening, traffic-related rutting, and migration of liquid asphalt due to increase in temperature (sustained air temperature over 32°C is identified as a significant threshold)
• Thermal expansion of bridge expansion joints and paved surfaces
Increases in very hot days and heat waves and decreased precipitation
• Corrosion of steel reinforcements in concrete structures due to increase in surface salt levels in some locations
Increases in temperature in very cold areas
• Changes in road subsidence and weakening of bridge supports due to thawing of permafrost
• Reduced ice loading on structures such as bridgesa
later onset of seasonal freeze and earlier onset of seasonal thaw
• Deterioration of pavement due to increase in freeze–thaw conditions in some locations
• Reduced pavement deterioration from less exposure to freezing, snow, and icea
Sea level rise and storm surges • Damage to highways, roads, underground tunnels, and bridges due to flooding, inundation in coastal areas, and coastal erosion
• Damage to infrastructure from land subsidence and landslides• More frequent flooding of underground tunnels and low-lying infrastructure• Erosion of road base and bridge supports• Reduced clearance under bridges• Decreased expected lifetime of highways exposed to storm surges
Increase in intense precipitation events • Damage to roads, subterranean tunnels, and drainage systems due to flooding
• Increase in scouring of roads, bridges, and support structures• Damage to road infrastructure due to landslides• overloading of drainage systems• Deterioration of structural integrity of roads, bridges, and tunnels due to
increase in soil moisture levels
Increases in drought conditions for some regions
• Damage to infrastructure due to increased susceptibility to wildfires• Damage to infrastructure from mudslides in areas deforested by wildfires
Increase of storm intensity • Damage to road infrastructure and increased probability of infrastructure failures
• Increased threat to stability of bridge decks• Increased damage to signs, lighting fixtures, and supports
Increase in wind speed • Suspension bridges, signs, and tall structures at risk from increasing wind speeds
a Positive impacts. Source: ADB. 2011. Guidelines for Climate Proofing Investment in the Transport Sector: Road Infrastructure Projects. Manila.

10
Climate Proofing ADB Investment in the Transport Sector
Climate Risk Screening and Vulnerability Assessment in ADB Investment ProjectsAlong with its overall financial support and technical assistance to countries of the Asia and Pacific, which now spans over 4 decades, ADB has also supported climate risk management in investment projects for numerous years. In 2003, ADB completed a 3-year project (Climate Change Adaptation Program for the Pacific) to assist selected Pacific DMCs to adapt to climate change variability. The project prepared climate change impact and risk profiling in eight countries, and developed a support kit and guidelines on mainstreaming adaptation. The project’s findings supported participating governments in adopting national guidelines for mainstreaming adaptation to climate change, and informed ADB’s institutional approach to climate change risk management.7
Since these early efforts, ADB has continued to develop and pilot test methods and tools to assess climate change vulnerability and impacts, and to identify adaptation needs and options. These methods and tools aim to assist ADB and DMCs in managing climate change risks throughout the project cycle. They include (i) risk screening tools that enable rapid risk assessment at the project preparation stage; (ii) sector briefings on adaptation; and (iii) technical guidelines for the assessment of climate impacts,
evaluation of risks, identification and prioritization of adaptation options, and monitoring and evaluation of adaptation measures. ADB’s approach to climate risk management has evolved from an initial identification of entry points for promoting adaptation in operations to a more rigorous framework to systematically identify proposed investments that may be adversely affected by climate change at the very early stages of project development and incorporate risk reduction measures in the project design.
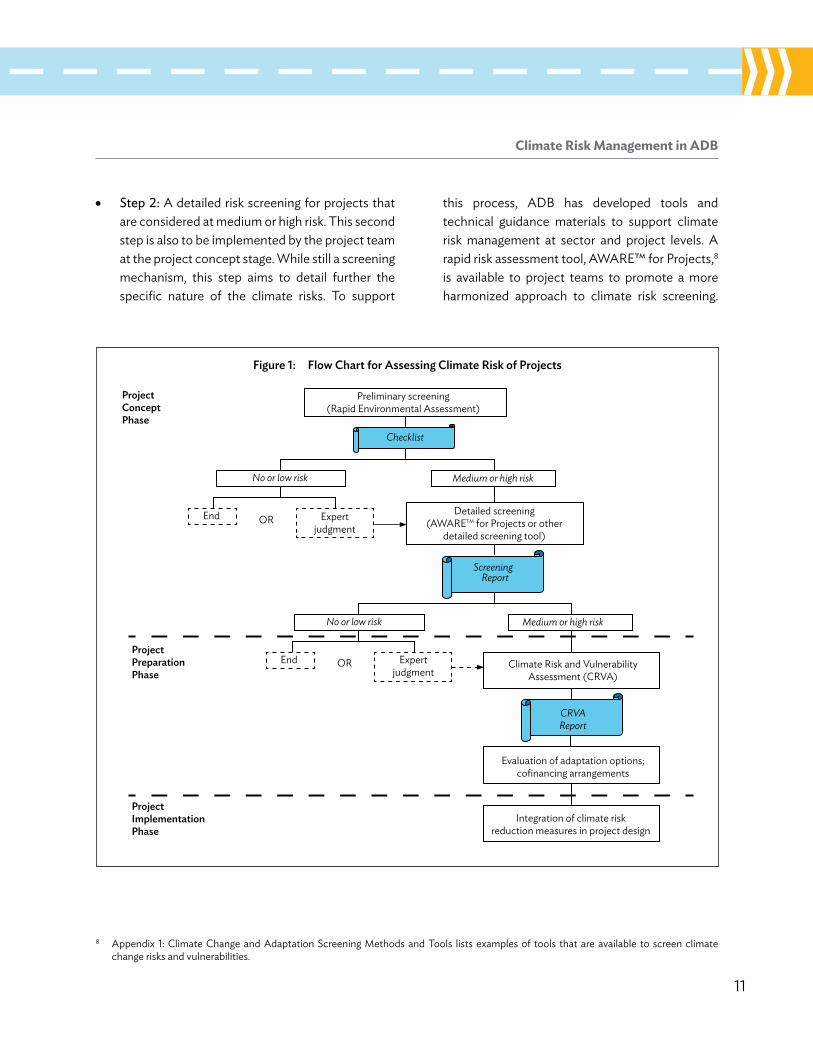
This framework (Figure 1) was institutionalized in early 2014, as a response to the mandated requirement that exposure and vulnerability to climate change risks be identified and accounted for in the preparation of investment projects.
As shown in Figure 1, the basic steps of the framework include the following:
• step 1: A preliminary climate risk screening to identify projects that may be at risk. This first step, undertaken at the project concept stage by the project processing team, is embedded in the project’s rapid environmental assessment. This first step aims to provide an initial assessment of the level of sensitivity of the project location and project components to climate variables such as temperature, and rainfall quantity and temporal distribution. This preliminary risk screening will indicate whether further climate risk screening should be undertaken.
7 The project’s main findings are summarized in ADB (2005).
Climate Risk Management in ADB
11
8 Appendix 1: Climate Change and Adaptation Screening Methods and Tools lists examples of tools that are available to screen climate change risks and vulnerabilities.
Figure 1: Flow Chart for assessing Climate risk of Projects
Preliminary screening(Rapid Environmental Assessment)
Medium or high risk
No or low risk
Checklist
End Expertjudgment
OR
Screening Report
Medium or high risk No or low risk
End Expertjudgment
OR
ProjectConceptPhase
Climate Risk and VulnerabilityAssessment (CRVA)
Integration of climate riskreduction measures in project design
CRVAReport
ProjectImplementationPhase
ProjectPreparationPhase
Evaluation of adaptation options;cofinancing arrangements
Detailed screening(AWARETM for Projects or other
detailed screening tool)
• step 2: A detailed risk screening for projects that are considered at medium or high risk. This second step is also to be implemented by the project team at the project concept stage. while still a screening mechanism, this step aims to detail further the specific nature of the climate risks. To support
this process, ADB has developed tools and technical guidance materials to support climate risk management at sector and project levels. A rapid risk assessment tool, AwARE™ for Projects,8 is available to project teams to promote a more harmonized approach to climate risk screening.

12
Climate Proofing ADB Investment in the Transport Sector
operational departments may also apply approaches that suit their needs in conjunction with the in-house knowledge and expertise. A risk rating of medium or high should then lead to the undertaking of the third and final assessment.
• step 3: A CRVA to quantify climate change risks on the project, and subsequent development of adaptation measures in the project design. This step, undertaken during project preparation, requires analysis of climate data (including model projections); impact assessments on project infrastructure, inputs, and performance; and technical and economic feasibility analyses of adaptation options.
• step 4: Reporting of the CRVA. The level of risk identified during concept development and the findings of the CRVA carried out during project preparation are documented in the report and
recommendations to the President and other ADB board documents. A supplementary document describing the CRVA, the adaptation measures incorporated in the project design, and associated costs can also be attached to the ADB board documents. The level of risk assigned to the project and the budget allocated to adaptation measures are recorded in the ADB project classification system for monitoring and reporting purposes.
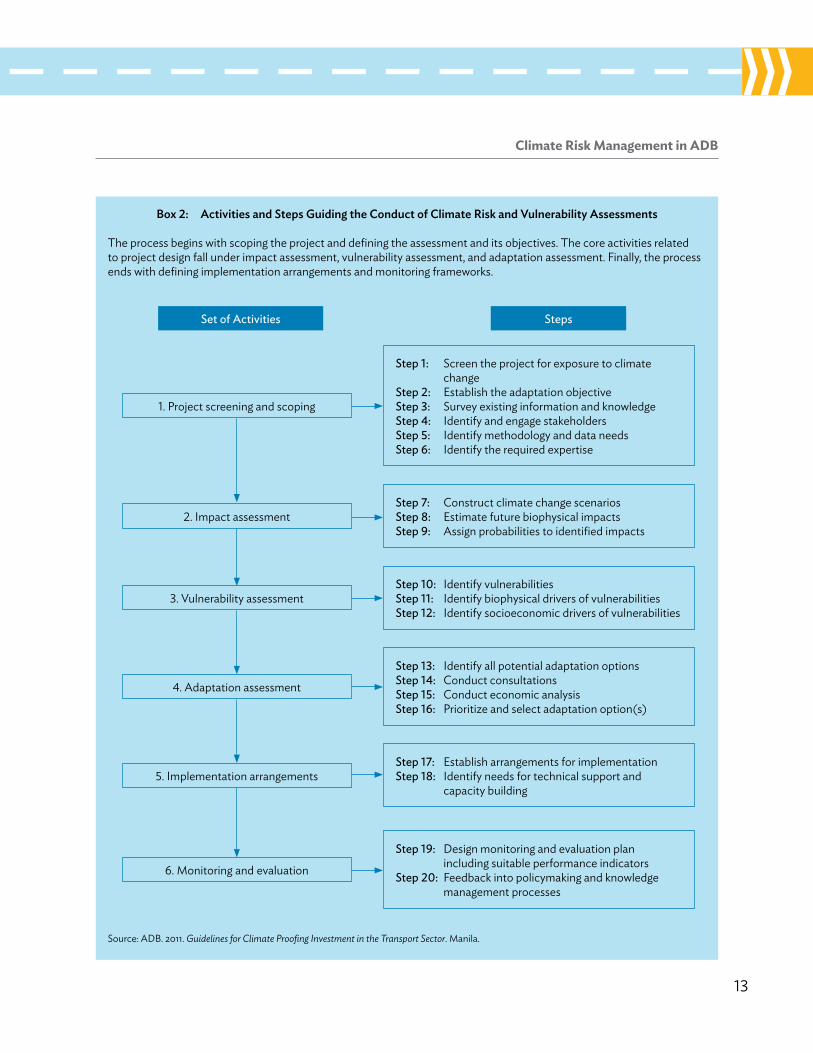
The methodological approach for conducting a CRVA is usually divided into six different sets of activities, comprising 20 steps, which are aligned with the ADB project cycle (Box 2).
The implementation of the above framework for assessing, identifying, and quantifying climate risk and vulnerability is fine-tuned by ADB’s regional departments to suit specific regional needs (Box 3).
Climate Risk Management in ADB
13
box 2: activities and steps guiding the Conduct of Climate risk and vulnerability assessments
The process begins with scoping the project and defining the assessment and its objectives. The core activities related to project design fall under impact assessment, vulnerability assessment, and adaptation assessment. Finally, the process ends with defining implementation arrangements and monitoring frameworks.
Source: ADB. 2011. Guidelines for Climate Proofing Investment in the Transport Sector. Manila.
1. Project screening and scoping
2. Impact assessment
3. Vulnerability assessment
4. Adaptation assessment
5. Implementation arrangements
6. Monitoring and evaluation
stepsset of activities
step 1: Screen the project for exposure to climate change
step 2: Establish the adaptation objectivestep 3: Survey existing information and knowledgestep 4: Identify and engage stakeholdersstep 5: Identify methodology and data needsstep 6: Identify the required expertise
step 7: Construct climate change scenariosstep 8: Estimate future biophysical impactsstep 9: Assign probabilities to identified impacts
step 10: Identify vulnerabilitiesstep 11: Identify biophysical drivers of vulnerabilitiesstep 12: Identify socioeconomic drivers of vulnerabilities
step 13: Identify all potential adaptation optionsstep 14: Conduct consultations step 15: Conduct economic analysisstep 16: Prioritize and select adaptation option(s)
step 17: Establish arrangements for implementationstep 18: Identify needs for technical support and
capacity building
step 19: Design monitoring and evaluation plan including suitable performance indicators
step 20: Feedback into policymaking and knowledge management processes

14
Climate Proofing ADB Investment in the Transport Sector
box 3: Climate risk and vulnerability assessment in operational departments
central and west asia department (cwrd)
Screening projects for climate change vulnerability, risks, and adaptation opportunities is undertaken by the Climate Change Team of the Central and west Asia Environment, Natural Resources and Agriculture Division. Based on initial screening, the division assigns a risk ranking to the project during draft concept paper review and before concept clearance. The nature of the ranking will determine appropriate climate change interventions to be built into project preparation, design, and implementation. A project is classified as high, medium, or low based on the degree of the risk to project input, performance, and output.
Further climate change assessments may be advised to be carried out during project preparation to identify project climate adaptation design measures in projects at risk. The risk ranking and a description of the adaptation measures incorporated in the project design are reported in the report and recommendation of the President, together with the adaptation spending identified during project preparation.
east asia department (eard)
EARD mission leaders are responsible for categorizing climate risks for their own projects. Mission leaders may consult with the environmental safeguards specialists or climate change specialists if they wish, and climate risk considerations are included in the environmental impact assessments as deemed appropriate. The East Asia Environment, Natural Resources and Agriculture Division has put together available information for priority areas in the People’s Republic of China and Mongolia on (i) historical annual and monthly averages and predicted changes in temperature, precipitation, soil moisture, evapotranspiration, humidity, and runoff, and (ii) the likelihood of severe storms, droughts, and floods. If this information is not available, then climate change projections from publicly available models are used. If possible, data is organized by a global bioclimatic scheme that takes into account climate variables. Climate studies have been carried out for a number of projects considered at high risk from climate change effects with support from the ADB Climate Change Fund.
Pacific department (Pard)
PARD mission leaders, assisted by the environmental safeguards specialist and climate change specialist, are responsible for the categorization and risk screening of projects. The initial screening is carried out during the concept stage, and a risk classification is assigned to the project. Depending on the risk classification, the climate parameters of concern, and the type of project investments, further risk assessments may be recommended to be carried out during project preparation. The climate change assessments will further guide the selection of appropriate climate change adaptation interventions to be built into project design and implementation. PARD, in partnership with the world Bank and the Government of Australia, is currently assessing the possibility of adopting some common standards for climate risk management for projects among development partners in the Pacific.
south asia department (sard)
SARD has established an internal mechanism wherein the Portfolio Results and Quality Control Unit under the office of the Director General (SAoD-PR) automatically screens all pipeline projects within the department for climate change risks at the concept stage. Using high-resolution climate projection data supplemented by up-to-date knowledge and information, project-specific risks related to both natural hazards and climate change are identified and analyzed. The results of the risk screening, including identifying the need for further studies, are shared with the project team in the early stages of project preparation. Guidance is sought from SAoD-PR when necessary by the project team throughout
continued on next page
Climate Risk Management in ADB
15
the preparation of the project. The project team assesses adaptation options for the project and includes them in the project design. To document the due diligence conducted, including measures taken to mitigate climate change risks, a supplementary appendix is attached to the report and recommendation of the President.
southeast asia department (serd)
SERD has developed a checklist for integrating climate change concerns in projects. The checklist also enables a project to be categorized into three levels of vulnerability (high, medium, and low). The climate change focal point in SERD, in collaboration with environmental safeguards specialists and other specialists in various divisions and resident missions, has a department-wide mandate to conduct a preliminary assessment of climate change implications for projects during the early stages of concept paper review. wherever such an initial assessment, which is largely based on desk review, suggests that climate change may pose medium to high risk, mission leaders are advised to include specific activities for climate risk assessment during project preparation, and provide appropriate adaptation options. For projects with significant risks, a supplementary document is prepared as part of the report and recommendation of the President to describe potential climate change risks and actions that might be considered to address those risks.
Private sector operations department (Psod)
PSoD environmental safeguards staff are tasked to ensure that climate risks are appropriately assessed in projects. Initial screening is carried out by using the Rapid Environmental Assessment checklist for environment categorization. For those projects that have potential risks, the PSoD project team supports clients in developing their risk mitigation measures by closely coordinating with Environment and Social Safeguards Division of the Regional and Sustainable Development Department (RSES) and the clients’ consultants. Provided that a client is committed to addressing climate change risk on the project, RSES support is crucial as PSoD has neither staff dedicated to climate change issues nor access to project preparation technical assistance funding.
Box 3 continued

16
ii. exPerienCe with Climate risk and vulnerability assessment in transPort ProjeCts
over the course of recent years, a significant number of ADB investment projects adopted a climate risk management approach,
undertook a CRVA and, where appropriate, examined the technical and economic feasibility of adaptation measures.
This section reviews a number of these assessments in the transport sector with the purpose of identifying lessons and challenges that can guide climate risk management in future projects.
Each case study presented below is generally organized along the following lines: (i) a description of the investment project, (ii) the preparation and use of climate change projections, (iii) a presentation of the vulnerability assessment, (iv) a discussion of the nature of climate proofing measures, and where available (v) a brief discussion of the economics of climate proofing investments.
As shown in the review of the 11 case studies presented below, while all CRVAs have pursued the general approach presented in the earlier section, the actual undertaking of a CRVA and of its design are conditional on the specific circumstances of the project, including the nature of the project, its location, the extent of data availability, the quality of existing information, and time and resources available to the project team. These case studies highlight that a CRVA is a collaborative process aimed at informing project teams and governments about future climate risks that can affect the performance of an investment project.
The case studies are grouped into four transport subsectors: (i) main roads and bridges, (ii) remote rural roads, (iii) urban transport, and (iv) waterways and ports.
Experience with Climate Risk and Vulnerability Assessment in Transport Projects
17
MAIn RoADS AnD BRIDgES
Nganglam–Deothang highway, which forms a section of the southern east–west highway; (ii) a mini dry port in the city of Phuentsholing and a land customs station at Alay; and (iii) a bypass road in Phuentsholing. The highway is considered to be a critical missing link between east and west Bhutan. The project will directly benefit almost 17% of Bhutan’s population through provision of shorter and safer routes within the country.
The Nglanglam–Deothang10 road is located in hot, subtropical southern Bhutan. In the project area, mean maximum temperature (over the period 2005–2011) reached approximately 29°C while mean minimum temperature was estimated to be approximately 11°C. The project is also located in a high rainfall zone with total annual rainfall of nearly 4,000 mm per year. The maximum mean monthly rainfall occurs during july with average rainfall of 935.82 mm and the mean minimum monthly rainfall of 4.0 mm takes place in the month of November (Bhutan Department of Roads 2014).
Road design, construction, and maintenance in Bhutan are governed by guidelines that do not explicitly account for changes in future temperature and precipitation. This could jeopardize the expected benefits from road transport investments.11 A CRVA was thus undertaken to identify key climate risks and adaptation needs in current road construction practices. The assessment examines the proposed 68.3 km Nglanglam–Deothangroad component of the SASEC Connectivity Project.
9 Project Number 39225-034 (March 2014). Project documents available at www.adb.org/projects/documents/south-asia-subregional-economic-cooperation-road-connectivity-project-rrp
10 Note that “Deothang” may also be spelled “Dewathang.”11 Based on a review of the Department of Roads principal manuals for the design, construction, and maintenance of roads and bridges:
the Road Survey and Design Manual, june 2005; Pavement Design Manual, june 2005; Bridge Reference Manual, june 2005; and Road Maintenance Manual, june 2005.
Bhutan: South Asia Subregional Economic Cooperation Road Connectivity Project
the Project9
Bhutan is a small kingdom covering an area of approximately 38,394 square kilometers (km2) in the eastern part of the himalayan Range. Expanding and maintaining roads to connect a small and dispersed population of over 700,000 people across mountainous terrain with high seismic risk and challenging weather conditions makes the achievement of economies of scale in service delivery difficult and costly. high domestic and cross-border transport costs and limited accessibility have constrained the country’s economic and social development. Facilitating the movement of goods and people within and across the country is key to Bhutan’s economic development.
The Bhutan South Asia Subregional Economic Cooperation (SASEC) Road Connectivity Project aims to respond to this need. The immediate outcome of the project will be improved efficiency of land transportation. The key outputs are (i) improvement and construction of 68.3 kilometers (km) of the
18
Climate Proofing ADB Investment in the Transport Sector
approach to Climate risk assessment
The CRVA implemented in the context of the Bhutan project made use of a number of databases including (i) a geophysical database (comprising geophysical data such as soil, land use and cover, vegetation cover, elevation, hydrology, and ecosystems), and (ii) a climate database in which primary climatic data such as monthly precipitation, temperature, rainy days, solar radiation, wind speed, frost days, sunshine hours, and relative humidity are assembled. These databases were then fed into an image processing system to identify areas of exposure and vulnerability and options for climate proofing.
Climate risks were identified using the following three approaches:
1. literature review. To find data on future climate changes in Bhutan and its surrounding region, literature reviews were carried out. Two reports were found to have data relevant for the project road: a report on vulnerability and adaptation assessment prepared by the National Environment Commision of Bhutan (NEC 2011), and a report on the impacts of climate change in the Eastern himalayas published by the International Centre for Integrated Mountain Development (ICIMoD 2010).
2. Hydrological assessment. Since flooding (mainly flash floods) and landslides are common occurrences in Bhutan, an in-depth hydrological assessment was carried out as part of the climate change study to identify the implications of
climate change on flooding and landslides. hydrological and climatic data on the project area were collected from the Meteorology Section, hydro–Met Services Division, Department of Energy, Ministry of Economic Affairs. This was further augmented by field data collected on rivers and streams crossing the Nglanglam–Deothang road. Discharge levels in cubic meters per second were calculated for all the streams and rivers crossing the project road based on the data collected from the meteorology section and field data. Future climate data on temperature and rainfall were taken from the NEC and ICIMoD reports and applied to the hydrological formulas to quantify the discharge levels with future climate change.12 This exercise resulted in identification of impacts of future projected climate change on key hydrological parameters that are relevant to the design, performance, and maintenance of the road and bridges.
3. vulnerability mapping. Vulnerability mapping of the Nglanglam–Deothang Road was carried out based on the field data and existing knowledge of the project area to identify specific areas that are vulnerable to climate change such as landslide-prone areas, areas with steep slopes, and geologically weak areas.
Climate Change Projections
The NEC conducted an in-depth climate change and adaptation study using downscaled projections from two general circulation models13 to determine the
12 This also resulted in the creation of an Excel-based worksheet on hydrological calculations, which could be used for other projects. The worksheet has provisions for automatic calculation of discharge levels with and without climate change after entering key data that would vary from one project to another.
13 The climate model from the hadley Centre climate model (hadCM3) and from the Max-Planck-Institut für Meteorologie (EChAM5).

Experience with Climate Risk and Vulnerability Assessment in Transport Projects
19
trajectory and scale of changes in mean annual and seasonal temperatures based on IPCC’s A1B emissions scenario.14 The NEC study concluded that temperature and precipitation changes will be zonal in nature and increasing by latitude, with northern Bhutan projected to experience a higher percentage of change in precipitation than the southern subtropical area. The
scenarios indicate that surface air temperature relative to the baseline period of 1961–1990 will be in the order of 1.4 ± 0.3°C in the 2020s, 2.5 ± 0.4°C in the 2050s, and 3.8 ± 0.5°C in the 2080s. It was also estimated that there will be a 7% increase in monsoon precipitation over the Eastern himalayas by the middle of the 21st century (Table 3).
table 3: Climate Change Projections for bhutan
climate Parameter 2010–2039 2040–2069Temperature Mean annual temperature is projected to
increase by 0.8°C (EChAM5) to 1.0°C (hadCM3)
hadCM3 projects a larger increase in mean winter temperature (1.2°C), and a lower increase in mean monsoon temperature (0.8°C).
EChAM5 projects a similar increase in mean winter and monsoon temperatures.
Mean annual temperature is projected to increase by 2.0°C (EChAM5) to 2.4°C (hadCM3)
hadCM3 projects a larger increase in mean winter temperature (2.8°C), and a lower increase in mean monsoon temperature (2.1°C).
EChAM5 projects a similar increase in mean winter and monsoon temperatures.
Rainfall Small to moderate projected increase in mean annual precipitation ranging between 22.1 mm (Sarpang District) and 200.2 mm (haa District). In relative terms, mean annual precipitation is projected to increase by 0.7% (Sarpang and Tsirang districts) and 19.8% (Gasa District).
Mean monsoon precipitation may increase in some districts (91.4 mm in Gasa District) and decrease in others (–59.6 mm in Tsirang District). In relative terms, changes vary from –2.9% (Sarpang and Tsirang districts) to +19.4% (Gasa District).
Moderate to large projected increase in mean annual precipitation ranging between 232.0 mm (Sarpang District) and 480.1 mm (haa District). In relative terms, mean annual precipitation is projected to increase by 6.8% (Sarpang District) and 59.4% (Gasa District).
Mean monsoon precipitation is projected to increase by 99.6 mm (Samdrupjongkhar District) and 344.5 mm (Punakha District). In relative terms, changes vary from +6.3% (Sarpang District) to +69.3% (Gasa District).
Mean winter precipitation to increase by 5.6 mm (Tsirang District) to 42.5 mm (haa District). In relative terms, changes vary from +2.9% (Tsirang District) to +138.9% (Gasa District).
Source: National Environment Commission (NEC). 2011. Climate Change: Vulnerability and Adaptation Assessment Volume 1: Technical Paper. Second National Communication from Bhutan to the United Nations Framework Convention on Climate Change. Thimpu: Government of Bhutan.
14 All studies reported in this publication were concluded before the publication of the fifth assessment report by the IPCC. In this latest report, the IPCC has introduced a new way of developing climate scenarios known as representative concentration pathways (RCPs). Appendix 2 provides a brief description of emissions scenarios and of the revised RCP approach.

20
Climate Proofing ADB Investment in the Transport Sector
Climate Change vulnerability assessment
A climate change vulnerability map for the Nganglam–Deothang road was produced using a geographic information system based on existing topographic data and field data collected using a global positioning system. The vulnerability map was obtained after superimposing the aspect, slope, and other field-verified vulnerable areas observed and recorded during field visits. Figure 2 shows areas of the Nganglam–Deothang road identified as vulnerable to climate change. These are areas with slopes greater than 60°, wet north-facing slopes, and critical areas recorded during the field visit. on the basis of the analysis, it was determined that the Nganglam–Deothang road is particularly vulnerable to temperature and precipitation increases and that the key road features at risk are the pavement, cross and longitudinal drains, bridges, and slopes on either side of the road (Table 4).
Climate Proofing measures
A number of potential climate proofing measures were examined involving both hard engineering measures as well as soft measures such as the review of design guidelines. In Table 5, “good practice” measures refer to conventional road construction and maintenance activities that may also help to minimize climate risks, while “climate proofing measures” refer to new or additional activities implemented specifically for climate change adaptation.
Discussions with stakeholders were held during the detailed design stage to prioritize climate proofing measures. In the course of this process, it was deemed that addressing projected changes in climate extremes was a priority. The following specific climate adaptation measures were incorporated in the final detailed design of the Nglanglam–Deothang road:
Figure 2: nglanglam–deothang road vulnerability map
Source: ADB. 2014. Report and Recommendation of the President to the Board of Directors: Proposed Loan and Grant to the Kingdom of Bhutan: South Asia Subregional Economic Cooperation Road Connectivity Project. Manila.
Experience with Climate Risk and Vulnerability Assessment in Transport Projects
21
• Upgrade concrete mix. Use M15 concrete mix (in lieu of M10) with a higher proportion of cement to improve the strength of the concrete and its ability to withstand extreme weather.
• Upgrade mortar mix. Use 1:4 (cement:sand) ratio (in lieu of 1:6) to increase mortar strength.
• Upgrade random rubble masonry wall. Standard practice is for the middle section of rubble masonry wall to be made of packed stones with the top and bottom made of concrete. The entire wall will now be made of concrete to improve the strength of the wall.
table 4: Climate Change threats to the nglanglam–deothang road Project
climate change Threats
Temperature increase
high temperatures are likely to cause bleeding, rutting, and segregation leading to pavement failure.
Regular thermal expansion and contraction has significant impact on bridge structure along the Nglanglam–Deothang road. The increase in frequency, intensity, and duration of heat waves brought about by climate change will have further adverse impacts on bridge structures.
Increasedprecipitation
Climate change is expected to bring extreme precipitation and flooding, which may lead to blockage of surface drains and damage the pavement surface.
Road damage by surface water is expected to increase in the future as a consequence of the predicted increase in general rainfall and more frequent heavy storm events. l-drain (the most commonly constructed drain) and hume pipe (reinforced concrete pipe) crossings are inadequate to meet the extreme weather conditions of southern Bhutan.
high-intensity precipitation has the potential to trigger significant material slides. Geographic information system analysis along with field verification shows the presence of a number of areas vulnerable to landslide or slope failure that could be triggered by extreme precipitation.
hydrological study reveals that major bridges of the Nglanglam–Deothang road over the Kirungri River, the Tshokhiri–Chowkiri River, and the Duiri River are less likely to be affected by extreme flooding due to geomorphological advantages of the bridge locations.
however, bridges on smaller streams with flatter streambeds are more likely to be affected by flash floods.
• Increase the number of cross drainage structures: Construct 5 cross drains per kilometer (in lieu of 4) to facilitate increased discharge levels.
• Increase the capacity of Hume pipes: Use 900 and 1,200 mm diameter hume pipes (in lieu of 450 mm and 600 mm) to facilitate proper flow of water and avoid frequent blockages due to debris being washed down.
• Increase slope of L-drain: Design l-drains with floor slope of 20% (in lieu of 15%) to improve the capacity for discharging increased quantities of water.
22
Climate Proofing ADB Investment in the Transport Sector
table 5: good Practice and Climate Proofing measures for the nglanglam–deothang road
risk good Practice and adaptation measures
Pavement: Increased heat waves will result in pavement surface deformation and cracking.
good practice:•Sealcrackedanddistressedareas.•Removeroadsidevegetation.•Increasefrequencyofgrasscutting.climate proofing measures:•Reviewpavementdesignguidelines.•Examinebuildingpracticesinwarmerneighboringcountries.•Usecut-backbitumenwithfast-evaporatingcutteroilsuitableforwarmclimate.•Improvesurfaceandsubsurfacedrainagesystems.•Stabilizeunsealedpavements.
bridges:Extreme flooding will lead to increased volume of water debris flows, which will scour and erode bridge foundations thereby weakening or permanently damaging the bridge.
good practice:•Inspectwatercoursesregularly.•Cleanoutdebrisfromwatercoursesandbridgestructuresinflood-proneareas.•Keeprecordsoffloodingeventsandlocations.•Preparecontingencyandemergencyplans.climate proofing measures:•Reviewfloodprojectionsbasedonhydrologicalstudy.•Reviewdesignstormreturnperiods.•Drawupmapsofflood-proneareasconsideringincreasingprecipitation.•Developnewdesignstandardsforhydraulicstructures.•Reinforcestructuresatrisktoprotectagainstscouringofbridgepiers.•Planforlanduseandupstreamwatershedmanagement.
continued on next page
• Use trapezoidal drains. Use trapezoidal l-drains (in lieu of longitudinal l-drains) to improve the capacity to discharge increased quantities of water.
• Introduce wing walls to protect bridges: Use wing walls on all bridges to protect the bridge foundation and abutment from scouring.
Climate Proofing Costs
Incorporating all of the above prioritized climate proofing measures increased civil works costs by approximately $1.6 million, representing 5.2% of the total project capital cost. The expected benefits of the investment in terms of anticipated reduction in future maintenance or repair costs have not been estimated.
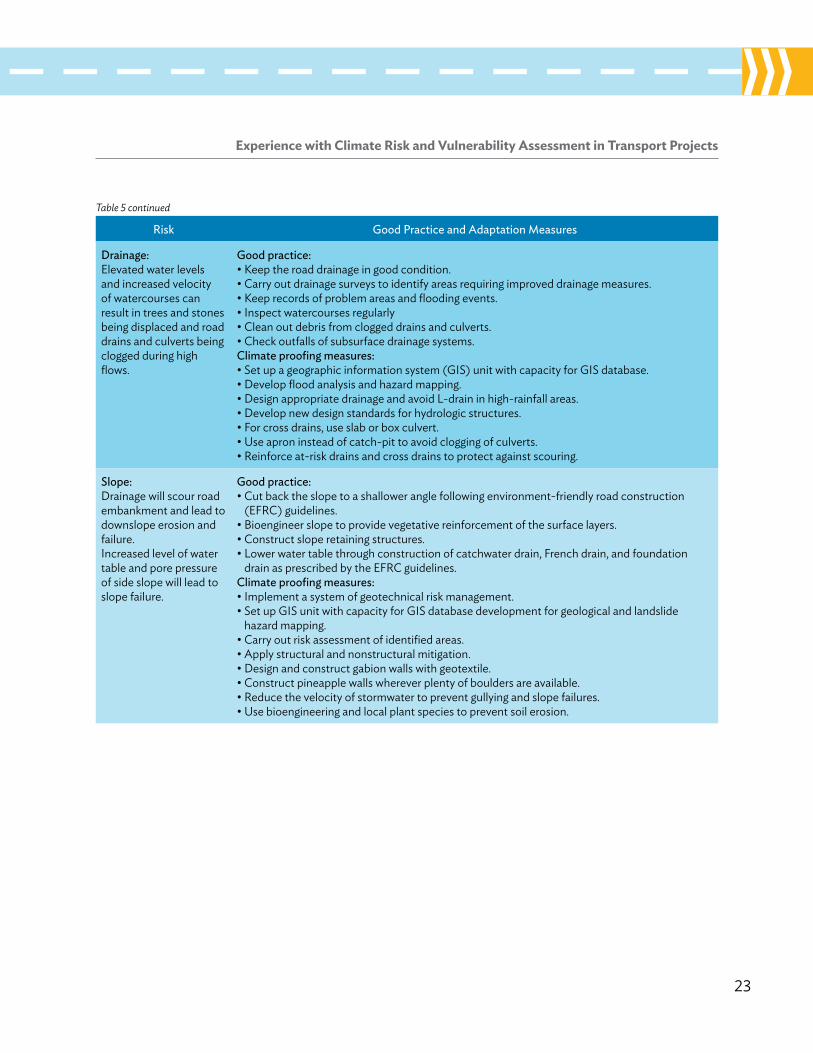
Experience with Climate Risk and Vulnerability Assessment in Transport Projects
23
risk good Practice and adaptation measures
drainage:Elevated water levels and increased velocity of watercourses can result in trees and stones being displaced and road drains and culverts being clogged during high flows.
good practice:•Keeptheroaddrainageingoodcondition.•Carryoutdrainagesurveystoidentifyareasrequiringimproveddrainagemeasures.•Keeprecordsofproblemareasandfloodingevents.•Inspectwatercoursesregularly•Cleanoutdebrisfromcloggeddrainsandculverts.•Checkoutfallsofsubsurfacedrainagesystems.climate proofing measures:•Setupageographicinformationsystem(GIS)unitwithcapacityforGISdatabase.•Developfloodanalysisandhazardmapping.•DesignappropriatedrainageandavoidL-draininhigh-rainfallareas.•Developnewdesignstandardsforhydrologicstructures.•Forcrossdrains,useslaborboxculvert.•Useaproninsteadofcatch-pittoavoidcloggingofculverts.•Reinforceat-riskdrainsandcrossdrainstoprotectagainstscouring.
slope:Drainage will scour road embankment and lead to downslope erosion and failure.Increased level of water table and pore pressure of side slope will lead to slope failure.
good practice:•Cutbacktheslopetoashalloweranglefollowingenvironment-friendlyroadconstruction
(EFRC) guidelines.•Bioengineerslopetoprovidevegetativereinforcementofthesurfacelayers.•Constructsloperetainingstructures.•Lowerwatertablethroughconstructionofcatchwaterdrain,Frenchdrain,andfoundation
drain as prescribed by the EFRC guidelines.climate proofing measures:•Implementasystemofgeotechnicalriskmanagement.•SetupGISunitwithcapacityforGISdatabasedevelopmentforgeologicalandlandslide
hazard mapping.•Carryoutriskassessmentofidentifiedareas.•Applystructuralandnonstructuralmitigation.•Designandconstructgabionwallswithgeotextile.•Constructpineapplewallswhereverplentyofbouldersareavailable.•Reducethevelocityofstormwatertopreventgullyingandslopefailures.•Usebioengineeringandlocalplantspeciestopreventsoilerosion.
Table 5 continued

24
Climate Proofing ADB Investment in the Transport Sector
15 Project Number 40255-033 (july 2013). Project documents available at www.adb.org/projects/documents/central-mekong-delta-region-connectivity-project-rrp
16 The Cao lanh Bridge (crossing the Tien River) is a cable-stayed bridge with spans 150+350+150 m and approach bridges with a total length of 2,015 m on both sides. The Vam Cong Bridge (crossing the hau River) is a cable-stayed bridge with spans 210+450+210m and approach bridges with a total length of 2,969 m.
Viet Nam: Central Mekong Delta Region Connectivity ProjectNumerous studies have identified Viet Nam as one of the developing countries most impacted by rising sea level (see Brecht et al. 2012; Dasgupta et al. 2011, 2009; and Nicholls and Cazenave 2010, among others). It has been estimated that a one-meter sea level rise may impact up to 10% of Viet Nam’s land. The transport sector will be among those most seriously impacted by climate change (ADB 2011a). If mean sea level rises by one meter, it is estimated that 11,000 km of roads could be submerged and that up to 695 km of national highways are at risk of inundation (Government of Viet Nam 2010). An estimated 4.3% of existing national and local roads would be permanently under water, including 574 km of dikes. Chinowsky et al. (2012) estimate total damage to the national road transport infrastructure from predicted changes in temperature, precipitation, and flooding ranging between $4 billion and $9 billion over the period 2010–2050.
Recognizing this significant vulnerability, ADB has provided support to Viet Nam to tackle climate change issues. This includes the drafting of a technical guidance note for integrating climate change in road transport infrastructure developments in Viet Nam. This guidance note introduces a systematic process, necessary steps to be followed, general information to be analyzed and considered, and tools to enable integration of climate change considerations into various stages of transport project planning and implementation (Appendix 2).
the Project15
The Central Mekong Delta Region Connectivity Project consists of two bridges16 and an interconnecting road that form part of a strategic transportation link connecting the provinces of Dong Thap, An Giang, and Can Tho to the Second Southern highway and ho Chi Minh City (Figure 3). Currently, the route crosses the Tien River and hau River by ferry, which represents a significant bottleneck, extending journey times considerably. Projected increases in traffic flows would necessitate expansion of ferry capacity (in terms of both the number of boats and of ferry landings). Relative to the no project scenario (in other words, without the project), the largest benefit accrues to ferry users by eliminating ferry waiting and crossing times.
The approach and connecting roads include 26 smaller bridges that cross canals and rivers. The openings of the bridges are designed to be adequate for standard design floods. Bridge approach roads are designed for the P1% event (flood characteristics recurring 1 in 100 years).
In consultation with the Mekong River Commission, the Government of Viet Nam has set a design constraint for bridge elevation based on providing a minimum navigation clearance of 37.5 m for the P5% event (1-in-20 year flood characteristics). This navigation clearance is set to allow future passage of 10,000 deadweight tonnage vessels upriver to Phnom Penh port.
The project is cofinanced by ADB and the governments of Australia and the Republic of Korea with an estimated total cost of $860 million in 2013.
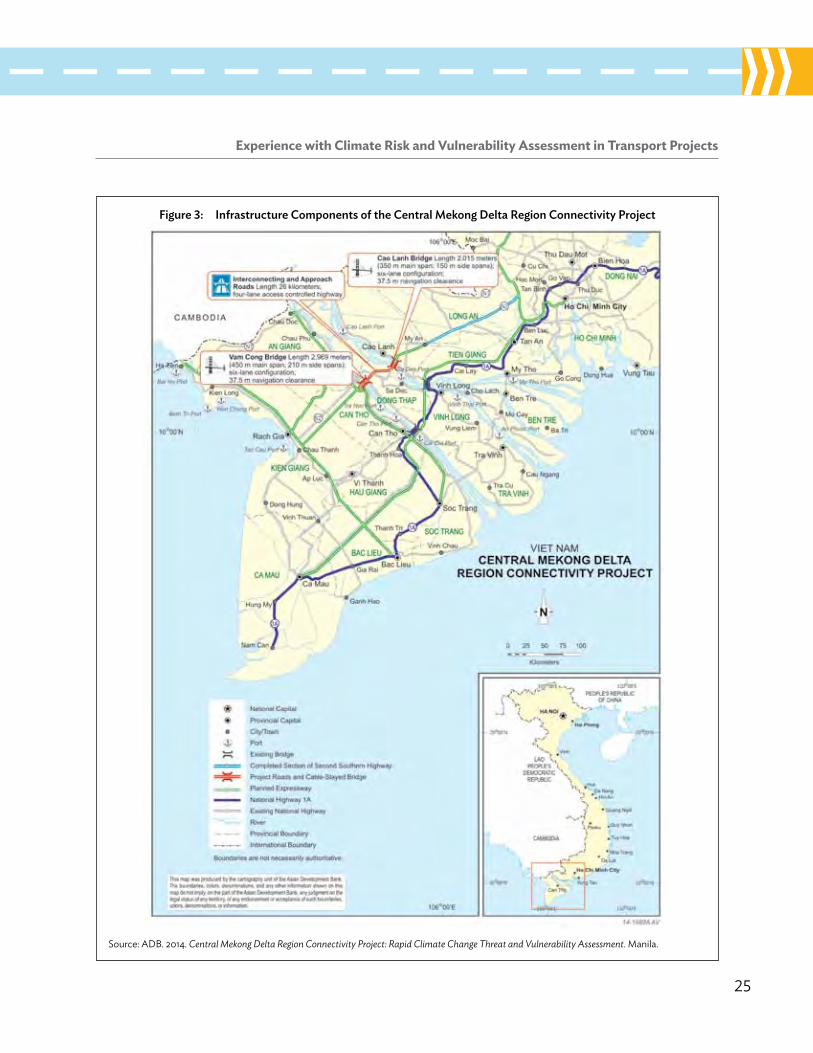
Experience with Climate Risk and Vulnerability Assessment in Transport Projects
25
Figure 3: infrastructure Components of the Central mekong delta region Connectivity Project
Source: ADB. 2014. Central Mekong Delta Region Connectivity Project: Rapid Climate Change Threat and Vulnerability Assessment. Manila.

26
Climate Proofing ADB Investment in the Transport Sector
with the projected increase in precipitation and sea level rise as well as more frequent and stronger storm surges due to climate change, project stakeholders raised concerns as to the impacts that climate change may have on the project bridges, approach roads, and interconnecting roads. while the original project feasibility study prepared by Transport Engineering Design Incorporated used sea level rise projections developed by the Institute of Meteorology, hydrology and Environment of the Ministry of Environment and Natural Resources, questions were raised as to the possible incremental combined impacts of the intensification of storm surges and changes in rainfall patterns in the Mekong River Basin.
A CRVA study was thus commissioned to provide an additional assessment of the potential risks posed by climate change to the bridges and roads as well as to navigation clearance, and to suggest adaptation options that may be incorporated into the detailed designs.
approach to Climate risk and vulnerability assessment17
The hydrometeorological threat of climate change was modeled using a statistical downscaling technique and a combination of hydrological and hydrodynamic modeling at three different scales. The CRVA approach includes (i) the selection of appropriate climate scenarios from IPCC’s Special Report on Emissions Scenarios (Appendix 3), (ii) the selection
and processing of general circulation model (GCM) data, (iii) the downscaling of GCM data to the Mekong Region, and (iv) hydrological and hydrodynamic modeling (Figure 4).
• Selecting Special Report on Emissions Scenarios (SRES) scenarios. The IPCC SRES A1B scenario was selected for use in the study because it falls within the range predicted by the official climate change scenarios of the Government of Viet Nam (A2 and B2), but is closer to the upper limit of the family of SRES scenarios.
• Selecting general circulation models. Twelve GCMs have been considered in past studies for the Mekong Basin, of which six are known to have performed well in terms of replicating historical records of the climate of the Mekong Basin region (Cai et al. 2009). These six GCMs18 have been used to provide climate change projections. outputs from the six selected GCMs provide daily future climate data for average, maximum, and minimum temperature and precipitation at the 100 weather monitoring stations found in the basin.
• Downscaling general circulation model data. GCMs were downscaled to regional and project site level resolution using statistical and dynamic downscaling techniques (Appendix 4). once downscaled, weather data was used for calibration of the model. These data records have been
17 In order to meet the demand of improving capacity for climate change integration into transport programs and projects in Viet Nam, in 2013 ADB’s Viet Nam Resident Mission in cooperation with Viet Nam’s Transport Development and Strategy Institute developed technical guidance for integrating climate change in road transport infrastructure developments in the country. The technical guidance closely follows the set of activities and steps presented earlier in Box 2.
18 These being (i) ncar_ccsm3_0 (from the National Center for Atmospheric Research—USA); (ii) micro3_2_medres (Center for Climate System Research—japan); (iii) inv_echam4 (Max-Planck-Institut für Meteorologie—Germany); (iv) giss_aom (Goddard Institute for Space Studies—USA); (v) cnrm_cm3 (Centre National de Recherches Meteorologiques—France); and (vi) cccma_cgcm3_1 (Canadian Centre for Climate Modeling and Analysis—Canada).
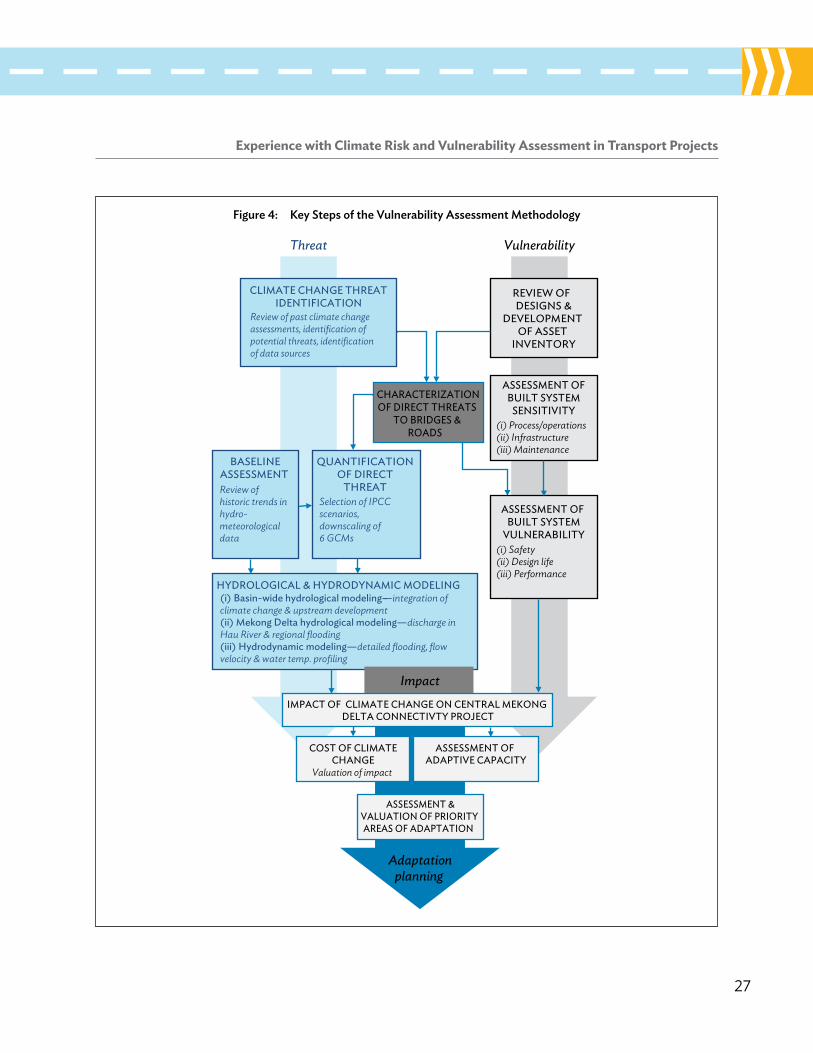
Experience with Climate Risk and Vulnerability Assessment in Transport Projects
27
Figure 4: key steps of the vulnerability assessment methodology
CLIMATE CHANGE THREATIDENTIFICATION
CHARACTERIZATIONOF DIRECT THREATS
TO BRIDGES & ROADS
REVIEW OF DESIGNS &
DEVELOPMENT OF ASSET
INVENTORY
ASSESSMENT OF BUILT SYSTEM
VULNERABILITY
QUANTIFICATION OF DIRECT
THREAT Selection of IPCCscenarios, downscaling of 6 GCMs
BASELINEASSESSMENT Review of historic trends inhydro-meteorologicaldata
HYDROLOGICAL & HYDRODYNAMIC MODELING –
Adaptationplanning
Threat Vulnerability
Impact IMPACT OF CLIMATE CHANGE ON CENTRAL MEKONG
DELTA CONNECTIVTY PROJECT
COST OF CLIMATECHANGE
Valuation of impact
ASSESSMENT OF ADAPTIVE CAPACITY
ASSESSMENT &VALUATION OF PRIORITY AREAS OF ADAPTATION
ASSESSMENT OFBUILT SYSTEM
SENSITIVITY(i) Process/operations(ii) Infrastructure(iii) Maintenance
Review of past climate changeassessments, identification of potential threats, identificationof data sources
(i) Basin-wide hydrological modeling—integration ofclimate change & upstream development(ii) Mekong Delta hydrological modeling—discharge inHau River & regional flooding(iii) Hydrodynamic modeling—detailed flooding, flow velocity & water temp. profiling
(i) Safety(ii) Design life(iii) Performance

28
Climate Proofing ADB Investment in the Transport Sector
collected from national government sources, regional institutions (such as the Mekong River Commission), and global sources including (i) the Tropical Rainfall Measuring Mission, (ii) the US National oceanic and Atmospheric Administration National Centers for Environmental Prediction, and (iii) the US National Climatic Data Center.
• Hydrological and hydrodynamic modeling. In order to estimate changes in future river flow including peak river flow and levels, the modeling strategy and approach involves a basin-wide model, a Mekong Delta model, and a project site model: (i) The basin-wide model provides boundary
values for the Mekong Delta model. The model includes erosion, sediment transport, and sediment trapping by the reservoir.
(ii) The Mekong Delta model utilizes the MIKE 11 platform developed by DhI.19 The model’s hydraulic schematization starts from Kratie, and covers the floodplain in Cambodia, including the Tonle Sap system and the whole Mekong Delta of Viet Nam. The model setup includes more than 3,900 rivers and canals and more than 5,000 hydraulic works representing irrigation and drainage sluices as well as overland flood flow to the floodplain via low-lying parts of roads. The model divides the delta into 120 zones and utilizes more than 25,900 water levels and 18,500 flow points to calculate small-area water balances.
(iii) 3D modeling is used to simulate river flow, sediment transport, and erosion. The 3D modeling takes into account both horizontal and vertical flow and suspended sediment distribution.
Climate change projections offered the following information:
• More than 80% of all simulated data indicate a clear increase in the maximum daily temperatures. year-round maximum daily temperature is projected to increase by an average of 2.3°C (1.5°C–3.0°C) by 2050. The largest increases are projected for the months of May–August, exacerbating hot weather at the start of the wet season. The greatest agreement between model results occurred for the end of the dry season and the transition season—with consistent trends from all GCMs.
• Under typical baseline conditions, maximum daily temperatures do not exceed 35°C. with climate change, by 2050, 15% to 45% of the year will see temperatures exceed 35°C, representing a 1.0°C to 4.5°C increase in the highest temperature expected in a typical year.
• At the project site, the largest increases in rainfall are expected for the wet season, including an average 8% increase in peak rainfall during october. Variability in peak october rainfall is large, ranging from –8% to +50% across the six GCMs.
• Cumulative rainfall is expected to increase from an average of 1,300 mm/y to 1,400 mm/y with all GCM simulations predicting an annual increase. During the wet season, average historic wet season rainfall varied between 600 and 1,400 mm. with climate change, wet season rainfall is expected to become 50% more variable, ranging from 600 to 1,800 mm. In addition, there is not likely to be a significant increase in the number of rainy days during the wet season, indicating the increased intensity of individual rainfall events.
19 DhI, formerly known as the Danish hydraulic Institute, provides global water consultancy services.
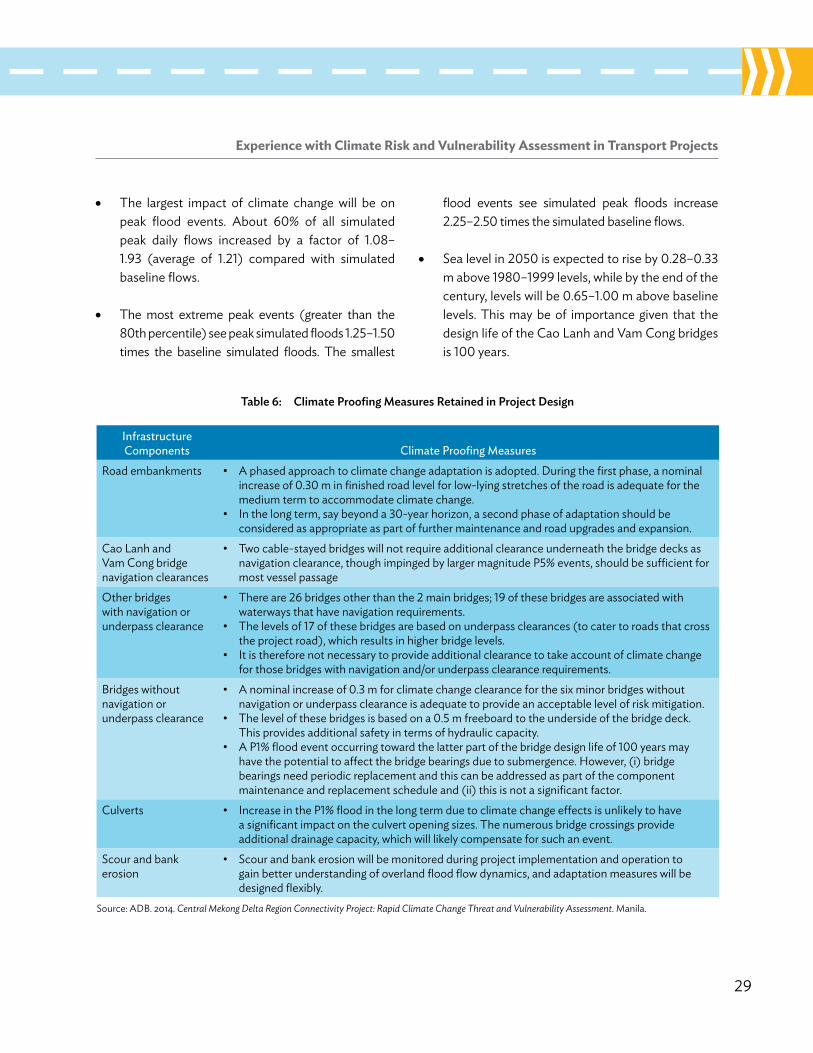
Experience with Climate Risk and Vulnerability Assessment in Transport Projects
29
• The largest impact of climate change will be on peak flood events. About 60% of all simulated peak daily flows increased by a factor of 1.08–1.93 (average of 1.21) compared with simulated baseline flows.
• The most extreme peak events (greater than the 80th percentile) see peak simulated floods 1.25–1.50 times the baseline simulated floods. The smallest
flood events see simulated peak floods increase 2.25–2.50 times the simulated baseline flows.
• Sea level in 2050 is expected to rise by 0.28–0.33 m above 1980–1999 levels, while by the end of the century, levels will be 0.65–1.00 m above baseline levels. This may be of importance given that the design life of the Cao lanh and Vam Cong bridges is 100 years.
table 6: Climate Proofing measures retained in Project design
infrastructure components climate Proofing measures
Road embankments • A phased approach to climate change adaptation is adopted. During the first phase, a nominal increase of 0.30 m in finished road level for low-lying stretches of the road is adequate for the medium term to accommodate climate change.
• In the long term, say beyond a 30-year horizon, a second phase of adaptation should be considered as appropriate as part of further maintenance and road upgrades and expansion.
Cao lanh and Vam Cong bridge navigation clearances
• Two cable-stayed bridges will not require additional clearance underneath the bridge decks as navigation clearance, though impinged by larger magnitude P5% events, should be sufficient for most vessel passage
other bridges with navigation or underpass clearance
• There are 26 bridges other than the 2 main bridges; 19 of these bridges are associated with waterways that have navigation requirements.
• The levels of 17 of these bridges are based on underpass clearances (to cater to roads that cross the project road), which results in higher bridge levels.
• It is therefore not necessary to provide additional clearance to take account of climate change for those bridges with navigation and/or underpass clearance requirements.
Bridges without navigation or underpass clearance
• A nominal increase of 0.3 m for climate change clearance for the six minor bridges without navigation or underpass clearance is adequate to provide an acceptable level of risk mitigation.
• The level of these bridges is based on a 0.5 m freeboard to the underside of the bridge deck. This provides additional safety in terms of hydraulic capacity.
• A P1% flood event occurring toward the latter part of the bridge design life of 100 years may have the potential to affect the bridge bearings due to submergence. however, (i) bridge bearings need periodic replacement and this can be addressed as part of the component maintenance and replacement schedule and (ii) this is not a significant factor.
Culverts • Increase in the P1% flood in the long term due to climate change effects is unlikely to have a significant impact on the culvert opening sizes. The numerous bridge crossings provide additional drainage capacity, which will likely compensate for such an event.
Scour and bank erosion
• Scour and bank erosion will be monitored during project implementation and operation to gain better understanding of overland flood flow dynamics, and adaptation measures will be designed flexibly.
Source: ADB. 2014. Central Mekong Delta Region Connectivity Project: Rapid Climate Change Threat and Vulnerability Assessment. Manila.
30
Climate Proofing ADB Investment in the Transport Sector
Climate Change impact assessment
The impacts of climate change were examined on all infrastructure components: bridge substructure (foundation slabs, pylons and abutments, and free-sliding bearings); bridge superstructure (bridge deck, stay cables, deck drainage, and expansion joints); and road embankments.
The impact of climate change on navigation clearance was of particular interest. The P1% floodplain water level is projected to increase by 0.6 m over a 100-year design life. Results in P1% water level variations based on downscaled modeling suggested that peak water levels in the floodplain will reach 3.5 meters above sea level (masl) and 3.1–3.6 masl at project sites. Navigation clearance should not be significantly affected by a P5% water level. Navigation clearances for the project’s cable-stayed bridges under a P5% event with climate change would be exceeded, but only for the largest 10,000 deadweight tonnage vessels for 63 days during mid-August to late November.
however, it was determined that without adaptation, the future P1% event will raise water levels some 0.1 m above the embankment freeboard, presenting a situation of risk.
Climate Proofing measures
while risks were clear, the consensus on the magnitude and scope of adaptation was only reached through continued dialogue and weighing response options and costs. Given the location, nature, scale, and investment needed, parties agreed to a phased approach allowing for incremental changes in road embankments with observed changes in flood levels and dynamics (Table 6).
Climate Proofing Costs
The incremental cost was estimated at $4.5 million (representing 0.5% of total project cost) due to (i) additional embankment volume, (ii) additional area of ground treatment due to increased width of embankment, (iii) additional length of culverts due to increased width of embankment, and (iv) additional height of abutments and piers of six bridges.
Despite the nature and scale of the project, the project length is relatively short (some 35 km) and all incremental cost comes from increasing the height of embankment, bridge piers, and abutments, which will be constructed of relatively cheaper components and materials (i.e., granular materials and extra lengths of reinforced concrete for substructure and culverts).
No attempt was made to estimate the expected benefits of such investment in terms of reduced future maintenance or repair costs.

Experience with Climate Risk and Vulnerability Assessment in Transport Projects
31
Papua New Guinea: Bridge Replacement for Improved Rural Access Project
the Project20
The 6.6 million population of Papua New Guinea (PNG) is spread over a land area of about 462,000 km2 and is connected by a network of 8,500 km of national roads and over 20,000 km of provincial and district roads.
owing to the rugged terrain and geographic and climatic conditions, PNG has a relatively large number of bridges for the size of its road network. It is estimated that there are over 700 bridges on the national road network. A large proportion of these are single-lane Bailey bridges that were used because of their low cost and faster deployment during early stages of development of the national road network. however, limited load carrying capacity, increasing traffic volume, and deterioration over time have made the Bailey bridges a safety risk and a weak link in the two-lane national road system. In view of the large number of bridges involved, a long-term program is needed to replace the Bailey and other deteriorated bridges.
This project, estimated to cost $100 million, will replace 20–30 Bailey bridges on five priority national roads with permanent two-lane bridges. The bridges are prioritized for each road following detailed selection criteria based on (i) traffic, (ii) condition, (iii) estimated residual life, (iv) availability of alternative routes, (v) safety of road users, (vi) population served, and (vii) additional works involving major realignment and river training.
Climate change is expected to have implications on the hydrologic and hydraulic properties of the bridge sites. It was deemed important for bridge design to incorporate climate change projections, particularly accounting for extreme temperatures and rainfall.
Climate Change Projections
In collaboration with the Commonwealth Scientific and Research organization of Australia, four climate scenarios (a low and a high emissions scenario for the years 2055 and 2090) were developed to capture the breadth of climate change projections relevant to the program.
The ensemble mean of projections from multiple GCMs show an increase in surface temperature ranging between 1.1°C and 1.6°C in 2055 and between 1.7°C and 2.6°C in 2090 (Table 7). Total rainfall is projected to increase by approximately 10% in 2055 and by up to 22% in 2090.
20 Project Number 43200-024 (September 2011). Project documents available at www.adb.org/projects/documents/bridge-replacement-improved-rural-access-sector-project-papua-new-guinea-rrp
table 7: Climate Change Projections in Papua new guinea
2055 Projections 2090 Projectionsclimatic variable low High low High
Surface air temperature (°C) + 1.1 + 1.6 + 1.7 + 2.6Total rainfall (%) + 10.0 + 11.0 + 9.8 + 21.9Mean sea level (cm) + 20 (10–29) +20 (10–29) +41 (22–60) +41 (22–60)
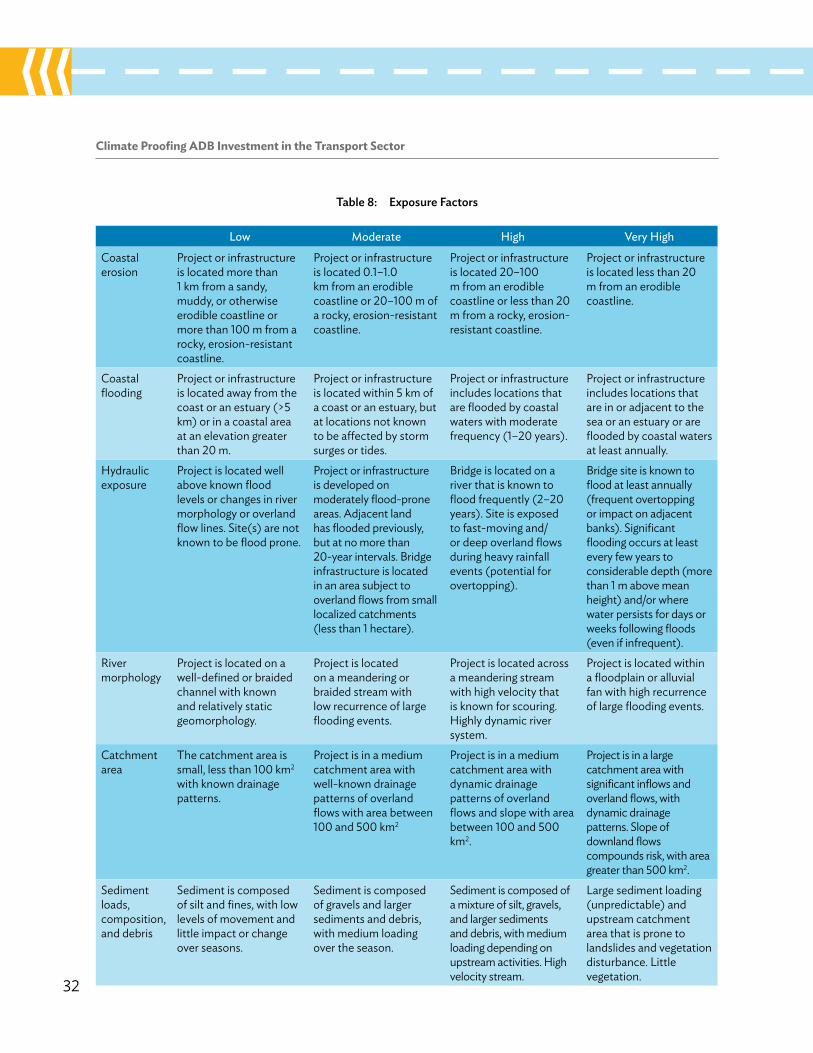
32
Climate Proofing ADB Investment in the Transport Sector
table 8: exposure Factors
low moderate High very High
Coastal erosion
Project or infrastructure is located more than 1 km from a sandy, muddy, or otherwise erodible coastline or more than 100 m from a rocky, erosion-resistant coastline.
Project or infrastructure is located 0.1–1.0 km from an erodible coastline or 20–100 m of a rocky, erosion-resistant coastline.
Project or infrastructure is located 20–100 m from an erodible coastline or less than 20 m from a rocky, erosion-resistant coastline.
Project or infrastructure is located less than 20 m from an erodible coastline.
Coastal flooding
Project or infrastructure is located away from the coast or an estuary (>5 km) or in a coastal area at an elevation greater than 20 m.
Project or infrastructure is located within 5 km of a coast or an estuary, but at locations not known to be affected by storm surges or tides.
Project or infrastructure includes locations that are flooded by coastal waters with moderate frequency (1–20 years).
Project or infrastructure includes locations that are in or adjacent to the sea or an estuary or are flooded by coastal waters at least annually.
hydraulic exposure
Project is located well above known flood levels or changes in river morphology or overland flow lines. Site(s) are not known to be flood prone.
Project or infrastructure is developed on moderately flood-prone areas. Adjacent land has flooded previously, but at no more than 20-year intervals. Bridge infrastructure is located in an area subject to overland flows from small localized catchments (less than 1 hectare).
Bridge is located on a river that is known to flood frequently (2–20 years). Site is exposed to fast-moving and/or deep overland flows during heavy rainfall events (potential for overtopping).
Bridge site is known to flood at least annually (frequent overtopping or impact on adjacent banks). Significant flooding occurs at least every few years to considerable depth (more than 1 m above mean height) and/or where water persists for days or weeks following floods (even if infrequent).
River morphology
Project is located on a well-defined or braided channel with known and relatively static geomorphology.
Project is located on a meandering or braided stream with low recurrence of large flooding events.
Project is located across a meandering stream with high velocity that is known for scouring. highly dynamic river system.
Project is located within a floodplain or alluvial fan with high recurrence of large flooding events.
Catchment area
The catchment area is small, less than 100 km2 with known drainage patterns.
Project is in a medium catchment area with well-known drainage patterns of overland flows with area between 100 and 500 km2
Project is in a medium catchment area with dynamic drainage patterns of overland flows and slope with area between 100 and 500 km2.
Project is in a large catchment area with significant inflows and overland flows, with dynamic drainage patterns. Slope of downland flows compounds risk, with area greater than 500 km2.
Sediment loads, composition, and debris
Sediment is composed of silt and fines, with low levels of movement and little impact or change over seasons.
Sediment is composed of gravels and larger sediments and debris, with medium loading over the season.
Sediment is composed of a mixture of silt, gravels, and larger sediments and debris, with medium loading depending on upstream activities. high velocity stream.
large sediment loading (unpredictable) and upstream catchment area that is prone to landslides and vegetation disturbance. little vegetation.

Experience with Climate Risk and Vulnerability Assessment in Transport Projects
33
Climate vulnerability assessment
The characteristics of the bridge included in the PNG bridge replacement program were assessed against a number of key criteria to determine their vulnerability. These were (i) operating life: the projected operating life or planning horizon for the bridge; (ii) legacy timeframe: the projected time frame beyond the operating life or planning horizon by which the bridge leaves a legacy (whether or not it has been decommissioned); (iii) socioeconomic criticality: the dependence of social and economic services and supply on the infrastructure, and how critical the route is to supply and logistics in the region; (iv) use and community dependency: the dependence of communities on the transport link, as defined by traffic use and population centers; and
(v) value and complexity of the bridge: the design of the bridge itself is an important characteristic and defines how vulnerable the infrastructure might be.
The above bridge characteristics were then combined with exposure factors (Table 8) and with sensitivity factors (Table 9) to determine the overall degree of vulnerability of the bridges included in the project.
The vulnerability of bridges assessed in the bridge replacement program is strongly related to river morphology and exposure to existing riverine and coastal flooding. Those bridges located on high-dependency highways—particularly those currently susceptible to flooding, landslides, and damage—were generally assessed to be more vulnerable.
table 9: sensitivity Factors
Factors low moderate High very High
Coastal interaction
Permanently elevated sea or river levels would not significantly interrupt operations or result in damage.
Coastal flooding interacting with the river would cause damage requiring some repairs or result in short interruption of bridge operation.
Coastal flooding interacting with the river would cause damage requiring major rebuilding or result in prolonged interruption of local operations.
Coastal flooding interacting with the river would cause damage requiring a near-complete rebuild or result in permanent cessation of local operations.
operational extent
Project is located in an area that is not subject to flooding. The bridge’s function is rarely affected.
Bridge operations could continue under flooding events or high-intensity rainfall events and would have limited impacts on use and structural integrity.
Bridge operation is impacted by flooding events and has an impact on functionality and the need for maintenance. Safety and availability for use are compromised.
Bridge operations are severely impacted by flooding or high- intensity rainfall events. Resultant damage compromises use and safety. Access is cut off and river and bridge works are required to reinstate function.
Community reliance
loss of bridge function has little impact on community use (location has multiple routes).
loss of access or bridge function has moderate impact on community use. Temporary inconvenience is caused, but functionality and ability to access the route are reinstated quickly.
loss of functionality of the bridge impacts socioeconomic factors, causing loss of income and access to services.
The community is wholly reliant on the bridge site. loss of access results in significant loss of supply, income, and access to services.
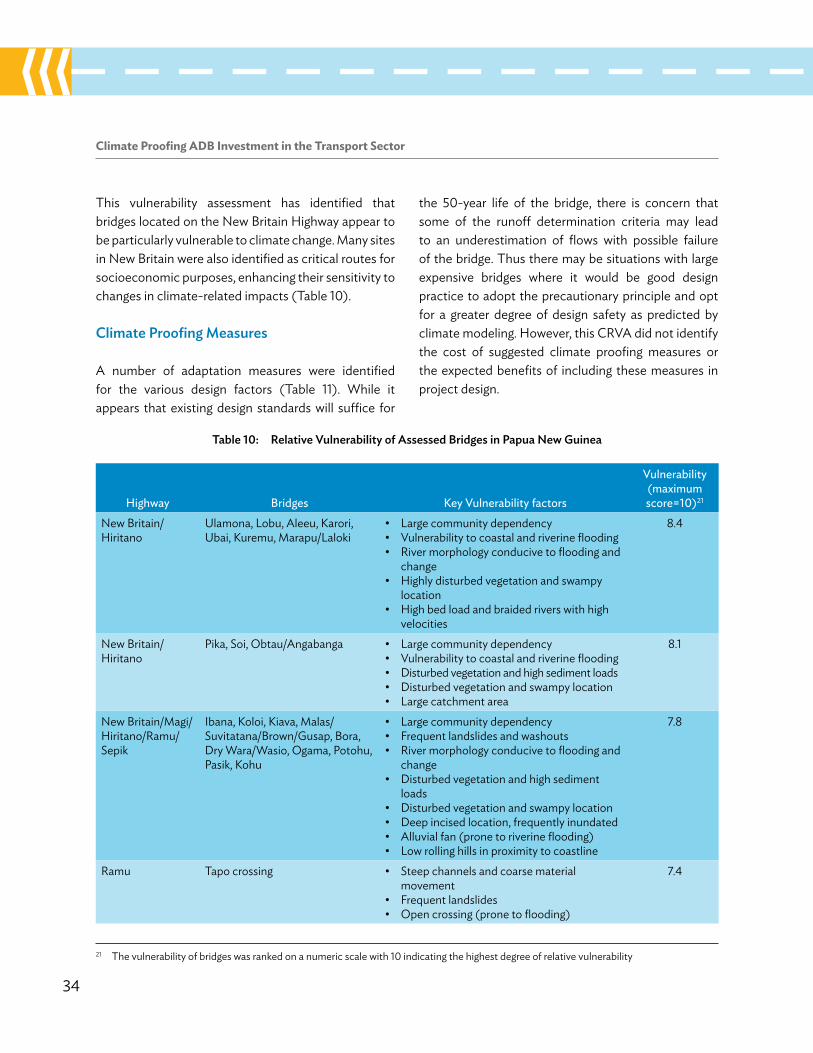
34
Climate Proofing ADB Investment in the Transport Sector
table 10: relative vulnerability of assessed bridges in Papua new guinea
Highway bridges key vulnerability factors
vulnerability (maximum score=10)21
New Britain/hiritano
Ulamona, lobu, Aleeu, Karori, Ubai, Kuremu, Marapu/laloki
• large community dependency• Vulnerability to coastal and riverine flooding• River morphology conducive to flooding and
change• highly disturbed vegetation and swampy
location• high bed load and braided rivers with high
velocities
8.4
New Britain/hiritano
Pika, Soi, obtau/Angabanga • large community dependency• Vulnerability to coastal and riverine flooding• Disturbed vegetation and high sediment loads• Disturbed vegetation and swampy location• large catchment area
8.1
New Britain/Magi/hiritano/Ramu/Sepik
Ibana, Koloi, Kiava, Malas/Suvitatana/Brown/Gusap, Bora, Dry wara/wasio, ogama, Potohu, Pasik, Kohu
• large community dependency• Frequent landslides and washouts• River morphology conducive to flooding and
change • Disturbed vegetation and high sediment
loads• Disturbed vegetation and swampy location• Deep incised location, frequently inundated• Alluvial fan (prone to riverine flooding)• low rolling hills in proximity to coastline
7.8
Ramu Tapo crossing • Steep channels and coarse material movement
• Frequent landslides• open crossing (prone to flooding)
7.4
This vulnerability assessment has identified that bridges located on the New Britain highway appear to be particularly vulnerable to climate change. Many sites in New Britain were also identified as critical routes for socioeconomic purposes, enhancing their sensitivity to changes in climate-related impacts (Table 10).
Climate Proofing measures
A number of adaptation measures were identified for the various design factors (Table 11). while it appears that existing design standards will suffice for
the 50-year life of the bridge, there is concern that some of the runoff determination criteria may lead to an underestimation of flows with possible failure of the bridge. Thus there may be situations with large expensive bridges where it would be good design practice to adopt the precautionary principle and opt for a greater degree of design safety as predicted by climate modeling. however, this CRVA did not identify the cost of suggested climate proofing measures or the expected benefits of including these measures in project design.
21 The vulnerability of bridges was ranked on a numeric scale with 10 indicating the highest degree of relative vulnerability
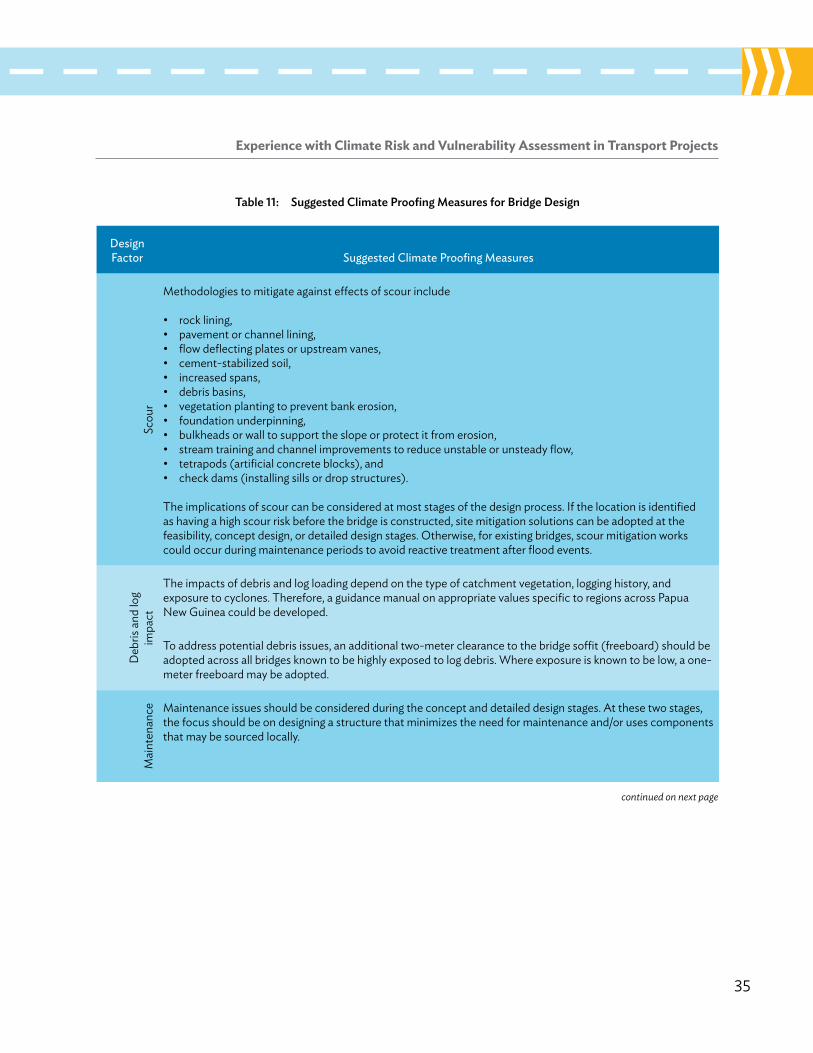
Experience with Climate Risk and Vulnerability Assessment in Transport Projects
35
table 11: suggested Climate Proofing measures for bridge design
design Factor suggested climate Proofing measures
Scou
r
Methodologies to mitigate against effects of scour include
• rock lining,• pavement or channel lining,• flow deflecting plates or upstream vanes,• cement-stabilized soil,• increased spans,• debris basins,• vegetation planting to prevent bank erosion,• foundation underpinning,• bulkheads or wall to support the slope or protect it from erosion,• stream training and channel improvements to reduce unstable or unsteady flow,• tetrapods (artificial concrete blocks), and• check dams (installing sills or drop structures).
The implications of scour can be considered at most stages of the design process. If the location is identified as having a high scour risk before the bridge is constructed, site mitigation solutions can be adopted at the feasibility, concept design, or detailed design stages. otherwise, for existing bridges, scour mitigation works could occur during maintenance periods to avoid reactive treatment after flood events.
Deb
ris a
nd lo
g im
pact
The impacts of debris and log loading depend on the type of catchment vegetation, logging history, and exposure to cyclones. Therefore, a guidance manual on appropriate values specific to regions across Papua New Guinea could be developed.
To address potential debris issues, an additional two-meter clearance to the bridge soffit (freeboard) should be adopted across all bridges known to be highly exposed to log debris. where exposure is known to be low, a one-meter freeboard may be adopted.
Mai
nten
ance Maintenance issues should be considered during the concept and detailed design stages. At these two stages,
the focus should be on designing a structure that minimizes the need for maintenance and/or uses components that may be sourced locally.
continued on next page
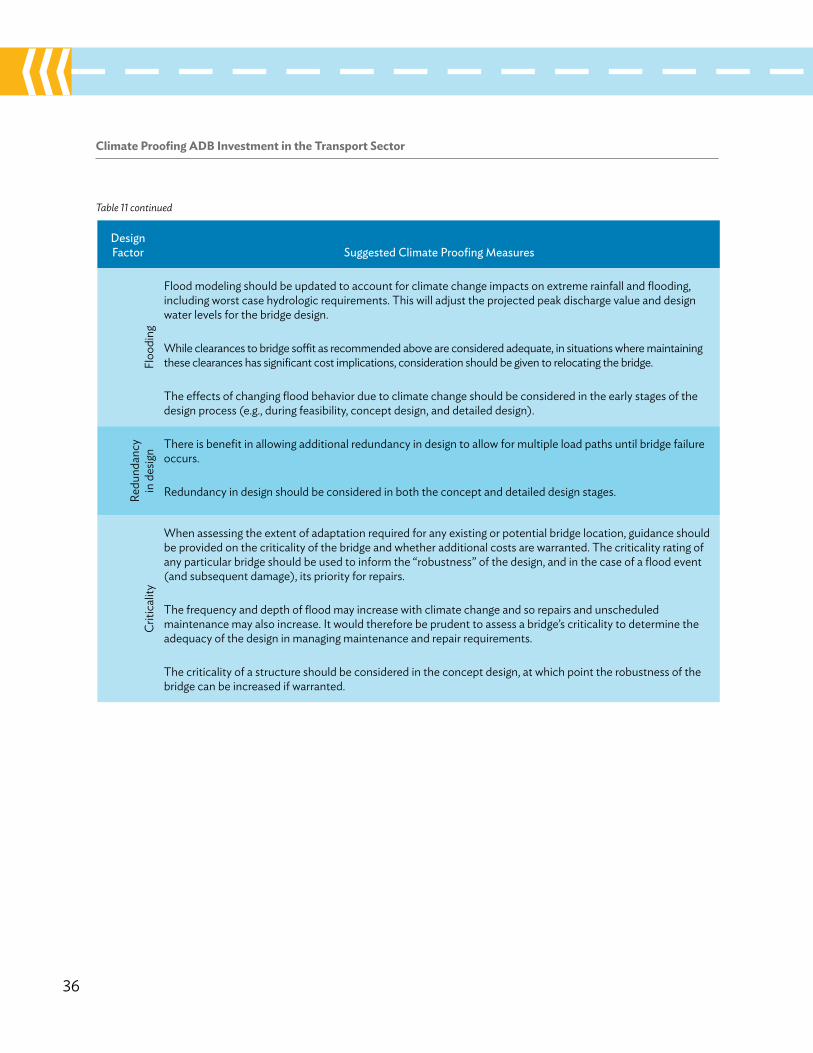
36
Climate Proofing ADB Investment in the Transport Sector
design Factor suggested climate Proofing measures
Floo
ding
Flood modeling should be updated to account for climate change impacts on extreme rainfall and flooding, including worst case hydrologic requirements. This will adjust the projected peak discharge value and design water levels for the bridge design.
while clearances to bridge soffit as recommended above are considered adequate, in situations where maintaining these clearances has significant cost implications, consideration should be given to relocating the bridge.
The effects of changing flood behavior due to climate change should be considered in the early stages of the design process (e.g., during feasibility, concept design, and detailed design).
Redu
ndan
cy
in d
esig
n There is benefit in allowing additional redundancy in design to allow for multiple load paths until bridge failure occurs.
Redundancy in design should be considered in both the concept and detailed design stages.
Criti
calit
y
when assessing the extent of adaptation required for any existing or potential bridge location, guidance should be provided on the criticality of the bridge and whether additional costs are warranted. The criticality rating of any particular bridge should be used to inform the “robustness” of the design, and in the case of a flood event (and subsequent damage), its priority for repairs.
The frequency and depth of flood may increase with climate change and so repairs and unscheduled maintenance may also increase. It would therefore be prudent to assess a bridge’s criticality to determine the adequacy of the design in managing maintenance and repair requirements.
The criticality of a structure should be considered in the concept design, at which point the robustness of the bridge can be increased if warranted.
Table 11 continued
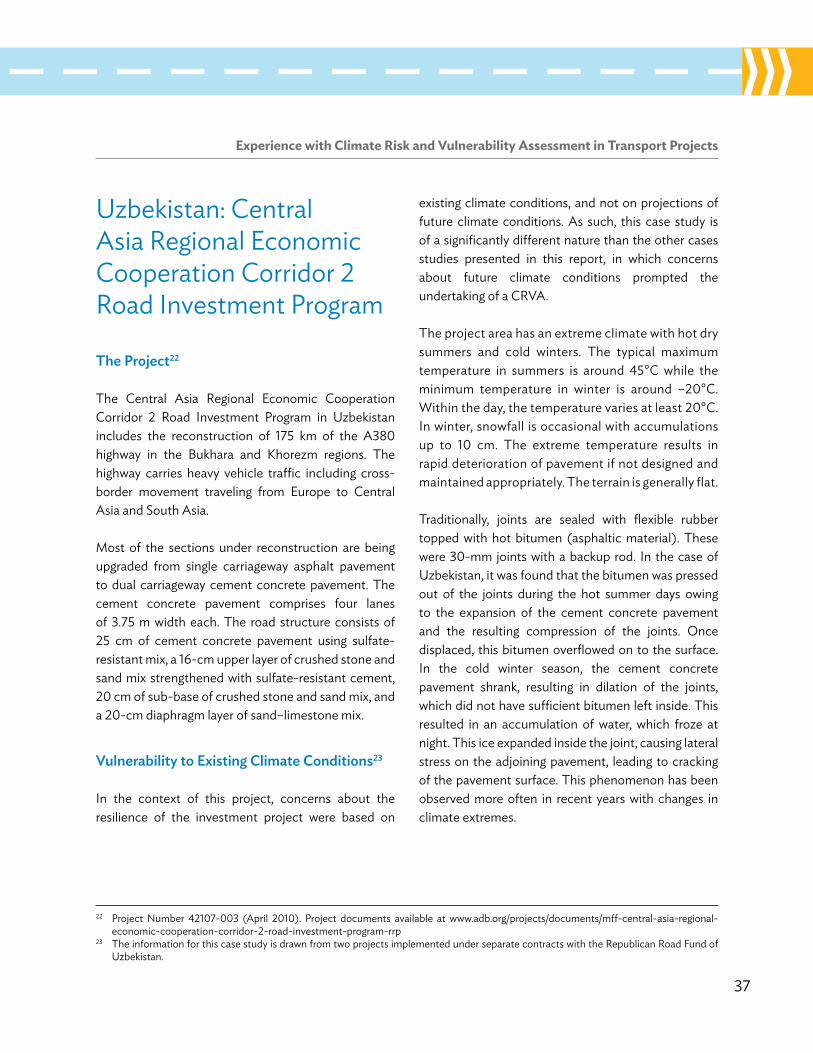
Experience with Climate Risk and Vulnerability Assessment in Transport Projects
37
Uzbekistan: Central Asia Regional Economic Cooperation Corridor 2 Road Investment Program
the Project22
The Central Asia Regional Economic Cooperation Corridor 2 Road Investment Program in Uzbekistan includes the reconstruction of 175 km of the A380 highway in the Bukhara and Khorezm regions. The highway carries heavy vehicle traffic including cross-border movement traveling from Europe to Central Asia and South Asia.
Most of the sections under reconstruction are being upgraded from single carriageway asphalt pavement to dual carriageway cement concrete pavement. The cement concrete pavement comprises four lanes of 3.75 m width each. The road structure consists of 25 cm of cement concrete pavement using sulfate-resistant mix, a 16-cm upper layer of crushed stone and sand mix strengthened with sulfate-resistant cement, 20 cm of sub-base of crushed stone and sand mix, and a 20-cm diaphragm layer of sand–limestone mix.
vulnerability to existing Climate Conditions23
In the context of this project, concerns about the resilience of the investment project were based on
existing climate conditions, and not on projections of future climate conditions. As such, this case study is of a significantly different nature than the other cases studies presented in this report, in which concerns about future climate conditions prompted the undertaking of a CRVA.
The project area has an extreme climate with hot dry summers and cold winters. The typical maximum temperature in summers is around 45°C while the minimum temperature in winter is around –20°C. within the day, the temperature varies at least 20°C. In winter, snowfall is occasional with accumulations up to 10 cm. The extreme temperature results in rapid deterioration of pavement if not designed and maintained appropriately. The terrain is generally flat.
Traditionally, joints are sealed with flexible rubber topped with hot bitumen (asphaltic material). These were 30-mm joints with a backup rod. In the case of Uzbekistan, it was found that the bitumen was pressed out of the joints during the hot summer days owing to the expansion of the cement concrete pavement and the resulting compression of the joints. once displaced, this bitumen overflowed on to the surface. In the cold winter season, the cement concrete pavement shrank, resulting in dilation of the joints, which did not have sufficient bitumen left inside. This resulted in an accumulation of water, which froze at night. This ice expanded inside the joint, causing lateral stress on the adjoining pavement, leading to cracking of the pavement surface. This phenomenon has been observed more often in recent years with changes in climate extremes.
22 Project Number 42107-003 (April 2010). Project documents available at www.adb.org/projects/documents/mff-central-asia-regional-economic-cooperation-corridor-2-road-investment-program-rrp
23 The information for this case study is drawn from two projects implemented under separate contracts with the Republican Road Fund of Uzbekistan.

38
Climate Proofing ADB Investment in the Transport Sector
addressing existing weather extremes
Economically efficient techniques to improve the resilience of the pavement are limited. however, an area where innovation has continued is in the sealing of contraction joints in the concrete pavement with improved economic and technical efficiency. There are basically two types of joints: transverse contraction joints, which are used to prevent cracking of the concrete pavement due to shrinkage in cold weather conditions, and longitudinal joints, which run parallel to the axis of the road and are necessary for pavements wider than 4.5 m to reduce surface cracks.
To improve the resilience of the joints, the project adopted plastic joint profiles made of ethylene-propylene-diene monomer rubber (EPDM). These needed a joint width of only 14 mm. EPDM rubber is not a new technology and has been extensively used for sealing water and natural gas pipes. It has been included in the road standards of several countries.
The synthetic rubber can sustain high temperature conditions and is resistant to ozone and ultraviolet light (Figure 5).
The EPDM rubber sealing was tested for hardness (ISo 48), tensile strength (ISo 37), compressive deformation (ISo 815), and thermal aging. For thermal aging, samples were tested for 72 hours at –10°C and at +70°C. In addition, the sealing material was tested for ozone resistance, in accordance with ISo 1431-1, for ozone concentration of 50+/– 5 parts per million at 40 +/– 2°C. The EPDM rubber sealant was tested for resilience power at both low and high temperatures following ASTM 2628-91, and for overstretch protection. In all cases, the sealant was found to comply with the international standards.
The use of EPDM rubber sealing was estimated to have saved $65,000 over a 50-km stretch of cement concrete pavement, as compared with using the traditional bitumen sealant.
Figure 5: structure of joint sealant using ePdm rubber
Profile of an 8mm Joint cross-section
<14 mm>
<25
mm
>
ELASTIC JOINT PROFILE
SHAMFER 3mm
8FIRS
T CU
T
SECO
ND
CU
T25
60–7
0
3
CRACK WIDTH UP TO 1 mm
EPDM = ethylene-propylene-diene monomer rubber.Source: Test Report P3709-A of Kiwa Polymer Institut, Quellenstrabe (Germany).
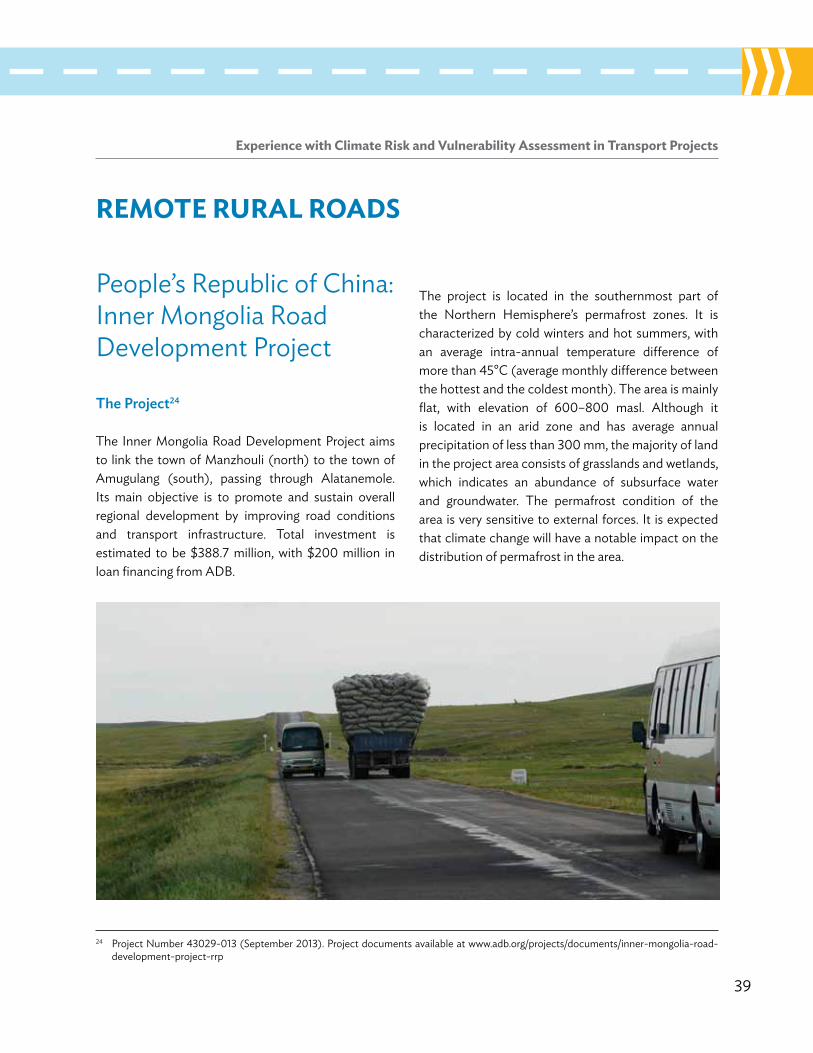
Experience with Climate Risk and Vulnerability Assessment in Transport Projects
39
REMoTE RuRAl RoADS
The project is located in the southernmost part of the Northern hemisphere’s permafrost zones. It is characterized by cold winters and hot summers, with an average intra-annual temperature difference of more than 45°C (average monthly difference between the hottest and the coldest month). The area is mainly flat, with elevation of 600–800 masl. Although it is located in an arid zone and has average annual precipitation of less than 300 mm, the majority of land in the project area consists of grasslands and wetlands, which indicates an abundance of subsurface water and groundwater. The permafrost condition of the area is very sensitive to external forces. It is expected that climate change will have a notable impact on the distribution of permafrost in the area.
24 Project Number 43029-013 (September 2013). Project documents available at www.adb.org/projects/documents/inner-mongolia-road-development-project-rrp
People’s Republic of China: Inner Mongolia Road Development Project
the Project24
The Inner Mongolia Road Development Project aims to link the town of Manzhouli (north) to the town of Amugulang (south), passing through Alatanemole. Its main objective is to promote and sustain overall regional development by improving road conditions and transport infrastructure. Total investment is estimated to be $388.7 million, with $200 million in loan financing from ADB.
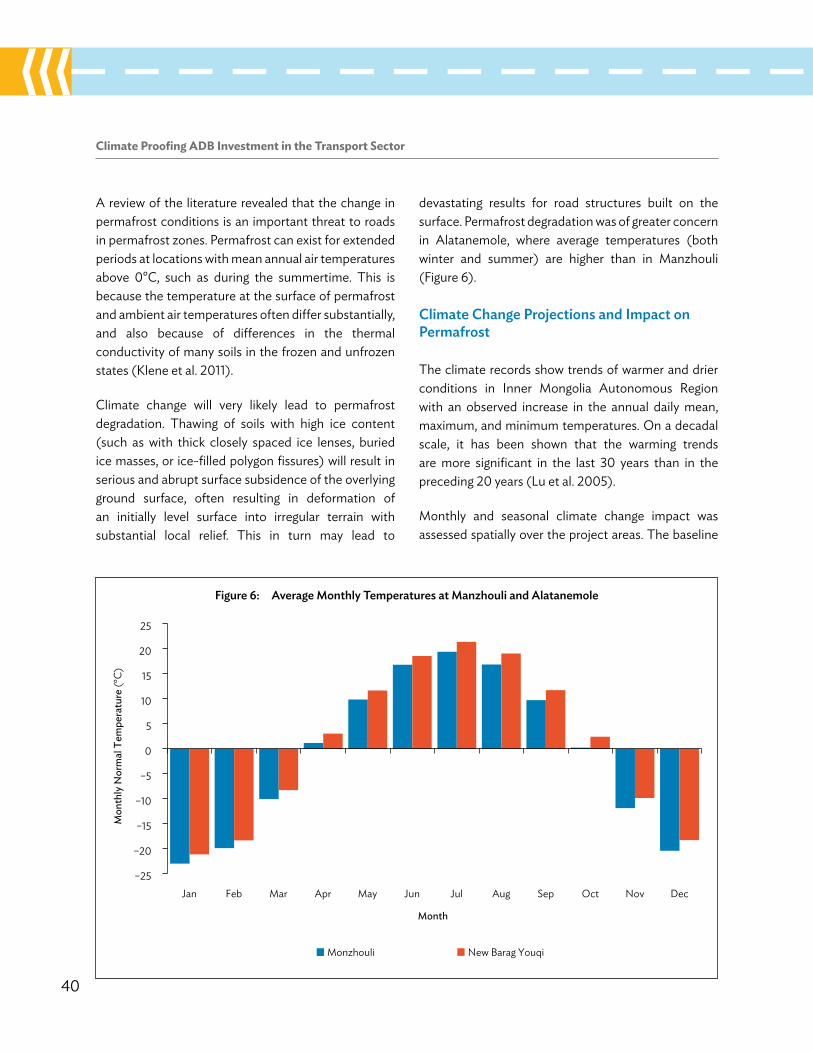
40
Climate Proofing ADB Investment in the Transport Sector
A review of the literature revealed that the change in permafrost conditions is an important threat to roads in permafrost zones. Permafrost can exist for extended periods at locations with mean annual air temperatures above 0°C, such as during the summertime. This is because the temperature at the surface of permafrost and ambient air temperatures often differ substantially, and also because of differences in the thermal conductivity of many soils in the frozen and unfrozen states (Klene et al. 2011).
Climate change will very likely lead to permafrost degradation. Thawing of soils with high ice content (such as with thick closely spaced ice lenses, buried ice masses, or ice-filled polygon fissures) will result in serious and abrupt surface subsidence of the overlying ground surface, often resulting in deformation of an initially level surface into irregular terrain with substantial local relief. This in turn may lead to
Figure 6: average monthly temperatures at manzhouli and alatanemole
–25
–20
–15
–10
–5
0
5
10
15
20
25
Jan Feb Mar Apr May Jun Jul Aug Sep Oct Nov Dec
Mon
thly
Nor
mal
Tem
pera
ture
(°C)
Month
Monzhouli New Barag Youqi
devastating results for road structures built on the surface. Permafrost degradation was of greater concern in Alatanemole, where average temperatures (both winter and summer) are higher than in Manzhouli (Figure 6).
Climate Change Projections and impact on Permafrost
The climate records show trends of warmer and drier conditions in Inner Mongolia Autonomous Region with an observed increase in the annual daily mean, maximum, and minimum temperatures. on a decadal scale, it has been shown that the warming trends are more significant in the last 30 years than in the preceding 20 years (lu et al. 2005).
Monthly and seasonal climate change impact was assessed spatially over the project areas. The baseline
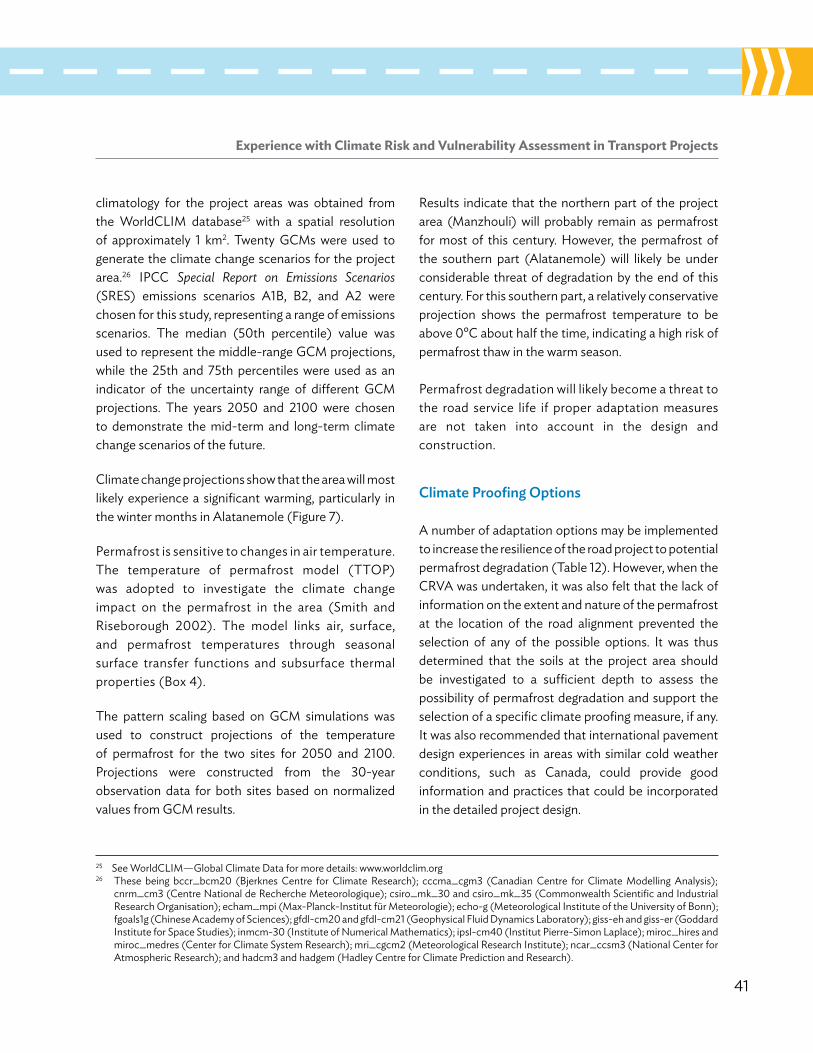
Experience with Climate Risk and Vulnerability Assessment in Transport Projects
41
25 See worldClIM—Global Climate Data for more details: www.worldclim.org26 These being bccr_bcm20 (Bjerknes Centre for Climate Research); cccma_cgm3 (Canadian Centre for Climate Modelling Analysis);
cnrm_cm3 (Centre National de Recherche Meteorologique); csiro_mk_30 and csiro_mk_35 (Commonwealth Scientific and Industrial Research organisation); echam_mpi (Max-Planck-Institut für Meteorologie); echo-g (Meteorological Institute of the University of Bonn); fgoals1g (Chinese Academy of Sciences); gfdl-cm20 and gfdl-cm21 (Geophysical Fluid Dynamics laboratory); giss-eh and giss-er (Goddard Institute for Space Studies); inmcm-30 (Institute of Numerical Mathematics); ipsl-cm40 (Institut Pierre-Simon laplace); miroc_hires and miroc_medres (Center for Climate System Research); mri_cgcm2 (Meteorological Research Institute); ncar_ccsm3 (National Center for Atmospheric Research); and hadcm3 and hadgem (hadley Centre for Climate Prediction and Research).
climatology for the project areas was obtained from the worldClIM database25 with a spatial resolution of approximately 1 km2. Twenty GCMs were used to generate the climate change scenarios for the project area.26 IPCC Special Report on Emissions Scenarios (SRES) emissions scenarios A1B, B2, and A2 were chosen for this study, representing a range of emissions scenarios. The median (50th percentile) value was used to represent the middle-range GCM projections, while the 25th and 75th percentiles were used as an indicator of the uncertainty range of different GCM projections. The years 2050 and 2100 were chosen to demonstrate the mid-term and long-term climate change scenarios of the future.
Climate change projections show that the area will most likely experience a significant warming, particularly in the winter months in Alatanemole (Figure 7).
Permafrost is sensitive to changes in air temperature. The temperature of permafrost model (TToP) was adopted to investigate the climate change impact on the permafrost in the area (Smith and Riseborough 2002). The model links air, surface, and permafrost temperatures through seasonal surface transfer functions and subsurface thermal properties (Box 4).
The pattern scaling based on GCM simulations was used to construct projections of the temperature of permafrost for the two sites for 2050 and 2100. Projections were constructed from the 30-year observation data for both sites based on normalized values from GCM results.
Results indicate that the northern part of the project area (Manzhouli) will probably remain as permafrost for most of this century. however, the permafrost of the southern part (Alatanemole) will likely be under considerable threat of degradation by the end of this century. For this southern part, a relatively conservative projection shows the permafrost temperature to be above 0ºC about half the time, indicating a high risk of permafrost thaw in the warm season.
Permafrost degradation will likely become a threat to the road service life if proper adaptation measures are not taken into account in the design and construction.
Climate Proofing options
A number of adaptation options may be implemented to increase the resilience of the road project to potential permafrost degradation (Table 12). however, when the CRVA was undertaken, it was also felt that the lack of information on the extent and nature of the permafrost at the location of the road alignment prevented the selection of any of the possible options. It was thus determined that the soils at the project area should be investigated to a sufficient depth to assess the possibility of permafrost degradation and support the selection of a specific climate proofing measure, if any. It was also recommended that international pavement design experiences in areas with similar cold weather conditions, such as Canada, could provide good information and practices that could be incorporated in the detailed project design.
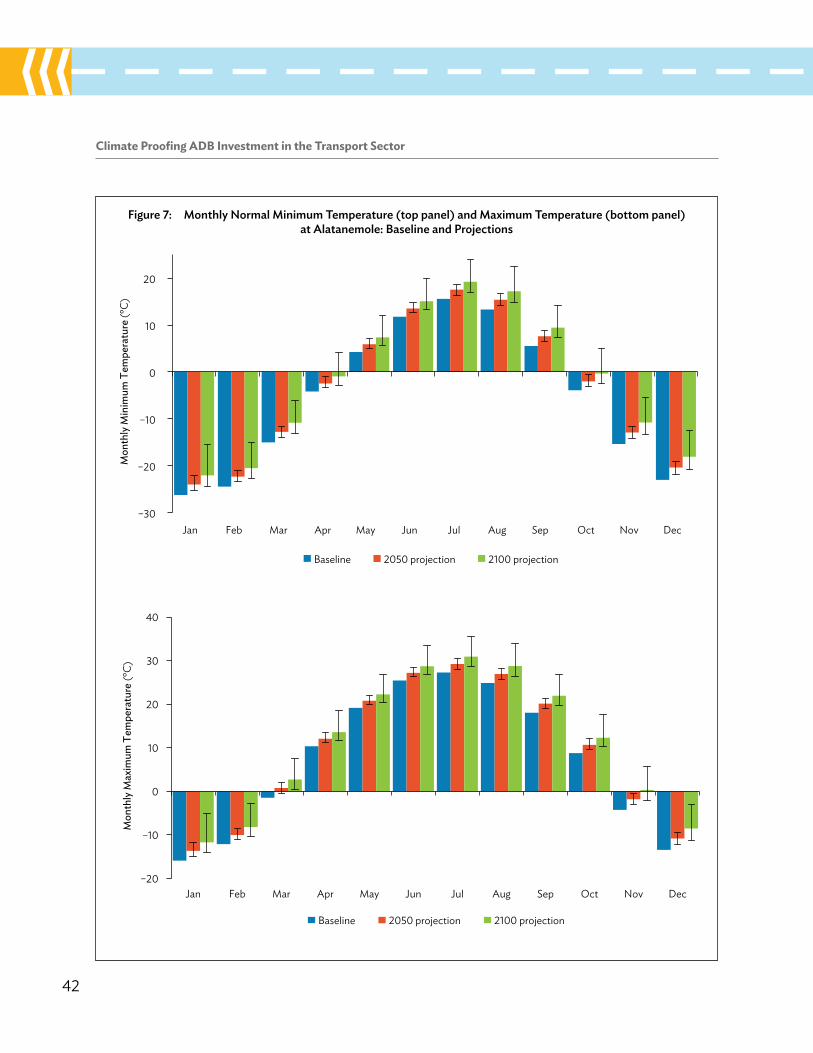
42
Climate Proofing ADB Investment in the Transport Sector
Figure 7: monthly normal minimum temperature (top panel) and maximum temperature (bottom panel) at alatanemole: baseline and Projections
–30
–20
–10
0
10
20
Jan Feb Mar Apr May Jun Jul Aug Sep Oct Nov Dec
Mon
thly
Min
imum
Tem
pera
ture
(ºC
)
Baseline 2050 projection 2100 projection
Baseline 2050 projection 2100 projection
–20
–10
0
10
20
30
40
Jan Feb Mar Apr May Jun Jul Aug Sep Oct Nov Dec
Mon
thly
Max
imum
Tem
pera
ture
(ºC)
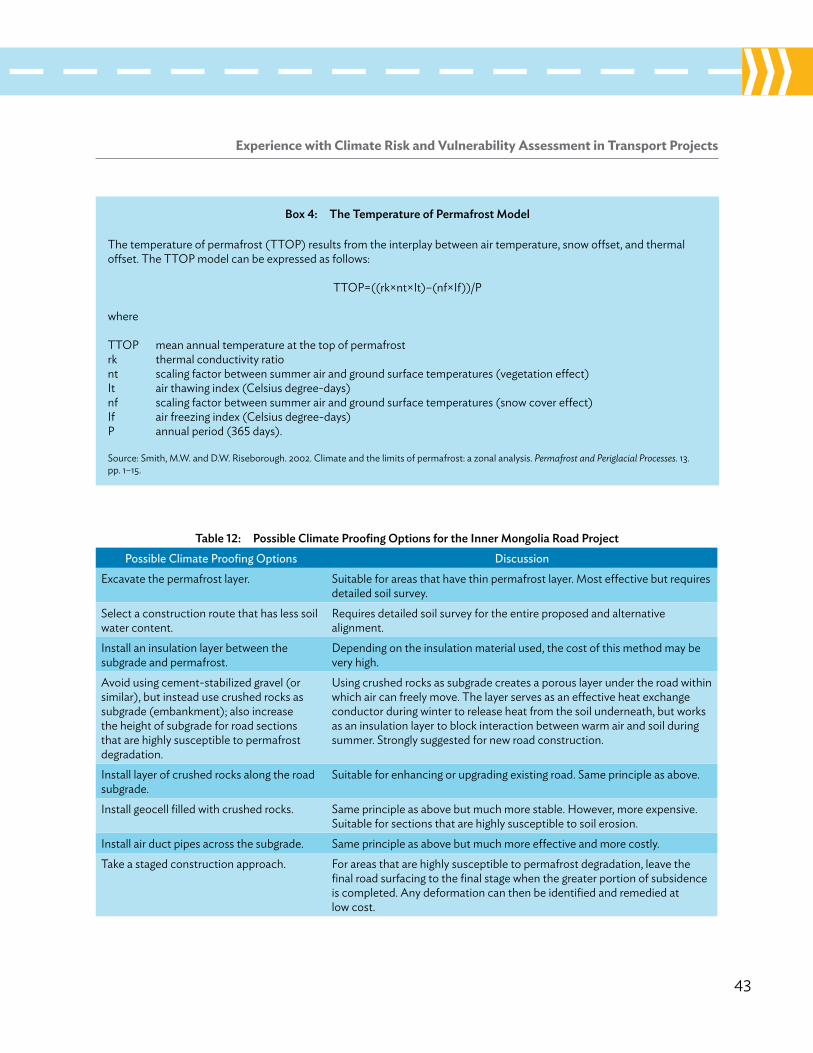
Experience with Climate Risk and Vulnerability Assessment in Transport Projects
43
box 4: the temperature of Permafrost model
The temperature of permafrost (TToP) results from the interplay between air temperature, snow offset, and thermal offset. The TToP model can be expressed as follows:
TToP=((rk×nt×It)–(nf×If))/P
where
TToP mean annual temperature at the top of permafrostrk thermal conductivity rationt scaling factor between summer air and ground surface temperatures (vegetation effect)It air thawing index (Celsius degree-days)nf scaling factor between summer air and ground surface temperatures (snow cover effect)If air freezing index (Celsius degree-days)P annual period (365 days).
Source: Smith, M.w. and D.w. Riseborough. 2002. Climate and the limits of permafrost: a zonal analysis. Permafrost and Periglacial Processes. 13. pp. 1–15.
table 12: Possible Climate Proofing options for the inner mongolia road ProjectPossible climate Proofing options discussion
Excavate the permafrost layer. Suitable for areas that have thin permafrost layer. Most effective but requires detailed soil survey.
Select a construction route that has less soil water content.
Requires detailed soil survey for the entire proposed and alternative alignment.
Install an insulation layer between the subgrade and permafrost.
Depending on the insulation material used, the cost of this method may be very high.
Avoid using cement-stabilized gravel (or similar), but instead use crushed rocks as subgrade (embankment); also increase the height of subgrade for road sections that are highly susceptible to permafrost degradation.
Using crushed rocks as subgrade creates a porous layer under the road within which air can freely move. The layer serves as an effective heat exchange conductor during winter to release heat from the soil underneath, but works as an insulation layer to block interaction between warm air and soil during summer. Strongly suggested for new road construction.
Install layer of crushed rocks along the road subgrade.
Suitable for enhancing or upgrading existing road. Same principle as above.
Install geocell filled with crushed rocks. Same principle as above but much more stable. however, more expensive. Suitable for sections that are highly susceptible to soil erosion.
Install air duct pipes across the subgrade. Same principle as above but much more effective and more costly.Take a staged construction approach. For areas that are highly susceptible to permafrost degradation, leave the
final road surfacing to the final stage when the greater portion of subsidence is completed. Any deformation can then be identified and remedied at low cost.
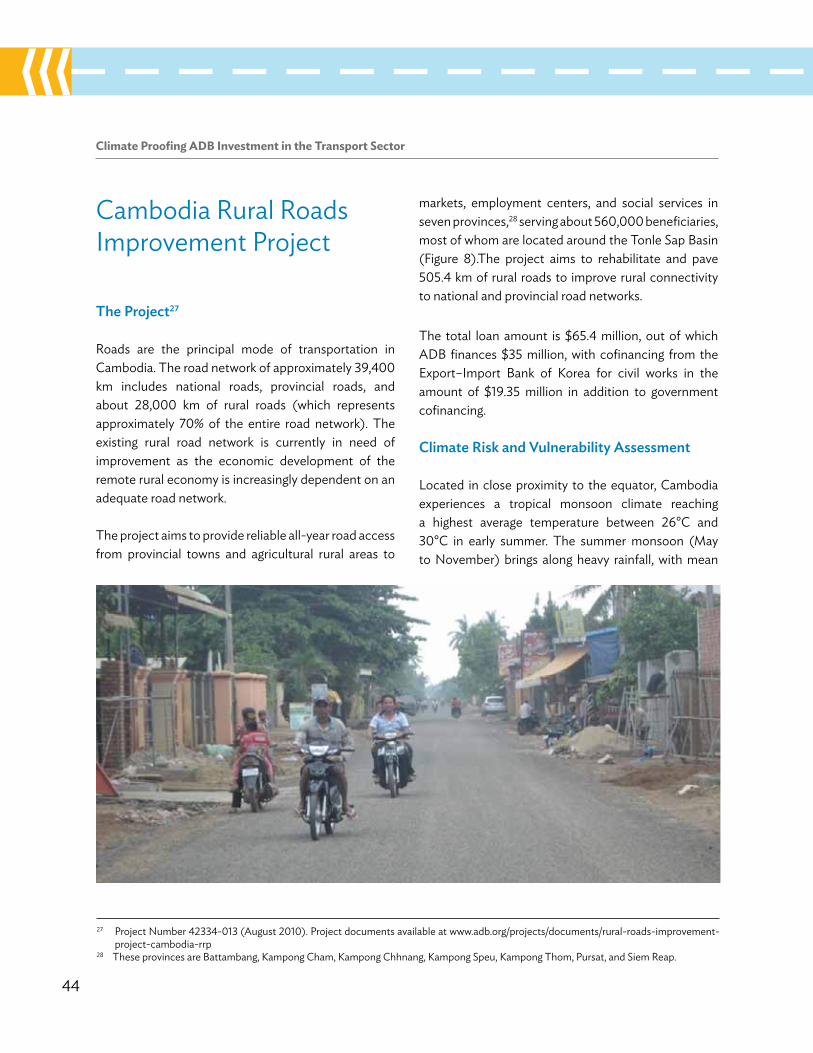
44
Climate Proofing ADB Investment in the Transport Sector
Cambodia Rural Roads Improvement Project
the Project27
Roads are the principal mode of transportation in Cambodia. The road network of approximately 39,400 km includes national roads, provincial roads, and about 28,000 km of rural roads (which represents approximately 70% of the entire road network). The existing rural road network is currently in need of improvement as the economic development of the remote rural economy is increasingly dependent on an adequate road network.
The project aims to provide reliable all-year road access from provincial towns and agricultural rural areas to
markets, employment centers, and social services in seven provinces,28 serving about 560,000 beneficiaries, most of whom are located around the Tonle Sap Basin (Figure 8).The project aims to rehabilitate and pave 505.4 km of rural roads to improve rural connectivity to national and provincial road networks.
The total loan amount is $65.4 million, out of which ADB finances $35 million, with cofinancing from the Export–Import Bank of Korea for civil works in the amount of $19.35 million in addition to government cofinancing.
Climate risk and vulnerability assessment
located in close proximity to the equator, Cambodia experiences a tropical monsoon climate reaching a highest average temperature between 26°C and 30°C in early summer. The summer monsoon (May to November) brings along heavy rainfall, with mean
27 Project Number 42334-013 (August 2010). Project documents available at www.adb.org/projects/documents/rural-roads-improvement-project-cambodia-rrp
28 These provinces are Battambang, Kampong Cham, Kampong Chhnang, Kampong Speu, Kampong Thom, Pursat, and Siem Reap.
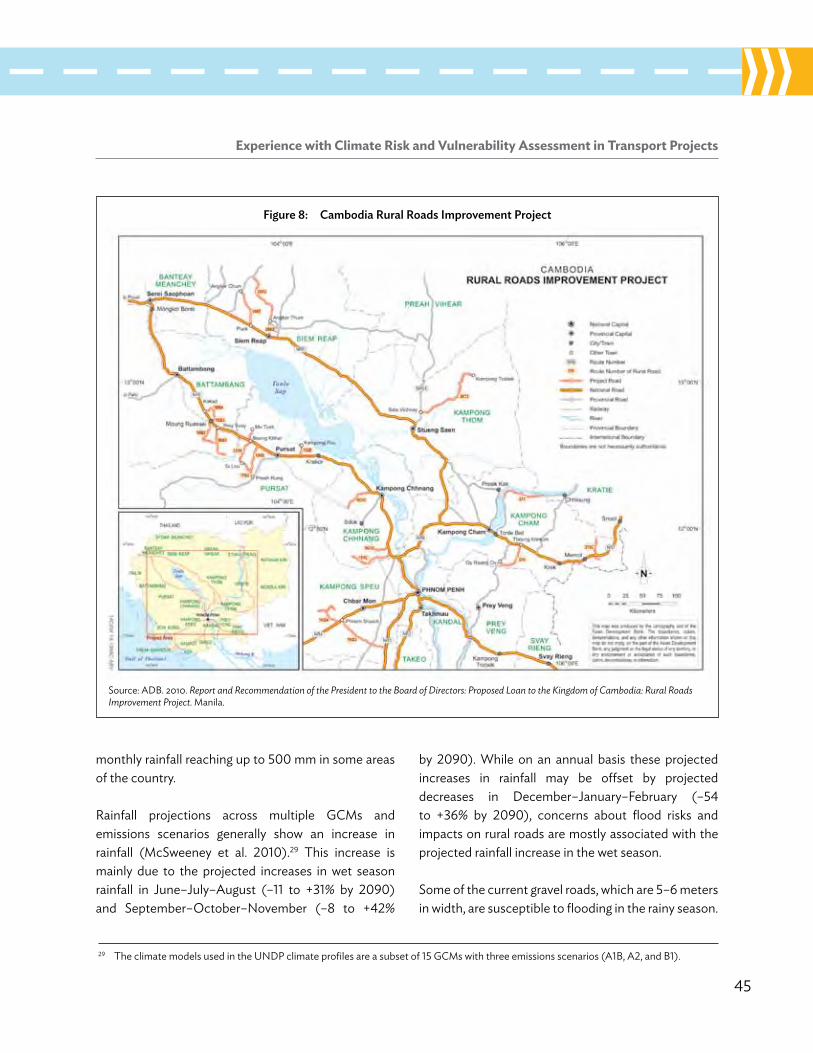
Experience with Climate Risk and Vulnerability Assessment in Transport Projects
45
Figure 8: Cambodia rural roads improvement Project
Source: ADB. 2010. Report and Recommendation of the President to the Board of Directors: Proposed Loan to the Kingdom of Cambodia: Rural Roads Improvement Project. Manila.
monthly rainfall reaching up to 500 mm in some areas of the country.
Rainfall projections across multiple GCMs and emissions scenarios generally show an increase in rainfall (McSweeney et al. 2010).29 This increase is mainly due to the projected increases in wet season rainfall in june–july–August (–11 to +31% by 2090) and September–october–November (–8 to +42%
by 2090). while on an annual basis these projected increases in rainfall may be offset by projected decreases in December–january–February (–54 to +36% by 2090), concerns about flood risks and impacts on rural roads are mostly associated with the projected rainfall increase in the wet season.
Some of the current gravel roads, which are 5–6 meters in width, are susceptible to flooding in the rainy season.
29 The climate models used in the UNDP climate profiles are a subset of 15 GCMs with three emissions scenarios (A1B, A2, and B1).
46
Climate Proofing ADB Investment in the Transport Sector
Additionally, given the natural disasters that Cambodia has faced in recent years, particularly the frequent flooding during the wet season, it is essential to address climate change considerations.
A rapid climate change assessment of adaptation needs was undertaken during the fact-finding mission in october 2009, including a field visit to an affected portion of the project area. Existing climate change projections supported by field observations highlight two major concerns related to current and future climate changes.
Specifically, there appears to be an overall increase in average total annual rainfall, and this increase is poorly distributed over seasons, resulting in increased floods during the rainy season as well as increased drought incidence during the dry season. The effects of drought are significant, especially for unpaved roads as dust levels increase and reduce visibility and create poor local air quality. Flooding and soil moisture content is a primary concern for protecting investments in roadworks and will be addressed as a priority in the adaptation strategy.
A second fact-finding mission, in March 2010, included visits to all of the proposed road sections. on this mission, three potential priority road areas were identified based on observations of their apparent vulnerability and historical damage from climate and hydrological events:
(i) Khampong Thom: Existing damage to the roads, including washouts, is primarily due to flooding from typhoon Ketsana in September 2009, though they were in poor condition prior to the typhoon. During the dry season, dust from road traffic on unpaved rural roads is observed and could worsen if warming continues and droughts deepen, which current projections seem to suggest. Under the project, this road segment will be paved to reduce dust in dry months. however,
this could increase runoff to surrounding areas during rainy seasons. Measures to manage this increased runoff, especially with increased peak rainfall events and storms, will be part of the adaptation measures. This implies building additional risk assumptions into the engineering design, which carries an important cost and has been incorporated into project design.
(ii) Khampong Speu: Segments of the road appear to be eroded, possibly from flash flooding. Unlike other parts of the project road, there is no irrigation and only wet season rice farming and livestock. Vegetative covers are extremely low and slash-and-burn agriculture appears to be practiced. high levels of environmental degradation make this area particularly exposed to the effects of climate change.
(iii) Pursat: Embankment erosion is evident and a small river may be eroding sections of the road in some segments. This may in part be due to improper timing of floodwater release by an upstream dam that is sending large volumes of water downstream. The level of the road is very low, and it may flood during rainy season. Current drainage capacity is poor, though a new irrigation project is underway that should assist in better managing water resources. Increased coordination with the Ministry of water on the timing of water releases is important.
Climate Proofing measures: an ecosystem-based approach
The proposed adaptation strategy therefore includes a combination of engineering, nonengineering, and planning activities to manage the changes observed and predicted in the project area.
The engineering changes have been mainstreamed in the project design itself for Khampong Thom in view of mainstreaming adaptation into core development
Experience with Climate Risk and Vulnerability Assessment in Transport Projects
47
planning activities. These changes include elevation of the road in areas where major flooding is becoming increasingly common and changing the selection of subgrade materials to withstand higher moisture content.
In addition to engineering options, nonengineering adaptation activities fall under two categories. A first type of adaptation activity aims to improve the Ministry of Rural Development’s planning capacity for rural road infrastructure development to accommodate climate change. A second type of activity aims to increase the resilience of road infrastructure to climate change.
Activities in the first category include the following:
• Prepare climate change vulnerability maps for rural roads to improve planning for climate changes, including potential climate change downscaling.
• Identify potential adaptation options and prioritize them, using, for example, an economic analysis of climate proofing measures, including engineering and nonengineering adjustments, to support the decision-making process.
• Review the sustainability and capacity of current engineering designs, standards, and guidelines to withstand climate change.
• Develop and implement training and curricula for the Ministry of Rural Development and at the university level for engineering students.
• Support the ministry in establishing a climate change adaptation office with adequate staffing and capacity.
Activities in the second category include the following:
• Design and implement ecosystem-based adaptation strategies focusing on environmental or
green planning for project roads to improve flood and drought management (i.e., increasing ground cover and infiltration of floods and water retention during droughts, which has the added co-benefit of improving rural livelihoods by improving the soil structure for agriculture). Climate-change-resilient trees will be planted along embankments of all project roads with selected grass and biomaterials. This will be a labor-intensive program supporting female-based employment for gender mainstreaming in the project provinces. The activity should happen after the roads have been paved, thus not obstructing roadwork during the rainy season.
• Develop and test a pilot local early warning system and a pilot program for emergency management planning for rural roads. In short, this will provide a fully equipped emergency management center (including a backup mobile unit), with early warning systems installed in key locations, and emergency management systems in place, such as appropriate communication systems, emergency and rescue equipment and vehicles, and trained personnel to manage the center (e.g., response teams and medical teams).
Cost of Climate Proofing measures
The cost to support the design and implementation of the second category of adaptation options was estimated to be $5.4 million funded through the Nordic Development Fund (Box 5). The cost of climate proofing represents 8.3% of total project cost. The expected benefits of this incremental investment were not explicitly quantified in monetary terms.

48
Climate Proofing ADB Investment in the Transport Sector
box 5: outline of Personnel inputs and Cost estimate of nonengineering Climate Proofing measures
outline of Personnel inputs of consulting services
consultant Team Person-monthsinternational
Team leader / Adaptation specialist 20Climate change economist 2
Climate change modeler 6Climate change impacts and hydrology specialist 4
Emergency management specialist 6Road engineer 10
nationalDeputy team leader / Adaptation specialist 33
Climate change economist 4Climate change modeler 8
Climate change impacts and hydrology specialist 6Emergency management specialist 8
Road engineer 24Vulnerability and environment specialist 8
Geographic information system specialist 3Source: ADB. 2010. Report and Recommendation of the President to the Board of Directors: Proposed Loan to the Kingdom of Cambodia: Rural Roads Improvement Project. Manila.
cost estimate
cost ($)1. Consultants
Remuneration and per diemInternational consultants 960,000National consultants 188,000
International and local travel 160,000Report and communications 100,000
2. EquipmentEmergency management center 1,000,000Computers, copiers, printers, GPS, software, etc. 112,000office furniture 100,000Field vehicles (5) for operations 300,000
3. Green planning 1,400,0004. Training, seminars, and conferences 200,0005. Surveys 200,0006. Various administration and support costs 80,0007. Contingencies 600,000
Total 5,400,000Source: ADB. 2010. Report and Recommendation of the President to the Board of Directors: Proposed Loan to the Kingdom of Cambodia: Rural Roads Improvement Project. Manila.
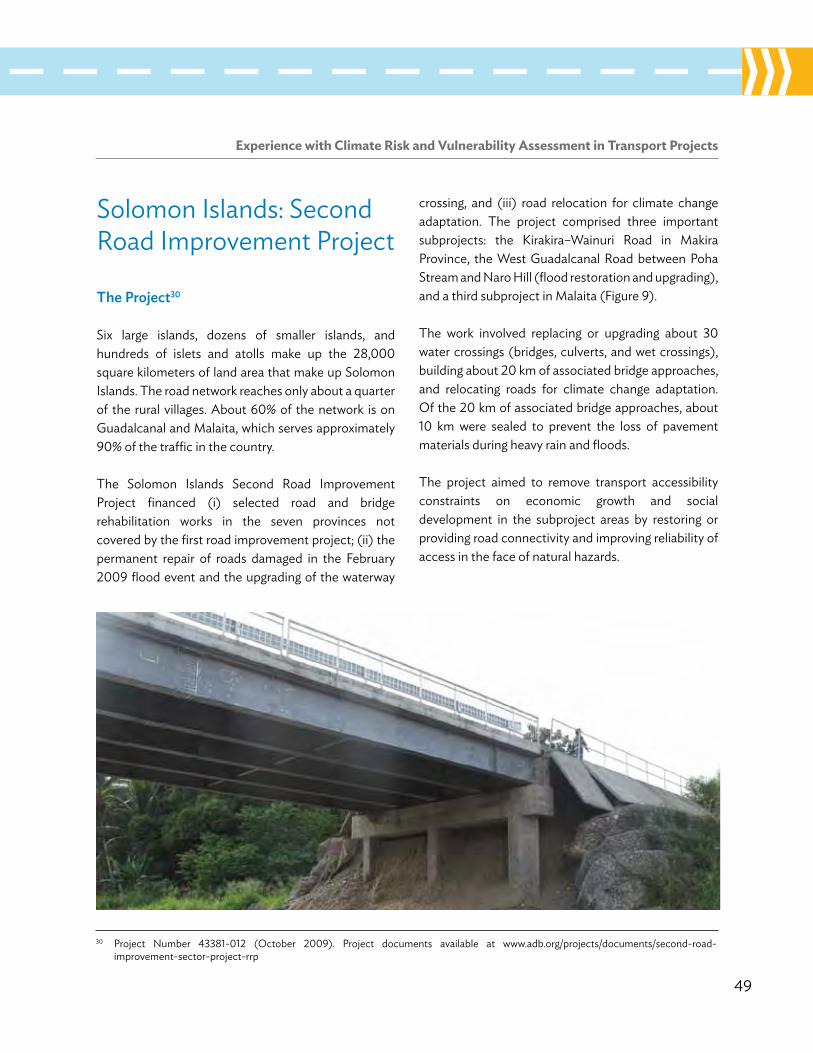
Experience with Climate Risk and Vulnerability Assessment in Transport Projects
49
Solomon Islands: Second Road Improvement Project
the Project30
Six large islands, dozens of smaller islands, and hundreds of islets and atolls make up the 28,000 square kilometers of land area that make up Solomon Islands. The road network reaches only about a quarter of the rural villages. About 60% of the network is on Guadalcanal and Malaita, which serves approximately 90% of the traffic in the country.
The Solomon Islands Second Road Improvement Project financed (i) selected road and bridge rehabilitation works in the seven provinces not covered by the first road improvement project; (ii) the permanent repair of roads damaged in the February 2009 flood event and the upgrading of the waterway
crossing, and (iii) road relocation for climate change adaptation. The project comprised three important subprojects: the Kirakira–wainuri Road in Makira Province, the west Guadalcanal Road between Poha Stream and Naro hill (flood restoration and upgrading), and a third subproject in Malaita (Figure 9).
The work involved replacing or upgrading about 30 water crossings (bridges, culverts, and wet crossings), building about 20 km of associated bridge approaches, and relocating roads for climate change adaptation. of the 20 km of associated bridge approaches, about 10 km were sealed to prevent the loss of pavement materials during heavy rain and floods.
The project aimed to remove transport accessibility constraints on economic growth and social development in the subproject areas by restoring or providing road connectivity and improving reliability of access in the face of natural hazards.
30 Project Number 43381-012 (october 2009). Project documents available at www.adb.org/projects/documents/second-road-improvement-sector-project-rrp
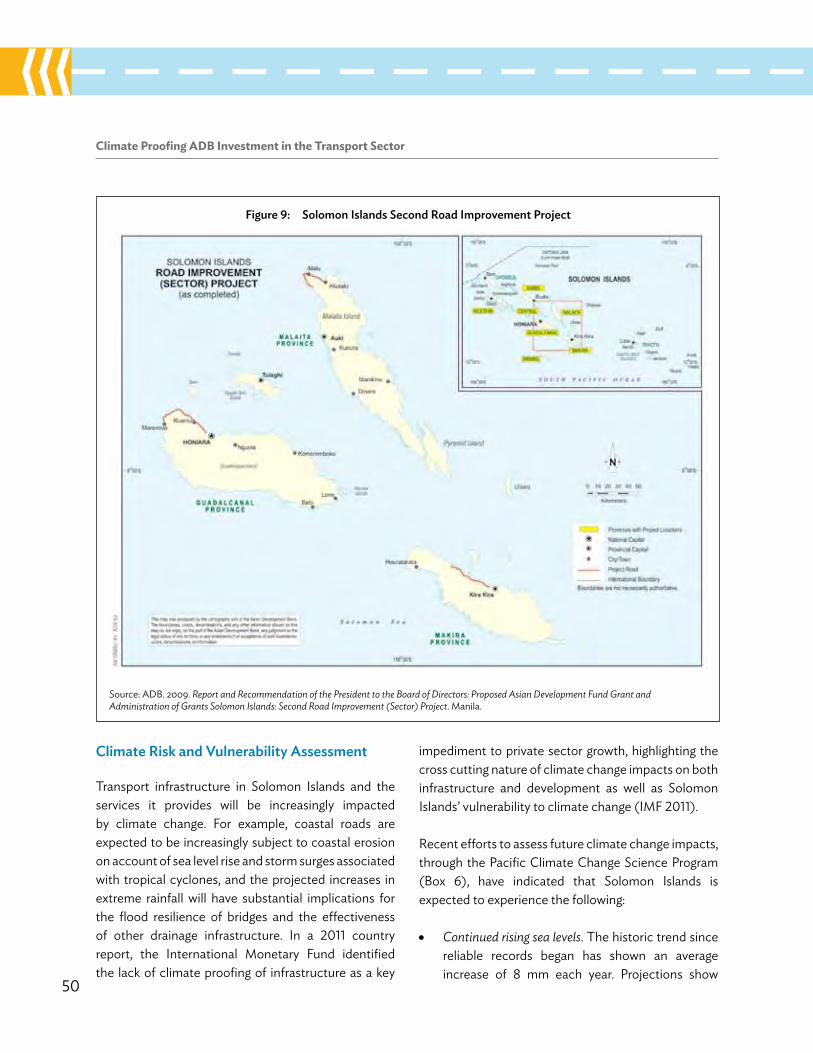
50
Climate Proofing ADB Investment in the Transport Sector
Figure 9: solomon islands second road improvement Project
Source: ADB. 2009. Report and Recommendation of the President to the Board of Directors: Proposed Asian Development Fund Grant and Administration of Grants Solomon Islands: Second Road Improvement (Sector) Project. Manila.
Climate risk and vulnerability assessment
Transport infrastructure in Solomon Islands and the services it provides will be increasingly impacted by climate change. For example, coastal roads are expected to be increasingly subject to coastal erosion on account of sea level rise and storm surges associated with tropical cyclones, and the projected increases in extreme rainfall will have substantial implications for the flood resilience of bridges and the effectiveness of other drainage infrastructure. In a 2011 country report, the International Monetary Fund identified the lack of climate proofing of infrastructure as a key
impediment to private sector growth, highlighting the cross cutting nature of climate change impacts on both infrastructure and development as well as Solomon Islands’ vulnerability to climate change (IMF 2011).
Recent efforts to assess future climate change impacts, through the Pacific Climate Change Science Program (Box 6), have indicated that Solomon Islands is expected to experience the following:
• Continued rising sea levels. The historic trend since reliable records began has shown an average increase of 8 mm each year. Projections show
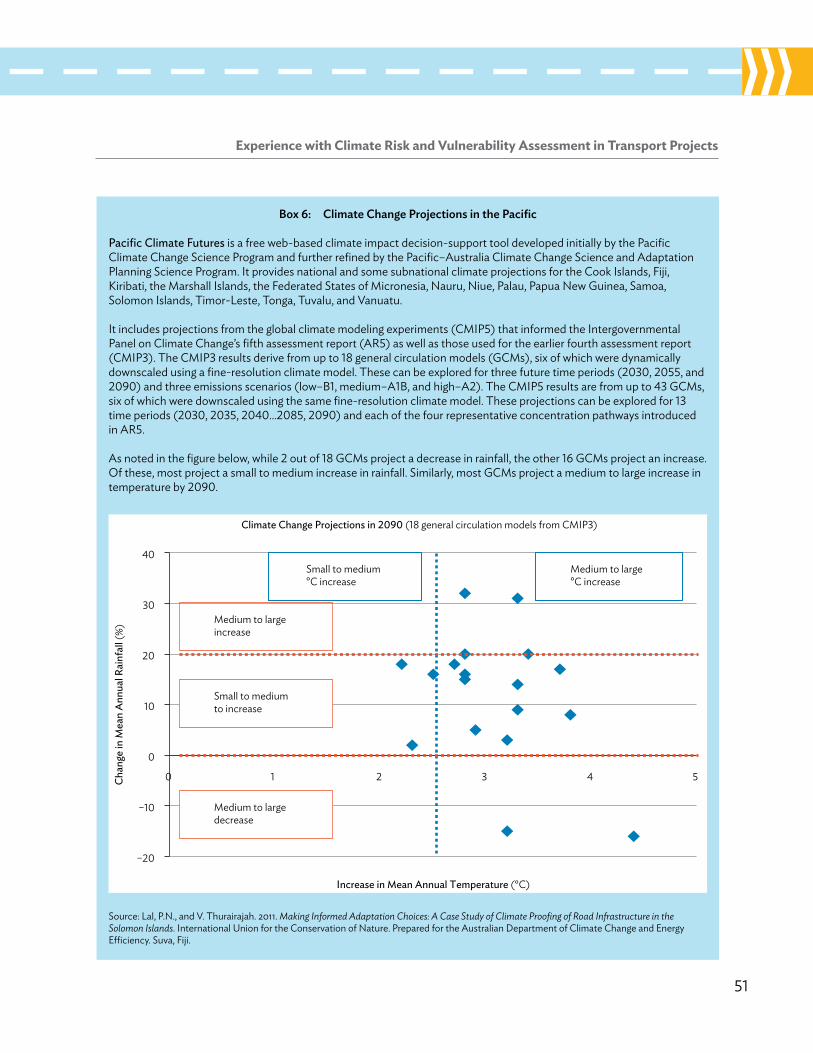
Experience with Climate Risk and Vulnerability Assessment in Transport Projects
51
box 6: Climate Change Projections in the Pacific
Pacific climate Futures is a free web-based climate impact decision-support tool developed initially by the Pacific Climate Change Science Program and further refined by the Pacific–Australia Climate Change Science and Adaptation Planning Science Program. It provides national and some subnational climate projections for the Cook Islands, Fiji, Kiribati, the Marshall Islands, the Federated States of Micronesia, Nauru, Niue, Palau, Papua New Guinea, Samoa, Solomon Islands, Timor-leste, Tonga, Tuvalu, and Vanuatu.
It includes projections from the global climate modeling experiments (CMIP5) that informed the Intergovernmental Panel on Climate Change’s fifth assessment report (AR5) as well as those used for the earlier fourth assessment report (CMIP3). The CMIP3 results derive from up to 18 general circulation models (GCMs), six of which were dynamically downscaled using a fine-resolution climate model. These can be explored for three future time periods (2030, 2055, and 2090) and three emissions scenarios (low–B1, medium–A1B, and high–A2). The CMIP5 results are from up to 43 GCMs, six of which were downscaled using the same fine-resolution climate model. These projections can be explored for 13 time periods (2030, 2035, 2040...2085, 2090) and each of the four representative concentration pathways introduced in AR5.
As noted in the figure below, while 2 out of 18 GCMs project a decrease in rainfall, the other 16 GCMs project an increase. of these, most project a small to medium increase in rainfall. Similarly, most GCMs project a medium to large increase in temperature by 2090.
Source: lal, P.N., and V. Thurairajah. 2011. Making Informed Adaptation Choices: A Case Study of Climate Proofing of Road Infrastructure in the Solomon Islands. International Union for the Conservation of Nature. Prepared for the Australian Department of Climate Change and Energy Efficiency. Suva, Fiji.
–20
–10
0
10
20
30
40
0 1 2 3 4 5Chan
ge in
Mea
n A
nnua
l Rai
nfal
l (%
)
Increase in Mean Annual Temperature (°C)
Climate Change Projections in 2090 (18 general circulation models from CMIP3)
Small to medium°C increase
Medium to large°C increase
Medium to largeincrease
Small to mediumto increase
Medium to largedecrease

52
Climate Proofing ADB Investment in the Transport Sector
an increase in sea level of up to 60 cm by 2090. Under these conditions, much of the country’s coastal infrastructure is projected to be at serious risk of inundation, flooding, and erosion. Impacts on roads include flooding from overtopping of rivers over river crossings, permanent subsurface flooding of roads from saltwater intrusion into groundwater, higher erosion rates of construction materials subject to higher salinity, and increased siltation of riverbeds, in addition to the impacts that road construction can have, which include decreasing the physical resilience of slope sides, riverbeds, and coastal zones. Sediment can also suffocate corals and mangroves, which provide natural protection of the coastline against storms.
• An increase in average annual rainfall and in frequency and intensity of heavy rainfall events. The 1-in-20 year rainfall event is expected to increase by 45 mm by 2090. The return period for the current 1-in-20 year rainfall event will reduce to a 1-in-5 year frequency.
• Changing frequency and severity of cyclones. A possible decrease in the total number of cyclones, but an increase in the number of the most severe cyclones (categories 4 and 5).
Climate Proofing measures
The Government of Solomon Islands, in partnership with the Government of Australia’s Pacific-Australia Climate Change Science and Adaptation Planning Program, developed a guidance manual for the systematic incorporation of climate change considerations in transport sector infrastructure development.
The step-by-step guide developed is a risk-based approach consistent with the international standard for risk management. one of the key components of the risk management approach is a standard five-by-five risk matrix used to assign levels of risk to different scenarios (Figure 10).
The approach uses a multistage process for every project being developed, with increasing levels of detail and investigation depending on the potential risks identified. In simple terms, projects with limited potential for risks from climate change would require limited investigation, whereas projects with the potential to be adversely impacted as a result of climate change would require more detailed consideration (Figure 11).
A number of climate proofing measures were considered for each subproject. In particular, the project will have these climate change adaptation features: (i) watercourse crossings designed to accept higher flood and river debris loads; (ii) bridge abutments anchored to piled foundations to minimize the collapse of abutments and approach roads; (iii) river training works to minimize the deviation of watercourses from their original path; (iv) strengthened protection for approach roads, with additional protection measures and river training works; (v) where a raised water table makes the road more flood prone, a raised road surface and side slopes designed to prevent erosion through gradient and protection; and (vi) rerouting of coastal sections of road exposed to wave action and king-tide inundation away from the immediate foreshore.
Total project cost is estimated to be $24 million.
economics of Climate Proofing
The economic analysis of the project considered three scenarios:
• Scenario 1. Climate change is not considered in project formulation.
• Scenario 2. Climate change is considered in project formulation, but no climate proofing measure is included.
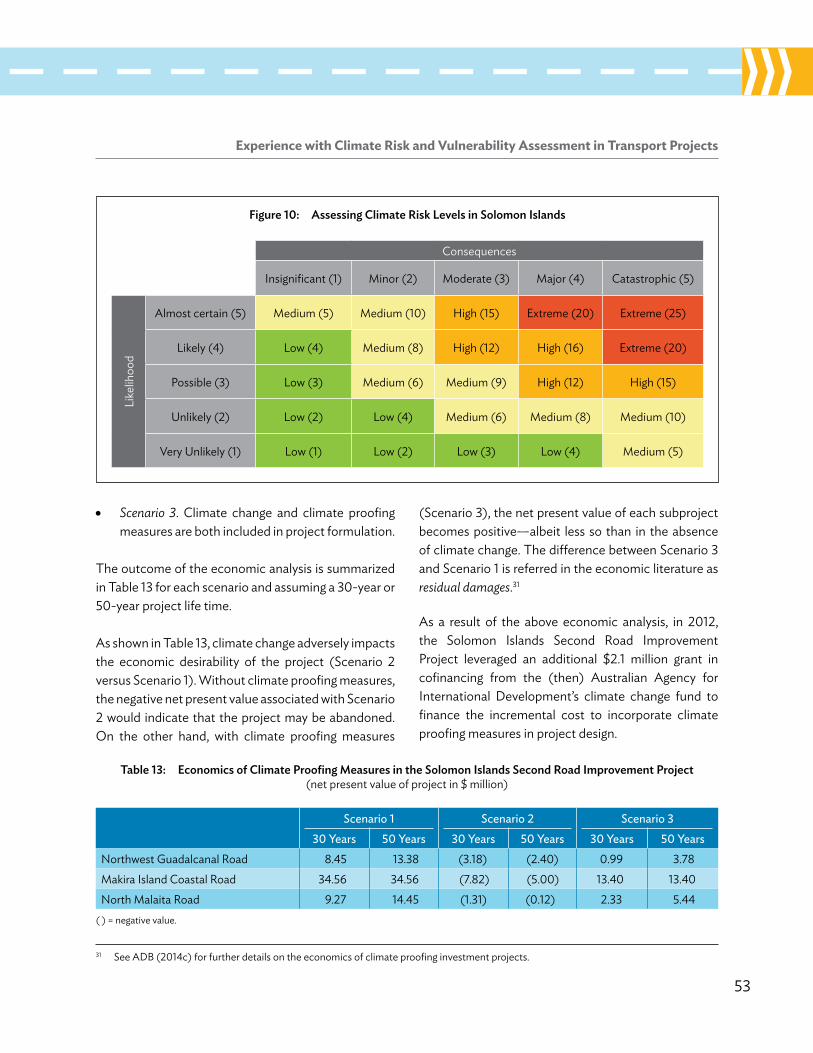
Experience with Climate Risk and Vulnerability Assessment in Transport Projects
53
Figure 10: assessing Climate risk levels in solomon islands
Consequences
Insignificant (1) Minor (2) Moderate (3) Major (4) Catastrophic (5)
like
lihoo
d
Almost certain (5) Medium (5) Medium (10) high (15) Extreme (20) Extreme (25)
likely (4) low (4) Medium (8) high (12) high (16) Extreme (20)
Possible (3) low (3) Medium (6) Medium (9) high (12) high (15)
Unlikely (2) low (2) low (4) Medium (6) Medium (8) Medium (10)
Very Unlikely (1) low (1) low (2) low (3) low (4) Medium (5)
table 13: economics of Climate Proofing measures in the solomon islands second road improvement Project(net present value of project in $ million)
scenario 1 scenario 2 scenario 330 years 50 years 30 years 50 years 30 years 50 years
Northwest Guadalcanal Road 8.45 13.38 (3.18) (2.40) 0.99 3.78Makira Island Coastal Road 34.56 34.56 (7.82) (5.00) 13.40 13.40North Malaita Road 9.27 14.45 (1.31) (0.12) 2.33 5.44
( ) = negative value.
• Scenario 3. Climate change and climate proofing measures are both included in project formulation.
The outcome of the economic analysis is summarized in Table 13 for each scenario and assuming a 30-year or 50-year project life time.
As shown in Table 13, climate change adversely impacts the economic desirability of the project (Scenario 2 versus Scenario 1). without climate proofing measures, the negative net present value associated with Scenario 2 would indicate that the project may be abandoned. on the other hand, with climate proofing measures
(Scenario 3), the net present value of each subproject becomes positive—albeit less so than in the absence of climate change. The difference between Scenario 3 and Scenario 1 is referred in the economic literature as residual damages.31
As a result of the above economic analysis, in 2012, the Solomon Islands Second Road Improvement Project leveraged an additional $2.1 million grant in cofinancing from the (then) Australian Agency for International Development’s climate change fund to finance the incremental cost to incorporate climate proofing measures in project design.
31 See ADB (2014c) for further details on the economics of climate proofing investment projects.
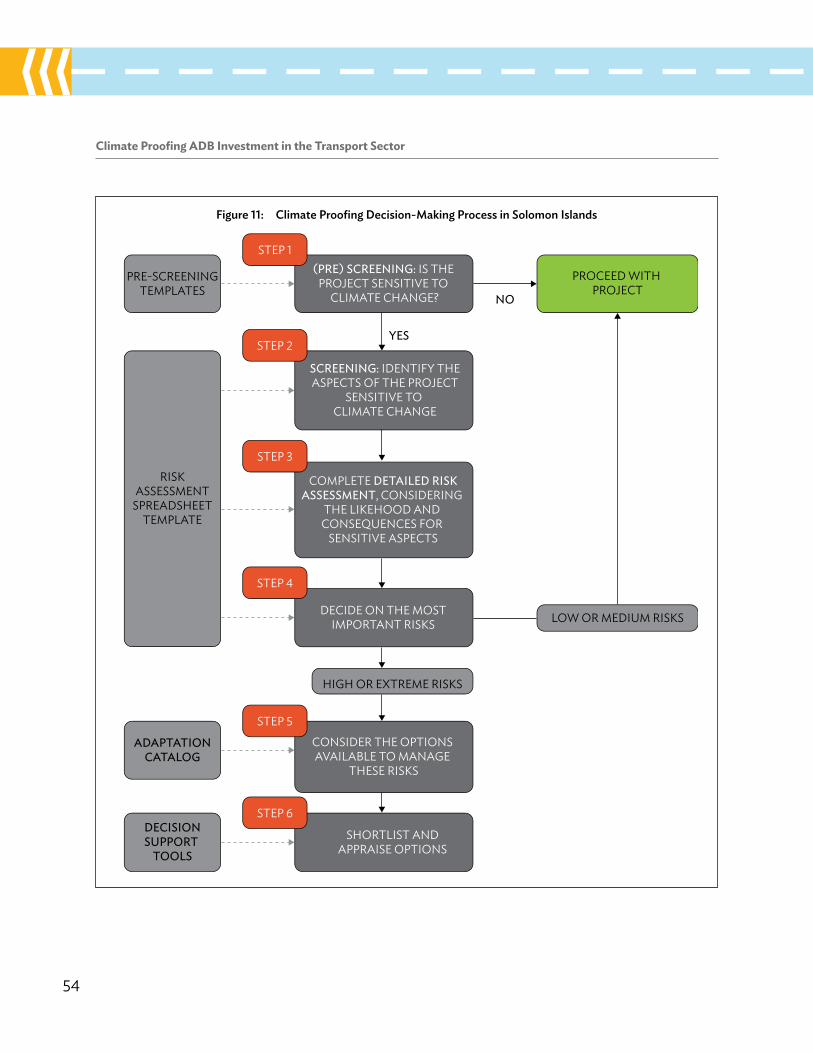
54
Climate Proofing ADB Investment in the Transport Sector
Figure 11: Climate Proofing decision-making Process in solomon islands
STEP 2
STEP 1
STEP 3
STEP 4
STEP 5
STEP 6
PROCEED WITH PROJECT
LOW OR MEDIUM RISKS
HIGH OR EXTREME RISKS
PRE-SCREENINGTEMPLATES
RISKASSESSMENT
SPREADSHEETTEMPLATE
(PRE) SCREENING: IS THE PROJECT SENSITIVE TO
CLIMATE CHANGE?
SCREENING: IDENTIFY THEASPECTS OF THE PROJECT
SENSITIVE TO CLIMATE CHANGE
COMPLETE DETAILED RISKASSESSMENT, CONSIDERING
THE LIKEHOOD AND CONSEQUENCES FOR
SENSITIVE ASPECTS
DECIDE ON THE MOSTIMPORTANT RISKS
CONSIDER THE OPTIONS AVAILABLE TO MANAGE
THESE RISKS
SHORTLIST ANDAPPRAISE OPTIONS
ADAPTATIONCATALOG
DECISIONSUPPORT
TOOLS
NO
YES
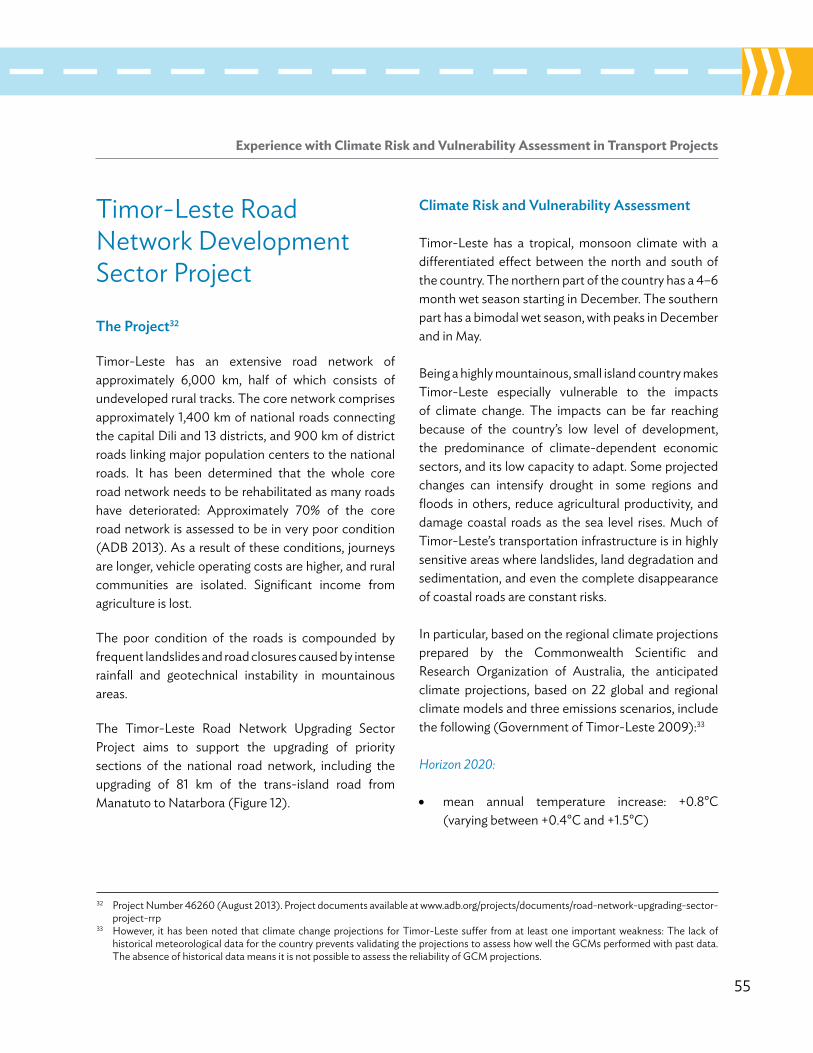
Experience with Climate Risk and Vulnerability Assessment in Transport Projects
55
Timor-leste Road Network Development Sector Project
the Project32
Timor-leste has an extensive road network of approximately 6,000 km, half of which consists of undeveloped rural tracks. The core network comprises approximately 1,400 km of national roads connecting the capital Dili and 13 districts, and 900 km of district roads linking major population centers to the national roads. It has been determined that the whole core road network needs to be rehabilitated as many roads have deteriorated: Approximately 70% of the core road network is assessed to be in very poor condition (ADB 2013). As a result of these conditions, journeys are longer, vehicle operating costs are higher, and rural communities are isolated. Significant income from agriculture is lost.
The poor condition of the roads is compounded by frequent landslides and road closures caused by intense rainfall and geotechnical instability in mountainous areas.
The Timor-leste Road Network Upgrading Sector Project aims to support the upgrading of priority sections of the national road network, including the upgrading of 81 km of the trans-island road from Manatuto to Natarbora (Figure 12).
Climate risk and vulnerability assessment
Timor-leste has a tropical, monsoon climate with a differentiated effect between the north and south of the country. The northern part of the country has a 4–6 month wet season starting in December. The southern part has a bimodal wet season, with peaks in December and in May.
Being a highly mountainous, small island country makes Timor-leste especially vulnerable to the impacts of climate change. The impacts can be far reaching because of the country’s low level of development, the predominance of climate-dependent economic sectors, and its low capacity to adapt. Some projected changes can intensify drought in some regions and floods in others, reduce agricultural productivity, and damage coastal roads as the sea level rises. Much of Timor-leste’s transportation infrastructure is in highly sensitive areas where landslides, land degradation and sedimentation, and even the complete disappearance of coastal roads are constant risks.
In particular, based on the regional climate projections prepared by the Commonwealth Scientific and Research organization of Australia, the anticipated climate projections, based on 22 global and regional climate models and three emissions scenarios, include the following (Government of Timor-leste 2009):33
Horizon 2020:
• mean annual temperature increase: +0.8°C (varying between +0.4°C and +1.5°C)
32 Project Number 46260 (August 2013). Project documents available at www.adb.org/projects/documents/road-network-upgrading-sector-project-rrp
33 however, it has been noted that climate change projections for Timor-leste suffer from at least one important weakness: The lack of historical meteorological data for the country prevents validating the projections to assess how well the GCMs performed with past data. The absence of historical data means it is not possible to assess the reliability of GCM projections.
56
Climate Proofing ADB Investment in the Transport Sector
• mean annual precipitation difference: +2% (varying between –12% and +15%)
Horizon 2050:• mean annual temperature increase: +1.5°C
(varying between +0.7°C and +2.8°C)
• mean annual precipitation difference: +4% (varying between –25% and +15%)
Horizon 2080:• mean annual temperature increase: +2.2°C
(varying between +0.8°C and +4.0°C)
• mean annual precipitation difference: +6% (varying between –21% and +32%)
of equal interest, climate projections and expert assessments indicate the following trends and potential climate changes:
• hot days and heat waves are expected to be more frequent in the future;
• while future conditions may bring fewer extreme rainfall events as well as a lesser number of tropical cyclones, the intensity of those rainfall events and cyclones is projected to be more important;
Figure 12: timor-leste road network upgrading sector Project
Source: ADB. 2013. Report and Recommendation of the President to the Board of Directors: Proposed Loans to the Democratic Republic of Timor-Leste: Road Network Upgrading Sector Project. Manila

Experience with Climate Risk and Vulnerability Assessment in Transport Projects
57
• flood intensity and frequency are expected to increase significantly for the region of interest;
• the intensity and probability of extreme wave heights associated with climate change along coastal regions are likely to increase.
Climate Proofing measures
At the time of the writing of this report, this road upgrading project in Timor-leste had reached the detailed design stage.
In order to address sea level changes and increased storm surge wave height, the following activities will be included during construction on a project-wide basis:
• Realignment: It is assumed that the subproject will follow the existing horizontal alignment and the inclusion of this strategy will be confined to adjustments of the road’s vertical alignment. where the elevation of the road is 2 masl or less, the vertical alignment will be increased to raise all areas of the road to above 2 masl.
• Erosion protection: The road is subject to risk of erosion from wave action, particularly where vertical alignment is 2 masl or less. The preferred strategy is to construct an earth levee bank with riprap protection against erosion by wave action and culverts every 150 m.
• Increased maintenance: The road currently is not maintained very frequently, and therefore the quantity and frequency of maintenance will be increased in response to the accelerated rate of physical deterioration.
In addition, stretches of the subproject road may be subject to more intense, short-duration precipitation. To address this situation, the following activities will be implemented during project construction:
• Increased capacity of transverse drainage system: where the intensity of short-duration precipitation events increases, the capacity of the transverse drainage system will be increased by providing additional relief culverts at the rate of two every kilometer.
• Improved longitudinal drainage: The ability of the longitudinal drainage systems to accommodate the higher quantity of runoff due to the increased precipitation will be improved by lining drains and providing larger drains.
• Erosion protection: Areas in the vicinity of the road that are at risk of erosion will be protected using bioengineering techniques. In addition, steeply graded streams in the project area will be provided with check dams to reduce sediment loads on the road drainage system.
• Increased maintenance: The quantity of maintenance will be increased in response to the faster rate of physical deterioration.
Cost of Climate Proofing measures
A grant of $4.5 million was obtained from the least Developed Countries Fund of the Global Environment Facility to support the implementation of the climate proofing measures.
The cost of the above engineering and bioengineering measures has been estimated to reach approximately $3.3 million, representing approximately 4% of the total project cost. The remaining resources will be used to increase awareness and understanding of climate change and its impacts at the national level as well as in vulnerable areas, and to strengthen adaptive capacity of national and regional stakeholders to respond to extreme weather events.
58
Climate Proofing ADB Investment in the Transport Sector
uRBAn TRAnSPoRT
The project involves the construction of a 11.3-km first stage of MRT line 2, from Ben Thanh to Tham luong (Figure 13). It includes a 9.3-km underground section and a 2.5-km elevated section with a total of 10 stations. A spur line of 1.1 kilometers connects the main line to a 22-hectare depot complex in Tham luong. From Tham luong, MRT line 2 will be elevated along the median of Truong Chinh until it reaches the vicinity of Tan Son Nhat International Airport. A transition section will take it underground just before the intersection of the Pham Van Bach line until it reaches the end of the line.
The cost of the project is estimated to reach $1.9 billion with ADB financing of $890 million.
Climate risk and vulnerability assessment
while hCMC is expected to contribute more significantly to the economic growth of Viet Nam over the coming years, it has been identified as one of the top 10 cities at risk of climate change impacts (Dasgupta et al. 2011, 2012).
hCMC is vulnerable because (i) it is barely above sea level—40% to 45% of land cover in hCMC is 0–1 meter (m) in elevation, 15%–20% is 1–2 m, and very little land sits above 4 m; (ii) it has a large and growing population—residents number more than 6.3 million and the dynamic economy draws migrants from all over the country; (iii) local development patterns are also affecting vulnerability and the local climate—urban development, for example, has decreased infiltration
34 Project Number 45200-002 (january 2014). Project documents available at www.adb.org/projects/documents/sustainable-urban-transport-ho-chi-minh-city-mrt-line-2-project-rrp
Viet Nam: Sustainable Urban Transport for ho Chi Minh City Mass Rapid Transit line 2
the Project34
ho Chi Minh City (hCMC) is the largest city in Viet Nam, with a population of over 9 million that is expected to grow to more than 13 million by 2025. Given the high population growth, there will be an increase in demand from the commuting public for better transport. however, public transport meets less than 10% of the total demand in the city. Private vehicles dominate transportation and existing road infrastructure is reaching the saturation point. Congestion is expected to worsen with rising household income as motorbike riders shift to cars. A well-integrated, high-capacity public urban transport system is essential to meet the mobility demands of this growing urban metropolis.
The Government of Viet Nam, through the hCMC People’s Committee, prepared the ho Chi Minh City Urban Mass Rapid Transit (MRT) line 2 Investment Program, which includes investment and non-investment components. The project is a high priority of the government, and one of the three priority MRT lines identified in the approved urban transport master plan for hCMC.
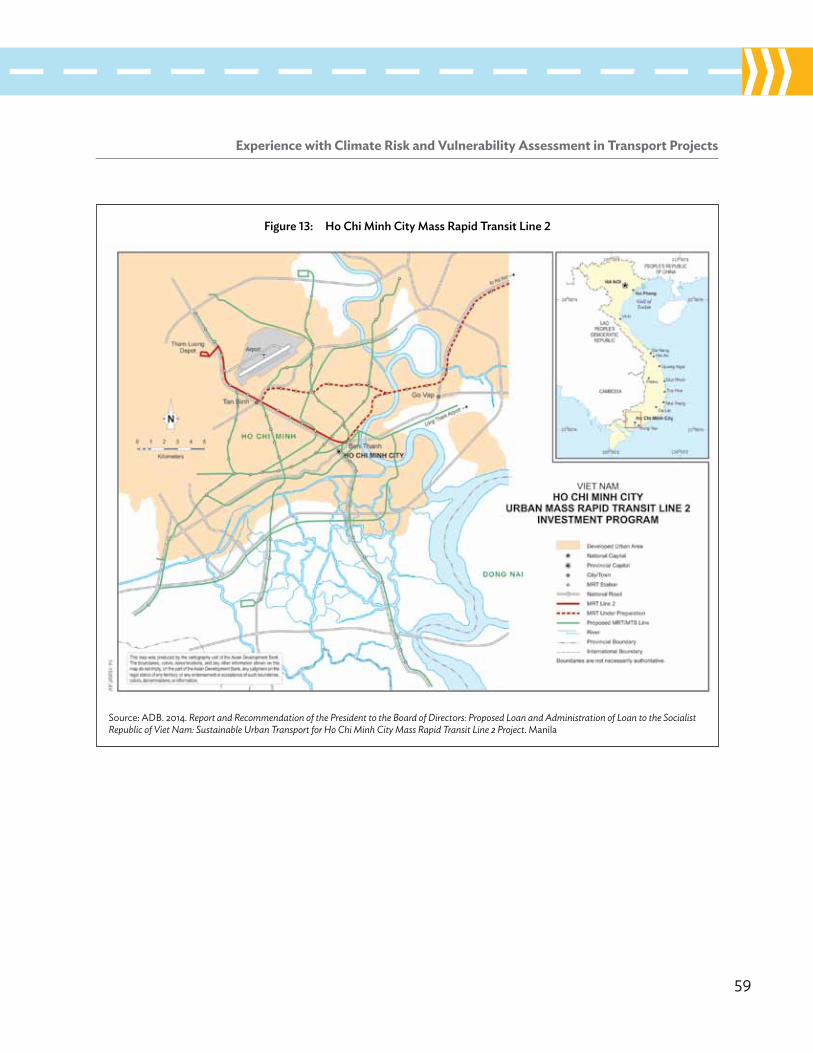
Experience with Climate Risk and Vulnerability Assessment in Transport Projects
59
Figure 13: ho Chi minh City mass rapid transit line 2
Source: ADB. 2014. Report and Recommendation of the President to the Board of Directors: Proposed Loan and Administration of Loan to the Socialist Republic of Viet Nam: Sustainable Urban Transport for Ho Chi Minh City Mass Rapid Transit Line 2 Project. Manila
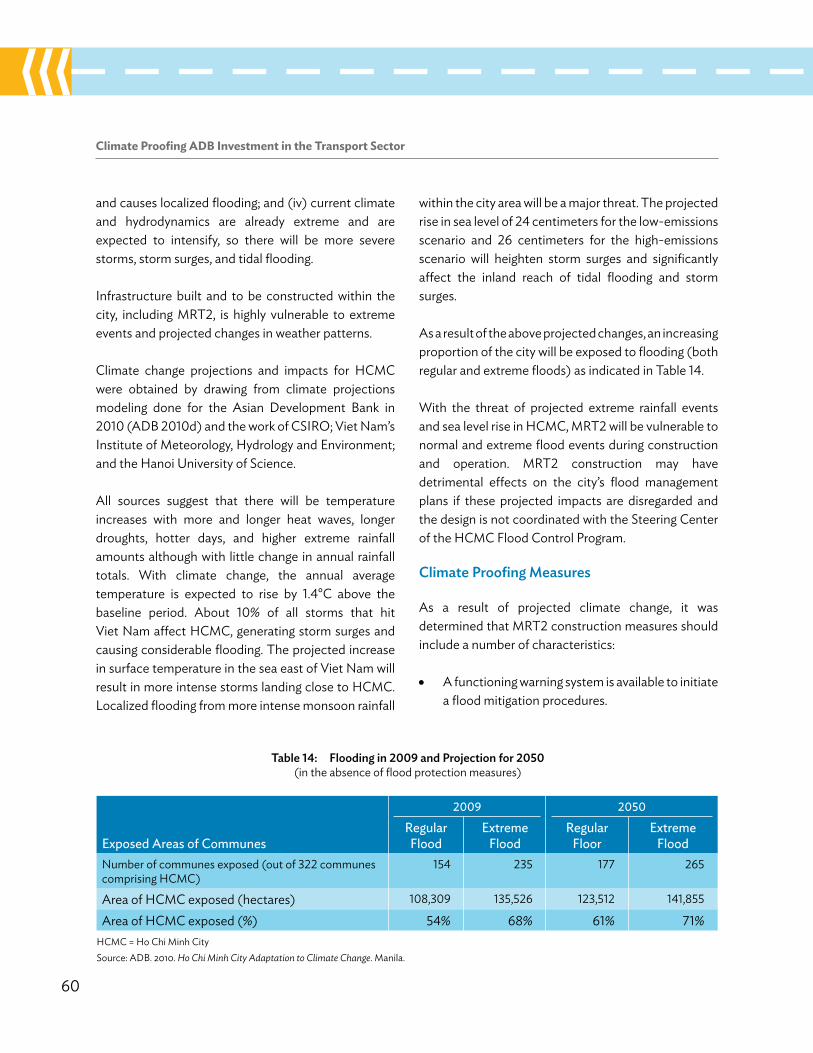
60
Climate Proofing ADB Investment in the Transport Sector
and causes localized flooding; and (iv) current climate and hydrodynamics are already extreme and are expected to intensify, so there will be more severe storms, storm surges, and tidal flooding.
Infrastructure built and to be constructed within the city, including MRT2, is highly vulnerable to extreme events and projected changes in weather patterns.
Climate change projections and impacts for hCMC were obtained by drawing from climate projections modeling done for the Asian Development Bank in 2010 (ADB 2010d) and the work of CSIRo; Viet Nam’s Institute of Meteorology, hydrology and Environment; and the hanoi University of Science.
All sources suggest that there will be temperature increases with more and longer heat waves, longer droughts, hotter days, and higher extreme rainfall amounts although with little change in annual rainfall totals. with climate change, the annual average temperature is expected to rise by 1.4°C above the baseline period. About 10% of all storms that hit Viet Nam affect hCMC, generating storm surges and causing considerable flooding. The projected increase in surface temperature in the sea east of Viet Nam will result in more intense storms landing close to hCMC. localized flooding from more intense monsoon rainfall
within the city area will be a major threat. The projected rise in sea level of 24 centimeters for the low-emissions scenario and 26 centimeters for the high-emissions scenario will heighten storm surges and significantly affect the inland reach of tidal flooding and storm surges.
As a result of the above projected changes, an increasing proportion of the city will be exposed to flooding (both regular and extreme floods) as indicated in Table 14.
with the threat of projected extreme rainfall events and sea level rise in hCMC, MRT2 will be vulnerable to normal and extreme flood events during construction and operation. MRT2 construction may have detrimental effects on the city’s flood management plans if these projected impacts are disregarded and the design is not coordinated with the Steering Center of the hCMC Flood Control Program.
Climate Proofing measures
As a result of projected climate change, it was determined that MRT2 construction measures should include a number of characteristics:
• A functioning warning system is available to initiate a flood mitigation procedures.
table 14: Flooding in 2009 and Projection for 2050(in the absence of flood protection measures)
2009 2050
exposed areas of communesregular Flood
extreme Flood
regular Floor
extreme Flood
Number of communes exposed (out of 322 communes comprising hCMC)
154 235 177 265
Area of hCMC exposed (hectares) 108,309 135,526 123,512 141,855
Area of hCMC exposed (%) 54% 68% 61% 71%hCMC = ho Chi Minh CitySource: ADB. 2010. Ho Chi Minh City Adaptation to Climate Change. Manila.
Experience with Climate Risk and Vulnerability Assessment in Transport Projects
61
• Critical electrical and mechanical operating systems are isolated from water.
• Tunnel entrances can be quickly and easily closed in the event of rising floodwaters.
• A third rail can be isolated and switched off automatically or manually.
• Emergency power is available for critical electrical and mechanical operating systems.
• Drainage and reinstatement of an operating rail system can proceed rapidly should catastrophic flooding occur.
• Passive underground cooling and dehumidification systems are in place.
The cost of the adopted climate proofing measures reached approximately $8 million, or less than 0.5% of the estimated capital cost of the project.
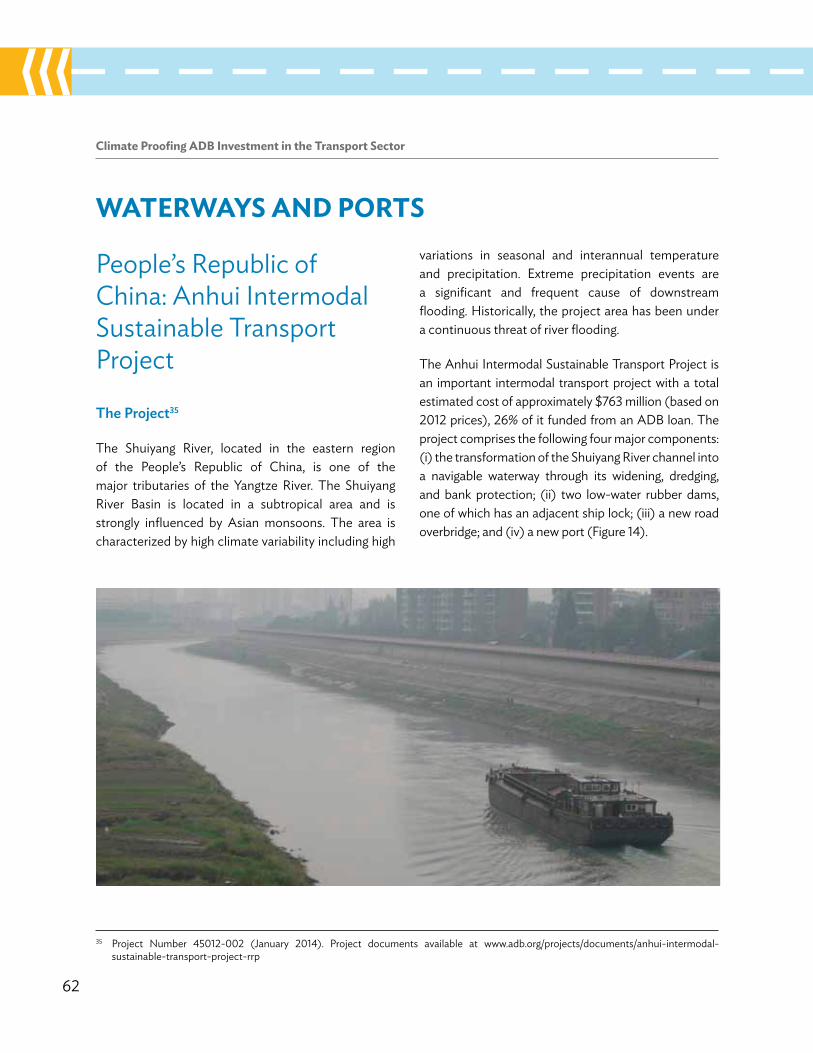
62
Climate Proofing ADB Investment in the Transport Sector
WATERWAyS AnD PoRTS
People’s Republic of China: Anhui Intermodal Sustainable Transport Project
the Project35
The Shuiyang River, located in the eastern region of the People’s Republic of China, is one of the major tributaries of the yangtze River. The Shuiyang River Basin is located in a subtropical area and is strongly influenced by Asian monsoons. The area is characterized by high climate variability including high
variations in seasonal and interannual temperature and precipitation. Extreme precipitation events are a significant and frequent cause of downstream flooding. historically, the project area has been under a continuous threat of river flooding.
The Anhui Intermodal Sustainable Transport Project is an important intermodal transport project with a total estimated cost of approximately $763 million (based on 2012 prices), 26% of it funded from an ADB loan. The project comprises the following four major components: (i) the transformation of the Shuiyang River channel into a navigable waterway through its widening, dredging, and bank protection; (ii) two low-water rubber dams, one of which has an adjacent ship lock; (iii) a new road overbridge; and (iv) a new port (Figure 14).
35 Project Number 45012-002 (january 2014). Project documents available at www.adb.org/projects/documents/anhui-intermodal-sustainable-transport-project-rrp
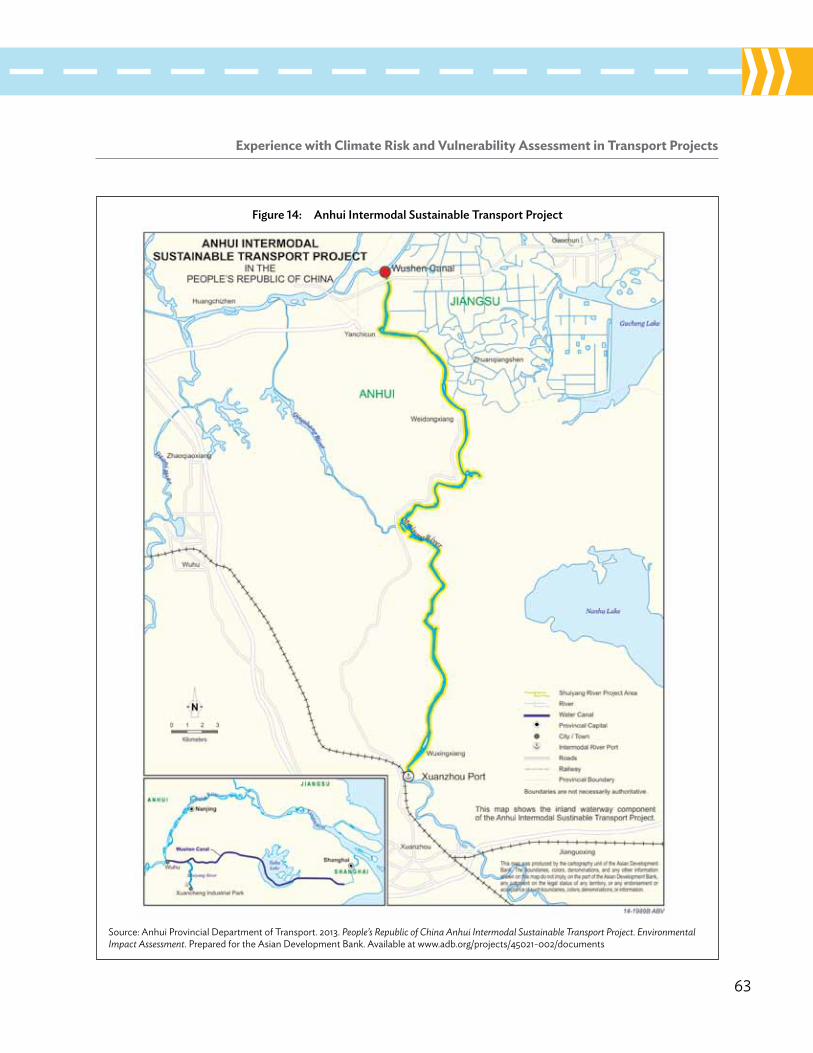
Experience with Climate Risk and Vulnerability Assessment in Transport Projects
63
Figure 14: anhui intermodal sustainable transport Project
Source: Anhui Provincial Department of Transport. 2013. People’s Republic of China Anhui Intermodal Sustainable Transport Project. Environmental Impact Assessment. Prepared for the Asian Development Bank. Available at www.adb.org/projects/45021-002/documents
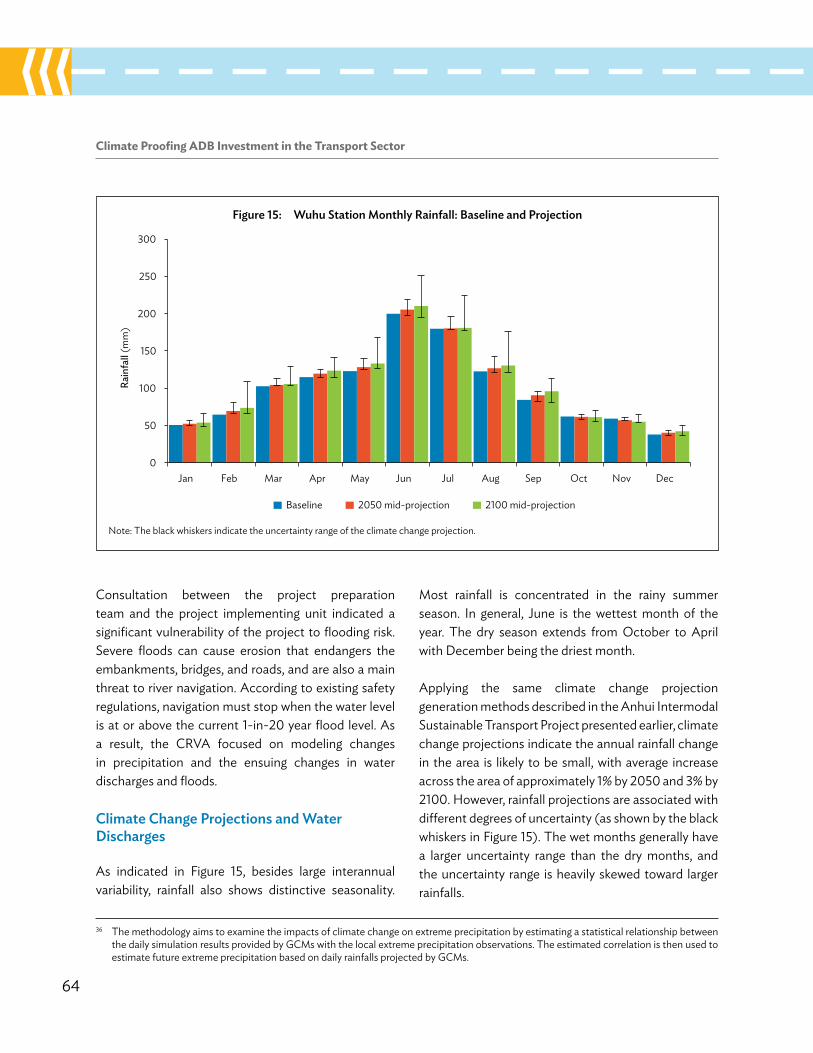
64
Climate Proofing ADB Investment in the Transport Sector
Consultation between the project preparation team and the project implementing unit indicated a significant vulnerability of the project to flooding risk. Severe floods can cause erosion that endangers the embankments, bridges, and roads, and are also a main threat to river navigation. According to existing safety regulations, navigation must stop when the water level is at or above the current 1-in-20 year flood level. As a result, the CRVA focused on modeling changes in precipitation and the ensuing changes in water discharges and floods.
Climate Change Projections and water discharges
As indicated in Figure 15, besides large interannual variability, rainfall also shows distinctive seasonality.
Most rainfall is concentrated in the rainy summer season. In general, june is the wettest month of the year. The dry season extends from october to April with December being the driest month.
Applying the same climate change projection generation methods described in the Anhui Intermodal Sustainable Transport Project presented earlier, climate change projections indicate the annual rainfall change in the area is likely to be small, with average increase across the area of approximately 1% by 2050 and 3% by 2100. however, rainfall projections are associated with different degrees of uncertainty (as shown by the black whiskers in Figure 15). The wet months generally have a larger uncertainty range than the dry months, and the uncertainty range is heavily skewed toward larger rainfalls.
Figure 15: wuhu station monthly rainfall: baseline and Projection
Note: The black whiskers indicate the uncertainty range of the climate change projection.
0
50
100
150
200
250
300
Jan Feb Mar Apr May Jun Jul Aug Sep Oct Nov Dec
Rain
fall
(mm
)
Baseline 2100 mid-projection2050 mid-projection
36 The methodology aims to examine the impacts of climate change on extreme precipitation by estimating a statistical relationship between the daily simulation results provided by GCMs with the local extreme precipitation observations. The estimated correlation is then used to estimate future extreme precipitation based on daily rainfalls projected by GCMs.

Experience with Climate Risk and Vulnerability Assessment in Transport Projects
65
Following a methodology developed by ye and li (2011), a general extreme value function was applied to the daily observation to investigate possible changes in extreme rainfall as a result of climate change.36 The statistical analysis revealed that the 10-day total rainfall has the most significant statistical relationship with the 3-day flood amount at the project location (xuancheng).
Figure 16: Changes in maximum 10-day total rainfall at Project location
GEV = general extreme value.
Retu
rn P
erio
d (Y
ears
)
2
5
10
20
50
100150
100 150 200 250 300 350 400 450 500 550 600 650
10-Day Total Rainfall (mm)
Observed extreme values Baseline GEV Mid scenario Low scenario High scenario
Figure 16 shows the baseline distribution of the annual maximum 10-day rainfall, as well as its 2050 and 2100 change projections. The right-shifting of the future general extreme value function indicates an increment of extreme rainfall in terms of either the intensity or the frequency. The 2050 change is noticeable, with a relatively small uncertainty range. The 2100 change is
table 15: existing and Projected 10-day maximum rainfall (millimeters)
return Period (years) baseline
2050 2100
mid low High mid low High2 192.37 218.13 203.37 245.09 240.41 212.58 334.185 264.14 298.25 278.74 333.75 327.99 290.97 449.29
10 321.15 363.56 338.61 407.72 400.62 353.23 551.4020 384.22 437.33 404.85 492.83 483.77 422.13 674.7250 480.14 552.15 505.59 628.09 615.19 526.90 881.82
100 564.30 655.22 593.99 751.98 734.92 618.84 1,081.89200 660.32 775.14 694.84 898.65 876.00 723.74 1,329.92
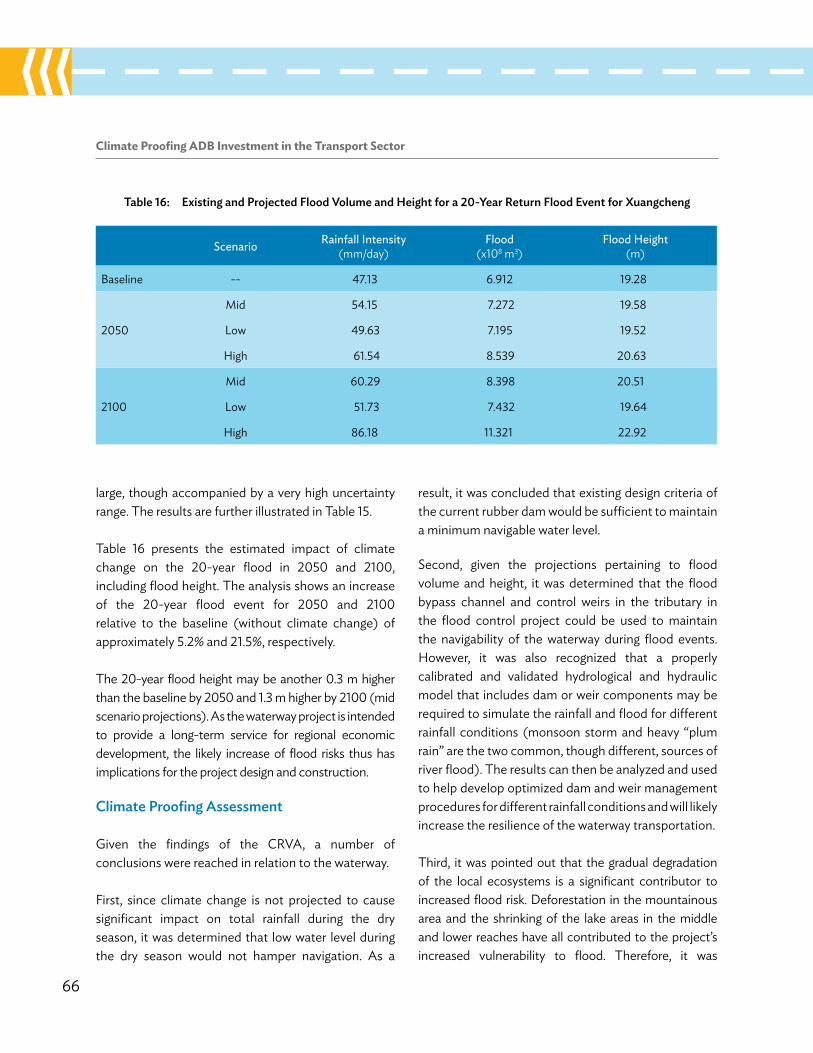
66
Climate Proofing ADB Investment in the Transport Sector
large, though accompanied by a very high uncertainty range. The results are further illustrated in Table 15.
Table 16 presents the estimated impact of climate change on the 20-year flood in 2050 and 2100, including flood height. The analysis shows an increase of the 20-year flood event for 2050 and 2100 relative to the baseline (without climate change) of approximately 5.2% and 21.5%, respectively.
The 20-year flood height may be another 0.3 m higher than the baseline by 2050 and 1.3 m higher by 2100 (mid scenario projections). As the waterway project is intended to provide a long-term service for regional economic development, the likely increase of flood risks thus has implications for the project design and construction.
Climate Proofing assessment
Given the findings of the CRVA, a number of conclusions were reached in relation to the waterway.
First, since climate change is not projected to cause significant impact on total rainfall during the dry season, it was determined that low water level during the dry season would not hamper navigation. As a
result, it was concluded that existing design criteria of the current rubber dam would be sufficient to maintain a minimum navigable water level.
Second, given the projections pertaining to flood volume and height, it was determined that the flood bypass channel and control weirs in the tributary in the flood control project could be used to maintain the navigability of the waterway during flood events. however, it was also recognized that a properly calibrated and validated hydrological and hydraulic model that includes dam or weir components may be required to simulate the rainfall and flood for different rainfall conditions (monsoon storm and heavy “plum rain” are the two common, though different, sources of river flood). The results can then be analyzed and used to help develop optimized dam and weir management procedures for different rainfall conditions and will likely increase the resilience of the waterway transportation.
Third, it was pointed out that the gradual degradation of the local ecosystems is a significant contributor to increased flood risk. Deforestation in the mountainous area and the shrinking of the lake areas in the middle and lower reaches have all contributed to the project’s increased vulnerability to flood. Therefore, it was
table 16: existing and Projected Flood volume and height for a 20-year return Flood event for xuangcheng
scenario rainfall intensity (mm/day)
Flood (x108 m3)
Flood Height (m)
Baseline -- 47.13 6.912 19.28
2050
Mid 54.15 7.272 19.58
low 49.63 7.195 19.52
high 61.54 8.539 20.63
2100
Mid 60.29 8.398 20.51
low 51.73 7.432 19.64
high 86.18 11.321 22.92
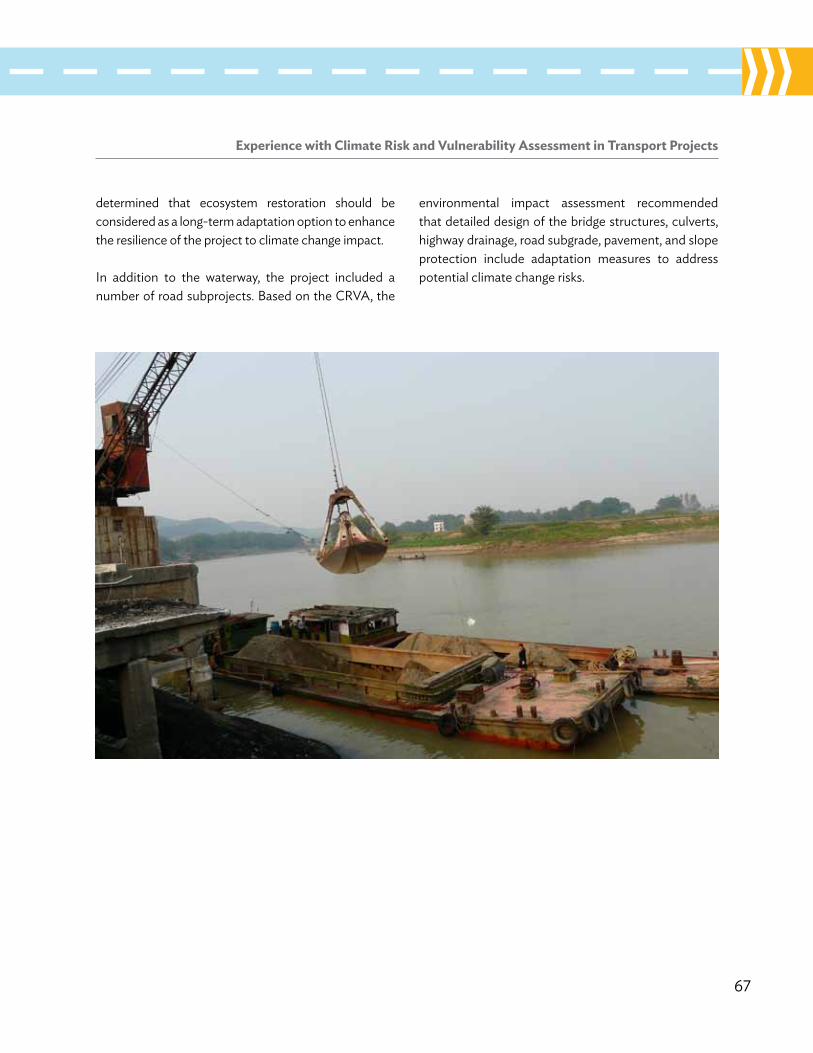
Experience with Climate Risk and Vulnerability Assessment in Transport Projects
67
determined that ecosystem restoration should be considered as a long-term adaptation option to enhance the resilience of the project to climate change impact.
In addition to the waterway, the project included a number of road subprojects. Based on the CRVA, the
environmental impact assessment recommended that detailed design of the bridge structures, culverts, highway drainage, road subgrade, pavement, and slope protection include adaptation measures to address potential climate change risks.

68
Climate Proofing ADB Investment in the Transport Sector
Cook Islands: Avatiu Port Development Project
the Project37
The Cook Islands comprise 15 small volcanic islands and coral atolls. The total population is estimated at approximately 21,000. Rarotonga is the principal island with a population of 14,000 and a maximum elevation of approximately 650 m.
The Cook Islands’ port infrastructure consists of two international ports, including one at Avatiu near
the main town of Avarua on Rarotonga (Figure 17). The Avatiu port handles approximately 90% of total imports by sea. The Avatiu port also serves tourism, with an increasing number of yachts, pleasure boats, and passenger cruise ships. The harbor cannot handle ships more than approximately 90 m in length, and the berth is limited to a 6-meter draft. This excludes cargo vessels above 4,000 tons, and most cruise ships must transfer passengers by ship’s boat. The port has suffered periodic damage from cyclones and emergency procedures are in place to minimize losses when cyclones occur. The existing wharf was constructed in 1989. It is in a state of advanced deterioration due to design deficiencies and poor construction.
37 Project Number 40287-023 (November 2008). Project documents available at www.adb.org/projects/40287-013/documents
Figure 17: Port of avatiu—Cook islands
Source: Cook Islands Port Authority.
Experience with Climate Risk and Vulnerability Assessment in Transport Projects
69
The project aims to address these existing deficiencies and constraints and bring the port and harbor up to acceptable international maritime safety standards by reconstructing the quay and part of the wharf area. The project will also widen and deepen the harbor and realign the quay to enable the port to handle larger cargo ships, thereby ensuring that the port remains resilient in the face of changing international conditions. The upgraded port will also be able to safely berth larger sizes of cruise ships, which cannot presently enter Avatiu harbor.
The initial project cost of $18.2 million (ADB 2008b) was subsequently raised to $24.6 million as a result of adverse currency movement and an underestimation of the cost of the civil works (ADB 2011c).
Climate risk and vulnerability assessment
As the project area lies within the cyclone belt of the South Pacific ocean, a climate risk profile revealed that key threats to the project are associated with storm surges and sea swells due to cyclones. These threats are expected to be exacerbated by rising sea level and by the expected intensification of cyclones (Government of the Cook Islands 2012).
A climate modeling exercise undertaken in 2004 under the ADB Climate Change Adaptation Program (ClIMAP) projected that in 2060 the Cook Islands will face (i) a rise in sea level between 0.5 m and 0.8 m; (ii) heavier rainfall events, with daily total precipitation reaching more than 200 mm and hourly total precipitation above 50 mm; (iii) more intense cyclones; and (iv) more importantly for the port, in 2065, an increase in significant wave height from the existing 10.8 m for a 1-in-50 year event to a projected 12.0 m for a 1-in-50 year event (Box 7).
The results indicated that the project may be adversely affected by climate risks. In particular, there is a high
risk that the wharf face will be overtopped during cyclone events. These risks were further assessed and confirmed with design engineers.
Climate Proofing measures
From an operational perspective, the obvious measure involved building the new wharf 0.5 m higher than originally proposed to accommodate projected sea level rise and storm intensification. however, this approach was not deemed feasible as a result of many small coastal ships using the port.
The alternative proposed was to design the wall so that the wharf face and adjacent pavement can be raised by 0.5 m in the future if required. This would require the wall to be designed for the future load increase, resulting in additional steel in the wall face and an increase in capacity of the anchors. This method has been selected for economic efficiency and raises the wharf edge level to an elevation that is more appropriate for current conditions and the larger ships using the port.
Costs and benefits of Climate Proofing measures
The cost estimate for this additional work was $0.8 million, representing an increase of approximately 4.4% over the estimated project total cost.
It was estimated that such an investment (to keep feasible the possibility of raising the structure at some point in the future) at the time of project implementation would prevent a future cost of approximately $12 million to raise the structure in case of a sea level rise of 0.5 m.
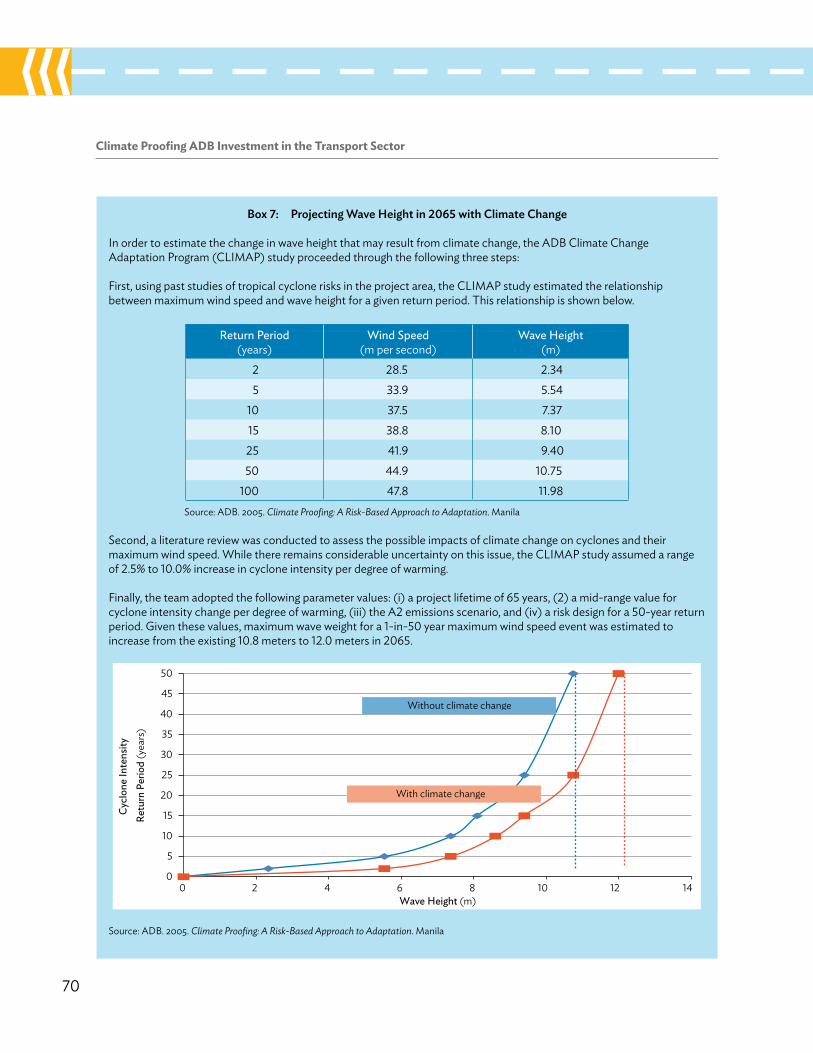
70
Climate Proofing ADB Investment in the Transport Sector
box 7: Projecting wave height in 2065 with Climate Change
In order to estimate the change in wave height that may result from climate change, the ADB Climate Change Adaptation Program (ClIMAP) study proceeded through the following three steps:
First, using past studies of tropical cyclone risks in the project area, the ClIMAP study estimated the relationship between maximum wind speed and wave height for a given return period. This relationship is shown below.
return Period (years)
wind speed (m per second)
wave Height (m)
2 28.5 2.345 33.9 5.54
10 37.5 7.3715 38.8 8.1025 41.9 9.4050 44.9 10.75
100 47.8 11.98Source: ADB. 2005. Climate Proofing: A Risk-Based Approach to Adaptation. Manila
Second, a literature review was conducted to assess the possible impacts of climate change on cyclones and their maximum wind speed. while there remains considerable uncertainty on this issue, the ClIMAP study assumed a range of 2.5% to 10.0% increase in cyclone intensity per degree of warming.
Finally, the team adopted the following parameter values: (i) a project lifetime of 65 years, (2) a mid-range value for cyclone intensity change per degree of warming, (iii) the A2 emissions scenario, and (iv) a risk design for a 50-year return period. Given these values, maximum wave weight for a 1-in-50 year maximum wind speed event was estimated to increase from the existing 10.8 meters to 12.0 meters in 2065.
Source: ADB. 2005. Climate Proofing: A Risk-Based Approach to Adaptation. Manila
0
5
10
15
20
25
30
35
40
45
50
0 2 4 6 8 10 12 14
Cycl
one
Inte
nsity
Re
turn
Per
iod
(yea
rs)
Wave Height (m)
Without climate change
With climate change
71
iii. exPerienCe and oPPortunities
All case studies presented in this report illustrate that investments in the transport sector are vulnerable to projected changes in
climate variables, including changes in temperature, precipitation, and water levels. In numerous policy and operational documents, ADB has asserted its intent to support its DMCs' efforts to address climate change issues and to mainstream climate adaptation measures into its operations, including in the transport sector.
over the course of the last few years, ADB and its DMCs have developed a varied portfolio of investment projects in the transport sector for which climate change risk and adaptation options have been identified, assessed, and occasionally quantified in both physical and economic terms. Some of these were described in the case studies presented earlier. The case studies cover 11 projects involving major roads and bridges (4 projects), remote rural roads (4 projects), urban transport (1 project), and waterways and ports (2 projects). These range in value from approximately $25 million to $1.9 billion. The projects are found across all regions of Asia and the Pacific. Time and costs required for conducting the CRVAs for the case studies ranged between 2 and 8 person-months and $35,000 and $250,000, respectively.
Building on this growing experience and the move toward systematic CRVA, there are increasing opportunities to mainstream climate resilience in investment projects. A number of lessons and
opportunities emerge from the experience presented in this report. These are grouped into three broad themes: (i) methods to identify climate risks, (ii) climate risks and vulnerabilities identified, and (iii) analysis and selection of climate proofing options. Following these opportunities will allow ADB to better support its DMCs in adapting to climate change.
Methods to Identify Climate Risks and Vulnerabilitiesexperience
The case studies show a variety of methods for identifying climate risks and vulnerabilities including literature reviews, referring to GCMs, downscaling of GCMs, conducting statistical analyses of climate data, carrying out other kinds of modeling (i.e., hydrological, temperature of permafrost), GIS-based mapping and analysis, conduct of qualitative analysis, and expert judgments based on field data and experiences from past climate-related disasters (Table 17). while the approaches used did not necessarily follow the exact sequence or all of the guidance steps provided in the Guidelines for Climate Proofing Investment in the Transport Sector (Box 2), in general they followed the key steps provided.
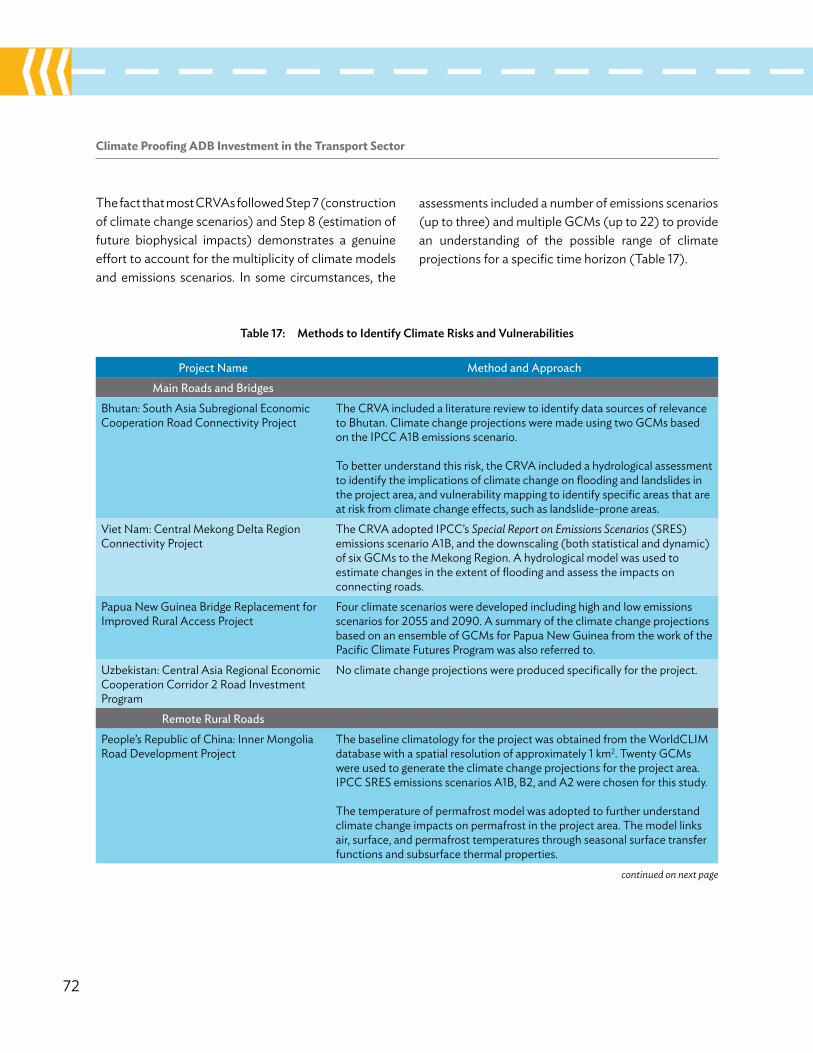
72
Climate Proofing ADB Investment in the Transport Sector
table 17: methods to identify Climate risks and vulnerabilities
Project name method and approachmain roads and bridges
Bhutan: South Asia Subregional Economic Cooperation Road Connectivity Project
The CRVA included a literature review to identify data sources of relevance to Bhutan. Climate change projections were made using two GCMs based on the IPCC A1B emissions scenario.
To better understand this risk, the CRVA included a hydrological assessment to identify the implications of climate change on flooding and landslides in the project area, and vulnerability mapping to identify specific areas that are at risk from climate change effects, such as landslide-prone areas.
Viet Nam: Central Mekong Delta Region Connectivity Project
The CRVA adopted IPCC’s Special Report on Emissions Scenarios (SRES) emissions scenario A1B, and the downscaling (both statistical and dynamic) of six GCMs to the Mekong Region. A hydrological model was used to estimate changes in the extent of flooding and assess the impacts on connecting roads.
Papua New Guinea Bridge Replacement for Improved Rural Access Project
Four climate scenarios were developed including high and low emissions scenarios for 2055 and 2090. A summary of the climate change projections based on an ensemble of GCMs for Papua New Guinea from the work of the Pacific Climate Futures Program was also referred to.
Uzbekistan: Central Asia Regional Economic Cooperation Corridor 2 Road Investment Program
No climate change projections were produced specifically for the project.
remote rural roadsPeople’s Republic of China: Inner Mongolia Road Development Project
The baseline climatology for the project was obtained from the worldClIM database with a spatial resolution of approximately 1 km2. Twenty GCMs were used to generate the climate change projections for the project area. IPCC SRES emissions scenarios A1B, B2, and A2 were chosen for this study.
The temperature of permafrost model was adopted to further understand climate change impacts on permafrost in the project area. The model links air, surface, and permafrost temperatures through seasonal surface transfer functions and subsurface thermal properties.
The fact that most CRVAs followed Step 7 (construction of climate change scenarios) and Step 8 (estimation of future biophysical impacts) demonstrates a genuine effort to account for the multiplicity of climate models and emissions scenarios. In some circumstances, the
continued on next page
assessments included a number of emissions scenarios (up to three) and multiple GCMs (up to 22) to provide an understanding of the possible range of climate projections for a specific time horizon (Table 17).
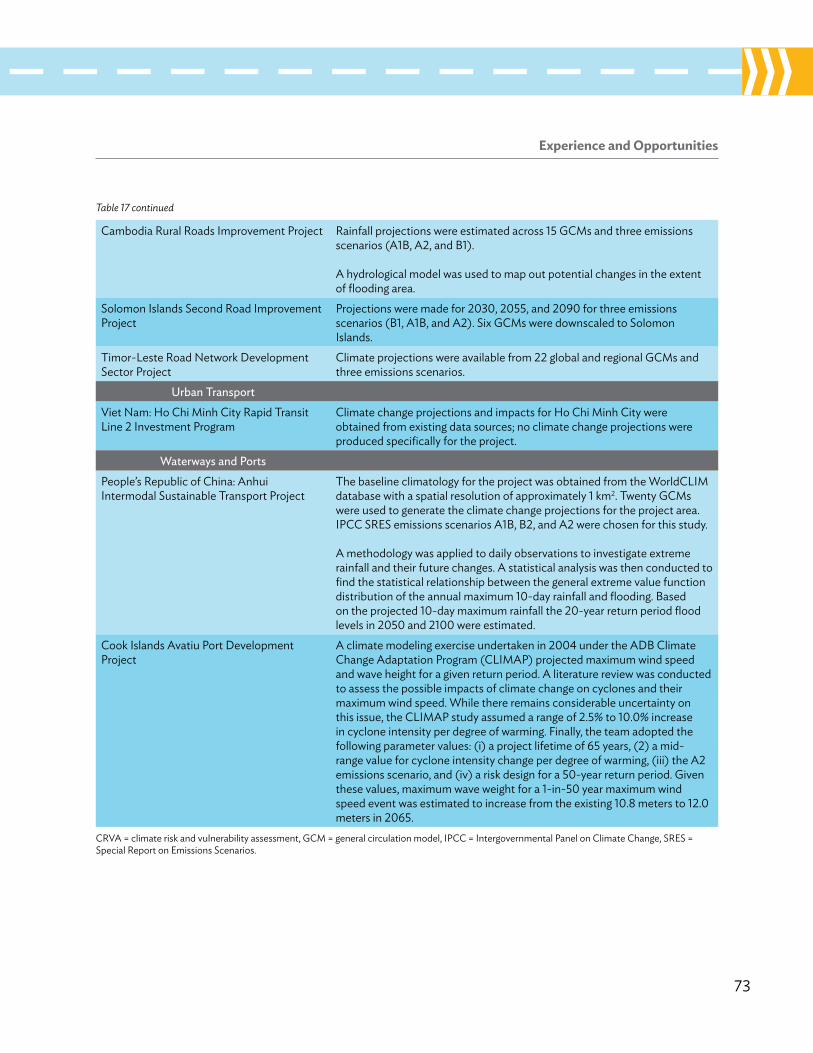
Experience and opportunities
73
Cambodia Rural Roads Improvement Project Rainfall projections were estimated across 15 GCMs and three emissions scenarios (A1B, A2, and B1).
A hydrological model was used to map out potential changes in the extent of flooding area.
Solomon Islands Second Road Improvement Project
Projections were made for 2030, 2055, and 2090 for three emissions scenarios (B1, A1B, and A2). Six GCMs were downscaled to Solomon Islands.
Timor-leste Road Network Development Sector Project
Climate projections were available from 22 global and regional GCMs and three emissions scenarios.
urban TransportViet Nam: ho Chi Minh City Rapid Transit line 2 Investment Program
Climate change projections and impacts for ho Chi Minh City were obtained from existing data sources; no climate change projections were produced specifically for the project.
waterways and PortsPeople’s Republic of China: Anhui Intermodal Sustainable Transport Project
The baseline climatology for the project was obtained from the worldClIM database with a spatial resolution of approximately 1 km2. Twenty GCMs were used to generate the climate change projections for the project area. IPCC SRES emissions scenarios A1B, B2, and A2 were chosen for this study.
A methodology was applied to daily observations to investigate extreme rainfall and their future changes. A statistical analysis was then conducted to find the statistical relationship between the general extreme value function distribution of the annual maximum 10-day rainfall and flooding. Based on the projected 10-day maximum rainfall the 20-year return period flood levels in 2050 and 2100 were estimated.
Cook Islands Avatiu Port Development Project
A climate modeling exercise undertaken in 2004 under the ADB Climate Change Adaptation Program (ClIMAP) projected maximum wind speed and wave height for a given return period. A literature review was conducted to assess the possible impacts of climate change on cyclones and their maximum wind speed. while there remains considerable uncertainty on this issue, the ClIMAP study assumed a range of 2.5% to 10.0% increase in cyclone intensity per degree of warming. Finally, the team adopted the following parameter values: (i) a project lifetime of 65 years, (2) a mid-range value for cyclone intensity change per degree of warming, (iii) the A2 emissions scenario, and (iv) a risk design for a 50-year return period. Given these values, maximum wave weight for a 1-in-50 year maximum wind speed event was estimated to increase from the existing 10.8 meters to 12.0 meters in 2065.
CRVA = climate risk and vulnerability assessment, GCM = general circulation model, IPCC = Intergovernmental Panel on Climate Change, SRES = Special Report on Emissions Scenarios.
Table 17 continued
74
Climate Proofing ADB Investment in the Transport Sector
38 For example, it is possible to imagine a situation where GCMs predict “on average” a 0% change in precipitation in 2050, while a subset of models projects a significant decrease in rainfall, and another subset projects a significant increase.
39 This risk is particularly significant where climate change projections are treated as climate predictions, i.e., as estimates, expectations, or best guesses of the value of a specific climate parameter many decades from now. Climate projections should instead be treated as conditional expectations (i.e., “if this happens, then this is what is expected”), and not as best predictions of the future.
40 It has occasionally been suggested that practitioners should avoid using downscaled climate information if not aware of their limitations (Taylor et al. 2012).
The availability of projections spanning a wide range of values may lead practitioners to want to reduce the number of outcomes by computing the mean of projections across models (such as average change in temperature or average change in precipitation). This approach amounts to assuming a uniform probability distribution over the set of projections, an approach that climate scientists do not recommend pursuing, as the reduction of an ensemble of projections into a single number may be misleading.38 The reduction of model projections to a single number (such as the average) does not allow project teams and decision makers to fully account for the uncertainty associated with climate change in project design. Using the full range of climate projections will always be a preferred approach supporting informed decision making. For the purpose of assessing climate change impacts, a generally prudent approach is to consider various downscaling methods and outputs from multiple models (Taylor et al. 2012).
A number of CRVAs are based on a single emissions scenario (e.g., SRES emissions scenario A1B) and the use of a limited number of GCMs. For climate parameters such as precipitation (for which projections may vary significantly across GCMs), there is a significant risk that such practice leads to inadequate or misguided adaptation outcomes.39
Uncertainty about climate change and the lack of availability of appropriate and relevant climate projections have been identified as key challenges that often limit the capacity to address climate change
issues at the project level. lack of readily accessible information has been identified as a key impediment to climate risk and vulnerability assessments, and to the design and implementation of effective adaptation responses.
As noted by the IPCC in its fifth assessment report, improved climate change projections in Asia and the Pacific, including characterizations of climate-related hazards such as floods, droughts, and tropical cyclones, are urgently needed to guide adaptation and resilience activities.
however, it is important to recognize that a greater availability of climate projections may not necessarily lead to better decision making without adequate support and capacity for their proper interpretation and use (as well as understanding of their limitations).40 while more data and information are of urgent necessity, capacity must also be in place to effectively use the information and facilitate decision making in a context of uncertainty.
The experience from the case studies on the use of various combinations of qualitative and quantitative methods for identifying climate risks and vulnerabilities shows the importance of a clear understanding of the appropriate use of climate models and projections as well as ability to make policy and investment decisions under an uncertain climate. This kind of capacity and expertise is currently in short supply throughout DMCs. A concerted effort needs to be made to address this important gap.

Experience and opportunities
75
41 The database hosts primary climate data as well as secondary and derived climate data. Primary climatic data include monthly precipitation, temperature, rainy days, solar radiation, wind speed, frost days, sunshine hours, and relative humidity. Secondary climatic data (e.g., heat index and water deficit) are derived from modeling. Sea level data are also stored in the database.
42 The consortium will be established with the support of RETA 8359: Regional Climate Projections Consortium and Data Facility in Asia and the Pacific. In the context of this project, the consortium will include Indonesia, the Philippines, and Thailand with the intent of expanding its geographic scope over time.
opportunity
ADB recognizes that the limited availability of scientifically credible climate information, and the lack of clarity and capacity for its interpretation and use, are strong impediments to the robust assessment of risks related to climate change, and to the design of effective adaptation and development projects.
Significant efforts are currently underway in a number of regional departments to increase their climate knowledge base. For example, the South Asia Department has assembled and continues to update a climate database of relevance to the region.41 The East Asia Department has also collated historical data and climate projections for selected provinces of the People’s Republic of China and Mongolia. The Central and west Asia Department has provided regional technical assistance to develop climate information in the region. These efforts by ADB’s operational departments should increasingly lead to a better understanding of projected climate change.
An additional important opportunity to address this significant limitation arises with the Climate Projections Consortium for Asia and the Pacific, a regional climate consortium and data facility currently being established with the support of ADB. The consortium engages the climate science community both within the region and internationally to make available a growing body of climate information and data products to support adaptation efforts.42
The consortium aims to lay a solid foundation for the development of regional public goods and services in the form of scientifically robust and decision-oriented climate data and projections in a cost-effective fashion. The consortium will develop and deliver decision-oriented climate data and projections, scenario analyses, targeted climate modeling, and model performance evaluation. The consortium will also maintain a compendium of CRVAs produced throughout the region with or without ADB support as well as other climate-related information of relevance.
outputs from the consortium should reduce the need for the production of climate change projections (selection of emissions scenarios, climate models, time scales, and resolution) on a project-by-project basis, a practice that has been commonly observed in recent years.
In addition to data and information, the consortium will provide thematic training, communications, and outreach to enhance the technical capacity of relevant agencies in DMCs as well as within ADB.
A key priority is to ensure access to simple, practical, and straightforward guidance and best practice approaches that can easily be implemented within the time and budget constraints that are normally experienced by project processing teams. This, together with the development of knowledge products and hands-on training for ADB staff and DMC partners, will help pave the way for mainstreaming CRVAs, which ADB is now mandated to implement.

76
Climate Proofing ADB Investment in the Transport Sector
box 8: survey responses to Changes in design standards and Practices
In a survey of transport officials in Asia (Regmi et al. 2011), respondents were asked if they agreed (yes or no) with 14 statements regarding suggested changes in design standards and practices. As shown below, a larger percentage of respondents answered “yes” to statements pertaining to addressing changes in precipitation and flood damages.
Percentage of Respondents Agreeing with Statement
Source: Regmi, M. and S. hanaoka. 2011. A Survey on Impacts of Climate Change on Road Transport Infrastructure and Adaptation Strategies in Asia. Environmental Economics and Policy Studies. 13. pp. 21–41.
Ensure e�ective drainage of surface water from pavementIncrease capacity of side drains
Estimate design flood and stormwater accounting for projected climateIncrease clearance above high flood level for bridges
Raise height of embankment in floodplains
Provide adequate slope protection works
Provide additional protection to coastal roadsIncrease capacity and size of culverts and cross drainage
Provide adequate river protection worksConsider increasing waterway and protection works to safeguard bridges
Place su�cient warning and information signs
Use thick and strong pavement to safeguard against frequent icing-thawingUse sti�er bitumen in pavement to safeguard from high temperature
Relocate coastal roads to higher areas
0 10 20 30 40 50 60 70
threat (Box 8). however, there is a significant degree of variation across GCM projections on precipitation, and projected changes in the frequency, intensity, and location of extreme weather events remain highly uncertain. Furthermore, unlike changes in temperature, which can be directly translated into impacts on infrastructure, the identification of the impacts of changes in precipitation will typically require the use of hydrological models (to estimate changes in water discharges that may result from changes in precipitation) and digital elevation data to configure the possible extent of flood areas.
The undertaking of a CRVA, especially when it involves increased precipitation and concerns about flood risks, requires time and resources that may not be available
Climate Risks and Vulnerabilities Identified
experience
Given the diverse nature and widespread geographic locations of the case studies across Asia and the Pacific, the nature of climate risk and vulnerability varied considerably, ranging from thawing permafrost to increasing storm surges (Table 18). Many of these are consistent with the findings of IPCC’s fifth assessment report discussed earlier. At least for the 11 case studies included in this report, increased precipitation and ensuing flood damages appear to be a recurrent
Experience and opportunities
77
within the regular scope of project preparation. The limited availability and predictability of resources has served as a disincentive to incorporating climate risk management in project activities.
opportunity
As a response to this experience, ADB recently established a funding mechanism through ADB’s Climate Change Fund that project teams can access to undertake the CRVA of an investment project. To be eligible for funding, the proposed CRVA must meet a number of eligibility criteria, including the following:
• An initial climate risk screening shows that the project is at medium or high risk from climate change.
• Project preparation is in the early phases and the CRVA is expected to inform project design.
• There is a demonstrated lack of adequate climate information in the project area.
• The project team is clearly committed to facilitating and actively supporting the undertaking of the CRVA study.
This financing window is currently expected to support the undertaking of up to 15 CRVAs by the end of 2015. Given that demand for technical support and funding outweighs supply, and in keeping with the strategic priority of scaling up support for climate adaptation expressed in the midterm review of Strategy 2020, it thus remains important to increase the volume of financing available for climate risk management and put in place flexible and innovative financing modalities to access internal as well as external resources in support of climate risk management.
The availability of this financing opportunity should allow project teams to explicitly incorporate terms of reference for climate specialists to ensure climate change risks are addressed at early stages of project development.
table 18: Climate risks and vulnerabilities
Project name identified exposure and vulnerabilitymain roads and bridges
Bhutan: South Asia Subregional Economic Cooperation Road Connectivity Project
Key climate risks for the project have been identified as projected increases in temperature and precipitation.
As a result of temperature increase, the asphalt pavement is likely to bleed. Regular thermal expansion and contraction will have significant impact on bridge structures.
Rainfall increase may lead to blockage of surface drains, damage to pavement surfaces, increase in slope failure and landslides, and damage to smaller bridges from flash floods.
Viet Nam: Central Mekong Delta Region Connectivity Project
The project was deemed vulnerable to projected increases in precipitation (with the ensuing increase in peak flood events) and sea level rise, which could limit navigation clearance under smaller bridges. A hydrological model was used to estimate changes in the extent of flooding and assess the impacts on connecting roads.
continued on next page
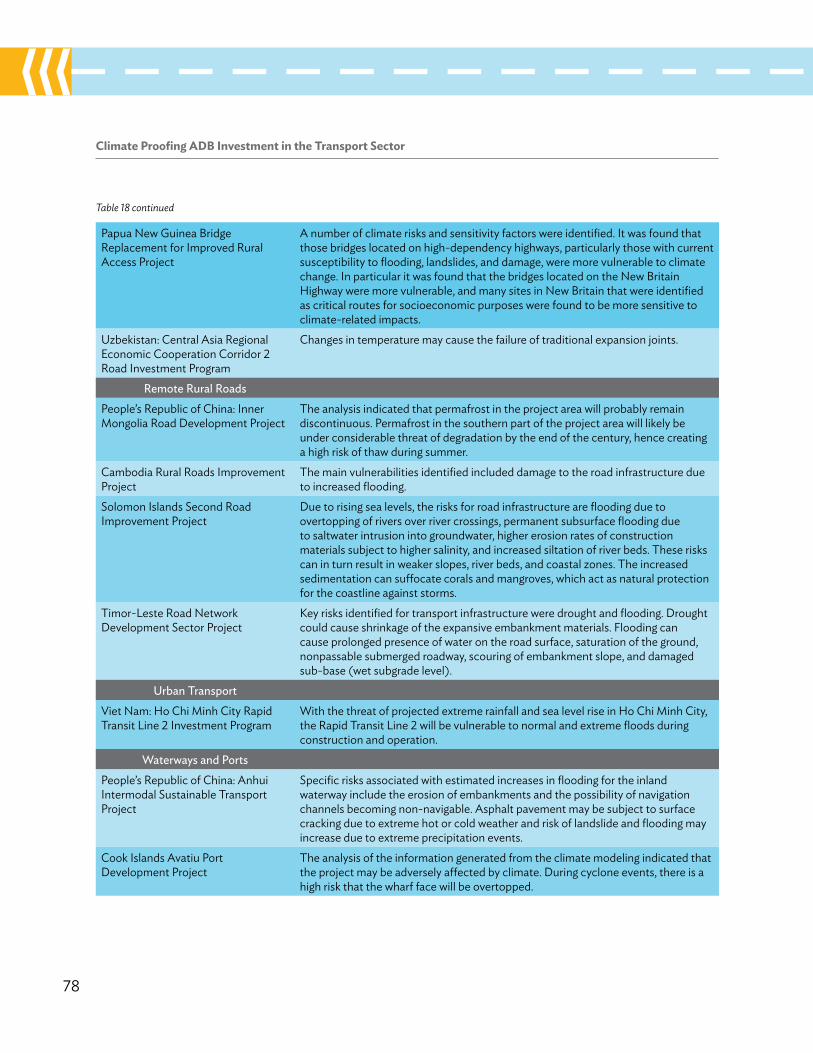
78
Climate Proofing ADB Investment in the Transport Sector
Papua New Guinea Bridge Replacement for Improved Rural Access Project
A number of climate risks and sensitivity factors were identified. It was found that those bridges located on high-dependency highways, particularly those with current susceptibility to flooding, landslides, and damage, were more vulnerable to climate change. In particular it was found that the bridges located on the New Britain highway were more vulnerable, and many sites in New Britain that were identified as critical routes for socioeconomic purposes were found to be more sensitive to climate-related impacts.
Uzbekistan: Central Asia Regional Economic Cooperation Corridor 2 Road Investment Program
Changes in temperature may cause the failure of traditional expansion joints.
remote rural roadsPeople’s Republic of China: Inner Mongolia Road Development Project
The analysis indicated that permafrost in the project area will probably remain discontinuous. Permafrost in the southern part of the project area will likely be under considerable threat of degradation by the end of the century, hence creating a high risk of thaw during summer.
Cambodia Rural Roads Improvement Project
The main vulnerabilities identified included damage to the road infrastructure due to increased flooding.
Solomon Islands Second Road Improvement Project
Due to rising sea levels, the risks for road infrastructure are flooding due to overtopping of rivers over river crossings, permanent subsurface flooding due to saltwater intrusion into groundwater, higher erosion rates of construction materials subject to higher salinity, and increased siltation of river beds. These risks can in turn result in weaker slopes, river beds, and coastal zones. The increased sedimentation can suffocate corals and mangroves, which act as natural protection for the coastline against storms.
Timor-leste Road Network Development Sector Project
Key risks identified for transport infrastructure were drought and flooding. Drought could cause shrinkage of the expansive embankment materials. Flooding can cause prolonged presence of water on the road surface, saturation of the ground, nonpassable submerged roadway, scouring of embankment slope, and damaged sub-base (wet subgrade level).
urban TransportViet Nam: ho Chi Minh City Rapid Transit line 2 Investment Program
with the threat of projected extreme rainfall and sea level rise in ho Chi Minh City, the Rapid Transit line 2 will be vulnerable to normal and extreme floods during construction and operation.
waterways and PortsPeople’s Republic of China: Anhui Intermodal Sustainable Transport Project
Specific risks associated with estimated increases in flooding for the inland waterway include the erosion of embankments and the possibility of navigation channels becoming non-navigable. Asphalt pavement may be subject to surface cracking due to extreme hot or cold weather and risk of landslide and flooding may increase due to extreme precipitation events.
Cook Islands Avatiu Port Development Project
The analysis of the information generated from the climate modeling indicated that the project may be adversely affected by climate. During cyclone events, there is a high risk that the wharf face will be overtopped.
Table 18 continued
Experience and opportunities
79
Analysis and Selection of Climate Proofing options
experience
In collaboration with other multilateral development banks, ADB has pursued the development and implementation of a common approach for reporting climate change adaptation financing. joint annual reports on adaptation finance have been prepared since 2011. In 2012 and 2013, 11 ADB projects included a total of $666.55 million of adaptation financing in the transport sector.
The CRVAs presented in this report generally indicate consideration of a large number of technically feasible climate proofing measures, including engineering approaches (such as improvements in concrete mix and the raising of bridges and embankments) and non-engineering approaches (such as road stabilization through planting trees or other vegetation). Table 19 summarizes climate adaptation measures adopted by the case studies presented in this report. It is evident that while the steps used to identify adaptation options were not necessarily followed exactly as given in the Guidelines for Climate Proofing Investment in the Transport Sector (Box 2), in general many of the case study projects did follow some of the key steps, such as Step 13 on identification of all potential adaptation options and Step 16 on prioritization and selection of adaptation options. Table 19 further highlights that in most instances, climate proofing measures of an engineering nature have received greater attention than measures of a nonengineering nature (such as ecosystem-based approaches to climate proofing). This may be indicative of a general difficulty of working across sectors (e.g., the replenishment of a denuded watershed—an activity that typically falls under the agriculture and natural resources sector—may be more
effective at improving climate resilience than climate proofing a rural road transport sector investment project).
The outcome of a CRVA may result in three different types of decisions: (i) climate proof now, (ii) make the project climate-ready, or (iii) do nothing.
Decision makers may elect to invest in climate proofing measure(s) at the time the project is being designed or implemented (climate proof now) under circumstances where any of the following applies:
• The costs of climate proofing now are estimated to be relatively small while the benefits (the avoided expected costs from not climate proofing), even though realized only under future climate change, are estimated to be very large. This is occasionally referred as a low-regret approach.
• The costs of climate proofing at a later point in time are expected to be prohibitive or climate proofing at a later point in time is technically not possible.
• Among the set of climate proofing options, one or more options deliver net positive economic benefits regardless of the nature and extent of climate change. Such options are occasionally referred as no-regret climate proofing options.
• The set of climate proofing options includes at least one option that not only reduces climate risks to the project, but also has other social, environmental, or economic benefits. Such options are occasionally referred as win-win climate proofing options.
Alternatively, decision makers may elect to invest minimally at the time of project design and implementation to ensure that the project can be

80
Climate Proofing ADB Investment in the Transport Sector
table 19: analysis and selection of adaptation options
Project name analysis and selection of adaptation options
main roads and bridgesBhutan: South Asia Subregional Economic Cooperation Road Connectivity Project
A number of adaptation options were identified for various components of the road project including improvements in the concrete mix for drainage structures and walls, in the design of masonry wall, the frequency of cross drainage structures, the size of hume pipes, and the design of drains and bridge protection walls.
Viet Nam: Central Mekong Delta Region Connectivity Project
For road embankments, the height was increased by 0.3 meters (m) for roads located in low-lying areas. For the long term (beyond 30 years), a recommendation was made for a second phase of adaptation as required as part of further maintenance and road upgrade. For minor bridges, an increase of 0.3 m was made to mitigate risks of submergence of the bridge bearings. For the other components, including the two major bridges, the existing designed structures were found to be resilient to climate change.
Papua New Guinea Bridge Replacement for Improved Rural Access Project
A number of adaptation measures were identified to address the risk of scouring, impacts from debris and logs, and flooding. however the measures were at a general level and further confirmation and identification of specific measures during the project concept and design stages were recommended.
Uzbekistan: Central Asia Regional Economic Cooperation Corridor 2 Road Investment Program
Plastic joint profiles made of ethylene-propylene-diene monomer (EPDM) rubber replaced traditional cement-concrete pavement joints
remote rural roadsPeople’s Republic of China: Inner Mongolia Road Development Project
The road upgrades that are proposed through this project have a design life of 25 years. Projections indicate that climate change impacts on permafrost are unlikely to be observed until the end of the century. It was recommended that the actual regional effects of climate change be monitored and taken into account in future planned major maintenance. If it becomes evident that projections do not reflect the actual situation then it be may be necessary to consider improving stability and drainage of road infrastructure during major maintenance. There may also be a need for an increased frequency of routine maintenance.
Cambodia Rural Roads Improvement Project
The engineering measures taken were elevation of the road in flood-prone areas and changing the selection of subgrade materials to withstand higher moisture content. Nonengineering measures include increasing the resilience of the road infrastructure through green planning and implementation of ecosystem-based adaptation strategies.
Solomon Islands Second Road Improvement Project
Specific climate adaptation measures included in the project are watercourse crossings designed to accept higher flood levels and debris loads, bridge abutments anchored to piled foundations to minimize collapse of abutments and approach roads, river training works to minimize the deviation of watercourses from their original paths, and strengthened protection of approach roads with additional protection and river training works.
Timor-leste Road Network Development Sector Project
Potential climate adaptation measures identified to mitigate the risks were replacement of embankment with suitable nonexpansive materials, use of flexible surface on pavement and shoulder, and removal of unsuitable ground materials.
continued on next page
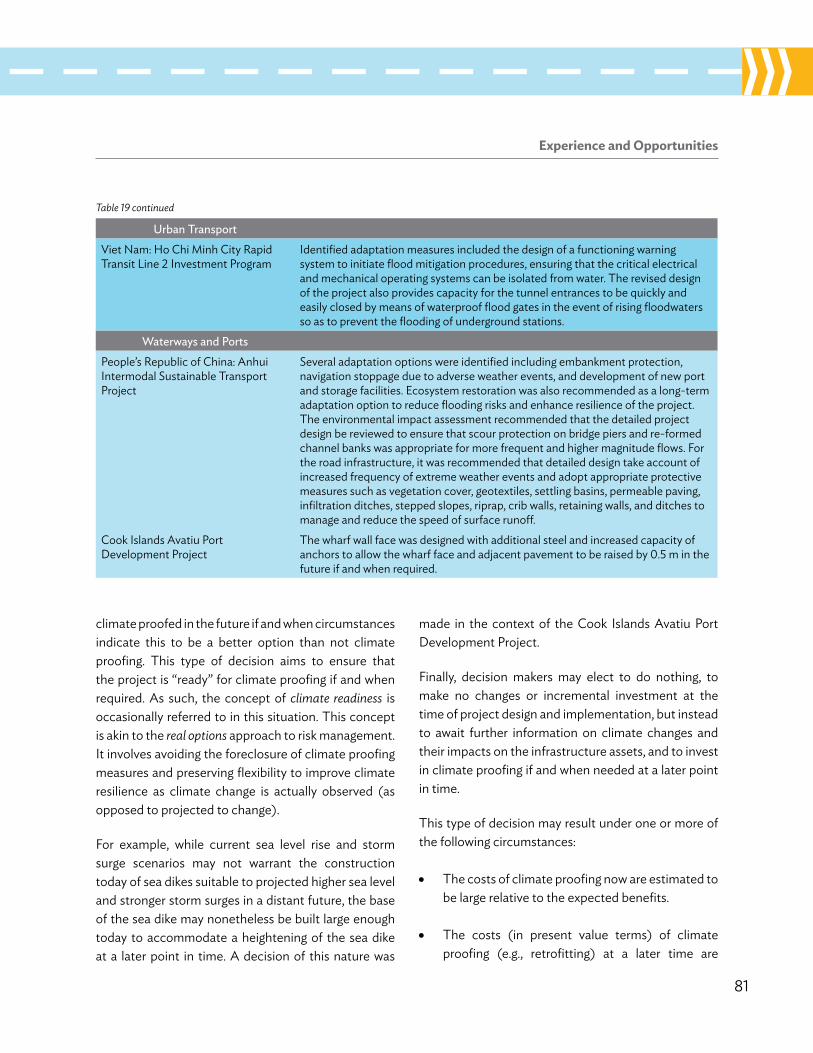
Experience and opportunities
81
climate proofed in the future if and when circumstances indicate this to be a better option than not climate proofing. This type of decision aims to ensure that the project is “ready” for climate proofing if and when required. As such, the concept of climate readiness is occasionally referred to in this situation. This concept is akin to the real options approach to risk management. It involves avoiding the foreclosure of climate proofing measures and preserving flexibility to improve climate resilience as climate change is actually observed (as opposed to projected to change).
For example, while current sea level rise and storm surge scenarios may not warrant the construction today of sea dikes suitable to projected higher sea level and stronger storm surges in a distant future, the base of the sea dike may nonetheless be built large enough today to accommodate a heightening of the sea dike at a later point in time. A decision of this nature was
made in the context of the Cook Islands Avatiu Port Development Project.
Finally, decision makers may elect to do nothing, to make no changes or incremental investment at the time of project design and implementation, but instead to await further information on climate changes and their impacts on the infrastructure assets, and to invest in climate proofing if and when needed at a later point in time.
This type of decision may result under one or more of the following circumstances:
• The costs of climate proofing now are estimated to be large relative to the expected benefits.
• The costs (in present value terms) of climate proofing (e.g., retrofitting) at a later time are
urban TransportViet Nam: ho Chi Minh City Rapid Transit line 2 Investment Program
Identified adaptation measures included the design of a functioning warning system to initiate flood mitigation procedures, ensuring that the critical electrical and mechanical operating systems can be isolated from water. The revised design of the project also provides capacity for the tunnel entrances to be quickly and easily closed by means of waterproof flood gates in the event of rising floodwaters so as to prevent the flooding of underground stations.
waterways and PortsPeople’s Republic of China: Anhui Intermodal Sustainable Transport Project
Several adaptation options were identified including embankment protection, navigation stoppage due to adverse weather events, and development of new port and storage facilities. Ecosystem restoration was also recommended as a long-term adaptation option to reduce flooding risks and enhance resilience of the project. The environmental impact assessment recommended that the detailed project design be reviewed to ensure that scour protection on bridge piers and re-formed channel banks was appropriate for more frequent and higher magnitude flows. For the road infrastructure, it was recommended that detailed design take account of increased frequency of extreme weather events and adopt appropriate protective measures such as vegetation cover, geotextiles, settling basins, permeable paving, infiltration ditches, stepped slopes, riprap, crib walls, retaining walls, and ditches to manage and reduce the speed of surface runoff.
Cook Islands Avatiu Port Development Project
The wharf wall face was designed with additional steel and increased capacity of anchors to allow the wharf face and adjacent pavement to be raised by 0.5 m in the future if and when required.
Table 19 continued

82
Climate Proofing ADB Investment in the Transport Sector
expected to be no larger than climate proofing now.
• The expected benefits of climate proofing are estimated to be relatively small.
The last two types of decisions are akin to an adaptive management approach, which consists of monitoring changes in climate and putting in place climate proofing measures over the project’s lifetime as changes and their impacts are observed. Key to both types of decisions is to ensure that appropriate data and information are collected.
Each of the above types of decisions has been observed in the CRVAs presented in this report (Table 20).
In the context of the process leading to the selection of a specific climate proofing decision, the economic analysis of climate proofing measures has typically played a minor role.
For the projects presented in this report, the cost of adaptation ranged between 0.5% and 8.7% of total project cost, with an average of 4.6% and a median of 4.8% (Table 21). while this information is certainly of interest, a complete economic analysis of climate proofing measure(s) (Box 2, Step 15) requires (i) an estimate of the expected benefits of climate proofing and (ii) a computation of the net present value of the climate proofing measure(s). Economic efficiency would indicate that a climate proofing measure should be implemented only if its expected net present value
table 20: types of Climate Proofing decision
climate Proof now
make Project climate ready do nothing
main roads and bridgesBhutan: South Asia Subregional Economic Cooperation Road Connectivity Project
√
Viet Nam: Central Mekong Delta Region Connectivity Project √a √b
Papua New Guinea Bridge Replacement for Improved Rural Access Project
√
Uzbekistan: Central Asia Regional Economic Cooperation Corridor 2 Road Investment Program
√
remote rural roadsInner Mongolia Road Development Project √
Cambodia Rural Roads Improvement Project √
Solomon Islands Second Road Improvement Project √
Timor-leste Road Network Development Sector Project √
urban TransportViet Nam: ho Chi Minh City Rapid Transit line 2 Investment Program
√
waterways and PortsAnhui Intermodal Sustainable Transport Project √
Cook Islands Avatiu Port Development Project √a connecting road; b major bridges
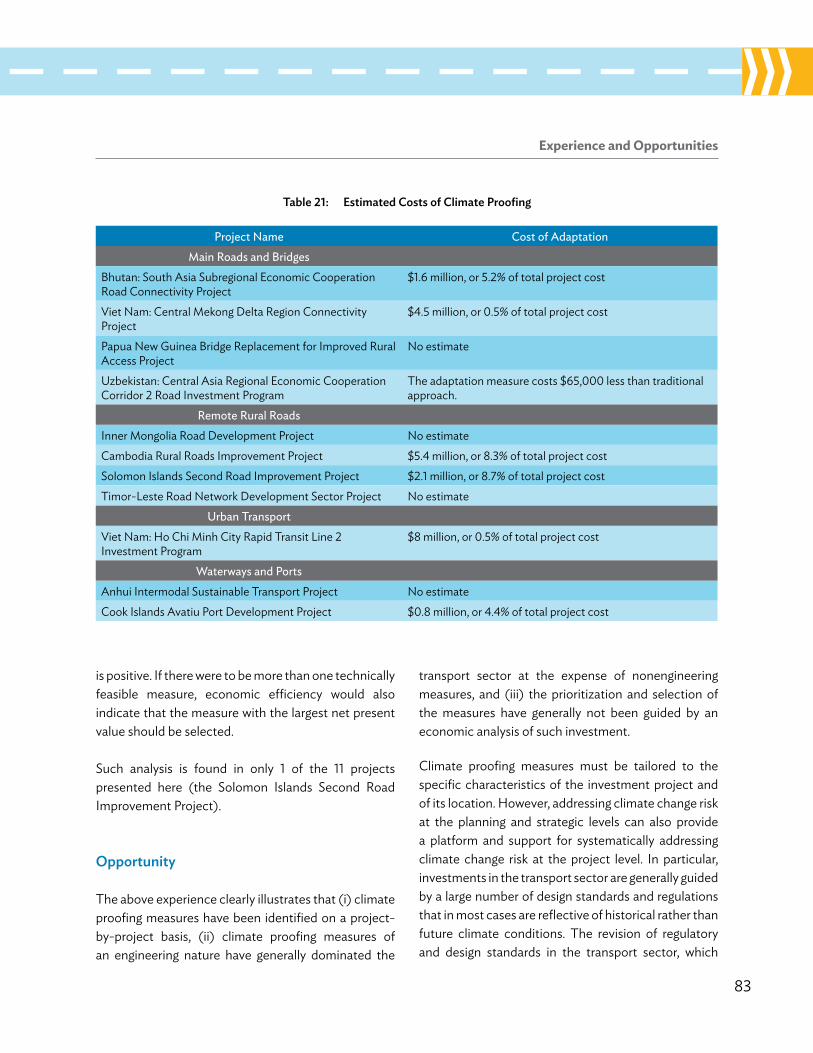
Experience and opportunities
83
is positive. If there were to be more than one technically feasible measure, economic efficiency would also indicate that the measure with the largest net present value should be selected.
Such analysis is found in only 1 of the 11 projects presented here (the Solomon Islands Second Road Improvement Project).
opportunity
The above experience clearly illustrates that (i) climate proofing measures have been identified on a project-by-project basis, (ii) climate proofing measures of an engineering nature have generally dominated the
table 21: estimated Costs of Climate Proofing
Project name cost of adaptation main roads and bridges
Bhutan: South Asia Subregional Economic Cooperation Road Connectivity Project
$1.6 million, or 5.2% of total project cost
Viet Nam: Central Mekong Delta Region Connectivity Project
$4.5 million, or 0.5% of total project cost
Papua New Guinea Bridge Replacement for Improved Rural Access Project
No estimate
Uzbekistan: Central Asia Regional Economic Cooperation Corridor 2 Road Investment Program
The adaptation measure costs $65,000 less than traditional approach.
remote rural roadsInner Mongolia Road Development Project No estimateCambodia Rural Roads Improvement Project $5.4 million, or 8.3% of total project costSolomon Islands Second Road Improvement Project $2.1 million, or 8.7% of total project costTimor-leste Road Network Development Sector Project No estimate
urban TransportViet Nam: ho Chi Minh City Rapid Transit line 2 Investment Program
$8 million, or 0.5% of total project cost
waterways and PortsAnhui Intermodal Sustainable Transport Project No estimateCook Islands Avatiu Port Development Project $0.8 million, or 4.4% of total project cost
transport sector at the expense of nonengineering measures, and (iii) the prioritization and selection of the measures have generally not been guided by an economic analysis of such investment.
Climate proofing measures must be tailored to the specific characteristics of the investment project and of its location. however, addressing climate change risk at the planning and strategic levels can also provide a platform and support for systematically addressing climate change risk at the project level. In particular, investments in the transport sector are generally guided by a large number of design standards and regulations that in most cases are reflective of historical rather than future climate conditions. The revision of regulatory and design standards in the transport sector, which
84
Climate Proofing ADB Investment in the Transport Sector
could not take place on a project-by-project basis, may significantly enhance the resilience of transport sector investments to climate change. ongoing dialogue with national transport sector stakeholders offers an opportunity to initiate such revision.
Perhaps as a result of the long expertise accumulated in the sector including the traditional makeup of project preparation teams, engineering climate proofing measures have clearly received a greater level of attention. however, in a number of circumstances, technically feasible and economically efficient measures may lie beyond engineering measures (such as addressing unsustainable land use practices in an upstream watershed). The preparation of terms of Reference at early stages of project development offers an important opportunity to emphasize the need for cross-sectoral approaches to adaptation where the nature of climate proofing measures may extend beyond the limited confines of any given sector.
Finally, economic efficiency recommends that climate proofing be implemented if the net present value of the project with climate proofing is larger than without climate proofing, even if climate proofing involves higher capital cost. In circumstances where multiple climate proofing measures are available, the same efficiency criterion recommends that the measures yielding the largest net present value be selected. Economic analysis has generally not guided decisions pertaining to climate proofing investment projects.
It is generally recognized that economic efficiency (as measured by a project’s net present value) is not (and should not be) the only criterion guiding decision-making processes pertaining to investment projects and that a multicriteria approach should be pursued. This is implicitly recognized in ADB’s guidelines for the
conduct of economic analysis, which specifically states that projects with an economic internal rate of return of less than 12% (but higher than 10%) be accepted provided that the presence of additional unvalued benefits can be demonstrated, and that these unvalued benefits are expected to exceed unvalued costs.
The Sustainable Transport Appraisal Rating (STAR) framework developed by ADB’s Transport Community of Practice was conceived as the first step in developing a broader multicriteria appraisal framework to measure the performance of a project or investment program against sustainable transport objectives to monitor progressive changes in the portfolio in line with the objectives of the STI-oP, and to contribute to the common assessment and reporting framework developed by the Multilateral Development Bank working Group on Sustainable Transport. The environmental objectives include a subcriterion on improvement of climate resilience of the transport system.43 The projects and programs included in the 2012 and 2013 transport portfolios were assessed against the STAR rating. In 2012, 12 out of 24 transport projects and programs approved that year scored positively (more than 1 on a 7 point scale of –3 to +3) against the climate resilience subcriterion. In 2013, 15 out of 22 transport projects and programs approved that year scored positively against the climate resilience subcriteria. (2013 results are tentative as scores are still being calibrated).
however, a multicriteria analysis does not aim to replace but rather to augment economic efficiency with additional criteria. As such, economic efficiency does remain an important criterion for project appraisal. It would thus be suggested that climate proofing measures be implemented only if such investment were to yield an economic rate of return of 12%, or of at
43 In the STAR appraisal framework, the climate resilience objective is defined as “improving the resilience of the transport system to impacts of climate change, including climate variability and extreme weather events.”
Experience and opportunities
85
least 10% if unvalued benefits of such investment are expected to outweigh the incremental costs.
ADB is currently finalizing guidelines on the conduct of economic analyses of climate proofing investment projects, and is also reviewing its guidelines for the economic analysis of projects (ADB 1997). These documents, accompanied by adequate training and
capacity building, offer an important opportunity to increase the understanding of cost–benefit analysis of investment projects in a context of risk and uncertainty introduced by climate change. Such improved understanding will support a constructive dialogue between ADB and its DMCs conducive to the adoption of climate proofing measures and ensuring the climate resilience of investment projects.

86
ConCluding remarks
The fifth assessment report of the IPCC concludes that even if decisive mitigation actions were to be implemented in the very
short term and greenhouse gas concentrations were to stabilize at existing levels, global warming will continue to unfold for decades to come.44 Climate change outcomes for the next 30 years or so do not significantly vary across emissions scenarios. Global mean surface temperature for the period 2016–2035 is likely to be 1.0°C to 1.5°C above the mean relative to the period 1850–1900, and projections of sea level rise range between 0.4 and 0.7 meters by 2100. Due to its vast and varied geography as well as being home to the largest population of the poor and vulnerable, Asia and the Pacific is at high risk from climate change and will experience climate-related impacts perhaps more than any other region.
In this context, ADB’s commitment to supporting climate change adaptation in its DMCs, and ensuring the climate resilience of its transport investments, will continue to be of particular importance.
The experiences documented in this report clearly show that the transport sector has made substantial progress with the systematic integration of climate change adaption measures in investment projects as committed to in the STI-oP. The midterm review of Strategy 2020 confirms that climate-resilient development is a core component of the long-term strategic framework of ADB. Considering that transport comprises about a third of ADB investments, progress under the sector also advances the bank’s strategic objectives to respond to climate change.
The CRVAs presented in this report, while covering only a subset of all CRVAs conducted in ADB across all sectors over recent years, clearly highlight that such assessment
• can be undertaken within a reasonable time frame and with limited resources;45
• provides a more comprehensive understanding of how an investment project may be affected by projected changes in key climate parameters;
44 This is generally referred to as climate change commitment. Plattner et al. (2009) and Solomon et al. (2009) show that increases in atmospheric temperature resulting from existing increases in carbon dioxide concentration are largely irreversible up to 1,000 years after emissions stop. Similarly, sea level will continue to rise for the forthcoming several centuries even if aggressive greenhouse gas mitigation were adopted and enforced (leverman et al. 2013 and Meehl et al. 2012).
45 The CRVAs presented in this report required between approximately 2 and 8 person-months and cost between $35,000 and $250,000. The recent allocation made available by the Climate Change Fund to facilitate the mainstreaming of CRVAs has assumed a unit cost between $100,000 and $200,000.
Concluding Remarks
87
• highlights that in most cases, a large menu of climate proofing measures, both engineering and nonengineering, is available to increase the climate resilience of an investment project, and that it generally does not imply significant changes to project design; and
• indicates that while adaptation to climate change is not cost-neutral, it also needs not be excessively costly.
Challenges due to inadequate information, capacity, and resources have certainly been encountered. The financing of the CRVAs have often been challenging and capacity and resource constraints have often been faced when recommending the introduction of climate proofing measures to borrowing governments. In particular, while 8 of the 11 case studies presented in this report pertain to roads and bridges, STI-oP aims to refocus ADB’s support in the transport sector to urban transport and intercity rail, two transport subsectors for which experience conducting CRVAs
remains limited. Further tools and capacity building efforts should aim to align the capacity to conduct CRVAs with the specific characteristics of the prioritized subsectors.
Some of these challenges are currently being addressed by ADB in close collaboration with its DMCs and other development partners. Partnerships with other multilateral development banks are of particular importance to articulate the case for consistency in climate risk management in a manner that does not alienate DMCs.
There are certainly many opportunities ahead with increased allocation of resources and increased focus on capacity building in this area. ADB is committed to scale up support for climate risk management in its portfolio of investment projects for the greater benefit of its DMCs. The key challenges and opportunities identified through this review provide direction for future efforts to further mainstream climate management in investment projects.

88
reFerenCes
Asian Development Bank (ADB). 2005. Climate Proofing: A Risk-Based Approach to Adaptation. Manila.
_____.2008a. Strategy 2020: The Long-Term Strategic Framework of the Asian Development Bank 2008–2020. Manila.
_____. 2008b. Report and Recommendation of the President to the Board of Directors: Proposed Loan to the Cook Islands for the Avatiu Port Development Project. Manila.
_____. 2009. Mainstreaming Climate Change in ADB Operations: Climate Change Implementation Plan for the Pacific (2009–2015). Manila.
_____. 2010a. Addressing Climate Change in Asia and the Pacific: Priorities for Action. Manila.
_____. 2010b. Sustainable Transport Initiative Operational Plan. Manila.
_____. 2010c. Report and Recommendation of the President to the Board of Directors: Proposed Loan to the Kingdom of Cambodia for the Rural Roads Improvement Project. Manila.
_____. 2010d. Ho Chi Minh City Adaptation to Climate Change. Manila.
_____. 2011a. Guidelines for Climate Proofing Investment in the Transport Sector: Road Infrastructure Projects. Manila.
_____. 2011b. Report and Recommendation of the President to the Board of Directors: Proposed Supplementary Loan to the Cook Islands for the Avatiu Port Development Project. Manila.
_____. 2011c. Community-Based Climate Vulnerability Assessment and Adaptation Planning: A Cook Islands Pilot Project. Manila.
_____. 2013. Environment Operational Directions 2013–2020: Promoting Transitions to Green Growth in Asia and the Pacific. Manila
_____. 2014a. Midterm Review of Strategy 2020: Meeting the Challenges of a Transforming Asia and Pacific. Manila.
_____. 2014b. Operational Plan for Integrated Disaster Risk Management 2014–2020. Manila.
_____. Forthcoming. On the Economics of Climate-Proofing Investment Projects. Manila. Publication in progress.
Balk, D., et al. 2009. Mapping urban settlements and the risks of climate change in Africa, Asia, and South America. In j.M. Guzman et al., eds. Population Dynamics and Climate Change. United Nations Fund for Population Activities, International Institute for Environment and Development. New york.
Balk, D., M. Montgomery, and Z. liu. 2012. Urbanization and Climate Change Hazards in Asia. Mimeo. Manila: ADB.

References
89
Bhutan Department of Roads. 2014. SASEC Road Connectivity Project Nganglam–Dewathang Highway: Environmental Impact Assessment. Ministry of works and human Settlement. Thimpu: Government of Bhutan.
Brecht, h., et al. 2012. Sea-level Rise and Storm Surges: high Stakes for a Small Number of Developing Countries. Journal of Environment and Development. 21(1). pp. 120–138.
Cai, x., et al. 2009. Assessing the Regional Variability of GCM Simulations. Geophysical Research Letters. 36: l02706, doi:10.1029/2008Gl036443.
Chinowsky, P., et al. 2012. Road Infrastructure and Climate Change in Viet Nam. United Nations University and world Institute for Development Economics Research. working Paper No. 2012/80. helsinki: UNU-wIDER.
Dasgupta, S., et al. 2009. The Impact of Sea-level Rise in Developing Countries: A Comparative Analysis. Climatic Change. 93(3). pp. 379–388.
Dasgupta, S., et al. 2011. Exposure of Developing Countries to Sea-level Rise and Storm Surges. Climatic Change. 106. pp. 567–579.
Eastham, j., et al. 2008. Mekong River Basin Water Resources Assessment: Impacts of Climate Change. Victoria: The Commonwealth Scientific and Industrial Research organisation (CSIRo).
Government of the Cook Islands. 2012. Joint National Action Plan for Disaster Risk Management and Climate Change Adaptation: 2011–2015. Cook Islands.
Government of Timor-leste, Ministry of Infrastructure. 2009. Volume III. Climate Change Assessment. Dili.
Government of Viet Nam, Ministry of Natural Resources and Environment. 2010. Impacts of Climate Change on Water Resources and Adaptation Measures. Final Report. Institute
of Meteorology, hydrology and Environment. ha Noi.
Intergovernmental Panel on Climate Change (IPPC). 2000. Special Report on Emissions Scenarios. Geneva.
_____. 2013. Climate Change 2013: The Physical Science Basis. Contribution of working Group I to the Fifth Assessment Report of the Intergovernmental Panel on Climate Change. Cambridge: Cambridge University Press.
_____. 2014. Climate Change 2014: Impacts, Adaptation and Vulnerability. Contribution of working Group II to the Fifth Assessment Report of the Intergovernmental Panel on Climate Change. Cambridge: Cambridge University Press.
International Centre for Integrated Mountain Development (ICIMoD). 2010. Climate Change Impacts and Vulnerability in the Eastern Himalayas. Technical Report 5. Kathmandu.
jubb, I., P. Canadell, and M. Dix. Undated. Representative Concentration Pathways (RCPs). Australian Climate Change Science Program. Canberra: Government of Australia and CSIRo.
Klene A., et al. 2001. The N-Factor in Natural landscape: Variability of Air and Soil-Surface Temperatures, Kurauk River Basin, Alaska, USA. Arctic, Antarctic and Alpine Research. 33(2). pp. 140–182.
Knutson, T., et al. 2010. Tropical Cyclones and Climate Change. Nature Geoscience. 3. pp. 157–163.
Kossin, j., K. Emanuel, and G. Vecchi. 2014. The Poleward Migration of the location of Tropical Cyclone Maximum Intensity. Nature. 509. pp. 349–352.
leverman, A., et al. 2013. The Multimillenial Sea-level Commitment of Global warming. Proceedings of the National Academy of Sciences (USA). 110. pp. 13745–13750.
References
90
McGranahan, G., D. Balk, and B. Anderson. 2007. The Rising Tide: Assessing the Risks of Climate Change to human Settlements in low-Elevation Coastal Zones. Environment and Urbanization. 19(1). pp. 17–37.
McSweeney, C., M. New, and G. lizcano. 2010. UNDP Climate Change Country Profiles: Cambodia. Phnom Penh: United Nations Development Programme.
Meehl, G., et al. 2012. Relative outcomes of Climate Change Mitigation Related to Global Temperature Versus Sea-level Rise. Nature Climate Change. 2. pp. 576–580.
National Environment Commission of Bhutan (NEC). 2011. Climate Change: Vulnerability and Adaptation Assessment Volume 1: Technical Paper. Second National Communication from Bhutan to the United Nations Framework Convention on Climate Change. Thimpu: Government of Bhutan.
Nicholls, R., and A. Cazenave. 2010. Sea level Rise and Its Impact on Coastal Zones. Science. 328n(5985). pp. 1517–1520.
Nicholls, R., S. hanson, and j. hickel. 2013. Cost of Adaptation to Rising Coastal Water Levels for the People’s Republic of China, Japan, and the Republic of Korea. Manila: ADB.
lu, N., et al. 2009. Climate Change in Inner Mongolia from 1955 to 2005—Trends at Regional, Biome, and local Scales. Environmental Research Letters. 4. doi:10.1088/1748-9326/4/4/045006.
Plattner, G., et al. 2008. long-Term Climate Commitments Projected with Climate-Carbon Cycle Models. Journal of Climate. 21(12). pp. 2721–51.
Regmi, M., and S. hanaoka. 2011. A Survey on Impacts of Climate Change on Road Transport Infrastructure and Adaptation Strategies in Asia. Environmental Economics and Policy Studies. 13. pp. 21–41.
Smith, M., and D. Riseborough. 2002. Climate and the limits of Permafrost: A Zonal Analysis. Permafrost and Periglacial Processes. 13. pp. 1–15.
Solomon, S., et al. 2009. Irreversible Climate Change Due to Carbon Dioxide Emissions. Proceedings of the National Academy of Sciences (USA). 106(6). pp. 1704–09.
Taylor, K., R. Stouffer, and G. Meehl. 2012. An overview of CMIP5 and the Experiment Design. Bulletin of the American Meteorological Society. 93. pp. 485–498.
van Vuuren, D., et al. 2011. The Representative Concentration Pathways: An overview. Climatic Change. 109. pp. 5–31.
Veron-okamoto, A., and K. Sakamoto. 2014. Toward a Sustainability Appraisal Framework for Transport. ADB Sustainable Development Working Paper Series. No. 31. Manila: ADB.
ye, w., and y. li. 2011. A Method of Applying Daily GCM outputs in Assessing Climate Change Impact on Multiple Day Extreme Precipitation for Brisbane River Catchment, MoDSIM11. In wongsosaputro, j., et al. 2011. Testing for structural breaks in discrete choice models. In Chan, F., Marinova, D. and Anderssen, R.S. eds. MoDSIM2011, 19th International Congress on Modelling and Simulation. Modelling and Simulation Society of Australia and New Zealand, December 2011, pp. 1652-1658. www.mssanz.org.au/modsim2011/D10/wongsosaputro.pdf
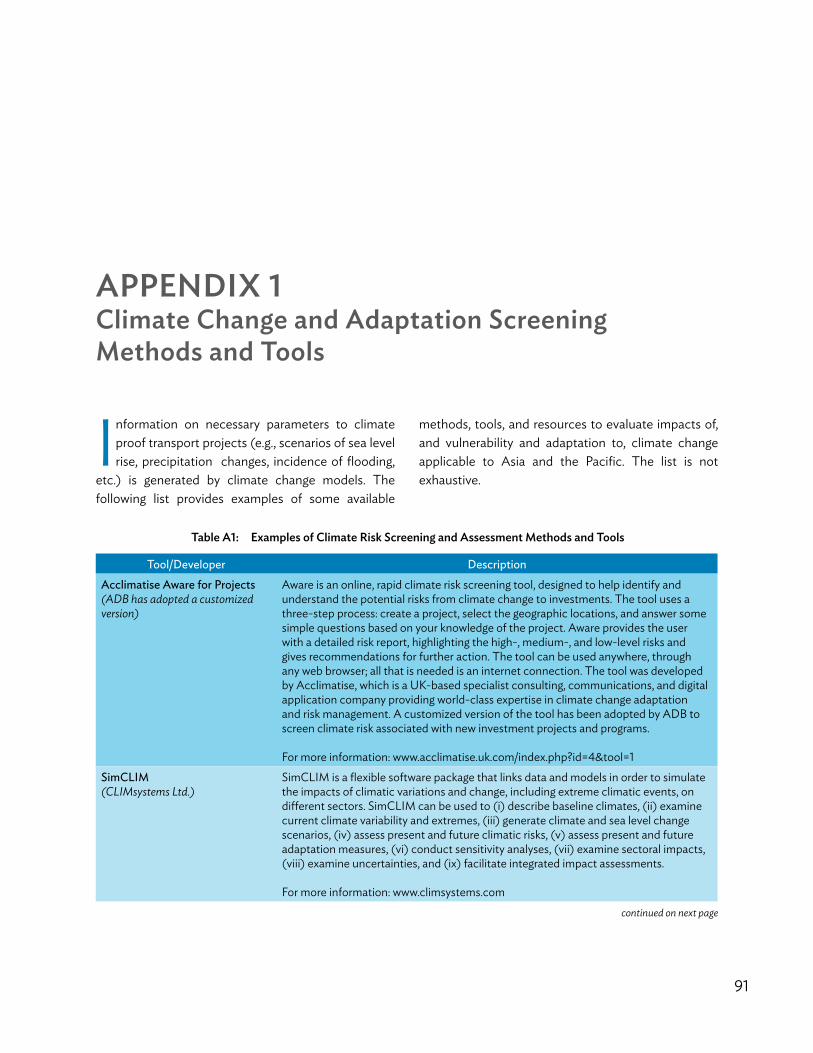
91
aPPendix 1 Climate Change and adaptation screening methods and tools
Information on necessary parameters to climate proof transport projects (e.g., scenarios of sea level rise, precipitation changes, incidence of flooding,
etc.) is generated by climate change models. The following list provides examples of some available
methods, tools, and resources to evaluate impacts of, and vulnerability and adaptation to, climate change applicable to Asia and the Pacific. The list is not exhaustive.
Tool/developer descriptionacclimatise aware for Projects(ADB has adopted a customized version)
Aware is an online, rapid climate risk screening tool, designed to help identify and understand the potential risks from climate change to investments. The tool uses a three-step process: create a project, select the geographic locations, and answer some simple questions based on your knowledge of the project. Aware provides the user with a detailed risk report, highlighting the high-, medium-, and low-level risks and gives recommendations for further action. The tool can be used anywhere, through any web browser; all that is needed is an internet connection. The tool was developed by Acclimatise, which is a UK-based specialist consulting, communications, and digital application company providing world-class expertise in climate change adaptation and risk management. A customized version of the tool has been adopted by ADB to screen climate risk associated with new investment projects and programs.
For more information: www.acclimatise.uk.com/index.php?id=4&tool=1 simclim (CLIMsystems Ltd.)
SimClIM is a flexible software package that links data and models in order to simulate the impacts of climatic variations and change, including extreme climatic events, on different sectors. SimClIM can be used to (i) describe baseline climates, (ii) examine current climate variability and extremes, (iii) generate climate and sea level change scenarios, (iv) assess present and future climatic risks, (v) assess present and future adaptation measures, (vi) conduct sensitivity analyses, (vii) examine sectoral impacts, (viii) examine uncertainties, and (ix) facilitate integrated impact assessments.
For more information: www.climsystems.comcontinued on next page
table a1: examples of Climate risk screening and assessment methods and tools

Appendix 1
92
Tool/developer descriptionclimate adaptation Tool (caT)(University of East Anglia, Norfolk County Council and Norfolk Climate Change Partnership)
CAT is a structured three-step practical tool for (i) identifying and prioritizing climate risks, (ii) identifying and appraising adaptation options, and (iii) auditing the performance of implemented options. It was originally designed to support adaptive decision making in UK-based organizations. CAT supports or yields several key outputs: (i) climate risk identification, (ii) climate risk prioritization, (iii) adaptation option identification, (iv) adaptation option appraisal, and (v) adaptation option audit. The scope of the CAT is very broad, applying to all organizations at different levels and all climate risks.
For more information: http://unfccc.int/adaptation/knowledge_resources/databases/items/7723.php
assessments of impacts and adaptations to climate change in multiple regions and sectors (aiacc)(UNEP/WMO/IPCC)
AIACC is a global initiative to advance scientific understanding of climate change vulnerabilities and adaptation options in developing countries. AIACC aims to fill gaps in the current understanding of vulnerability and opportunities for adaptation by funding, training, and mentoring developing country scientists to undertake multisector, multicountry research of priority to developing countries. There are 24 AIACC studies funded to date, which can be used as a source of lessons concerning the process of assessing vulnerability and adaptation options in particular sectors and regions.
For more information: http://www.start.org/Projects/AIACC_Project/aiacc.htmlclimate change data Portal (World Bank)
The Climate Change Data Portal provides an entry point for access to climate-related data and tools. The portal provides comprehensive global and country data information related to climate change and development. The platform can be tailor-made and includes spatial data sets as it intends to serve as a common platform and flexible network to collect, integrate, and display information relevant to climate change at the global scale. The CC Data Portal has also been used for capacity building and learning purposes related to the integration of adaptation to climate change into development plans.
For more information: http://sdwebx.worldbank.org/climateportal/doc/Cliamte_change_Portal_USERsMANUAl.pdf
climate analysis indicators Tool—caiT 2.0(WRI)
CAIT 2.0 provides free access to comprehensive, reliable, and comparable greenhouse gas emissions data sets, as well as other climate-relevant indicators (e.g. climate technology data), to enable analysis on a wide range of climate-related data questions. The tool permits manipulation on a country-by-country basis. CAIT 2.0 country and United States state emissions data applies a consistent methodology to create a six-gas, multisector, and internationally comparable data set for 186 countries and all US states.
For more information: http://cait2.wri.org/wri
Table A1 continued
continued on next page
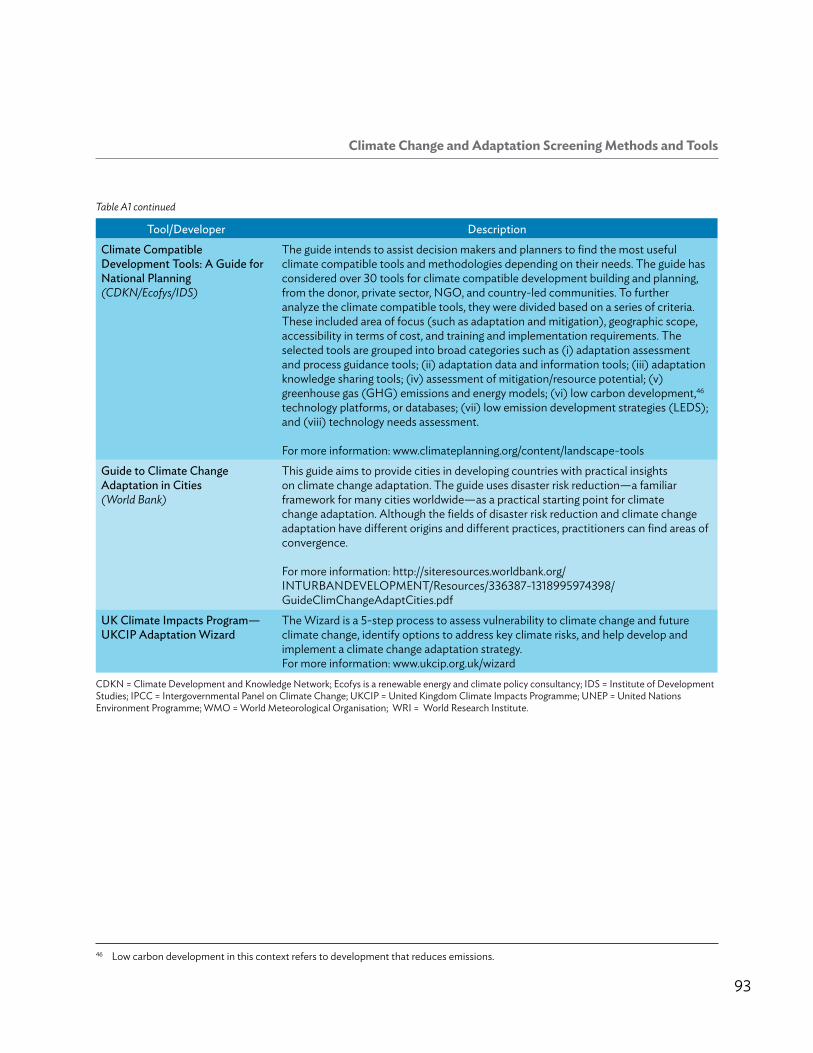
Climate Change and Adaptation Screening Methods and Tools
93
Tool/developer descriptionclimate compatible development Tools: a guide for national Planning(CDKN/Ecofys/IDS)
The guide intends to assist decision makers and planners to find the most useful climate compatible tools and methodologies depending on their needs. The guide has considered over 30 tools for climate compatible development building and planning, from the donor, private sector, NGo, and country-led communities. To further analyze the climate compatible tools, they were divided based on a series of criteria. These included area of focus (such as adaptation and mitigation), geographic scope, accessibility in terms of cost, and training and implementation requirements. The selected tools are grouped into broad categories such as (i) adaptation assessment and process guidance tools; (ii) adaptation data and information tools; (iii) adaptation knowledge sharing tools; (iv) assessment of mitigation/resource potential; (v) greenhouse gas (GhG) emissions and energy models; (vi) low carbon development,46 technology platforms, or databases; (vii) low emission development strategies (lEDS); and (viii) technology needs assessment.
For more information: www.climateplanning.org/content/landscape-toolsguide to climate change adaptation in cities(World Bank)
This guide aims to provide cities in developing countries with practical insights on climate change adaptation. The guide uses disaster risk reduction—a familiar framework for many cities worldwide—as a practical starting point for climate change adaptation. Although the fields of disaster risk reduction and climate change adaptation have different origins and different practices, practitioners can find areas of convergence.
For more information: http://siteresources.worldbank.org/INTURBANDEVEloPMENT/Resources/336387-1318995974398/GuideClimChangeAdaptCities.pdf
uk climate impacts Program—ukciP adaptation wizard
The wizard is a 5-step process to assess vulnerability to climate change and future climate change, identify options to address key climate risks, and help develop and implement a climate change adaptation strategy. For more information: www.ukcip.org.uk/wizard
CDKN = Climate Development and Knowledge Network; Ecofys is a renewable energy and climate policy consultancy; IDS = Institute of Development Studies; IPCC = Intergovernmental Panel on Climate Change; UKCIP = United Kingdom Climate Impacts Programme; UNEP = United Nations Environment Programme; wMo = world Meteorological organisation; wRI = world Research Institute.
46 low carbon development in this context refers to development that reduces emissions.
Table A1 continued
94
aPPendix 2draft technical guidance note for integrating Climate Change in road transport infrastructure development in viet nam
A. Need for Technical Guidance for Integrating Climate Change in Road Transport Infrastructure Development in Viet NamA number of national policies and programs have been approved to provide concrete legislation frameworks for climate change responding actions, such as the National Climate Change Strategy approved in December 2011, the National Target Program to Respond to Climate Change 2012–2015 approved in october 2012, and the Viet Nam National Green Growth Strategy approved in September 2012
Recognizing the significant role of the transport sector in greenhouse gas emissions and the resulting increased climate change, as well as potential risks of climate change to the safe, efficient, and sustainable operation of the transport system, the Ministry of Transport developed and implemented the Action Plan to Respond to Climate Change in 2011–2015, of which an important task is “to integrate/mainstream climate change considerations in transportation infrastructure
development strategies, planning, plans, programs and projects, and refine and finalize the sector’s system of technical standards and norms.”
At present, integration of climate change in the process of project planning, design, and implementation in Viet Nam still is inconsistent and relatively ad hoc, due to the weak capacity of involved partners as well as a lack of official guidance from government agencies. Awareness and attitudes of policy makers about mainstreaming climate change into sector planning is limited. Sector climate change response plans are more of a formality, and tend to lack consistent technical analysis. Experts and consultants involved in the process of project planning, design, and implementation have limited knowledge, capacity, and experiences related to the identification of climate change impacts and adaptation and mitigation options. There is no available guideline for integrating climate change in the process of sector program and project development.
In order to meet the demand for improving capacity for integrating climate change into transport programs and projects, in 2013 the Viet Nam Resident Mission, in cooperation with the Transport Development and Strategy Institute, developed the Technical
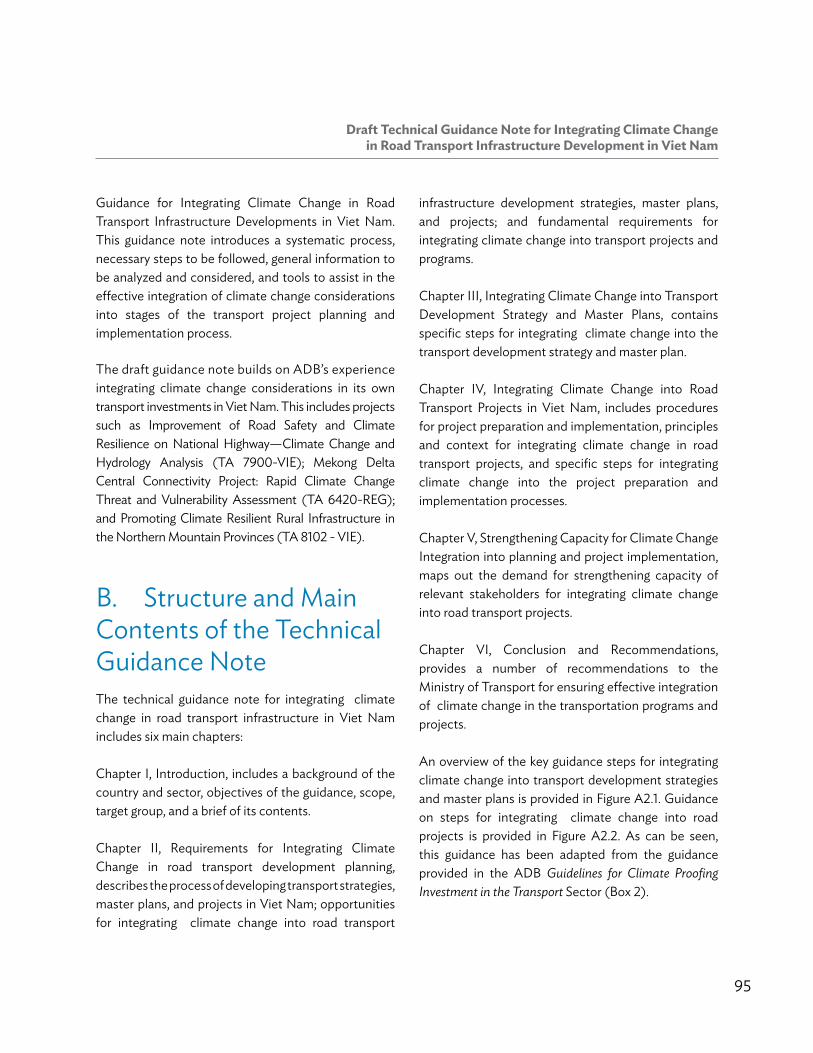
Draft Technical guidance note for Integrating Climate Change in Road Transport Infrastructure Development in Viet nam
95
Guidance for Integrating Climate Change in Road Transport Infrastructure Developments in Viet Nam. This guidance note introduces a systematic process, necessary steps to be followed, general information to be analyzed and considered, and tools to assist in the effective integration of climate change considerations into stages of the transport project planning and implementation process.
The draft guidance note builds on ADB’s experience integrating climate change considerations in its own transport investments in Viet Nam. This includes projects such as Improvement of Road Safety and Climate Resilience on National highway—Climate Change and hydrology Analysis (TA 7900-VIE); Mekong Delta Central Connectivity Project: Rapid Climate Change Threat and Vulnerability Assessment (TA 6420-REG); and Promoting Climate Resilient Rural Infrastructure in the Northern Mountain Provinces (TA 8102 - VIE).
B. Structure and Main Contents of the Technical Guidance NoteThe technical guidance note for integrating climate change in road transport infrastructure in Viet Nam includes six main chapters:
Chapter I, Introduction, includes a background of the country and sector, objectives of the guidance, scope, target group, and a brief of its contents.
Chapter II, Requirements for Integrating Climate Change in road transport development planning, describes the process of developing transport strategies, master plans, and projects in Viet Nam; opportunities for integrating climate change into road transport
infrastructure development strategies, master plans, and projects; and fundamental requirements for integrating climate change into transport projects and programs.
Chapter III, Integrating Climate Change into Transport Development Strategy and Master Plans, contains specific steps for integrating climate change into the transport development strategy and master plan.
Chapter IV, Integrating Climate Change into Road Transport Projects in Viet Nam, includes procedures for project preparation and implementation, principles and context for integrating climate change in road transport projects, and specific steps for integrating climate change into the project preparation and implementation processes.
Chapter V, Strengthening Capacity for Climate Change Integration into planning and project implementation, maps out the demand for strengthening capacity of relevant stakeholders for integrating climate change into road transport projects.
Chapter VI, Conclusion and Recommendations, provides a number of recommendations to the Ministry of Transport for ensuring effective integration of climate change in the transportation programs and projects.
An overview of the key guidance steps for integrating climate change into transport development strategies and master plans is provided in Figure A2.1. Guidance on steps for integrating climate change into road projects is provided in Figure A2.2. As can be seen, this guidance has been adapted from the guidance provided in the ADB Guidelines for Climate Proofing Investment in the Transport Sector (Box 2).

Appendix 2
96
Figure a2.1: specific steps for integrating Climate Change into transport development strategies and master Plans
stePs oF strategy/ master Plan develoPment Climate Change Considerations
1. Defining objectives and scope of the strategy/master plan
4. Analyzing and selecting climate change mitigation and adaptation options
5. Updating investment for climate change response in the investment needs and selection of prioritized projects
6. Developing policy framework for implementation of proposed climate change measures
3. Identifying transport demand projection
4. Developing transport infrastructure development scenarios
5. Analyzing and selecting appropriate master plan options
2. Assessing current socioeconomic situation and natural conditions in the master plan
1. Establishing the context for consideration of climate change issues within scope of strategy or master plan
2. Identifying relevant stakeholders and information sources and collecting data on climate change related to the strategy or master plan
3. Analyzing future trends, risks, and impacts under likely climate change scenarios. Identifying climate change issues and objectives for the transport strategy and master plan.
6. Identifying investment demands and phases; determining priority programs and projects
7. Developing policy framework, implementation measures, and monitoring arrangements
Compilation of the strategy or master plan document with climate change integration
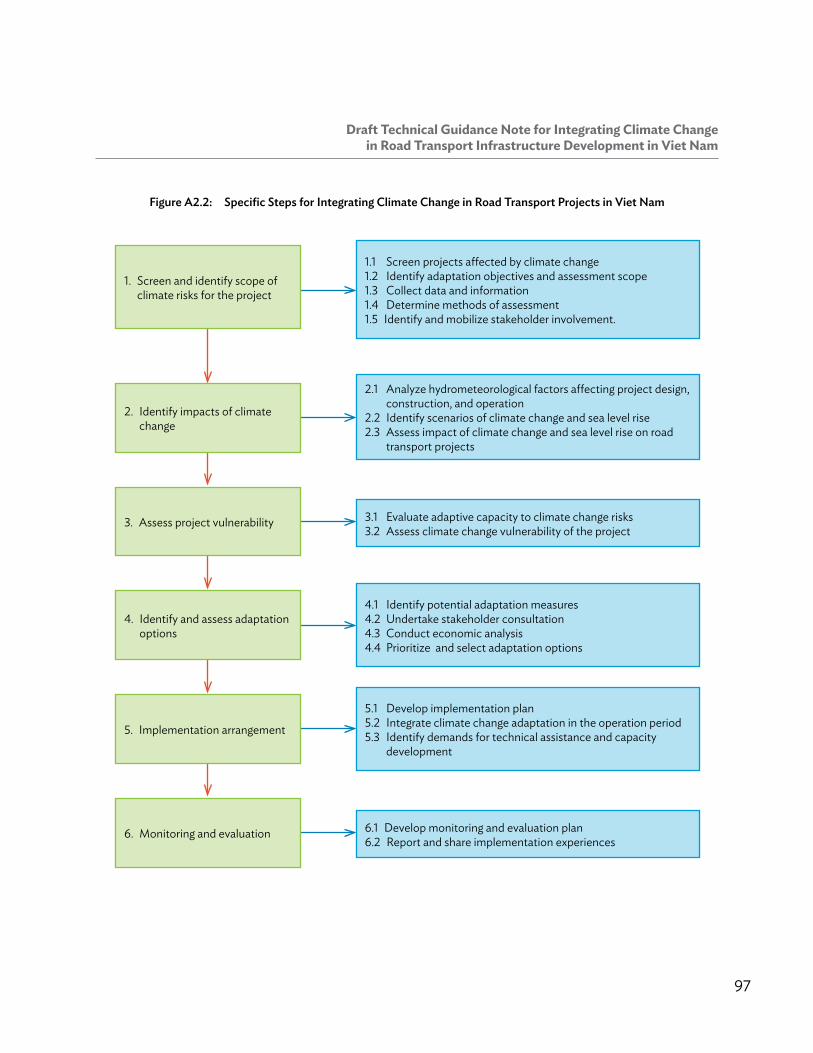
Draft Technical guidance note for Integrating Climate Change in Road Transport Infrastructure Development in Viet nam
97
Figure a2.2: specific steps for integrating Climate Change in road transport Projects in viet nam
1. Screen and identify scope of climate risks for the project
1.1 Screen projects affected by climate change1.2 Identify adaptation objectives and assessment scope 1.3 Collect data and information1.4 Determine methods of assessment1.5 Identify and mobilize stakeholder involvement.
2.1 Analyze hydrometeorological factors affecting project design, construction, and operation
2.2 Identify scenarios of climate change and sea level rise2.3 Assess impact of climate change and sea level rise on road
transport projects
3.1 Evaluate adaptive capacity to climate change risks3.2 Assess climate change vulnerability of the project
6.1 Develop monitoring and evaluation plan 6.2 Report and share implementation experiences
2. Identify impacts of climate change
3. Assess project vulnerability
4. Identify and assess adaptation options
4.1 Identify potential adaptation measures4.2 Undertake stakeholder consultation4.3 Conduct economic analysis4.4 Prioritize and select adaptation options
5. Implementation arrangement
5.1 Develop implementation plan5.2 Integrate climate change adaptation in the operation period 5.3 Identify demands for technical assistance and capacity
development
6. Monitoring and evaluation

Appendix 2
98
C. Achievements So FarThe draft of the technical guidance note was sent to national and international experts and specialists for peer review. In addition, a consultation workshop was organized in ha Noi in early November 2013 to review and provide inputs for improvement and finalization of the document.
The final version, which incorporates comments and feedback received through peer review and the consultation workshop, was completed in December 2013. The Transport Development and Strategy Institute will work closely with the Ministry of Transport to secure endorsement of a government circular.
99
aPPendix 3From emissions scenarios to representative Concentration Pathways
In the context of its Special Report on Emissions Scenarios (SRES), the Intergovernmental Panel on Climate Change prepared “storylines” and
“scenario families” to project future greenhouse gas emissions.
The A1 storyline and scenario family describes a future world of very rapid economic growth, global population that peaks in mid-century and declines thereafter, and the rapid introduction of new and more efficient technologies. This A1 scenario family is then categorized into three groups depending on their technological emphasis: fossil fuel intensive (A1FI), nonfossil energy sources (A1T), or a balance across all sources (A1B).
The A2 storyline and scenario family assumes a very heterogeneous world with population fertility patterns converging only slowly across regions. In the A2 storyline, technological advances are relatively more fragmented.
The B1 storyline and scenario family describes a convergent world. Global population peaks in mid-century and declines thereafter similar to the A1 storyline. Economic structures change rapidly toward a service and information economy, with reductions in material intensity and the introduction of clean and resource-efficient technologies. The emphasis is on
global solutions to economic, social, and environmental sustainability, including improved equity, but without additional climate initiatives.
The B2 storyline and scenario family depicts a world where local solutions to economic, social, and environmental sustainability are emphasized. Global population increases continuously, but at a rate lower than A2. The levels of economic development are intermediate, with less rapid and more diverse technological change than in the B1 and A1 storylines. The scenario is also focused on local and regional levels of environmental protection and social equity.
Altogether, there are approximately 40 SRES scenarios. The set of scenarios consists of six groups drawn from the four families: one group each in A2, B1, and B2, and three groups within the A1 family, characterizing alternative developments of energy technologies: A1FI (fossil fuel intensive), A1B (balanced), and A1T (predominantly nonfossil fuel).
In its fifth assessment report, the IPCC introduced a new way of developing climate scenarios known as representative concentration pathways (RCPs). Unlike the set of emissions scenarios presented in IPCC’s previous SRES, the set of RCPs focuses less on emissions (and the underlying forces driving emissions such as population growth, economic
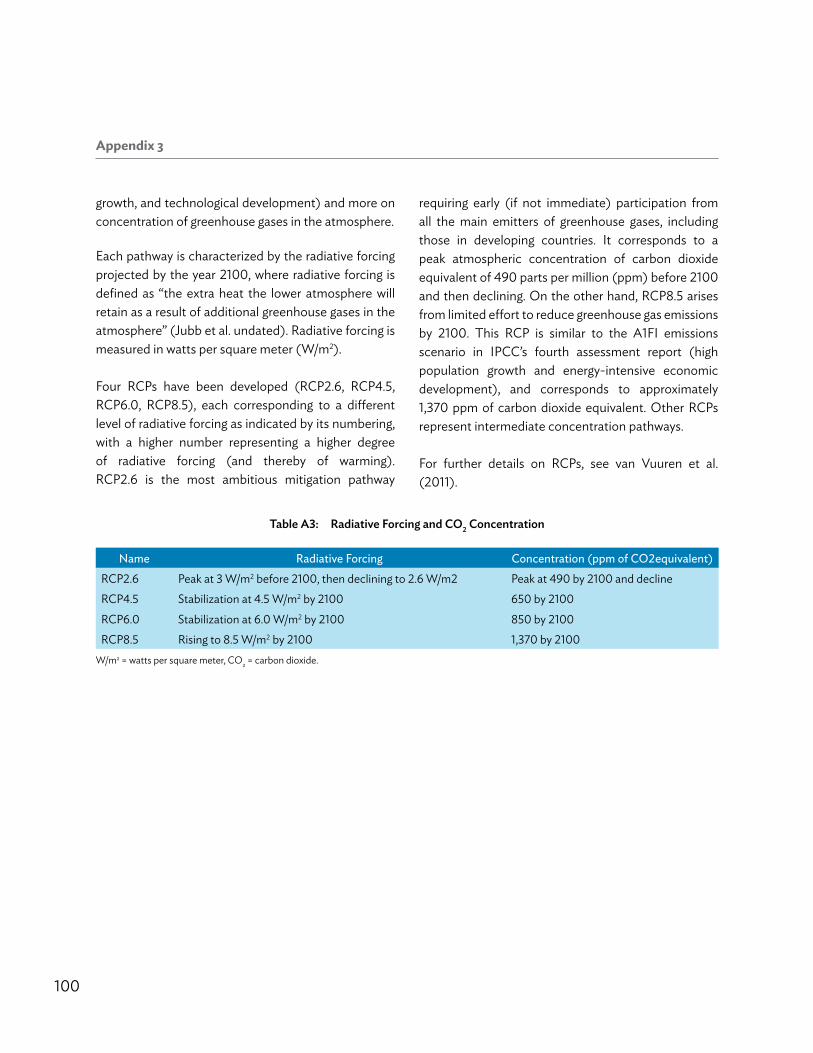
100
Appendix 3
growth, and technological development) and more on concentration of greenhouse gases in the atmosphere.
Each pathway is characterized by the radiative forcing projected by the year 2100, where radiative forcing is defined as “the extra heat the lower atmosphere will retain as a result of additional greenhouse gases in the atmosphere” (jubb et al. undated). Radiative forcing is measured in watts per square meter (w/m2).
Four RCPs have been developed (RCP2.6, RCP4.5, RCP6.0, RCP8.5), each corresponding to a different level of radiative forcing as indicated by its numbering, with a higher number representing a higher degree of radiative forcing (and thereby of warming). RCP2.6 is the most ambitious mitigation pathway
requiring early (if not immediate) participation from all the main emitters of greenhouse gases, including those in developing countries. It corresponds to a peak atmospheric concentration of carbon dioxide equivalent of 490 parts per million (ppm) before 2100 and then declining. on the other hand, RCP8.5 arises from limited effort to reduce greenhouse gas emissions by 2100. This RCP is similar to the A1FI emissions scenario in IPCC’s fourth assessment report (high population growth and energy-intensive economic development), and corresponds to approximately 1,370 ppm of carbon dioxide equivalent. other RCPs represent intermediate concentration pathways.
For further details on RCPs, see van Vuuren et al. (2011).
table a3: radiative Forcing and Co2 Concentration
name radiative Forcing concentration (ppm of co2equivalent)RCP2.6 Peak at 3 w/m2 before 2100, then declining to 2.6 w/m2 Peak at 490 by 2100 and declineRCP4.5 Stabilization at 4.5 w/m2 by 2100 650 by 2100
RCP6.0 Stabilization at 6.0 w/m2 by 2100 850 by 2100RCP8.5 Rising to 8.5 w/m2 by 2100 1,370 by 2100
w/m2 = watts per square meter, Co2 = carbon dioxide.
101
aPPendix 4approaches to downscaling general Circulation models
A number of approaches are used to downscale general circulation models (GCMs).
Spatial redistribution/pattern downscaling. In regions where climate data is both spatially distributed and extensive, a relatively simple downscaling technique can use this fine-resolution observation data to spatially differentiate the GCM results for a given grid cell into more detailed future climate outputs. This method cannot correct for statistical bias and so can only be used to assess relative changes or explore relative trends—it is not successful in predicting future absolute climate values.
In the Mekong Basin, a variation of this approach has been applied by Australia’s Commonwealth Scientific and Industrial Research organisation, which divided the Mekong Basin into 18 lumped subcatchments and assumed linearity in future climate trends. This assumption was then used to scale the results from 11 GCMs to each subcatchment using global interpolated data (Eastham et al. 2008).
Statistical/empirical downscaling. This approach relies on the premise that local climate is conditioned by large-scale (global) climate and by local physiographical features such as topography, distance from the ocean, and vegetation, such that at any
specific location there is a link between large-scale and local climatic conditions. Determining the nature of these links in terms of physical processes can often be difficult, but by fitting long time series data with a statistical distribution, empirical links can be identified between the large-scale patterns of climate elements (predictors) and local climate conditions (predicted). To do this, GCM output is compared with observed information for a reference period to calculate period factors, which are then used on the rest of the GCM time series in order to adjust biases. These factors can be annual means (resulting in a single correction factor) or monthly means (resulting in 12 correction factors). In addition, it is possible to correct data in such a way that not only the mean, but also the variance, are corrected on the basis of the date observed in the reference time series. Statistical downscaling can be done for individual stations, but can also be spatially explicit. Because of the use of correction factors, statistical techniques have been shown to be less accurate in arid climates where future climate trends can be masked by the correction factor, though results have been better for tropical zones. Standard interpolation techniques are then used to provide area-based climate information between stations and covering the entire basin.
Dynamical downscaling. A more sophisticated way to downscale GCM data is to use a physically based regional climate model. Such models are forced at the

102
Appendix 4
boundaries by GCMs and calculate the flows of energy, gases, etc., at a higher resolution for a specific area. These can also be “nested” in a GCM itself. Creating such a regional climate model requires a lot of expertise and labor to set it up and calibrate it properly, and it is also computationally very expensive.
To date in the Mekong Basin, there has been one attempt at dynamical downscaling using PRECIS. The PRECIS dynamic downscaling model was developed by the Met office hadley Centre for Climate Prediction and Research in the UK and was used by consortium partner SEA START for IPCC Special Report on Emissions Scenarios A2 and B2
Climate Proofing ADB Investment in the Transport SectorInitial Experience
The transport sector is key to the continued economic development of Asia and the Pacific. By improving connectivity and making the movement of goods and people more affordable, transport contributes to economic growth, efficiency, and competitiveness while providing poor people with access to economic opportunities and services. Various components of the transport infrastructure are exposed and vulnerable to climate change. This is of particular concern to countries in Asia and the Pacific which will experience significant adverse impacts from a changing climate. The Asian Development Bank has put in place a systematic framework guiding the conduct of climate risk and vulnerability assessments of investment projects. Ongoing initiatives will address some of the key challenges encountered when conducting climate risk and vulnerability assessments, including access to readily available climate change information.
About the Asian Development Bank
ADB’s vision is an Asia and Pacific region free of poverty. Its mission is to help its developing member countries reduce poverty and improve the quality of life of their people. Despite the region’s many successes, it remains home to approximately two-thirds of the world’s poor: 1.6 billion people who live on less than $2 a day, with 733 million struggling on less than $1.25 a day. ADB is committed to reducing poverty through inclusive economic growth, environmentally sustainable growth, and regional integration.
Based in Manila, ADB is owned by 67 members, including 48 from the region. Its main instruments for helping its developing member countries are policy dialogue, loans, equity investments, guarantees, grants, and technical assistance.
ASIAN DEVELOPMENT BANK6 ADB Avenue, Mandaluyong City1550 Metro Manila, Philippineswww.adb.org
CLIMATE PROOFINGADB INVESTMENTIN THE TRANSPORT SECTORINITIAL EXPERIENCE
ASIAN DEVELOPMENT BANK