Climate characteristics and factors behind record heavy ...
13
Climate characteristics and factors behind record-heavy rain in Japan in August 2021 24 September 2021 Tokyo Climate Center (TCC), Japan Meteorological Agency (JMA) https://ds.data.jma.go.jp/tcc/tcc Summary ⚫ In mid-August 2021, areas from western to eastern Japan experienced record-heavy rain. ⚫ The conditions observed are mainly attributed to the following: ➢ Unusually for mid-summer in eastern and western Japan, like atmospheric flow in the latter half of the early-summer rainy season, known as the Baiu, a stationary front was strengthened by a significant north-south gradient of temperature in the lower troposphere between the Okhotsk High to north of Japan and the southward shifted North Pacific Subtropical High (NPSH) expanding to the south of Japan. A continuous confluence of water vapor from continental China and along the margin of the NPSH also contributed to widespread continuous heavy rainfall. ➢ The southward shift of the NPSH that caused a large amount of water vapor flow into western and eastern Japan was related to the subtropical jet stream (STJ) in the upper troposphere, with an overall southward shift over East Asia. Furthermore, significant southward meandering of STJ to the west of Japan is considered to produce a favorable conditions for updraft occurrence and persistent rainfall. ➢ The southward shift of the STJ was likely affected by sea surface temperatures (SSTs) in the tropical Indian Ocean and related convective activity over the Asian summer monsoon region. ⚫ On 14th August, the northern part of the Kyushu region (see Figure A1 for the locations) experienced extremely heavy rainfall associated with stationary linear mesoscale convective systems. In addition to the formation of conditions conducive to convective cloud development to the south of the front a small-scale low was also developed on the same day on the front over the East China Sea. This may have contributed to the formation of cumulonimbus clouds organized as stationary linear mesoscale convective systems over sea areas west of the Kyushu region to the east of the small-scale low. 1. Climate conditions Wide areas from western to eastern parts of Japan experienced record-heavy rainfall
Transcript of Climate characteristics and factors behind record heavy ...

Climate characteristics and factors behind record-heavy rain in Japan
in August 2021
24 September 2021
Tokyo Climate Center (TCC), Japan Meteorological Agency (JMA)
https://ds.data.jma.go.jp/tcc/tcc
Summary
⚫ In mid-August 2021, areas from western to eastern Japan experienced record-heavy
rain.
⚫ The conditions observed are mainly attributed to the following:
➢ Unusually for mid-summer in eastern and western Japan, like atmospheric flow in
the latter half of the early-summer rainy season, known as the Baiu, a stationary
front was strengthened by a significant north-south gradient of temperature in
the lower troposphere between the Okhotsk High to north of Japan and the
southward shifted North Pacific Subtropical High (NPSH) expanding to the south
of Japan. A continuous confluence of water vapor from continental China and
along the margin of the NPSH also contributed to widespread continuous heavy
rainfall.
➢ The southward shift of the NPSH that caused a large amount of water vapor flow
into western and eastern Japan was related to the subtropical jet stream (STJ) in
the upper troposphere, with an overall southward shift over East Asia.
Furthermore, significant southward meandering of STJ to the west of Japan is
considered to produce a favorable conditions for updraft occurrence and
persistent rainfall.
➢ The southward shift of the STJ was likely affected by sea surface temperatures
(SSTs) in the tropical Indian Ocean and related convective activity over the Asian
summer monsoon region.
⚫ On 14th August, the northern part of the Kyushu region (see Figure A1 for the
locations) experienced extremely heavy rainfall associated with stationary linear
mesoscale convective systems. In addition to the formation of conditions conducive to
convective cloud development to the south of the front a small-scale low was also
developed on the same day on the front over the East China Sea. This may have
contributed to the formation of cumulonimbus clouds organized as stationary linear
mesoscale convective systems over sea areas west of the Kyushu region to the east of
the small-scale low.
1. Climate conditions
Wide areas from western to eastern parts of Japan experienced record-heavy rainfall
totaling as much as 1,400 mm from mid- to late August 2021 in association with a highly
active stationary front over the country (Figure 1-1, 1-2, 1-3, 1-4 and Table 1-1). From 12th
to 14th August in particular, stationary linear mesoscale convective systems contributed to
these conditions over the northern Kyushu and Chugoku regions (see Figure A1 for the
locations of these regions), with JMA issuing Emergency Warnings for various locations from
13th to 15th August. Monthly precipitation on the Sea of Japan and Pacific sides of western
Japan was the highest on record for August since 1946, when collection of the area-
averaged statistical data referenced here began (Table 1-2).
To identify possible causative factors, JMA, with the TCC Advisory Panel on Extreme
Climatic Events (a JMA body staffed by prominent experts on climate science from
universities and research institutes), investigated factors considered to have contributed to
these extreme climatic conditions.
2. Factors
The primary factors contributing to the climate conditions detailed above are illustrated
in Figure 2-1.
The widespread heavy rainfall event was partially attributed to unusual frontal formation
for midsummer1 in eastern and western Japan, like atmospheric flow in the latter half of the
early-summer rainy season, known as the Baiu, relating to a significant gradient of north-
south temperature in the lower troposphere between the Okhotsk High in northern Japan
and the NPSH in the south. The cold Okhotsk High on the surface developed from early
August onward and persisted due to an evolved blocking high over eastern Siberia in the
upper troposphere. The NPSH shifted farther southward than normal and expanded to the
seas south of Japan. Continuous and massive inflow of water vapor into the front from
continental China and along the margin of the NPSH also contributed to the event (Figure
1-5).
The southward shift of the NPSH that caused a large amount of water vapor flow into
western and eastern Japan was related to the southward shift of the subtropical jet stream
(STJ) from East Asia to Japan in the upper troposphere. Furthermore, significant southward
meandering of the jet stream to the west of Japan is considered to have supported upward
airflow and persistent rainfall over areas from eastern to western Japan.
From mid-July to early August, tropical SSTs were higher than normal to the southwest
of Sumatra and lower than normal in the western part of the Indian Ocean. In association,
the Asian summer monsoon was less active than normal from the South China Sea to the
area east of the Philippines, and its active convection region was shifted southwest of its
normal position.
1 The North Pacific Subtropical High normally extends northwestward around Japan, bringing hot and sunny conditions to
the country in mid-summer.

Statistical analysis indicates that the inactive and southwestern-biased Asian monsoon
may have caused the STJ over East Asia to shift southward overall and meander southward
to the west of Japan.
3. Characteristics of the record-heavy rain event and related atmospheric conditions
From August 12th to 14th, the Chugoku region and the northern part of the Kyushu
region experienced stationary linear mesoscale convective systems and JMA issued nine
instances of Bulletin on Significant Heavy Rain (Table 3-1). Before dawn and on the morning
on 14th August in particular, the northern part of the Kyushu region affected by the
stationary linear mesoscale convective systems experienced extreme heavy rainfall (Figure
3-1). During this period, large amounts of water vapor flowed into areas around the front
over seas west of the Kyushu region. Along with enhanced updraft near the front, lower-
level winds were strengthened to the south of the front, supporting local development of
convective clouds (Figure 3-2). On the front over the East China Sea, a small-scale low may
also have contributed to the formation of the stationary linear mesoscale convective
systems over seas west of the Kyushu region to the east of the small-scale low (Figure 3-3).
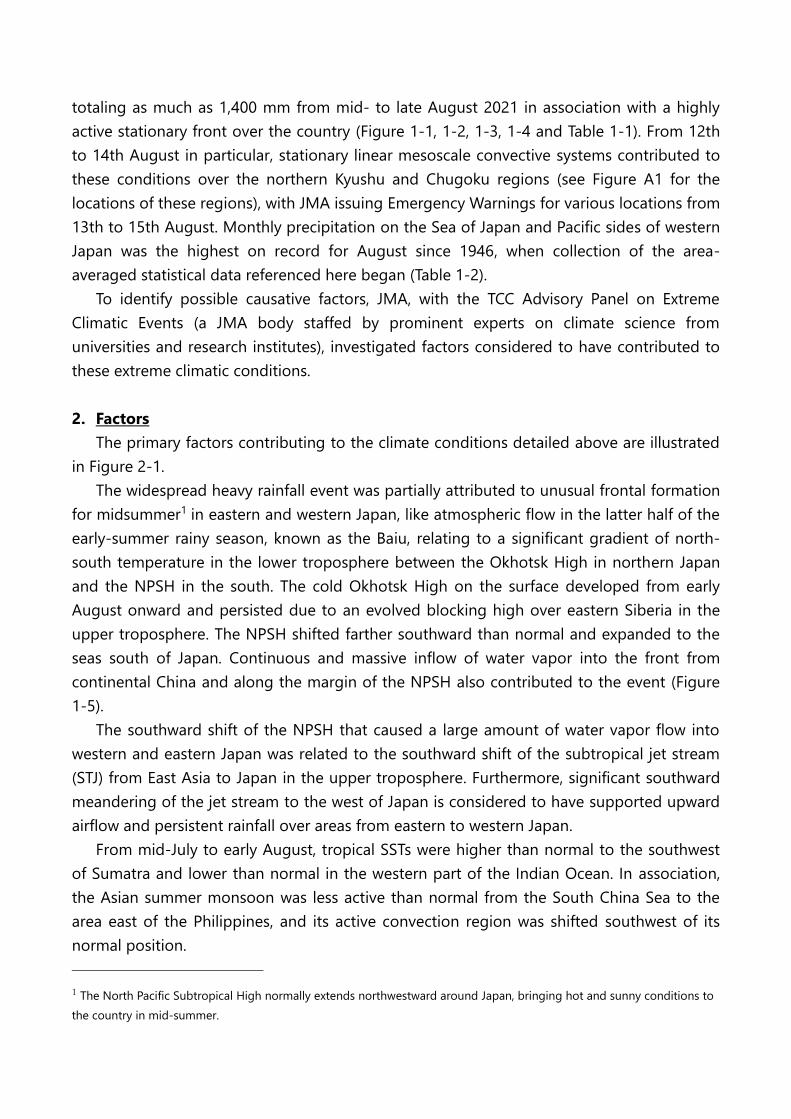
The increased precipitation of this event may be linked to a rising long-term trend in
airborne water vapor associated with global warming (Figure 2-2 and 2-3), although further
studies are needed to evaluate the link quantitatively including probability of heavy rainfall.

Figure 1-1. Total precipitation amounts [mm] for 11 – 26 August, 2021
Figure 1-2. Maximum 72-hour precipitation [mm] for 11– 26 August, 2021

Figure 1-3. Frequency distribution of overall total precipitation at 1029 selected AMeDAS
stations throughout Japan for 10-day periods starting on the 1st, 11th and 21st of the
month since 1982
Figure 1-4. Comparison of maximum overall N-day precipitation amount during each heavy
rain event occurrence at 1,029 selected AMeDAS stations throughout Japan since 1982

Table 1-1 Record overall total precipitation at selected 1029 AMeDAS stations all over Japan
for any 10 days starting from 1st, 11th and 21st of the months since 1982
Rank Period All stations (mm)
1 Mid-August, 2021 235,788.5
2 Early July, 2018 218,844.0
3 Early July, 2020 217,037.5
4 Late June, 1985 209,016.0
5 Mid-September, 1990 205,925.0
6 Late October, 2017 203,475.5
7 Early August, 2014 185,173.0
8 Late June, 1999 170,692.0
9 Early July, 1995 166,014.0
10 Early September, 1989 165,200.0
Table 1-2 Years and its ratios of the top three highest events of monthly precipitation totals in
August from 1946 to 2021
Western Japan Sea of Japan side
of western Japan
Pacific side of
western Japan
Eastern Japan Pacific side of
eastern Japan
1st 2021(331%) 2021(371%) 2021(297%) 1982(208%) 1982(231%)
2nd 2014(246%) 1980(255%) 2014(275%) 2021(205%) 2021(219%)
3rd 1980(230%) 1993(228%) 2004(216%) 2003(201%) 2003(218%)
Ratios are deviations from the baseline (the 1991 – 2020 average). The rainfall in the Sea of Japan
side of eastern Japan in August 2021 was the ninth highest (152% of normal).

(a) Vertical integrated water vapor flux amount and its convergence
(b) Water vapor amounts concentrated in western Japan
Figure 1-5. (a) Vertically integrated horizontal water vapor flux amount (vectors) and its
convergence (shade) averaged over the period from 11th to 17th August 2021 and (b) time-
series representation of vertically integrated water vapor flux amount convergence (the 7-
day running mean) in the area surrounded by the black lines in (a)) from June to July after
1958
(a) Unit: kg/m/second for vectors and mm/day for shade.
(b) Unit: mm/day. Data for the period from 1958 to 2021 are overlaid into one calendar year. The
red, blue, orange and gray indicate values for 2021, 2020 (The heavy rain event of July 2020), 2018
(The heavy rain event of July 2018), 2014 (The heavy rain event of August 2014) and others after
1958, respectively. (a) and (b) are generated from JRA-55 data (Kobayashi, 2015), and vertical
integration here represents integration from the surface to 300hPa.

Figure 2-1. Characteristics of atmospheric circulation bringing record-heavy rain from 11th
to 17th August
Figure 2-2. Annual maximum precipitation ratio in 72 hours from 1976 to 2021 in Japan
This graph is based on precipitation data from 637 AMeDAS stations which have been
continuously operated from 1976 to 2021. Bars indicate the ratio to the baseline (the 1991 – 2020
average), while the blue and red lines indicate the related five-year running mean and the long-
term linear trend, respectively (statistically significant at a confidence level of 95%). The value for
2021 is preliminary as of 31st of August. The red triangle marks the timing of a change in the
observation method for precipitation (observed every hour before 2003 and every 10 minutes
thereafter).

Figure 2-3. Specific humidity ratio at 850 hPa for August from 1981 to 2021 in western and
eastern Japan
The data are presented as ratios against the baseline (the 1991 – 2020 average).
Note: The term specific humidity refers to the mass of water vapor in a unit mass of moist air
(g/kg). The data used in this analysis were based on radiosonde observations (balloon-borne
instrument platforms with a radio-transmitting device) at 6 upper-air observation stations in
western and eastern Japan (Wajima, Tateno, Hachijojima, Shionomisaki, Fukuoka and Kagoshima).
The thin black line indicates the averages of the data for the 6 stations. The blue and red lines
indicate the related five-year running mean and the long-term linear trend, respectively
(statistically significant at a confidence level of 99%). Data from the period marked by the red
triangles may include biases due to instrument changes.

Table 3-1. Issues regarding bulletin on significant heavy rain in mid-August 2021
Bulletin on significant heavy rain relates to ongoing extreme downpours in particular locations
associated with stationary linear mesoscale convective systems. Against a background of increasing
disaster risk, the content is issued to outline situations with keywords related to such systems when
the following conditions are met:
⚫ 1: Areas in which Radar/Raingauge-Analyzed Precipitation with a spatial resolution of 5 km
exceeds 100 mm over 500 km2 during the preceding three hours.
⚫ 2: The shape of the area extracted by the criterion of 1 is linear (with aspect ratios exceeding
5:2).
⚫ 3: Maximum cumulative precipitation amount during the preceding three hours in 1 exceeds
150 mm.
⚫ 4: Real-time Landslide Risk Map exceeds the criteria for Landslide Alert Information and reaches
80 percent of the threshold of soil rainfall index for Heavy Rain Emergency Warnings, or Real-
time Flood Risk Map significantly exceed warning criteria.
Information is re-issued when the related criteria still apply three hours after initial issuance, or
within the three-hour period if the target area is expanded.
Time of issuance Issuance
number Prefecture Primary subdivision
Year Month Day Hour Minute
2021 8 12 13 59 1 Fukuoka Chikugo
2021 8 12 13 59 1 Kumamoto Kumamoto
2021 8 13 09 19 1 Hiroshima Northern, Southern
2021 8 14 02 21 1 Saga Southern
2021 8 14 02 21 1 Nagasaki Northern
2021 8 14 02 49 2 Nagasaki Southern, Northern
2021 8 14 05 00 2 Saga Southern, Northern
2021 8 14 05 59 3 Nagasaki Southern, Northern
2021 8 14 06 09 1 Fukuoka Fukuoka
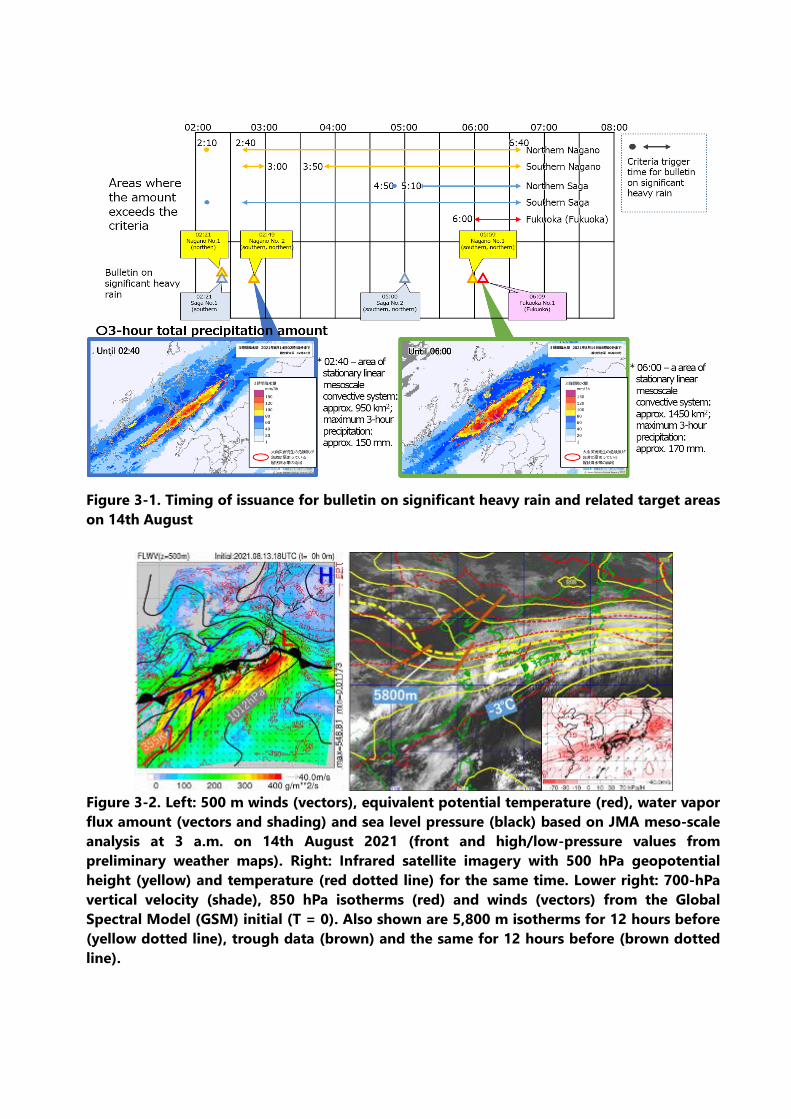
Figure 3-1. Timing of issuance for bulletin on significant heavy rain and related target areas
on 14th August
Figure 3-2. Left: 500 m winds (vectors), equivalent potential temperature (red), water vapor
flux amount (vectors and shading) and sea level pressure (black) based on JMA meso-scale
analysis at 3 a.m. on 14th August 2021 (front and high/low-pressure values from
preliminary weather maps). Right: Infrared satellite imagery with 500 hPa geopotential
height (yellow) and temperature (red dotted line) for the same time. Lower right: 700-hPa
vertical velocity (shade), 850 hPa isotherms (red) and winds (vectors) from the Global
Spectral Model (GSM) initial (T = 0). Also shown are 5,800 m isotherms for 12 hours before
(yellow dotted line), trough data (brown) and the same for 12 hours before (brown dotted
line).

Figure 3-3. Left: Time-series representation of radar echo intensity at 20-minute intervals
from 3:20 to 4:40 on 14th August 2021. Center: sea level pressure (black), wind (vectors)
and precipitable water (shading) at 3 a.m. on 14th August 2021 based on JMA meso-scale
analysis. The black dotted line represents the main convergence area. Right: simultaneous
vertical profiles of atmospheric temperature (red) and dew point temperature (blue dotted
line) averaged for the area within the blue box in the central figure, based on JMA local
analysis.
Figure A1. Climatological
regions of Japan
JMA’s seven regional divisions
for climate monitoring and
forecasting (the Sea of Japan
and Pacific sides of northern,
eastern and western Japan, and
Okinawa/Amami)


![NUCL 1 [512295]: Determination of heavy metals and …prosper.cofc.edu/~nuclear/2002Orlando223Abstracts.pdfNUCL 1 [512295]: Determination of heavy metals and their leaching characteristics](https://static.fdocuments.in/doc/165x107/5b2ba5ac7f8b9a594c8b7390/nucl-1-512295-determination-of-heavy-metals-and-nuclear2002orlando223abstractspdfnucl.jpg)