Climate Change & Water Issues for Agriculture Production...
46
Dave Sauchyn Prairie Adaptation Research Collaborative University of Regina Climate Change & Water Issues for Agriculture Production on the Prairies Manitoba Forage Symposium Winnipeg, 14 March 2007
Transcript of Climate Change & Water Issues for Agriculture Production...

Dave SauchynPrairie Adaptation Research CollaborativeUniversity of Regina
Climate Change & Water Issues for Agriculture Production on the Prairies
Manitoba Forage Symposium Winnipeg, 14 March 2007


http://data.giss.nasa.gov/gistemp/
0.31996
0.311988
0.321999
0.332000
0.351991
0.381995
0.381990
0.41997
0.482001
0.492004
0.542006
0.552003
0.562002
0.571998
0.632005

Northern Hemisphere temperature, past 2000 years
0 200 400 600 800 1000 1200 1400 1600 1800 2000
-1
-0.5
0
0.5
1
ProxyMeasured
Moberg, et al., 2005

Climate Change 2007: The Physical Science Basis -Summary for Policymakers, February 2, 2007
4th Assessment Report
800+ contributing authors450+ lead authors from 130+ countries2500+ scientitic expert reviewers 6 years of work4 volumes

IPCC 4th Assessment Report
• Warming of the climate system is unequivocal
• The warmth of the last half century is unusual in at least the previous 1300 years
• Most of the observed increase in globally averaged temperatures since the mid-20th century is very likely due to the observed increase in anthropogenic greenhouse gas concentrations
• Anthropogenic warming would continue for centuries, even if greenhouse gas concentrations were to be stabilized

Canadian National Assessment – early fall, 2007
http://www.adaptation.nrcan.gc.ca/assess_e.php

http://data.giss.nasa.gov/gistemp/
2006 Temperatures: Departures from Normal (1961-90)

Change in temperature (C) from baseline (1961-90)
CGCM2 A212050s
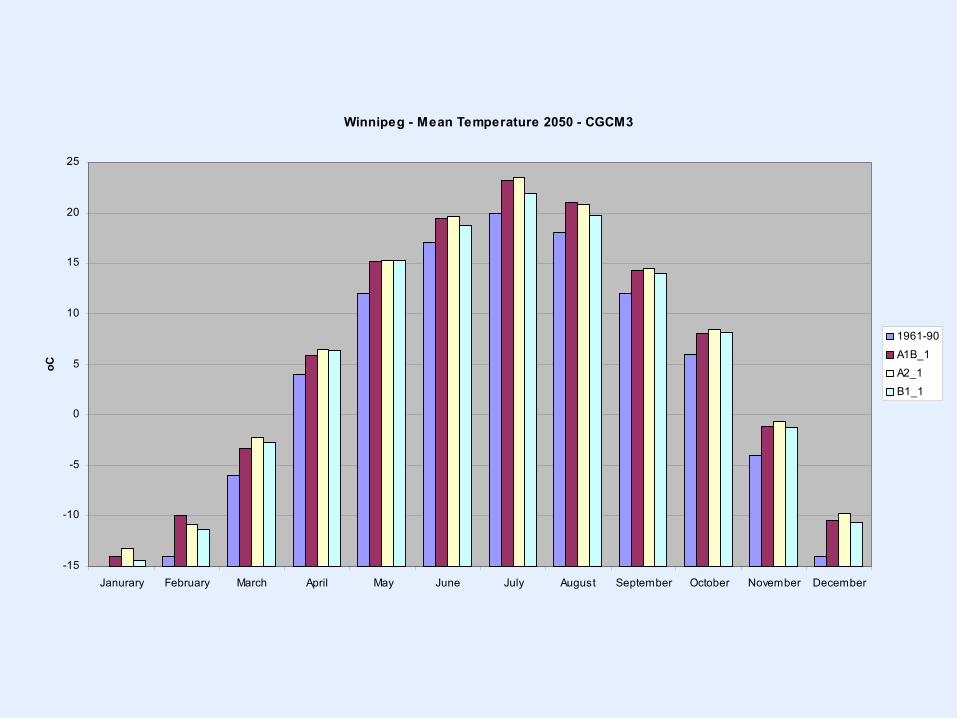
Winnipeg - Mean Temperature 2050 - CGCM3
-15
-10
-5
0
5
10
15
20
25
Janurary February March April May June July August September October November December
oC
1961-90
A1B_1A2_1
B1_1
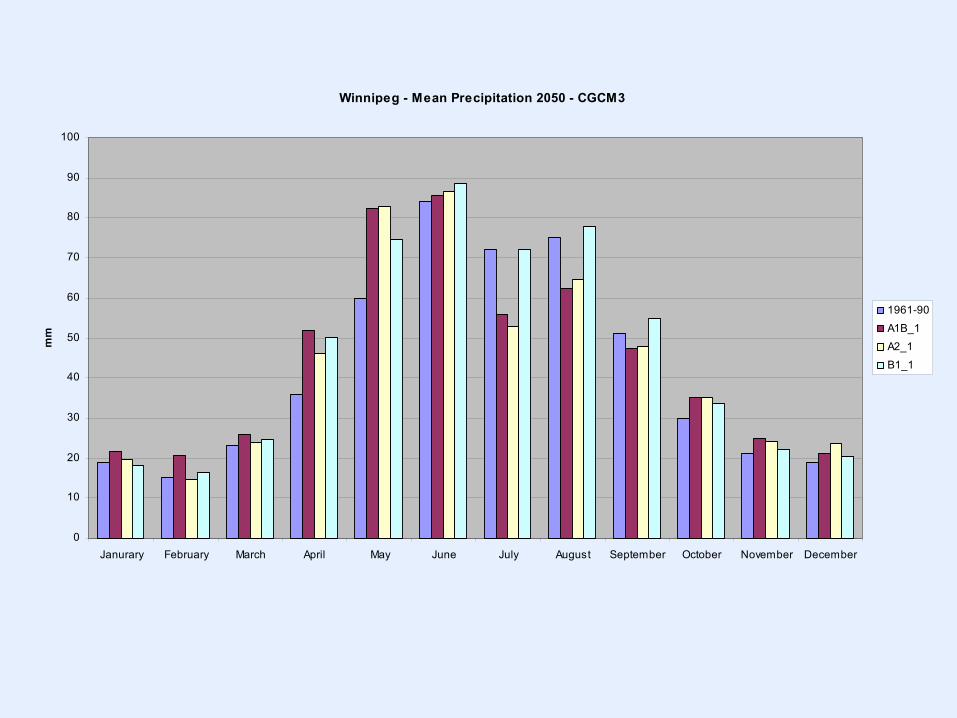
Winnipeg - Mean Precipitation 2050 - CGCM3
0
10
20
30
40
50
60
70
80
90
100
Janurary February March April May June July August September October November December
mm
1961-90
A1B_1A2_1
B1_1

slightly to significantly less surface and soil water
one of the most certain projections is that extra water will be available in winter and spring and summers generally will be drier

Alberta
Manitoba
Ontario
Montana
Saskatchewan
Idaho
British Columbia
Minnesota
North Dakota
Oregon
Washington
WisconsinSouth Dakota
Wyoming
Michigan
Saskatchewan River
Churchill River
Peace River
Red River
Lake Winnipeg
Athabasca River
Assiniboine River
Hayes River
Winnipeg River
Nelson River
Missouri River
Seal River
3
40
11
1
0
10
0
62
30
27
0
Boise
Helena
Regina
Calgary
Winnipeg
Edmonton
Bismarck
Saskatoon
Saint PaulMinneapolis
Source:Non-contributing area - Agriculture and Agri-Food Canada, P.F.R.A.Elevation data - Environmental Systems Research Institute
Non-contributing drainage area (percent of total basin area) for prairie drainage basins-median annual runoff-
0 100 20050
Kilometers
Prairie Drainage Basins
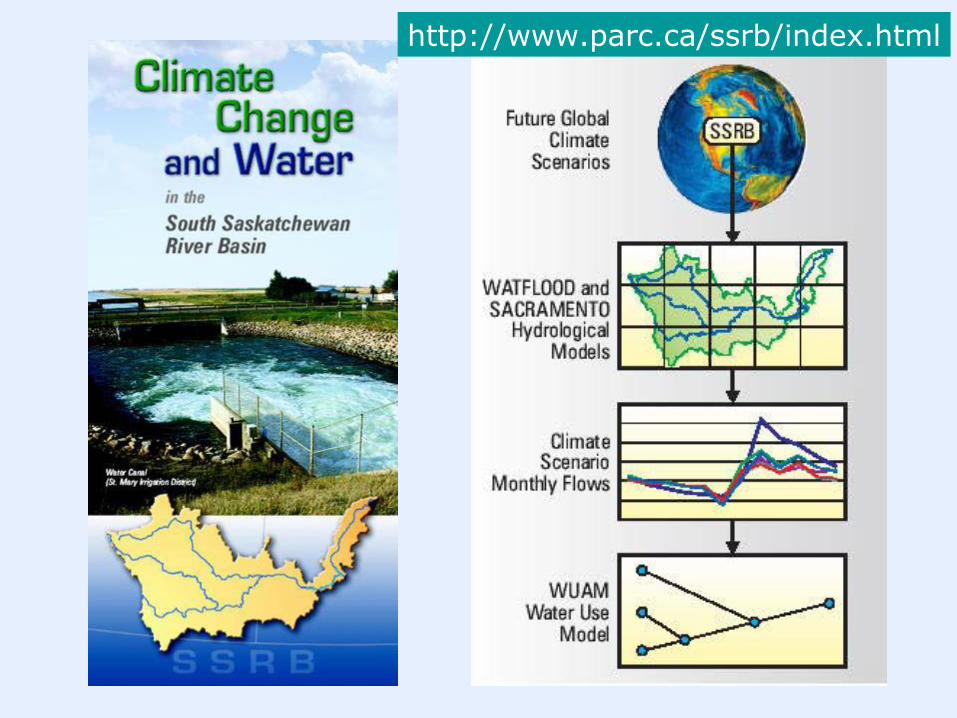
http://www.parc.ca/ssrb/index.html

Red Deer at Bindloss-13%(-32% to 13%)
South Sask atDiefenbaker-8.5%(-22% to 8%)
Oldman at mouth- 4%(-13% to 8%)
Bow River at mouth-10%(-19% to 1%)
Projected annual flow, 2039 – 2070
Pietroniro et al., 2006

South Sask River at Diefenbaker
0
100
200
300400
500
600
700
current ech had ncarclimatology
mod
elle
d flo
ws
(ave
rage
m
3/se
c)
winterspringsummerfall
Oldman River at Mouth
0
50100
150
200
250300
350
current ech had ncarclimatology
mod
elle
d flo
ws
(ave
rage
m
3/se
c )
winterspringsummerfall
GCM %Precip +Tempecha21 -3.8 2.8echb21 -2.0 2.8hada21 6.4 2.3hadb21 0.2 2.1ncara21 11.5 1.7ncarb21 9.1 1.5
driest, warmest
moderately wet and warm
wettest and least warm
Description
Bow River at Calgary
0
50
100
150
200
250
current ech had ncarclimatology
mod
elle
d flo
ws
(ave
rage
m
3/se
c)
winterspringsummerfall
Bow River at Mouth
0
50
100
150
200
250
300
current ech had ncarclimatology
mod
elle
d flo
ws
(ave
rage
m
3/se
c)winterspringsummerfall
Seasonal flows, SSRB, 2039-2070
Pietroniro et al., 2006

Closed-basin Prairie Lakes
van der Kamp et al.)
-12
-10
-8
-6
-4
-2
0
2
4
6
8
10
12
1910 1920 1930 1940 1950 1960 1970 1980 1990 2000 2010Years
Rel
ativ
e Le
vels
(m)
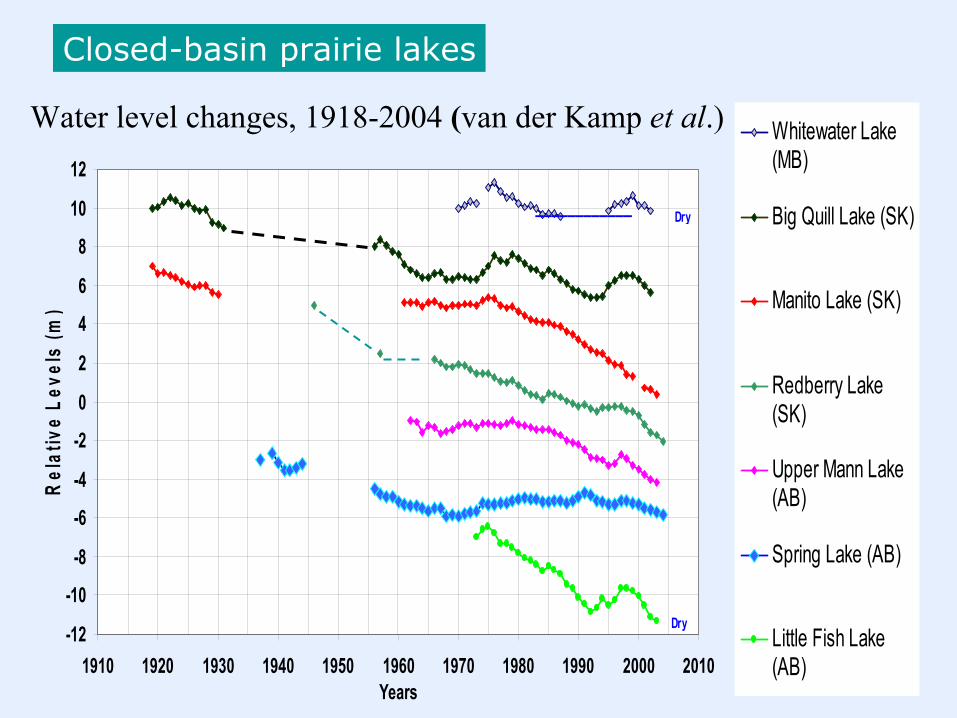
Whitewater Lake(MB)
Big Quill Lake (SK)
Manito Lake (SK)
Redberry Lake(SK)
Upper Mann Lake(AB)
Spring Lake (AB)
Little Fish Lake(AB)
____________
Dry
Dry
Water level changes, 1918-2004 (van der Kamp et al.)
Closed-basin prairie lakes

Coping Range
Time
Adaptationimplementation
Climatic changeClimatic variability

There will be greater variation from season to season and year to year
Both drought and unusually wet years could occur with greater frequency and severity

-15
-10
-5
0
5
10
15
Dep
artu
res
(bu/
acre
s)
1905 1910 1915 1920 1925 1930 1935 1940 1945 1950 1955 1960 1965 1970 1975 1980 1985 1990 1995 2000 2005
-200
-100
0
100
200
Dep
artu
res
(mm
)
Wheat Yields
Precipitation
Wheat Yields, Saskatchewan / Precipitation, Saskatoon, 1906-2002

020
4060
Retu
rn P
erio
d (y
ears
)
10 15 20 25 30Length of Dry Spell (days)
Central North America
Today
~2070
Increasing Drought Frequency
Kharin and Zwiers 2000


Tree-Ring Sampling Sites


1890 1900 1910 1920 1930 1940 1950 1960 1970 1980 1990 2000
-8
-6
-4
-2
0
JJA PDSI < 0, Calgary, 1895-2002
1890 1900 1910 1920 1930 1940 1950 1960 1970 1980 1990 2000
-0.8
-0.6
-0.4
-0.2
0
TRI (-ve departures), WCH, 1895-2004
r = 0.628

1350 1400 1450 1500 1550 1600 1650 1700 1750 1800 1850 1900 1950 2000
-4
-2
0
2
4 PDSI, Calgary, 1341-2004
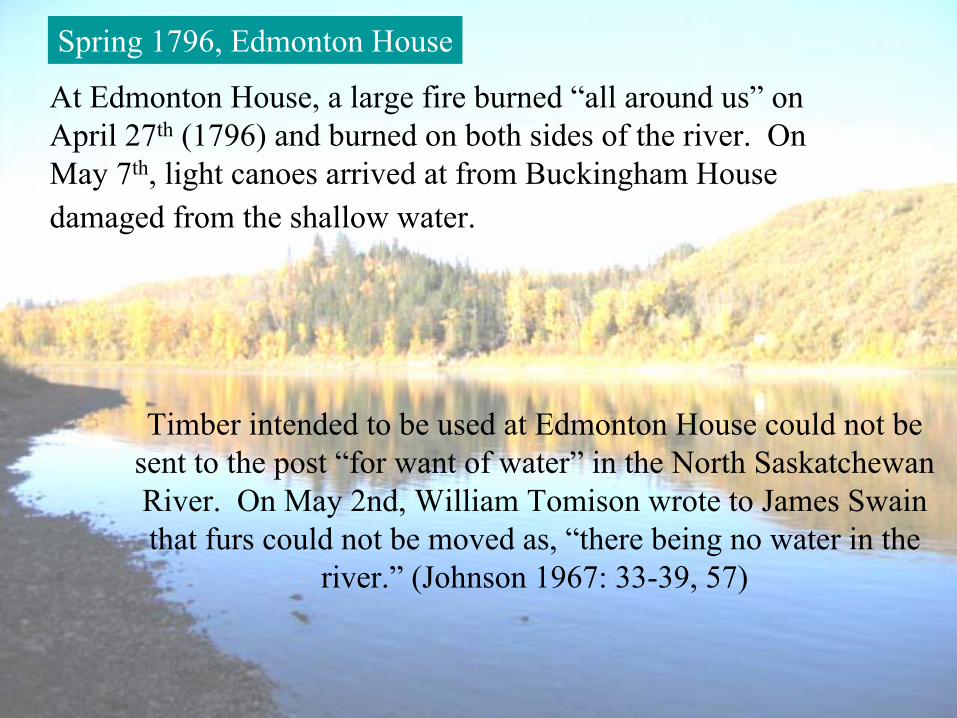
At Edmonton House, a large fire burned “all around us” on April 27th (1796) and burned on both sides of the river. On May 7th, light canoes arrived at from Buckingham House damaged from the shallow water.
Timber intended to be used at Edmonton House could not be sent to the post “for want of water” in the North Saskatchewan River. On May 2nd, William Tomison wrote to James Swain that furs could not be moved as, “there being no water in the
river.” (Johnson 1967: 33-39, 57)
Spring 1796, Edmonton House

-150
-100
-50
0
50
100
150
200
250
1402
1422
1442
1462
1482
1502
1522
1542
1562
1582
1602
1622
1642
1662
1682
1702
1722
1742
1762
1782
1802
1822
1842
1862
1882
1902
1922
1942
1962
1982
2002
Dep
artu
res
from
the
mea
n
South Saskatchewan River at Medicine Hat, 1402-2004
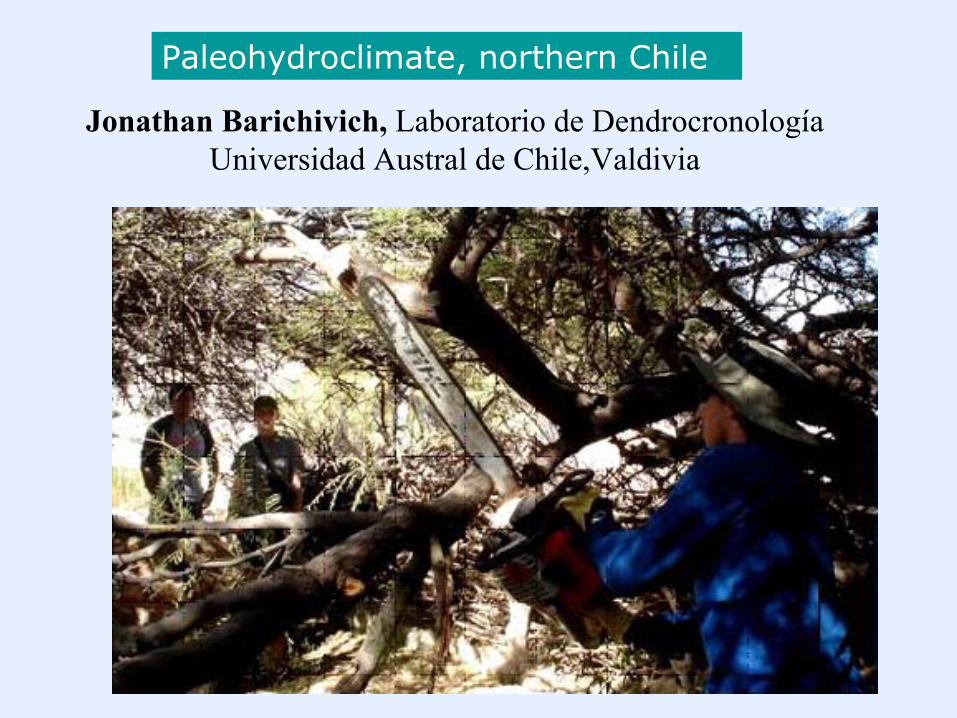
Paleohydroclimate, northern Chile
Jonathan Barichivich, Laboratorio de DendrocronologíaUniversidad Austral de Chile,Valdivia

Wavelet power spectra

Wavelet power spectrum

A “myth of abundance” and an assumption that “the hydrological regime is stationary and will continue to be stationary in the future”.
-10
-8
-6
-4
-2
0
2
4
6
8
1016
0216
1216
2216
3216
4216
5216
6216
7216
8216
9217
0217
1217
2217
3217
4217
5217
6217
7217
8217
9218
0218
1218
2218
3218
4218
5218
6218
7218
8218
9219
0219
1219
2219
3219
4219
5219
6219
7219
8219
9220
02
Dep
artu
res
from
the
mea
n

Most impacts are adverse because economies and activities are not adapted to change

The impacts of climate change will depend on how well we adapt and how much adapation is required

The degree to which adjustments are possible in practices, processes, or structures of systems to projected or actual changes of climate (IPCC, 2001).
Adaptation

Adaptive CapacityDeterminant ExplanationEconomic resources
Greater economic resources increase adaptive capacity Lack of financial resources limits adaptation options
Technology Lack of technology limits range of potential adaptation options Less technologically advanced regions are less likely to develop and/or implement technological adaptations
Information and skills
Lack of informed, skilled and trained personnel reduces adaptive capacity Greater access to information increases likelihood of timely and appropriate adaptation
Infrastructure Greater variety of infrastructure can enhance adaptive capacity, since it provides more options Characteristics and location of infrastructure also affect adaptive capacity
Institutions Well-developed social institutions help to reduce impacts of climate-related risks, and therefore increase adaptive capacity
Equity Equitable distribution of resources increases adaptive capacity Both availability of, and access to, resources is important

Adaptation Options
Share the Loss
Bear the Loss
Modify the Events
Prevent the Effects
Research
Education, Behavioural
Avoid the Impacts
Structural, Technological
Legislative, Regulatory, Financial
Institutional, Administrative
Market-based
On-site Operations
Change Use
Change Location

Dennis McKerracherJV Farms, High River, AB
•one-year trial, from August 2004 to July 2005, the ball-bite drinker sections of the barn used 35 per cent less water that the standard drinker sections
•no detrimental effects on the animals or facility management. the
•significant decrease in water usage led to many secondary benefits
ball-bite drinker
standard drinker

• Are we optimal – with everything perfected?• Nature – conservation of mass and energy,
cascades and transforms • Human systems – 15% used, 85% wasted• Maybe we are outrageously imperfect?• Maybe change pays?
C. KirklandSaskEnergy Leadership Forum, Oct 21/02
Does change cost?
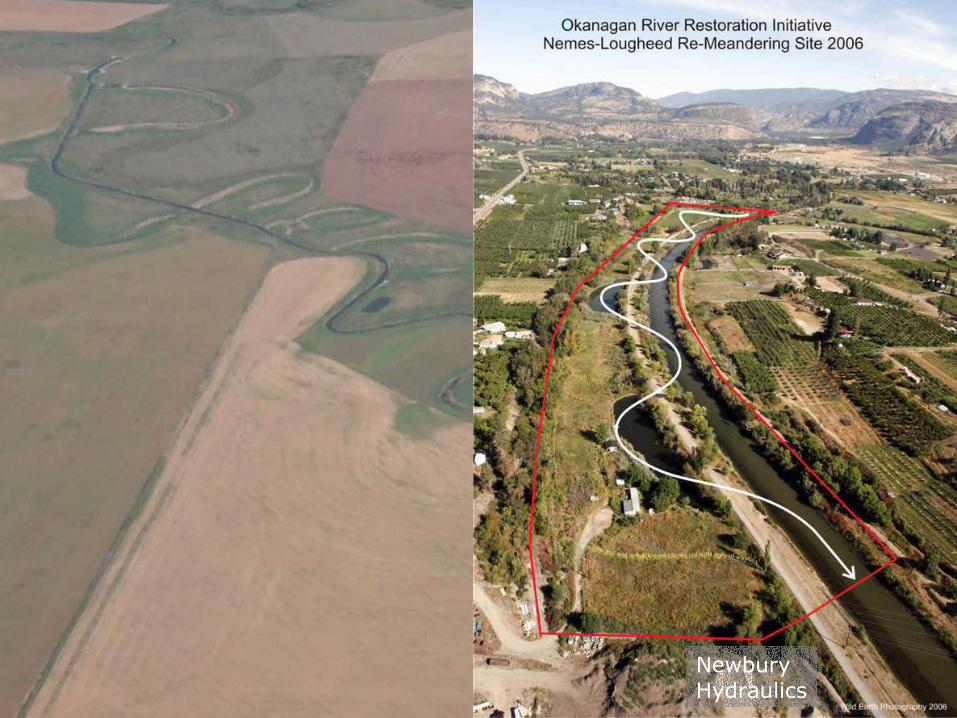
NewburyHydraulics


Thanks