
Climate Change Scenarios for Tourist Destinations in St Lucia: Pigeon Causeway to Rodney Bay and...
29
Climate Change Climate Change Climate Change Climate Change Scenarios for Tourist Scenarios for Tourist Destinations in St Lucia: Destinations in St Lucia: Pigeon Causeway to Pigeon Causeway to Pigeon Causeway to Pigeon Causeway to Rodney Bay and Rodney Bay and S f iè S f iè Soufrière Soufrière www.cep.unep.org 1 Carolina Cavazos-Guerra, Oxford University
-
Upload
intasave-caribsavegroup -
Category
Environment
-
view
170 -
download
0
Transcript of Climate Change Scenarios for Tourist Destinations in St Lucia: Pigeon Causeway to Rodney Bay and...

Climate ChangeClimate ChangeClimate Change Climate Change Scenarios for Tourist Scenarios for Tourist Destinations in St Lucia: Destinations in St Lucia: Pigeon Causeway toPigeon Causeway toPigeon Causeway to Pigeon Causeway to Rodney Bay and Rodney Bay and S f ièS f ièSoufrièreSoufrièrewww.cep.unep.org
1
Carolina Cavazos-Guerra, Oxford University

Climate Change Scenarios for Climate Change Scenarios for D ti ti t S i t L iD ti ti t S i t L iDestinations at Saint LuciaDestinations at Saint Lucia
Gathering and analysing climate i) Observed Climate
ii) Modelled Climate
a) Regional Scaleb) National Scale
change data ii) Modelled Climate c) Destinational Scale
Use data to identify potential impacts and vulnerabilities on Pigeon
Human healthAgriculture and fisheriesRun-off and soil erosion
Causeway to Rodney Bay and Soufrière Biodiversity and habitat lossAffectation to Tourism Sector
Making a climate change data bank available for further impacts studies
2
o u t e pacts stud es

Climate Change Data StudiesClimate Change Data StudiesIs there evidence of long-term trends in the climate
What are the characteristics of
What year to year variations are seen in ‘normal’ or current
••Observed DataObserved Data
in past decades?current climate? normal or current climate?
• Past and Present climate 1960-2009 ◦National scale: Gridded data sets from different sources◦Local scale:Records from Weather stations, but also satellite data...
Is there evidence of long-term trends in the climate
What will the characteristics of
What variations will be seen in ‘normal’ for the
••Modeled DataModeled Data
in future decades?future climate? future climate?
◦Projections for the future from Global Climate Models (GCMs)◦Projections from Regional Climate Models (RCMs)
3

Future Climate ScenariosFuture Climate Scenarios
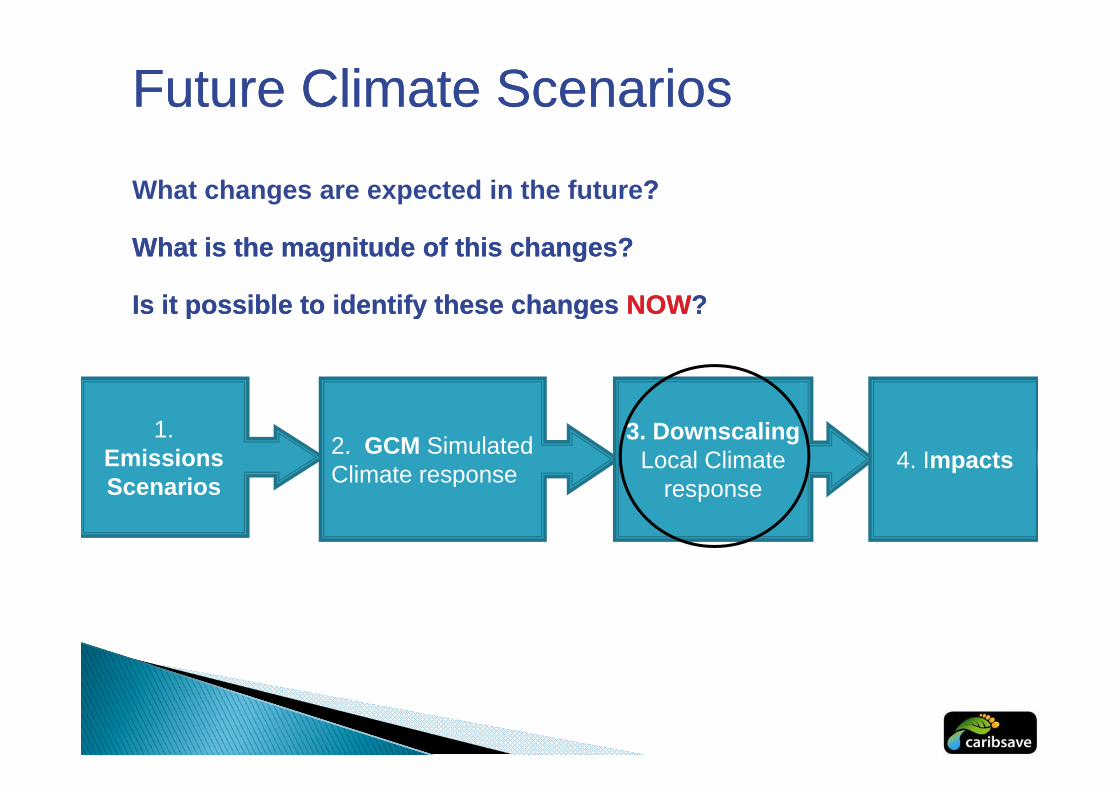
What changes are expected in the future??
What is the magnitude of this changes?What is the magnitude of this changes?
Is it possible to identify these changesIs it possible to identify these changes NOWNOW??Is it possible to identify these changes Is it possible to identify these changes NOWNOW? ?
1. Emissions Scenarios
2. GCM Simulated Climate response
3. DownscalingLocal Climate
response4. Impacts
Scenarios p response
4

1. Emissions Scenarios1. Emissions Scenarios‘What will happen to the climate if....’Estimate carbon emissions based on different scenarios of societal change e g attitudes population technological developmentse.g. attitudes, population, technological developments
Current
A1Bmedium emissions
(rapid economic growth
B1low emissions
(a more environmentally
A2high emissions
(high population growth(rapid economic growth but with decreasing
reliance on fossil fuels)
( ysustainable approach, lower
consumption and lower population growth.)
(high population growth, strong emphasis on
economic development)
5
They are neither predictions nor forecasts.

Future Climate ScenariosFuture Climate Scenarios
What changes are expected in the future??
What is the magnitude of this changes?What is the magnitude of this changes?
Is it possible to identify these changesIs it possible to identify these changes NOWNOW??Is it possible to identify these changes Is it possible to identify these changes NOWNOW? ?
1. Emissions Scenarios
2. GCM Simulated Climate response
3. DownscalingLocal Climate
response4. Impacts
Scenarios p response
6

AtmosphereHorizontal exchange between columns of momentum, heat and moistureAtmosphere
Vertical exchange Run-off
Biosphere
gbetween layers of momentum, heat and moisture
Land surfaceE.g. Topography, Hydrology, Ice Sheets, Vegetation cover
2 How does2 How does Ocean LayersVertical exchange of water, heat, salt, nutrients... Ocean layers
Horizontal exchange of t h t lt
2. How does 2. How does a GCM worka GCM work
7
water, heat, salt, nutrients etc

AtmosphereHorizontal exchange between columns of momentum, heat and moistureAtmosphere
Vertical exchange Run-off
Biosphere
gbetween layers of momentum, heat and moisture
Land surfaceE.g. Topography, Hydrology, Ice Sheets, Vegetation cover
2 How does2 How does Ocean LayersVertical exchange of water, heat, salt, nutrients... Ocean layers
Horizontal exchange of t h t lt
2. How does 2. How does a GCM worka GCM work
8
water, heat, salt, nutrients etc

How GCMHow GCMHow GCM How GCM models have models have evolved through evolved through ti ?ti ?time?time?
9

�The Caribbean in GCM Boxes�The Caribbean in GCM BoxesSimulate large scale global circulation
The Caribbean in GCM BoxesThe Caribbean in GCM BoxesSimulate large scale global circulation
patters that determine climate
2.5˚ lat/lon resolution
BUT:
Cannot resolve many importantCannot resolve many important processes at this coarse resolution e.g. Storms/hurricanes.
Cannot simulate land-sea interactions
Cannot represent fully the topography i l k– mountains, lakes etc
Doesn’t give ‘local’ enough projections for small scale climate impact assessment
10
for small scale climate impact assessment
Future Climate ScenariosFuture Climate Scenarios
What changes are expected in the future??
What is the magnitude of this changes?What is the magnitude of this changes?
Is it possible to identify these changesIs it possible to identify these changes NOWNOW??Is it possible to identify these changes Is it possible to identify these changes NOWNOW? ?
1. Emissions Scenarios
2. GCM Simulated Climate response
3. DownscalingLocal Climate
response4. Impacts
Scenarios p response
11

3. Downscalings with Regional3. Downscalings with Regional3. Downscalings with Regional 3. Downscalings with Regional Climate Models (RCMs)Climate Models (RCMs)
Do nscale to higher spatial resol tion
50 km
Downscale to higher spatial resolution
Model smaller regions with boundaryModel smaller regions with boundary
conditions from a GCM
Higher resolution allows more realistic
representation of physical processes
PRECIS- Driven by 2 different GCMs
(ECHAM-4 and HadCM3)
12
( C a d adC 3)

Regional Scale Country Scale Destinational ScaleRegional Scale(Caribbean)
Country Scale(Saint Lucia) (Pigeon Causeway to Rodney
Bay and Soufrière)
www.gettyimages.com/detail/10155933/Riser
www.maps.com/map.aspx?pid=16526
Gridded observational datasetsLocal Observation
Stations (if available)
Ensemble of 15 IPCC One Regional Model (2 driving GCMS)
Stations (if available)
13
Global Models One Regional Model (2 driving GCMS)

Climate VariablesClimate VariablesDirectly projected from climate models
Temperature (minimum, mean, maximum)Rainfall (total, intensity, number of rainy days, timing of seasonal rainfall, length of dry spells)length of dry spells)Relative HumiditySea-surface temperaturesWind speedWind speed Cloud cover (sunshine hours)
Calculated from these variables
Indices of extreme daily temperature:d ces o e t e e da y te pe atu e◦ Frecuency of Hot and Cold days◦ Frecuency of Hot and Cold nights
Indices of extreme daily precipitation:
14
y◦ Maximum 1-day rainfall◦ Maximum 5-day rainfall

Saint Lucia: Temperature ChangesSaint Lucia: Temperature Changes
Observed increase 0.16˚ per decade (1961 2000)per decade (1961-2000)
2050s(+0.9) +1.4˚(+1.7)(+1.0) +1.4˚(+1.8)
2080s(+1.8) +2.3(+3.1)(+1.2) +2.1˚(+3.2)
2020s(+0.3) +0.7˚(+0.8)(+0.3) +0.7˚(+1)
Under the A2 Scenario...
(+0.6) +1.1˚(+1.2) (+0.9) +1.4˚(+2.0(+0.3) +0.7˚(+0.8)
15

Saint Lucia: Temperature ChangesSaint Lucia: Temperature Changes
20802080s
PRECIS Echam4
Under the A2 Scenario...
PRECIS Echam4
+3.3˚C
PRECIS HadCM3
2 4˚C
16
+2.4˚C

Saint Lucia: Rainfall ChangesSaint Lucia: Rainfall Changes
Trends indicate slight reduction in rainfall
2050s(-35) -9% (+7)(-33) -10% (+6)
2080s(-66) -23% (+12)(-52) -15% (+10)
2020s(-28) -5% (+8)(-19) -4% (+10)
(-34) -5% (+3) (-38) -9% (+14)(-20) -5% (+14)
17

Saint Lucia: Rainfall ChangesSaint Lucia: Rainfall Changes
PRECIS Echam4
Under the A2 Scenario... 2080s
PRECIS Echam4
-11%
PRECIS HadCM3
32%
18
-32%

ExtremesExtremes
Frequency of ‘Hot days’ ‘Cold days’ ‘Hot nights’ andFrequency of Hot days , Cold days , Hot nights and ‘Cold nights’◦ Using daily maximum and minimum temperature records,
T t d d i t li t 1 i 10 dTemperature exceeded in current climate every 1 in 10 days...◦ Different value for every region and season◦ How often will this temperature be exceeded in the future? (i.e.
Might the temperature that we currently consider to be relatively ‘hot’ or ‘cold’ in current climate become more normal in future?
Maximum 1-day and 5-day total rainfallsy yProportion of rainfall that occurs in ‘Heavy’ eventsNumber of consecutive dry-days
19

Saint Lucia: Hot DaysSaint Lucia: Hot Days
2050s(38) 54% (64)(39) 59% (64)(30) 43% (49)
2080s(55) 83% (97)(45) 77% (88)(35) 48% (68)
Under the A2 Scenario...( ) ( ) ( ) ( )
20

�Saint Lucia: Cold Days�Saint Lucia: Cold DaysPractically no cold days for all scenarios
Under the A2 Scenario...2050s
(0) 0% (0)(0) 0% (0)(0) 0% (1)
2080s(0) 0% (0)(0) 0% (0)(0) 0% (0)( ) ( ) ( ) ( )
21

Saint Lucia: Heavy RainfallSaint Lucia: Heavy Rainfall
2050s(-19) -1 (2)(-17) -1 (4)(-20) 0 (3)
2090s(-25) -3 (2)(-26) -3 (1)(-21) -1 (7)
22

How these results are interpretedHow these results are interpreted
Physical Impacts
Projected from climate modelsPhysical Impacts• Water quality and availability• Ocean acidity• Flooding – from coasts or heavy rainfall
Indirect
Temperature RainfallHumiditySea-surface temperatures heavy rainfall
• Coastal erosion • Run-off and Soil Erosion
Wind speed Cloud cover (sunshine hours)Extremes
Additional info required
AgricultureWater
Climate
E i
TransportSea-level riseStorm surge incidence
SustainableCaribbean Tourism
DestinationsNatural Health
InfrastructureEconomic Development
gStorms and Hurricanes:
Frequency, intensity, paths
Direct
23
Resources
Energy
Waste Management
Security

Sea Level RiseSea Level Rise
Picture to be inserted hereWhat we knowPicture to be inserted here
R h t f 2007
What we know about future SLR:The oceans can be expected to ‘expand’ with
Rahmstorf, 200755-125 cm
IPCC 2007
increasing temperature at a reasonably predictable rate
What we aren’t sureIPCC, 200718-59 cm
What we aren t sure about future SLR:How quickly will the Antarctic and Greenland Ice-sheets will melt?
We must consider a wide range of possiblewide range of possible SLR increases
24

Tropical CyclonesTropical CyclonesWhat we know about TCs and
Climate ChangeWhat we aren’t sure about TCs and Climate Change
1)The intensity of North Atlantic TCs has increased since 1970...
• ... long-term climate change signal or inter-decadal variability?
2) TC intensity is strongly correlated with SST, and SSTs are rising...
• ... but how might the frequency of TCs change (formation is dependent on a number of conditions e.g. Wind shear)??
3) TC intensity is likely to increase as SSTs increase. i.e. peak wind speed (+3-20%) rainfall intensity (+10-35%)
g )
(+3-20%), rainfall intensity (+10-35%).
25

Summary 1Summary 1
Estimate future changes in primary climateEstimate future changes in primary climate variables using a combination of observed data and global and regional model scenariosand global and regional model scenariosCombination of GCM’s and RCM’s data allows us to maximise the data available to usto maximise the data available to us◦ Regional models maximise the spatial detail and realism
in the modelsin the models◦ Global model projections allow us to compare multiple
models to give an uncertainty range
26

Summary 2Summary 2o Projections of temperature indicate:
GCM’s Increases in temperature of around 0 6-1 7˚ by 2050sGCM s Increases in temperature of around 0.6 1.7 by 2050s and 1.2 to 3.1° by 2080sRCM’s The PRECIS HadCM3 indicate 3.3° the PRECIS Echam4 indicates an increase of 2 4° by 2080’sEcham4 indicates an increase of 2.4° by 2080 s.
o Projections of rainfall indicate:jGCM’s All projections indicate critical decrease in rainfall: range from -35% to +7% in annual rainfall by 2050s, and -66% to +14% by 2080sby 2080sRCM’s The PRECIS HadCM3 indicate -32%, the PRECIS Echam4 indicates a reduction of -11%
o We may see an accelerated response in climate extremes compared with the mean
27
p

Constraints, recommendations and Constraints, recommendations and Future DirectionsFuture DirectionsFuture DirectionsFuture Directions
Observed climate data not always available (sparse in the Caribbean). which restricts the deductions we can make regarding the changes that have already occurred.
Climate models have demonstrable skill in reproducing the large-scale characteristics of the global climate dynamics, there remain substantial deficiencies
i) Limitations resolution imposed by available computing powerii) Deficiencies in scientific understanding of some processesiii) limited spatial resolution restricts the representation of many of theiii) limited spatial resolution restricts the representation of many of the
smaller Caribbean Islands even for RCM)
F h i f i b d l i h l l l l i hFurther information about model uncertainty at the local level might be drawn if additional regional model simulations based on a range of differing GCMs and RCMs were generated for the Caribbean region
28
in the future.