Climate Change & Policy Responses: Implications for the Extractive Industry Dr. Shiv Someshwar...
80
Climate Change & Policy Responses: Implications for the Extractive Industry Dr. Shiv Someshwar Director Climate Policy & Advisor SDSN CGSD/Earth Institute, Columbia University Extractive Industry & Sustainable Development Training Program 19 Jun 2014, New York With thanks to Kye Baroang and Haresh Bhojwani
-
Upload
archibald-wilson -
Category
Documents
-
view
213 -
download
0
Transcript of Climate Change & Policy Responses: Implications for the Extractive Industry Dr. Shiv Someshwar...

Climate Change & Policy Responses: Implications for the Extractive Industry
Dr. Shiv SomeshwarDirector Climate Policy & Advisor SDSN
CGSD/Earth Institute, Columbia University
Extractive Industry & Sustainable Development Training Program19 Jun 2014, New York
With thanks to Kye Baroang and Haresh Bhojwani

Key messages• Climate is changing
• Global mitigation policies (nature, commitment, binding…) are in flux
• The level of impact depends on industry type and policy exposure (Annex 1, post-Kyoto ‘binding’…)
• Understanding of climate variability & change and of policies is critical for anticipatory planning
Do nothing is not a sound business proposition for company sustainability

Structure
Background on climate variability and change
Climate of selected countries: historical conditions and projections
Overview of the UNFCCC and Kyoto Protocol
Implications of climate change & of policy responses for extractive industries
Managing climate risks and opportunities

Weather, climate variability,climate change
“Weather” •1-10 days
•2-3 months
•6 months – 1 year
•Decades
•Several decades
•Centuries
“Climate Change”
“Climate Variability”
Atmosphere-Land conditions
Ocean-atmosphere-land conditions (conditions vary at slower rates – leads to predictability)
Climate change: in addition to physical processes, assumptions about human/societal behavior

What affects the climate?

Historical global temperature and CO2 levels


Year
Reg
ion
ally
-av
erag
ed t
emp
erat
ure
Long term average
New record high
1900 2000 2030
Climate variability and climate change

Source: IPCC, 2011
A changing climate shifts the odds and distribution of climate events

Historical climate pattern analysis
Raw precipitation data
Analysis of anomalies at different timescales
Source: Annual precipitation data from Centro de Ciencias de la Atmósfera (CCA) at the Universidad Nacional Autónoma de México (UNAM).
Climate Change Decadal variability Interannual variability

Status in understanding and predicting climate across timescales: counter-intuitive
Seasonal-Interannual
Decadal ClimateChange
Timescale
“Good”
“Some Info”
“Frontier”
Understanding
Predictability

Climate prediction(s)
• Seasonal prediction– Ocean-atmosphere interactions: “memory” leads to
prediction– El Nino Southern Oscillation, MJO, IOD
• Decadal projection– Limited knowledge, growing research area– Atlantic and Pacific Decadal Oscillations (ADO, PDO)
• Climate change– Physical and socio-economic processes– Global-scale temperature change generally well-
understood– Precipitation and regional/local patterns more uncertain

Climate change
• UNFCCC definition focus – ‘human impacts’ – often confused with natural variability
• Climate change models are scenario projections (not absolute predictions) modeling effects of GHGs– “What ifs” based on possible emissions scenarios– Not initialized (started) with current climate conditions
• Best agreement is on global average temperature increases
• Effects on precipitation patterns more uncertain
• Model disagreement over regional trends

Socio-economic assumptions for emissions scenarios
GTZ Climate Change Information for Effective Adaptation: A Practitioner’s Manual, 2009.
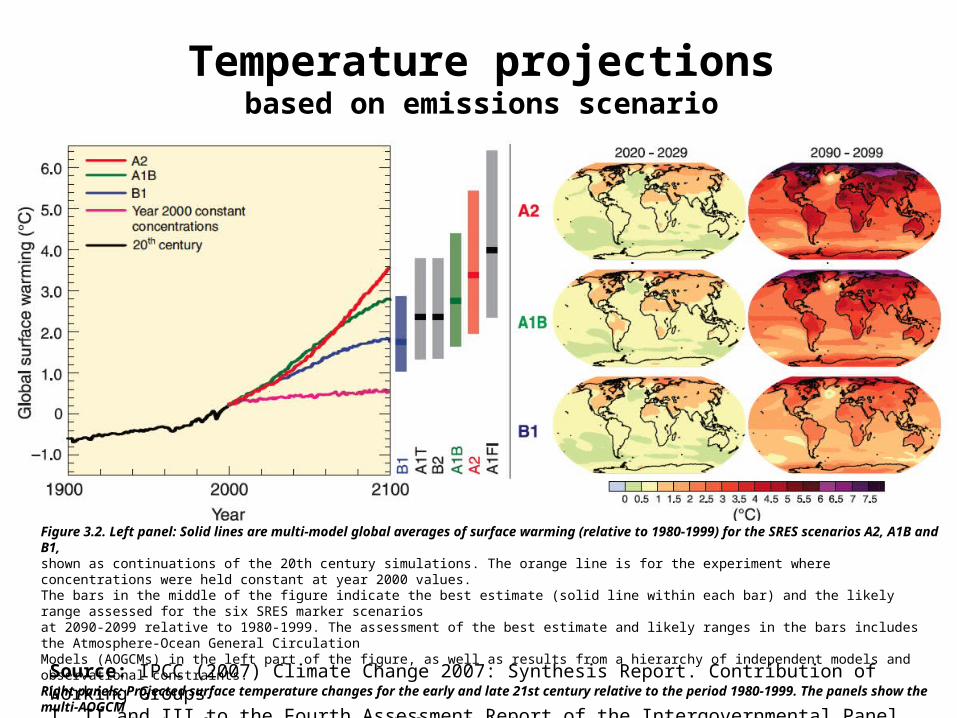
Figure 3.2. Left panel: Solid lines are multi-model global averages of surface warming (relative to 1980-1999) for the SRES scenarios A2, A1B and B1,shown as continuations of the 20th century simulations. The orange line is for the experiment where concentrations were held constant at year 2000 values.The bars in the middle of the figure indicate the best estimate (solid line within each bar) and the likely range assessed for the six SRES marker scenariosat 2090-2099 relative to 1980-1999. The assessment of the best estimate and likely ranges in the bars includes the Atmosphere-Ocean General CirculationModels (AOGCMs) in the left part of the figure, as well as results from a hierarchy of independent models and observational constraints.Right panels: Projected surface temperature changes for the early and late 21st century relative to the period 1980-1999. The panels show the multi-AOGCMaverage projections for the A2 (top), A1B (middle) and B1 (bottom) SRES scenarios averaged over decades 2020-2029 (left) and 2090-2099 (right). {WGI10.4, 10.8, Figures 10.28, 10.29, SPM}
Temperature projectionsbased on emissions scenario
Source: IPCC (2007) Climate Change 2007: Synthesis Report. Contribution of Working GroupsI, II and III to the Fourth Assessment Report of the Intergovernmental Panel on Climate Change.

Precipitation projections: greater uncertainty
Source: IPCC (2007) Climate Change 2007: Synthesis Report. Contribution of Working GroupsI, II and III to the Fourth Assessment Report of the Intergovernmental Panel on Climate Change.
Dec-Jan-Feb Jun-Jul-Aug

Climate Models: Global vs. Regional
Source: Hadley Centre (2004) PRECIS Handbook.


Climate of selected countries: historical conditions and projections

0
50
100
150
200
250
300
350
0 1 2 3 4 5 6 7 8 9 10 11 12
Month
Pre
cip
itat
ion
(m
m)
SW Uruguay: Monthly Means of Precipitation (1915-2008)
Pick 15 years randomly

0
50
100
150
200
250
300
350
0 1 2 3 4 5 6 7 8 9 10 11 12
Month
Pre
cip
itat
ion
(m
m)
None of the Years behaves like the long term mean
Probability of a Year being “Average” = ZERO
Can we use something with Probability > 0 ?
Climate Forecasts(likelihood of “Drier”, “Wetter”)
Still, Planning is based on “AVERAGE” year
SW Uruguay: Monthly precipitation means (1915-2008)

Source: S. Zebiak

Source for next 5 slides: El Nino Teleconnections in Africa, Latin America and Caribbean, and Asia Pacific, Someshwar et al. 2009
January-MarchDrier
July-SeptemberDrier

October-DecemberWetter
October-DecemberDrier

January-MarchDrier
July-SeptemberDrier

October-DecemberDrier

July-SeptemberWetter
October-DecemberWetter

October-DecemberWetter

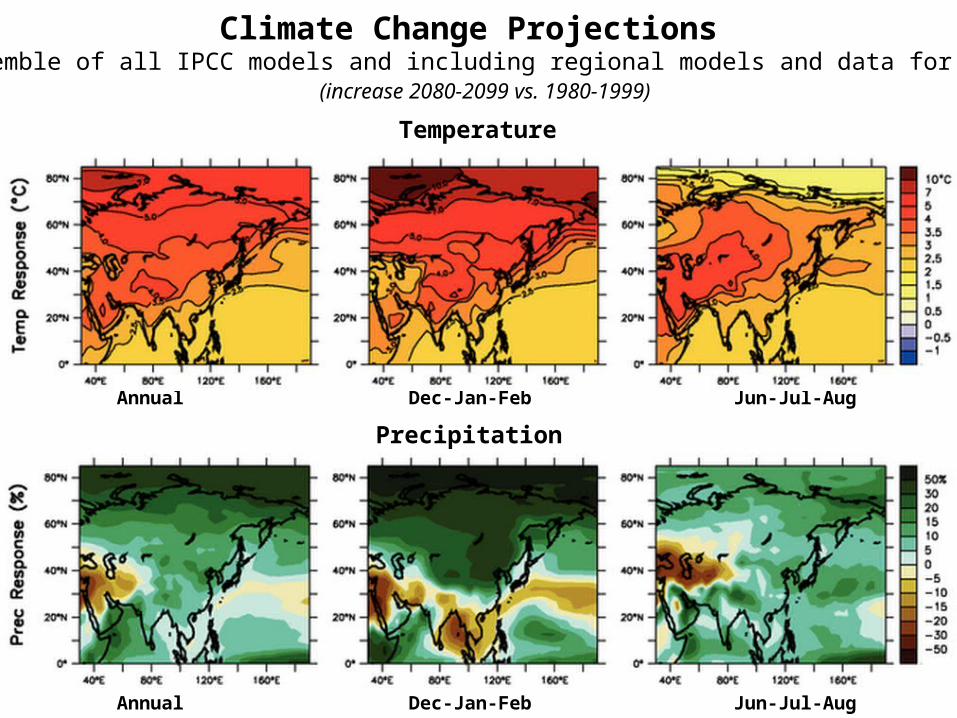
Climate Change Projections Ensemble of all IPCC models and including regional models and data for A1B
(increase 2080-2099 vs. 1980-1999)
Temperature
Annual Dec-Jan-Feb Jun-Jul-Aug
Precipitation
Annual Dec-Jan-Feb Jun-Jul-Aug
Climate Change Projections Ensemble of all IPCC models and including regional models and data for A1B
(increase 2080-2099 vs. 1980-1999)
Temperature
Annual Dec-Jan-Feb Jun-Jul-Aug
Precipitation
Annual Dec-Jan-Feb Jun-Jul-Aug

Climate Change Projections Ensemble of all IPCC models and including regional models and data for A1B
(increase 2080-2099 vs. 1980-1999)
Temperature
Annual Dec-Jan-Feb Jun-Jul-Aug
Precipitation
Annual Dec-Jan-Feb Jun-Jul-Aug

In considering ‘impacts’ on industry, we need to be mindful of the changing ‘policy environment’ as well..
Overview of the UN Framework Convention on Climate Change (UNFCCC)
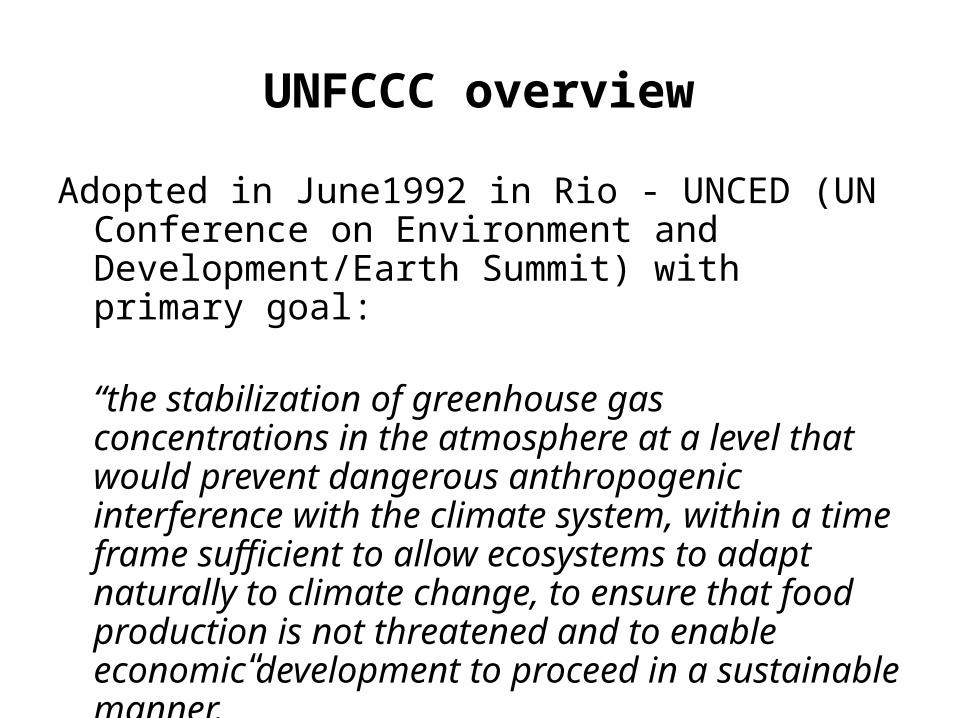
UNFCCC overview
Adopted in June1992 in Rio - UNCED (UN Conference on Environment and Development/Earth Summit) with primary goal:
“the stabilization of greenhouse gas concentrations in the atmosphere at a level that would prevent dangerous anthropogenic interference with the climate system, within a time frame sufficient to allow ecosystems to adapt naturally to climate change, to ensure that food production is not threatened and to enable economic development to proceed in a sustainable manner.”

Climate Change per UNFCCC
• a change of climate which is attributed directly or indirectly to human activity that alters the composition of the global atmosphere and which is in addition to natural climate variability observed over comparable time period…

UNFCCC principles
• Responsibility to future generations
• Equity
• Countries have common but differentiated responsibilities and respective capabilities
• Parties have a right to develop

Commitments
• to adopt national policies on mitigating climate change.
• cooperate in technology transfers, help countries (especially poor countries) adapt to climate change.
• support and enable research, education training and awareness.

Structure
• Conference of the Parties (COP) as the supreme body periodically reviews, establishes needed subsidiary bodies and changes
• Secretariat, administrative/managerial body
• Subsidiary Body for Scientific and Technological Advice (SBSTA) & Subsidiary Body for Implementation (SBI)
• Financial Mechanism - facilitate implementation money (primarily in developing countries). Operation is entrusted to one or more international entities (e.g. World Bank, GEF )

Annex 1 & Annex 2 countries
Annex 1Austria, Australia, Belarus, Belgium, Bulgaria, Canada, Croatia, Czech Republic, Denmark, Estonia, Finland, France, Germany, Greece, Hungary, Iceland, Ireland, Italy, Japan, Latvia, Liechtenstein, Lithuania, Luxembourg, Monaco, Netherlands, New Zealand, Norway, Poland, Portugal, Russian Federation, Slovakia, Slovenia, Spain, Sweden, Switzerland, Turkey, Ukraine, United Kingdom, United States of America.
Annex 2Austria, Australia, Belgium, Canada, Denmark, Finland, France, Germany, Greece, Iceland, Ireland, Italy, Japan, Luxembourg, Netherlands, New Zealand, Norway, Portugal, Spain, Sweden, Switzerland, United Kingdom, United States of America.

UNFCCC - Adaptation
• Annex 2 Countries – responsible to fund adaptation.
• Impacts will happen – those least to blame will be the most impacted

Overview of Kyoto
• Adopted at COP-3, Kyoto 1997
• Entered into force in 2005
• In Pursuit of the main objective of UNFCCC
• Commits Annex 1 countries to stabilize emissions
• Commitment Period 2008-2012

• Absence of key emitters
• Targets too low
• Forests ignored
• Weak enforcement
• In limbo Post-2012 (2015 Paris COP)
• Adaptation under represented
Kyoto Critique

Important Coda on Kyoto Protocol
• Sustained opposition by some companies/countries to Kyoto Protocol– ‘Unfair’ (large developing country emitters not included)– ‘Bottom line’ is the ONLY metric shareholders care
• Sustained and ‘dirty’ campaign to discredit climate science by some companies

Implications of climate change for extractive industries
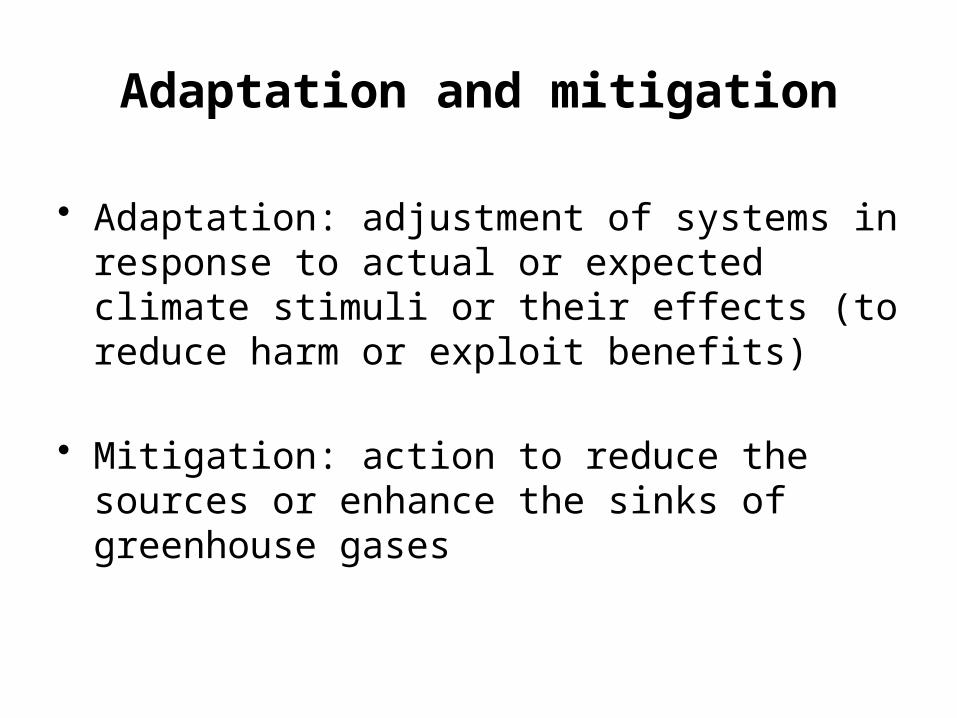
Adaptation and mitigation
• Adaptation: adjustment of systems in response to actual or expected climate stimuli or their effects (to reduce harm or exploit benefits)
• Mitigation: action to reduce the sources or enhance the sinks of greenhouse gases

International Council on Mining and Metals commitment on CC
• ICMM’s Council of CEOs: All members commit to– introduce emissions reduction strategies
– ensure the efficient use of natural resources
– support R&D of appropriate low GHG technologies
– measure and report on progress
• World Petroleum Council’s commitment to CC?


Energy demandTransportation
Quality of life
Flooding impactsInfrastructure
Water availabilityHydropowerMigration
InsuranceProperty/life lossInfrastructure
Coastal protectionLand use change

Impact o
f polic
ies – mitig
ation (e
mission
reduction) /
adaptation (r
esiliency build
ing)

What makes Extractive Industries vulnerable?
• Reliance on large fixed assets with long design lifetimes
• Dependence on long global supply chains (climate-related disruption significantly impact operations in multiple locations)
• Operations in challenging geographies and climates, including fragile environments with ecosystems highly sensitive to CC
• Work with local communities highly vulnerable to CC risks (e.g., impacts on health, water availability and agriculture)
• Heavy reliance on water and energy for processing, both of which can be highly climate sensitive

What makes Extractive Industries vulnerable?
• Dependent on energy intensity of the industry
• Emission reduction policy exposure– Power generation – renewable or regular grid
• Carbon pricing – carbon tax or carbon trading– Differential risk to competiveness across countries
• Non-competitiveness (Kyoto heterogeneity)

Risks to structural integrity of surfaceimpoundments and site conditions fromflooding, subsidence, landslide and soilerosion, as well as thawing permafrost insome locations.
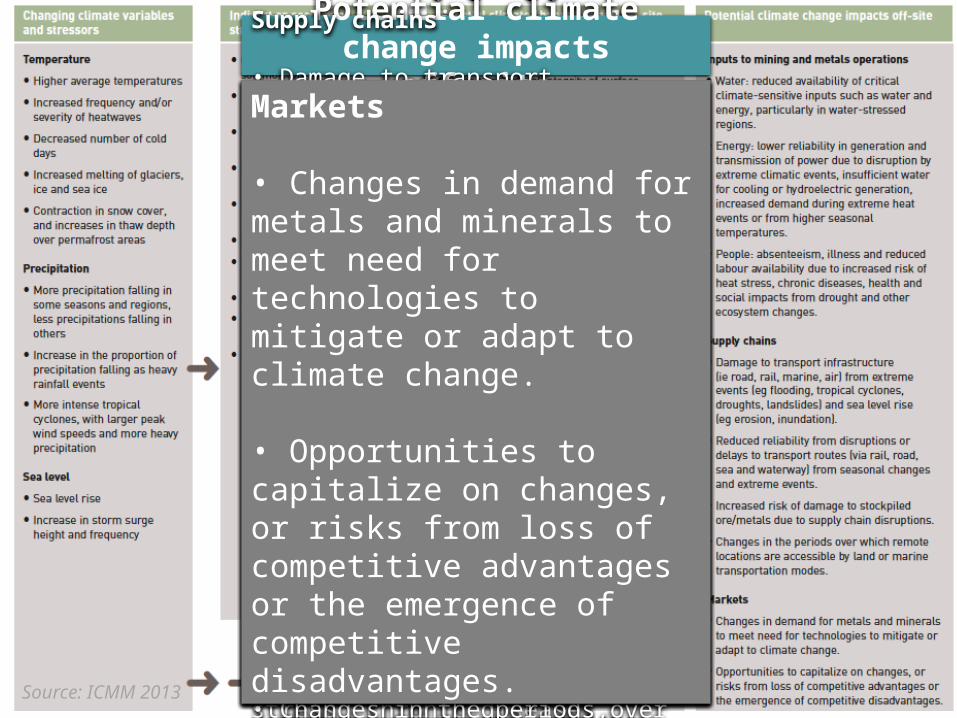
Potential climate change impactson-site
Risk of health, economic impacts on localcommunities and environments.
On-site health and safety risks fromincreased risk of floods and wildfire.
Exploration: increased access to newreserves.
Operations: reduced efficiency, increaseddowntime and higher operational costs from higher temperatures, increased intensity of extreme weather events, and reduced water quality and availability, particularly in areas where water resources are already under stress.
Reduced performance or inadequatecapacity for water treatment, water, andwaste impoundments due to changes inhydrological conditions.
Construction, closure and post-closure:environmental impact assessment may need to take future climate into account; long-term closure and reclamation plans should reflect the expected climate over the site lifetime.
Operations, closure and post-closure:increased weathering of potentiallyacid-generating rock due to increases intemperature and precipitation.
Source: ICMM 2013
ICMM, 2013. Adapting to a changing climate: implications for the mining and metals industry
Inputs to mining and metals operations
• Water: reduced availability of criticalclimate-sensitive inputs such as water andenergy, particularly in water-stressedregions.
• Energy: lower reliability in generation and transmission of power due to disruption by extreme climatic events, insufficient water for cooling or hydroelectric generation, increased demand during extreme heat events or from higher seasonal temperatures.
• People: absenteeism, illness and reduced labour availability due to increased risk of heat stress, chronic diseases, health and social impacts from drought and other ecosystem changes.
Potential climate change impactsoff-site
Supply chains
• Damage to transport infrastructure(ie road, rail, marine, air) from extremeevents (eg flooding, tropical cyclones,droughts, landslides) and sea level rise(eg erosion, inundation).
• Reduced reliability from disruptions ordelays to transport routes (via rail, road,sea and waterway) from seasonal changes and extreme events.
• Increased risk of damage to stockpiledore/metals due to supply chain disruptions.
• Changes in the periods over which remote locations are accessible by land or marine transportation modes.
Markets
• Changes in demand for metals and minerals to meet need for technologies to mitigate or adapt to climate change.
• Opportunities to capitalize on changes, or risks from loss of competitive advantages or the emergence of competitive disadvantages.
Source: ICMM 2013

Your views
What are some impacts of a changing climate on your operations?
What are some examples of company decisions in response? What are some barriers to action?
What policies would you adopt if put in charge?

Managing climate risks and opportunities
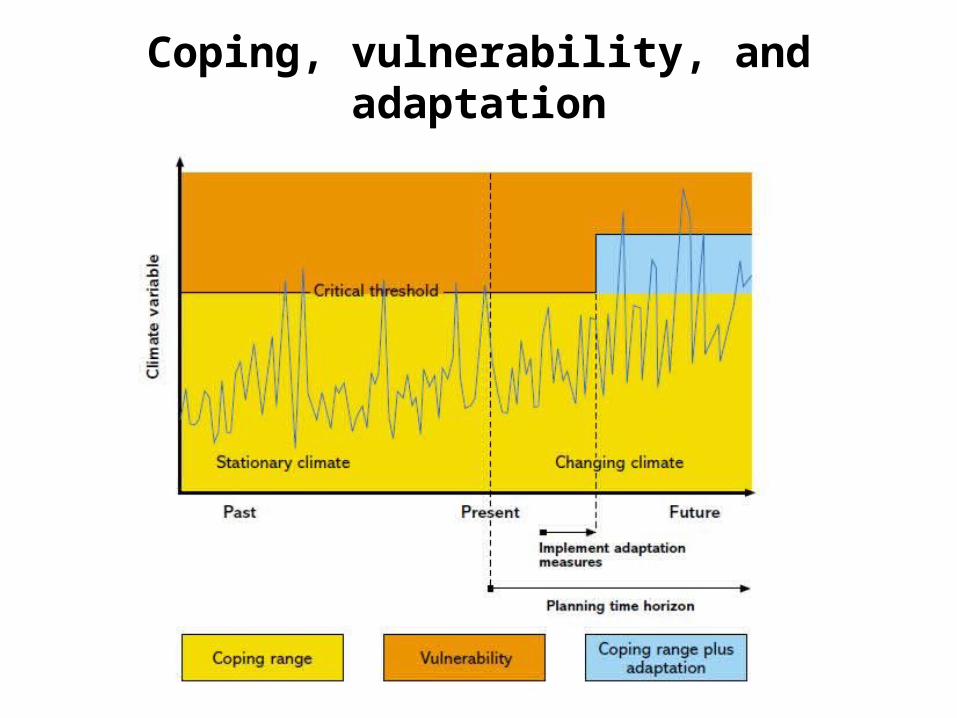
Coping, vulnerability, and adaptation

Adaptation framework processes
Source: UKCIP, 2003

Many tools to support risk and vulnerability assessments
UNDP Stocktaking of Tools and Guidelines to Mainstream Climate Change Adaptation, 2010

Framework for evaluating climate change risks to the mining and metals sector
Source: ICMM, 2013

Climate Risk Management Approach (months, seasons, decades)
Identify Vulnerabilities and Opportunities in Collaboration with Stakeholders (systems and sub-systems)
Reduce Uncertainties (learn from the past, monitor the present, access information on the future)
Identify Technologies & Practices that Reduce Vulnerability (e.g., engineered solutions and revised design specifications)
Identify Decisions and Institutional Arrangements to Reduce Vulnerability, Mitigate Impacts, Transfer Risks (e.g., impact of targeted regulations, early warning & response systems, climate insurance)
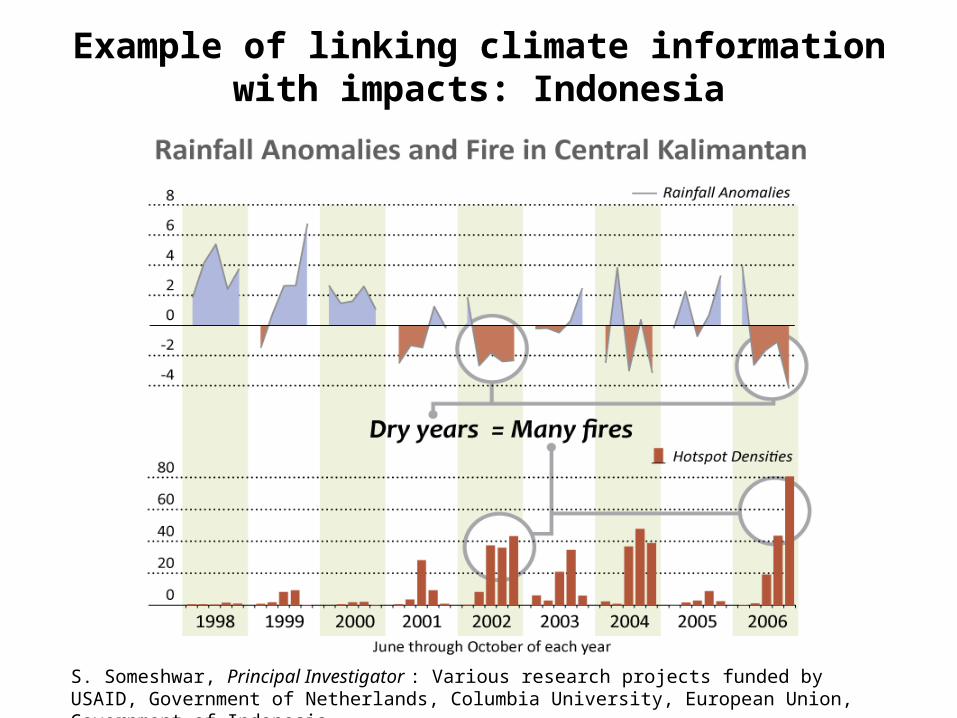
Example of linking climate information with impacts: Indonesia
S. Someshwar, Principal Investigator : Various research projects funded by USAID, Government of Netherlands, Columbia University, European Union, Government of Indonesia

Indonesia: Forecasting peatland fire risk 2 months ahead
Example of linking climate information with impacts: Indonesia

Key messages• Climate is changing
• Global mitigation policies (nature, commitment, binding…) are in flux
• The level of impact depends on industry type and policy exposure (Annex 1, post-Kyoto ‘binding’…)
• Understanding of climate variability & change and of policies is critical for anticipatory planning
• Do nothing is not a sound business proposition for company sustainability

From ‘vulnerability’ to resilience/sustainability
To jiu jitsu vulnerability DISCUSSION• Reliance on large fixed assets with long design lifetimes• Dependence on long global supply chains (climate-related
disruption significantly impact operations in multiple locations)
• Operations in challenging geographies and climates, including fragile environments with ecosystems highly sensitive to CC
• Work with local communities highly vulnerable to CC risks (e.g., impacts on health, water availability and agriculture)
• Heavy reliance on water and energy for processing, both of which can be highly climate sensitive
From ‘vulnerability’ to resilience/sustainability
To jiu jitsu vulnerability DISCUSSION• Dependent on energy intensity of the industry• Emission reduction policy exposure
– Power generation – renewable or regular grid• Carbon pricing – carbon tax or carbon trading
– Differential risk to competiveness across countries• Non-competitiveness (Kyoto heterogeneity)• ……….

Additional material

Source: ICMM 2013

Climate variables affecting port assets & functions (1)
Source: McEvoy & Mullett, 2013, Enhancing the resilience of seaports to a changing climate

Climate variables affecting port assets & functions (2)

Source: Freed & Sussman 2008; ICMM 2013
Must consider system-wide impacts of climate on…

More adaptation framework processes…

Survey of Canadian mining professionals(mining companies, consulting firms, suppliers, govt.)
Source: ArcticNorth Consulting, 2009
Large majority – climate has
large or moderate
impact
Slight majority – yes or don’t
know if CC impacting
Large majority – bad or very
bad for business

Survey of Canadian mining professionals(mining companies, consulting firms, suppliers, govt.)
Source: ArcticNorth Consulting, 2009
Majority taking action to manage
current CC
Uncertainties and cost are
main barriers to action
Slight majority – yes or don’t
know if CC WILL impact

Source: ArcticNorth Consulting, 2009
Large majority – future CC
bad or very bad for business
More snow, fires, extremes and changes in
seasons
Different projections;
same projections as
positive
Fewer taking action for future
CC
Survey of Canadian mining professionals(mining companies, consulting firms, suppliers, govt.)

Survey of Canadian mining professionals(mining companies, consulting firms, suppliers, govt.)
Source: ArcticNorth Consulting, 2009
Action mostly engineering &
admin
Uncertainties and cost
remain main barriers to
action

Survey of Canadian mining professionals(mining companies, consulting firms, suppliers, govt.)
Source: ArcticNorth Consulting, 2009
Aspects of mine operations susceptible to climate change

Survey of Canadian mining professionals(mining companies, consulting firms, suppliers, govt.)
Source: ArcticNorth Consulting, 2009
Aspects of mine operations susceptible to climate change
Implications of policies (that are in response to CC) were not considered by the respondants