Climate Change Information System for UHI for Planning … · Climate Change Information System for...
40
Climate Change Information System for UHI for Planning and Design A Singapore Case Study Tian Kuay LIM, Singapore A Multi-agency Initiative (Urban Redevelopment Authority, National Parks Board, Housing Development Board, Building Control Authority, Singapore Land Authority, Land Transport Authority, Jurong Town Corporation, Information Development Agency and Ministry of National Development/Ministry of the Environment & Water Resources)
Transcript of Climate Change Information System for UHI for Planning … · Climate Change Information System for...
Climate Change Information System
for UHI for Planning and Design
A Singapore Case Study
Tian Kuay LIM, Singapore
A Multi-agency Initiative (Urban Redevelopment Authority, National Parks Board, Housing Development Board, Building Control
Authority, Singapore Land Authority, Land Transport Authority, Jurong Town Corporation, Information Development Agency and
Ministry of National Development/Ministry of the Environment & Water Resources)

Singapore - City in a Garden
Highly urbanised city: Population: 5.2Million, Land Area: 714 sq km - Tropical weather, High-rise Buildings & Rich Urban Forestry
- Environmental Stresses & Climate Change Impacts, include:
Urban Wind Channels ► Urban Heat Island Effects (Heat Ventilation)

BACKGROUND: UHI- A CONSEQUENCE OF URBAN
DEVELOPMENT
Source: Wong & Yu, 2005
CBD is
4 deg C hotter
than Lim Chu
Kang
• Trapping of heat within urban canyons
• Increased heat storage from man-made materials
• Less vegetation and evapotranspiration
• Anthropogenic heat release
• Poor air movement and reduced heat transfer

Singapore’s UHI could worsen in
future
• Due to combined effects of climate change (global warming) + further
intensification of urban developments
• Negative impacts on thermal comfort, health and building energy use
for cooling
BACKGROUND: UHI- A CONSEQUENCE OF URBAN
DEVELOPMENT

1. Geospatial and Environmental
Data
Map
Land Use
Temperature
Terrain
Wind
Sea Level
2. Integrated Urban Modelling & Simulation and & Sensing
Building Present Island
Sensing
Measuremen
t
Temperatur
e
Solar Radiation
Thermal Comfort
Map 3. User Interface and
Data Analytics Platform Adaptation & Mitigation Strategies
Calibrate and
Validate
Island
District
Building
Present
Future
Integrated Adaptation Planning and Design
(Combined effects of UHI + global warming)

6
BAU: GPR 5.6
All 40 Storey HDB Blocks
Improved scheme: GPR 4.2
Height differentiated HDB Blocks
Wind Velocity: 3.3m/s (NNW)
4.25m/s
0.00m/s Wind Velocity: 3.3m/s (NNW)
4.25m/s
0.00m/s
Urban Heat Island Effect Assessment
How will the development of a new town affect the wind flow and comfort (thermal) in adjacent
towns? Wind corridors; good ventilation; parks, open spaces and greenery?

Urban Greenery
Cool Materials
Cool Transport
Urban Ventilation
Reduce Heat Emissions
Shade Sunlight
Absorb Sunlight
(Minimal Radiation)
Evapotranspiration
Reduce
Heat
Reflect Sunlight
Increase air movement
Need for climate-sensitive planning and design upfront
UHI and global warming mitigation covers different aspects of our built
environment, and involves different agencies.
Integrated Adaptation Planning and Design
(Combined effects of global warming + UHI)

Location-Specific Thermal Comfort Stress Assessment uses integrated, coupled
multi-scales models:
(i) weather/climate & environment models (1~0.1 km resolution);
– GSM/RSM/MSM: Horizontal aspects 10km (regional domain) to (1~0.1 km resolution);
– Coupling of Land Surface Model (NOAH) to Urban Canopy Model – (Development)
(ii) urban modeling (1~10 metre resolution)
Based on OpenFoam and CFD code: Mass conservation and momentum equations were solved together
with specific model equations, such as energy balance, turbulence such as Spalart Allmaras turbulence
model, etc.
Thermal Comfort Assessment Framework
(1) Integrated, Coupled Multi-scales Urban Model
Incorporates Location as an Element for Decision-making

The effects of land use type and anthropogenic heat (AH) and its diurnal variation on the thermal and wind
environment such as coupling the Noah Land Surface Model (Chen and Dudhia, 2001) to the Single-
Layer Urban Canopy Model (Kusaka et al., 2001; Kusaka and Kimura, 2004) using a tile-approach
(Tewari et al., 2006).
Coupling of Land Surface Model to Urban Canopy Model
(Development- Preliminary Results)
Land Use/Land Cover Map
Sea breeze evolution in domain d04 at (a) 11:00 LT and
(b) 17:00 LT. (Left) 10 m wind field.

QUEST- Generate higher resolution of 40km Global temperatures (for baselines study) from the
coarser resolution of 200km from NCEP Reanalysis.

QUEST- Access to IPCC AR5 Global Climate Projections for the study of climate change impacts.

QUEST- Generate higher resolution of 10km regional temperatures (baseline study) over SE Asia
from the coarser resolution 40km global model.

QUEST- Generate higher resolution of 1km local temperatures (baseline study) over Singapore and
its surrounding region based on the coarser global and regional resolution with resolution of 40km
and 10km respectively.

QUEST- Generate of 2m street-level temperatures (baseline study) over JLD from the coarser
resolution 1km local model.

QUEST- Sensors installed over JLD for Calibration and Validation of the 2m street-level
temperatures (baseline study) over JLD.

QUEST- Access to the observations from Sensors installed over JLD for Calibration and
Validation of the 2m street-level temperatures (baseline study) over JLD.

• Define Domain of Interest;
• Data Extraction;
• Setting up of scenarios for Simulation
– Edit existing buildings/structures
– Add new buildings/structures
– Select the environmental conditions
– Select the simulations to run
– Select the outputs for the simulations
Modelling & Simulation of UHI for Urban
Planning & Design (Workflow)

Select the environmental conditions
Select the simulations to run
Select the outputs for the simulations
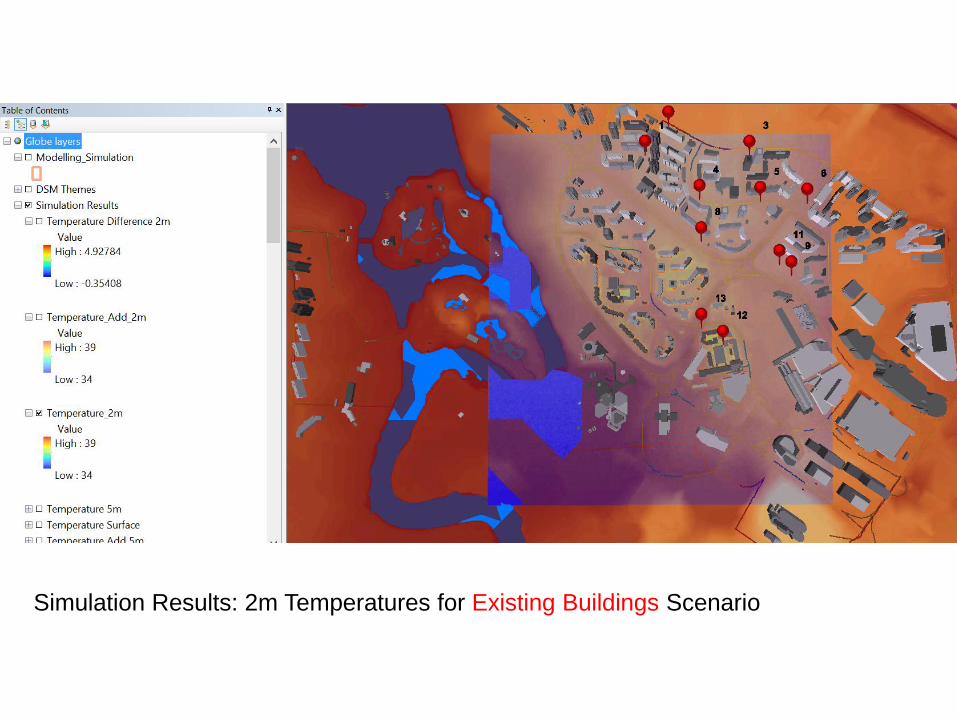
Simulation Results: 2m Temperatures for Existing Buildings Scenario

Simulation Results: 2m Temperatures with additional New Buildings Scenario

Simulation Results: Comparison of the 2m Temperatures for the two scenarios
(i) Existing Buildings Scenario; (ii) Adding New Buildings Scenario

Thermal Comfort Assessment/Simulation
TSV map during daytime (Tmax) (Current) TSV map during daytime (Tmax) (2050, A2)

Various Information Layers such as wind at 10m height, etc., for Decision Support
Module
Examples of other factors for Urban Planning and Design

Various Information ayers such as Inland Indundation A1_2100 ,for Decision Support Module

Various Information layers such as coastal Inland Indundation A1_2100 ,for Decision Support
Module

Combination of Various Information Layers such as Inland Indundation A1_2100 ,
Coastal, thermal comfort, etc. for Decision Support Module

COMMON GEOPLATFORMS FOR WOG DATA SHARING
AGENCY
SPECIFIC
SYSTEMS
Fine grained data in
Aggregated Data Zones
(ADZ) for detailed
analysis
GEO DATA GEO ANALYTICS
Heatmap. Service Area. Routing.
Proximity Search.
Tackling Climate
Change
Climate Change
Comm (CLICIS)
Multi-Window
Public Access
General
Public
NGOs Educational
Institutions
Businesses
Common Platforms:
Data: SCPR. Age. Gender. Ethnicity. Income. Student Enrolment. Household with Domestic Workers. Car Ownership. Construction Sites. Workers’ Dorm
SHARES
Restricted Presenter: Maryln Lim

Summary
A GIS-based UHI/Thermal Comfort Assessment Framework (based on
integrated coupled multi-scales atmospheric-urban-thermal comfort modelling)
provides an effective platform to support climate-sensitive design and planning
for Singapore with following key functionalities:
1) Data & Information Access & Retrieval
2) Planning, Design & Adaptation

Summary Data & Information Access & Retrieval

Summary Planning, Design & Adaptation

Areas for Development and Collaboration

A 3D GIS-based Modelling and
Simulation Tool for Planning & Design
of Sustainable Cities
THANKS
T

Urban Planning
“driven by the
vision of an
inclusive,
highly
liveable,
economically
vibrant and
green home
for all
Singaporeans
”

Integrated Modelling Platform
What would a Low CO2 emission city look like?

Modeling &Simulation (M&S) for Adaptation Planning (Biodiversity)
Cooling Energy Demand

An Assessment & Visualisation Tool
3D Carbon Accounting Tool

(a) Access to oceanic, atmospheric, and geophysical data archives, which includes the archive
of Global Synoptic Observation Data from 1901-Present of synoptic (hourly, 3-hourly,
and 6-hourly climate data) from across the globe as well as global precipitation analyses
(monthly, pentad, and daily) from surface and satellite measurements for 1979 onwards.
(NCEP/NCAR Reanalysis I: 1948-present (~200km); NCEP/DOE Reanalysis II: 1979-near
present (~200km); NOAA-CIRES 20th Century Reanalysis version 2 (20CRv2): 1871-2012
(~200km); NCEP Climate Forecast System Reanalysis (CFSR) (~38km): 1979-present;
Real-time NCEP Global Forecast System (GFS): 2015-present (~13km)
(b) Use of the datasets for the study of climate change and climatic baselines on UHI and
thermal comfort; Sharing of research and studies on heat stress index.
(c) Customisation of the global/regional datasets and optimisation of integration of the
downscaled global/regional climate data for the study of climate change and climatic
baselines on UHI and thermal comfort for ANY typical city planning and design;
(d) Optimisation of GSM/RSM/MSM/Urban Model for urban planning and design.
(I) Environmental Information Study of climate change and climatic baselines on UHI/Thermal
Comfort

(II) Modeling for Urban Environment
NOAH (NOAH land surface model)
Developed in NCEP, OSU, Air force, Hydrologic Research Lab
NOA1: maximum one-vegetation type considered in each cell
Coupling of Land Surface Model to Urban Canopy Model – NCEP RSM/MSM
The effects of land use type and anthropogenic heat (AH) and its
diurnal variation on the thermal and wind environment such as coupling
the Noah Land Surface Model (Chen and Dudhia, 2001) to the Single-
Layer Urban Canopy Model (Kusaka et al., 2001; Kusaka and Kimura,
2004) using a tile-approach (Tewari et al., 2006).

(III) Use of Environmental Information for Integrated
Planning & Design of Sustainable Cities
(a) Integration of Built and Natural Environment Datasets, incorporating
environmental datasets, sensing and simulation such as urban materials;
greenery types; scenario modelling (environment and climate) at various scales
(island, precinct and building scales); 3D wind, temperature, thermal comfort;
(b) Analytical and 3D visualisation tools and services to support planners and
managers in understanding the complex nature of urban development;
(c) Intelligent Disaster Decision Support System (IDDSS) for urban planning,
integrating a smart geospatial information platform with an advanced
optimisation and simulation engine to facilitate discovery and then integrate and
analyse the data to develop simulation and optimisation models;

THANK YOU