Climate Change in Prince George · on flood risk evaluation and flood control solution as well as...
58
Climate Change in Prince George Summary of Past Trends and Future Projections 31 August 2009 Ian M. Picketts University of Northern British Columbia Arelia T. Werner Trevor Q. Murdock Pacific Climate Impacts Consortium
Transcript of Climate Change in Prince George · on flood risk evaluation and flood control solution as well as...

Climate Change in Prince George
Summary of Past Trends and
Future Projections
31 August 2009
Ian M. Picketts University of Northern British Columbia
Arelia T. Werner Trevor Q. Murdock
Pacific Climate Impacts Consortium


Climate Change in Prince George
Summary of Past Trends and
Future Projections
31 August 2009
Ian M. Picketts University of Northern British Columbia
Arelia T. Werner Trevor Q. Murdock
Pacific Climate Impacts Consortium

(BLANK)
ii
Climate Change in Prince George
Summary of Past Trends and Future Projections
Executive Summary ........................................................................................................... iii Acknowledgements ............................................................................................................ iv About PCIC ........................................................................................................................ iv Preface ................................................................................................................................. v 1. Introduction ..................................................................................................................... 1 2. Background – Climate Change and Variability .............................................................. 2 3. Background – City of Prince George .............................................................................. 4 4. Baseline Climatology ...................................................................................................... 5
4.1. North-central BC ...................................................................................................... 5 4.2. Prince George Airport Climate Station .................................................................... 6
5. Climate Variability .......................................................................................................... 8 5.1. Temperature and Precipitation ................................................................................. 9
6. Climate Trends .............................................................................................................. 12 6.1. Temperature and Precipitation ............................................................................... 12
7. Streamflow .................................................................................................................... 15 7.1. Hydrographs ........................................................................................................... 16 7.2. Variability .............................................................................................................. 18 7.3. Trends .................................................................................................................... 20
8. Future Projections of Climate Change and Uncertainty ............................................... 23 8.1. Temperature ........................................................................................................... 24 8.2. Precipitation ........................................................................................................... 27 8.3. Streamflow ............................................................................................................. 30 8.4. Plant and Tree Species Suitability ......................................................................... 31
9. Summary and Implications ........................................................................................... 32 10. Vulnerabilities and Opportunities ............................................................................... 33 11. Recommendations for Future Directions .................................................................... 35 References ......................................................................................................................... 37 List of Tables .................................................................................................................... 40 List of Figures ................................................................................................................... 41 Appendix A: Summary of Events Leading to the Creation of this Report ....................... 43 Appendix B: Temperature and Precipitations Trends in Prince George ........................... 46
Citation: Picketts, I.M., A.T. Werner and T.Q. Murdock, 2009: Climate change in Prince George: summary of past trends and future projections. Pacific Climate Impacts Consortium, University of Victoria, Victoria BC, 48 pp.

Disclaimer
This information has been obtained from a variety of sources and is provided as a public service by the Consortium. While reasonable efforts have been undertaken to assure its accuracy, it is provided by the Consortium without any warranty or representation, express or implied, as to its accuracy or completeness. Any reliance you place upon the information contained within this document is your sole responsibility and strictly at your own risk. In no event will the Consortium be liable for any loss or damage whatsoever, including without limitation, indirect or consequential loss or damage, arising from reliance upon the information within this document.

iii
Executive Summary
Northern-central British Columbia is susceptible to climate change and its impacts. The City of Prince George is preparing for climate change in order to avoid potential disruptions to the systems that residents rely on. Such long range planning requires regional climate information. This report summarizes historical trends and projected future changes in the hydro-climatology for Prince George and surrounding areas. Much of the analysis has been presented at workshops in Prince George. This report provides a summary of potential implications, vulnerabilities, and opportunities based on input gathered at these events as well as additional research. Prince George is located in an area of strong climate variability and trends. The effects of climate variability, such as the El Niño / Southern Oscillation (ENSO) and the Pacific Decadal Oscillation (PDO), on climate and hydrology are presented. During the ENSO warm phase (El Niño) winters are 1.5°C to 2.0°C warmer on average with 5% to 15% less precipitation than usual; during its cool phase (La Niña) winters tend to be cooler and wetter than average. The warm (cool) phase of PDO adds an additional influence of approximately 1.0°C over decadal time scales. This climate variability is associated with reduced (enhanced) streamflow at several nearby locations during warm (cool) ENSO and PDO phases. Prince George has experienced an average warming trend of 1.3°C over the last century. Night-time low temperatures increased more rapidly than day-time highs. In recent decades, Prince George has become ‘less cold’ and a greater percentage of precipitation has fallen as rain rather than snow. These climate trends are consistent with streamflow trends at several locations where flow increased (decreased) in winter (summer). Annual temperatures in the region are projected to increase an average of 1.6°C to 2.5°C by the middle of the 21st century. Precipitation is projected to increase by 3% to 10% primarily in winter with possible decreases in summer. The magnitude of projected temperature change is likely to result in serious impacts as they are above the historical range in variability for this region, and will create conditions that have not occurred historically. Changes to streamflow timing and amount will depend on watershed location and type.
The City of Prince George is using this report in its flood risk assessment and in preparing the Adapting to Climate Change in Prince George report. Recommendations for further use of climate information to incorporate adaptation into the City’s land use and maintenance plans include seven actions that can be taken based on existing information, three that require information not included in this report, and nine that require additional analysis to thoroughly assess the vulnerability of infrastructure, improve emergency planning and maximize any positive benefits.

iv
Acknowledgements
This report was made possible by the City of Prince George through financial support as well as vision, in-kind support, input and guidance on adaptation needs from City staff Dave Dyer and Dan Milburn. Ian Picketts has been supported by the Pacific Institute for Climate Solutions in his research, as well as by the City of Prince George and the Canadian Institute of Planners. Many partners participated in a Planning Institute of British Columbia (PIBC) workshop as facilitators and by providing funding, including the BC Ministry of the Environment, University of Northern British Columbia (UNBC), BC Hydro, the Fraser Basin Council, Fraser Nechako Regional District, Visible Strategies, Environment Canada and Landworks Consultants. Special thanks go to Professors Eric Rapaport and John Curry (UNBC) for their assistance with the research, and to Robin Chang (UNBC) for her review of the report and assistance with preparing and facilitating the City of Prince George climate adaptation workshop. The authors are thankful for an internal review by Markus Schnorbus, PCIC hydrologist, as well as external reviews by Professor Stephen Déry, Canada Research Chair in northern hydrometeorology at UNBC and Professor Stewart Cohen, Adaptation & Impacts Research Division (AIRD) of Environment Canada. Each of these reviews enriched the final report, as did copy editing by Melissa Nottingham and Heather Travers (PCIC). The authors would also like to recognize Elizabeth Henry and Joan Chess from the Fraser Basin Council for their assistance at many stages towards developing an adaptation strategy for the City of Prince George. Finally, this report draws heavily upon work done by PCIC with the support of the Columbia Basin Trust (Murdock et al., 2007) and by the BC Ministry of Agriculture (Dawson et al., 2008).
About PCIC
The mission of the Pacific Climate Impacts Consortium is to quantify the impacts of climate change and variability on the physical environment in Pacific North America. The Pacific Climate Impacts Consortium is financially supported by BC Ministry of Environment, BC Hydro, BC Ministry of Forests and Range and several regional and community stakeholders. For more information see www.PacificClimate.org

v
Preface
This report is one in a series of regional assessments created as a collaborative effort between Pacific Climate Impacts Consortium (PCIC) staff and a community or region. These reports on past and future climate and hydrology are a product of the Regional Climate Impacts Theme, one of the four major Themes of the PCIC program. An integral part of the process is identifying a local “champion” who leads the effort of identifying community needs and ensuring that the report addresses these issues. This collaboration results in two-way knowledge transfer: to the champion on climate change science and impacts, as well as to PCIC staff on adaptation needs. Each champion acts as a liaison between PCIC staff and the local stakeholders. In addition to knowledge of local needs, each champion is an expert in a key regional biophysical impacts sector (e.g. forestry, agriculture) or in adaptation and extension. The community addressed in this report is the City of Prince George. The extramural champion is Ian Picketts, a graduate student in the Natural Resources and Environmental Studies program at the University of Northern British Columbia (UNBC), supported by research fellowships from the Pacific Institute for Climate Solutions and the Canadian Institute of Planners. The focus of Ian’s thesis is to partner with the City of Prince George to create a climate change adaptation strategy, making him a natural champion for this report. Ian led the organization of two adaptation workshops as part of this study. Ian is the lead author of this collaborative report; he wrote the introduction and regional context (sections 1, 2, 3), implications and recommendations (sections 9, 10 and 11) and drew upon content of previous similar PCIC reports in drafting the remaining sections. The PCIC staff contribution was led by Arelia Werner, a hydrologist who has contributed to four similar projects throughout BC and Yukon. Arelia gave presentations at two workshops in Prince George, conducted analysis and provided interpretation throughout sections 4, 5, 6, 7 and 8. My role (Murdock) was to provide the climate science background (particularly sections 4, 5, 6 and 8), interpretation throughout the report and general oversight of the project. Our active collaboration has resulted in a joint report that will be a valuable resource for the public, municipal staff, planners and researchers as the City continues to take steps in the long-term iterative process of adapting to climate change.
Trevor Q. Murdock
Climate Scientist and Program Lead Regional Climate Impacts Theme
Pacific Climate Impacts Consortium 31 August 2009

(BLANK)

1
1. Introduction
The purpose of this report is to summarize a preliminary analysis of historical and projected changes in hydro-climatology for the Prince George region. This document can be used as a tool to inform the public, municipal staff, planners and researchers of the potential risks and benefits of climate change in the region. Information from this report has been applied to the City’s work on flood risk evaluation and flood control solution as well as to climate change adaptation research and has the potential for use in several capacities. Some of these are as follows:
To provide climate information for the Adapting to Climate Change in Prince George report that is being prepared by UNBC and the City of Prince George. The report will evaluate climate impacts and set priorities for strategic adaptation planning through the upcoming iteration of the City of Prince George Official Community Plan, the new Integrated Community Sustainability Plan, and other initiatives.
To consider the impact of climate change on City infrastructure and then review operation and maintenance management of City infrastructure.
To identify vulnerabilities and potential opportunities resulting from climate change for key resource values and ecosystem components in Prince George.
To propose and prioritize initial adaptation actions that can be taken to address the identified vulnerabilities and opportunities.
To be an educational tool to raise awareness of potential climate change issues in the Prince George area.
To stimulate further discussion and actions to adapt resource management and planning in the Prince George region to a changing climate.
Several workshops and events have taken place in north-central British Columbia that raised awareness about climate change and adaptation. Please refer to Appendix A for a summary of these events. Early workshops and meetings contributed towards building support for the Prince George Climate Change Adaptation Strategy. Draft versions of figures contained in this report have been presented at some of the workshops listed in Appendix A.

2
2. Background – Climate Change and Variability
Climate change is already affecting the ecosystems and resources that humans depend on and these impacts are projected to increase (Parry et al., 2007). Managers and stakeholders in local areas will need to adapt to these changes. Sectors already being affected by climate change in British Columbia (BC) include water resources, forestry, agriculture, transportation, tourism and health (Walker and Sydneysmith, 2008). For example, it is projected that water resources in North America will be constrained by climate change (Parry et al., 2007). Demand from economic development, agricultural activities and population growth will further limit surface and groundwater availability in many areas within the Province. Many regions in the interior of BC have already felt the effects of water scarcity and have been forced to take action in response (Cohen and Neale, 2006). Over the last century, large changes have occurred in the climate of British Columbia. Average annual night-time low (minimum) temperatures increased between 1.0°C and 2.5°C throughout the Province and annual day-time high (maximum) temperatures increased between 0.5°C and 1.5°C. Seasonal trends of minimum temperature increases of as much as 3.5°C were detected in the winter and spring in Northern BC (Rodenhuis et al., 2007). These changes are greater than the average global temperature increase, which was approximately 0.6°C over the past hundred years (Solomon et al., 2007). Global temperatures will continue to increase during the 21st century by 1.1°C to 6.4°C depending on the worldwide level of future greenhouse gas emissions (Solomon et al., 2007). Although these changes seem small compared to normal seasonal and even daily temperature fluctuations, changes of this magnitude can have profound impacts on an ecosystem. For example, an average global temperature increase of approximately 4ºC over the course of about 8,000 years (occurring approximately 15,000 years ago) was sufficient to melt the vast ice sheets that once covered much of North America (Walker and Pellatt, 2003). Precipitation also changed throughout the 20th century in BC. Annual precipitation increased by an average of 22%, but the changes varied significantly across the Province and throughout the century. The beginning of the century was exceptionally dry in most places data were available. Increases were greatest in the northern interior regions of BC (Rodenhuis et al., 2007). The spatial distribution of precipitation is also changing as a result of climate change (Zhang et al., 2007). In addition to climate change, natural variability that occurs on decadal time scales is prevalent in the precipitation record for western North America. An example of this variability is the severe drought that occurred in the 1930s (Trenberth et al., 2007). The definitions of climate variability and climate change given here are based upon IPCC definitions (IPCC, 2007), modified to provide a plain language description of how they are used in this report.

3
Climate variability refers to variations in the climate, beyond individual weather events, over time scales such as years or decades. Variability is caused by natural internal processes within the climate system (internal variability) and by variations in natural or anthropogenic forces outside of the climate system (external variability). Climate variability is caused by several different mechanisms that redistribute heat and influence the movement of the atmospheric and hydrological systems of the Earth. In particular, Pacific North America as a whole, including the Prince George region, is strongly influenced by changes to the sea surface temperature of the Pacific Ocean and related effects on atmospheric flow patterns. Two climate oscillations that affect Prince George are the El Niño/Southern Oscillation (ENSO) and the Pacific Decadal Oscillation (PDO). ENSO influences climate variability on the scale of seasons to years, while the PDO occurs over 20 to 30 years. These two patterns are described further in section 5. Climate change refers to any change in climate over an extended period, such as several decades to a century. Climate change includes changes in measures of the climate system, such as averages of daily, monthly, seasonal and annual temperature and precipitation at the Earth’s surface, as well as the frequency of extremes. Climate change is caused by both natural internal processes and external forces such as human induced increases in greenhouse gas concentrations. The terms climate variability and climate change are not interchangeable, just as the terms weather and climate are not. Each term denotes a different concept. Figure 2-1 compares the timescales of climate variability and change as they are used in this document.
Climate VariabilityClimate Variability
Short term : (years Short term : (years to decadal) rises to decadal) rises and falls about the and falls about the trend line (ENSO)trend line (ENSO)
Climate ChangeClimate Change
Long Term Trends or Long Term Trends or major shifts in major shifts in climate: (centuries)climate: (centuries)
NormalsNormalsClimate OscillationsClimate Oscillations
MultiMulti--decadal decadal oscillations in oscillations in regional climate: regional climate: (e.g. PDO, NAO)(e.g. PDO, NAO)
NormalsNormalsClimate Change and Climate Variability
Figure 2-1 Visual Description of Climate Change and Climate Variability. Source: R.J. Lee.

4
3. Background – City of Prince George
Prince George is a city with a population of approximately 77,000 in north-central British Columbia. The city lies in the Fraser-Fort George Regional District and covers a total land area of 316 km2, or 33,000 hectares (Government of BC, 2009). It is situated near the geographical centre of British Columbia: 786 km north of Vancouver and 739 km west of Edmonton, Alberta, at 53°53′ north latitude 122°40′ west longitude. The elevation of Prince George is approximately 575 m in the city centre (City of Prince George, 2007). The City lies near the middle of the Sub-Boreal Spruce biogeoclimatic zone, which has a continental climate with extremes in hot and cold weather. Summers are short but warm and the area experiences long cold winters with snow cover from roughly November to March. Thunderstorms are frequent throughout the summer months, contributing to fire hazard as a major disturbance factor in the zone (BC Ministry of Forests, 2004). Lodgepole pine and trembling aspen are common pioneer species, with hybrid white spruce and subalpine fir as the more common late-successional species (BC Ministry of Forests, 2004). Due to its location within a richly forested landscape, both within and surrounding the city limits, Prince George is often referred to as ‘a city within a forest’. Lying east of the Coast Mountains, Prince George is often shielded from Pacific storms. The City is situated in the most northern region of the Fraser Plateau at the confluence of the Nechako and the Upper Fraser River, making it susceptible to flooding and ice-jams. Precipitation amounts are relatively low in this region of BC, but the headwater regions for these rivers are some of the Province’s most mountainous, including the Rocky Mountains for the Upper Fraser. This altitudinal gradient promotes large amounts of precipitation that are stored as snowpack during winter and later melted during the spring freshet.

5
4. Baseline Climatology
Often, temperature and precipitation are investigated and planning carried out on the basis of means and extremes of a given period, such as 30 years. The averages of temperature and precipitation over such a period are called climatology, or climate normals (Figure 2-1). In climate science, future projections of climate change are frequently given as a difference from these average recent conditions. See section 8 for future climate projections in the Prince George region. This section provides two types of climate information for Prince George for the 1961-1990 period. First, annual mean temperature and precipitation climatologies are shown by maps with station data interpolated to 4 km resolution by the Precipitation-elevation Regressions on Independent Slopes Model (PRISM). These maps provide an overview of the variation in temperature and precipitation over this area. Data are also presented in a tabular format for the Prince George airport station (Prince George A, 1096450) from the Adjusted Historical Canadian Climate Dataset (AHCCD). Monthly, seasonal and annual values of mean, minimum and maximum temperature, precipitation, rain and snow are summarized.
4.1. North-central BC
PRISM is an interpolation of station-based measurements of monthly and annual temperature and precipitation to regularly spaced grid cells (Daly et al., 1994). The resulting high resolution (4 km) surface reflects spatial variations in climate caused by elevation, aspect, effectiveness of terrain as a barrier to flow, proximity to the coast, moisture availability and inversionsi. Station data provided by Environment Canada and the global historic climatology network (GHCN) were used to create PRISM in BC and the Yukon (Simpson et al., 2005). Annual mean temperatures ranged from 0°C to 4°C in the area around Prince George during 1961-1990 (Figure 4.1-1a). In areas at higher elevations outside of Prince George, annual temperatures ranged from -2°C to 0°C with a few exceptional areas where temperatures averaged as low as -4°C. In the area immediately surrounding Prince George precipitation ranged from 450 mm to 1000 mm. In the western part of the region, which lies on the leeward side of the Coast Mountains, relatively low annual precipitation occurred (Figure 4.1-1b). Annual precipitation amounts in this area ranged from 450 mm to 750 mm. The areas east and north-east of Prince George, on the windward side of the Rocky Mountains, received between 750 mm and 2000 mm of precipitation annually.
i http://www.prism.oregonstate.edu/

6
4.2. Prince George Airport Climate Station
Baseline 1961-1990 temperature and precipitation data are provided for the Prince George airport climate station (1096450 AHCCD) as seasonal average climatologies for winter (December, January, February), spring (March, April, May), summer (June, July, August) and autumn (September, October, November). This station is one reference point within the region that reveals something about the monthly and seasonal variation of climate during the baseline period (Tables 4.2-1, 4.2-2, and 4.2.3). Standard deviation is provided for temperature and precipitation to indicate the typical deviation from the mean for the period. For precipitation, the coefficient of variation is also provided for the monthly values. This dimensionless number is defined as the ratio of the standard deviation to the mean, which is a measure of the amount of variation. The lower the value, the more the data approximates the mean. (Note: when the value of the mean is near zero, the coefficient of variation is not useful because it is too sensitive to small changes in the standard deviation.) The average summer (June, July, August) 1961-1990 temperatures in Prince George are a daytime high (maximum) of 21.1 °C and nighttime low (minimum) of 7.5°C. The average winter (December, January, February) 1961-1990 temperatures are a maximum of -3.6°C and a minimum of -12.3°C. Annual mean (average of daytime high and nighttime low) temperature for the 1961-1990 period was 3.7°C, as compared to a range of PRISM values for the surrounding area of 0°C to 4°C. Similarly, the station precipitation was 687 mm and the nearby range of precipitation was between 450 mm and 1000 mm (Figure 4.1-1b). On an annual basis, the ratio of rain to snow at the station was approximately 2:1. Both the temperature and precipitation values from the point measurement at the station (Tables 4.2-1, 4.2-2, and 4.2-3) and the PRISM 4 km interpolation (Figures 4.1-1a and 4.1-1b) are in agreement.
Figure 4.1-1 Baseline climate maps for the Prince George region, (a) annual mean temperature and (b) annual precipitation 1961-1990 climatology. Source: PRISM (Daly et al., 2004).
a b

7
On a monthly basis, all temperatures were lowest in January with a mean of -10.0°C, minimum of -14.1°C and maximum of -5.8°C. The largest standard deviation occurred in January for all three variables. The warmest temperatures occurred in July for all variables with a mean of 15.3°C, minimum of 8.4°C and maximum of 22.1°C (Table 4.2-2). The highest precipitation was in June, with 70 mm falling on average over the month (Table 4.2-3). In July and August, precipitation was comparable to that in January, but fell as rain rather than snow. Rain amounts were small relative to snow from December to February. The majority of the snow accumulated in November, December and January, followed by February and March. Table 4.2-1 Baseline (1961-1990) climate data for Prince George (1096450 AHCCD). Annual Winter Spring Summer Autumn Mean Temperature (°C) 3.7 -8.0 4.5 14.3 3.8 Standard Deviation (°C) 0.8 3.1 1.1 0.8 1.7 Maximum Temperature (°C) 9.2 -3.6 10.5 21.1 8.8 Standard Deviation (°C) 0.8 2.8 1.1 1.3 1.8 Minimum Temperature (°C) -1.9 -12.3 -1.5 7.5 -1.1 Standard Deviation (°C) 0.8 3.6 1.1 0.6 1.6 Precipitation (mm) 687 167 128 201 189 Standard Deviation (mm) 110 50 28 65 48 Rain (mm) 456 27 90 201 139 Standard Deviation (mm) 81 21 28 65 39 Snow (mm) 231 140 37 0 51 Standard Deviation (mm) 75 53 19 0 29 Table 4.2-2 Baseline (1961-1990) temperature data for Prince George (1096450 AHCCD). Jan Feb Mar Apr May Jun Jul Aug Sep Oct Nov Dec Mean Temperature (°C) -10.0 -5.5 -0.7 4.7 9.4 13.1 15.3 14.6 9.8 4.8 -3.2 -8.5Std Dev (°C) 5.0 4.0 2.2 1.3 1.0 1.4 1.1 1.4 1.6 1.2 3.7 4.3Minimum Temperature (°C) -14.1 -10.3 -6.0 -1.4 2.8 6.5 8.4 7.7 3.6 -0.1 -6.8 -12.5Std Dev (°C) 5.5 4.5 2.5 1.1 0.8 1.0 0.9 1.0 1.6 1.2 4.0 4.8Maximum Temperature (°C) -5.8 -0.7 4.6 10.8 16.0 19.7 22.1 21.5 16.0 9.8 0.6 -4.5Std Dev (°C) 4.5 3.6 2.0 1.7 1.5 2.1 1.6 2.2 2.0 1.6 3.4 3.9 Table 4.2-3 Baseline (1961-1990) precipitation, rain and snow data for Prince George (1096450 AHCCD). Jan Feb Mar Apr May Jun Jul Aug Sep Oct Nov Dec Precipitation (mm) 65 41 39 32 57 70 65 66 65 64 61 63Std Dev (mm) 36 18 16 13 23 37 32 31 31 29 25 29Coeff. of Variation 0.6 0.5 0.4 0.4 0.4 0.5 0.5 0.5 0.5 0.5 0.4 0.5Rain (mm) 7 10 14 23 54 70 65 66 64 56 19 10Std Dev (mm) 7 10 13 12 22 38 32 31 31 25 12 15Coeff. of Variation 1.1 1.0 0.9 0.5 0.4 0.5 0.5 0.5 0.5 0.5 0.7 1.4Snow (mm) 59 31 25 9 3 0 0 0 1 8 42 53Std Dev (mm) 36 20 16 9 3 0 0 0 3 10 24 24Coeff. of Variation 0.6 0.6 0.6 NA NA NA NA NA NA 1.2 0.6 0.4

8
5. Climate Variability
Climate has a natural cycle of variability that brings different temperatures and precipitation amounts from those found on average (section 2). There are multiple modes of variability including those with shorter periods such as the El Niño/Southern Oscillation and those that persist for extended (decadal) time periods like the Pacific Decadal Oscillation. The El Niño/Southern Oscillation (ENSO) is an irregular tropical Pacific ocean-atmosphere phenomenon associated with anomalously warm, or cool, sea water in the equatorial Pacific that influences climate around the world. The warm phase of ENSO is commonly referred to as El Niño, while the cool phase is called La Niña. ENSO tends to shift between the two extremes and a neutral state irregularly within a two to seven year period. Usually it does not remain in either the warm or cool phase for any longer than a year or two (although longer instances have occurred). Its effects are different from one episode to the next, depending on the strength and structure of the particular event. The Pacific Decadal Oscillation (PDO) is a large-scale climate oscillation characterized by spatial variations in the sea surface temperature (SST) and atmospheric pressure anomalies in the northern Pacific Ocean (Mantua et al., 1997; Zhang et al., 2000). The positive PDO phase is observed when the SSTs in areas of the North Pacific Ocean are below average and the SSTs along the west coast of North America are above average. The negative PDO phase is observed when the situation is reversed. The positive and negative phases of the PDO described above can also be referred to as warm and cool phases. One feature that distinguishes PDO from ENSO is its long lasting phases, which usually persist for 20 to 30 years, while typical ENSO events persist for 6 to 18 months (Mantua et al., 1997). The PDO amplifies or dampens the effects of ENSO (Mantua et al., 1997). For example, during the warm phase of the PDO, El Niño years tend to be even warmer (and similarly La Niña years even cooler during the PDO cool phase). PDO was in a cool phase from about 1890-1924 and from 1947-1976 and was in a warm phase from 1925-1946 and from 1977 until at least the mid-1990s (Hare and Mantua, 2000). A change from warm to cool may have occurred since the mid to late-1990s, but it is difficult to positively identify the change between phases until sufficient records have been accumulated, many years after a shift occurs. The PDO pattern as identified during the 20th century may also be significantly altered by climate change. The influence of ENSO and PDO on temperature, precipitation and streamflow in the Prince George region is shown in section 5.1, below. Seasonal climate variability was investigated for El Niño, La Niña, warm PDO and cool PDO phases. The influence of ENSO and PDO on snow water equivalent (SWE), a measure of snowpack, can be found in Rodenhuis et al. (2007). Streamflow responses to ENSO and PDO are presented in section 7. Second order effects that may result from hydro-climatic variability include geomorphologic events such as landslides and flooding, changes to sediment transport and fluctuations in freshwater fish populations (Fleming et al., 2007).

9
Awareness of the regional effects of ENSO and PDO can provide valuable information for planning purposes by helping managers to understand the historical variability of the climate.ii Variability is one part of the climate that operates in concert with longer term trends. The past response of temperature, precipitation and streamflow during warm phases of these large-scale circulation phenomena can be used as examples to illustrate how climate and hydrology might respond to future warming, with the caveat that warmer future climates will still have (possibly different) climate variability superimposed on changes to the average climate. Although future climate variability and changes to extremes will likely have important implications for adaptation, they are beyond the scope of this report; section 8 shows projected changes to the average climate only.
5.1. Temperature and Precipitation
The influence of ENSO in British Columbia through “teleconnections” (Moore et al., 2008) is strongest in spring and winter seasons. During an El Niño winter the jet stream in the mid-Pacific is more likely to split, creating storm tracks at low and high latitudes (Shabbar et al., 1997). This pattern contributes to the generally warmer than normal winter and spring temperatures and reduced precipitation that occurs over most of western Canada in response to El Niño. Conversely, during La Niña, western Canada normally experiences cooler and wetter winters. Warmer (cooler) winter temperatures occur throughout western Canada during positive (negative) PDO phases (Moore et al., 2008). Differences in precipitation associated with PDO are not as strong in magnitude or as spatially uniform as for temperature. The results described below are based on composites of the warm (El Niño) and cool (La Niña) phases of ENSO between 1900 and 2007 and the warm and cool phases of PDO between 1900 and 1998. Composites are calculated as differences from the long-term average. Results are provided for winter when the effects of these modes of variability are generally strongest. The source of the data was CANGRID, at a resolution of 50 km (see Rodenhuis et al., 2007 for a more detailed explanation). Winters in the area around Prince George during El Niño were 1.5°C to 2.0°C warmer than the average for the whole period (1900-2007) and 1.0°C to 1.5°C cooler than average during La Niña (Figure 5.1-1a,b). This response to ENSO is stronger than many other areas of the Province and is stronger than the influence of PDO. Winter temperatures were on average 0.5°C to 1.0°C warmer during warm-PDO phases and 0.5°C to 1.0°C cooler during cool-PDO phases (Figure 5.1-1c,d). As described above, ENSO and PDO reinforce each other when they are both in the same phase. Precipitation also has a larger response to ENSO (Figures 5.1-2a,b) than to PDO (Figures 5.1-2c,d) in the region. Winter precipitation near Prince George was on average 5% to 15% less during El Niño and 5% to 15% more during La Niña than the normal for the whole period (1900-2007). There is only minimal precipitation response to either PDO phase: a large portion of the
ii The ENSO signal is used to make relatively short term (compared climate change projections in section 8) seasonal outlook predictions up to a year in advance by Environment Canada http://www.weatheroffice.gc.ca/saisons/index_e.html

10
area surrounding Prince George falls within the -2% to +2% range for both the warm and cool phases. Finally, an additional mode of variability, called the Arctic Oscillation (AO), has been found to influence more northerly parts of Canada (Fleming et al., 2006). It is associated with fluctuations in the strength of the stratospheric polar jet. Investigation of the influence of AO on climate in BC is underway at PCIC. Preliminary results (not shown) indicate that Prince George temperatures tend to be slightly warmer during positive AO years by approximately 1°C.
Figure 5.1-1 Seasonal climate variability for mean temperature (a) El Niño winter, (b) La Niña winter, (c) warm PDO winter and (d) cool PDO winter for Prince George region. Results are composites from the 1900 to 2007 (ENSO) and 1900 to 1998 (PDO) calculated as degree Celsius differences from the long-term average. Black solid circles indicate statistically significant results (95% confidence level) compared to normal. Source: CANGRID (50 km) data.
a b
c d

11
Figure 5.1-2 Historical effects of ENSO and PDO on winter precipitation in Prince George. Seasonal climate variability for mean precipitation (a) El Niño winter, (b) La Niña winter, (c) warm PDO winter and (d) cool PDO winter. Results are composites from 1900 to 2007 (ENSO) and 1900 to 1998 (PDO) calculated as differences from the long-term average in percent of the 1961-1990 climatology. Black solid circles indicate statistically significant results (95% confidence level) compared to normal. Source: CANGRID (50 km) data.
c d
ba

12
6. Climate Trends
Eleven of the twelve years between 1995 and 2006 rank among the twelve warmest in the instrumental global surface air record since 1950 (Solomon et al., 2007). The global rate of warming over the last 50 years (0.13°C + 0.03°C per decade) (1956-2005) is almost twice that for the last 100 years (0.074°C + 0.018°C per decade) (1906-2005) (Solomon et al., 2007). Warming has been shown to be greatest in the northern latitudes and the majority of this warming has taken place in winter and spring (Solomon et al., 2007). Analyzing trends in temperature, precipitation and streamflow for Prince George and its surrounding area gives some indication of how these variables are being affected locally. Although current trends may not be extrapolated into the future, trend analysis illustrates the changes that have taken place in this region and provides context for comparison of trends in this area relative to others. It is also important to note that the trends are influenced by modes of decadal variability, such as the PDO, which was in a warm phase from 1977 to 1998 (sections 2 and 5). Trends in annual temperature and precipitation for several periods in the historical record are presented below (section 6.1). Streamflow trends are discussed in section 7.3, where analysis of trends in five-day means of streamflow and associated trends in temperature and precipitation are provided.
6.1. Temperature and Precipitation
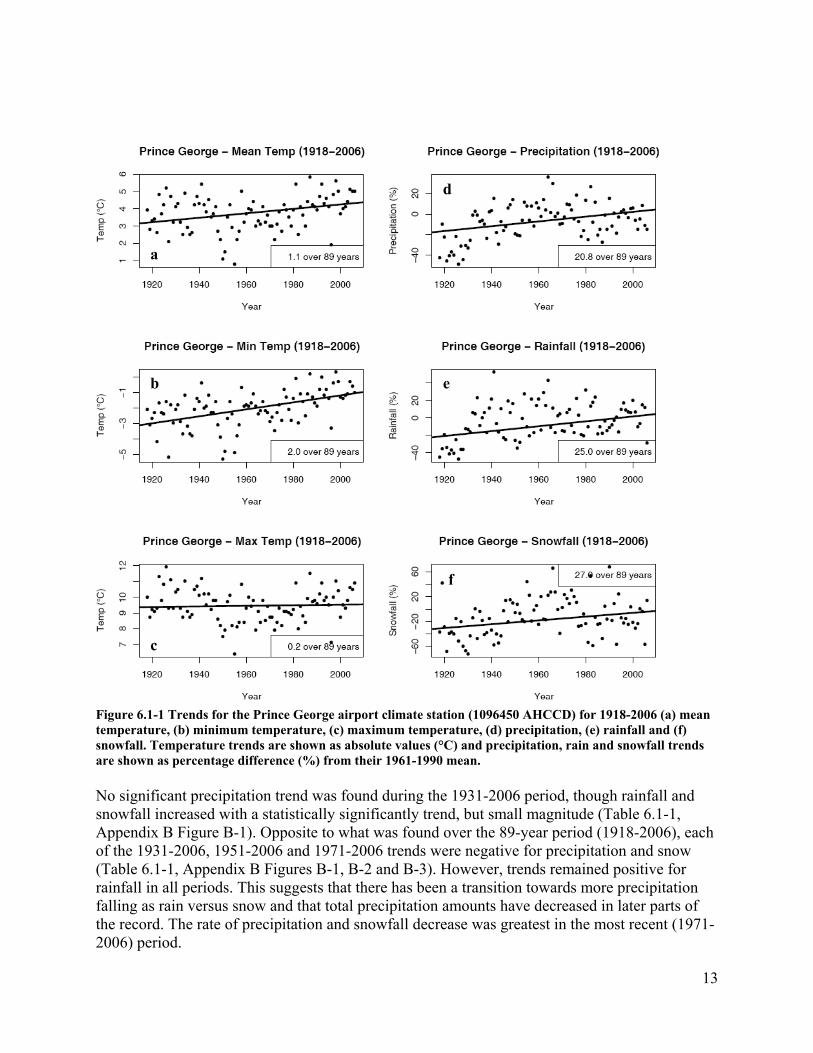
The Prince George airport climate station (1096450 AHCCD) that was described in section 4.2 was investigated for trends over the 1918-2006, 1931-2006, 1951-2006 and 1971-2006 periods. Trends were analyzed using an iterative approach, that included pre-whitening (Zhang et al., 2000) to remove autocorrelation. The magnitude of the trend was computed with the Theil-Sen method and significance was assessed with the Mann-Kendall test. These methods are suitable for use with datasets that are not necessarily normally distributed, such as precipitation, and are robust to the influence of outliers. The long-term (1918-2006) mean annual temperature trend for Prince George showed warming of 1.3°C per century (Figure 6.1-1a, Table 6.1-1). This trend was statistically significant at the 95% confidence level. Night-time low temperature (minimum) increased at a faster rate of 2.2°C per century (Figure 6.1-1b). Day-time high temperature (maximum) increased by only 0.4°C per century (Figure 6.1-1c). Precipitation, rainfall and snowfall all increased by more than 20% over the 89 year period from 1918 to 2006 (Figure 6.1-1d,e,f; Table 6.1-1). These increases are largely attributable to the low precipitation amounts found in the early part of the century. Precipitation at the climate station appears to respond strongly to the phases of PDO (Figure 6.1-1d), in contrast to the weak response indicated by composite maps (section 5.1). This result suggests that PDO may have a larger influence on precipitation in Prince George than suggested by the spatially interpolated CANGRID dataset that has low station density in the area.
13
Figure 6.1-1 Trends for the Prince George airport climate station (1096450 AHCCD) for 1918-2006 (a) mean temperature, (b) minimum temperature, (c) maximum temperature, (d) precipitation, (e) rainfall and (f) snowfall. Temperature trends are shown as absolute values (°C) and precipitation, rain and snowfall trends are shown as percentage difference (%) from their 1961-1990 mean. No significant precipitation trend was found during the 1931-2006 period, though rainfall and snowfall increased with a statistically significantly trend, but small magnitude (Table 6.1-1, Appendix B Figure B-1). Opposite to what was found over the 89-year period (1918-2006), each of the 1931-2006, 1951-2006 and 1971-2006 trends were negative for precipitation and snow (Table 6.1-1, Appendix B Figures B-1, B-2 and B-3). However, trends remained positive for rainfall in all periods. This suggests that there has been a transition towards more precipitation falling as rain versus snow and that total precipitation amounts have decreased in later parts of the record. The rate of precipitation and snowfall decrease was greatest in the most recent (1971-2006) period.
a
b
c
d
e
f

14
Trends in minimum, maximum, and mean temperature in the 1931-2006 period were roughly 0.1°C per decade larger than in 1918-2006 (Appendix B Figure B-1). All temperature trends continued to increase throughout the century (Appendix B Figures B-2 and B-3). The most recent warming trends were 0.5°C per decade in each minimum, maximum, and mean temperature over 1971-2006. Seasonal changes were not analyzed at the station, but were provided in an analysis conducted for the Province of BC for the 1900-2004 period (Rodenhuis et al., 2007) using the 50 km CANGRID interpolated dataset. Temperature trends just south of Prince George had the greatest increases in the winter (December-January-February) followed by spring (March-April-May) seasons over the 1900-2004 period. Precipitation increases of up to 40% for all seasons were found in the Prince George area over the 1900-2004 period. Table 6.1-1 Summary of temperature and precipitation trends for Prince George (1096450 AHCCD) for 1918-2006, 1931-2006, 1951-2006 and 1971-2006.
Time Period 1918-2006 1931-2006 1951-2006 1971-2006 Number of years 89 76 56 36 Trend per time period Minimum Temp (°C) 2.0 2.2 1.9 1.6
Mean Temp (°C) 1.1 1.6 1.8 1.7 Maximum Temp (°C) 0.2 0.8 1.7 1.9 Precipitation (%) 21 0 -8 -6 Rainfall (%) 25 1 5 8 Snowfall (%) 27 6 -26 -23
Trend per decade Minimum Temp (°C) 0.2 0.3 0.3 0.5 Mean Temp (°C) 0.1 0.2 0.3 0.5 Maximum Temp (°C) .02 0.1 0.3 0.5 Precipitation (%) 2 0 -1 -2 Rainfall (%) 3 0 1 2 Snowfall (%) 3 1 -5 -6
Trend per century Minimum Temp (°C) 2.3 3.0 3.4 4.5 Mean Temp (°C) 1.3 2.1 3.2 4.6 Maximum Temp (°C) 0.2 1.1 3.0 5.3 Precipitation (%) 23 0 -14 -15 Rainfall (%) 28 1 9 21 Snowfall (%) 30 8 -46 -63
* Temperature trends are shown as absolute amounts. Precipitation, rain and snowfall trends are shown as percentage changes from the 1961-1990 climatology.

15
7. Streamflow
Streamflow regimes can be classified into one of four categories: rainfall dominated (pluvial), a mixture of rainfall and snow-melt dominated (hybrid), snow-melt dominated (nival) and snow-melt and glacier-melt dominated (nival/glacial). Each category has defining characteristics that can be used to better understand streamflow response under a changing climate. Streamflow in rivers fed by glacier melt tend to peak in June or July, while those fed by snow melt peak in May. Summer precipitation may also contribute to flow from July through September in these systems, but both generally have low-flows from November to April. All other things being equal, catchments with glacier cover have larger and longer freshets that peak later than snow-melt dominated catchments, as well as higher base flow conditions (Fleming, 2005). The amount of glacier cover in a catchment is important in determining the magnitude of annual streamflow from a catchment. Stations used in the analysis are identified in Table 7-1. All are near Prince George and include both Reference Hydrometric Basin Network (RHBN) stations and non-RHBN stations. Stations classified as RHBN should not have been affected by human influences such as land-use change or water extraction, which makes them more suitable for climate studies. However, some RHBN stations have been impacted by human influences like logging or by natural disturbance like the mountain pine beetle (MPB). Caution should be taken when interpreting the non-RHBN results. Trends in streamflow at these stations cannot be directly attributed to climate trends or variability. Where possible, “naturalized” streamflow records created by Allan Chapman of the River Forecast Centre (RFC) by modeling streamflow with the UBCWM model were used in place of the non-RHBN stations (08JC001 and 08JC002). Basin area and percentage glacier cover values were retrieved from Environment Canada’s Station Information Map Vieweriii. This information helps to interpret streamflow changes and trends (Table 7.1-1). Table 7-1 Hydrometric station metadata.
Station # Station Name Time PeriodRHBN
Basin Area (km2)
Percentage Glacier Cover
08JA013 Skins Lake Spillway, Nechako
Reservoir 1956-2006 No n/a
n/a
08JC001 Nechako River at Vanderhoof
(Naturalized Flow, UBCWM model) 1958-2007 No 25,100
0.91
08JC002 Nechako River at Isle Pierre
(Naturalized Flow, UBCWM model) 1958-2007 No 42,500
0.55
07EE009 Chuchinka Creek near the Mouth 1975-2006 Yes 311
n/a
08ED001 Nanika River at Outlet of Kidprice
Lake 1950-2006* Yes 741
10.10
08JB002 Stellako River at Glenannan
(logged and pine beetle outbreak) 1929-2006** Yes 3,600
0.19 *The majority of the data before 1975 is missing. **The majority of the data before 1950 is missing.
iii http://scitech.pyr.ec.gc.ca/climhydro/welcome_e.asp

16
7.1. Hydrographs
Average streamflow for each pentad (5-day period) is shown for six stations for the 1961-1990 and 1976-2005 periods to demonstrate the average annual characteristics of each system (Figure 7.1-1). These hydrograph plots start in October (typically the onset of the wet season) and end in September, displaying the 12-month period known as the hydrologic year. Skins Lake Spillway at the Nechako Reservoir (08JA013) is a regulated river that has a unique hydrograph that is uncharacteristic of its natural regime. Naturalized flow was not available for this station. Results are presented to demonstrate the impact regulation can have on streamflow (compare Figure 7.1-1a to 7.1-1b through 7.1-1f). Streamflow on the Nechako River is regulated by the Kenney dam (operated by Rio Tinto) and is monitored at Vanderhoof (08JC001) and at Isle Pierre (08JC002). The system is snow and glacier-melt dominated, but regulation has altered the natural seasonality of the flow. Naturalized flow was available at 08JC001 and 08JC002 and was used in place of observed streamflow for analysis. Streamflow peaked primarily in May or June, during the early snow-melt period and flow was elevated in late summer and early fall (Figures 7.1-1b and 7.1-1c), likely because of the moderate glacier coverage in the Nechako watershed (Table 7.1-1). Chuchinka Creek near the Mouth (07EE009), Nanika River at Outlet of Kidprice Lake (08ED001) and Stellako River at Glenannan (08JB002) peak in May or June when snowpack melts with rising spring temperatures. 07EE009 and 08JB002 are snow-melt dominated rivers (Figures 7.1-1d and 7.1-1f). 08ED001 also has extended streamflow through late summer and early fall, likely due to glacier melt, which makes it a snow-melt and glacier-melt dominated system (Figure 7.1-1e). The predominant streamflow types found in the north-central region are snow-melt dominated and snow-melt/glacier-melt dominated. Each system can respond differently to climate change and variability. Hydrographs from the two time periods were compared to assess possible shifts in the hydrological regimes from one period to the next. Significant differences between the first and second period at the Skins Lake Spillway on the Nechako Reservoir (08JA013) were detected (Figure 7.1-1a). This is expected due to changes to regulation that took place from the earlier period to the later. Naturalized flows during 1976-2005 were significantly less in late-June and July than they were in 1961-1990 at the Nechako River at Vanderhoof (08JC001; Figure 7.1-1b) and Isle Pierre (08JC002; Figure 7.1-1c). This could be attributed to reductions in snowpack in the later period that resulted in snowpack melting out faster, leaving less water to replenish flow in early summer. Insufficient data were available to assess changes in streamflow between the two periods for stations 07EE009 and 08ED001 (Figures 7.1-1d and 7.1-1e). The Stellako River at Glenannan (08JB002) record started in 1950. Comparing 1961-1990 to 1976-2005 at this station, the later period shows significant reductions in flow during July and early-August (Figure 7.1-1f). This basin did have a small percentage of glacier cover in the 1990s; some of the reduction in flow could be associated with reduced glacier area. Logging and the mountain pine beetle outbreak have taken place in this watershed and could have contributed to changes in streamflow also.

17
−10 0 10 20 30 40 50
050
100
150
200
250
08JA013
5−day interval
Str
eam
flow
(m
3 s1 )
1961−1990 1976−2005
−10 0 10 20 30 40 50
020
040
060
0
08JC001
5−day interval
Str
eam
flow
(m
3 s1 )
1961−1990 1976−2005
−10 0 10 20 30 40 50
020
040
060
080
010
00
08JC002
5−day interval
Str
eam
flow
(m
3 s1 )
1961−1990 1976−2005
−10 0 10 20 30 40 50
05
1015
2025
30
07EE009
5−day interval
Str
eam
flow
(m
3 s1 )
1976−2005
−10 0 10 20 30 40 50
020
4060
8010
0
08ED001
5−day interval
Str
eam
flow
(m
3 s1 )
1976−2005
−10 0 10 20 30 40 50
020
4060
08JB002
5−day interval
Str
eam
flow
(m
3 s1 )
1961−1990 1976−2005
Figure 7.1-1 Pentad (5-day interval) climatology hydrographs for 1961-1990 baseline and 1975-2006 time periods for (a) 08JA013, (b) 08JC001, (c) 08JC002, (d) 07EE009, (e) 08ED001 and (f) 08JB002. See Table 7-1 for station names and meta data. Average streamflow for each pentad (5-day period) is provided in m3/s. The grey and black triangles indicate significant differences at the 95% and 99% confidence levels respectively. Source: RFC naturalized and RHBN data.
Regulated Naturalized
Naturalized
a b
c d
e f
5-day Interval
Oct Dec Feb Apr Jun Aug
Relative Month
5-day Interval
Oct Dec Feb Apr Jun Aug
Relative Month
5-day Interval
Oct Dec Feb Apr Jun Aug
Relative Month
5-day Interval
Oct Dec Feb Apr Jun Aug
Relative Month
5-day Interval
Oct Dec Feb Apr Jun Aug
Relative Month
5-day Interval
Oct Dec Feb Apr Jun Aug
Relative Month

18
7.2. Variability
Streamflow in BC has also been found to respond to ENSO and PDO (Fleming et al., 2007; Kiffney et al., 2002). The response of temperature and precipitation to climate variability was described in section 5.1. Below are plots of average monthly streamflow in north-central BC for the ENSO and PDO phases. ENSO was analyzed for all stations. However, only those stations that had sufficient records (1948-1998) were investigated for PDO. Over the 1948-1998 time period, two full phases of the PDO cycle were completed making it suitable for comparing the warm and cool phases. The most recent cool-PDO stretched from 1946 to 1976, which was followed by a warm-PDO phase (1977-1998). Average monthly streamflow during all El Niño years was compared to all La Niña years over the 1948 to 2006 period. Streamflow in the Nechako River at Isle Pierre (08JC002-Naturalized) was greater during La Niña than El Niño from June through September, with significant differences in August (Figure 7.2-1a). Streamflow was less during warm-PDO phases from June through February, with significant differences for most of the summer and fall (Figure 7.2-1b). The response at the Nechako River at Vanderhoof (08JC001-Naturalized) was similar, with greater flows during La Niña than El Niño for most of the year (not shown). The PDO response was also strong, with decreased flows during warm-PDO from June through to February (not shown). The naturalized flow record for 08JC001 and 08JC002 is from 1958 to 2007. Thus, there is only one of each (cool and warm) PDO phase in the record, with the warm phase occurring in the latter half. This means that the difference between warm and cool PDO composites in Figure 7.2-1b is exaggerated by 20th century trends (section 6.1). This does not affect the ENSO composites in Figure 7.2-1a because La Niña and El Niño events both occurred throughout the 1958 to 2007 record. Hamlet et al.(2005) also found that precipitation trends and PDO cycles have a combined influence on snowpack during the 1947 to 2003 period, which affects streamflow. Response to ENSO was strong for Chuchinka Creek near the mouth (07EE009; Figure 7.2-2) in May and June when streamflow during El Niño years was low compared to La Niña years, although differences were not statistically significant. Sufficient data were not available to analyze the PDO response for Chuchinka Creek. Stellako River at Glenannan (08JB002) had a minimal response to ENSO (Figure 7.2-3a), but a strong response to PDO (Figure 7.2-3b). During cool-PDO years, streamflow was ~20 m3s-1 more in June on average. Streamflow was greater during cool-PDO years from June to March and these differences were statistically significant. Similar to the Nechako River, anthropogenic warming during the warm-PDO phase likely contributed to the large difference between streamflow in the warm and cool-PDO phases at this site.

19
−2 0 2 4 6 8
020
4060
08JB002
Month
Str
eam
flow
(m
3 s1 )
El Nino La Nina Neutral
Oct Dec Feb Apr Jun Aug −2 0 2 4 6 8
020
4060
80
08JB002
Month
Str
eam
flow
(m
3 s1 )
PDO−cool PDO−warm
Oct Dec Feb Apr Jun Aug
−2 0 2 4 6 8
020
040
060
080
010
0008JC002
Month
Str
eam
flow
(m
3 s1 )
El Nino La Nina Neutral
Oct Dec Feb Apr Jun Aug −2 0 2 4 6 8
020
040
060
080
010
00
08JC002
MonthS
trea
mflo
w (
m3 s
1 )
PDO−cool PDO−warm
Oct Dec Feb Apr Jun Aug
Figure 7.2-1 Composite analysis hydrographs for (a) ENSO and (b) PDO on seasonal pattern of monthly streamflow (m3/s) for station 08JC002 - Nechako River at Isle Pierre (Naturalized Flow). The grey and black triangles indicate significant differences at the 95% and 99% confidence levels respectively. Source: RFC naturalized data.
−2 0 2 4 6 8
05
1015
2025
30
07EE009
Month
Str
eam
flow
(m
3 s1 )
El Nino La Nina Neutral
Oct Dec Feb Apr Jun Aug
Figure 7.2-2 Composite analysis hydrographs for ENSO on seasonal pattern of monthly streamflow (m3/s) for station 07EE009 - Chuchinka Creek near the Mouth. The grey and black triangles indicate significant differences at the 95% and 99% confidence levels respectively. Source: RHBN data.
Figure 7.2-3 Composite analysis hydrographs for (a) ENSO and (b) PDO on seasonal pattern of monthly streamflow (m3/s) for station 08JB002- Stellako River at Glenannan. The grey and black triangles indicate significant differences at the 95% and 99% confidence levels respectively. Source: RHBN data.
a b
a b

20
7.3. Trends
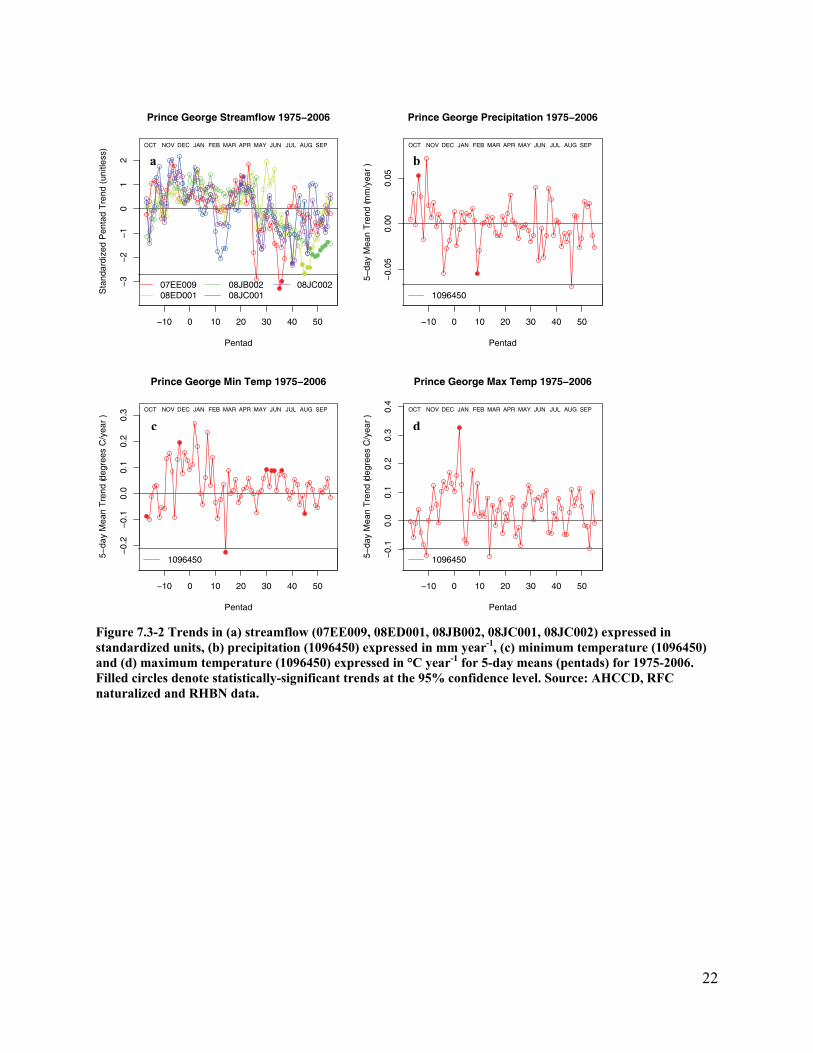
Trends in average streamflow for each pentad (5-day period) are useful for analyzing change in the timing of streamflow and to evaluate the rate at which changes have taken place (Dery, 2009). The following approach is modeled after Dery et al.’s (2009) methodology. For ease of comparison between stations, data were normalized by subtracting their mean and dividing by their standard deviation over the analysis period. Then averages were calculated for each of the seventy-three 5-day periods that occur over a year and evaluated for trend (1956-2006 and 1976-2006 periods). Trends are provided as the total change in standardized flow over the period of analysis. For example, for those stations analyzed for 1956-2006, the trend (increase or decrease in standardized flow) over 57 years of record is shown. In Figures 7.3-1 and 7.3-2, pentads shown on the horizontal axis are negative between October 1st and December 31st and positive from January 1st to September 30th. Months are given as a reference at the top of the plots. The standard trend range on the vertical axis may differ between the plots. Closed circles on the plots represent values that are significant at the 95% confidence level; open circles are not. Due to the relatively short period of record for the majority of the sites and limitations to interpreting statistical significance of streamflow trends (Dery, 2009), the following discussion will focus on the magnitude and direction of the trend. For the 1956-2006 period, streamflow trends were positive for the Stellako River at Glenannan (08JB002), the Nechako River at Vanderhoof (08JC001-Naturalized) and the Nechako River Isle Pierre (08JC002-Naturalized) from October through May, except in February (Figure 7.3-1a). Much of this increase coincides with a persistent rise in both minimum and maximum temperatures as detected at the Prince George airport climate station (1096450 AHCCD; Figures 7.3-1c and 7.3-1d) and increased ratio of precipitation falling as rain versus snow (Table 6.1-1). Thus, more streamflow was generated in the winter and less snowpack accumulated. Clear trends in precipitation amounts were not apparent for pentads over the analysis period however (Figure 7.3-1b). In both periods, relatively large negative trends in streamflow began in June and persisted through September. The warmer temperatures that caused less snowpack to accumulate over the winter resulted in snowpack being exhausted earlier in the summer, which decreased summer streamflow. Isolated positive trends in standardized flow occurred in August for the 08JC001(Naturalized) and 08JC002 (Naturalized). Positive trends for minimum and maximum temperature during spring and summer at Prince George airport could have elevated rates of evapo-transpiration and reduced soil moisture contributing to reduced streamflow. For the 1976-2006 period, two additional stations were analyzed. Data were not available until 1976 for Chuchinka Creek near the Mouth (07EE009) and the Nanika River at Outlet of Kidprice Lake (08ED001). Trends in streamflow were positive in winter for all stations and negative in summer for most stations, especially 08JB002 and 08ED001 (Figure 7.3-2a). A positive trend in winter minimum and maximum temperatures occurred (Figure 7.3-2c and Figure 7.3-2d). Warmer temperatures likely reduced snowpack accumulation by causing more precipitation to fall as rain. Decreases in streamflow for 08ED001 could also be related to decreases in glacier coverage in this basin. The Nanika River watershed above Kidprice Lake had 10% glacial coverage in the 1990s (Table 7.1-1). With warmer temperatures, the glacier area likely decreased during 1975-2006, resulting in reduced streamflow. The volume of glaciers in the central Coast Mountains, the region where 08ED001 is located, decreased during 1985-1999 (Schiefer et al., 2007).

21
−10 0 10 20 30 40 50
−3
−2
−1
01
23
4Prince George Streamflow 1956−2006
Pentad
Sta
ndar
dize
d P
enta
d T
rend
(un
itles
s)
08JB002 08JC001 08JC002
JAN FEB MAR APR MAY JUN JUL AUG SEPOCT NOV DEC
−10 0 10 20 30 40 50
−0.
04−
0.02
0.00
0.02
0.04
Prince George Precipitation 1956−2006
Pentad
5−da
y M
ean
Tre
nd (m
m/y
ear
)
1096450
JAN FEB MAR APR MAY JUN JUL AUG SEPOCT NOV DEC
−10 0 10 20 30 40 50
−0.
050.
000.
050.
100.
15
Prince George Min Temp 1956−2006
Pentad
5−da
y M
ean
Tre
nd (d
egre
es C
/yea
r )
1096450
JAN FEB MAR APR MAY JUN JUL AUG SEPOCT NOV DEC
−10 0 10 20 30 40 50
−0.
10−
0.05
0.00
0.05
0.10
Prince George Max Temp 1956−2006
Pentad
5−da
y M
ean
Tre
nd (d
egre
es C
/yea
r )
1096450
JAN FEB MAR APR MAY JUN JUL AUG SEPOCT NOV DEC
Figure 7.3-1 Trends in (a) streamflow (08JB002, 08JC001, 08JC002) expressed in standardized units, (b) precipitation (1096450) expressed in mm year-1, (c) minimum temperature (1096450) and (d) maximum temperature (1096450) expressed in °C year-1 for 5-day means (pentads) for 1956-2006. Filled circles denote statistically-significant trends at the 95% confidence level. Source: AHCCD, RFC naturalized and RHBN data.
a b
c d
22
−10 0 10 20 30 40 50
−3
−2
−1
01
2Prince George Streamflow 1975−2006
Pentad
Sta
ndar
dize
d P
enta
d T
rend
(un
itles
s)
07EE00908ED001
08JB00208JC001
08JC002
JAN FEB MAR APR MAY JUN JUL AUG SEPOCT NOV DEC
−10 0 10 20 30 40 50
−0.
050.
000.
05
Prince George Precipitation 1975−2006
Pentad
5−da
y M
ean
Tre
nd (m
m/y
ear
)
1096450
JAN FEB MAR APR MAY JUN JUL AUG SEPOCT NOV DEC
−10 0 10 20 30 40 50
−0.
2−
0.1
0.0
0.1
0.2
0.3
Prince George Min Temp 1975−2006
Pentad
5−da
y M
ean
Tre
nd (d
egre
es C
/yea
r )
1096450
JAN FEB MAR APR MAY JUN JUL AUG SEPOCT NOV DEC
−10 0 10 20 30 40 50
−0.
10.
00.
10.
20.
30.
4Prince George Max Temp 1975−2006
Pentad
5−da
y M
ean
Tre
nd (d
egre
es C
/yea
r )
1096450
JAN FEB MAR APR MAY JUN JUL AUG SEPOCT NOV DEC
Figure 7.3-2 Trends in (a) streamflow (07EE009, 08ED001, 08JB002, 08JC001, 08JC002) expressed in standardized units, (b) precipitation (1096450) expressed in mm year-1, (c) minimum temperature (1096450) and (d) maximum temperature (1096450) expressed in °C year-1 for 5-day means (pentads) for 1975-2006. Filled circles denote statistically-significant trends at the 95% confidence level. Source: AHCCD, RFC naturalized and RHBN data.
c d
a b

23
8. Future Projections of Climate Change and Uncertainty
Projections of future climate are provided as box plots from an ensemble of roughly 140 Global Climate Model (GCM) projections. GCMs are numerical representations of the climate system based on the physical, chemical and biological properties of its components, their interactions and their feedback processes. These projections are made up of a combination of multiple runs from 22 GCMs under each of the IPCC A2, A1B and B1 emissions scenarios. The A2 emissions scenario is considered to be ‘business as usual’ in which society continues to burn fossil fuels for most of its energy. The other emissions scenario commonly used is B1 which assumes much less greenhouse gas use globally. The A1B scenario is similar to A2 at first, but emissions decline after a few decades. Differences between projected climate change impacts across emissions scenarios are not large in the 2050s time frame, but become considerable later in the 21st century (Rodenhuis et al., 2007). Box plots (Figures 8.1-1, 8.1-2, 8.2-1, and 8.2-2) show the range of values projected by the various models with the “whiskers” at the end of the vertical lines to indicate the highest and lowest ranges of model projections. The top and bottom of the box shows the 25th and 75th percentiles and the horizontal bar within the box indicates the median value of the model projections. Thus, the middle 50% of the projections are enclosed by the box. Box plots are valuable for showing both the climate change projected by the majority of models as well as the level of uncertainty among models. In addition to boxplots based on an ensemble of GCMs, higher resolution regional information is provided in maps of results from a Regional Climate Model (RCM). However, there are fewer runs of RCMs than there are of GCMs. Climate projections provided by Ouranos Consortium are shown below for the 2050s from the Canadian Regional Climate Model (CRCM) at 45 km resolution (version 4.1.1, runs acs and act). The CRCM was forced (through boundary conditions at the edges of its domain – North America) by the ~350 km resolution Canadian Global Climate Model version 3 (CGCM3) following the A2 emissions scenario (run 4). Because the CRCM is at a higher resolution, it represents physical and dynamical processes as well as elevation and land surface characteristics in more detail than the GCM. It is capable of showing relief related effects, such as more precipitation on the windward side of mountains. Additionally, the RCM better represents the snow-albedo feedback: enhanced warming as snowpack diminishes leaving a lower albedo surface, such as soil or glacial firn exposed.iv Figures 8.1-3, 8.1-4, 8.2-3 and 8.2-4 show spatial differences in projected future climate from CRCM at 45 km resolution. These must be considered in the context of how the CRCM projected climate compares to the full ensemble of GCM projections, as shown in Figures 8.1-1 and 8.2-1 where all projections are averaged over the region. For north-central BC, CGCM3 (A2 run 4) projected changes to temperature and precipitation were warmer and wetter than most other GCMs. Thus it is probable that the CRCM version 4.1.1 results, because they are forced by this run, are also on the warmer and wetter end of results.
iv White surfaces, such as snow, have exceptionally high albedo. Thus, lower albedo surfaces absorb radiation, causing additional warming which inhibits snow accumulation.

24
Further RCM analysis is underway at PCIC, using projections from the North American Regional Climate Change Assessment Program. This program has set out to systematically investigate the uncertainties in future climate change projections at a regional level by running multiple RCMs with multiple GCMs over North America.v
8.1. Temperature
Based on the mid-range (25th to 75th percentiles) of the ensemble of ~140 GCM projections, annual temperature is projected to become 1.6°C to 2.5°C warmer by the 2050s (2041-2070), compared to the 1961-1990 baseline. Temperature is projected to increase slightly more in winter than summer. For more details see Figure 8.1-1, 8.1-2 and Table 8.1-1. CRCM temperature projections are relatively uniform over the area within a few hundred kilometers surrounding Prince George. Annual and winter temperature increases (Figures 8.1-3 and 8.1-4a) are smaller in the area of Prince George than in areas to the north, east and south. Table 8.1-1 Temperature projections for the 2020s, 2050s and 2080s based on roughly 140 GCM projections averaged over the Prince George region.
v http://www.narccap.ucar.edu
Temperature (°C)
Winter Summer Annual
2020s 2050s 2080s 2020s 2050s 2080s 2020s 2050s 2080s Maximum 3.2 5.1 6.7 2.4 4.3 6.1 2.4 4.0 5.7 75th percentile 1.9 3.0 4.5 1.4 2.5 3.6 1.4 2.5 3.7 Median 1.2 2.3 3.4 1.1 2.0 3.0 1.0 2.0 2.9 25th percentile 0.7 1.6 2.6 0.8 1.6 2.4 0.7 1.6 2.2 Minimum -0.7 0.0 0.6 0.4 0.8 0.9 0.1 0.7 1.4

25
Figure 8.1-1 Box plot of GCM projected change in annual mean temperature for the Prince George region as compared to the 1961-1990 baseline based on roughly 140 GCM projections that include 22 GCMs, run several times under the A2, A1B and B1 emissions scenarios. The red line indicates results from run 4 of CGCM3 forced with the A2 emissions scenario over the Prince George region.
a b
Figure 8.1-2 Box plots of GCM projected change in (a) winter and (b) summer mean temperature for the Prince George region as compared to the 1961-1990 baseline based on roughly 140 GCM projections that include 22 GCMs, run several times under the A2, A1B and B1 e missions scenarios. The red line indicates results from run 4 of CGCM3 forced with the A2 emissions scenario over the Prince George region.

26
Figure 8.1-3 Prince George region 2050s (2041-2070) projected annual mean temperature anomaly from the 1961-1990 baseline. Source: Ouranos Consortium (CRCM4 forced with CGCM3 following the A2 emissions scenario).
a b
Figure 8.1-4 Prince George region 2050s (2041-2070) projected (a) winter and (b) summer mean temperature anomaly from the 1961-1990 baseline. Source: Ouranos Consortium (CRCM4 forced with CGCM3 following the A2 emissions scenario).

27
8.2. Precipitation
Based on the mid-range (25th to 75th percentiles) of the ensemble of ~140 GCM projections, annual precipitation is projected to increase by 3% to 10% for the 2050s (2041-2070) compared with the 1961-1990 baseline (Table 8.2-1 and Figure 8.2-1). However, precipitation is projected to increase more in winter (+3% to +13%) and could decrease or increase (-6% to +5%) in summer depending on the projection (Table 8.2-1, Figure 8.2-2a and Figure 8.2-2b). Generally, projected winter precipitation increases become progressively larger from the 2020s to the 2080s. The impact of the changing climate is more certain for temperature than it is for precipitation, partly because precipitation is naturally more variable as has been demonstrated over the historical record (Rodenhuis et al., 2007). However, the fact that summer precipitation projections include possible increases and decreases indicates not only uncertainty but also a need to plan for adaptation to either situation. The CRCM projection is for a larger annual precipitation increase in the area northwest of Prince George than most other areas (Figure 8.2-3). Part of this region is at a high elevation, where the headwaters of the Nechako River are located. Seasonal changes show complex intra-regional patterns in winter and summer (Figure 8.2-4a and Figure 8.2-4b). These RCM results are based on a GCM projection that is wetter than most (CGCM3 A2 run 4) and must be taken in the context of the full ensemble. Compare the regional average from the RCM (red lines) to the GCM boxes in Figures 8.2-1 and 8.2-2. Table 8.2-1 Precipitation projections for the 2020s, 2050s and 2080s based on roughly 140 GCM projections averaged over the Prince George region.
Precipitation (%)
Winter Summer Annual
Time Period 2020s 2050s 2080s 2020s 2050s 2080s 2020s 2050s 2080s Maximum 17 27 34 20 26 23 11 19 27 75th percentile 8 13 19 4 5 7 6 10 15 Median 5 8 13 -1 -1 1 3 6 9 25th percentile 1 3 6 -5 -6 -8 1 3 6 Minimum -10 -8 -7 -19 -27 -32 -7 -6 -6

28
Figure 8.2-1 Box plots of GCM projected change in annual mean precipitation for the Prince George region as compared to the 1961-1990 baseline based on roughly 140 GCM projections that include 22 GCMs, run several times under the A2, A1B and B1 emissions scenarios. The red line indicates results from run 4 of CGCM3 forced with the A2 emissions scenario over the Prince George region.
a b
Figure 8.2-2 Box plots of GCM projected change in (a) winter and (b) summer mean temperature for the Prince George region as compared to the 1961-1990 baseline based on roughly 140 GCM projections that include 22 GCMs, run several times under the A2, A1B and B1 emissions scenarios. The red line indicates results from run 4 of CGCM3 forced with the A2 emissions scenario over the Prince George region.

29
Figure 8.2-3 Prince George region 2050s (2041-2070) projected annual mean precipitation anomaly from the 1961-1990 baseline. Source: Ouranos Consortium (CRCM4 forced with CGCM3 following the A2 emissions scenario).
Figure 8.2-4 Prince George region 2050s (2041-2070) projected (a) winter and (b) summer mean precipitationanomaly from the 1961-1990 baseline. Source: Ouranos Consortium (CRCM4 forced with CGCM3 following the A2 emissions scenario).
a b

30
8.3. Streamflow
Prince George is located near the confluence of the Fraser and Nechako Rivers, in the northern reaches of the Fraser River Basin. Studies are underway to understand how climate change will impact streamflow in the Fraser River Basin. One study completed in 2006 used CRCM versions 3.6 and 3.7 to investigate climate change for the Fraser River at Port Mann driven by the CGCM version 2 following the A2 emissions scenario and by National Centers for Environmental Prediction reanalysis data (Sushama et al., 2006). For the majority of the year (except August and September), CRCM simulated streamflow was higher than observed at the Fraser River at Port Mann (49°13N 122°49W). More recent RCM projections from a higher resolution (15 km) CRCM are also being analyzed by PCIC in collaboration with Ouranos Consortium. Several smaller test basins will be selected across BC to determine the influence of climate change on water balance components such as runoff. Initial studies will focus on the Peace, Campbell and Columbia River basins. Widespread mortality of pine trees as a result of the mountain pine beetle (MPB) infestation has occurred in over 13 million hectares of forest in BC, an area quadruple the size of Vancouver Island (BC Ministry of Forests, 2008). The majority of this outbreak lies within the Fraser River Basin, affecting approximately 35% of the drainage area. This infestation is expected to continue for another decade and kill more than 75% of the merchantable lodgepole pine volume in the interior of the Province (BC Ministry of Forests, 2008). At this scale, the potential exists for widespread hydrologic impacts within the basin. The ability to understand the problem with stand level studies is limited. As stated above, Prince George is downstream of the Nechako River (08JC002 - Nechako at Isle Pierre), which includes the Stuart-Lake drainage and the Upper Fraser River (08KB001 - Fraser River at Shelley). Flow from these basins has the potential to be altered by the MPB outbreak. The Variable Infiltration Capacity (VIC) hydrology model, developed at the University of Washington, has been used at PCIC in collaboration with the Climate Impacts Group at the University of Washington and the BC River Forecast Centre to quantify the hydrologic impacts of MPB outbreak within the Fraser River basin. VIC has been applied at a resolution of approximately ~5-6 km (27-32 km2) and used to quantify streamflow impacts for 60 sub-basins ranging in area from 330 km2 to 230,000 km2. The local and regional sensitivity of streamflow to MPB and harvest disturbance has been assessed using a set of seven scenarios. These include a pre-infestation baseline, current forest cover and five hypothetical scenarios of increasing disturbance severity. All scenarios are forced with meteorological data collected from 1915 to 2006. Preliminary results of the modeling effort focus on impacts to the annual maximum peak flow regime. Based on these results, peak flow impacts become more severe with increased severity of disturbance in the Fraser River in general. However, for the Nechako and Upper Fraser River upstream of Prince George, changes due to MPB will not likely be significant with respect to peak flow (Schnorbus et al., 2009). This work was funded by Natural Resources Canada. Work is ongoing to explore the mechanisms controlling basin sensitivity to MPB and harvest disturbance. PCIC is also conducting an analysis using VIC and statistically downscaled GCM scenarios to model projections of future streamflow.

31
8.4. Plant and Tree Species Suitability
Growing degree days are used as an agricultural indicator of when or if crops will reach maturity in a seasonvi. Annual total growing degree days ranged from 1000 to 1500 for the 1961-1990 period at Prince George (Figure 8.4-1a). Projections are for growing degree days to increase to the next category: 1500 to 2000 in the valley areas surrounding Prince George by the 2050s (Figure 8.4-1b). This range would be conducive to growing crops that previously could not have been grown in this area. For example, the growing degree day requirement for canola to mature is 1500 (NDAWN, 2007). The suitability of a given tree species to grow in the area is also expected to change in future (Hamann and Wang, 2006). Tree species suitability will be influenced directly by the changing climate but also indirectly through effects of climate change on forest pests. A PCIC project investigating the changes to tree species and pest suitability for two tree-pest systems (spruce-spruce bark beetle and Douglas fir-western spruce budworm) has recently been completed. Tree and pest suitability projections for the end of the century (not shown) indicate that spruce suitability will generally decline throughout the Prince George region. The area suitable for interior Douglas fir in BC is projected to decrease in the southern interior and increase in the northern interior; Prince George is in a transition zone between these areas where projected changes to suitability are relatively small (Flower and Murdock, in prep.; Murdock and Flower, 2009).
Figure 8.4-1 Annual mean growing degree days. Maps of (a)annual mean growing degree days (1961-1990) and (b) projected growing degree days the 2050s (2041-2070) by CGCM3 A2 run 4.
vi For example, a day that had a minimum temperature of 5°C and a maximum temperature of 11°C would have an average temperature of 8°C. This is 3 degrees Celsius above the 5°C threshold, so the degree day total for that day would be 3 degree days. If a month had 15 such days, with an average temperature of 8°C (3 degrees above the threshold) and the rest of the days had mean temperature below the 5°C threshold, that month would have 3°C×15 days = 45 °C×days = 45 degree days.
Figure 8.4-1 a) Climatology (1961-1990) of mean annual growing degree days (GDD) that are greater than 5°C. Source: PRISM. b) 2050s (2041-2070) projected high-resolution GDD. Source: PRISM, ClimateBC downscaling, LLNL (IPCC AR4).
a b

32
9. Summary and Implications
The climate of Prince George, with its extremes in hot and cold weather and snowy winters (section 4), makes it susceptible to climate change impacts in the future. Ecosystems, infrastructure and management practices are adapted to the current climate. Planning is required in order to avoid and prepare for consequences of climate changing outside of past ranges. Other factors, such as electricity generation and flooding, are dependent on the upstream watershed and will also be affected by climate change. Precipitation and temperature respond strongly to climate variability in the north-central region (section 5). During winter, temperatures can be 2.5°C to 3.5°C warmer and have 10% to 30% greater precipitation during El Niño years than normal. Differences between cool and warm phases of PDO are 1.0°C to 2.0°C in winter, with little variation in precipitation (section 5). Rates of warming in this region over the past century have been nearly twice the global average. Precipitation increased since the beginning of the century, but decreased by 8% from 1951 to 2006 (section 6). While this is a small decrease in total precipitation, it is made up of a 26% reduction in snowfall and a 5% increase in rain. Thus, the combined effect of changes to precipitation and temperature has been to change the form of precipitation to more rain and less snow with resulting streamflow patterns (section 7). Historical trends in river flows across the region are complex and depend on the flow regime of a particular river. Overall, winter streamflow has increased and summer streamflow has decreased in glacial and snow-melt fed rivers, although there are important local complications similar to ones that have been found in other areas (Fleming and Clarke, 2003; Stahl and Moore, 2006). Shifts in the timing and magnitude of streamflow have implications for aquatic habitats, hydro-electric power generation and flood control. Temperatures are projected to increase by 1.6°C to 2.5°C and precipitation to increase by 3% to 10% by the 2050s based on an ensemble of GCM projections (sections 8.1 and 8.2), causing further increases in the proportion of precipitation falling as rain. Changes in temperature of this magnitude are above the historical range in variability for this region and will create conditions that have not occurred before. In response, ecosystems will shift; plant and animal species, possibly invasive, may migrate into northern regions (Noss, 2001). The MPB outbreak has already killed many trees in the area. Preliminary studies of the impacts of MPB on streamflow suggest changes to peak-flow are limited, but other factors are still being investigated (section 8.3). Warming, longer fire seasons and increased fuel load may promote increases in the number and severity of forest fires (Flannigan and de Groot, 2009). The projected cold season temperature and precipitation changes could lead to diminished snowpack. Future hydro-electric power generation and susceptibility to flooding will depend on the response of the watershed to upstream changes. These responses are difficult to predict due to large elevation ranges, high variation in snowpack and fluctuations in glacier volume, and they require complex macro-scale hydrologic models to assist with projecting changes to streamflow in response to climate change.

33
10. Vulnerabilities and Opportunities
Shifts in temperature and precipitation could change stressors on the municipal infrastructure in Prince George in ways that are likely to have significant cost implications. For example, increases in temperature could reduce the energy needed for heating. The cost of maintenance and renewal of roads and airport landing strips depends on temperature and precipitation. In particular, increased freezing and thawing cycles have already been attributed to the increased rate of deterioration of road surfaces (Dyer, 2006).
The City of Prince George is partially built on a flood-plain, downstream of two high elevation areas that generate significant streamflow. This makes it susceptible to upstream hydro-climatic changes. The climate change projections described in section 8 could increase the likelihood of both floods and droughts. A study by Milly et al. (2002) has shown that floods have increased substantially during the 20th century and are projected to increase in the future in major rivers, including the Fraser. The drainage basin of the Nechako River is partially regulated by the Kenney dam and diverted to the Kemano power-plant. This regulation affects the flow regime of the Nechako and allows for flood control. The Kenney Dam has reduced Nechako River flows since it was built, but the effect on peak flows of regulating the river with the dam is not well understood (Northwest Hydraulics Consultants, 2009). Climate change may impact how the Nechako Reservoir is regulated by altering the timing and magnitude of flow volumes that need to be controlled. Changes in the seasonality of the streamflow in the Nechako River could lead to changes in the ability to generate power and also in changes to the ability of the dam to minimize floods. The City of Prince George relies on groundwater for the majority of its water supply; most (80%) of the City’s water wells come from aquifers that are recharged by the Nechako River. The future 20 year maximum day pumping rate from these wells is projected to be about 1.2% of the low water flow of the Nechako River (Golder Associates, 2003). The amount of water required by the City is a small percentage of the amount available; Prince George is not facing immediate water shortages. The aquifers that supply the City with water are unconfined, thus whatever is discharged at the surface will interact with the underground aquifer. Therefore these aquifers are susceptible to contamination. Reducing the pumping rate of a well means that less water is drawn in, so the drawdown radius (i.e. the area around the well that water is drawn from) of the well is decreased, as is the speed of drawdown of the well. Maintaining low pumping rates ensures the wells are more protected from contamination (M. Fornari, pers. comm. 2008). Although supplies seem more than adequate, careful management of water resources is required to ensure that the City will have a sustainable supply of clean water for the future even in the face of climate change. Regional temperature, precipitation and streamflow patterns are related to modes of climate variability such as PDO and ENSO. These influences could be taken into account when setting management strategies. However, some modes of climate variability could be altered by changes in climate, making them more or less extreme and altering their frequency. Storm tracks are projected to move poleward, which will result in changes in wind and storminess (Solomon et al., 2007), affecting the need to reinforce buildings to withstand stronger storms. More extreme precipitation is projected to occur in North America (Kharin et al., 2007). This means that there

34
may be an increasing number of emergency events such as floods, but also an increase in periods of drought (Christensen, 2007). The seasonal availability of water may be reduced, raising the possibility of more frequent periods of water scarcity (Solomon et al., 2007). Groundwater will also be influenced by climate change due to changes in recharge rates, surface water interactions, demand and lower availability of other sources such as surface water (Rivera et al., 2004). Forest fire, a natural disturbance, has also become a growing concern in BC over the last few years, as fire severity increases and the fire season lengthens (Flannigan and de Groot, 2009). Furthermore, future conditions may be more suitable for new species of plants and animals, including invasive species (Williamson, 2007). These problems are exacerbated by the pine beetle epidemic (see section 8.3). The annual allowable cut has been increased by approximately 27% in the area in recent years to allow for salvage harvesting of beetle affected wood. This increase in logging activity exacerbates the effect the beetle infestation is having on the hydrologic cycle by removing both living and dead trees from the environment (Government of BC, 2004). The hydrology of the region is also changing due to the recent large scale Mountain Pine Beetle infestation. This has affected many related processes such as transpiration, soil moisture storage, groundwater levels and recharge, snowfall, peak flows, flooding and erosion (section 8.3). Possible opportunities from changes in climate on ecosystems include greater potential to grow new crops (section 8.3) and a possible increase in the yield of those currently grown in the region (Tingle, 2003). However, roughly half of GCMs project decreased summer precipitation in north-central BC (section 8.2), which would restrict water available for irrigation. Other land-cover shifts in vegetation and disturbance and changes to crop suitability may be vulnerabilities or opportunities (Tingle, 2003). These and other vulnerabilities and opportunities will be discussed in more detail in the report: Adapting to Climate Change in Prince George.

35
11. Recommendations for Future Directions
This report is the product of a partnership between the Pacific Climate Impacts Consortium (PCIC) at the University of Victoria, the City of Prince George, and a local championvii at the University of Northern British Columbia. PCIC’s direct involvement in the local workshops enabled customization of the information contained herein to elements that are relevant and pertinent to the City. Input and reviews from a wide variety of people make this report a comprehensive reference for the City that will assist in climate change adaptation planning and other activities. Knowledge of local issues through extensive interactions with City staff, community stakeholders and researchers has helped to guide this document and will continue to guide future research.
In order to use the summary of past trends and future projections contained in this report to inform the development of adaptation strategies, there are some intermediate steps that could be considered. The following recommendations are examples of ways to proceed. These recommendations have come from the authors, reviewers and participants in the November 2008 “Adapting to Climate Change in Prince George” workshop. Recommendations have been divided into three general categories of action. Category 1 consists of actions that the City of Prince George can pursue in the near future with the information that they have, Category 2 consists of useful additional climate information not included in the scope of this report and Category 3 consists of useful information that would benefit Prince George, but is not yet readily available. PCIC and collaborators (such as UNBC and Environment Canada) may be able to assist in obtaining additional information in recommendations under bullets 2 and 3, depending on need, priority and funding.
1. Actions for the City of Prince George a. Make use of future climate projections when taking measures to reduce greenhouse gas
emissions (e.g. consider future climate conditions when undertaking green building, or considering alternative energy sources) (Castle et al., 1996).
b. Identify the location, types, life spans and replacement costs of infrastructure (i.e. airports, bridges, energy, hospitals, buildings, railroad, roads, sewer, schools, telecommunications structures, etc.) in order to determine ideal future time periods for adaptation planning (Larsen, 2007).
c. Conduct pilot projects to investigate possible adaptive measures that may require changes to current bylaws and regulations in order to be widely implemented.
d. Identify opportunities to take advantage of knowledge of current ENSO and PDO cycles on a year to year basis.
e. Adopt interim standards based on past standards, future projections and expert judgment while in depth studies are conducted into new standards (e.g., flood risk assessment).
f. Continue to use the Prince George community forest and the wildfire management strategy to mitigate forest fire risk within the City, identify new actions to minimize the urban wildfire interface, consider climate change in forest planning.
g. Share climate information with nearby communities that are included in this analysis so that they can benefit from this work.
vii See Preface for more information.

36
2. Additional information for Prince George a. Utilize information on El Niño / La Niña cycles to predict upcoming seasonal conditions
and plan proactively for them to more efficiently manage city activities, such as road salting and other areas identified by recommendation 1d.
b. Obtain monitoring and modeling results for lightning/storm frequencies from Environment Canada staff and professors at UBC who are currently experts in this type of modeling.
c. Make use of available projections of tree species suitability and pest outbreak suitability.
3. Further analysis that would benefit Prince George a. Obtain detailed freeze-thaw cycle trends and future projections. b. Update rating curves for major rivers, streams and waterways. c. Consider projections of precipitation and temperature for the Prince George region with
an ensemble of RCMs to estimate a range of uncertainty for the regional projections, to supplement the ensemble of GCM projections and single RCM provided here.
d. Provide information and predictions about sunshine hours. This could contribute to energy opportunities, businesses and marketing.
e. Assess vulnerability of infrastructure to climate change and potential for adaptive measures. Develop cost structures to incorporate climate change in planning for lifespan replacement estimates. Complete a full socioeconomic investigation (Larsen, 2007).
f. Investigate trends in precipitation intensity and exceedance thresholds. g. Develop indicators of future temperature, precipitation, and wind extremes so that the
City can plan proactively for these changes. For example wind might be important for impacts on infrastructure such as fallen trees, damaged hydro lines, fire hazards, etc.
h. Factor in the impacts of changes in vegetation on streamflow. i. Conduct analysis of inversions to determine impacts on air quality.

37
References
BC Ministry of Forests, 2004. The Ecology of the Sub-Boreal Spruce Zone, pp. 6. BC Ministry of Forests, 2008. 2006-2011 Mountian Pine Beetle Action Plan: Progress Report. Castle, E.N., Berrens, R.P. and Polasky, S., 1996. The economics of sustainability. Natural Resources Journal, 36:
475-490. CCIARN, 2003. Adapting to Climate Change in Northern British Columbia, Canadian Climate Impacts and
Adaptation Research Network, Prince George, BC. Christensen, J.H., Hewitson, B., Busuioc, A., Chen, A., Gao, X., Held, I., Jones, R., Kolli, R.K., Kwon, W.-T.,
Laprise, R., Magaña Rueda, V., Mearns, L., Menéndez, C.G., Räisänen, J., Rinke, A., Sarr, A., Whetton, P., 2007. Regional Climate Projections. In: S. Solomon, Qin, D., Manning, M., Chen, Z., Marquis, M., Averyt, K.B., Tignor, M., Miller, H.L. (Editor), Climate Change 2007: The Physical Science Basis. Contribution of Working Group I to the Fourth Assessment Report of the Intergovernmental Panel on Climate Change. Cambridge University Press, Cambridge United Kingdom and New York, NY, USA.
City of Prince George, 2007. Community Website: Our City. http://www.city.pg.bc.ca/pages/ourcity/. Cohen, S. and Neale, T., 2006. Participatory Integrated Assessment of Water Management and Climate Change in
the Okanagan Basin, British Columbia, Environment Canada and the University of British Columbia, Vancouver, BC, 188 pp.
Daly, C., Neilson, R.P. and Phillips, D.L., 1994. A statistical-topographic model for mapping climatological precipitation over mountainous terrain. Journal of Applied Meteorology, 33: 140-158.
Dawson, R., Werner, A.T. and Murdock, T.Q., 2008. Preliminary Analysis of Climate Change in the Cariboo-Chilcotin Area of British Columbia, University of Victoria, Victoria, BC, 49 pp.
Dery, S.J., Stahl, K., Moore, R.D., Whitfield, P.H., Menounos, B., Burford, J.E., 2009. Detection of runoff timing in pluvial, nival and glacial rivers of western Canada. Water Resources Research, 45(W04426): 1-11.
Dyer, D., 2006. Communities and Climate Change, Communities and Climate Change Conference, Prince George. Flannigan, M. and de Groot, B., 2009. Forest Fires and Climate Change in the Circumboreal Forest,
ALANIS/iLEAPS Workshop. Fleming, S.W., 2005. Comparative analysis of glacial and nival streamflow regimes with implications for lotic
habitat quantity and fish species richness. River Research and Applications, 21: 363-379. Fleming, S.W. and Clarke, K.C., 2003. Glacial control of water resource and related environmental responses to
climatic warming: Empirical analysis using historical streamflow data from Northwestern Canada. Canadian Water Resources Journal, 28(1): 69-86.
Fleming, S.W., Moore, R.D. and Clarke, G.K.C., 2006. Glacier-mediated streamflow teleconnections to the Arctic Oscillation. International Journal of Climatology, 26: 619–636.
Fleming, S.W., Whitfield, P.H., Moore, R.D. and Quilty, E.J., 2007. Regime-dependent streamflow sensitivities to Pacific climate modes cross the Georgia–Puget transboundary ecoregion. Hydrological Processes, 21(24): 3264-3287.
Flower, A. and Murdock, T.Q., in prep. Using an ensemble of downscaled climate model projections to assess potential impacts of climate change on spruce and Douglas-fir forests for decision-making in BC. Canadian Journal of Forest Research.
Golder Associates, 2003. Application for Environmental Certificate and Draft Comprehensive Study Report - City of Prince George Hart Water Supply Improvements; Fishtrap Island Collector Well Project, Prince George, BC.
Government of BC, 2004. Recommended Operational Procedures to Address Hydrological Concerns. http://www.for.gov.bc.ca/hfp/mountain_pine_beetle/stewardship/Hydrological%20Recommendations%20Dec%203%202004.pdf.
Government of BC, 2009. Community Facts: Prince George City. http://www.bcstats.gov.bc.ca/data/dd/factsheet/cf163.pdf.
Hamann, A. and Wang, T.L., 2006. Potential effects of climate change on ecosystem and tree species distribution in British Columbia. Ecology.
Hamlet, A.F., Mote, P.W., Clark, M.P. and Lettenmaier, D.P., 2005. Effects of temperature and precipitation variability on snowpack trends in the Western United States. Journal of Climate, 18(21): 4545-4561.
Hare, S.R. and Mantua, N.J., 2000. Empirical evidence for North Pacific regime shifts in 1977 and 1989. Progress in Oceanography, 47(2-4): 103-146.

38
IPCC, 2007. Climate Change 2007: Synthesis Report, IPCC (International Panel on Climate Change) Geneva, Switzerland,.
Kharin, V.V., Zwiers, F.W., Zhang, X. and Hegerl, G.C., 2007. Changes in Temperature and Precipitation Extremes in the IPCC Ensemble of Global Coupled Model Simulations. Journal of Climate, 20(8): 1419-1444.
Kiffney, P.M., Bull, J.P. and Feller, M.C., 2002. Climatic and hydrologic variability in a coastal watershed of Southwestern British Columbia. Journal of the American Water Resources Association, 38(5): 1437 - 1451.
Larsen, P., Goldsmith, S., Smith, O., Wilson, M., Strzepek, K., Chinowsky, P., Saylor, B., 2007. Estimating Future Costs for Alaska Public Infrastructure At Risk from Climate Change, Institute of Social and Economic Research, University of Alaska Anchorage, Anchorage, Alaska, 99 pp.
Mantua, N.J., Hare, S.R., Zhang, Y., Wallace, J.M. and Francis, R.C., 1997. A Pacific interdecadal climate oscillation with impacts on salmon production. Bulletin of the American Meteorological Society, 78(6): 1069-1079.
Milly, P.C.D., Wetherald, R.T., Dunne, K.A. and Delworth, T.L., 2002. Increasing risk of great floods in a changing climate. Nature., 415(514-517).
Moore, R.D., Spittlehouse, D.L., Whitfield, P.H. and Stahl, K., 2008. Chapter 3: Weather and Climate [Draft]. In: R.G. Pike, et al. (Editor), Compendium of forest hydrology and geomorphology in British Columbia. BC Ministry of Forests and Range, Research Branch, Victoria, BC and FORREX Forest Research Extension Partnership, Kamloops, BC, Kamloops, BC.
Murdock, T.Q. and Flower, A., 2009. Final Technical Report Forest Science Program Project # Y093061 Development and analysis of forest health databases, models, and economic impacts for BC: Spruce bark beetle & spruce; western spruce budworm and Douglas fir, Pacific Climate Impacts Consortium, University of Victoria, Victoria, BC.
Murdock, T.Q., Fraser, J. and Pearce, C., 2007. Preliminary Analysis of Climate Variability and Change in the Canadian Columbia River Basin: Focus on Water Resources 2006, University of Victoria, Victoria, BC, 57pp.
NDAWN, 2007. Canola Development and Growing Degree Days (GDD), http://ndawn.ndsu.nodak.edu/help.html?topic=canolagdd-info, May 16, 2007.
Northwest Hydraulics Consultants, 2009. City of Prince George Flood Risk Evaluation and Flood Control Solutions, 308 pp.
Noss, R., 2001. Beyond Kyoto: Forest management in a time of rapid climate change. Conservation Biology, 15(3): 578-590.
Parry, M.L., Canziani, O.F., Palutikof, J.P. and Co-authors, 2007. Technical Summary. Climate Change 2007: Impacts, Adaptation and Vulnerability. Contribution of Working Group II to the Fourth Assessment Report of the Intergovernmental Panel on Climate Change. Cambridge University Press, Cambridge, United Kingdom, 56 pp.
Rivera, A., Allen, D.A. and Maathuis, H., 2004. Climate Variability and Change - Groundwater, Chapter 10 in Environment Canada, Threats to the Availability of Water in Canada, National Water Research Institute, Burlington, Ontario, pgs. 89-95.
Rodenhuis, D., Bennett, K., Werner, A., Murdock, T.Q. and Bronaugh, D., 2007. Hydro-climatology and Future Climate Impacts in British Columbia. Pacific Climate Impacts Consortium, University of Victoria, 121 pp.
Schiefer, E., Menounos, B. and Wheate, R., 2007. Recent volume loss of British Columbian glaciers, Canada. Geophyscial Research Letters, 34: 1-6.
Schnorbus, M.A., Bennett, K.E. and Werner, A.T., 2009. Quantifying the Hydrologic Impacts of Mountain Pine Beetle and Salvage Harvest in the Fraser River Basin, British Columbia, Canada, EOS Trans. AGU, 90(22), Jt. Assem. Suppl., Abstract CG21A-23.
Shabbar, A., Bonsal, B. and Khandekar, M., 1997. Canadian precipitation patterns associated with the Southern Oscillation. Journal of Climate, 10: 3016 - 3026.
Simpson, J.J., Hufford, G.L., Daly, C., Berg, J.S. and Fleming, M.D., 2005. Comparing maps of mean monthly surface temperature and precipitation for Alaska and adjacent areas of Canada produced by two different methods. Arctic, 58(2): 137-161.
Solomon, S. et al., 2007. Technical Summary. Climate Change 2007: The Physical Science Basis. Contribution of Working Group I to the Fourth Assessment Report of the Intergovernmental Panel on Climate Change. Cambridge University Press, Cambridge, United Kingdom and New York, NY, USA.
Stahl, K. and Moore, R.D., 2006. Influence of watershed glacier coverage on summer streamflow in British Columbia, Canada. Water Resources Research, 42(W06201): 1-5.

39
Sushama, L., Laprise, R., Caya, D., Frigon, A. and Slivitzky, M., 2006. Canadian RCM projected climate-change signal and its sensitivity to model errors. International Journal of Climatology, 26: 2141-2159.
Tingle, J., 2003. Impacts of Climate Change on Agriculture in Northern BC, Adapting to Climate Change in Northern British Columbia Workshop, Prince George, BC, pgs. 48-51.
Trenberth, K. et al., 2007. Observations: Surface and Atmospheric Climate Change. In: Climate Change 2007: The Physical Science Basis. Contribution of Working Group I to the Fourth Assessment Report of the Intergovernmental Panel on Climate Change, Cambridge University Press, United Kingdom and New York, NY, USA.
Walker, I. and Pellatt, M., 2003. Climate change in coastal British Columbia — A paleoenvironmental perspective. Canadian Water Resources Journal, 28: 531-566.
Walker, I.J. and Sydneysmith, R., 2008. British Columbia. In: D. Lemmon (Editor), From Impacts to Adaptation: Canada in a Changing Climate 2007. Government of Canada, Ottawa, ON, pp. 329-386.
Williamson, T.B., Price, D.T., Beverly, D.T., Bothwell, J., Parkins, P.M., Patriquin, J.R., Pearce, M.N., Stedman, R.C., Volney, W.J.A., 2007. A Framework for Assessing Vulnerability of Forest-based Communities to Climate Change, Natural Resources Canada, Canadian Forest Service, Northern Forestry Centre, Edmonton, AB, 50 pp.
Zhang, X., Vincent, L.A., Hogg, W.D. and Niitsoo, A., 2000. Temperature and Precipitation Trends in Canada During the 20th Century. Atmosphere-Ocean, 38(3): 395-429.
Zhang, X. et al., 2007. Detection of human influence on twentieth-century precipitation trends. Nature, 448(7152): 461-465.

40
List of Tables
Table 4.2-1 Baseline (1961-1990) climate data for Prince George (1096450 AHCCD). .............................................. 7
Table 4.2-2 Baseline (1961-1990) temperature data for Prince George (1096450 AHCCD). ....................................... 7
Table 4.2-3 Baseline (1961-1990) precipitation, rain and snow data for Prince George (1096450 AHCCD). ............. 7
Table 6.1-1 Summary of temperature and precipitation trends for Prince George (1096450 AHCCD) for 1918-2006, 1931-2006, 1951-2006 and 1971-2006. ....................................................................................................................... 14
Table 7-1 Hydrometric station metadata. .................................................................................................................... 15
Table 8.1-1 Temperature projections for the 2020s, 2050s and 2080s based on roughly 140 GCM projections averaged over the Prince George region. ..................................................................................................................... 24
Table 8.2-1 Precipitation projections for the 2020s, 2050s and 2080s based on roughly 140 GCM projections averaged over the Prince George region. ..................................................................................................................... 27

41
List of Figures
Figure 2-1 Visual Description of Climate Change and Climate Variability. Source: R.J. Lee………………………. 3
Figure 4.1-1 Baseline climate maps for the Prince George region, (a) annual mean temperature and (b) annual precipitation 1961-1990 climatology. Source: PRISM (Daly et al., 2004). ................................................................... 6
Figure 5.1-1 Seasonal climate variability for mean temperature (a) El Niño winter, (b) La Niña winter, (c) warm PDO winter and (d) cool PDO winter for Prince George region. Results are composites from the 1900 to 2007 (ENSO) and 1900 to 1998 (PDO) calculated as degree Celsius differences from the long-term average. Black solid circles indicate statistically significant results (95% confidence level) compared to normal. Source: CANGRID (50 km) data. ...................................................................................................................................................................... 10
Figure 5.1-2 Historical effects of ENSO and PDO on winter precipitation in Prince George. Seasonal climate variability for mean precipitation (a) El Niño winter, (b) La Niña winter, (c) warm PDO winter and (d) cool PDO winter. Results are composites from 1900 to 2007 (ENSO) and 1900 to 1998 (PDO) calculated as differences from the long-term average in percent of the 1961-1990 climatology. Black solid circles indicate statistically significant results (95% confidence level) compared to normal. Source: CANGRID (50 km) data. ............................................ 11
Figure 6.1-1 Trends for the Prince George airport climate station (1096450 AHCCD) for 1918-2006 (a) mean temperature, (b) minimum temperature, (c) maximum temperature, (d) precipitation, (e) rainfall and (f) snowfall. Temperature trends are shown as absolute values (°C) and precipitation, rain and snowfall trends are shown as percentage difference (%) from their 1961-1990 mean. .............................................................................................. 13
Figure 7.1-1 Pentad (5-day interval) climatology hydrographs for 1961-1990 baseline and 1975-2006 time periods for (a) 08JA013, (b) 08JC001, (c) 08JC002, (d) 07EE009, (e) 08ED001 and (f) 08JB002. See Table 7-1 for station names and meta data. Average streamflow for each pentad (5-day period) is provided in m3/s. The grey and black triangles indicate significant differences at the 95% and 99% confidence levels respectively. Source: RFC naturalized and RHBN data. ........................................................................................................................................ 17
Figure 7.2-1 Composite analysis hydrographs for (a) ENSO and (b) PDO on seasonal pattern of monthly streamflow (m3/s) for station 08JC002 - Nechako River at Isle Pierre (Naturalized Flow). The grey and black triangles indicate significant differences at the 95% and 99% confidence levels respectively. Source: RFC naturalized data. .............. 19
Figure 7.2-2 Composite analysis hydrographs for ENSO on seasonal pattern of monthly streamflow (m3/s) for station 07EE009 - Chuchinka Creek near the Mouth. The grey and black triangles indicate significant differences at the 95% and 99% confidence levels respectively. Source: RHBN data. ..................................................................... 19
Figure 7.2-3 Composite analysis hydrographs for (a) ENSO and (b) PDO on seasonal pattern of monthly streamflow (m3/s) for station 08JB002- Stellako River at Glenannan. The grey and black triangles indicate significant differences at the 95% and 99% confidence levels respectively. Source: RHBN data. ............................................... 19
Figure 7.3-1 Trends in (a) streamflow (08JB002, 08JC001, 08JC002) expressed in standardized units, (b) precipitation (1096450) expressed in mm year-1, (c) minimum temperature (1096450) and (d) maximum temperature (1096450) expressed in °C year-1 for 5-day means (pentads) for 1956-2006. Filled circles denote statistically-significant trends at the 95% confidence level. Source: AHCCD, RFC naturalized and RHBN data. ..... 21
Figure 7.3-2 Trends in (a) streamflow (07EE009, 08ED001, 08JB002, 08JC001, 08JC002) expressed in standardized units, (b) precipitation (1096450) expressed in mm year-1, (c) minimum temperature (1096450) and (d) maximum temperature (1096450) expressed in °C year-1 for 5-day means (pentads) for 1975-2006. Filled circles denote statistically-significant trends at the 95% confidence level. Source: AHCCD, RFC naturalized and RHBN data. ..... 22
Figure 8.1-1 Box plot of GCM projected change in annual mean temperature for the Prince George region as compared to the 1961-1990 baseline based on roughly 140 GCM projections that include 22 GCMs, run several times under the A2, A1B and B1 emissions scenarios. The red line indicates results from run 4 of CGCM3 forced with the A2 emissions scenario over the Prince George region. .................................................................................. 25

42
Figure 8.1-2 Box plots of GCM projected change in (a) winter and (b) summer mean temperature for the Prince George region as compared to the 1961-1990 baseline based on roughly 140 GCM projections that include 22 GCMs, run several times under the A2, A1B and B1 e missions scenarios. The red line indicates results from run 4 of CGCM3 forced with the A2 emissions scenario over the Prince George region. ................................................... 25
Figure 8.1-3 Prince George region 2050s (2041-2070) projected annual mean temperature anomaly from the 1961-1990 baseline. Source: Ouranos Consortium (CRCM4 forced with CGCM3 following the A2 emissions scenario). 26
Figure 8.1-4 Prince George region 2050s (2041-2070) projected (a) winter and (b) summer mean temperature anomaly from the 1961-1990 baseline. Source: Ouranos Consortium (CRCM4 forced with CGCM3 following the A2 emissions scenario). ............................................................................................................................................... 26
Figure 8.2-1 Box plots of GCM projected change in annual mean precipitation for the Prince George region as compared to the 1961-1990 baseline based on roughly 140 GCM projections that include 22 GCMs, run several times under the A2, A1B and B1 emissions scenarios. The red line indicates results from run 4 of CGCM3 forced with the A2 emissions scenario over the Prince George region. .................................................................................. 28
Figure 8.2-2 Box plots of GCM projected change in (a) winter and (b) summer mean temperature for the Prince George region as compared to the 1961-1990 baseline based on roughly 140 GCM projections that include 22 GCMs, run several times under the A2, A1B and B1 emissions scenarios. The red line indicates results from run 4 of CGCM3 forced with the A2 emissions scenario over the Prince George region. ........................................................ 28
Figure 8.2-3 Prince George region 2050s (2041-2070) projected annual mean precipitation anomaly from the 1961-1990 baseline. Source: Ouranos Consortium (CRCM4 forced with CGCM3 following the A2 emissions scenario). 29
Figure 8.2-4 Prince George region 2050s (2041-2070) projected (a) winter and (b) summer mean precipitation anomaly from the 1961-1990 baseline. Source: Ouranos Consortium (CRCM4 forced with CGCM3 following the A2 emissions scenario). ............................................................................................................................................... 29
Figure 8.4-1 a) Climatology (1961-1990) of mean annual growing degree days (GDD) that are greater than 5°C. Source: PRISM. b) 2050s (2041-2070) projected high-resolution GDD. Source: PRISM, ClimateBC downscaling, LLNL (IPCC AR4). ..................................................................................................................................................... 31

43
Appendix A: Summary of Events Leading to the Creation of this Report
A summary of events leading to the creation of this report is as follows. A detailed overview of each event is included after the summary. In February 2003 a workshop was held in Prince George entitled “Adapting to Climate
Change in Northern British Columbia”. This workshop was put on by the Canadian Climate Impacts and Adaptation Research Network.
In May 2006 a workshop was held in Prince George entitled “Communities and Climate Change: Planning for Impacts and Adaptations”. The workshop was put on by the McGregor Model Forest Association.
o This workshop led to the creation of the Northern Climate Network, which now operates as part of the Resources North Association – see http://www.resourcesnorth.org/rna/380/nccn for more information.
In June 2008 a workshop was held in Prince George entitled “Planning for Climate Change”. This workshop was put on by UNBC, with assistance from the City of Prince George, the Fraser Basin Council, Environment Canada and others. The workshop occurred as part of the Planning Institute of British Columbia (PIBC) annual conference.
o For this event, PCIC conducted analysis and created graphics to demonstrate the influence of climate change and variability on air temperature, precipitation and streamflow in the past for the Prince George region. Projections of future changes in temperature, precipitation and snow water equivalent were also presented.
o The workshop proved to be an effective mechanism to raise awareness of climate change amongst the planning community and to stimulate dialogue around this new facet of planning. Many participants indicated that as a result of the workshop they had developed a solid understanding of why adaptation is required in response to climate change and had some examples of how they could adapt. The final plenary provided forum to share information with a large number of planners from across BC.
In November 2008 a stakeholder workshop was held for the City of Prince George entitled “Adapting to Climate Change in Prince George”. This workshop was put on by UNBC, with assistance from the Fraser Basin Council and the City. The workshop was designed to increase knowledge and awareness of climate change adaptation within the city and to identify a prioritized approach for developing a climate change adaptation strategy for the City.
o For this event PCIC presented past trends and future climate projections. Adapting to Climate Change in Northern British Columbia workshop: In February 2003, approximately 40 key stakeholders from across BC met in downtown Prince George for an “Adapting to Climate Change in Northern British Columbia” workshop. The purpose of the workshop was to ‘discuss impacts and adaptations’ to the changes that BC will experience as a result of climate change. This workshop was put on by the Canadian Climate Impacts and Adaptation Research Network. The workshop brought together local and provincial experts from across BC, as well as academics and industry representatives, to discuss this timely issue. Several key stakeholders in Prince George attended this workshop (CCIARN, 2003).
44
Communities and Climate Change workshop: Another workshop was held in Prince George on May 17, 2006 entitled, “Communities and Climate Change: Planning for Impacts and Adaptations”. This workshop was designed to enhance communication and coordination between climate change researchers, planners and community leaders and the general public. Dave Dyer from the City of Prince George was one of the presenters at this workshop. One of the key outcomes of this workshop was the conceptualization of a Northern Climate Network that would promote information sharing about climate change adaptation in the North. The Network (initiated by the former McGregor Model Forest Association, which is now the Resources North Association) provides a website and a listserv and has facilitated workshops and speaker events. It is looking to expand its services to help communities be better prepared for the potential impacts of climate change. For more information please visit http://www.resourcesnorth.org/rna/380/nccn. Planning for Climate Change workshop: In the fall of 2007, Grant Bain (Manager, Long Range Planning), Dave Dyer (Chief Engineer, Development Services) and Ian Picketts (Graduate Student, UNBC) along with his supervisors Dr. John Curry and Dr. Eric Rapaport agreed to team up to continue to work on climate change adaptation in Prince George. In early 2008, Dan Milburn replaced Grant Bain as the manager of long term planning. The group contacted the Pacific Climate Impacts Consortium (PCIC) to provide state-of-the-art climate model projections and interpretation. The group took advantage of the PIBC annual conference, which was hosted by the City of Prince George and was focused on climate change. As part of this conference, Ian Picketts organized and facilitated a full day “Planning for Climate Change” Workshop on June 12, 2008. The purpose of the workshop was to collaborate with Planners from across BC and the Yukon to educate professionals on the subject of climate change adaptation and also to discuss adaptation strategies for the case study community of Prince George. For this event, PCIC conducted analysis and created graphics to demonstrate the influence of climate change and variability on air temperature, precipitation and streamflow in the past for the Prince George region. Projections of future changes in temperature, precipitation and snow water equivalent were also presented. These visual tools provided a foundation for discussing impacts on water quality and quantity, flooding and stormwater, infrastructure and forest fires. Arelia Werner, from PCIC, gave a presentation about past and future climate changes at the Workshop and participated in the focus group sessions throughout the day. Ms. Werner was on hand to interact with the Workshop participants and also met briefly with municipal planners and engineers from the City to discuss the implications of the climate change impacts presented. From these interactions a few key ideas for future work were identified. Adapting to Climate Change in Prince George workshop: In November 2008 a stakeholder workshop was held in Prince George entitled “Adapting to Climate Change in Prince George”. Ian Picketts from UNBC organized the workshop with research assistant Robin Chang, along with Dave Dyer from the City of Prince George and Elizabeth Henry and Joan Chess from the Fraser Basin Council. The workshop utilized the climate information that was generated by PCIC. Once again, Arelia Werner was on hand to give a presentation about past and future climate changes to the group and to answer stakeholder

45
questions throughout the day. As part of this event, meetings occurred between UNBC researchers, PCIC representatives and senior City staff who were unable to attend the workshop. The purpose of this workshop was to engage Prince George city staff and key stakeholders in adapting to climate change. The workshop’s two principle objectives were; to increase the knowledge and awareness of climate change impacts and climate change adaptation priorities within the City of Prince George; and to identify a prioritized approach for developing a climate change adaptation strategy for the city. The one day workshop agenda is shown below.
Table A-1: Workshop agenda
Topic
Facilitator
Introduction to Workshop: Welcome, overview of workshop, definition of terms, summary of
climate change work occurring in PG
UNBC, City of PG
Understanding Projected Changes in PG’s Climate: Overview of the past changes and future temperature and
precipitation projections in the PG region.
PCIC (Pacific Climate
Impacts Consortium )
Identifying the Impacts of Climate Change in PG: Linking the climate projections with actual impacts on city infrastructure,
operations and planning.
Fraser Basin Council,
UNBC, City of PG, PCIC
Visioning an Adaptation Strategy for PG: Determining the priorities for an adaptation strategy and the best
approach for developing this strategy. Identifying the future vision for the City of PG and how we must plan to adapt to
climate change so that we can attain this vision. Wrap up, final thoughts and Future directions.
City of PG, Fraser Basin
Council, UNBC

46
Appendix B: Temperature and Precipitations Trends in Prince George
Figure B-1 Trends for the Prince George airport climate station (1096450 AHCCD) for 1931-2006 (a) mean temperature, (b) minimum temperature, (c) maximum temperature, (d) precipitation, (e) rainfall and (f) snowfall. Temperature trends are shown as absolute values (°C) and precipitation, rain and snowfall trends are shown as percentage difference (%) from their 1961-1990 mean.
a
b
c
d
e
f

47
Figure B-2 Trends for the Prince George airport climate station (1096450 AHCCD) for 1951-2006 (a) mean temperature, (b) minimum temperature, (c) maximum temperature, (d) precipitation, (e) rainfall and (f) snowfall. Temperature trends are shown as absolute values (°C) and precipitation, rain and snowfall trends are shown as percentage difference (%) from their 1961-1990 mean.
f
e
da
b
c

48
Figure B-3 Trends for the Prince George airport climate station (1096450 AHCCD) for 1971-2006 (a) mean temperature, (b) minimum temperature, (c) maximum temperature, (d) precipitation, (e) rainfall and (f) snowfall. Temperature trends are shown as absolute values (°C) and precipitation, rain and snowfall trends are shown as percentage difference (%) from their 1961-1990 mean.
a
b
f
c
e
d