Climate change impact on the seaweed Fucus serratus, a key foundational species on North Atlantic...
163
Introduction Paper I Paper II Paper III Overall conclusions Climate change impact on the seaweed Fucus serratus, a key foundational species on North Atlantic rocky shores Alexander Jüterbock [email protected] Faculty of Biosciences and Aquaculture University of Nordland PhD Thesis, 01.06.2010–12.08.2013 1 / 56
-
Upload
alexander-jueterbock -
Category
Science
-
view
54 -
download
0
Transcript of Climate change impact on the seaweed Fucus serratus, a key foundational species on North Atlantic...

Introduction Paper I Paper II Paper III Overall conclusions
Climate change impact on the seaweedFucus serratus, a key foundational species
on North Atlantic rocky shores
Alexander Jü[email protected]
Faculty of Biosciences and AquacultureUniversity of Nordland
PhD Thesis, 01.06.2010–12.08.2013
1 / 56

Introduction Paper I Paper II Paper III Overall conclusions
CO2 increase since the industrial revolution
2 / 56
Introduction Paper I Paper II Paper III Overall conclusions
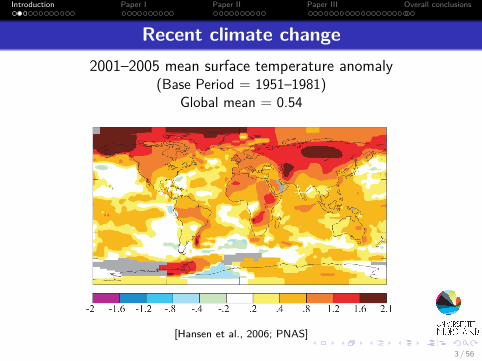
Recent climate change2001–2005 mean surface temperature anomaly
(Base Period = 1951–1981)Global mean = 0.54
[Hansen et al., 2006; PNAS]3 / 56

Introduction Paper I Paper II Paper III Overall conclusions
Climate change responses
..
Temperaturerise
.
Heat waves
.
Seasonalityshi
.
Oceanacidifica on
.
Migra on
.
Acclima on
.
Adapta on
.Species
4 / 56

Introduction Paper I Paper II Paper III Overall conclusions
High sensitivity of intertidal species
5 / 56

Introduction Paper I Paper II Paper III Overall conclusions
Seaweeds are key species in temperateNorth Atlantic regions
Between the 10℃ summer and the 20℃ winter isotherm
6 / 56

Introduction Paper I Paper II Paper III Overall conclusions
Seaweeds are key species in temperateNorth Atlantic regions
© Hoarau, G., 20106 / 56

Introduction Paper I Paper II Paper III Overall conclusions
Seaweeds are key species in temperateNorth Atlantic regions
6 / 56

Introduction Paper I Paper II Paper III Overall conclusions
The focal species Fucus serratus
7 / 56

Introduction Paper I Paper II Paper III Overall conclusions
Fucus in the tree of life
[Cock et al., 2010; Nature]
[Coyer et al., 2006; Mol. Phylogenet. Evol.]
Hybridization
8 / 56

Introduction Paper I Paper II Paper III Overall conclusions
Life cycle and dispersal of Fucus serratus
[Braune, 2008; Meeresalgen]
♂ ♀ dioecious
Fecundity: 106 eggs per female
low genetic exchange
9 / 56

Introduction Paper I Paper II Paper III Overall conclusions
Life cycle and dispersal of Fucus serratus
[Braune, 2008; Meeresalgen]
♂ ♀ dioecious
zygote dispersal: <10m
Fecundity: 106 eggs per female
low genetic exchange
9 / 56

Introduction Paper I Paper II Paper III Overall conclusions
Life cycle and dispersal of Fucus serratus
[Braune, 2008; Meeresalgen]
♂ ♀ dioecious
zygote dispersal: <10mpanmictic unit: 0.5–2km
Fecundity: 106 eggs per female
low genetic exchange
9 / 56

Introduction Paper I Paper II Paper III Overall conclusions
Distribution of F. serratus in the North Atlantic
Occurrence records
10 / 56

Introduction Paper I Paper II Paper III Overall conclusions
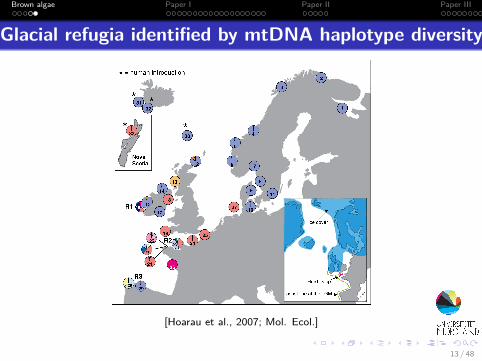
Distribution of F. serratus in the North AtlanticLast Glacial Maximum 18-20,000 years ago
Occurrence records Glacial Refugia[Hoarau et al., 2007; Mol. Ecol.]
10 / 56

Introduction Paper I Paper II Paper III Overall conclusions
Distribution of F. serratus in the North Atlantic
Occurrence records Glacial Refugia[Hoarau et al., 2007; Mol. Ecol.]
10 / 56

Introduction Paper I Paper II Paper III Overall conclusions
Recent changes in southern edge populationsof F. serratus
1999
201090% abundance declineReduced reproductive capacity[Viejo et al., 2011; Ecography]
11 / 56

Introduction Paper I Paper II Paper III Overall conclusions
Objectives
..
Migra on
.
Acclima on
.
Adapta on
.Fucusserratus
Distributional shiftuntil 2200
Warm temperaturetolerance
Genetic changes over the past decadeAdaptive potential to future stress
12 / 56

Introduction Paper I Paper II Paper III Overall conclusions
Objectives
..
Migra on
.
Acclima on
.
Adapta on
.Fucusserratus
Distributional shiftuntil 2200
Warm temperaturetolerance
Genetic changes over the past decadeAdaptive potential to future stress
13 / 56

Introduction Paper I Paper II Paper III Overall conclusions
Paper I - Migration
14 / 56

Introduction Paper I Paper II Paper III Overall conclusions
Objectives
..
Migra on
.
Acclima on
.
Adapta on
.Fucusserratus
Predominant seaweeds in the North-Atlantic
Fucus serratus Fucusvesiculosus
Ascophyllumnodosum
Shores with biggest ecological change?
Assemblage shift?
15 / 56

Introduction Paper I Paper II Paper III Overall conclusions
Ecological Niche ModelingPresent-day conditions
Bio-ORACLE database[Tyberghein et al., 2011; Global Ecol. Biogeogr.].
Georeferenced Occurrences
DA (m−1)SST (℃)
SAT (℃)
Ecological Niche Model (Maxent [Phillips et al., 2006; Ecol. Model.])
2000 2100 ? 2200 ?16 / 56

Introduction Paper I Paper II Paper III Overall conclusions
Ecological Niche ModelingPresent-day conditions
Bio-ORACLE database[Tyberghein et al., 2011; Global Ecol. Biogeogr.].
Georeferenced Occurrences
DA (m−1)SST (℃)
SAT (℃)
Ecological Niche Model (Maxent [Phillips et al., 2006; Ecol. Model.])
2000 2100 ? 2200 ?CO2 emission scenario changes
SST (℃)SAT (℃)
SST (℃)SAT (℃)
16 / 56

Introduction Paper I Paper II Paper III Overall conclusions
Predicted Niche ShiftsBased on the intermediate IPCC scenario A1B
17 / 56

Introduction Paper I Paper II Paper III Overall conclusions
ConclusionsMigration
..
Migra on
.
Acclima on
.
Adapta on
.Fucusserratus
Shores with biggest ecologicalchange?
Warm temperate and Arctic areasAssemblage shift?
18 / 56

Introduction Paper I Paper II Paper III Overall conclusions
Predominant seaweeds shift northward as anassemblage
East-Atlantic
F. serratus F. vesiculosus A. nodosum
19 / 56

Introduction Paper I Paper II Paper III Overall conclusions
ConclusionsMigration
..
Migra on
.
Acclima on
.
Adapta on
.Fucusserratus
Shores with biggest ecologicalchange?
Warm temperate and Arctic areasAssemblage shift
20 / 56

Introduction Paper I Paper II Paper III Overall conclusions
Climate change impact also on subtidal kelp
[Raybaud et al., 2013; PLOS ONE]
Percentage of models forecasting adisappearance of Laminaria digitata
21 / 56

Introduction Paper I Paper II Paper III Overall conclusions
ConclusionsMigration
..
Migra on
.
Acclima on
.
Adapta on
.Fucusserratus
Shores with biggest ecologicalchange?
Warm temperate and Arctic areasAssemblage shift
Mitigation by acclimation or adap-tation?
22 / 56

Introduction Paper I Paper II Paper III Overall conclusions
Objectives
..
Migra on
.
Acclima on
.
Adapta on
.Fucusserratus
Distributional shiftuntil 2200
Warm tempera-ture tolerance
Genetic changes over the past decadeAdaptive potential to future stress
23 / 56

Introduction Paper I Paper II Paper III Overall conclusions
Paper II - Acclimation
Thermal stress resistance of the brown algaFucus serratus along the North-Atlantic coast:acclimatization potential to climate change
Alexander Jueterbock, Spyros Kollias, Irina Smolina,Jorge M.O. Fernandes, James A. Coyer, Jeanine L. Olsen, Galice Hoarau
Marine Genomics. Submitted
24 / 56

Introduction Paper I Paper II Paper III Overall conclusions
Objectives
..
Migra on
.
Acclima on
.
Adapta on
.Fucusserratus
Local thermal adaptation?
Areas under highest extinction risk?
25 / 56

Introduction Paper I Paper II Paper III Overall conclusions
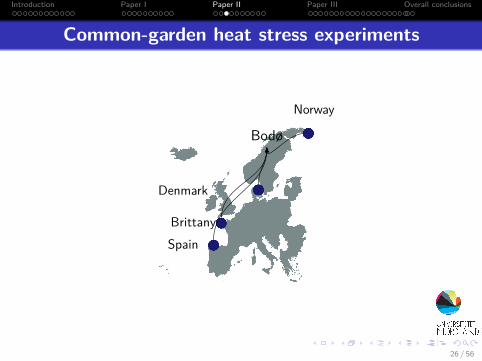
Common-garden heat stress experiments
Norway
Denmark
BrittanySpain
26 / 56
Introduction Paper I Paper II Paper III Overall conclusions
Common-garden heat stress experiments
Norway
Denmark
BrittanySpain
Bodø
26 / 56

Introduction Paper I Paper II Paper III Overall conclusions
Common-garden heat stress experiments
Norway
Denmark
BrittanySpain
Bodø
Acclimation at 9℃
26 / 56

Introduction Paper I Paper II Paper III Overall conclusions
Common-garden heat stress experiments
Norway
Denmark
BrittanySpain
Bodø
Heat stress, > 6 ind./pop
1h Stress 24h Recovery
9℃
20℃24℃28℃32℃36℃
T (°C)
Time
26 / 56

Introduction Paper I Paper II Paper III Overall conclusions
Measuring the physiological stress response
Fitness
TemperatureBenignStress StressLethal Lethal
Pho
tosynthetic
performance
Fluorescence measurements
20℃–36℃
27 / 56

Introduction Paper I Paper II Paper III Overall conclusions
Photosynthetic response
0 4 8 12 16 20 24 28 32 36 ℃
Tested temperature range
NorwayDenmarkBrittanySpain
stress without recoverystress with recovery
28 / 56

Introduction Paper I Paper II Paper III Overall conclusions
Photosynthetic response
0 4 8 12 16 20 24 28 32 36 ℃
Tested temperature range
NorwayDenmarkBrittanySpain
stress without recoverystress with recovery
Local adaptation
28 / 56

Introduction Paper I Paper II Paper III Overall conclusions
Photosynthetic response
0 4 8 12 16 20 24 28 32 36 ℃
Tested temperature range
Thermal range in 2000NorwayDenmarkBrittanySpain
stress without recoverystress with recovery
Local adaptation
sst meansst range
28 / 56

Introduction Paper I Paper II Paper III Overall conclusions
Photosynthetic response
0 4 8 12 16 20 24 28 32 36 ℃
Tested temperature range
Thermal range in 2000NorwayDenmarkBrittanySpain
stress without recoverystress with recovery
Local adaptation
highest upper temperature highest tolerance limit
sst meansst range
28 / 56

Introduction Paper I Paper II Paper III Overall conclusions
Photosynthetic response
0 4 8 12 16 20 24 28 32 36 ℃
Tested temperature range
NorwayDenmarkBrittanySpain
stress without recoverystress with recovery
Thermal range in 2200
sst meansst range
28 / 56

Introduction Paper I Paper II Paper III Overall conclusions
Photosynthetic response
0 4 8 12 16 20 24 28 32 36 ℃
Tested temperature range
NorwayDenmarkBrittanySpain
stress without recoverystress with recovery
Thermal range in 2200Stress
sst meansst range
28 / 56

Introduction Paper I Paper II Paper III Overall conclusions
Photosynthetic response
0 4 8 12 16 20 24 28 32 36 ℃
Tested temperature range
NorwayDenmarkBrittanySpain
stress without recoverystress with recovery
Thermal range in 2200Stress
Stress limit reached at the southern range
sst meansst range
28 / 56
Introduction Paper I Paper II Paper III Overall conclusions
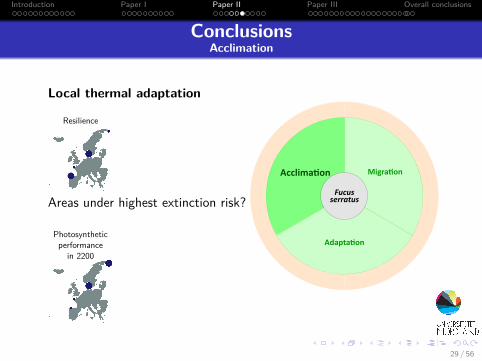
ConclusionsAcclimation
..
Migra on
.
Acclima on
.
Adapta on
.Fucusserratus
Local thermal adaptation
Areas under highest extinction risk?
Resilience
Photosyntheticperformance
in 2200
29 / 56
Introduction Paper I Paper II Paper III Overall conclusions
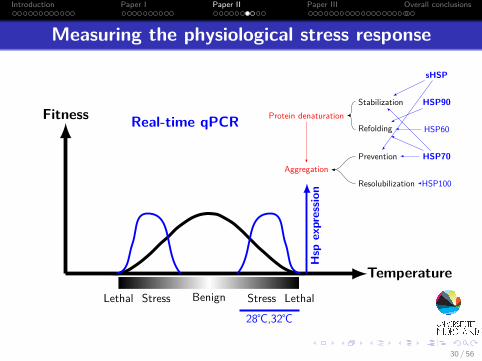
Measuring the physiological stress response
Fitness
TemperatureBenignStress StressLethal Lethal
Hsp
expressio
n
Real-time qPCR Protein denaturation
Aggregation
Refolding
Resolubilization
Prevention
Stabilization
sHSP
HSP60
HSP70
HSP90
HSP100
28℃,32℃
30 / 56

Introduction Paper I Paper II Paper III Overall conclusions
sHsp gene expression
Before heat shock exposure After 24h recovery
31 / 56

Introduction Paper I Paper II Paper III Overall conclusions
sHsp gene expression
Before heat shock exposure
High constitutive expression
After 24h recovery
31 / 56

Introduction Paper I Paper II Paper III Overall conclusions
sHsp gene expression
Before heat shock exposure
High constitutive expression
After 24h recovery
Reduced responsiveness
31 / 56

Introduction Paper I Paper II Paper III Overall conclusions
ConclusionsAcclimation
..
Migra on
.
Acclima on
.
Adapta on
.Fucusserratus
Local thermal adaptation
Areas under highest extinction risk?(Brittany), Spain
Resilience
Photosyntheticperformance
in 2200
Heat shockresponse
32 / 56

Introduction Paper I Paper II Paper III Overall conclusions
Objectives
..
Migra on
.
Acclima on
.
Adapta on
.Fucusserratus
Distributional shiftuntil 2200
Warm temperaturetolerance
Genetic changes over the past decadeAdaptive potential to future stress
33 / 56

Introduction Paper I Paper II Paper III Overall conclusions
Paper III - Adaptation
A decade of climate change onNorth Atlantic rocky shores
-can the seaweed Fucus serratusadapt to rising temperatures?
Alexander Jueterbock, Spyros Kollias, James A. Coyer, Jeanine L. Olsen,Galice Hoarau
Manuscript
34 / 56

Introduction Paper I Paper II Paper III Overall conclusions
Objectives
..
Migra on
.
Acclima on
.
Adapta on
.Fucusserratus
Effective population size Ne? Genetic changes (past 10 yrs)?
35 / 56

Introduction Paper I Paper II Paper III Overall conclusions
Sampling scheme (50–75 ind./pop)
∼ 2000 ∼ 2010
Spatial
(enviro
nmental)eff
ects
Temporal changes
1 decadeof selection
36 / 56

Introduction Paper I Paper II Paper III Overall conclusions
Methods and analysis
∼ 2000 ∼ 2010
Spatial
(enviro
nmental)eff
ects
Temporal changes
1 decadeof selection
Genotyping31 microsatellite markers (20 EST-linked)
AnalysisEffective population size (Ne)Allelic richness (α)Temperature associated outlier loci
37 / 56

Introduction Paper I Paper II Paper III Overall conclusions
Methods and analysis
∼ 2000 ∼ 2010
Spatial
(enviro
nmental)eff
ects
Temporal changes
1 decadeof selection
Genotyping31 microsatellite markers (20 EST-linked)
AnalysisEffective population size (Ne)Allelic richness (α)Temperature associated outlier loci
38 / 56

Introduction Paper I Paper II Paper III Overall conclusions
Effective population size NeReflecting adaptive capacity
∼ 2000 ∼ 2010
18
6320723
Norway
DenmarkBrittanySpain
32
6121026
Estimates excluding outlier loci
39 / 56

Introduction Paper I Paper II Paper III Overall conclusions
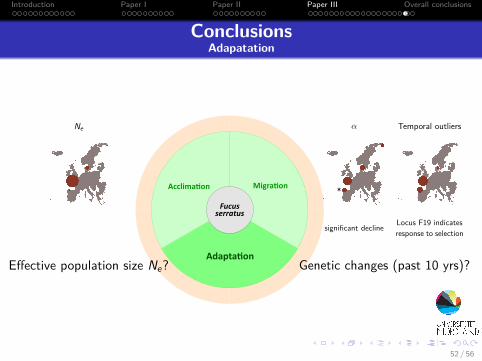
ConclusionsAdapatation
..
Migra on
.
Acclima on
.
Adapta on
.Fucusserratus
Effective population size Ne? Genetic changes (past 10 yrs)?
Ne
40 / 56

Introduction Paper I Paper II Paper III Overall conclusions
Methods
∼ 2000 ∼ 2010
Spatial
(enviro
nmental)eff
ects
Temporal changes
1 decadeof selection
Genotyping31 microsatellite markers (20 EST-linked)
AnalysisEffective population size (Ne)Allelic richness (α)Temperature associated outlier loci
41 / 56

Introduction Paper I Paper II Paper III Overall conclusions
Changes in allelic richness
∼ 2000 ∼ 2010
3.1
4.68.04.0
Norway
DenmarkBrittanySpain
3.3
4.87.94.6
Significantdecline
42 / 56

Introduction Paper I Paper II Paper III Overall conclusions
ConclusionsAdaptation
..
Migra on
.
Acclima on
.
Adapta on
.Fucusserratus
Effective population size Ne? Genetic changes (past 10 yrs)?
Ne α
*
significant decline
43 / 56

Introduction Paper I Paper II Paper III Overall conclusions
Methods and analysis
∼ 2000 ∼ 2010
Spatial
(enviro
nmental)eff
ects
Temporal changes
Spatial approach
Genotyping31 microsatellite markers (20 EST-linked)
AnalysisEffective population size (Ne)Allelic richness (α)Temperature associated outlier loci
44 / 56
Introduction Paper I Paper II Paper III Overall conclusions
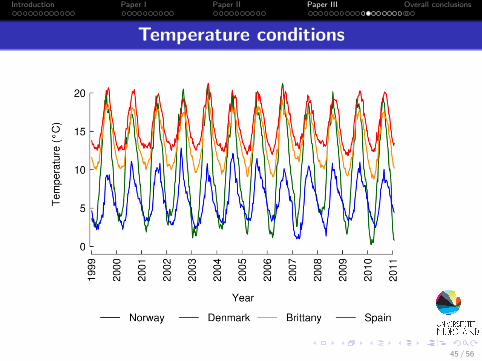
Temperature conditions
45 / 56
Introduction Paper I Paper II Paper III Overall conclusions
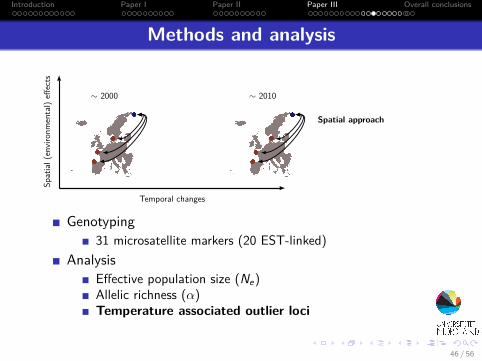
Methods and analysis
∼ 2000 ∼ 2010
Spatial
(enviro
nmental)eff
ects
Temporal changes
Spatial approach
Genotyping31 microsatellite markers (20 EST-linked)
AnalysisEffective population size (Ne)Allelic richness (α)Temperature associated outlier loci
46 / 56

Introduction Paper I Paper II Paper III Overall conclusions
Spatial outlier loci
∼ 2000 ∼ 2010
1: E6, L58
2: F36, F49, L58
3: F19, L58
1: F19, L58
2: E9, F22, F49, L58
3: E9, F19, F60, L58
123
123
47 / 56

Introduction Paper I Paper II Paper III Overall conclusions
Spatial outlier loci
∼ 2000 ∼ 2010
1: E6, L58
2: F36, F49, L58
3: F19, L58
1: F19, L58
2: E9, F22, F49, L58
3: E9, F19, F60, L58
123
123
Outliers in both years
47 / 56

Introduction Paper I Paper II Paper III Overall conclusions
Local adaptation - or?Examples fo alternative reasons for spatial outliers
Genetic incompatibilities [Bierne et al., 2011; Mol. Ecol.]
Isolation-by-distance pattern increases false positive rate[Fourcade et al. 2013; Mol. Ecol., Bierne et al., 2013; Mol. Ecol.]
48 / 56
Introduction Paper I Paper II Paper III Overall conclusions
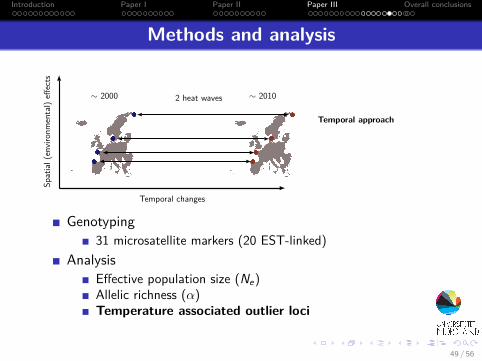
Methods and analysis
∼ 2000 2 heat waves ∼ 2010
Spatial
(enviro
nmental)eff
ects
Temporal changes
Temporal approach
Genotyping31 microsatellite markers (20 EST-linked)
AnalysisEffective population size (Ne)Allelic richness (α)Temperature associated outlier loci
49 / 56

Introduction Paper I Paper II Paper III Overall conclusions
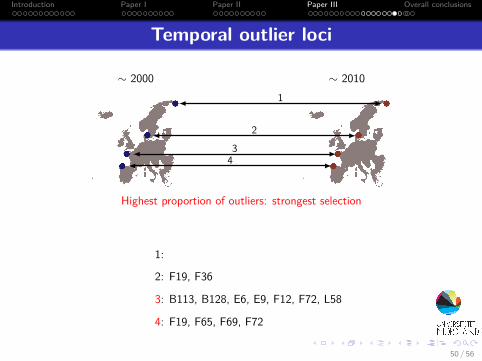
Temporal outlier loci
∼ 2000 ∼ 2010
1:
2: F19, F36
3: B113, B128, E6, E9, F12, F72, L58
4: F19, F65, F69, F72
1
234
50 / 56
Introduction Paper I Paper II Paper III Overall conclusions
Temporal outlier loci
∼ 2000 ∼ 2010
1:
2: F19, F36
3: B113, B128, E6, E9, F12, F72, L58
4: F19, F65, F69, F72
1
234
Highest proportion of outliers: strongest selection
50 / 56

Introduction Paper I Paper II Paper III Overall conclusions
Temporal outlier loci
∼ 2000 ∼ 2010
1:
2: F19, F36
3: B113, B128, E6, E9, F12, F72, L58
4: F19, F65, F69, F72
1
234
Highest proportion of outliers: strongest selectionCongruent outlier: broad-scale selection
50 / 56

Introduction Paper I Paper II Paper III Overall conclusions
Spatio-temporal outlier lociSpatial outliers
∼ 2000 ∼ 2010
1: E6, L58
2: F36, F49, L58
3: F19, L58
1: F19, L58
2: E9, F22, F49, L58
3: E9, F19, F60, L581
23
123
Outliers in both years
Temporal outliers∼ 2000 ∼ 2010
1:
2: F19, F36
3: B113, B128, E6, E9, F12, F72, L58
4: F19, F65, F69, F72
1
234
Highest proportion of outliers: strongest selectionCongruent outlier: broad-scale selection 51 / 56

Introduction Paper I Paper II Paper III Overall conclusions
Spatio-temporal outlier lociSpatial outliers
∼ 2000 ∼ 2010
1: E6, L58
2: F36, F49, L58
3: F19, L58
1: F19, L58
2: E9, F22, F49, L58
3: E9, F19, F60, L581
23
123
Outliers in both years
Temporal outliers∼ 2000 ∼ 2010
1:
2: F19, F36
3: B113, B128, E6, E9, F12, F72, L58
4: F19, F65, F69, F72
1
234
Highest proportion of outliers: strongest selectionCongruent outlier: broad-scale selection
F19 - response to climate change?
51 / 56
Introduction Paper I Paper II Paper III Overall conclusions
ConclusionsAdapatation
..
Migra on
.
Acclima on
.
Adapta on
.Fucusserratus
Effective population size Ne? Genetic changes (past 10 yrs)?
Ne α
*
Temporal outliers
Locus F19 indicatesresponse to selectionsignificant decline
52 / 56

Introduction Paper I Paper II Paper III Overall conclusions
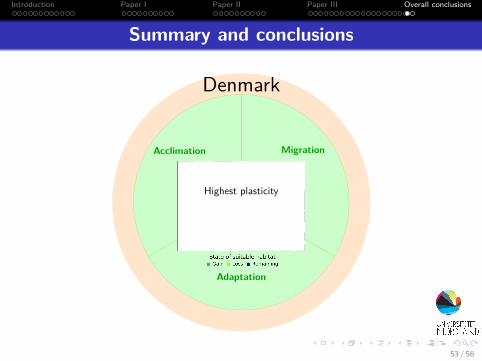
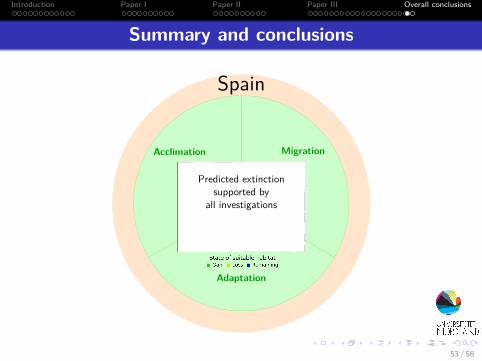
Summary and conclusions
MigrationAcclimation
Adaptation
F. serratus, 2200
53 / 56

Introduction Paper I Paper II Paper III Overall conclusions
Summary and conclusions
MigrationAcclimation
Adaptation
F. serratus, 2200
Norway
53 / 56

Introduction Paper I Paper II Paper III Overall conclusions
Summary and conclusions
MigrationAcclimation
Adaptation
F. serratus, 2200
Norway
Performance, 2200
Not threatened
53 / 56

Introduction Paper I Paper II Paper III Overall conclusions
Summary and conclusions
MigrationAcclimation
Adaptation
F. serratus, 2200
Norway
Ne
Low adaptive potential?
53 / 56

Introduction Paper I Paper II Paper III Overall conclusions
Summary and conclusions
MigrationAcclimation
Adaptation
F. serratus, 2200
Norway
Potential to colonizeArctic shores?
53 / 56

Introduction Paper I Paper II Paper III Overall conclusions
Summary and conclusions
MigrationAcclimation
Adaptation
F. serratus, 2200
Denmark
53 / 56

Introduction Paper I Paper II Paper III Overall conclusions
Summary and conclusions
MigrationAcclimation
Adaptation
F. serratus, 2200
Denmark
Resilience
Local adaptation
53 / 56

Introduction Paper I Paper II Paper III Overall conclusions
Summary and conclusions
MigrationAcclimation
Adaptation
F. serratus, 2200
Denmark
Broadest thermal range
53 / 56
Introduction Paper I Paper II Paper III Overall conclusions
Summary and conclusions
MigrationAcclimation
Adaptation
F. serratus, 2200
Denmark
Highest plasticity
53 / 56

Introduction Paper I Paper II Paper III Overall conclusions
Summary and conclusions
MigrationAcclimation
Adaptation
F. serratus, 2200
Brittany
53 / 56

Introduction Paper I Paper II Paper III Overall conclusions
Summary and conclusions
MigrationAcclimation
Adaptation
F. serratus, 2200
Brittany
Resilience Performance, 2200
Low plasticity
53 / 56

Introduction Paper I Paper II Paper III Overall conclusions
Summary and conclusions
MigrationAcclimation
Adaptation
F. serratus, 2200
Brittany
Ne Temporal outliers
Highest adaptability
53 / 56

Introduction Paper I Paper II Paper III Overall conclusions
Summary and conclusions
MigrationAcclimation
Adaptation
F. serratus, 2200
Brittany
Will the center ofdiversity persist?
53 / 56

Introduction Paper I Paper II Paper III Overall conclusions
Summary and conclusions
MigrationAcclimation
Adaptation
F. serratus, 2200
Spain
53 / 56
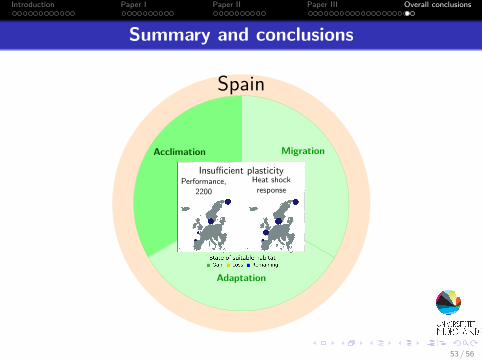
Introduction Paper I Paper II Paper III Overall conclusions
Summary and conclusions
MigrationAcclimation
Adaptation
F. serratus, 2200
Spain
Performance,2200
Heat shockresponse
Insufficient plasticity
53 / 56

Introduction Paper I Paper II Paper III Overall conclusions
Summary and conclusions
MigrationAcclimation
Adaptation
F. serratus, 2200
Spain
Ne α
Insufficient adaptive capacity
53 / 56
Introduction Paper I Paper II Paper III Overall conclusions
Summary and conclusions
MigrationAcclimation
Adaptation
F. serratus, 2200
Spain
Predicted extinctionsupported by
all investigations
53 / 56

Introduction Paper I Paper II Paper III Overall conclusions
Overall conclusion
Climate change drivenecosystem shift?
54 / 56

Introduction Paper I Paper II Paper III Overall conclusions
Acknowledgements
Supervisors:
Galice HoarauJorge FernandesJeanine L. Olsen
Spyros KolliasIrina SmolinaKetil EianeKurt TandeMark PowellRandi Restad SjøvikSteinar JohnsonAll lab- and wetlab techniciansAll administrative staffAll friends
Dissertation Committee:
Christine MaggsNicolas BierneKurt Tande
Olivier De ClerckKlaas Pauly
Heroen Verbruggen
Lennert Tyberghein
James A. Coyer
Havkyst projects: 196505, 203839, 216484
55 / 56

Introduction Paper I Paper II Paper III Overall conclusions
56 / 56

Brown algae Paper I Paper II Paper III
References I
Balanya, J.; Oller, J.M.; Huey, R.B.; Gilchrist, G.W.; Serra, L. (2006)Global genetic change tracks global climate warming in Drosophila subobscura.Science 313(5794):1173–1175.
Berteaux, D.; Reale, D.; McAdam, A.G.; Boutin, S. (2004)Keeping pace with fast climate change: can arctic life count on evolution?Integrative and Comparative Biology 44(2):140–151.
Bierne, N. (2010)The distinctive footprints of local hitchhiking in a varied environment and global hitchhiking in a subdividedpopulationEvolution 64(11):3254–3272.
Bierne, N.; Welch, J.; Loire E.; Bonhomme, F.; David, P. (2011)The coupling hypothesis: why genome scans may fail to map local adaptation genesMolecular Ecology 20(10):2044–2072.
Bierne, N.; Roze, D.; Welch, J. (2013)Pervasive selection or is itâĂę? why are FST outliers sometimes so frequent?Molecular Ecology 22(8):2061–2064.
Bradshaw, W. E. and Holzapfel, C. M. (2006)Climate change - Evolutionary response to rapid climate changeScience 312(5779):1477–1478.
1 / 48

Brown algae Paper I Paper II Paper III
References II
Braune, W. (2008)MeeresalgenKoeltz Scientific Books Königstein, Germany.
Bussotti, F.; Desotgiu, R; Pollastrini, M.; Cascio, C. (2010)The JIP test: a tool to screen the capacity of plant adaptation to climate changeScandinavian Journal of Forest Research 25(Suppl 8): 43–50.
Charlesworth, B.; Nordborg, M.; Charlesworth, D. (1997)The effects of local selection, balanced polymorphism and background selection on equilibrium patterns ofgenetic diversity in subdivided populationsGenetic Research 70:155–174.
Coyer, J. A.; Peters, A.F.; Stam, W.T.; Olsen, J.L. (2003)Post-ice age recolonization and differentiation of Fucus serratus L. (Phaeophyceae; Fucaceae) populationsin Northern EuropeMolecular Ecology 12:1817–1829.
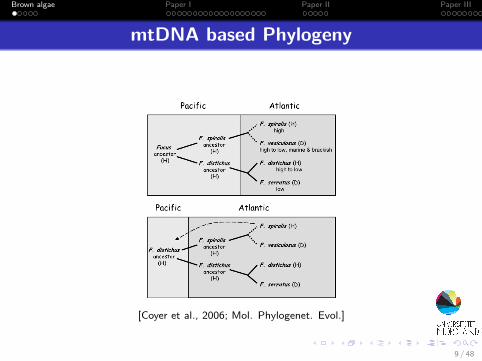
Coyer, J. A.; Hoarau, G.; Oudot-Le Secq, M.-P.; Stam, W.T. (2006)A mtDNA-based phylogeny of the brown algal genus Fucus (Heterokontophyta; Phaeophyta)Molecular Phylogenetics and Evolution 39:209–222.
Cock, J.M.; Sterck, L.; Rouzé, P. et al. (2010)The Ectocarpus genome and the independent evolution of multicellularity in brown algaeNature 465(3):617–621.
2 / 48
Brown algae Paper I Paper II Paper III
References III
Duarte L.; Viejo R.M.; Martínez B.; deCastro M.; Gómez-Gesteira M.; Gallardo T.(2013)Recent and historical range shifts of two canopy-forming seaweeds in North Spain and the link with trendsin sea surface temperatureActa Oecologica 51:1–10.
Excoffier, L.; Foll, M.; Petit, R.J. (2009)Genetic Consequences of Range ExpansionsAnnual Review of Ecology, Evolution, and Systematics 40:481–501.
Excoffier, L.; Lischer, H.E.L. (2010)Arlequin suite ver 3. 5: a new series of programs to perform population genetics analyses under Linux andWindowsMolecular Ecology Resources 10(3):564–567.
Fredriksen, S.; Christie, H.; Saethre, B.A. (2005)Species richness in macroalgae and macrofauna assemblages on Fucus serratus L. (Phaeophyceae) andZostera marina L. (Angiospermae) in Skagerrak, Norway.Marine Biology Research 1(1):2–19.
Fourcade, Y.; Chaput-Bardy, A.; Secondi, J.; Fleurant, C.; Lemaire, C. (2013)Is local selection so widespread in river organisms? Fractal geometry of river networks leads to high bias inoutlier detectionMolecular Ecology 22(8):2065–2073.
3 / 48

Brown algae Paper I Paper II Paper III
References IV
Halpern, B.S.; Walbridge, S.; Selkoe, K.A.; Kappel, C.V.; Micheli, F.; D’Agrosa, C.; Bruno, J.F.; Casey,K.S.; Ebert, C.; Fox, H.E. and others (2010)A global map of human impact on marine ecosystemsScience 319(5856):948–952.
Hansen, J.; Sato, M.; Ruedy, R.; Lo, K.; Lea, D.W.; Medina-Elizade, M. (2006)Global temperature changeProceedings of the National Academy of Sciences 103(39):14288–14293.
Hoarau, G.; Coyer, J.A.; Veldsink, J.H.; Stam, W.T.; Olsen, J.L. (2007)Glacial refugia and recolonization pathways in the brown seaweed Fucus serratusMolecular Ecology 16(17):3606–3616.
Hofer, T.; Ray, N.; Wegmann, D.; Excoffier, L. (2009)Large Allele Frequency Differences between Human Continental Groups are more Likely to have Occurred byDrift During range Expansions than by SelectionAnnals of Human Genetics 73(1):95–108.
Jimenez-Valverde, Alberto (2012)Insights into the area under the receiver operating characteristic curve (AUC) as a discrimination measure inspecies distribution modellingGlobal Ecology and Biogeography 21:498–507.
Jueterbock, A.; Tyberghein, L.; Verbruggen, H.; Coyer, J.A.; Olsen, J.L.; Hoarau, G. (2013)Climate change impact on seaweed meadow distribution in the North Atlantic rocky intertidalEcology and Evolution 3(5):1356–1373.
4 / 48

Brown algae Paper I Paper II Paper III
References V
Knight, M.; Parke, M. (1950)A biological study of Fucus vesiculosus L. and F. serratus L.Journal of the Marine Biological Association of the UK 29:439–514.
Køie, M.; Kristiansen, A.; Weitemeyer, S. (2001)Der große Kosmos Strandführer.Kosmos.
Luikart, G.; England, P. R.; Tallmon, D.; Jordan, S.; Taberlet, P. (2003)The power and promise of population genomics: from genotyping to genome typingNature Reviews Genetics 4(12):981–994.
McMahon, C.R. & Hays, G.C. (2006)Thermal niche, large-scale movements and implications of climate change for a critically endangered marinevertebrate.Global Change Biology 12(7):1330–1338.
Meehl, G.A.; Stocker, T.F.; Collins, W.D.; Friedlingstein, P.; Gaye, A.T.; Gregory, JM.; Kitoh, A.; Knutti,R.; Murphy, J.M.; Noda, A.; Raper, S.C.B.; Watterson, I.G and Weaver, A.J.; Zhao, Z.-C. (2007)Global Climate Projections.Climate Change 2007: the physical science basis: contribution of Working Group I to the FourthAssessment Report of the Intergovernmental Panel on Climate Change Eds: Solomon S. et al.
Nicastro, K.R.; Zardi, G.I.; Teixeira, S.; Neiva, J.; Serrao, E.A.; Pearson, G.A. (2013)Shift happens: trailing edge contraction associated with recent warming trends threatens a distinct geneticlineage in the marine macroalga Fucus vesiculosus.BMC Biology 11(6).
5 / 48

Brown algae Paper I Paper II Paper III
References VI
Nolan, T.; Hands, R.E.; Bustin, S.A. (2006)Quantification of mRNA using realtime RT-PCRNature Protocols 1(3)1559–1582.
Pannell, J. R.; Charlesworth, B. (2000)Effects of metapopulation processes on measures of genetic diversityPhilosophical Transactions of the Royal Society of London B 355(1404):1851-1864.
Pearson, G.A.; Lago-Leston, A.; Mota, C. (2009)Frayed at the edges: selective pressure and adaptive response to abiotic stressors are mismatched in lowdiversity edge populations.Journal of Ecology 97(3):450–462.
Pespeni, M.H.; Sanford, E.; Gaylord, B.; Hill, T.M; Hosfelt, J.D. et al. (2013)Evolutionary change during experimental ocean acidificationProceedings of the National Academy of Sciences 110(17):6937–6924.
Phillips, S.J.; Anderson, R.P.; Schapire, R.E. (2006)Maximum entropy modeling of species geographic distributions.Ecological Modelling 190(3-4):231–259.
Pounds, J. A.; Bustamante, M.R.; Coloma, L.A.; Consuegra, J.A.; Fogden, M.P.L.; Foster, P.N.; La Marca,E.; Masters, K.L.; Merino-Viteri, A.; Puschendorf, R.; Ron, S.R.; Sanchez-Azofeifa, G.A.; Still, C.J.; Young,B.E. (2006)Widespread amphibian extinctions from epidemic disease driven by global warmingNature 7073:161–167.
6 / 48
Brown algae Paper I Paper II Paper III
References VII
Raybaud, V.; Beaugrand, G.; Goberville, E.; Delebecq, G.; Destombe, C.; Valero, M.; Davoult, D.; Morin,P.; Gevaert, F. (2013)Decline in Kelp in West Europe and ClimatePLOS ONE 8:e66044.
Sturm, M.; Schimel, J.; Michaelson, G.; Welker, J.M.; Oberbauer, S.F.; Liston, G.E.; Fahnestock, J.;Romanovsky, V. (2005)Winter biological processes could help convert Arctic tundra to shrubland.Bioscience55(1):17–26.
Tyberghein, L.; Verbruggen, H.; Pauly, K.; Troupin, C.; Mineur, F.; De Clerck, O. (2011)Bio-ORACLE: a global environmental dataset for marine species distribution modelling.Global Ecology and Biogeography.
van Asch, M.; Salis, L.; Holleman, L.J.M.; van Lith, B.; Visser, M.E. (2013)Evolutionary response of the egg hatching date of a herbivorous insect under climate change.Ecography 3:244–248.
Verbruggen, H. (2012)Occurrence Thinner version 1.04.http://www.phycoweb.net/software.
Verbruggen, H. (2012)Maxent Model Surveyor v1.01.http://www.phycoweb.net/software.
7 / 48

Brown algae Paper I Paper II Paper III
References VIII
Viejo, R.M.; Martínez, B.; Arrontes, J.; Astudillo, C.; Hernández, L. (2011)Reproductive patterns in central and marginal populations of a large brown seaweed: drastic changes at thesouthern range limit.Ecography 34(1):75–84.
Walther, G.-R.; Post, E.; Convey, P.; Menzel, A.; Parmesan, C.; Beebee, T.J.C.; Fromentin, J.-M.;Hoegh-Guldberg, O.; Bairlein, F. (2002)Ecological responses to recent climate change.Nature 416(6879):389–395.
Warren, D. L.; Seifert, S. N. (2011)Ecological niche modeling in Maxent: the importance of model complexity and the performance of modelselection criteriaEcological Applications 21(2):335–342.
Wernberg, T.; Russell, B.D.; Thomsen, M.S.; Gurgel, F.D.; Bradshaw, C.J.A.; Poloczanska, E.S., Connell,S.D. (2011)Seaweed Communities in Retreat from Ocean Warming.Current Biology 21(21):1828–1832.
8 / 48
Brown algae Paper I Paper II Paper III
mtDNA based Phylogeny
[Coyer et al., 2006; Mol. Phylogenet. Evol.]
9 / 48

Brown algae Paper I Paper II Paper III
Human introduction
10 / 48

Brown algae Paper I Paper II Paper III
Life cycles of algae
[Braune, 2008; Meeresalgen] 11 / 48

Brown algae Paper I Paper II Paper III
Recolonization of the N-Atlantic after the LGM
[Hoarau et al., 2007; Mol. Ecol.]
12 / 48
Brown algae Paper I Paper II Paper III
Glacial refugia identified by mtDNA haplotype diversity
[Hoarau et al., 2007; Mol. Ecol.]
13 / 48

Brown algae Paper I Paper II Paper III
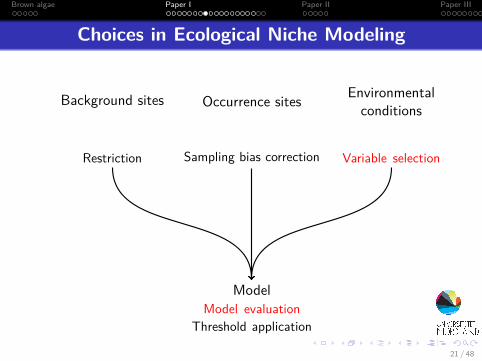
Choices in Ecological Niche Modeling
Occurrence sites
Sampling bias correction
Background sites
Restriction
Environmentalconditions
Variable selection
ModelModel evaluation
Threshold application
14 / 48

Brown algae Paper I Paper II Paper III
Choices in Ecological Niche Modeling
Occurrence sites
Sampling bias correction
Background sites
Restriction
Environmentalconditions
Variable selection
ModelModel evaluation
Threshold application
14 / 48

Brown algae Paper I Paper II Paper III
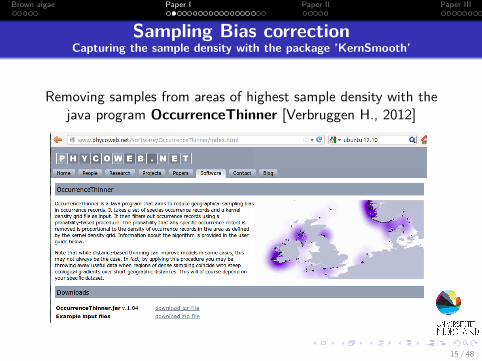
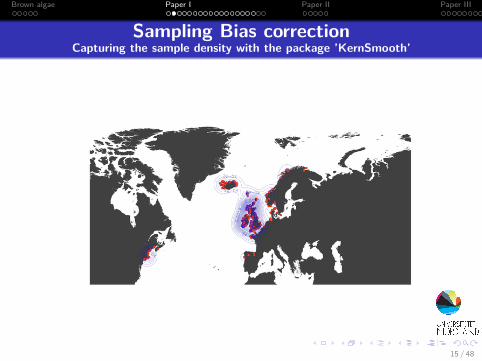
Sampling Bias correctionCapturing the sample density with the package ’KernSmooth’
15 / 48
Brown algae Paper I Paper II Paper III
Sampling Bias correctionCapturing the sample density with the package ’KernSmooth’
Removing samples from areas of highest sample density with thejava program OccurrenceThinner [Verbruggen H., 2012]
15 / 48
Brown algae Paper I Paper II Paper III
Sampling Bias correctionCapturing the sample density with the package ’KernSmooth’
15 / 48

Brown algae Paper I Paper II Paper III
Sampling Bias correctionCapturing the sample density with the package ’KernSmooth’
15 / 48

Brown algae Paper I Paper II Paper III
Sampling Bias correctionCapturing the sample density with the package ’KernSmooth’
15 / 48

Brown algae Paper I Paper II Paper III
Choices in Ecological Niche Modeling
Occurrence sites
Sampling bias correction
Background sites
Restriction
Environmentalconditions
Variable selection
ModelModel evaluation
Threshold application
16 / 48

Brown algae Paper I Paper II Paper III
North Atlantic background samples
17 / 48

Brown algae Paper I Paper II Paper III
North Atlantic background samples
17 / 48

Brown algae Paper I Paper II Paper III
North Atlantic background samples
17 / 48

Brown algae Paper I Paper II Paper III
Habitat suitability predictions depend on thebackground area
18 / 48

Brown algae Paper I Paper II Paper III
Choices in Ecological Niche Modeling
Occurrence sites
Sampling bias correction
Background sites
Restriction
Environmentalconditions
Variable selection
ModelModel evaluation
Threshold application
19 / 48

Brown algae Paper I Paper II Paper III
Variable importanceMaxent model output
Contribution of variables to the gain in model performance
20 / 48
Brown algae Paper I Paper II Paper III
Choices in Ecological Niche Modeling
Occurrence sites
Sampling bias correction
Background sites
Restriction
Environmentalconditions
Variable selection
ModelModel evaluation
Threshold application
21 / 48

Brown algae Paper I Paper II Paper III
Variable selection and model evaluation work together
Creating models of decreasing complexityEvaluating the performance with the AUC, AIC value
22 / 48

Brown algae Paper I Paper II Paper III
Automatic variable selection
based on Maxent Model Surveyor (Perl program) [Verbruggen H., 2012]
Suggests suitable predictor setStepwise exclusion (fwd) or inclusion (bwd) of parametersSignificant change in AUC is the stopping point
23 / 48
Brown algae Paper I Paper II Paper III
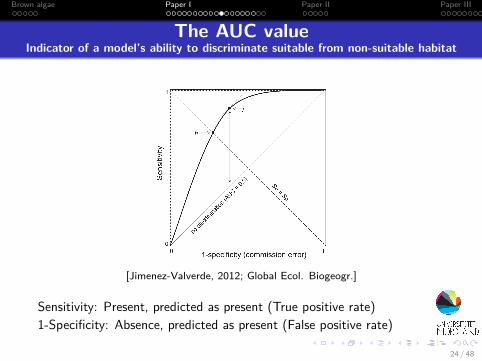
The AUC valueIndicator of a model’s ability to discriminate suitable from non-suitable habitat
[Jimenez-Valverde, 2012; Global Ecol. Biogeogr.]
Sensitivity: Present, predicted as present (True positive rate)1-Specificity: Absence, predicted as present (False positive rate)
24 / 48

Brown algae Paper I Paper II Paper III
Issues with the AUC value
Intrinsically higher for species with narrow ranges relative tothe background areaEstimates performance to identify the realized but not thefundamental niche (equal weight on omission and comissionerrors) [Jimenez-Valverde, 2012; Global Ecol. Biogeogr.]
AIC less overpredicting and models better transferablebetween regions and times [Warren & Seifert 2011; Ecol. Appl.]
25 / 48

Brown algae Paper I Paper II Paper III
Importance of temperature for algal distribution
[Jueterbock et al., 2013; Ecol. Evol.]
26 / 48
Brown algae Paper I Paper II Paper III
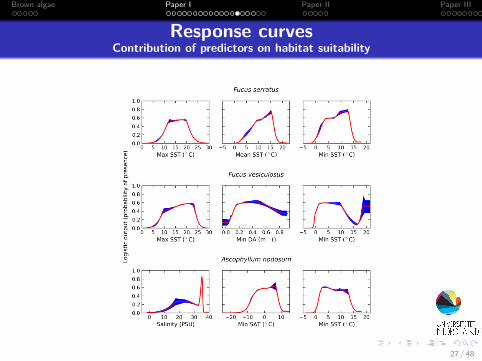
Response curvesContribution of predictors on habitat suitability
27 / 48

Brown algae Paper I Paper II Paper III
Choices in Ecological Niche Modeling
Occurrence sites
Sampling bias correction
Background sites
Restriction
Environmentalconditions
Variable selection
ModelModel evaluation
Threshold application
28 / 48
Brown algae Paper I Paper II Paper III
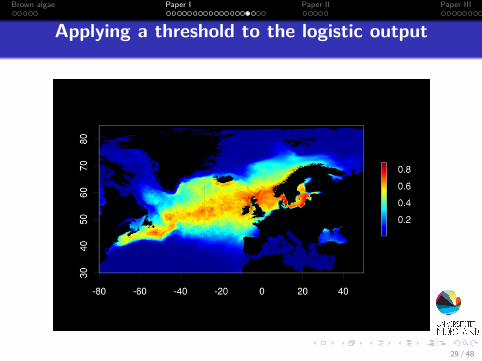
Applying a threshold to the logistic output
29 / 48

Brown algae Paper I Paper II Paper III
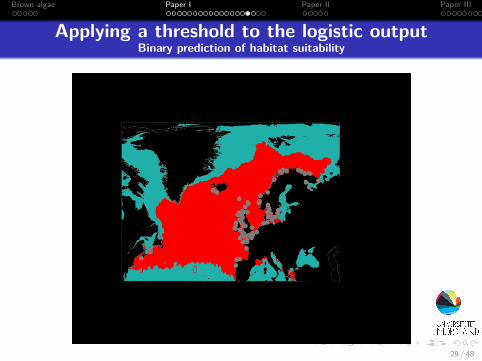
Applying a threshold to the logistic outputBinary prediction of habitat suitability
29 / 48
Brown algae Paper I Paper II Paper III
Applying a threshold to the logistic outputBinary prediction of habitat suitability
29 / 48

Brown algae Paper I Paper II Paper III
Present-day habitat suitability and occurrence sites
[Jueterbock et al., 2013; Ecol. Evol.]30 / 48

Brown algae Paper I Paper II Paper III
SRES CO2 emission scenarios
[Meehl et al., 2007; Climate Change 2007]31 / 48

Brown algae Paper I Paper II Paper III
Ocean currents in the North Atlantic
32 / 48

Brown algae Paper I Paper II Paper III
OJIP curve
Fm
F0
[Bussotti et al., 2010; Scand. J. Forest Res.]
33 / 48

Brown algae Paper I Paper II Paper III
Heat stress effect on photosynthesis
PS IIP680
PS IP700
NADPHCalvin CycleCO2 fixation
decrease
Photochemistry
e− transportdecrease
Photochemistry
e− transportdecrease
Heat
Fluorescence
measurableincrease
Heat
Fluorescence
h ∗ V h ∗ V
34 / 48

Brown algae Paper I Paper II Paper III
Quantification of gene products
[Nolan et al., 2006; Nature Protocols]
Efficiency = 10−1/slope
quantity = 10Ct−bslope
35 / 48

Brown algae Paper I Paper II Paper III
Long-term heat wave experiment
Sampling times (days)
Temperature (℃)
8℃
12℃
16℃
20℃
24℃
0d 4d 6d 14d 18d 28d
12h:12h light:dark cycleF. serratus, (F. distichus)4/(3) populations8 inds/pop
36 / 48

Brown algae Paper I Paper II Paper III
Long-term heat wave experiment
Results for F. serratus
36 / 48

Brown algae Paper I Paper II Paper III
Long-term heat wave experiment
Results for F. distichus
36 / 48

Brown algae Paper I Paper II Paper III
Unsolved questions and further studies
BrittanyLow plasticity
HFC correlations?Testing for MLH - photosynthetic performance correlationTesting if patches of higher diversity have higher shootdensity, growth etc.
37 / 48

Brown algae Paper I Paper II Paper III
Unsolved questions and further studies
SpainConstitutive Hsp expression - low responsiveness
Correlation could be explained by non-release of HSF1Cold stress during acclimation - heat hardening
In situ hsp measurements necessary to confirmUnlikely as hsp should have decreased over acclmation timeand 9-20℃same performanceCan reduce growth and reproduction (found for F. serratus)
Local adaptationAdaptive shift in shsp performance (sequence difference?)
Constitutive stressTemperatures in Spain are getting to warm
Paralogous genesCould perform differently under stressSequencing of gene products necessary
37 / 48

Brown algae Paper I Paper II Paper III
No correlation between photosynthetic performance and hspexpression
Other Hsps, like cp-sHSP protect the photoynthetic apparatusProtein kinase or amino acid oxidase can protect PSIIAlterations in cell membrane involved in HSRDanish population: increased shsp expression (28℃) andrecovery from 32℃uncoupled
37 / 48

Brown algae Paper I Paper II Paper III
Genome scan for outlier loci
cM0 100 200
0
0.5
1
0
0.5
1FST
Heterozygosity
Genotyped loci
Outlier locus
Selective sweep Selective sweep
38 / 48

Brown algae Paper I Paper II Paper III
Arlequin - test for outlier loci
[Excoffier & Lischer, 2010; Mol. Ecol. Res.]
39 / 48

Brown algae Paper I Paper II Paper III
Identification of outlier loci
[Luikart et al., 2003; Nature Reviews Genetics]
40 / 48

Brown algae Paper I Paper II Paper III
Potential reasons for low Ne values
Unequal sex ratiosVariance in family size (individual gametic contribution)Fluctuations of population size (potential reason for the lowNe in SpainReduced gene flow between populationsInbreeding
41 / 48

Brown algae Paper I Paper II Paper III
Ne indicates
The rate of genetic change due to genetic drift is proportionalto 1
2Ne
The effectiveness of selection over genetic drift (driftdominates if selection < 1
2Ne
Nucleotide diversity 4Nu with u being the mutation rateIn a closed population, Ne can indicate MLH. Gene flowuncouples Ne from genetic stochasticity
42 / 48

Brown algae Paper I Paper II Paper III
Significant FIS values can not be explained by asmall-scale family structure
Genetic correlations among individuals
[Coyer et al., 2003; Mol. Ecol.]
43 / 48

Brown algae Paper I Paper II Paper III
Local adaptation - or?Alternative reasons for spatial outliers
Geographic distribution that creates correlations in populationstructure [Fourcade et al. 2013; Mol. Ecol., Bierne et al., 2013; Mol. Ecol.]
44 / 48

Brown algae Paper I Paper II Paper III
Local adaptation - or?Alternative reasons for spatial outliers
Background selection against deleterious mutations[Charlesworth et al., 1997; Genet. Res.]
44 / 48

Brown algae Paper I Paper II Paper III
Local adaptation - or?Alternative reasons for spatial outliers
Species-wide selective sweeps [Bierne, 2010; Evolution]
44 / 48
Brown algae Paper I Paper II Paper III
Local adaptation - or?Alternative reasons for spatial outliers
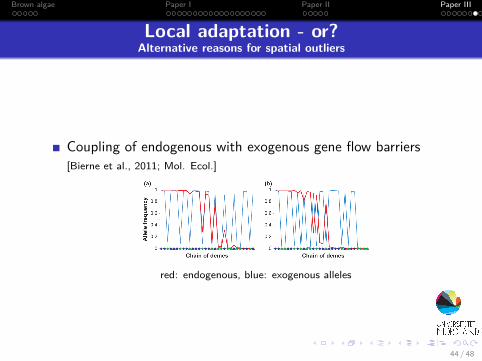
Coupling of endogenous with exogenous gene flow barriers[Bierne et al., 2011; Mol. Ecol.]
red: endogenous, blue: exogenous alleles
44 / 48
Brown algae Paper I Paper II Paper III
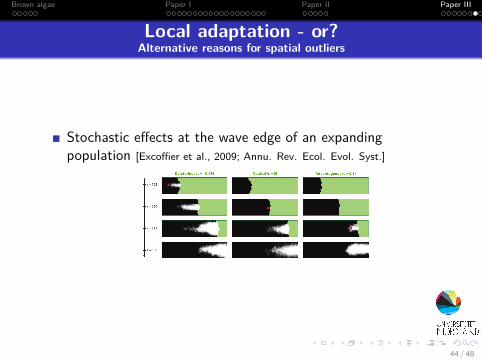
Local adaptation - or?Alternative reasons for spatial outliers
Stochastic effects at the wave edge of an expandingpopulation [Excoffier et al., 2009; Annu. Rev. Ecol. Evol. Syst.]
44 / 48
Brown algae Paper I Paper II Paper III
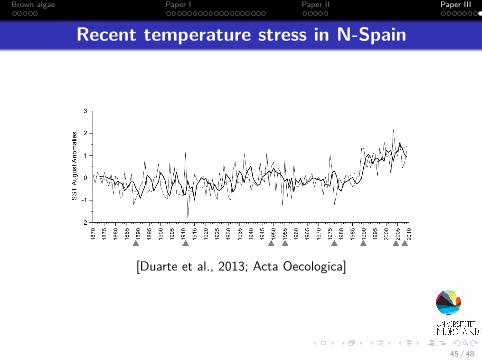
Recent temperature stress in N-Spain
[Duarte et al., 2013; Acta Oecologica]
45 / 48

Brown algae Paper I Paper II Paper III
Recent temperature stress in N-Spain
[Duarte et al., 2013; Acta Oecologica]
45 / 48

Brown algae Paper I Paper II Paper III
Work in Progress - Biological replicates
∼ 2000 ∼ 2010
1 decadeof selection
46 / 48
Brown algae Paper I Paper II Paper III
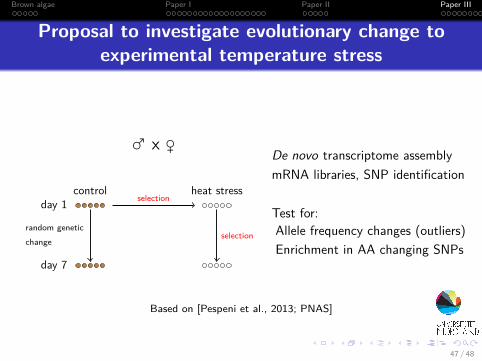
Proposal to investigate evolutionary change toexperimental temperature stress
♂ x ♀
control heat stressday 1
day 7
selection
random geneticchange
selection
De novo transcriptome assemblymRNA libraries, SNP identification
Test for:Allele frequency changes (outliers)Enrichment in AA changing SNPs
Based on [Pespeni et al., 2013; PNAS]
47 / 48

Brown algae Paper I Paper II Paper III
Unsolved questions and further studies
BrittanyHigh adaptive potential?
Selection experiment (is adaptive variation high?)Outliers
Checking allele frequency shifts in temporal and spatialapproachprolong mRNA transcripts to annotate gene products
48 / 48

Brown algae Paper I Paper II Paper III
Unsolved questions and further studies
Low Ne in F. serratus
Likely reason: Type III survivorship curveIn Spain: Variations in population size, strong selection, thus lowfitness (literature)Likely not biased by:
unequal sex ratiosSmall-scale family structureGene flow effects
48 / 48

Brown algae Paper I Paper II Paper III
Unsolved questions and further studies
Significant FISWahlund Effect - Unlikely as sampling range within panmicticunit (1-100m)Inbreeding - would explain low fitness of Spanish southernedge populationsNull alleles - can not be fully excludedSelective advantage of homozygotes
48 / 48

Brown algae Paper I Paper II Paper III
Unsolved questions and further studies
OutlierHigh proportion of temporal outliers due to different selectiveagents (eutrophication, salinity changes, chemical pollution,UV-radiation, ocean acidification)Prolongation of long 3’-UTRs with RACE (rapid amplificationof cDNA ends) for annotationF19: track allele frequency shifts under experimental selection
48 / 48