Climate Change Impact on Management of Deteriorating ...docs.trb.org/prp/17-04849.pdf ·...
14
Khatami and Shafei 1 Climate Change Impact on Management of Deteriorating Bridges: A Case Study of U.S. Midwest Region Dena Khatami Graduate Research Assistant Department of Civil, Environment and Construction Engineering Iowa State University 423 Town Engineering Building Ames, IA 50011-3232 Phone: 515-294-2181 Email: [email protected] Behrouz Shafei, Ph.D., P.E. Assistant Professor Institute for Transportation Department of Civil, Environment and Construction Engineering Iowa State University 424 Town Engineering Building Ames, IA 50011-3232 Phone: 515-294-4058 Email: [email protected] Word count: 4,725 words text + (7 Figures & 2 Tables) × 250 words = 6,975 words Submission Date (Revised Manuscript): November 15, 20
Transcript of Climate Change Impact on Management of Deteriorating ...docs.trb.org/prp/17-04849.pdf ·...
Khatami and Shafei 1
Climate Change Impact on Management of Deteriorating Bridges:
A Case Study of U.S. Midwest Region
Dena Khatami
Graduate Research Assistant
Department of Civil, Environment and Construction Engineering
Iowa State University
423 Town Engineering Building
Ames, IA 50011-3232
Phone: 515-294-2181
Email: [email protected]
Behrouz Shafei, Ph.D., P.E.
Assistant Professor
Institute for Transportation
Department of Civil, Environment and Construction Engineering
Iowa State University
424 Town Engineering Building
Ames, IA 50011-3232
Phone: 515-294-4058
Email: [email protected]
Word count: 4,725 words text + (7 Figures & 2 Tables) × 250 words = 6,975 words
Submission Date (Revised Manuscript): November 15, 20
Khatami and Shafei 2
Climate Change Impact on Management of Deteriorating Bridges:
A Case Study of U.S. Midwest Region
ABSTRACT
A large number of reinforced concrete (RC) bridges located in the U.S. are at least 50 years old
and during their service life are exposed to environmental stressors. As a consequence, the bridges
have degraded due to ingress of aggressive ions, such as chlorides. Although the deterioration of
bridges has been studied in the field and numerical models have been proposed for it, the effect of
the environmental condition and particularly climate change has not been investigated with a
region-specific perspective. The environmental parameters, such as temperature, relative
humidity, and precipitation, have changed because of climate change effects. The variation of
environmental parameters have several impacts on the occurrence of extreme events, such as scour
and flooding. In addition, climate change is believed to affect the continuous deterioration of RC
bridges through its impact on various environmental parameters. Therefore, it is necessary to study
how the deterioration mechanisms will change under the expected climate change scenarios. The
outcome of this effort can be implemented to predict the future condition of bridges more
realistically. Therefore, the stakeholders can better plan for necessary maintenance and repair
actions, which lead to an optimized bridge management system.
1. INTRODUCTION
Diffusion of aggressive ions such as chlorides in the RC bridges is one of the major causes of
deterioration in these structures. There are a number of studies in the literature which attempt to
capture the chloride penetration and its impact either numerically or experimentally. Saetta et al.
(1) was one of the first studies that modeled the diffusion of chloride ions in one-dimensional
unsaturated concrete considering a range of material and environmental parameters. Xi and Bazant
(2) included binding capacity and chloride diffusivity in the model proposed for the study of
chloride penetration in the saturated concrete. Martin-Perez et al. (3) used the finite difference
approach and studied the chloride binding effect on chloride profiles. Kong et al. (4) used the Xi
and Bazant (2)’s model to conduct a reliability analysis on saturated concrete to investigate the
influence of water-to-cement ratio and curing time. Ababneh et al. (5) modeled chloride diffusion
in unsaturated concrete considering both diffusion and convention mechanisms. Han (6)
considered the effect of chloride binding and evaporable water on the diffusion coefficient by a
finite element method. Val and Trapper (7) used a one-dimensional model for chloride ingress,
diffusion, and convection into concrete. Bertolini (8) examined both carbonation and chloride
diffusion in the study of concrete corrosion. El Hassan et al. (9) investigated the effect of
environmental conditions, such as humidity and temperature, on the degradation process. Shafei
et al. (10) proposed a three-dimensional finite-element model for chloride penetration and
estimated the chloride content by solving four nonlinear time-dependent mechanisms
simultaneously.
There are several internal and external parameters that have an impact on chloride penetration
process. Concrete properties and diffusion characteristic are examples of internal parameters and
ambient temperature and relative humidity are known as external parameters. It is known that the
external parameters fluctuate due to change of season and geographic location of a structure.
However, climate change has a direct effect on the average trends of external parameters by
Khatami and Shafei 3
changing the temperature, relative humidity, and precipitation in the long term. According to the
Intergovernmental Panel on Climate Change (IPCC) reports, temperature has an increasing trend
due to the emission of greenhouse gases. They defined some emission scenarios according to the
population, economic condition and technological change. The fifth IPCC assessment (11)
particularly includes more comprehensive emission scenarios compared to the fourth IPCC
assessment (12). The emission scenarios in the fifth assessment are expressed by ‘RCP’ which is
an abbreviation for ‘representative concentration pathways’. Overall, the RCPs scenarios are
similar to the ones in the fourth assessment. For example, RCP 8.5 is broadly comparable to
A2/A1F1 scenario, RCP 6.0 to B2, and RCP 4.5 to B1. However, there is no equivalent scenario
for RCP 2.6. All the emission scenarios will be explained with necessary details in the Section 3
of this manuscript.
Incorporating the climate scenarios in the chloride penetration model will help the decision maker
to plan for proper maintenance strategies. There are some studies around the world which
investigated the impact of climate change on the structural behavior and response. Yoon et al. (13)
evaluated the effect of CO2 concentration on carbonation of concrete under IS92a emission
scenario in Korea. Castro-Borges and Mendoza-Rangel (14) captured the historical data (1961-
2008) of temperature, relative humidity and precipitation of Yucatan in Mexico and studied the
chloride profile behavior under climate change. Stewart et al. (15) investigated the deterioration
of structures under three scenarios of A1F1, A1B and 550 ppm in the Australian cities of Sydney
and Darwin. Stewart et al. (16) showed that carbonation-induced and chloride-induce damage risks
may increase by 16% and 3% by 2100, respectively. The authors suggested that in regions where
carbonation or penetration of chlorides govern the durability, the concrete cover should be
increased by up to 10 mm in the design stage to minimize the effect of climate change. Bastidas-
Arteaga and Stewart (17) studied the impact of climate change on the deterioration of structures in
France. They considered two emission scenarios, high and medium ones, and concluded that the
current concrete cover might not be satisfactory. Although the listed studies investigated the
impact of climate change on the deterioration of structures, there is limited work available in the
literature to investigate the climate change effects on the durability of bridges in the U.S. In
addition, most of the studies used simplified models of chloride penetration to predict the chloride
content profile, which may lead to inaccurate results. Furthermore, the existing studies suggest
some adaptations in the design stage of structures in order to prevent the aggressive impacts of
climate changes; however, they have not offered any solutions to update the current maintenance
and repair strategies.
In the current study, chloride concentration at different depths of RC structures is predicted by
developing a detail, multi-physics finite-element model. The effects of variation of environmental
parameters, such as temperature, humidity, and surface chloride under climate change, are fully
monitored. The current study is expected to help the engineers and decision makers to consider the
extreme environmental conditions (e.g., climate change effects) to improve the efficiency of
maintenance and repair actions through a reliable prediction of the condition state of RC structures
during the expected service life.
Khatami and Shafei 4
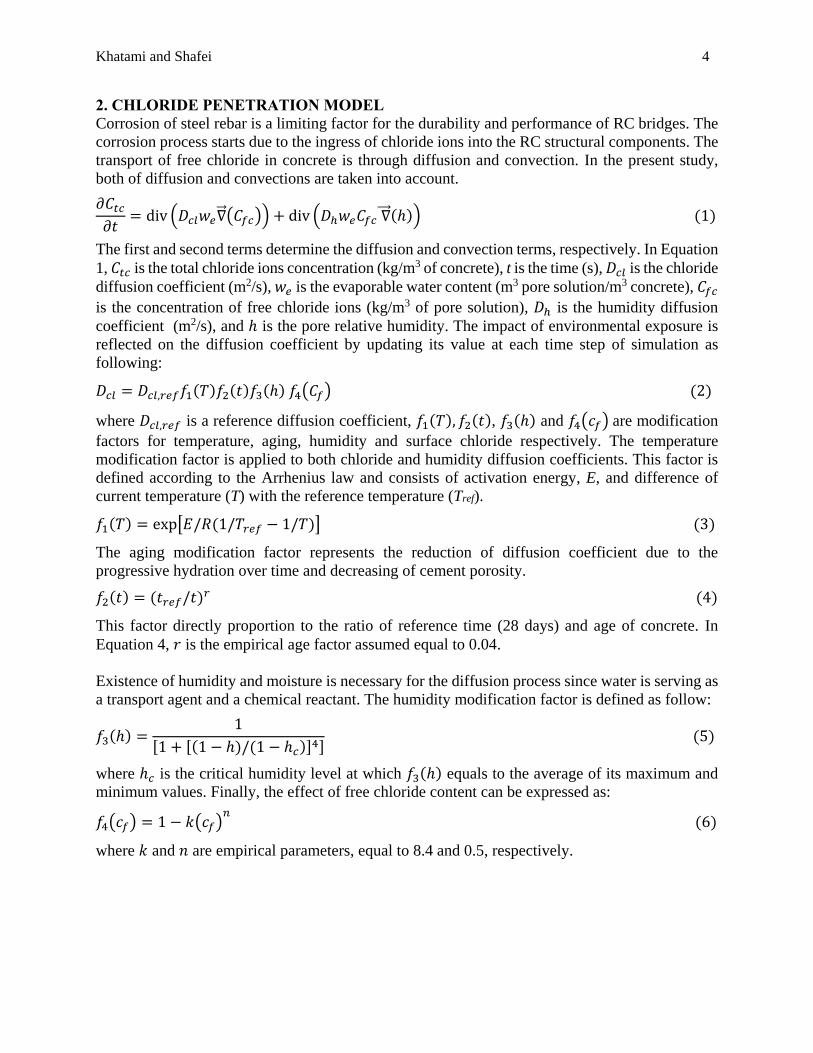
2. CHLORIDE PENETRATION MODEL
Corrosion of steel rebar is a limiting factor for the durability and performance of RC bridges. The
corrosion process starts due to the ingress of chloride ions into the RC structural components. The
transport of free chloride in concrete is through diffusion and convection. In the present study,
both of diffusion and convections are taken into account.
𝜕𝐶𝑡𝑐
𝜕𝑡= div (𝐷𝑐𝑙𝑤𝑒 ∇⃗⃗ (𝐶𝑓𝑐)) + div (𝐷ℎ𝑤𝑒𝐶𝑓𝑐 ∇⃗⃗ ⃗(ℎ)) (1)
The first and second terms determine the diffusion and convection terms, respectively. In Equation
1, 𝐶𝑡𝑐 is the total chloride ions concentration (kg/m3 of concrete), t is the time (s), 𝐷𝑐𝑙 is the chloride
diffusion coefficient (m2/s), 𝑤𝑒 is the evaporable water content (m3 pore solution/m3 concrete), 𝐶𝑓𝑐
is the concentration of free chloride ions (kg/m3 of pore solution), 𝐷ℎ is the humidity diffusion
coefficient (m2/s), and ℎ is the pore relative humidity. The impact of environmental exposure is
reflected on the diffusion coefficient by updating its value at each time step of simulation as
following:
𝐷𝑐𝑙 = 𝐷𝑐𝑙,𝑟𝑒𝑓𝑓1(𝑇)𝑓2(𝑡)𝑓3(ℎ) 𝑓4(𝐶𝑓) (2)
where 𝐷𝑐𝑙,𝑟𝑒𝑓 is a reference diffusion coefficient, 𝑓1(𝑇), 𝑓2(𝑡), 𝑓3(ℎ) and 𝑓4(𝑐𝑓) are modification
factors for temperature, aging, humidity and surface chloride respectively. The temperature
modification factor is applied to both chloride and humidity diffusion coefficients. This factor is
defined according to the Arrhenius law and consists of activation energy, E, and difference of
current temperature (T) with the reference temperature (Tref).
𝑓1(𝑇) = exp[𝐸/𝑅(1/𝑇𝑟𝑒𝑓 − 1/𝑇)] (3)
The aging modification factor represents the reduction of diffusion coefficient due to the
progressive hydration over time and decreasing of cement porosity.
𝑓2(𝑡) = (𝑡𝑟𝑒𝑓/𝑡)𝑟 (4)
This factor directly proportion to the ratio of reference time (28 days) and age of concrete. In
Equation 4, 𝑟 is the empirical age factor assumed equal to 0.04.
Existence of humidity and moisture is necessary for the diffusion process since water is serving as
a transport agent and a chemical reactant. The humidity modification factor is defined as follow:
𝑓3(ℎ) =1
[1 + [(1 − ℎ)/(1 − ℎ𝑐)]4]
(5)
where ℎ𝑐 is the critical humidity level at which 𝑓3(ℎ) equals to the average of its maximum and
minimum values. Finally, the effect of free chloride content can be expressed as:
𝑓4(𝑐𝑓) = 1 − 𝑘(𝑐𝑓)𝑛 (6)
where 𝑘 and 𝑛 are empirical parameters, equal to 8.4 and 0.5, respectively.
Khatami and Shafei 5
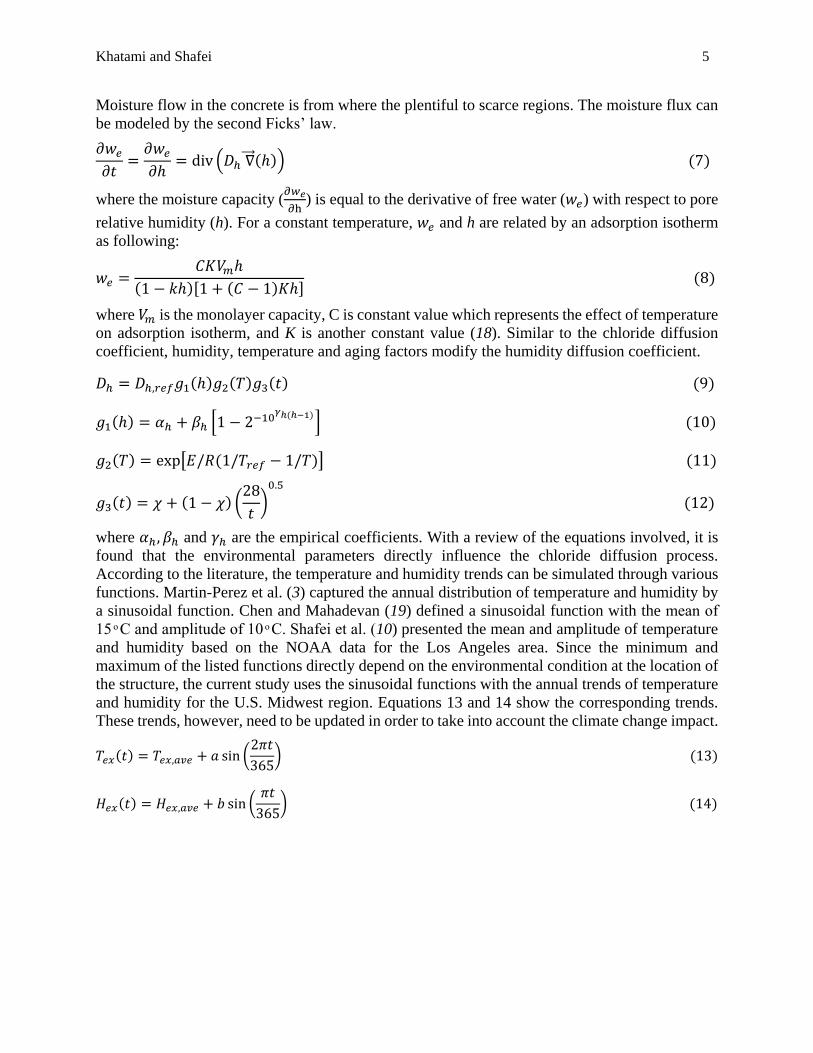
Moisture flow in the concrete is from where the plentiful to scarce regions. The moisture flux can
be modeled by the second Ficks’ law.
𝜕𝑤𝑒
𝜕𝑡=
𝜕𝑤𝑒
𝜕ℎ= div (𝐷ℎ ∇⃗⃗ ⃗(ℎ)) (7)
where the moisture capacity (𝜕𝑤𝑒
𝜕h) is equal to the derivative of free water (𝑤𝑒) with respect to pore
relative humidity (h). For a constant temperature, 𝑤𝑒 and h are related by an adsorption isotherm
as following:
𝑤𝑒 =𝐶𝐾𝑉𝑚ℎ
(1 − 𝑘ℎ)[1 + (𝐶 − 1)𝐾ℎ] (8)
where 𝑉𝑚 is the monolayer capacity, C is constant value which represents the effect of temperature
on adsorption isotherm, and K is another constant value (18). Similar to the chloride diffusion
coefficient, humidity, temperature and aging factors modify the humidity diffusion coefficient.
𝐷ℎ = 𝐷ℎ,𝑟𝑒𝑓𝑔1(ℎ)𝑔2(𝑇)𝑔3(𝑡) (9)
𝑔1(ℎ) = 𝛼ℎ + 𝛽ℎ [1 − 2−10𝛾ℎ(ℎ−1)
] (10)
𝑔2(𝑇) = exp[𝐸/𝑅(1/𝑇𝑟𝑒𝑓 − 1/𝑇)] (11)
𝑔3(𝑡) = 𝜒 + (1 − 𝜒) (28
𝑡)0.5
(12)
where 𝛼ℎ, 𝛽ℎ and 𝛾ℎ are the empirical coefficients. With a review of the equations involved, it is
found that the environmental parameters directly influence the chloride diffusion process.
According to the literature, the temperature and humidity trends can be simulated through various
functions. Martin-Perez et al. (3) captured the annual distribution of temperature and humidity by
a sinusoidal function. Chen and Mahadevan (19) defined a sinusoidal function with the mean of
15 ͦ C and amplitude of 10 ͦ C. Shafei et al. (10) presented the mean and amplitude of temperature
and humidity based on the NOAA data for the Los Angeles area. Since the minimum and
maximum of the listed functions directly depend on the environmental condition at the location of
the structure, the current study uses the sinusoidal functions with the annual trends of temperature
and humidity for the U.S. Midwest region. Equations 13 and 14 show the corresponding trends.
These trends, however, need to be updated in order to take into account the climate change impact.
𝑇𝑒𝑥(𝑡) = 𝑇𝑒𝑥,𝑎𝑣𝑒 + 𝑎 sin (2𝜋𝑡
365) (13)
𝐻𝑒𝑥(𝑡) = 𝐻𝑒𝑥,𝑎𝑣𝑒 + 𝑏 sin (𝜋𝑡
365) (14)
Khatami and Shafei 6
3. EMISSION SCENARIOS
As mentioned earlier, the IPCC (12) expressed the greenhouse gas (GHG) emissions through four
scenarios: RCP 8.5, RCP 6.0, RCP 4.5 and RCP 2.6, in which RCP 8.5 shows the high GHG
emission, RCP 4.5 and RCP 6.0 are intermediate scenarios and RCP 2.6 reflects the stringent
mitigation scenario. The trend of temperature and sea level is forecasted for these scenarios. The
mentioned emission scenarios correspond to the ones in the IPCC (11) except for the RCP 2.6. In
the IPCC 2007, the scenarios are based on the development, economic and technological pathway.
For example A1 shows a rapid economic growth and rapid introduction of efficient technologies
as well as a global population that peaks in the mid-century. Based on the alternatives of
technological change, A1 is divided to A1F1, which relies on fossil fuels intensively, A1T, which
supplies non-fossil energy resources, and A1B, which is a balance of all energy sources. A2 shows
a world with high population growth, but slow technological and economic development. Finally,
B2 demonstrates an intermediate population and economic growth. Table 1 summarizes the
temperature variation under each scenarios.
TABLE 1. Predicted temperature change for the 21st century based on the fourth and fifth
IPCC assessments.
Fourth assessment (IPCC 2007) 2081-2100 Fifth assessment (IPCC 2014) 2090-2099
Scenario Mean (ͦC) Interval Scenario Mean (ͦC) Interval
RCP 2.6 1.0 0.3-1.7
RCP 4.5 1.8 1.1-2.6 B1 1.8 1.1-2.9
RCP 6.0 2.2 1.4-3.1 B2 2.4 1.4-3.8
RCP 8.5 3.7 2.6-4.8 A1B 2.8 1.7-4.4
A1T 2.4 1.4-3.8
A1F1 4.0 2.4-6.4
A2 3.4 2.0-5.4
The average temperature and humidity in Equations 13 and 14 needs to be increased at each time
step based on the corresponding emission. For example, if the average temperature is 20 ͦC, it is
expected to reach 23.7 ͦC in 2100. In this study, four RCP scenarios are taken into account.
Therefore, in addition to sinusoidal functions which represent the annual variation of temperature,
the increasing trend of the mean of temperature is considered. There is no information available in
the IPCC reports for relative humidity. Brown and Degaetano (20) found that relative humidity
has an increasing trend throughout the central region of the U.S. but generally decreases towards
the east and west coasts. Gaffen and Ross (21) also mentioned that relative humidity has an
increasing trend, especially at nights in winter and spring over most of the nation, with the most
striking increase in Alaska. According to Dai (22), the change of relative humidity is small
compared with the mean value. They also proposed an increasing trend for relative humidity over
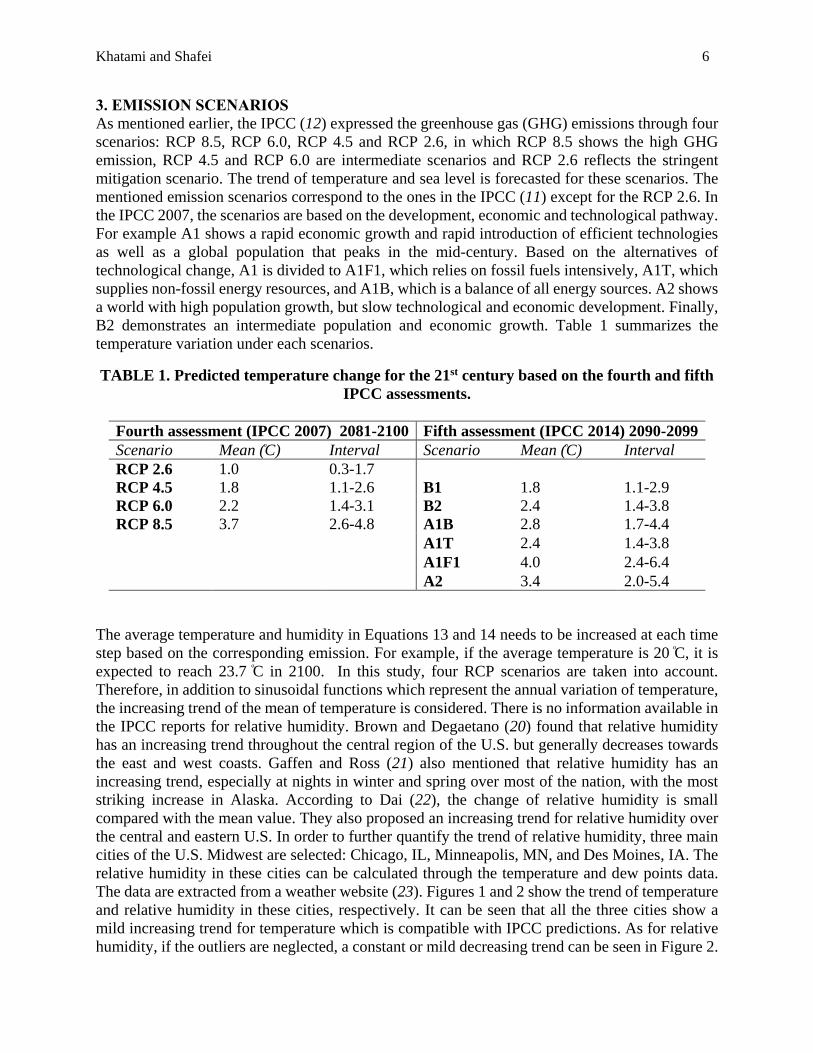
the central and eastern U.S. In order to further quantify the trend of relative humidity, three main
cities of the U.S. Midwest are selected: Chicago, IL, Minneapolis, MN, and Des Moines, IA. The
relative humidity in these cities can be calculated through the temperature and dew points data.
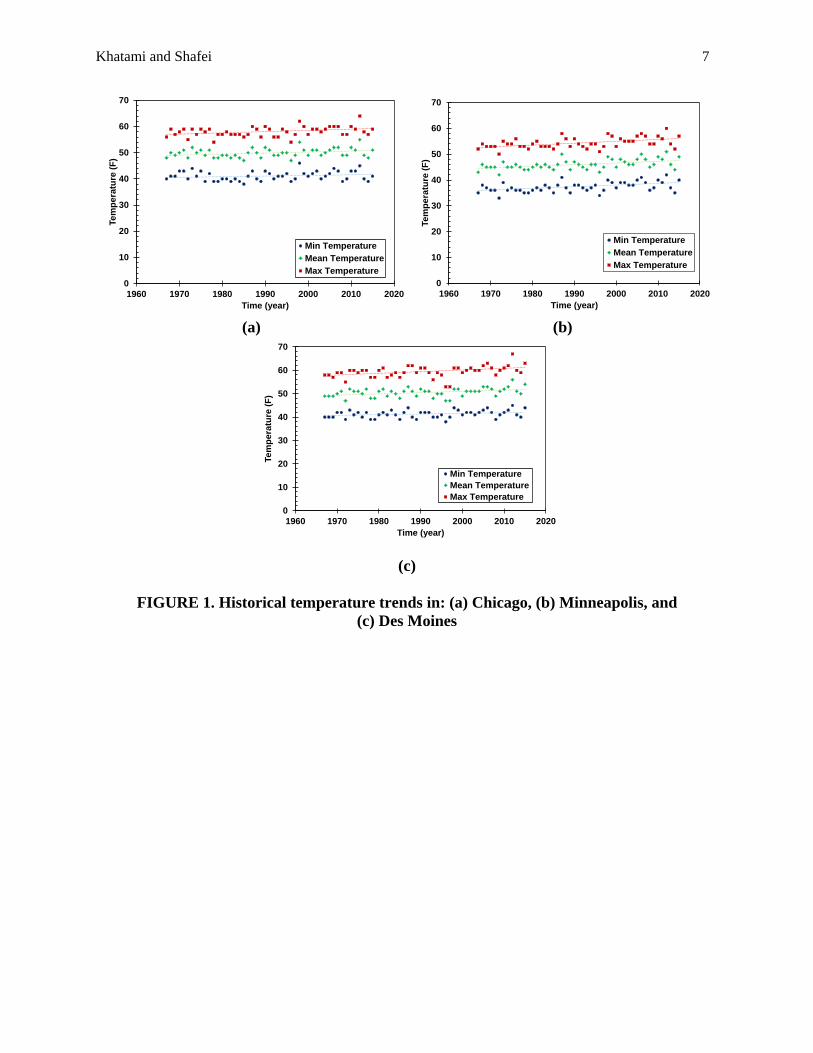
The data are extracted from a weather website (23). Figures 1 and 2 show the trend of temperature
and relative humidity in these cities, respectively. It can be seen that all the three cities show a
mild increasing trend for temperature which is compatible with IPCC predictions. As for relative
humidity, if the outliers are neglected, a constant or mild decreasing trend can be seen in Figure 2.
Khatami and Shafei 7
(a) (b)
(c)
FIGURE 1. Historical temperature trends in: (a) Chicago, (b) Minneapolis, and
(c) Des Moines
0
10
20
30
40
50
60
70
1960 1970 1980 1990 2000 2010 2020
Tem
pera
ture
(F
)
Time (year)
Min Temperature
Mean Temperature
Max Temperature
0
10
20
30
40
50
60
70
1960 1970 1980 1990 2000 2010 2020
Tem
pera
ture
(F
)
Time (year)
Min Temperature
Mean Temperature
Max Temperature
0
10
20
30
40
50
60
70
1960 1970 1980 1990 2000 2010 2020
Tem
pera
ture
(F
)
Time (year)
Min Temperature
Mean Temperature
Max Temperature
Khatami and Shafei 8
(a) (b)
(c)
FIGURE 2. Historical trends of relative humidity in: (a) Chicago, (b) Minneapolis, and
(c) Des Moines
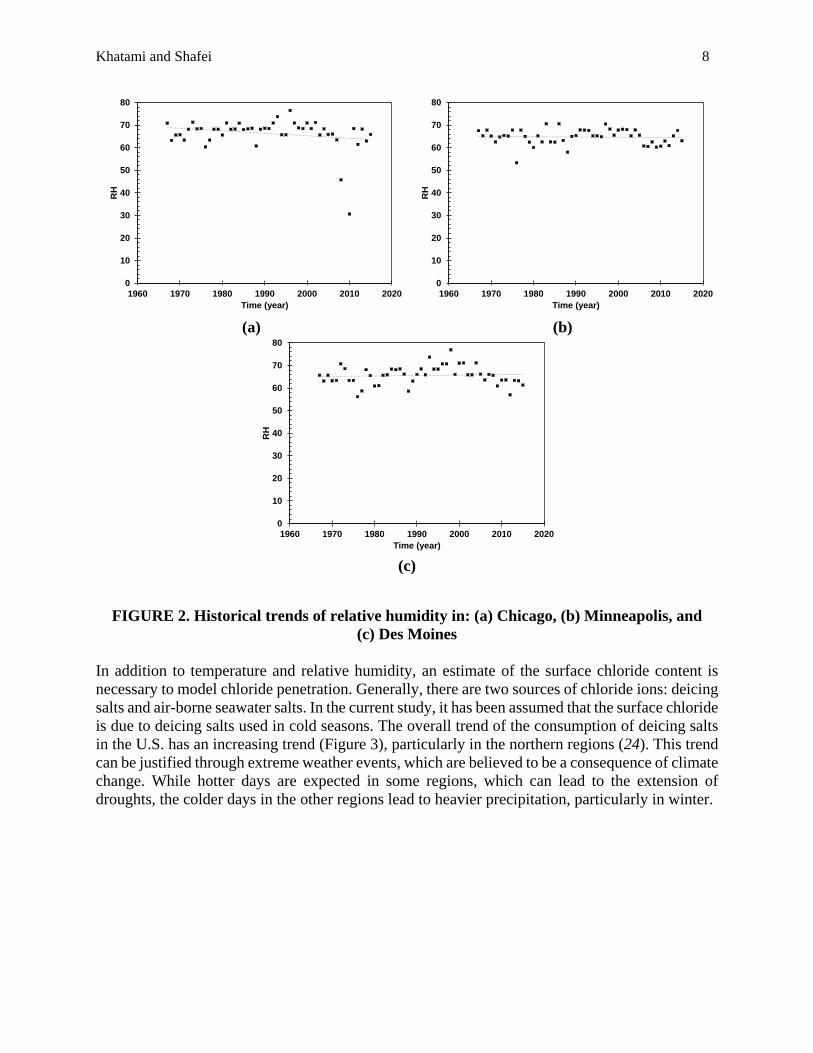
In addition to temperature and relative humidity, an estimate of the surface chloride content is
necessary to model chloride penetration. Generally, there are two sources of chloride ions: deicing
salts and air-borne seawater salts. In the current study, it has been assumed that the surface chloride
is due to deicing salts used in cold seasons. The overall trend of the consumption of deicing salts
in the U.S. has an increasing trend (Figure 3), particularly in the northern regions (24). This trend
can be justified through extreme weather events, which are believed to be a consequence of climate
change. While hotter days are expected in some regions, which can lead to the extension of
droughts, the colder days in the other regions lead to heavier precipitation, particularly in winter.
0
10
20
30
40
50
60
70
80
1960 1970 1980 1990 2000 2010 2020
RH
Time (year)
0
10
20
30
40
50
60
70
80
1960 1970 1980 1990 2000 2010 2020
RH
Time (year)
0
10
20
30
40
50
60
70
80
1960 1970 1980 1990 2000 2010 2020
RH
Time (year)
Khatami and Shafei 9
FIGURE 3. Trend of the consumption of deicing salts in the U.S.
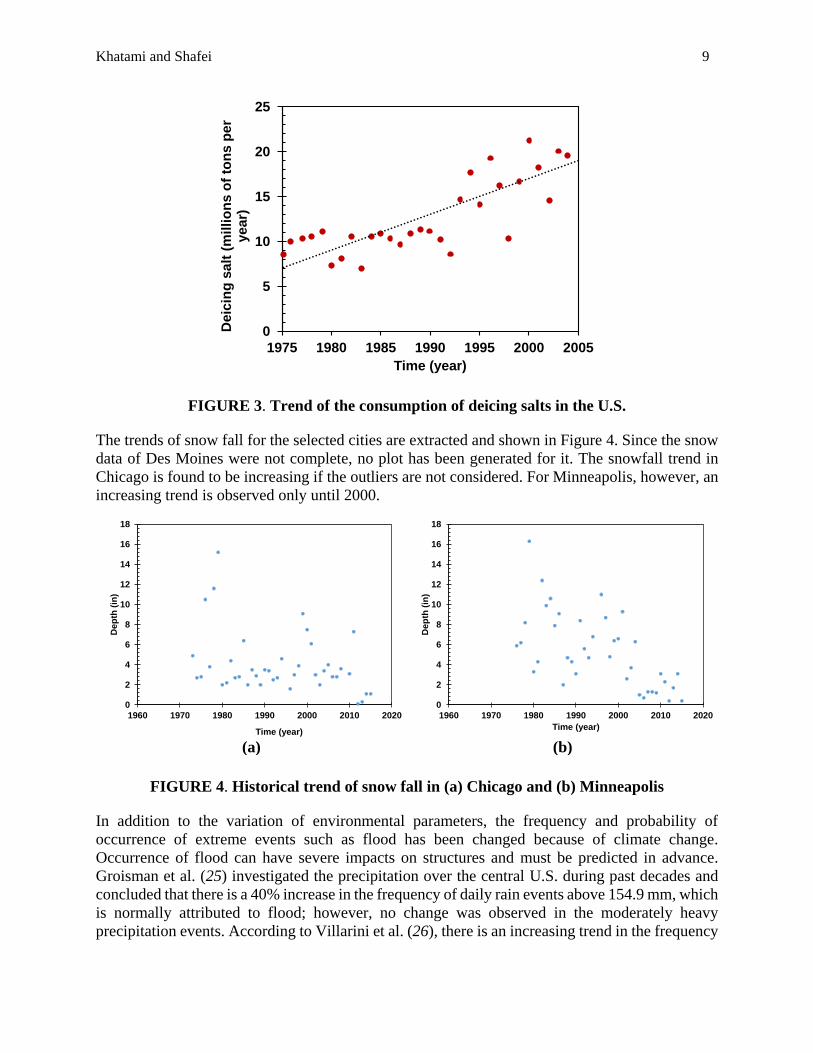
The trends of snow fall for the selected cities are extracted and shown in Figure 4. Since the snow
data of Des Moines were not complete, no plot has been generated for it. The snowfall trend in
Chicago is found to be increasing if the outliers are not considered. For Minneapolis, however, an
increasing trend is observed only until 2000.
(a) (b)
FIGURE 4. Historical trend of snow fall in (a) Chicago and (b) Minneapolis
In addition to the variation of environmental parameters, the frequency and probability of
occurrence of extreme events such as flood has been changed because of climate change.
Occurrence of flood can have severe impacts on structures and must be predicted in advance.
Groisman et al. (25) investigated the precipitation over the central U.S. during past decades and
concluded that there is a 40% increase in the frequency of daily rain events above 154.9 mm, which
is normally attributed to flood; however, no change was observed in the moderately heavy
precipitation events. According to Villarini et al. (26), there is an increasing trend in the frequency
0
5
10
15
20
25
1975 1980 1985 1990 1995 2000 2005
Deic
ing
salt
(m
illi
on
s o
f to
ns p
er
year)
Time (year)
0
2
4
6
8
10
12
14
16
18
1960 1970 1980 1990 2000 2010 2020
De
pth
(in
)
Time (year)
0
2
4
6
8
10
12
14
16
18
1960 1970 1980 1990 2000 2010 2020
De
pth
(in
)
Time (year)
Khatami and Shafei 10
of heavy rainfalls over the central U.S., which includes the States of Illinois, Minnesota, and Iowa.
Rahmani et al. (27) studied the distributions of extreme daily and monthly rainfalls in Kansas for
the period of 1890–2013. The results show that most stations in the region have experienced an
upward trend for the frequency of rainfall events above the 90th, 95th and 99th percentile.
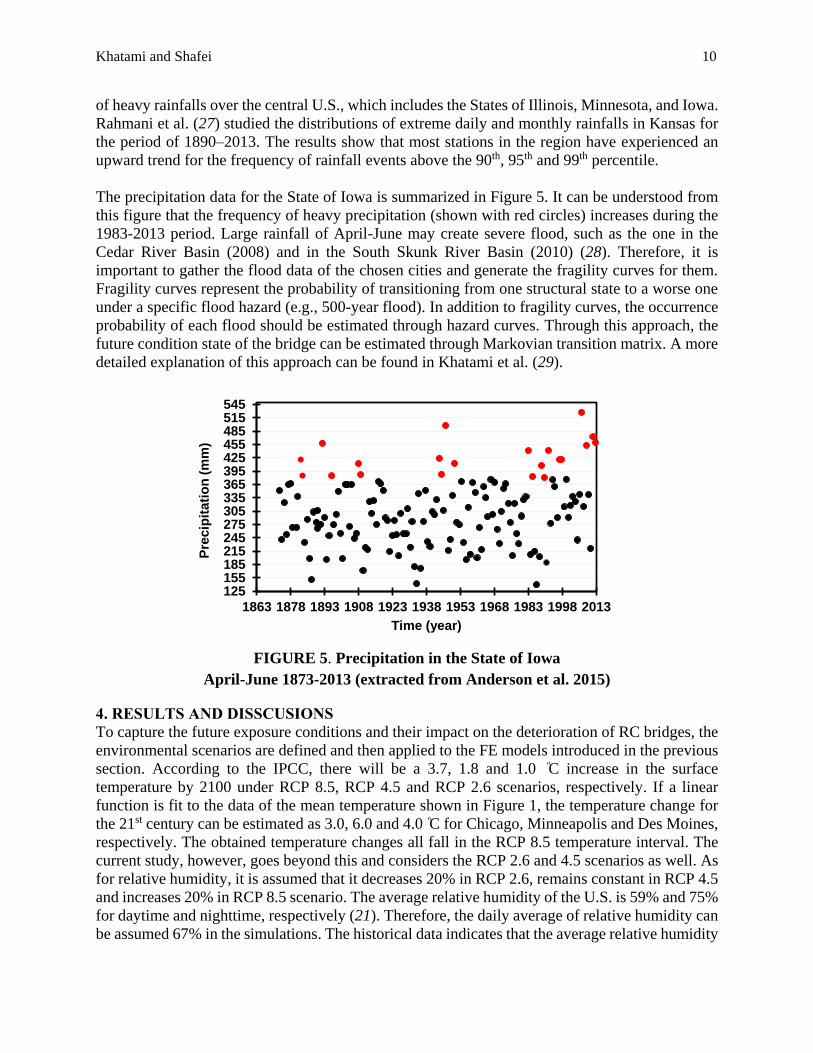
The precipitation data for the State of Iowa is summarized in Figure 5. It can be understood from
this figure that the frequency of heavy precipitation (shown with red circles) increases during the
1983-2013 period. Large rainfall of April-June may create severe flood, such as the one in the
Cedar River Basin (2008) and in the South Skunk River Basin (2010) (28). Therefore, it is
important to gather the flood data of the chosen cities and generate the fragility curves for them.
Fragility curves represent the probability of transitioning from one structural state to a worse one
under a specific flood hazard (e.g., 500-year flood). In addition to fragility curves, the occurrence
probability of each flood should be estimated through hazard curves. Through this approach, the
future condition state of the bridge can be estimated through Markovian transition matrix. A more
detailed explanation of this approach can be found in Khatami et al. (29).
FIGURE 5. Precipitation in the State of Iowa
April-June 1873-2013 (extracted from Anderson et al. 2015)
4. RESULTS AND DISSCUSIONS
To capture the future exposure conditions and their impact on the deterioration of RC bridges, the
environmental scenarios are defined and then applied to the FE models introduced in the previous
section. According to the IPCC, there will be a 3.7, 1.8 and 1.0 ͦC increase in the surface
temperature by 2100 under RCP 8.5, RCP 4.5 and RCP 2.6 scenarios, respectively. If a linear
function is fit to the data of the mean temperature shown in Figure 1, the temperature change for
the 21st century can be estimated as 3.0, 6.0 and 4.0 ͦC for Chicago, Minneapolis and Des Moines,
respectively. The obtained temperature changes all fall in the RCP 8.5 temperature interval. The
current study, however, goes beyond this and considers the RCP 2.6 and 4.5 scenarios as well. As
for relative humidity, it is assumed that it decreases 20% in RCP 2.6, remains constant in RCP 4.5
and increases 20% in RCP 8.5 scenario. The average relative humidity of the U.S. is 59% and 75%
for daytime and nighttime, respectively (21). Therefore, the daily average of relative humidity can
be assumed 67% in the simulations. The historical data indicates that the average relative humidity
125155185215245275305335365395425455485515545
1863 1878 1893 1908 1923 1938 1953 1968 1983 1998 2013
Pre
cip
ita
tio
n (
mm
)
Time (year)
Khatami and Shafei 11
is 66%, 65% and 66% in Chicago, Minneapolis and Des Moines respectively. This indicates that
the average relative humidity of 67% assumed for simulations can capture the actual trend of
relative humidity in the U.S. Midwest region very well. By having the estimates of temperature
and relative humidity, the only parameter that needs to be defined in the climate scenarios is
surface chloride content. The concentration of surface chloride is a function of mass of consumed
deicing salts. Although deicing salts are used in cold seasons, it is known that the surface chloride
content will not necessarily drop to zero after the winter time, primarily because of flushing by
snowmelts and spring rains. The surface chloride due to deicing salts has approximately 60.6% of
NaCl mass (30). In this study, it is assumed that the surface chloride will increase 5%, 10% and
20% for low to high exposure conditions. Table 2 represents the environmental parameters of each
global warming scenarios.
TABLE 2 Global warming scenarios parameters.
Scenario RCP 2.6 RCP 4.5 RCP 8.5
2005 2100 2005 2100 2005 2100
Temperature (K) 256.5 257.5 256.5 258.3 256.5 260.2
Relative humidity 67.0 53.6 67.0 67.0 67.0 80.4
Surface chloride (kg/m3) 17.2 18.0 17.2 18.9 17.2 20.5
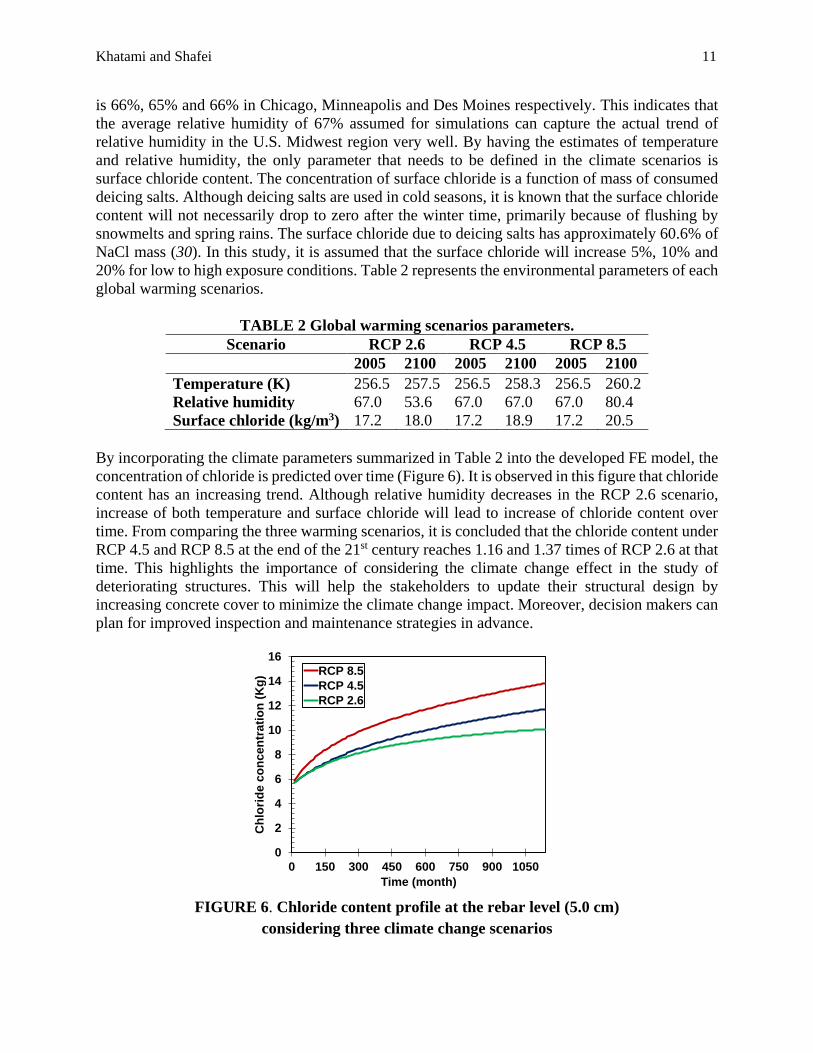
By incorporating the climate parameters summarized in Table 2 into the developed FE model, the
concentration of chloride is predicted over time (Figure 6). It is observed in this figure that chloride
content has an increasing trend. Although relative humidity decreases in the RCP 2.6 scenario,
increase of both temperature and surface chloride will lead to increase of chloride content over
time. From comparing the three warming scenarios, it is concluded that the chloride content under
RCP 4.5 and RCP 8.5 at the end of the 21st century reaches 1.16 and 1.37 times of RCP 2.6 at that
time. This highlights the importance of considering the climate change effect in the study of
deteriorating structures. This will help the stakeholders to update their structural design by
increasing concrete cover to minimize the climate change impact. Moreover, decision makers can
plan for improved inspection and maintenance strategies in advance.
FIGURE 6. Chloride content profile at the rebar level (5.0 cm)
considering three climate change scenarios
0
2
4
6
8
10
12
14
16
0 150 300 450 600 750 900 1050
Ch
lori
de c
on
cen
trati
on
(K
g)
Time (month)
RCP 8.5
RCP 4.5
RCP 2.6
Khatami and Shafei 12
To incorporate the impact of climate change in the Bridge Management Systems, the chloride
penetration process needs to be evaluated by incorporating the environmental parameters under
different climate change scenarios. The updated chloride profile should then be employed to
develop a stochastic process that can predict the future condition state of the bridge components
depending on site-specific exposure conditions. This will be achieved by updating the traditional
transition matrices. The decision makers will be able to utilize the revised transition matrices to
estimate the future structural condition of the bridge at any desired time interval. The details of
this procedure can be found in Khatami et al. (29). In addition to the impact of climate change on
the deterioration of bridges, the severe consequences of extreme events such as flood should be
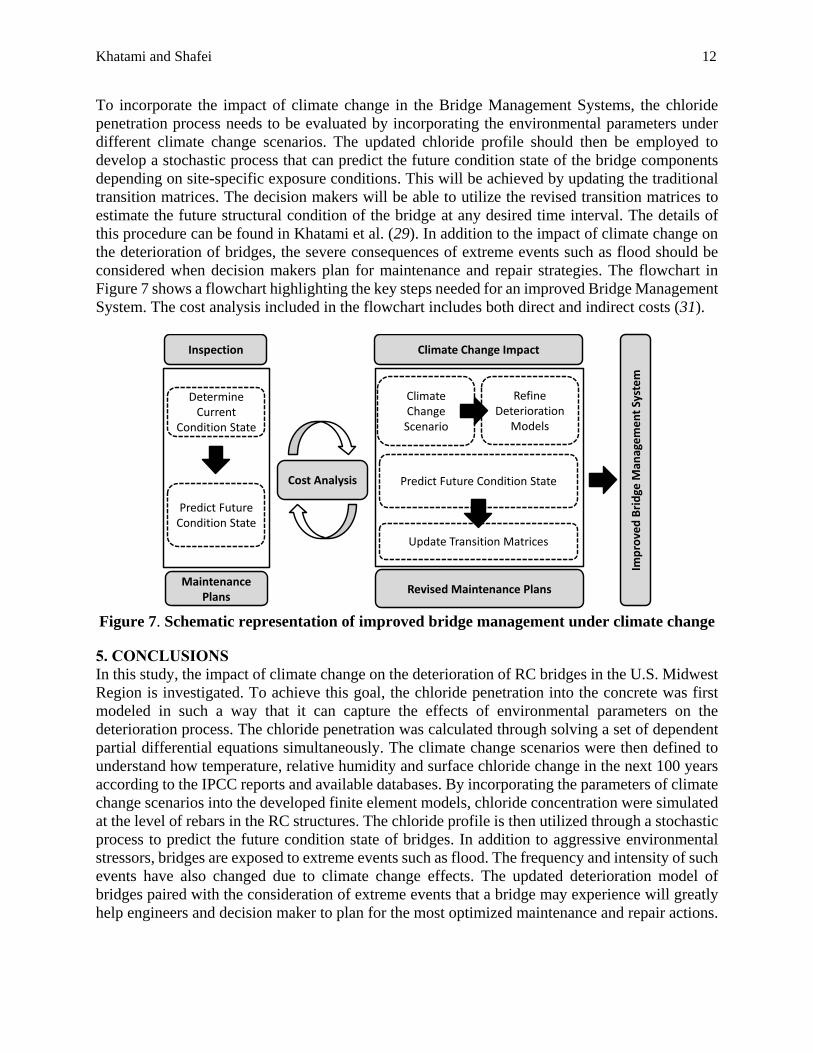
considered when decision makers plan for maintenance and repair strategies. The flowchart in
Figure 7 shows a flowchart highlighting the key steps needed for an improved Bridge Management
System. The cost analysis included in the flowchart includes both direct and indirect costs (31).
Figure 7. Schematic representation of improved bridge management under climate change
5. CONCLUSIONS
In this study, the impact of climate change on the deterioration of RC bridges in the U.S. Midwest
Region is investigated. To achieve this goal, the chloride penetration into the concrete was first
modeled in such a way that it can capture the effects of environmental parameters on the
deterioration process. The chloride penetration was calculated through solving a set of dependent
partial differential equations simultaneously. The climate change scenarios were then defined to
understand how temperature, relative humidity and surface chloride change in the next 100 years
according to the IPCC reports and available databases. By incorporating the parameters of climate
change scenarios into the developed finite element models, chloride concentration were simulated
at the level of rebars in the RC structures. The chloride profile is then utilized through a stochastic
process to predict the future condition state of bridges. In addition to aggressive environmental
stressors, bridges are exposed to extreme events such as flood. The frequency and intensity of such
events have also changed due to climate change effects. The updated deterioration model of
bridges paired with the consideration of extreme events that a bridge may experience will greatly
help engineers and decision maker to plan for the most optimized maintenance and repair actions.
Inspection
Maintenance Plans
Cost Analysis
Revised Maintenance Plans
Climate Change Impact
Imp
rove
d B
rid
ge M
anag
eme
nt
Syst
em
Determine Current
Condition State
Predict Future Condition State
Update Transition Matrices
Predict Future Condition State
Climate Change
Scenario
Refine Deterioration
Models
Khatami and Shafei 13
The developed framework directly contributes to improve the bridge management and cost
predictions under the climate change impact.
ACKNOWLEDGEMENT
This manuscript is based on the work supported by the Midwest Transportation Center (MTC).
Any opinions, findings, and conclusions expressed in this manuscript are those of the authors and
do not necessarily reflect the views of the Midwest Transportation Center (MTC).
REFERENCES
1. Saetta, A. V., Scotta, R. V., and Vitaliani, R. V. Analysis of Chloride Diffusion into
Partially Saturated Concrete, ACI Materials Journal, 1993, 90(5), 441-451.
2. Xi, Y., and Bazant, Z. P. Modeling Chloride Penetration in Saturated Concrete, Journal of
Materials in Civil Engineering, 1999, 58-65.
3. Martin-Perez, B., Pantazopoulou, Thomas, M. D. A. Numerical Solution of Mass Transport
Equations in Concrete Structures, Computer and Structures, 2001, 79, 1251-1264.
4. Kong, J. S., Ababneh, A. N., Frangopol, D. M., and Xi, Y. Reliability Analysis of Chloride
Penetration in Saturated Concrete, Probabilistic Engineering Mechanics, 2002, 17, 305-
315.
5. Ababneh A., Benboudjema, F., Xi, Y. Chloride Penetration in Non-Saturated Concrete,
Journal of Materials in Civil Engineering, 2003, 183-191.
6. Han, S. H. Influence of Diffusion Coefficient on Chloride Ion Penetration of Concrete
Structure, Construction and Building Materials, 2007, 21, 370-378.
7. Val, D. V. and Trapper, P. A. Probabilistic Evaluation of Initiation Time of Chloride-
Induced Corrosion, Reliability Engineering and System Safety, 2008, 93, 364-372.
8. Bertolini, Steel Corrosion and Service Life of Reinforced Concrete Structures, Structure
and Infrastructure Engineering, 2008, 4(2), 123-137.
9. El Hassan, J., Bressolette, P., Chateauneuf, A., and Tawil, K. E. Reliability-Based
Assessment of the Effect of Climatic Conditions on the Corrosion of RC Structures Subject
to Chloride Ingress, Engineering Structures, 2010, 32, 3279-3287.
10. Shafei, B., Alipour, A., and Shinozuka, M., Prediction of Corrosion Initiation in Reinforced
Concrete Members Subjected to Environmental Stressors: A Finite-Element Framework,
Cement and Concrete Research, 2012, 42, 365-376.
11. Pachauri, R. K., and Reisinger, A. Climate Change 2007, Synthesis Report,
Intergovernmental Panel on Climate Change.
12. Pachauri, R. K., and Meyer, L. Climate Change 2014, Synthesis Report, Intergovernmental
Panel on Climate Change.
13. Yoon, I-S., Copuroglu, O. and Park, K-.. Effect of Global Climatic Change on Carbonation
Progress of Concrete. Atmospheric Environment, Vol. 41, 2007, pp. 7274-7285.
14. Castro-Borges, P., and Mendoza-Rangel, J. M. Influence of Climate Change on Concrete
Durability in Yucatan Peninsula, Corrosion Engineering, Science and Technology, Vol.
45, No.1, 2010, pp. 61-69.
15. Stewart, M.G., Wang, X. and Nguyen, X. Climate Change Impact and Risks of Concrete
Infrastructure Deterioration, Engineering Structures, Vol. 33, 2011, pp. 1326-1337.
Khatami and Shafei 14
16. Stewart, M. G., Wang, X. and Nguyen, M. N. Climate Change Adaptation for Corrosion
Control of Concrete Infrastructure, Structural Safety, Vol.35, 2012, pp.29-39.
17. Bastidas-Arteaga E., and Stewart, M.G. Economic Assessment of Climate Adaptation
Strategies for Existing Reinforced Concrete Structures Subjected to Chloride-Induced
Corrosion, Structure and Infrastructure Engineering, 2015,
http://dx.doi.org/10.1080/15732479.2015.1020499
18. Xi, Y., Bazant, Z. P., and Jennings, H. M. Moisture Diffusion in Cementitious Materials,
Advanced Cement Based Materials, 1994, 248-257.
19. Chen, D., and Mahadevan, S. Chloride-Induced Reinforcement Corrosion and Concrete
Cracking Simulation, Cement and Concrete Composites, 2008, 30, 227-238.
20. Brown, P. J., and Degaetano, A. T. Trends in U.S. Surface Humidity, 1930-2010, American
Meteorological Society, 2013, 52, 147-163.
21. Gaffen, D. J., and Ross, R. J. Climatology and Trends of U.S. Surface Humidity and
Temperature, Journal of Climate, 1999, 12, 811-828.
22. Dai, A. Recent Climatology, Variability, and Trends in Global Surface Humidity,
American Meteorological Society, 2006, 3589-3606.
23. https://www. wunderground.com
24. Findlay, S. E.G., and Kelly, V.R. Emerging Indirect and Long-Term Road Salt Effects on
Ecosystems, Annals of the New York Academy of Sciences, 2011, 58-68.
25. Groisman, P. Y., Knight, R.W., and Karl, T.R. Changes in Intense Precipitation Over the
Central United States, American Meteorological Society, 2013, pp. 47-66.
26. Villarini, G., Smith, J. A., and Vecchi, G. Changing Frequency of Heavy Rainfall Over the
Central United States, American Meteorological Society, 2013, pp. 351-357.
27. Rahmani, V., Hutchinson, S.L., Harrington Jr., J.A., and Hutchinson, J. M.S. Analysis of
Frequency and Magnitude of Extreme Rainfall Events with Potential Impacts on Flooding:
A Case Study from the Central United States, International Journal of Climatology, 2015,
doi:10.1002/joc.4577.
28. Anderson, C.J., Claman, D., and Mantilla, R. Iowa’s Bridge and Highway Climate Change
and Extreme Weather Vulnerability Assessment Pilot, Institude for Transportation Iowa
State University, 2015.
29. Khatami, D., Shafei, B., and Smadi, O. Management of bridges under aging mechanisms
and extreme events: A Risk-Based Approach, Transportation Research Record Journal,
2016, pp. 89-95.
30. Rivett, M. O., Cuthbert, M. O., Gamble, R., Connon, L. E., Pearson, A., Shepley, M. G.,
and Davis, J. Highway Deicing Salt Dynamic Runoff to Surface Water and Subsequent
Infiltration to Groundwater During Severe UK Winters, Science of the Total Environment,
2016, 565, 324-338.
31. Alipour, A., Shafei, B., and Shinozuka, M. Capacity Loss Evaluation of Reinforced
Concrete Bridges Located in Extreme Chloride-Laden Environment. Structure and
Infrastructure Engineering, Vol. 9, No. 1, 2013, pp. 8-27.