Climate change, fires, and carbon aerosol over N. America with preliminary detour to discuss GCAP...
17
Climate change, fires, and carbon aerosol over N. America with preliminary detour to discuss GCAP model development (GCAP= Global change and air pollution) GCAP phase 2: Daniel Jacob (PI), Loretta Mickley, Shiliang Wu, Daewon Byun, David Rind, Joshua Fu, John Seinfeld, David Streets, Moeko Yoshitomi, Havala Pye, Hong Liao, Yum-Fat Lam (Nicky), Hyun Cheol, et al. Landcover project: Loretta Mickley, Shiliang Wu, Jed Kaplan, Daniel Jacob Wildfire project: Jennifer Logan (PI), Dominick Spracklen, Rynda Hudman, Loretta Mickley, Daewon Byun, David Diner, Qinbin Li
-
date post
19-Dec-2015 -
Category
Documents
-
view
215 -
download
1
Transcript of Climate change, fires, and carbon aerosol over N. America with preliminary detour to discuss GCAP...

Climate change, fires, and carbon aerosol over N. America
with preliminary detour to discuss GCAP model development
(GCAP= Global change and air pollution)
GCAP phase 2: Daniel Jacob (PI), Loretta Mickley, Shiliang Wu, Daewon Byun, David Rind, Joshua Fu, John Seinfeld, David Streets, Moeko Yoshitomi, Havala Pye, Hong Liao, Yum-Fat Lam (Nicky), Hyun Cheol, et al.
Landcover project: Loretta Mickley, Shiliang Wu, Jed Kaplan, Daniel Jacob
Wildfire project: Jennifer Logan (PI), Dominick Spracklen, Rynda Hudman, Loretta Mickley, Daewon Byun, David Diner, Qinbin Li
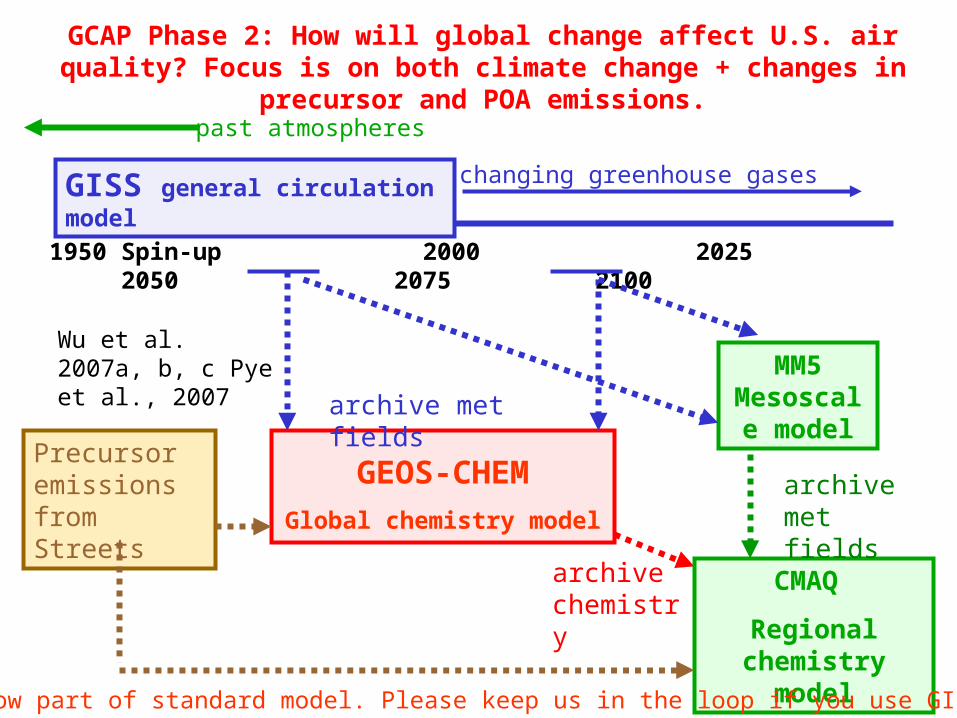
GCAP Phase 2: How will global change affect U.S. air quality? Focus is on both climate change + changes in precursor and POA
emissions.
Precursor emissions from Streets
archive met fields
GEOS-CHEM
Global chemistry model
CMAQ
Regional chemistry model
1950 2000 2025 2050 2075 2100
GISS general circulation model
Spin-up
MM5 Mesoscale
model
archive chemistry
archive met fields
changing greenhouse gases
past atmospheres
GCAP is now part of standard model. Please keep us in the loop if you use GISS met!!
Wu et al. 2007a, b, c Pye et al., 2007

Land cover variation of GCAP: How will climate change affect future land cover? What are the chem-climate interactions of land
cover change?
Anthro emissions
Archive met fields
GEOS-CHEM
Global chemistry model
Ozone and aerosol (including dust)
Chemistry fields + land cover change will be fed back into GCM.
1950 2000 2025 2050 2075 2100
GISS general circulation model
Spin-up
changing greenhouse gases
LPJ vegetation model
Apply1950-2100 met fields + CO2
Recalculate 2000-2100 climate
veg type + LAI
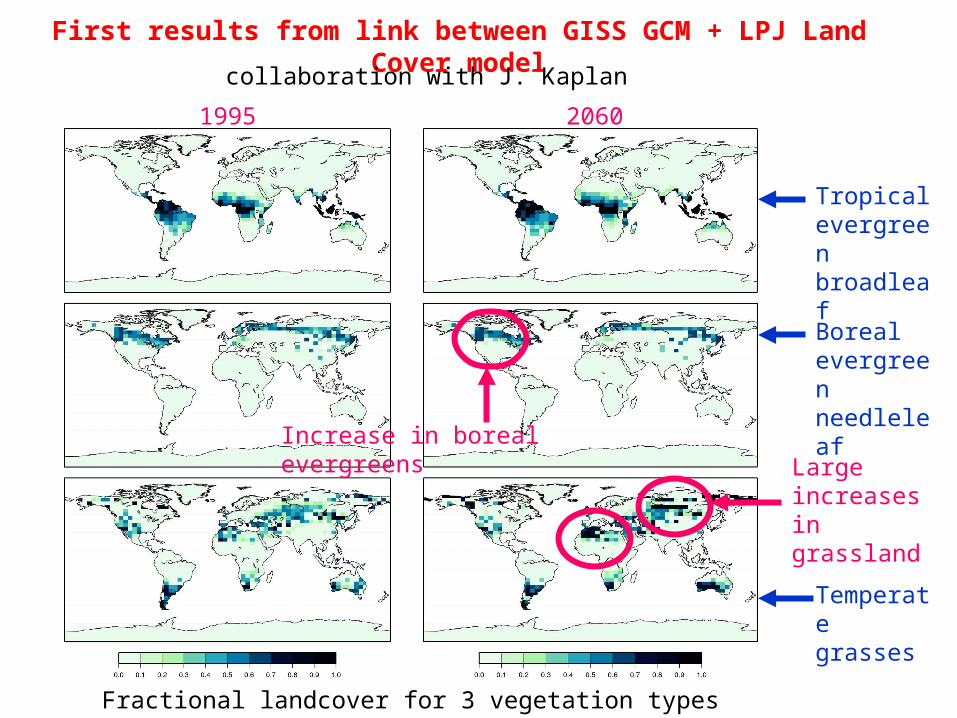
First results from link between GISS GCM + LPJ Land Cover model
1995 2060
Tropical evergreen broadleaf
Boreal evergreen needleleaf
Temperate grasses
Large increases in grassland
Increase in boreal evergreens
Fractional landcover for 3 vegetation types
collaboration with J. Kaplan

Observed trends in temperature and area burned over Canada show large interannual variability.
Most of the variability in wildfire frequency is due to year-to-year changes in surface temperatures and precipitation.
Area burned and temperature in Canada over the last century
Gillet et al., 2004
EPA wildfire project: How will changing forest fire frequency affect future air quality over the United States?
What will happen next? Dominick Spracklen developed a fire prediction tool to calculate area burned using GISS GCM meteorological variables.
. . . 2050 and beyond
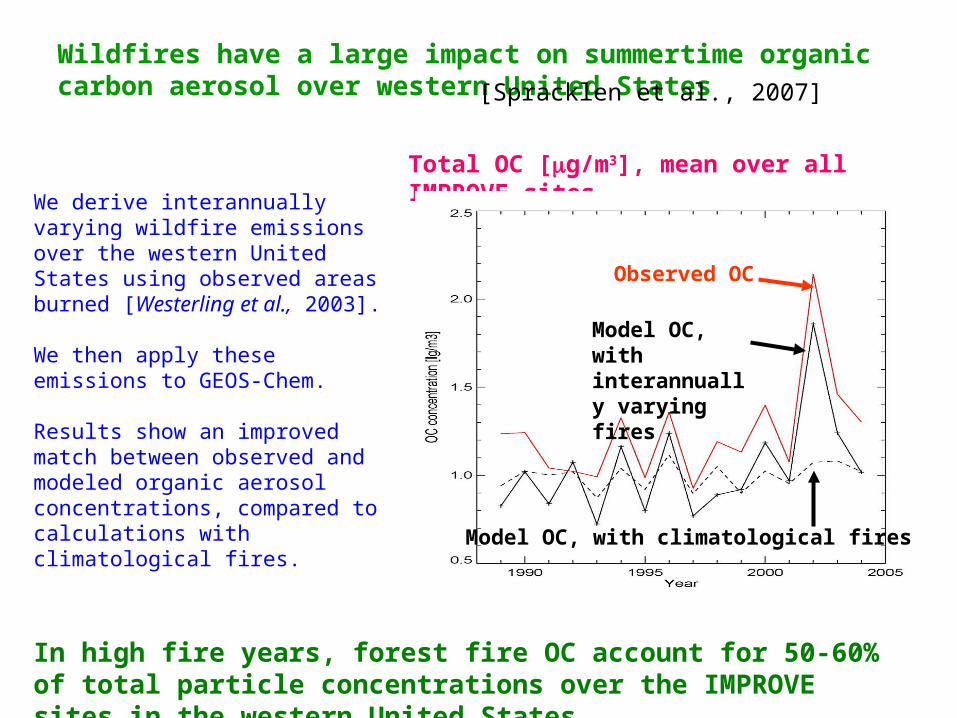
Wildfires have a large impact on summertime organic carbon aerosol over western United States
We derive interannually varying wildfire emissions over the western United States using observed areas burned [Westerling et al., 2003].
We then apply these emissions to GEOS-Chem.
Results show an improved match between observed and modeled organic aerosol concentrations, compared to calculations with climatological fires.
Total OC [g/m3], mean over all IMPROVE sites
Observed OC
Model OC, with interannually varying fires
Model OC, with climatological fires
In high fire years, forest fire OC account for 50-60% of total particle concentrations over the IMPROVE sites in the western United States.
[Spracklen et al., 2007]

Dominick’s Fire Prediction tool for the western U.S: 1) Regress observed met variables and drought indices against linear area burned2) Choose best predictors for each ecosystem.3) Archive these predictors from GISS GCM for future climate.
May-Oct mean obs TemperatureMay-Oct mean obs Drought Code
R2=52%
Are
a b
urn
ed /
106
Ha
0.5
0.25
1980 20001990
1980 1990 2000 200019901980
observations
model Regressions ‘explain’ 50-60% of variability in annual area burned in forest ecosystems.
Best predictors are often temperature or Fuel Moisture Index.
Sample results for Pacific Northwest/Cascade Forests.
May-Oct Area burned

Variation of GCAP model to predict climate change impacts on forest fires and air quality
Calculate emissions
archive met fields
GEOS-CHEM
Global chemistry model
1950 2000 2025 2050 2075 2100
GISS general circulation model
Spin-up
archive chemistry
changing greenhouse gases (A1 scenario)
Predict Area Burned
Area Burned Regressions
Organic carbon aerosol from wildfires.
Fields will be fed back into GISS GCM to calculate chem-climate interactions.
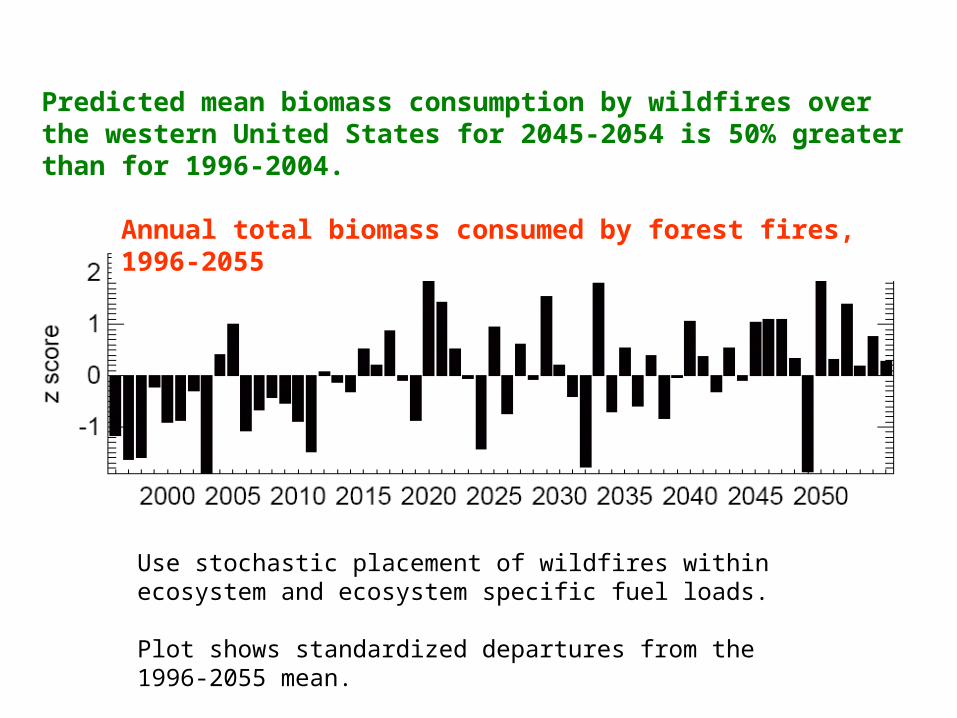
Predicted mean biomass consumption by wildfires over the western United States for 2045-2054 is 50% greater than for 1996-2004.
Use stochastic placement of wildfires within ecosystem and ecosystem specific fuel loads.
Plot shows standardized departures from the 1996-2055 mean.
Annual total biomass consumed by forest fires, 1996-2055

Current (1996-2000) Future (2046-2050)
Future-current Future / current
Predicted changes to summertime (June-Aug) Organic Carbon concentrations over the US from GCAP model
Summertime OC concentrations predicted to increase by ~30% over western US.
Largest increases over Rockies and Pacific Northwest.
Dr. Hudman will continue this work with full chemistry GCAP model.

Conclusions
• In western United States, interannual variability in summertime OC is driven by variability in fires.
• Increased fires in western US since the mid 1980s has likely caused increase in summertime OC concentrations. • Regressions of annual area burned in western US capture 50-57% of interannual variablity. Temperature and fuel moisture are best predictors.
• Using GISS GCM output, forest fire emissions of OC predicted to increase by 50% by 2045-2055 (over 1995-2004) resulting in mean summertime OC to increase by 30% over western United States.

Extra slides

Blueprint for model predicting forest fire area burned from met fields [Flannigan et al., 2005; Spracken et al., 2007]
Daily forest moisture parameters
Observed area burned database (1o x 1o)
Aggregate area burned to
ecosystem
Canadian Fire Weather Index
System
Predictors of Area Burned
Linear stepwise regression
Observed daily Temperature, Wind speed, Rainfall, RH
Models uses stepwise linear regression between meteorological/forest moisture variables & area burned

Aggregated ecosystems (similar vegetation / climate)
6.7105.8
17.525.4
3.611.6
12.8151.6 4.8
51.8
4.59.8
1980 – 2004 Totals [Westerling et al., 2002]Area Burned / 106 acresBiomass consumed/ Tg
Bailey (1994) classification
Over the western U.S., the Pacific Northwest and Rocky Mountain Forests are the most important regions for biomass consumption in wildfires.
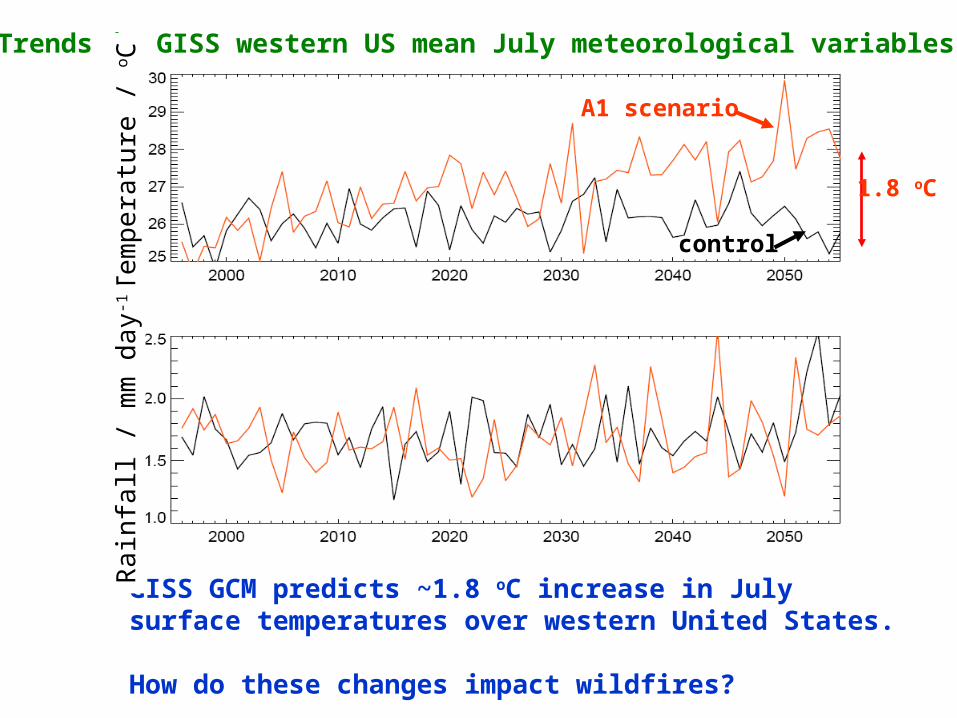
Trends in GISS western US mean July meteorological variables
GISS GCM predicts ~1.8 oC increase in July surface temperatures over western United States.
How do these changes impact wildfires?
Te
mp
era
ture
/ oC
Ra
infa
ll / m
m d
ay-1
A1 scenario
control
1.8 oC
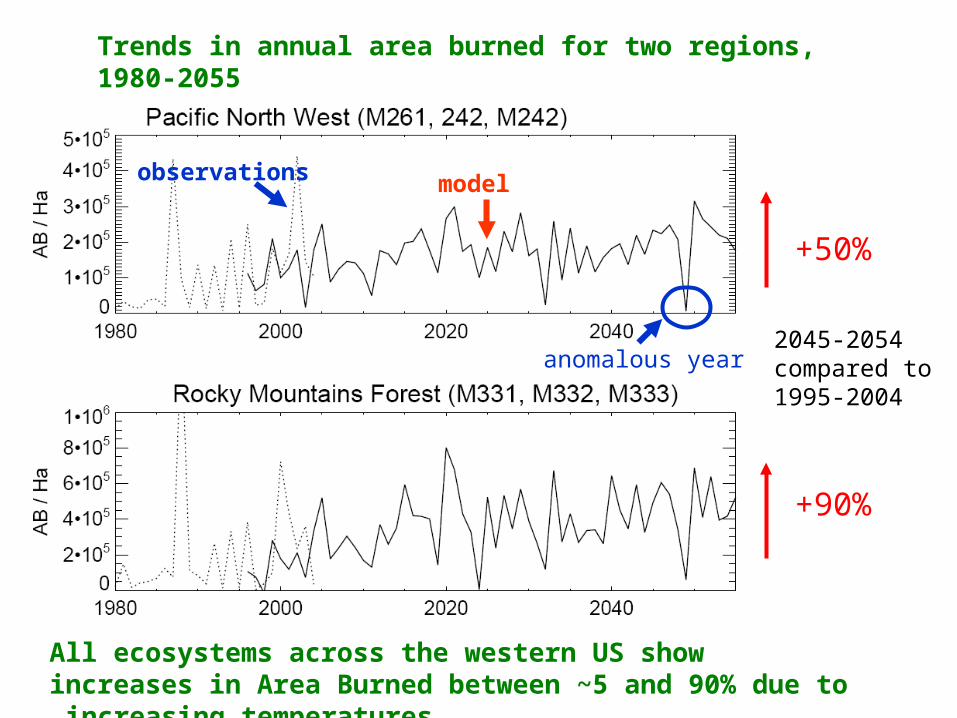
Trends in annual area burned for two regions, 1980-2055
All ecosystems across the western US show increases in Area Burned between ~5 and 90% due to increasing temperatures.
+50%
+90%
2045-2054 compared to 1995-2004
observations model
anomalous year
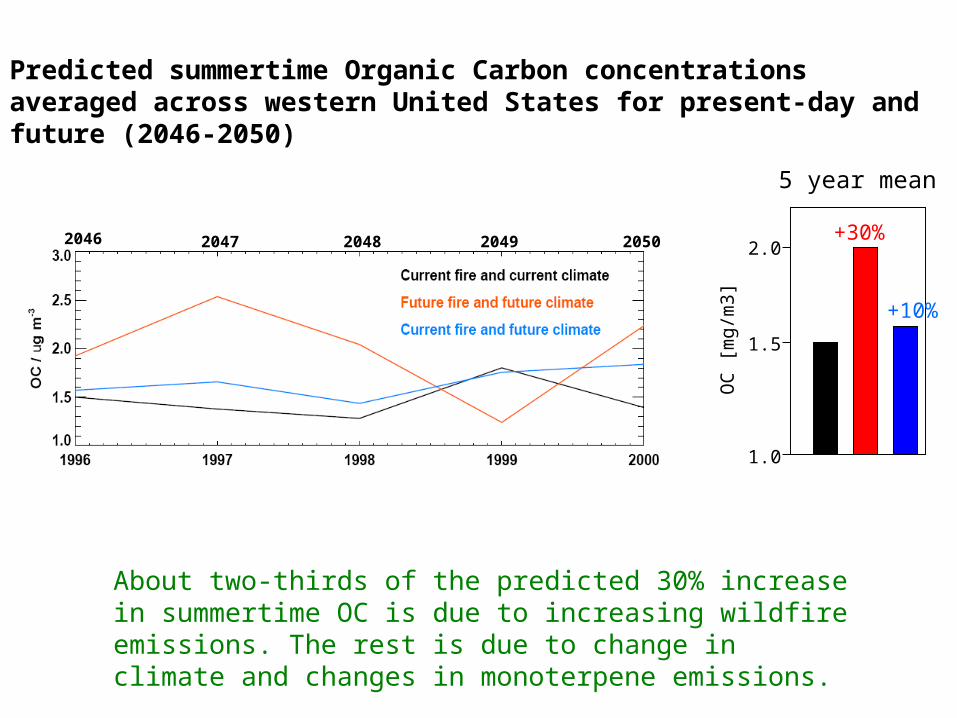
Predicted summertime Organic Carbon concentrations averaged across western United States for present-day and future (2046-2050)
About two-thirds of the predicted 30% increase in summertime OC is due to increasing wildfire emissions. The rest is due to change in climate and changes in monoterpene emissions.
2046 2047 2048 2049 2050
1.0
2.0
1.5
5 year mean
OC
[m
g/m
3]
+30%
+10%