Climate Change Data and Risk Assessment Methodologies … · Climate Change Data and Risk...
65
Climate Change Data and Risk Assessment Methodologies for the Caribbean Hope Herron Bill Bohn Sujoy Roy Warren Evans IDB-TN-633 Environmental Safeguards Unit TECHNICAL NOTE Nº Revised March 2016
Transcript of Climate Change Data and Risk Assessment Methodologies … · Climate Change Data and Risk...
Climate Change Data and Risk
Assessment Methodologies for the
Caribbean
Hope Herron
Bill Bohn
Sujoy Roy
Warren EvansIDB-TN-633
Environmental
Safeguards Unit
TECHNICAL
NOTE Nº
Revised March 2016

Climate Change Data and Risk Assessment
Methodologies for the Caribbean
Hope Herron
Bill Bohn
Sujoy Roy
Warren Evans
Prepared by Tetra Tech, Inc.
Revised March 2016

Cataloging-in-Publication data provided by the
Inter-American Development Bank
Felipe Herrera Library
Climate change data and risk assessment methodologies for the Caribbean / Prepared
for Inter-American
Development Bank Environmental Safeguards Unit by Tetra Tech, Inc.
p. cm. — (IDB Technical Note ; 633)
Includes bibliographic references.
1. Climatic changes—Databases. 2. Climatic changes—Risk assessment—Caribbean
Area. I. Tetra Tech,
Inc. II. Inter-American Development Bank. Environmental Safeguards Unit. III. Series.
IDB-TN-633
JEL Classification: Q5; Q54
Keywords: Climate Change, Risk Assessment, Climate Assessment, Caribbean
Copyright © Inter-American Development Bank. This work is licensed under a Creative Commons IGO 3.0 Attribution-
NonCommercial-NoDerivatives (CC-IGO BY-NC-ND 3.0 IGO) license (http://creativecommons.org/licenses/by-nc-nd/3.0/igo/
legalcode) and may be reproduced with attribution to the IDB and for any non-commercial purpose. No derivative work is allowed.
Any dispute related to the use of the works of the IDB that cannot be settled amicably shall be submitted to arbitration pursuant to
the UNCITRAL rules. The use of the IDB's name for any purpose other than for attribution, and the use of IDB's logo shall be
subject to a separate written license agreement between the IDB and the user and is not authorized as part of this CC-IGO license.
Note that link provided above includes additional terms and conditions of the license.
The opinions expressed in this publication are those of the authors and do not necessarily reflect the views of the Inter-American
Development Bank, its Board of Directors, or the countries they represent.
http://www.iadb.org
2016

This paper was prepared with the guidance and direction of Hilary Hoagland-Grey, Lead Environmental
Protection Specialist, Inter-American Development Bank (IDB) Environmental Safeguards Unit (ESG). The
technical note was written by Tetra Tech, Inc., led by Hope Herron, with co-authors Bill Bohn, Dr. Sujoy
Roy and Dr. Warren Evans.

i
Table of Contents
TABLE OF CONTENTS1.0 Purpose and Approach........................................................................................... 1
2.0 Overarching Climate Change Risk Framework.................................................. 3
2.1 Existing Risk Assessment Methodologies ............................................................................................ 6
2.2 Proposed Climate Change Risk Assessment Methodology ............................................................ 8
2.3 Climate Change Risk Assessment in the IDB Project Cycle.........................................................11
3.0 Climate Change Risk Assessment Methodology (Steps 1‒3) and Toolsfor the Caribbean ................................................................................................. 13
3.1 Step 1: Screen the Project.....................................................................................................................13
3.2 Step 2: Define the Assessment Parameters ......................................................................................163.2.1 Overview of Climate Data and Tools for the Caribbean...........................................17
3.2.1.1 Background on Climate Projections......................................................................173.2.1.2 Temperature and Precipitation...............................................................................183.2.1.3 Sea Level Rise..............................................................................................................253.2.1.4 Hurricane Frequency and Intensity........................................................................283.2.1.5 Integrating Sea Level Rise and Storm Surge ........................................................303.2.1.6 Decision Making using Uncertain Climate Projections .....................................33
3.3 Step 3: Vulnerability and Risk Assessment ........................................................................................343.3.1 Background on Climate Change Vulnerability and Risk Assessment.......................34
3.3.2 Determining the Type of Assessment Needed.............................................................35
3.3.3 Step 3a: Basic Vulnerability Assessment .........................................................................373.3.3.1 Exposure ......................................................................................................................373.3.3.2 Sensitivity .....................................................................................................................403.3.3.3 Adaptive Capacity ......................................................................................................413.3.3.4 Understanding Basic Vulnerability Assessment Results ....................................42
3.3.4 Step 3b: Detailed Risk Assessment ..................................................................................42
3.3.4.1 Hazard Assessment ...................................................................................................433.3.4.2 Hydrologic Models (focused on estimated of flow volumes)..........................443.3.4.3 Hydraulic Models (focused on estimation of flood elevation) ........................443.3.4.4 Erosion Models...........................................................................................................453.3.4.5 Wave Height Models.................................................................................................453.3.4.6 Run-up Models............................................................................................................453.3.4.7 Consequence Assessment .......................................................................................46
4.0 Conclusions ........................................................................................................... 48
5.0 Recommendations for Next Steps ..................................................................... 50
6.0 References ............................................................................................................. 51
Annex 1: Tools and Resources ....................................................................................... 54
ii
Table of Contents
TABLES
Table 2.1 Climate Change Risk Assessment Methodology Steps .........................................................7
Table 3.1 Proposed Classification Filter for Climate Risk Project Screening .......................................15
Table 3.2 Proposed Ranking Criteria to Determine Type of Vulnerability Assessment Needed ............37
FIGURES
Figure 2-1. Illustrative climate risks to Caribbean nations.................................................................4
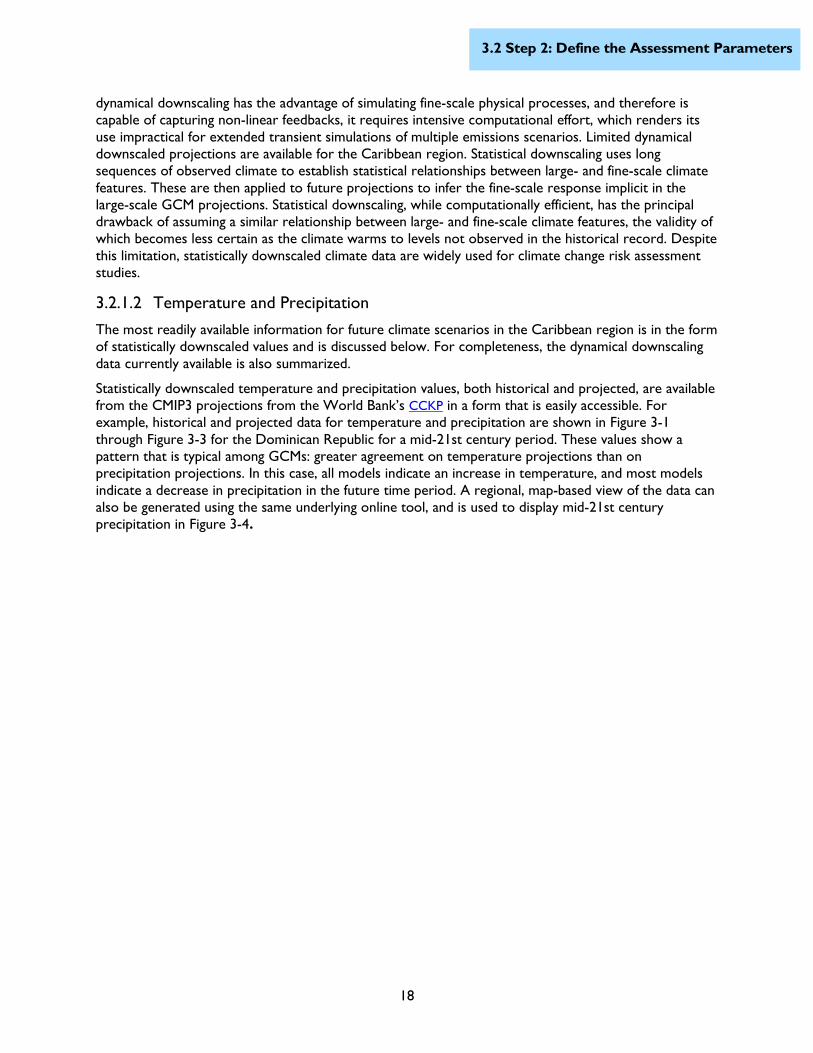
Figure 2-2. Climate and climate change risk assessment framework diagram. ...................................10Figure 3-1. Historical temperature and precipitation for the Dominican Republic from the World
Bank’s CCKP at <http://sdwebx.worldbank.org>..........................................................19
Figure 3-2. Projected mean temperature for the Dominican Republic for 2046‒2065 from theWorld Bank’s CCKP at <http://sdwebx.worldbank.org>. The plot on the right showsprojections for 9 different GCMs. ..............................................................................20
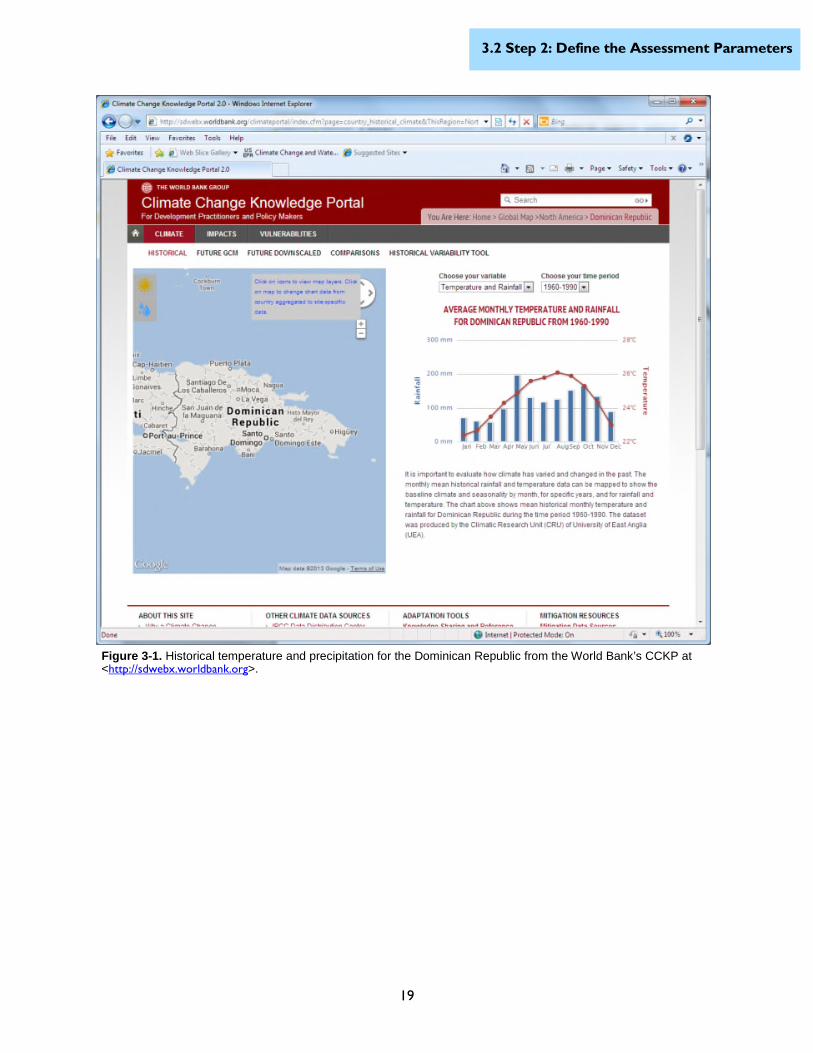
Figure 3-3. Projected mean precipitation for the Dominican Republic for 2046‒2065 from theWorld Bank’s CCKP at <http://sdwebx.worldbank.org>. The plot on the right showsprojections for 9 different GCMs. ..............................................................................21
Figure 3-4. Projected precipitation for the Caribbean region for 2046‒2065 using CMIP3 data anda mapping tool called ClimateWizard that has been customized for the World Bank’sCCKP at <http://sdwebx.worldbank.org>....................................................................22
Figure 3-5. Projected precipitation for the Caribbean region for the 20th and 21st century fromthe CMIP5 data. summary plot obtained from <http://www.worldclim.org>. ...................23
Figure 3-6. Projected changes in June, July, and August (JJA) precipitation through a GCM (left)and through an RCM (right). The lower panel is for dynamic downscaling for NorthAmerica (including parts of the Western Caribbean region) for the mid-21st century.These results are based on a specific pairing of a GCM and an RCM. The GCM used isCCSM, the RCM used is MM5I. (Source: http://www.narccap.ucar.edu/results/tmsl-results.html). Although the results do not match, both indicate a decrease inprecipitation in the portion of Caribbean that falls in the model domain. ........................24
Figure 3-7. Projected changes in precipitation through a Caribbean-specific RCM (PRECIS). ThisWeb interface can be used to develop maps for specific variables for different timeperiods, and can also be used to download numerical data. (Source:http://www.caribbeanclimate.bz/index.php?Itemid=88&option=com_wrapper&view=wrapper) ....................................................................................................................25
Figure 3-8. Active sea level gauges in the Caribbean, as reported by the PSMSL. The colors of thesymbols indicate the length of record, and most are 30 years or less. ............................26
Figure 3-9. Sea level (monthly and annual mean) for a gauge in Cristobal (Panama). This is one ofthe longest periods of record in the Caribbean region in the PSMSL database. ................27
Figure 3-10. Sea level rise from 1950 to 2100 based on a semi-empirical model (Vermeer andRahmstorf 2009) and three emission scenarios (A2, B1, and A1FI). AR4 refers toprojections made in the IPCC 2007 report. The increase seen over the historicalperiod is expected to accelerate significantly based on this model. .................................27
Figure 3-11. Projection of sea level rise from 2000 to 2100, along with upper and loweruncertainty bounds, based on an evaluation of the literature and alternative modelingmethods (National Academy of Sciences 2012). The models employed for thiscomposite projection are in addition to the Vermeer and Rahmstorf (2009)projections shown in Figure 3-10................................................................................28

iii
Table of Contents
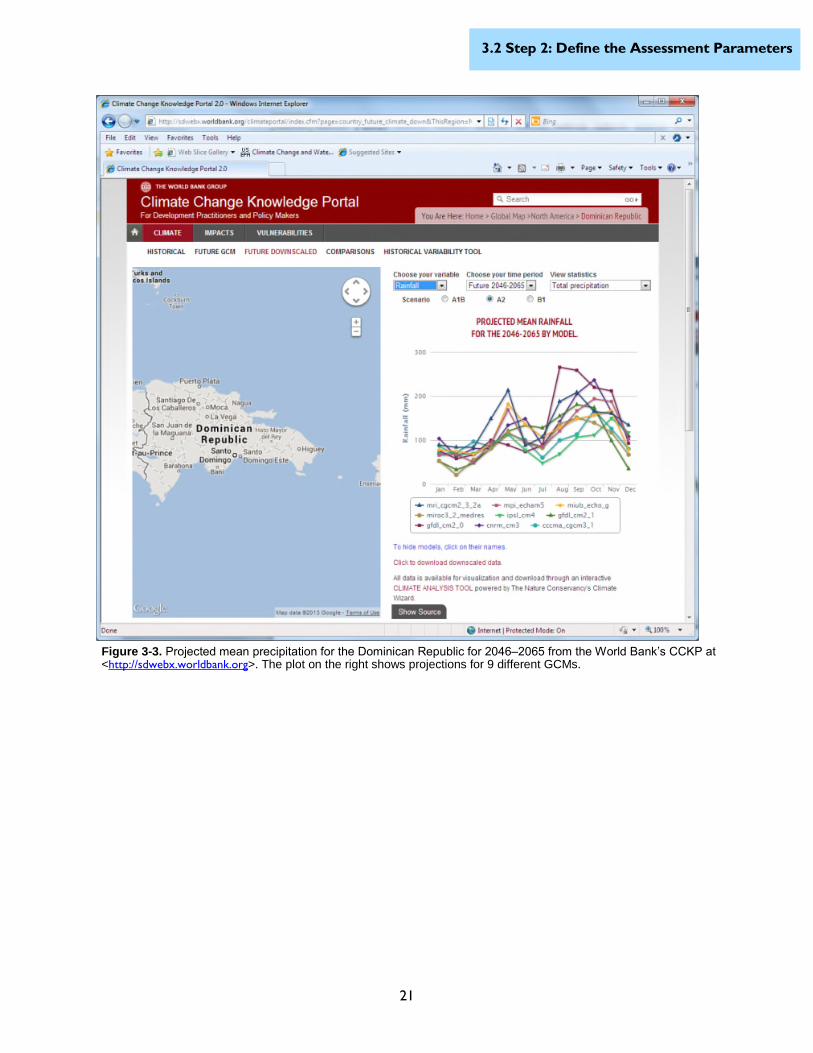
Figure 3-12. Hurricanes from 1851 to 2010, aggregated over 5 years in the Eastern and WesternCaribbean. (category 3‒5: purple; category 1‒2: red; tropical storms: blue).(Source: http://stormcarib.com/climatology/) ................................................................29
Figure 3-13. Modeled and observed hurricanes from 1980-2012. ...................................................29
Figure 3-14a. Storm surge computed by the TAOS model for the Dominican Republic ....................31
Figure 3-14b. Storm surge computed by the TAOS model for Jamaica (Source: CDMP project). ........32Figure 3-15. Inundated areas for Kingston, Jamaica, for conditions representing ~4 meters higher
water level than mean sea level (1.2-meter mean sea level rise due to climate change,and 2.5-meter storm surge, estimated using the TAOS model for this region).................33
Figure 3-16. Risk assessment methodologies (Source: Jones and Preston 2011).................................35
Figure 3-17. Vulnerability and risk assessment needs compared to methodologies (Source: NOAA2008).......................................................................................................................36
Figure 3-18. Risk assessment components....................................................................................42
Figure 3-19. Scenario-Based (Source: NOAA, 2008). .....................................................................43
Figure 3-20. Flood damage function.............................................................................................46
iv
Acronyms and Abbreviations
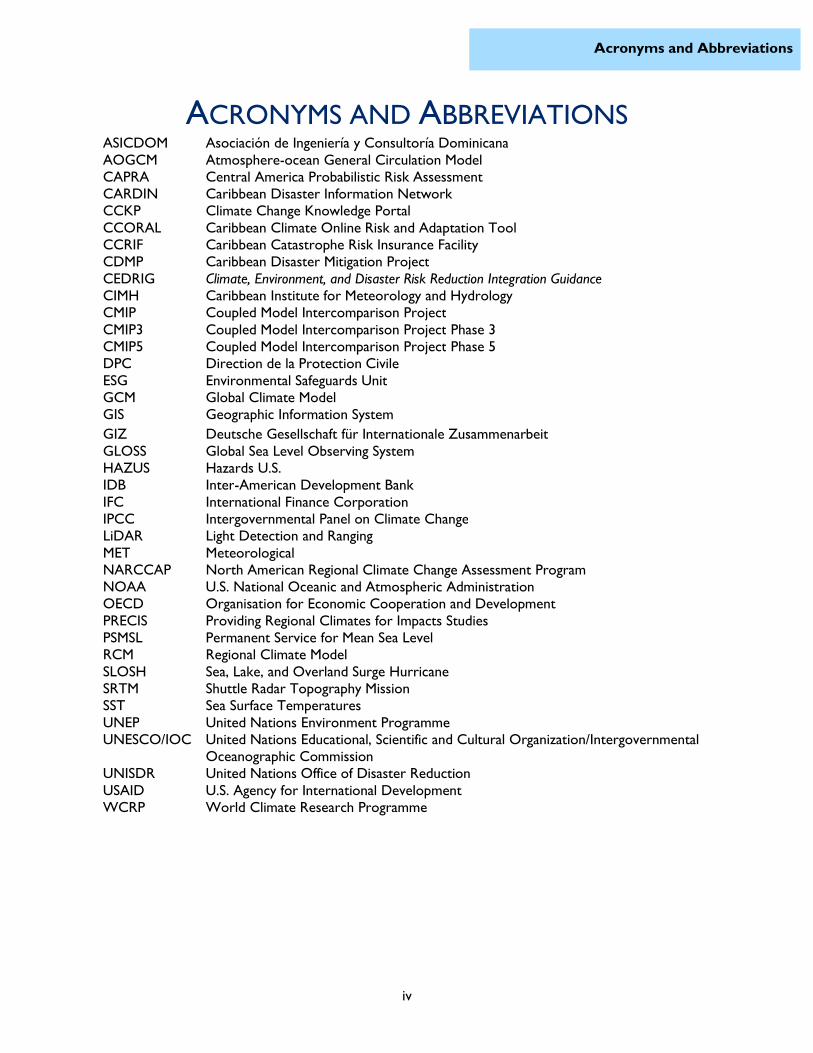
ACRONYMS AND ABBREVIATIONSASICDOM Asociación de Ingeniería y Consultoría DominicanaAOGCM Atmosphere-ocean General Circulation ModelCAPRACARDIN
Central America Probabilistic Risk AssessmentCaribbean Disaster Information Network
CCKP Climate Change Knowledge PortalCCORALCCRIF
Caribbean Climate Online Risk and Adaptation ToolCaribbean Catastrophe Risk Insurance Facility
CDMP Caribbean Disaster Mitigation ProjectCEDRIG Climate, Environment, and Disaster Risk Reduction Integration GuidanceCIMH Caribbean Institute for Meteorology and HydrologyCMIP Coupled Model Intercomparison ProjectCMIP3 Coupled Model Intercomparison Project Phase 3CMIP5 Coupled Model Intercomparison Project Phase 5DPC Direction de la Protection CivileESG Environmental Safeguards UnitGCM Global Climate ModelGIS Geographic Information System
GIZ Deutsche Gesellschaft für Internationale ZusammenarbeitGLOSSHAZUS
Global Sea Level Observing SystemHazards U.S.
IDB Inter-American Development BankIFC International Finance CorporationIPCC Intergovernmental Panel on Climate ChangeLiDAR Light Detection and RangingMET MeteorologicalNARCCAP North American Regional Climate Change Assessment ProgramNOAAOECD
U.S. National Oceanic and Atmospheric AdministrationOrganisation for Economic Cooperation and Development
PRECISPSMSL
Providing Regional Climates for Impacts StudiesPermanent Service for Mean Sea Level
RCM Regional Climate ModelSLOSH Sea, Lake, and Overland Surge HurricaneSRTM Shuttle Radar Topography MissionSST Sea Surface TemperaturesUNEP United Nations Environment ProgrammeUNESCO/IOC United Nations Educational, Scientific and Cultural Organization/Intergovernmental
Oceanographic CommissionUNISDR United Nations Office of Disaster ReductionUSAID U.S. Agency for International DevelopmentWCRP World Climate Research Programme

v
Key Concepts
KEY CONCEPTSThis Technical Note draws upon key concepts from both the climate change and disaster risk reductioncommunities of practice. As each community has developed distinct definitions related to riskassessment and risk management, it is prudent to define key concepts and specify the terminology thatwill be used here.
• Adaptive capacity: The ability of a system to adjust to climate change (including climatevariability and extremes) to moderate potential damages, to take advantage of opportunities, orto cope with the consequences (NRC, 2010).
• Climate variability: Variations in the mean state and other statistics (such as standarddeviations, statistics of extremes, etc.) of the climate on all temporal and spatial scales beyondthat of individual weather events (IPCC, 2007).
• Climate change: The United Nations Framework Convention on Climate Change(UNFCCC), in its Article 1, defines climate change as: ‘a change of climate which is attributeddirectly or indirectly to human activity that alters the composition of the global atmosphere andwhich is in addition to natural climate variability observed over comparable time periods’. TheUNFCCC thus makes a distinction between climate change attributable to human activitiesaltering the atmospheric composition, and climate variability attributable to natural causes. Seealso Climate change commitment, Detection and Attribution.
• Climate change risk management is used here as interchangeable with the definition ofadaptation, which is: “the process of adjustment to actual or expected climate and its effects.In human systems, adaptation seeks to moderate harm or exploit beneficial opportunities. Innatural systems, human intervention may facilitate adjustment to expected climate and itseffects” (IPCC, 2014).
• Disaster: the occurrence of an extreme hazard event that impacts vulnerable communitiescausing substantial damage, disruption and possible casualties, and leaving the affectedcommunities unable to function normally without outside assistance (Benson and Twigg, 2007).
• Disaster preparedness: Activities and measures taken in advance to ensure an effectiveresponse to the impact of hazards, including the issuance of timely and effective early warningsand the temporary evacuation of people and property from threatened locations (IDB, 2008).Contingency planning is part of disaster preparedness.
• Disaster risk management: The systematic process that integrates risk identification,prevention, mitigation and transfer, as well as disaster preparedness, emergency response andrehabilitation/reconstruction to lessen the impacts of hazards (IDB, 2008).
• Disaster risk reduction: The systematic development and application of policies, strategiesand practices to minimize vulnerabilities, hazards and the unfolding of disaster impactsthroughout a society, in the broad context of sustainable development (UN, 2004 in IDB, 2008).
• Exposure: The presence of people; livelihoods; environmental services and resources;infrastructure; or economic, social, or cultural assets in places that could be adversely affectedby climate change effects (IPCC, 2012).
• Financial protection: Ex ante activities to prepare financial mechanisms or instruments forrisk retention and transfer in order to have ex post access to timely economic resources, whichimproves the response capacity in the event of disasters.
vi
Key Concepts
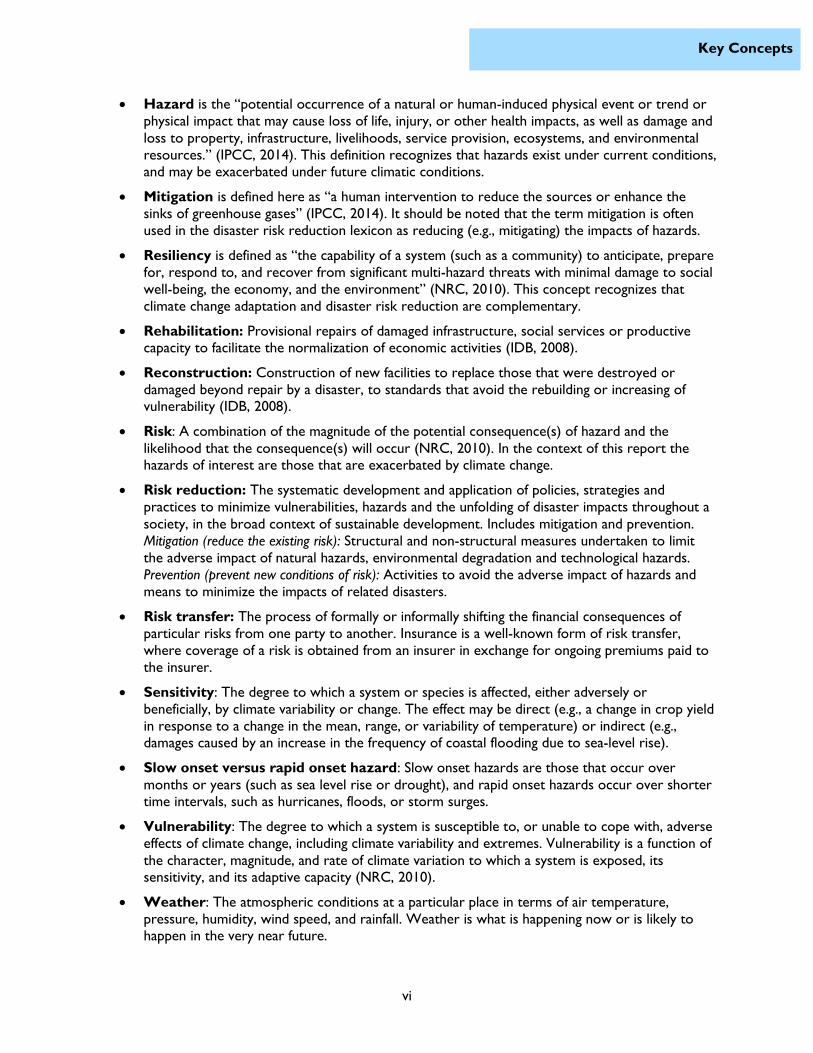
• Hazard is the “potential occurrence of a natural or human-induced physical event or trend orphysical impact that may cause loss of life, injury, or other health impacts, as well as damage andloss to property, infrastructure, livelihoods, service provision, ecosystems, and environmentalresources.” (IPCC, 2014). This definition recognizes that hazards exist under current conditions,and may be exacerbated under future climatic conditions.
• Mitigation is defined here as “a human intervention to reduce the sources or enhance thesinks of greenhouse gases” (IPCC, 2014). It should be noted that the term mitigation is oftenused in the disaster risk reduction lexicon as reducing (e.g., mitigating) the impacts of hazards.
• Resiliency is defined as “the capability of a system (such as a community) to anticipate, preparefor, respond to, and recover from significant multi-hazard threats with minimal damage to socialwell-being, the economy, and the environment” (NRC, 2010). This concept recognizes thatclimate change adaptation and disaster risk reduction are complementary.
• Rehabilitation: Provisional repairs of damaged infrastructure, social services or productivecapacity to facilitate the normalization of economic activities (IDB, 2008).
• Reconstruction: Construction of new facilities to replace those that were destroyed ordamaged beyond repair by a disaster, to standards that avoid the rebuilding or increasing ofvulnerability (IDB, 2008).
• Risk: A combination of the magnitude of the potential consequence(s) of hazard and thelikelihood that the consequence(s) will occur (NRC, 2010). In the context of this report thehazards of interest are those that are exacerbated by climate change.
• Risk reduction: The systematic development and application of policies, strategies andpractices to minimize vulnerabilities, hazards and the unfolding of disaster impacts throughout asociety, in the broad context of sustainable development. Includes mitigation and prevention.Mitigation (reduce the existing risk): Structural and non-structural measures undertaken to limitthe adverse impact of natural hazards, environmental degradation and technological hazards.Prevention (prevent new conditions of risk): Activities to avoid the adverse impact of hazards andmeans to minimize the impacts of related disasters.
• Risk transfer: The process of formally or informally shifting the financial consequences ofparticular risks from one party to another. Insurance is a well-known form of risk transfer,where coverage of a risk is obtained from an insurer in exchange for ongoing premiums paid tothe insurer.
• Sensitivity: The degree to which a system or species is affected, either adversely orbeneficially, by climate variability or change. The effect may be direct (e.g., a change in crop yieldin response to a change in the mean, range, or variability of temperature) or indirect (e.g.,damages caused by an increase in the frequency of coastal flooding due to sea-level rise).
• Slow onset versus rapid onset hazard: Slow onset hazards are those that occur overmonths or years (such as sea level rise or drought), and rapid onset hazards occur over shortertime intervals, such as hurricanes, floods, or storm surges.
• Vulnerability: The degree to which a system is susceptible to, or unable to cope with, adverseeffects of climate change, including climate variability and extremes. Vulnerability is a function ofthe character, magnitude, and rate of climate variation to which a system is exposed, itssensitivity, and its adaptive capacity (NRC, 2010).
• Weather: The atmospheric conditions at a particular place in terms of air temperature,pressure, humidity, wind speed, and rainfall. Weather is what is happening now or is likely tohappen in the very near future.

1
1.0 Purpose and Approach
1.0 Purpose and ApproachThe Inter-American Development Bank (IDB) Environmental Safeguards Unit (ESG) initiated this studyto address the need to better understand how to assess and address climate change related risks in IDB-funded projects. The Caribbean region is uniquely sensitive to natural hazards such as hurricanes,extreme precipitation events, and coastal storm surges due to the relatively small size and lowelevations of the island nations that make up the region. Climate change is expected to exacerbate thethreat of natural hazards. As a result of climate change, average temperatures and sea levels are rising,precipitation patterns might change, and hurricanes could intensify. Many of these changes are alreadyoccurring, and are projected to become more severe in the future.
Climate change risk is acknowledged within Directive A.6 of the Environmental and Social SafeguardCompliance Policy (OP-703, 2006) and its Implementation Guideline (2007a), as well as in PolicyGuidelines 1.7 and 1.8 of the Disaster Risk Management Safeguard and Policy (2007b) and itsImplementation Guideline (2008). Climate change could adversely affect the intended outcomes ofdevelopment operations, as well as impact the economic and financial rates of return of IDBinvestments. Effective disaster and climate change risk assessment is critical to guide IDB’s developmentfinancing and (1) to assist its borrowers in reducing risks from natural disasters and climate change and(2) to support the attainment of their social, environmental, and economic development goals.
The purpose of this paper is to: (1) propose a step-wise process to assess disaster and climate changerisks to IDB projects and (2) identify tools and methodologies to support the risk assessment processspecific to the Caribbean region.1 The pilot risk assessment process focuses on the direct and indirectrisks to projects from three climate-induced hazards: sea level rise, hurricanes (including storm surge),and flooding (both coastal and riverine) because these hazards are considered to pose the greatestthreat to the Caribbean region. Further consideration was given to the types of projects mostvulnerable to climate change risk, including infrastructure projects; projects that involve investments in,or rely substantially on, natural resources (such as water and agriculture); and projects that rely onother infrastructure (such as national transportation infrastructure for tourism).
Significant work has been undertaken in recent years to understand climate variability and change andrelated risks in the Caribbean, including that conducted under the Caribbean Community ClimateChange Centre and the IDB-World Bank Pilot Program for Climate Resilience in the Caribbean. Thispaper builds on these efforts by identifying and summarizing information that is most salient toevaluating site-specific climate risks. It is important to note that this paper relied on existing informationand did not involve field research.
This paper is organized into the following sections:
Section 2: Overarching Climate Change Risk Framework
Section 3: Climate Change Risk Assessment Methodology (Steps 1‒3) and Tools for theCaribbean
Section 4: Conclusions
Section 5: Recommendations for Next Steps
1 We are aware that it is very difficult— if not impossible in the short term —to differentiate between risks causedby climate variability and climate change. Thus, this document addresses both types of risks under the term“climate change risk” and emphasizes that risk assessment has to take into account the possible additional riskscaused by climate change.

2
1.0 Purpose and Approach
Section 6: References
Of note, the tools and resources identified in this paper are included along with their respectivehyperlinks in Annex 1. A fact sheet has also been developed that summarizes the combined disaster riskand climate change risk management screening process and recommended tools presented in thispaper. The objective of the fact sheet is to help project proponents better understand and conduct therecommended climate risk assessment. Given the vast amount of relevant information available on theInternet, to the extent feasible, links to other documents/data resources are provided as hyperlinks inthe electronic version of this file.
The intended audience of this paper is individuals who may need to develop disaster and climate changerisk assessments for specific public or private sector investments and those who need toevaluate/review such risk assessments performed in support of environmental impact documentation.

3
2.0 Overarching Climate Change RiskFramework
2.0 Overarching Climate Change RiskFramework
The Caribbean includes relatively small island nations that typically have low elevations and highpopulation densities located in the coastal zone. These factors make the Caribbean region particularlysusceptible to natural hazards, which are anticipated to pose a greater risk under future climatescenarios. The Caribbean is also characterized by its heavy dependence on tourism and agriculture; bothof these sectors are highly vulnerable to climate change risk. Underscoring this vulnerability, from 1975to 2002 natural disasters caused $3.2 billion in physical losses in the region—more than half the level ofannual loan commitments by the IDB (IDB 2004). However, the projected losses to the region underfuture climate change are anticipated to be much greater. Bueno et al. (2008) found that if no adaptationmeasures are implemented to mitigate climate risk, damages in the region could total $22 billion annuallyby 2050 and $46 billion by 2100.2
Climate change will thus exacerbate the current financial risks to IDB-funded projects in the Caribbean,with the potential to damage infrastructure and cause long- and short-term disruptions to supply chains,services (e.g., water supply), and markets. Impacts to natural resources, such as coral reefs and beaches,will adversely affect private sector investments in the tourism sector. Both directly and indirectly,climate impacts could adversely affect the financial, economic, environmental, and social performance ofcurrent and future IDB investments in the region.3 Figure 2-1 illustrates some of the primary climaterisks to Caribbean nations.
2 The study considered increased hurricane damages, loss of tourism revenue, and infrastructure damages on 24island nations in the Caribbean. Refer to <http://ase.tufts.edu/gdae/pubs/rp/caribbean-full-eng.pdf> for additionalinformation.3 For additional information related to climate science and projected climate change impacts, refer to the IPCCAssessment Reports: <http://www.ipcc.ch/publications_and_data/publications_and_data.shtml#.UwPAQ_ldWrg>,as well IDB Technical Notes developed on the topic (Iqbal and Suding, 2011; Simpson et al., 2011).

4
2.0 Overarching Climate Change RiskFramework
Fig
ure
2-1
.Ill
ustr
ativ
ecl
ima
teri
sks
toC
arib
bea
nna
tion
s.

5
2.0 Overarching Climate Change RiskFramework
Climate change can affect projects in many different ways. In the box below, a general impact chain ispresented using the disaster risk concept.4 In this view, two groups of climate change manifestations aredistinguished, those which affect rapid onset natural hazards and those which impact slow onsetnatural hazards.5
According to this, climate change may increase rapid onset disasters by greater climate variability, i.e.increase in the frequency and/or severity of natural hazards such as intense storms, heavy rainfall, longand deep drought periods etc. and the respective impacts. Climate change also may cause long termslow onset change in the project region such as changes in mean average, maximum and minimumtemperatures, and changes in precipitation amount, onset, duration, and geographic distribution. Thesechanges contribute to follow-on impacts such as sea level rise, changes in water availability and its timing,and changes in crop yields.
Depending on intensity of the change, exposure of project and area of influence and the vulnerability orresilience of the project, the area and the society, the impacts of the natural hazards may be extreme,significant, moderate or low. With respect to the objects of the impact, a distinction is made betweenthe project itself (scenario type 1) and the environing systems (scenario type 2). In the text box belowfurther sub- distinctions of the scenarios in the impact chain are made and examples given.
4 IDB’s Disaster Risk Management Policy (OP 704) has been adopted as the framework for incorporating climatechange risks in the project cycle. A rather wide definitions of hazards is used including slow onset changes.
5 In an IDB options paper from 2011(Iqbal and Suding 2011), these groups are called Category A and Category Bclimate change manifestations, available at:http://idbdocs.iadb.org/wsdocs/getdocument.aspx?docnum=37671112>. In IDB, this classification has beendeveloped further in the course of incorporating climate change risk with disaster risk assessment andmanagement in the project cycle.
Climate Change
Affects rapid onset natural hazards and slow onset natural hazards
Depending on exposure of project and area of influence
and vulnerability / Resilience of project, area and society
Disaster Risks are high, moderate or lowfor project itself (scenario Type 1) and/or
for human life, property, environment (scenario Type 2)
Disaster and Climate Change Risk Managementreduces exposure, mitigates vulnerability and/or makes provisions in order to
achieve an acceptable level of risk.
From: IDB draft guidance notes

6
2.1 Existing Risk Assessment Methodologies
2.1 Existing Risk Assessment Methodologies
This section identifies key risk assessment methodologies that have been developed at the internationaland regional level to provide a general climate risk framework. This list is not meant to be exhaustive;rather, it reflects the most relevant and internationally respected guidance documents developed todate. This paper discusses the following key guidance documents:
• Caribbean Risk Management Guidelines for Climate Change Adaptation Decision Making (CaribbeanCommunity Secretariat 2008)
• Shaping Climate-Resilient Development: A Framework for Decision-making (Economics and ClimateAdaptation Working Group 2009)
• Climate Risk and Business (IFC 2010)
Integrated Classification of Disaster and Climate Change Risks to IDB DevelopmentProjects
Type 1 Disaster Risk Scenario: The project itself could be adversely impacted by natural hazards.This may occur in two forms:
1. Direct impact of a hazard on assets and operations, including damage and destruction of assets,and modification or shutdown of operations, e.g., developments located in coastal zones of theCaribbean are likely to be affected by hurricanes, tropical storms and coastal flooding due to stormsurges;
2. Direct impact of a hazard on area of influence, from where resources for the project originatewith economic repercussions on project; e.g., an irrigation system that relies on water runoff fromglaciers that are shrinking, or an agricultural processing project that relies on produce from a regionwhere suppliers are switching to other crops that are more suited to changing climatic conditions.
Type 2 Disaster Risk Scenario: The operation has a potential to exacerbate hazard risk to humanlife, property, the environment or the operation itself. This may occur in two ways:
1. The natural hazard poses risks through the project for people and the environment in the area ofinfluence (knock-on effects from damages or changes in operation in the project). Examples include:damage to a dam results in its failure to retain water mass; spillways of hydropower projects are notsufficient to regulate the water flow in case of extreme hydrological events and could increase risks ofoverflow and downstream flooding; a damaged pipeline or storage tank leaks toxic substance into theenvironment; a loose part of a damaged structure in motion (on slope or in the sea) destroys adjacentstructures; etc.
2. The project reduces resilience to natural hazards of people and the environment in the area ofinfluence: construction, implementation and operation activities of a project may increase thevulnerability. Examples include: removal of vegetation by a project in mountainous terrain couldweaken the soil stability and initiate a landslide in heavy precipitation events or could exacerbateerosion, leading to flooding; removal of vegetation or earth for a coastal project may exacerbatecoastal erosion, which reduces the resilience of the coast and its infrastructure against storm surges;obstruction of floodplains by project works could lead to blockage of drainage flows and diversion offloods, exacerbating the impact of inland floods.
From: IDB Safeguards Policy Filter (project screening tool)

7
2.1 Existing Risk Assessment Methodologies
• Climate Proofing for Development: Adapting to Climate Change, Reducing Risk (Deutsche Gesellschaftfür Internationale Zusammenarbeit [GIZ] 2011)
• Climate, Environment, and Disaster Risk Reduction Integration Guidance (Swiss Agency forDevelopment and Cooperation 2010)
Although it is anticipated that the World Bank and IDB Pilot Program for Climate Resilience in theCaribbean will also yield valuable lessons learned regarding risk assessment methodology, the programhas only recently begun; therefore, limited data on results are available.
Each of the guidance documents listed above identifies a framework for evaluating climate change riskthat includes several steps and guiding principles. The specific steps identified in each guidance documentare identified in Table 2.1. The variance reflects the different levels of analysis (e.g., institutional, national,local) and interventions (e.g., development aid, national adaptation planning, private sector investment)that the individual guidance document was developed to target. Table 2.1 identifies the target audiencefor the guidance documents.
Table 2.1 Climate Change Risk Assessment Methodology Steps
Summary of Climate Change Risk Assessment Methodology Audience and Steps
Caribbean RiskManagementGuidelines
Shaping ClimateResilient
DevelopmentClimate Risk and
BusinessClimate Proofingfor Development
Climate, Environment,and Disaster Risk
Reduction IntegrationGuidance
TargetAudience
Decision Makers inCaribbean Region
Development Banks Private Sector Development Banks Development Banks
Step Identified in Subject Document
Step 1 Get StartedComprehensiveApproach andObjective
Identify Problem/Objectives
Prepare Assess Risks
Step 2Analyze the ClimateVariability or ClimateChange Hazard
Prioritize Hazardsand Locations
Establish Decision-making Criteria
AnalyzeIdentify Adaptation andRisk Reduction Options
Step 3 Estimate the RiskRecognizeUncertainty ofClimate Change
Assess RiskIdentify Options forAction
Select Adaptation andRisk Reduction Options
Step 4 Evaluate the RiskIdentify Cost-Effective PriorityMeasures
Identify Options IntegrateDefine Monitoring andEvaluation Indicators
Step 5Adapt, Control Riskand Financing
Focus on AddressingDevelopmentBottlenecks
Appraise Options Prepare
Step 6Implement andMonitor
Encourage Fundingfrom InternationalCommunity
Make Decision Analyze
Step 7MobilizeStakeholders
ImplementDecision
Step 8 Monitor
Note: Not all methodologies have the same number of steps. For example, the Climate, Environment, and Disaster Risk Reduction IntegrationGuidance (CEDRIG) identifies 4 steps; thus, cells 5‒8 are blank. See text above identifying the organizations that have prepared these risk assessment documents.
It is useful to consider the different climate risk methodologies and audiences of the available guidancedocuments to develop a targeted step-wise methodology that will be specific to the IDB private sectorportfolio in the Caribbean. In general, each of the methodologies recommend the following steps: (1)undergo an initial screening to identify climate risk and define parameters, (2) conduct a risk assessment,(3) identify and implement adaptation options, and (4) monitor and evaluate the results. The importance

8
2.2 Proposed Climate Change RiskAssessment Methodology
of stakeholder engagement to better understand site-specific concerns and more effectively identify andimplement adaptation options is also identified as a cross-cutting issue.
The International Finance Corporation’s (IFC’s) Climate Risk and Business methodology is the mostrelevant guidance for this paper, given the multilateral and private sector focus. In the compendiumdocuments, the IFC methodology is further tailored to sector-specific climate risk assessments; forexample, it considers the project’s exposure, sensitivity, and adaptive capacity as part of the vulnerabilityassessment. (IFC’s pilot projects will be further discussed in later sections.) With the exception of theIFC pilot studies, an overarching finding of this literature review is that available methodologies are verygeneral and lack guidance on the specific steps, models, and tools that are needed to conduct a project-specific risk assessment. IFC has an ongoing program to prepare sector-specific guidance; however, thisguidance will not be completed until late 2014.
2.2 Proposed Climate Change Risk Assessment Methodology
Based on an evaluation of existing work, and an understanding of IDB’s current needs and policies, thefollowing climate risk assessment methodology steps have been developed for use by IDB clients;expected to provide the most robust, yet flexible framework for assessing climate change risk:
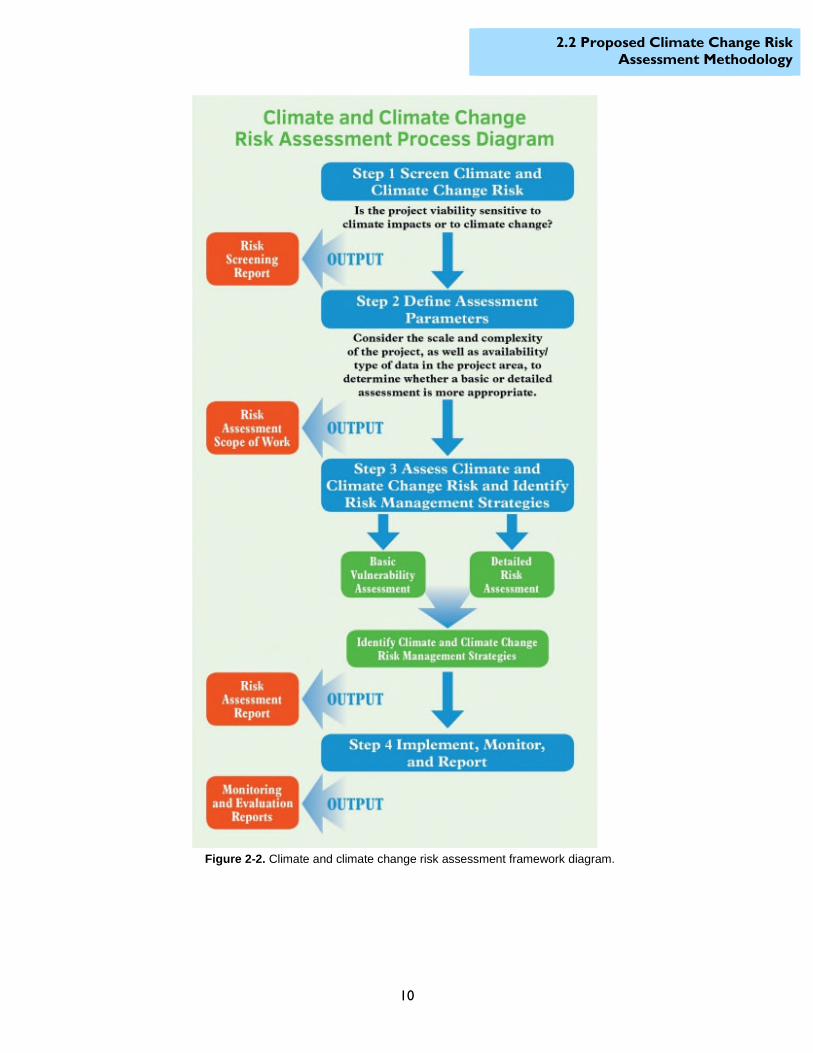
• Step 1: Screen for climate and climate change risk. Review the project to determine whetherfurther climate change related analysis is necessary.6
• Step 2: Define the assessment parameters. This includes defining the site and planning horizonsand identifying and gathering relevant data to better understand what type of vulnerabilityassessment will be conducted.
• Step 3: Assess climate and climate change risk and identify risk management strategies. Conducta basic vulnerability or detailed risk assessment to identify how susceptible the project is toclimate and climate change hazards (such as sea level rise, hurricanes, flooding, and drought).Identify strategies to address identified risks, vulnerabilities, or impacts.
• Step 4: Implement, monitor, report. Implement climate and climate change risk managementstrategies. Evaluate the effectiveness and efficiency of the measures implemented (on the groundex post evaluation7 and comparison with the ex ante evaluation8 done in step 3)
The approach is structured as a tiered process with the flexibility to stop after project screening (Step1) or determine if a basic vulnerability assessment or more complex risk assessment is necessary for theproposed project (Step 3).
As IDB has integrated climate change risk assessment in the disaster risk management procedures forprojects proposed for IDB financing, the present framework has been developed so that the findings ofthe risk assessment can be directly incorporated into documents required by the Bank as part of itsproject appraisal.
While the climate change risk management guidance included in this document can be consideredgenerally applicable to addressing climate change risk; the guidance has been developed specifically to
6 Please note that this screening is different from the IDB project Environmental and Social Safeguard Screeningcompleted by IDB project teams during the early appraisal of projects proposed for IDB financing.7 The ex post evaluation of operations at the Bank aims to assess the extent to which the development objectivesof IDB-financed operations have been attained. The ex post evaluation of operations also aims to assess theefficiency with which those objectives have been attained. It is called an ex post evaluation since the purpose is toevaluate the results of an operation, particularly in terms of its outcomes and/or impact, after it has beencompleted. For more refer here: <http://www.iadb.org/en/about-us/evaluation-of-idb-operational-objectives,6242.html>8 The ex ante evaluation is conducted pre-intervention and describes the situation prior to an intervention, againstwhich progress can be assessed or comparisons made. Baseline data are collected before a program or policy isimplemented to assess the “before” state.

9
2.2 Proposed Climate Change RiskAssessment Methodology
inform Steps 1 through 3, but stops short of providing guidance on risk management strategies. Aseparate Technical Note, Addressing Climate Change within Disaster Risk Management: A Practical Guide forIDB Project Preparation,9 identifies climate change risk management options that can be incorporated intoIDB investments. The primary purpose of this Technical Note is to help identify climate change riskmanagement measures to minimize the risk posed by climate change to IDB investments.
9Technical Note No. IDB-TN-806, Addressing Climate Change within Disaster Risk Management: A Practical Guidefor IDB Project Preparation, is available here: https://publications.iadb.org/handle/11319/6910?locale-attribute=en.
10
2.2 Proposed Climate Change RiskAssessment Methodology
Figure 2-2. Climate and climate change risk assessment framework diagram.
11
2.3 Climate Change Risk Assessment in theIDB Project Cycle
2.3 Climate Change Risk Assessment in the IDB Project Cycle
Climate-related risks to IDB-financed projects should be addressed per the Environmental and SocialSafeguards Compliance Policy (Directives A.3, A.6, and B.4) and the Disaster Risk ManagementSafeguard and Policy (Guidelines 1.7 and 1.8 and Directive A-2).
The proposed climate change risk assessment methodology is intended for use by the IDB and theirborrowers to help assess and reduce climate-related risks to acceptable levels. The project proponentswill conduct the climate change risk assessment in the framework of the disaster risk assessment tomeet the borrowing requirements.
As envisioned in this paper, the climate change risk assessment will be implemented in the projectpreparation stage, and the findings carried throughout the IDB project cycle phases and compliancerequirements. This approach is supported through the Organization for Economic Cooperation andDevelopment (OECD, 2009) recommendations of using a “climate lens” as a comprehensive frameworkfor mainstreaming adaptation into policy and planning processes, whereby analysis of climate changerisks and interventions are mainstreamed throughout the life of the project or program.10
Since IDB has adopted the integration of climate change risk assessment in the disaster risk managementprocedures, the present methodology has been developed so that it could be directly incorporated intoboth the Environmental and Social Safeguards Compliance Policy requirements (OP-703) and DisasterRisk Management Policy (OP 7-4) requirements. For example, the climate change risk assessment couldbe inserted directly as a section in a Disaster Risk Management Plan or included as an appendix to anEnvironmental Impact Assessment, and referred to in the Disaster (and Climate Change) RiskManagement Summary. IDB asks the borrowers of projects which show high or moderate disaster risksto prepare a disaster (and climate change) risk management summary. The content of this summary ispresented in the text box below. The specific climate change risks will be addressed in section 3 of thissummary.
The distinction between impacts on the projects (type 1 scenario) and the human life, property andenvironment around it (type 2 scenario) made in section 2.0 is important, since it allocates theresponsibilities in the further project risk management process. Whereas the risks for the project itselfis a matter particularly important for credit risk management, the risk for human life, property, andenvironment is rather a matter of the environmental and social safeguards process.
10 A climate lens is further defined as “an analytical tool to examine a strategy, policy, plan, programme orregulation. The application of such a climate lens at the national or sectoral level involves examining: (i) the extentto which a measure – be it a strategy, policy, plan or programme – under consideration could be vulnerable to risksarising from climate variability and change; (ii) the extent to which climate change risks have been taken intoconsideration in the course of the formulation of this measure; (iii) the extent to which it could increasevulnerability, leading to maladaptation or, conversely, miss important opportunities arising from climate change;and (iv) for pre-existing strategies, policies, plans and programmes which are being revised, what amendmentsmight be warranted in order to address climate risks and opportunities.” The full document is available at<http://www.oecd.org/dac/43652123.pdf>.

12
2.3 Climate Change Risk Assessment in theIDB Project Cycle
Stakeholder involvement is considered cross-cutting across the project cycle. It is thereforerecommended that climate change issues be incorporated in all stakeholder engagement activities perOP-703 of the Environment and Safeguards Compliance Policy.
Outline of Disaster Risk Assessment Summary
1. Summary of initial disaster risk profile of project; identification of pertaining (high ormoderate) natural hazards; exclusion of low risk hazards
2. Disaster Risk Assessment (DRA) for relevant rapid onset hazards (conventional analysis,without considering climate change;
2.1. Specification of rapid onset natural hazards (type, intensity, frequency) for the particularproject area (exposure);
2.2. Potential impact of event (at likely recurrence level) on project and area of influenceduring implementation and operation of project (scenario type 1), including exacerbatedimpacts when project is implemented and operating, on human life and integrity,property, social systems and environment (scenario type 2) for given vulnerability levelsand coping capacities;
2.3. Risk reduction options for identified project risks, using industry standards and standardmethodology (without considering potential additional impacts exerted climate change),alternatives;
3. Revision of Disaster Risk Assessment, addressing Climate Change
3.1. Modification of hazards, vulnerability and potential impacts by climate change (mainly forhydro-meteorological events)3.1.1. Frequency and intensity of rapid onset hazards modified by Climate Change,3.1.2. New Climate Change related risks; slow onset hazards and shifting of averages
/patterns:3.2. Risk reduction options that also deal with additional risks posed by climate change;
decision making under (compounded) uncertainty (probability given by historical trends;additional uncertainty from anticipated climate change); project design at an acceptablelevel of natural hazard risks
4. Disaster Risk Management Plan
4.1. Disaster risk reduction (siting, investment choice, engineering)4.2. Disaster risk preparedness (e.g., contingency planning) and response4.3. Financial protection (transfer, retention)
From: IDB draft guidance note
13
3.0 Climate Change Risk AssessmentMethodology (Steps 1‒3) and Tools for the
Caribbean
3.0 Climate Change Risk AssessmentMethodology (Steps 1‒3) and Tools forthe Caribbean
This section will focus on steps 1 to 3 of the proposed methodology and will identify the state of knowledgespecific to the Caribbean as well as the tools and data sets available for performing these steps.11
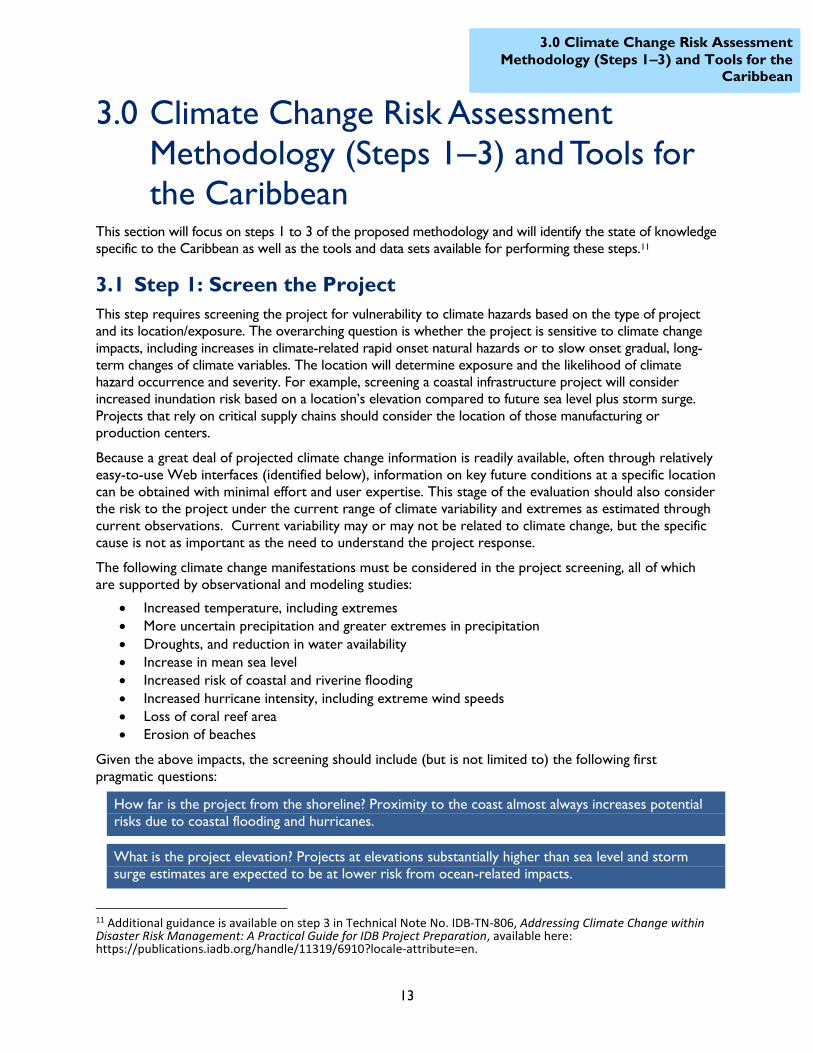
3.1 Step 1: Screen the Project
This step requires screening the project for vulnerability to climate hazards based on the type of projectand its location/exposure. The overarching question is whether the project is sensitive to climate changeimpacts, including increases in climate-related rapid onset natural hazards or to slow onset gradual, long-term changes of climate variables. The location will determine exposure and the likelihood of climatehazard occurrence and severity. For example, screening a coastal infrastructure project will considerincreased inundation risk based on a location’s elevation compared to future sea level plus storm surge.Projects that rely on critical supply chains should consider the location of those manufacturing orproduction centers.
Because a great deal of projected climate change information is readily available, often through relativelyeasy-to-use Web interfaces (identified below), information on key future conditions at a specific locationcan be obtained with minimal effort and user expertise. This stage of the evaluation should also considerthe risk to the project under the current range of climate variability and extremes as estimated throughcurrent observations. Current variability may or may not be related to climate change, but the specificcause is not as important as the need to understand the project response.
The following climate change manifestations must be considered in the project screening, all of whichare supported by observational and modeling studies:
• Increased temperature, including extremes• More uncertain precipitation and greater extremes in precipitation• Droughts, and reduction in water availability• Increase in mean sea level• Increased risk of coastal and riverine flooding• Increased hurricane intensity, including extreme wind speeds• Loss of coral reef area• Erosion of beaches
Given the above impacts, the screening should include (but is not limited to) the following firstpragmatic questions:
How far is the project from the shoreline? Proximity to the coast almost always increases potentialrisks due to coastal flooding and hurricanes.
What is the project elevation? Projects at elevations substantially higher than sea level and stormsurge estimates are expected to be at lower risk from ocean-related impacts.
11 Additional guidance is available on step 3 in Technical Note No. IDB-TN-806, Addressing Climate Change withinDisaster Risk Management: A Practical Guide for IDB Project Preparation, available here:https://publications.iadb.org/handle/11319/6910?locale-attribute=en.

14
3.1 Step 1: Screen the Project
How far is the project from an inland water body? Inland water bodies can be subject to floodingfrom extreme precipitation events, and proximity to streams might be a potential risk.
How much fresh water will the project need to operate? Water resources are expected to becomemore constrained and dependence on large water withdrawals is a potential risk.
What natural resources does the project’s success depend on (beaches, coral reefs, agriculturalproducts)? Natural resources (including agricultural resources) can be an indirect component of aproject’s success, and adverse impacts to these resources might affect the success of the relatedproject.
Where are critical supply chain locations? Projects could depend on products or services in other partsof the country or region. Understanding the potential exposure of the supply chain to climate impacts isalso important. Answering the questions above for all critical supply chain locations and associatedactivities will help determine exposure to climate impacts.
Climate change impacts, such as changes in precipitation or increased intensity of hurricanes, couldimpact a project’s integrity and result in negative effects to the surrounding environment orcommunity. For example, increased hurricane intensity could lead to increased storm surge to an oilpipeline project or other coastal infrastructure. If the storm surge is higher than the pipeline wasdesigned to withstand, the pipeline could fail, causing a spill which could in turn affect localcommunities and ecosystems.
These questions do not have simple answers, but the assumptions that are used to justify a project mustbe evaluated in light of the climate change impacts identified above. If the assumptions appearquestionable, then a more detailed assessment with more local, on-the-ground information and moredetailed modeling might be warranted. A detailed assessment almost always requires resources greaterthan those required for a rapid assessment (often an order of magnitude or more). The projectscreening, therefore, is a good first step before conducting a more detailed analysis.
There are several Web-based tools that could assist with the project screening, including the following:
• The Caribbean Climate Online Risk and Adaptation TooL (CCORAL) is an online, open-sourcetool that guides users through several steps, helping them identify whether climate change islikely to influence their activity.
• The World Bank’s Climate Change Knowledge Portal (CCKP) is an online tool for access toglobal, regional, and country-level data related to climate change and development. The WorldBank’s CCKP includes environmental, disaster risk, and socio-economic data sets. (The portalwill be described in further detail in the next sections.)
• The effects of climate change on the coast of Latin America and the Caribbean project database isa geographic information system (GIS)-based database that contains information on coastaldynamics in Latin America and the Caribbean, climate variability, coastal vulnerability andexposure to climate change, the impact of climate change in the area, and an estimation ofpredictable risks in the future.
A proposed classification filter for the project screening step is included below, with potential impactsidentified as low, moderate, or high risks (Table 3.1).

15
3.1 Step 1: Screen the Project
Table 3.1 Proposed Classification Filter for Climate Risk Project Screening
Proposed Classification Filter
Proposed ProjectScreening Questions Additional Considerations Illustrative Classification
How far is the projectfrom the shoreline?
• Identify/assess current coastal floodplain.• Identify/assess projected future floodplain.• Identify/assess potential impacts from
coastal flooding (includes risk from sea levelrise, coastal erosion, and storm surge) andanticipated time horizon.
High risk: Project is in the current coastal floodplain(or < 3 miles from shore with minimal elevation).Moderate risk: Project will be in the future floodplainin the near-term (20 years) (or < 5 miles from shorewith minimal elevation).Low risk: Project is not in the coastal floodplain orfuture floodplain (or is located > 5 miles from shore,or elevated from flood risk).
What is the projectelevation?
How far is the projectfrom an inland waterbody?
• Identify/assess current riverine floodplain.• Identify/assess projected future floodplain.• Identify/assess potential impacts from
riverine flooding (includes risk from sea levelrise, coastal erosion, and storm surge) andanticipated time horizon.
High risk: Project is in the current riverine floodplain(or < 1 mile from bank with minimal elevation).Moderate risk: Project will be in the future floodplainin the near-term (20 years) (or < 2 miles from shorewith minimal elevation).Low risk: Project is not in the riverine floodplain orfuture floodplain (or is located > 2 miles from shore).
How much fresh waterwill the project need tooperate?
• Identify/assess all fresh water requirementsfor the project, including any seasonalvariability.
• Identify/assess available fresh watersupplies, including any seasonal variabilityand emergency water agreements/supplies.
• If relying on municipal or shared resources,or both, consider projected water demand.
• If relying on aquifers, consider distance fromthe shoreline and potential for salineintrusion.
High risk: Current or projected water availability isinsufficient for project operations or a short-term,temporary disruption of water resources would bedetrimental to operations.Moderate risk: Project relies on aquifer that is at-riskfor salinization; or a shared water resource that hashigh water demand relative to supply; or a short-term,temporary disruption of water resources wouldimpact operations.Low risk: Project has adequate water supply and isnot exposed to short-term disruptions.
What natural resourcesdoes the project’ssuccess depend on?
• Identify/assess all natural resourcerequirements for the project, including anyseasonal variability.
High risk: Critical natural resource for projectoperations is at major risk of impact.Moderate risk: Natural resource that supportsproject operations (but is not considered critical) is atrisk of impact.Low risk: The project does not rely on naturalresources, or it has redundant systems in place.
Where are critical supplychain locations?
• Identify/assess all critical supply chainlocations, including location andvulnerability, as well as alternativetransportation routes should one route beimpacted.
High risk: Supply chains are in at-risk areas or ashort-term, temporary disruption would bedetrimental to operations.Moderate risk: Supply chains are in moderately at-risk areas or a short-term, temporary disruptionwould impact operations.Low risk: The project does not rely on supply chains,or it has redundant systems in place.
Could climate risks to theproject result insignificant negativeimpacts to thesurrounding environmentor community?
• Identify/assess whether climate-inducedhazards could cause project failures thatwould harm the surrounding environmentand community.
• Identify/assess vulnerability of thesurrounding environment. Are there at-riskendangered species or protected areas?
• Identify/assess vulnerability of thesurrounding community. Are there at-riskvulnerable populations?
High risk: Potential for significant impact asdesigned, and moderate to high likelihood of climaterisk.Moderate risk: Potential for impact as designed, butlow likelihood of climate risk.Low risk: The project would not harm or exacerbatethe risk to the surrounding environment orcommunity.
Are there other climate-related concerns notaddressed through theabove questions?
• Based on local/site specific informationexplore whether other considerations areimportant.
Classify risk as for the questions above.
The goal of the project screening is that the project’s vulnerability to the climate change impacts isconsidered alongside other hazards and considerations already assessed in the Environmental and SocialSafeguard Screening process. Thus, considered alongside the Disaster Risk Management Policy OP-704,the following two questions should be answered in the screening process:

16
3.2 Step 2: Define the Assessment Parameters
• Whether there is a natural hazard risk that will be exacerbated by climate change that mighthave a consequential impact on human life, property, and environment.
• Whether the project could exacerbate disaster risk for human life, property, and environmentby increasing vulnerability to the climate risk in the area of impact, even if the project itselfmight not be affected.
If the answer to one or both of the above questions is yes, and a high level of risk is identified for one ormore of the classification filter questions, then the project proponent should move to the next step ofthe climate and climate change risk assessment process.12 If the project is screened as a low climate risk,the project proponent can stop at this stage. It is recommended that screening be conducted as a“project-centric” process, as opposed to a “prescriptive” process, so that there is flexibility to assessclimate change risk according to the unique project attributes.
3.2 Step 2: Define the Assessment Parameters
Once a project is determined to require further evaluation, the parameters of the climate change riskassessment must be defined. The key steps associated with this step include the following:
1) Identify location or region of interest, and planning horizon for climate change impact evaluation.
2) Based on the project screening, identify the climate change risks that warrant further evaluation.
3) Determine what climate-relevant data is available to support further evaluation of the climate
risk in the geographic area of interest. This could include:
a. Temperature data and metrics (e.g., maximum temperature, average temperature, etc.).
b. Precipitation data and associated metrics (e.g., annual precipitation, precipitation during
a growing season, highest precipitation over a specified period, etc.).
c. Upper and lower bounds of sea level rise using recent estimates.
d. Change in hurricane frequency and intensity.
e. Storm surge estimates, which can be combined with the sea level rise estimates for a
point in time and land elevation to estimate areas that are subject to inundation during
storms and hurricanes under future sea level conditions.
The geographic boundaries for the assessment should include locations of all project-relatedinfrastructure. This includes consideration of the project’s physical infrastructure as well as the locationsof critical support infrastructure (e.g., airports, ports, wastewater utilities) and associated naturalresources (e.g., water supplies, beaches, agricultural production) identified in the screening process. Todetermine the time horizon of the climate change risk assessment, the life cycle of both the investmentand infrastructure should be considered.
The screening process should identify the priority hazards that pose risk to the project. In this step, thekey types of data related to the climate hazard and available for the project-specific location(s) should beidentified. There is a great deal of projected climate data available in the Caribbean region because theseare often produced through global climate models. However, there is also a need for local, measureddata on various climatic and sea level features that provide an understanding of the range and variabilityof these drivers. These measured data are less commonly available in the Caribbean or are not in thepublic domain. Examples of these variables include daily precipitation and wave heights.
12 The study team recommends that the IDB further define the project screening questions and that thresholdconsiderations for whether a project proponent should proceed to the next step in the climate change riskassessment are identified.

17
3.2 Step 2: Define the Assessment Parameters
A climate risk assessment can be limited by the availability of data relevant to the location of interestand planning horizon. Identifying what data is available will inform the level of analysis that can beconducted. For example, extreme precipitation may be a factor affecting riverine flooding. Althoughclimate change is expected to increase the intensity of extreme precipitation events (IPCC, 2013), localdata are needed to perform a quantitative assessment of the potential flooding under current or moreextreme conditions.
A full discussion of the available data sets for the Caribbean and how to access that data is includedbelow to help facilitate the climate risk assessment process.
3.2.1 Overview of Climate Data and Tools for the Caribbean
The goal of this section is to provide the reader with sources of information that can be used toperform a climate change risk assessment. Following a brief background on climate change projectionmodeling, climate-related data collection—for historical and current conditions as well as futureprojections—is demonstrated at various locations in the Caribbean where the IDB might have a fundingrole. The data compilation is presented in a general manner, and is not focused on a specific region ortype of project. The description of pertinent climate data is divided into three categories: (1)temperature and precipitation changes, (2) sea level rise, and (3) incidence of hurricanes and tropicalstorms. Also of interest are geographical data on elevation and socioeconomic features that helpcharacterize impacts in specific regions. For completeness, these sources of data are also presented. Thesections that follow provide sample results, and where appropriate, screenshots of websites thatillustrate how a user can obtain similar data for other locations.
3.2.1.1 Background on Climate Projections
A variety of models and greenhouse gas emission scenarios has been developed to simulate globalclimate over the past quarter century. To standardize some of the output generated by diverse modelinggroups from around the world, the Coupled Model Intercomparison Project (CMIP) was begun to serveas a repository of model runs with consistent emission scenarios. The World Climate ResearchProgramme (WCRP) develops climate projections every 5 to 7 years. These projections have informedIntergovernmental Panel on Climate Change (IPCC) Assessment Reports that summarize the state ofclimate science and are published every 5 to 7 years. 13 The last published IPCC report (in 2007) usedthe CMIP Phase 3 (CMIP3) projections. Because the CMIP projections are readily accessible on theInternet, they are commonly used for various research and impact assessment activities related toclimate change. WCRP released global climate projections from CMIP Phase 5 (CMIP5) during 2012‒2013. Over the coming years it is expected that CMIP5 data will be used for climate change analysis. Acrucial difference between CMIP3 and CMIP5 projections is that they use somewhat different emissionspathways for the future. The most recent IPCC report (termed the Fifth Assessment Report, IPCC 2013)uses CMIP5 data. At the time of development of this paper, CMIP3 data were more widely available forthe Caribbean, but it is anticipated that this will change in the coming months as CMIP5 data areincorporated.
The CMIP climate data are in the form of outputs from atmosphere-ocean general circulation models(AOGCMs), or, in more common and recent usage as global climate models (GCMs). Because thespatial scale of GCM output, typically 200‒500 kilometers, is too large to characterize climate over smalland topographically complex areas, downscaling to a finer resolution is necessary. This can take twogeneral forms: statistical and dynamical downscaling (Benestad 2001; Mearns et al. 2001). While
13 Note that Representative Concentration Pathways will be used as the set of standards to model climate data inthe upcoming Fifth IPCC Assessment (AR5) in 2014. Representative Concentration Pathways refer to fourgreenhouse gas concentrations. They are the third generation of IPCC scenarios. The first set (IS92) was publishedin 1992. In 2000, the second generation (SRES) was released.
18
3.2 Step 2: Define the Assessment Parameters
dynamical downscaling has the advantage of simulating fine-scale physical processes, and therefore iscapable of capturing non-linear feedbacks, it requires intensive computational effort, which renders itsuse impractical for extended transient simulations of multiple emissions scenarios. Limited dynamicaldownscaled projections are available for the Caribbean region. Statistical downscaling uses longsequences of observed climate to establish statistical relationships between large- and fine-scale climatefeatures. These are then applied to future projections to infer the fine-scale response implicit in thelarge-scale GCM projections. Statistical downscaling, while computationally efficient, has the principaldrawback of assuming a similar relationship between large- and fine-scale climate features, the validity ofwhich becomes less certain as the climate warms to levels not observed in the historical record. Despitethis limitation, statistically downscaled climate data are widely used for climate change risk assessmentstudies.
3.2.1.2 Temperature and Precipitation
The most readily available information for future climate scenarios in the Caribbean region is in the formof statistically downscaled values and is discussed below. For completeness, the dynamical downscalingdata currently available is also summarized.
Statistically downscaled temperature and precipitation values, both historical and projected, are availablefrom the CMIP3 projections from the World Bank’s CCKP in a form that is easily accessible. Forexample, historical and projected data for temperature and precipitation are shown in Figure 3-1through Figure 3-3 for the Dominican Republic for a mid-21st century period. These values show apattern that is typical among GCMs: greater agreement on temperature projections than onprecipitation projections. In this case, all models indicate an increase in temperature, and most modelsindicate a decrease in precipitation in the future time period. A regional, map-based view of the data canalso be generated using the same underlying online tool, and is used to display mid-21st centuryprecipitation in Figure 3-4.
19
3.2 Step 2: Define the Assessment Parameters
Figure 3-1. Historical temperature and precipitation for the Dominican Republic from the World Bank’s CCKP at<http://sdwebx.worldbank.org>.

20
3.2 Step 2: Define the Assessment Parameters
Figure 3-2. Projected mean temperature for the Dominican Republic for 2046‒2065 from the World Bank’s CCKP at <http://sdwebx.worldbank.org>. The plot on the right shows projections for 9 different GCMs.
21
3.2 Step 2: Define the Assessment Parameters
Figure 3-3. Projected mean precipitation for the Dominican Republic for 2046‒2065 from the World Bank’s CCKP at <http://sdwebx.worldbank.org>. The plot on the right shows projections for 9 different GCMs.

22
3.2 Step 2: Define the Assessment Parameters
Figure 3-4. Projected precipitation for the Caribbean region for 2046‒2065 using CMIP3 data and a mapping tool called ClimateWizard that has been customized for the World Bank’s CCKP at <http://sdwebx.worldbank.org>.
If, however, CMIP5 projections are desired, a different source of data might need to be used. At thistime, the CMIP5 globally downscaled data can be obtained from WorldClim, a set of global climate layers(climate grids) with a spatial resolution of about 1 square kilometer. The interface for this data source isoriented toward researchers and does not have the simple country-by-country functionality of theWorld Bank site. A regional summary of the precipitation in the Caribbean region over the 20th and21st centuries from the CMIP5 data is shown in Figure 3-5. It is possible that the World Bank site willalso be updated in the coming months, however, many completed and ongoing studies are based onCMIP3 projections that were considered the best information available at the time of the study. Eventhough CMIP5 is newer, it is not considered a more reliable product, and for some time, it is likely thatclimate impact studies will be performed using both CMIP3 and CMIP5 projections. From a practicalstandpoint, there are great uncertainties in climate change projections, and if a risk assessment indicatesconcerns using the available CMIP3 data, these concerns are also likely to occur using CMIP5 data.

23
3.2 Step 2: Define the Assessment Parameters
Figure 3-5. Projected precipitation for the Caribbean region for the 20th and 21st century from the CMIP5 data.summary plot obtained from <http://www.worldclim.org>.
In addition to the data sources above, two major sources of dynamically downscaled information can beconsidered. The first is a North America-wide modeling effort with multiple GCMs and regional climatemodels (RCMs) to produce high-resolution climate change simulations called the North AmericanRegional Climate Change Assessment Program (NARCCAP). The model domain here includes theWestern Caribbean, and the data can be downloaded for specific climate change scenarios for use inimpacts research. An example of precipitation outputs from NARCCAP is shown Figure 3-6; the datashown compares the results from the global-scale model with the regional-scale model. As with thestatistical downscaling results, these data are available for multiple models. A Caribbean-specific RCM,developed using a modeling framework called PRECIS (Providing Regional Climates for Impacts Studies),provides projections for a wider range of variables and for specific time periods. The United KingdomMeteorological (MET) Office developed PRECIS.14 An example of future precipitation for the mid-21stcentury obtained from this tool is shown in Figure 3-7. While these data are more focused on theregion of interest as compared to NARCCAP, the available output only pertains to a single model,which is limiting given the uncertainty across different climate models (discussed further below). TheCaribbean Institute for Meteorology and Hydrology (CIMH) also collects climate data and is considered aregional resource; however, their data is not available online and must be requested.
14 This data is also available from the Caribbean Community Climate Change Centre.

24
3.2 Step 2: Define the Assessment Parameters
Figure 3-6. Projected changes in June, July, and August (JJA) precipitation through a GCM (left) and through an RCM(right). The lower panel is for dynamic downscaling for North America (including parts of the Western Caribbean region) forthe mid-21st century. These results are based on a specific pairing of a GCM and an RCM. The GCM used is CCSM, theRCM used is MM5I. (Source: http://www.narccap.ucar.edu/results/tmsl-results.html). Although the results do not match,both indicate a decrease in precipitation in the portion of Caribbean that falls in the model domain.

25
3.2 Step 2: Define the Assessment Parameters
Figure 3-7. Projected changes in precipitation through a Caribbean-specific RCM (PRECIS). This Web interface canbe used to develop maps for specific variables for different time periods, and can also be used to downloadnumerical data. (Source: http://www.caribbeanclimate.bz/index.php?Itemid=88&option=com_wrapper&view=wrapper)
In summary, several data sources are currently available for climate projections in the Caribbean. TheWorld Bank site appears to the most comprehensive and easy-to-use resource currently, and is suitableas a data source on projected future climate for both basic and detailed risk assessments.
3.2.1.3 Sea Level Rise
There is a close correspondence between mean sea level and global temperatures, and this aspect ofclimate change is of particular importance to the Caribbean because of numerous small island nationsand extensive exposed coastlines throughout the region. Changes in sea level are due to a complexinteraction of climatic and geologic factors. The climatic factors are global; sea levels are rising largelybecause global temperatures are rising, causing ocean water to expand and land ice to melt. Besides thisglobal trend, regional changes are also occurring in ocean and atmospheric circulation patterns that areaffecting sea level. The geologic factors (subsidence, rebound, and uplift) are also regional. For thesereasons, actual sea level rise varies by location. Local sea level projections for the Caribbean are notavailable and global estimates are appropriate for use in the region.
The global 20th century sea level rise was 1.7 ± 0.5 millimeters per year (IPCC 2007). Over a morerecent period, 1993–2003, the global increase has been reported to be 3.1± 0.7 millimeters per yearusing satellite altimetry data (National Academy of Sciences 2012).

26
3.2 Step 2: Define the Assessment Parameters
In the Caribbean region long-term tide gauge data are relatively sparse. The best available data are fromPermanent Service for Mean Sea Level (PSMSL). PSMSL is a data repository for long-term sea levelchange information from tide gauges and bottom-pressure recorders. PSMSL has been responsible forthe collection, publication, analysis, and interpretation of sea level data from the global network of tidegauges. Active sea level gauges in the Caribbean are shown in Figure 3-8. Typical trends in sea level for astation in Cristobal (in Panama) are shown in Figure 3-9. This is one of the longest publicly availablecontinuous records in the Caribbean region. Most available gauges are less than 30 years old and do notprovide sufficient data to identify a trend in sea level. For example, the Tsunami Alert System has recentlystarted collecting tide data and establishing additional tide gauges.
Figure 3-8. Active sea level gauges in the Caribbean, as reported by the PSMSL. The colors of the symbolsindicate the length of record, and most are 30 years or less.

27
3.2 Step 2: Define the Assessment Parameters
Figure 3-9. Sea level (monthly and annual mean) for a gauge in Cristobal (Panama). This is one of the longestperiods of record in the Caribbean region in the PSMSL database.
Recent global sea level rise estimates for the 21st century suggest a considerably larger increase thanhad been projected a few years ago in the 2007 IPCC report, and show an increasing rate compared tothe 20th century rate of change (Figure 3-10). Based on an assessment of calculations using multipleGCMs as well as empirical methods, a recent comprehensive review reported that global sea level isestimated to rise 8–23 centimeters by 2030 relative to 2000, 18‒48 centimeters by 2050, and 50‒140centimeters by 2100 (National Academy of Sciences 2012). This information is summarized in plot formin Figure 3-11, and can be used to select ranges of sea level rise for specific time periods. The mostrecent IPCC report suggests a somewhat lower range of sea level rise, ranging from 17-38 centimetersover 2046-2065, and from 26-82 centimeters over 2081-2100 relative to a baseline of 1986-2005 (IPCC,2013). Both are scientifically credible sources of information, and the differences are indicative offundamental scientific uncertainties driving sea level rise estimates. Given the international focus of theIPCC reports, the IPCC results may be used in preference to the National Academy of Sciences review.
Figure 3-10. Sea level rise from 1950 to 2100 based on a semi-empirical model (Vermeer and Rahmstorf 2009) andthree emission scenarios (A2, B1, and A1FI). AR4 refers to projections made in the IPCC 2007 report. The increaseseen over the historical period is expected to accelerate significantly based on this model.

28
3.2 Step 2: Define the Assessment Parameters
Figure 3-11. Projection of sea level rise from 2000 to 2100, along with upper and lower uncertainty bounds, basedon an evaluation of the literature and alternative modeling methods (National Academy of Sciences 2012). Themodels employed for this composite projection are in addition to the Vermeer and Rahmstorf (2009) projectionsshown in Figure 3-10.
3.2.1.4 Hurricane Frequency and Intensity
Hurricanes are a climatic extreme with significant consequences over much of the Caribbean, and thechanges in hurricane frequency and intensity due to climate change are a subject of considerableresearch. This section summarizes the best current representation of the state of science on this criticalaspect of climate-related risk.
Available data on hurricane frequency and intensity shows no clear pattern over a 160-year period ofhistorical record (data for Eastern and Western Caribbean from the Caribbean Hurricane Network [Figure3-12]), during which there have been observable increases in global mean temperature. This isparticularly true if the early years with fewer hurricanes are corrected for the fact that limited shiptraffic might have caused some hurricanes or tropical storms to go unobserved (Biasutti et al. 2012;Vecchi and Knutson 2008). Note that some trends can be observed visually over more limited periods(e.g., over the last 30 years), but are not supported by the longer record in the region. These shortertrends might be related to natural climatic oscillations, but their link to anthropogenic effects has notbeen established.
Eastern Caribbean
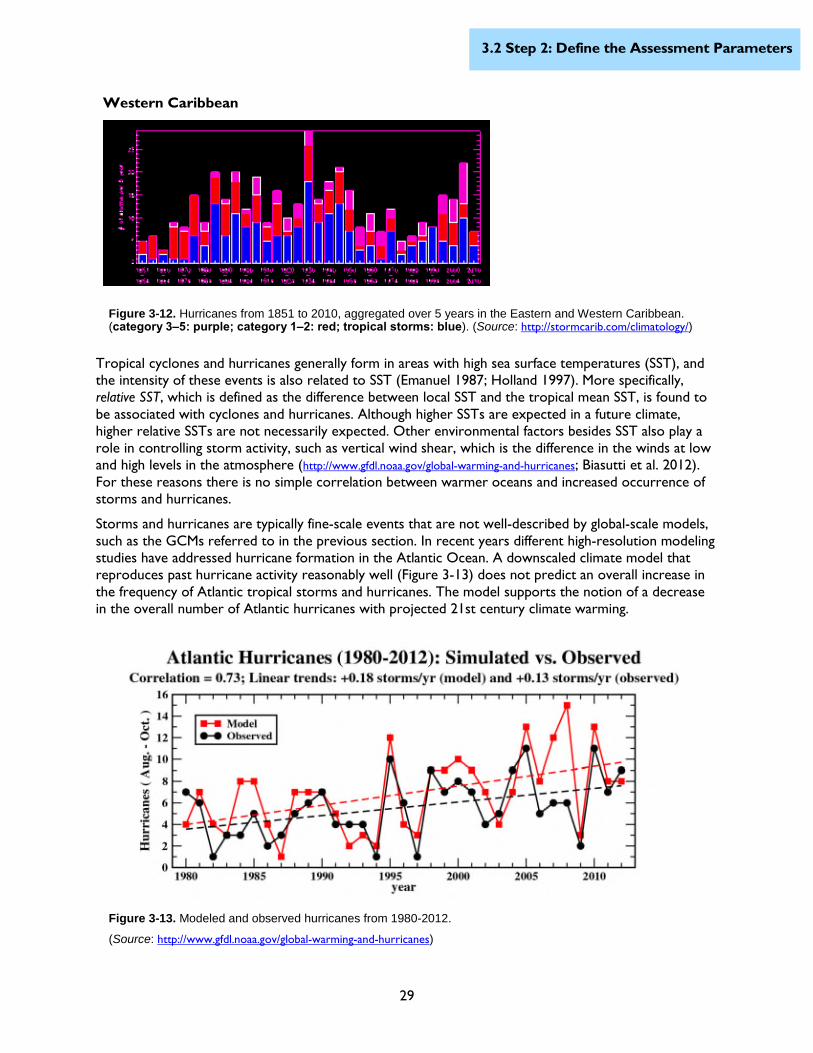
29
3.2 Step 2: Define the Assessment Parameters
Tropical cyclones and hurricanes generally form in areas with high sea surface temperatures (SST), andthe intensity of these events is also related to SST (Emanuel 1987; Holland 1997). More specifically,relative SST, which is defined as the difference between local SST and the tropical mean SST, is found tobe associated with cyclones and hurricanes. Although higher SSTs are expected in a future climate,higher relative SSTs are not necessarily expected. Other environmental factors besides SST also play arole in controlling storm activity, such as vertical wind shear, which is the difference in the winds at lowand high levels in the atmosphere (http://www.gfdl.noaa.gov/global-warming-and-hurricanes; Biasutti et al. 2012).For these reasons there is no simple correlation between warmer oceans and increased occurrence ofstorms and hurricanes.
Storms and hurricanes are typically fine-scale events that are not well-described by global-scale models,such as the GCMs referred to in the previous section. In recent years different high-resolution modelingstudies have addressed hurricane formation in the Atlantic Ocean. A downscaled climate model thatreproduces past hurricane activity reasonably well (Figure 3-13) does not predict an overall increase inthe frequency of Atlantic tropical storms and hurricanes. The model supports the notion of a decreasein the overall number of Atlantic hurricanes with projected 21st century climate warming.
Figure 3-13. Modeled and observed hurricanes from 1980-2012.
(Source: http://www.gfdl.noaa.gov/global-warming-and-hurricanes)
Western Caribbean
Figure 3-12. Hurricanes from 1851 to 2010, aggregated over 5 years in the Eastern and Western Caribbean.(category 3‒5: purple; category 1‒2: red; tropical storms: blue). (Source: http://stormcarib.com/climatology/)

30
3.2 Step 2: Define the Assessment Parameters
However, other analysis projects a doubling in frequency of very intense (category 4‒5) hurricanes inthe Atlantic basin by the end of the 21st century. This analysis uses an 18-model average climate changeprojection to drive higher resolution "downscaling" models used for hurricane calculations. This findingwas not consistently supported when individual models were used with the downscaling models, but thestudy suggests some plausible increase in hurricane frequency under future conditions.
Based on current focused research on hurricanes, the following conclusions are relevant from a climaterisk assessment perspective for the Caribbean region:
• Anthropogenic warming by the end of the 21st century will likely cause hurricanes globally (notjust in the Caribbean region) to be more intense on average (by 2 to 11 percent for mid-rangeemission scenarios). This change would imply an even larger increase in the destructive potentialper storm, assuming no reduction in storm size.
• On average across the globe, assuming global climate changes within the range deemed mostlikely, the frequency of tropical cyclone and hurricane occurrence is expected to decrease by 6–34 percent (Knutson et al. 2010).
• Climate warming over the next century might lead to an increase in the numbers of intensehurricanes in some basins—an increase that would be substantially larger in percentage termsthan the 2‒11 percent increase in the average storm intensity. This increase is projected despitea likely decrease (or little change) in the global numbers of all tropical storms.
• Anthropogenic warming by the end of the 21st century will likely cause hurricanes to havesubstantially higher rainfall rates than present-day hurricanes, with a model-projected increase ofabout 20 percent for rainfall rates averaged within about 100 kilometers of the storm center.
The recent IPCC report (2013) suggests that there is low confidence in a human effect on tropical cyclonesin the observations to date, but that in future (late 21st century) there is more likelihood of further change.From a practical standpoint, therefore, climate risk assessments in the Caribbean might justifiably considerthe effects of more intense storms and hurricanes in a given location compared to storms documented inthe historical record. The change in hurricane frequency and intensity in the Caribbean over the 21stcentury can be approximated as a small increase (~10 percent) from baseline conditions, although moreuncertainty is associated with this variable as discussed above. Another approach would be to considerevaluating impacts for more extreme events than is typically done (i.e., by considering a more extremestorm with a100-year return period rather than a 25- or 50-year return period).
3.2.1.5 Integrating Sea Level Rise and Storm Surge
Storm surges result from high winds and low pressure pushing the ocean’s surface up, and areassociated with tropical storms and hurricanes. The previous section discussed the expectationsassociated with these extreme events under future climatic conditions. Storm surge elevations andreturn periods are useful to land use planners and emergency managers to assess the likelihood ofextreme water depths associated with tropical storms or hurricanes.
Storm surge elevations are a complex function of the storm characteristics, the bathymetry of the seawater in the surrounding region, and the topography of the land where the storm is making landfall.Typically storm surges are computed through hydrodynamic models. For the Caribbean, a previousproject (Caribbean Disaster Mitigation Project or CDMP) has developed storm surge estimates acrossthe entire region. The U.S. Agency for International Development (USAID) implemented the CDMP.The storm surge estimates were developed using a numerical model called TAOS for different returnperiods. TAOS is a numerical model that produces estimates of maximum sustained winds at thesurface, and still water surge height and wave height at the coastline, for any coastal area in theCaribbean basin. Although this work was completed in 1999, it appears to currently be the mostdetailed assessment available in the public domain. A non-public, commercial data resource is described

31
3.2 Step 2: Define the Assessment Parameters
below. Also, specific regions can develop more high-resolution models of storm surge, but these aretypically not available off-the-shelf and might need to be performed for specific projects.
Examples of storm surge estimates from the CDMP project for two nations of interest (the DominicanRepublic and Jamaica) are shown in Figure 3-14a and 3-14b for 100-year return periods. (Similar data arealso available for 25- and 50-year return periods.) Typically, storm surge depth values would consist of acomponent of sea level rise, specific to a time period of interest, and a digital elevation model of aregion, to estimate the extent of inundation.
Accurate elevation data over reasonably large areas are developed through LiDAR (Light Detection andRanging) measurements. More accurate data are obtained through ground-based measurements. Thesedata are not readily available in the Caribbean, at least not on a large scale. The best public domain data forthe Caribbean are from the Shuttle Radar Topography Mission (SRTM), which are at 30-meter resolution.These data are also used as the elevation data source in the freely available Google Earth software.
Figure 3-14a. Storm surge computed by the TAOS model for the Dominican Republic(Source: CDMP project).
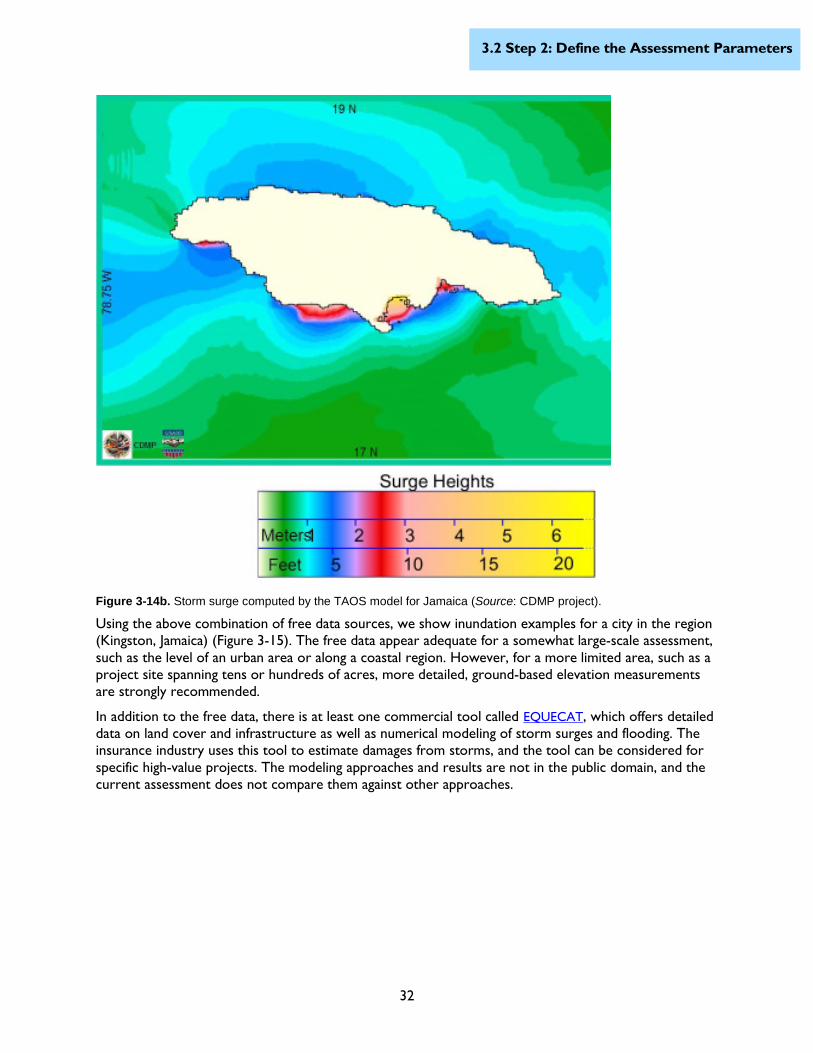
32
3.2 Step 2: Define the Assessment Parameters
Figure 3-14b. Storm surge computed by the TAOS model for Jamaica (Source: CDMP project).
Using the above combination of free data sources, we show inundation examples for a city in the region(Kingston, Jamaica) (Figure 3-15). The free data appear adequate for a somewhat large-scale assessment,such as the level of an urban area or along a coastal region. However, for a more limited area, such as aproject site spanning tens or hundreds of acres, more detailed, ground-based elevation measurementsare strongly recommended.
In addition to the free data, there is at least one commercial tool called EQUECAT, which offers detaileddata on land cover and infrastructure as well as numerical modeling of storm surges and flooding. Theinsurance industry uses this tool to estimate damages from storms, and the tool can be considered forspecific high-value projects. The modeling approaches and results are not in the public domain, and thecurrent assessment does not compare them against other approaches.
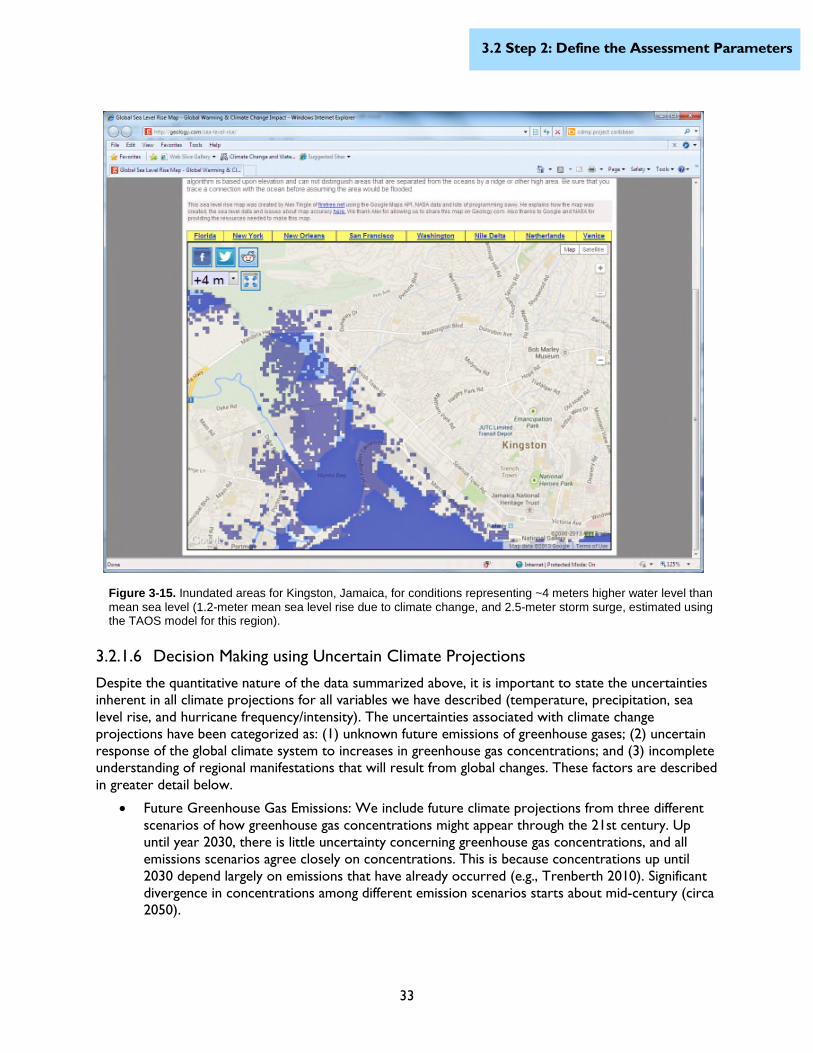
33
3.2 Step 2: Define the Assessment Parameters
3.2.1.6 Decision Making using Uncertain Climate Projections
Despite the quantitative nature of the data summarized above, it is important to state the uncertaintiesinherent in all climate projections for all variables we have described (temperature, precipitation, sealevel rise, and hurricane frequency/intensity). The uncertainties associated with climate changeprojections have been categorized as: (1) unknown future emissions of greenhouse gases; (2) uncertainresponse of the global climate system to increases in greenhouse gas concentrations; and (3) incompleteunderstanding of regional manifestations that will result from global changes. These factors are describedin greater detail below.
• Future Greenhouse Gas Emissions: We include future climate projections from three differentscenarios of how greenhouse gas concentrations might appear through the 21st century. Upuntil year 2030, there is little uncertainty concerning greenhouse gas concentrations, and allemissions scenarios agree closely on concentrations. This is because concentrations up until2030 depend largely on emissions that have already occurred (e.g., Trenberth 2010). Significantdivergence in concentrations among different emission scenarios starts about mid-century (circa2050).
Figure 3-15. Inundated areas for Kingston, Jamaica, for conditions representing ~4 meters higher water level thanmean sea level (1.2-meter mean sea level rise due to climate change, and 2.5-meter storm surge, estimated usingthe TAOS model for this region).

34
3.3 Step 3: Vulnerability and Risk Assessment
• Climate Response to Rising Greenhouse Gas Concentrations: Because of complicatedinteractions between the ocean, land, and atmosphere, the chaotic nature of the climate system,and the imperfect representation of the physics of the climate in climate models, our presentability to simulate climatic responses to greenhouse gas concentrations is limited. GCMs do,however, represent our current understanding of the climate system and are useful for obtainingplausible projections of climatic responses. Because of differences in the representation of thephysical processes, different GCMs can exhibit a wide range of sensitivity to changinggreenhouse gas levels.
• Regional Impacts: While there is some agreement on large-scale climate processes simulated byclimate models, there is significant divergence in the projections as they related to climatevariables at the local scale. In particular, at a given location, the models generally agree ontemperature changes, but might disagree on the nature of precipitation change. Hurricaneintensity and frequency impacts are highly region specific.
To characterize this uncertainty, typically model ensembles are used for analysis, rather than any singlemodel. Also, model output is used for several years (typically 30 years), rather than just a few years. Bytreating each model’s projections as an equally likely possible outcome, the likelihood of any specificresponses of the climate to a specific greenhouse gas concentration level can be quantified, within therealm of model results. Hurricane modeling is even more uncertain than that for temperature andprecipitation, and specific projections for future impact assessment must be used with caution. Finally,even the entire realm of model results does not represent certainty, because the true climatic responseof the natural system might lie outside of this realm. Thus, an analyst using these data sources must beaware of these limitations, and also of the need to update analyses as newer, and perhaps better,projection estimates become available.
3.3 Step 3: Vulnerability and Risk Assessment
The climate risk assessment process involves either conducting a basic or detailed risk assessment. Theproject proponent, working closely with IDB staff, will need to determine which level of analysis willbest suit the specific project.
The goal of this section is to provide the reader with an understanding of the two methods for assessingthe potential impacts to a proposed project. The basic assessment methodology has been developedbased on the IPCC vulnerability assessment methodology, while the detailed risk assessmentmethodology has been developed based on methodology used by insurance companies and design firms.This section will focus on IDB member countries where many upcoming projects could take place,including Barbados, Dominican Republic, Haiti, Jamaica, and Trinidad and Tobago. Relevant data sourcesand tools are provided for each step.
3.3.1 Background on Climate Change Vulnerability and Risk Assessment
Climate change risk and vulnerability have been defined in different ways by different organizations withdifferent needs. Climate change risk can best (or prevalently) be described as the negative consequence ofhazard, exposure and vulnerability. It is assumed a hazard analysis (including a likelihood assessment) isconducted. Vulnerability can be described as the degree to which geophysical, biological and socio-economic systems are susceptible to, and unable to cope with, adverse impacts of climate change (Füsseland Klein 2006).
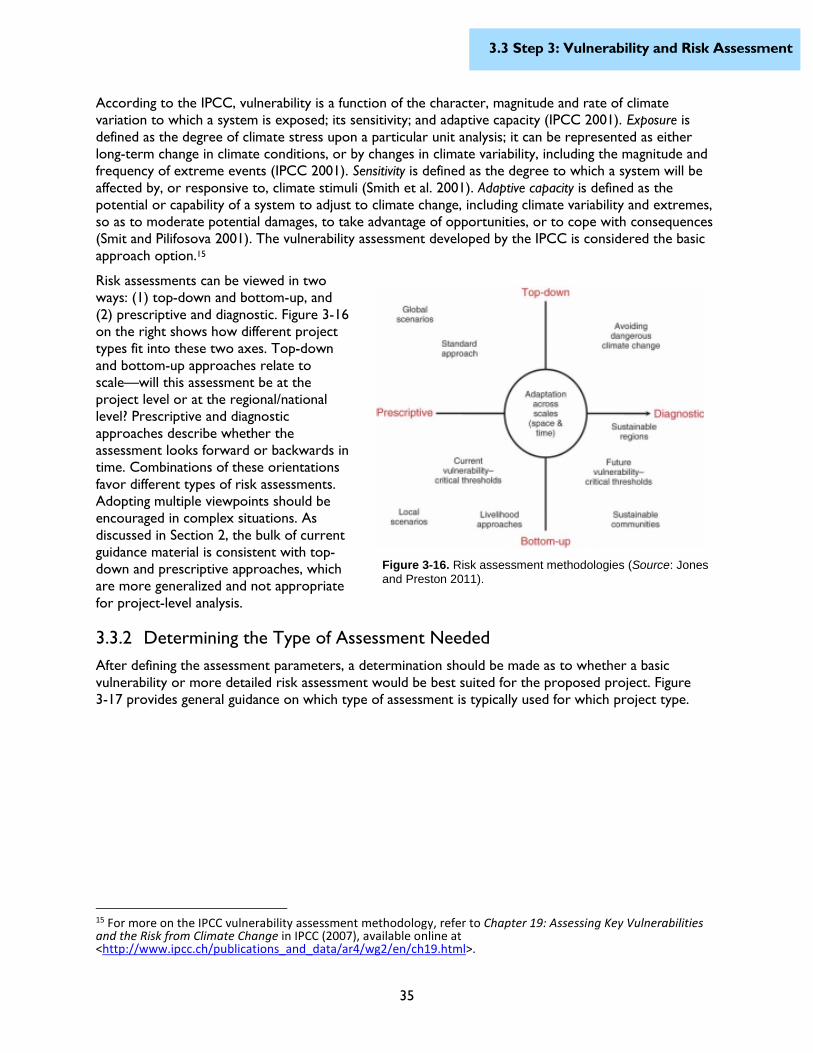
35
3.3 Step 3: Vulnerability and Risk Assessment
According to the IPCC, vulnerability is a function of the character, magnitude and rate of climatevariation to which a system is exposed; its sensitivity; and adaptive capacity (IPCC 2001). Exposure isdefined as the degree of climate stress upon a particular unit analysis; it can be represented as eitherlong-term change in climate conditions, or by changes in climate variability, including the magnitude andfrequency of extreme events (IPCC 2001). Sensitivity is defined as the degree to which a system will beaffected by, or responsive to, climate stimuli (Smith et al. 2001). Adaptive capacity is defined as thepotential or capability of a system to adjust to climate change, including climate variability and extremes,so as to moderate potential damages, to take advantage of opportunities, or to cope with consequences(Smit and Pilifosova 2001). The vulnerability assessment developed by the IPCC is considered the basicapproach option.15
Risk assessments can be viewed in twoways: (1) top-down and bottom-up, and(2) prescriptive and diagnostic. Figure 3-16on the right shows how different projecttypes fit into these two axes. Top-downand bottom-up approaches relate toscale—will this assessment be at theproject level or at the regional/nationallevel? Prescriptive and diagnosticapproaches describe whether theassessment looks forward or backwards intime. Combinations of these orientationsfavor different types of risk assessments.Adopting multiple viewpoints should beencouraged in complex situations. Asdiscussed in Section 2, the bulk of currentguidance material is consistent with top-down and prescriptive approaches, whichare more generalized and not appropriatefor project-level analysis.
3.3.2 Determining the Type of Assessment Needed
After defining the assessment parameters, a determination should be made as to whether a basicvulnerability or more detailed risk assessment would be best suited for the proposed project. Figure3-17 provides general guidance on which type of assessment is typically used for which project type.
15 For more on the IPCC vulnerability assessment methodology, refer to Chapter 19: Assessing Key Vulnerabilitiesand the Risk from Climate Change in IPCC (2007), available online at<http://www.ipcc.ch/publications_and_data/ar4/wg2/en/ch19.html>.
Figure 3-16. Risk assessment methodologies (Source: Jonesand Preston 2011).

36
3.3 Step 3: Vulnerability and Risk Assessment
Assessment Needs Bas
icV
uln
era
bili
tyA
sses
sme
nt
De
taile
dR
isk
Ass
ess
me
nt
Top
-Do
wn
Bo
tto
m-U
p
Pre
scri
pti
ve
Dia
gno
stic
Public Awareness X X X X X X
Grant Distribution Justification X X X
National Assessment X X X
Local/Community Assessment X X X X X
Local Adaptation Justification X X X
Coastal Planning X X X X X
Emergency Response X X X X X
Infrastructure Design X X X
Insurance X X X X
Figure 3-17. Vulnerability and risk assessment needs compared tomethodologies (Source: NOAA 2008).
In step 2, the project proponent will have determined the scale, scope, and available data. Thisinformation will help inform the type of assessment needed.
There are essentially two scales that have bearing on the methods selection of a vulnerability and riskassessment: (1) the regional and national (top-down) or (2) local and site-specific (bottom-up). The scaleof the assessment will be based on the geographic boundaries of the project assets and projectedclimate risks. It is possible that both national and site-specific scales are appropriate for evaluation. Forexample, a hotel project might need to evaluate its infrastructure at the site level to determine whetherhigher building elevations could mitigate the impact of future storm surge, as well as the vulnerability ofnational critical infrastructure such as highways and airports. The scale of an assessment will also beinformed by the availability of appropriately scaled climate projections. If climate data is not available tosupport a site-specific assessment, then a national-level assessment might be all that’s possible.
Identifying project scope involves identifying the sector(s) that are of interest. A single-sectorassessment, such as one for water or transportation, provides the ability to focus data and resources onthat sector analysis. There also tends to be more quantitative decision support tools available to single-sector analysis. Qualitative assessment tends to be more applicable to multisector projects wherequalitative inferences might need to be made about the relationships between sectors, or to sectorswhere sufficient data is not available for quantitative analysis.
For the purposes of the IDB, it is recommended that a project-specific ranking criterion be used todetermine whether a project should undergo a basic vulnerability or a detailed risk assessment. Table 3-2 identifies such an illustrative ranking criteria.

37
3.3 Step 3: Vulnerability and Risk Assessment
Table 3.2 Proposed Ranking Criteria to Determine Type of Vulnerability Assessment Needed
Proposed Ranking Criteria
Project Attributes
Proposed Ranking
Basic Vulnerability Assessment Detailed Risk Assessment
Scale Regional or national Local or site-specific
Scope Multisector Single sector
Data Availability Not available or limited forgeographic area of interest
Data concerning project constructionand siting, climate change, historicalhazard events, and environment areavailable
3.3.3 Step 3a: Basic Vulnerability Assessment
A basic vulnerability assessment is cost effective, quick, and produces some quantitative results.However, the results are limited and uncertainty is higher. The vulnerability assessment methodologyinvolves assessing the project’s exposure, sensitivity, and adaptive capacity, which is further detailedbelow.
The first step is to define the project’s assets. These assets could be the infrastructure itself (e.g.,manufacturing facility or hydropower plant), but they could also be coral reefs or beaches for tourism-based projects. Both coral reefs and beaches are considered the basis for the crucial tourism industry inthe region, which includes 40 million visitors annually (NOAA 2013). Coral reefs also serve vitalfunctions as nurseries for marine life and as protection from storm surges. Coral reefs are affected byocean warming or acidification as a result of higher dissolved carbon dioxide levels, and die-offs orbleaching has been extensively documented over the past decade. Because of warming temperatures,models predict significant risk to coral reefs, with substantial loss in the worst-case scenarios. Beaches inthe Caribbean region have been eroding over the past two decades, with higher rates of erosion forislands hit by hurricanes. Greater erosion is expected under future sea level rise scenarios. Reduction,or even complete loss, of beach area in some regions could have a major adverse effect on tourisminfrastructure and future potential.
3.3.3.1 Exposure
Exposure is defined as the degree of climate stress upon a particular unit analysis; it may be representedas either long-term change in climate conditions, or by changes in climate variability, including themagnitude and frequency of extreme events (IPCC 2001). This assessment focuses on the exposurefrom three climate-induced hazards: (1) sea level rise, (2) flooding, and (3) hurricanes (including stormsurge). To understand what could be affected, it is first necessary to identify at-risk areas. This processincludes collecting data on physical environment, historical events in the area, and modeled data forpotential future events.
Physical environment data include elevation models and location relative to the shoreline, river, or otherwater body. Several free products are available that can support this basic analysis, such as Google Earth.This Web-based product allows a user to zoom into a project site and identify an elevation using itsterrain model, which is based on the SRTM data source described above. It also has a measurement toolto determine distances from the current shoreline or water body. Storm surge has been estimated forall regions of the Caribbean through the CDMP project and can provide an initial assessment of areas atrisk of inundation.

38
3.3 Step 3: Vulnerability and Risk Assessment
To get a general idea of the current potential hazard for a country, the United Nations EnvironmentProgramme (UNEP)/Grid-Geneva developed the Global Risk Data Platform, which is supported by theUnited Nations Office of Disaster Reduction (UNISDR). This site provides historical and probabilisticdata that can be viewed or downloaded and used in GIS. The data include:
• Hurricane wind events, tracks, frequency, risk, and probabilistic wind speeds• Hurricane surge events and frequency• Flood events, frequency, and risk
Representative country-specific data for five IDB member countries is summarized below.
Barbados
Barbados is home to 277,821 people and is part of the Lesser Antilles. The 432-square-kilometer islandhas 97 kilometers of shoreline (CIA World Factbook) and rises to the central highland region with anelevation of 340 meters above sea level. The country has wet (June through November) and dry(December through May) seasons. The annual precipitation ranges from 1,000 to 2,300 millimeters(BBC 2009).
The island does not have tide gauge data. Historical data on flood and cyclone events are available at theEM-DAT website. Historical data include:
• Flood events (1900‒2013): Two events caused 3 casualties, impacted 310, and caused $500,000in damage.
• Cyclone events (1900‒2013): Seven events caused 58 casualties, impacted 10,617, and caused$106.7 million in damage.
Sources for local data and information can be found within the government website, which includes datafrom the Ministry of Environment and Drainage; Ministry of Agriculture, Food, Fisheries, and WaterResource Management; and Department of Emergency Management.
Dominican Republic
The Dominican Republic is a nation on the island of Hispaniola, which it shares with Haiti and part of theGreater Antilles archipelago. The 48,445-square-kilometer country is home to nearly 10 million peopleand has a 1,288-kilometer shoreline.
The country has two tidal gauges: (1) Puerto Plata, which has collected data between 1949 and 1969 with73 percent coverage, and the United Nations Educational, Scientific and CulturalOrganization/Intergovernmental Oceanographic Commission (UNESCO/IOC) collecting and compilingmore recent data; and (2) Barahona, which has collected data between 1954 and 1969 with 64 percentcoverage, and UNESCO/IOC collecting and compiling more recent data. Historical data on flood, surge,and cyclone events are available at the EM-DAT website and include:
• Flood events (1900‒2013): Twenty-one events caused 832 casualties, impacted 1,473,072, andcaused $55 million in damage.
• Surge events (1900‒2013): One event caused 9 casualties, impacted 65,003, and caused $42.6million in damage.
• Cyclone events (1900‒2013): Twenty-seven events caused 4,485 casualties, impacted 2,863,246,and caused $2.8 billion in damage.
Sources for local data and information can be found within the government website, which includes datafrom the Ministry of Environment, Natural Resources, Physical Planning, and Fisheries; Ministry of Lands,Housing, Settlements, and Water Resource Management; and Office of Disaster Management. Thenongovernmental organization, Asociación de Ingeniería y Consultoría Dominicana (ASICDOM) alsocollects local information.
39
3.3 Step 3: Vulnerability and Risk Assessment
Haiti
Haiti is a Caribbean country on the western, smaller portion of the island of Hispaniola, in the GreaterAntillean archipelago. The 27,750-square-kilometer country is home to 9.7 million people and has a1,771-kilometer shoreline. The World Bank’s CCKP includes a country profile for Haiti that providesrelevant climate change information for that country.
The country has one tidal gauge, Port Au Prince, which has collected data between 1949 and 1961 with97 percent coverage, and the Global Sea Level Observing System (GLOSS) collecting and compiling morerecent data. Historical data on flood, surge, and cyclone events are available at the EM-DAT website andinclude:
• Flood events (1900‒2013): Forty-eight events caused 3,944 casualties, impacted 702,999, andcaused $2 million in damage.
• Surge events (1900‒2013): One event caused zero casualties, impacted 4,690, and caused anunknown amount in damage.
• Cyclone events (1900‒2013): Thirty-five events caused 14,137 casualties, impacted 3,390,620,and caused $1.2 billion in damage.
Sources for local data and information can be found within the Direction de la Protection Civile (DPC)government website.
Jamaica
Jamaica is an island country in the Caribbean, comprising the third-largest island of the Greater Antillesand fifth-largest in the Caribbean. The 10,990-square-kilometer island is home to 2.8 million people andhas a 1,022-kilometer shoreline.
The country has one tidal gauge, Port Royal, which has collected data between 1954 and 1969 with 98percent coverage, and GLOSS collecting and compiling more recent data. Historical data on flood, surge,and cyclone events is available at the EM-DAT website and include:
• Flood events (1900‒2013): Thirteen events caused 730 casualties, impacted 903,712, and caused$168 million in damage.
• Cyclone events (1900‒2013): Twenty-eight events caused 604 casualties, impacted 1,579,705,and caused $2.6 billion in damage.
Sources for local data and information can be found within the government website, which includes datafrom the Ministry of Water, Land, Environment and Climate Change; and the Ministry of Science,Technology, Energy and Mining. Other data sources include the nongovernmental organization Abacus
for Communities, and Caribbean Disaster Information Network (CARDIN) at the University of WestIndies.
Trinidad and Tobago
Trinidad and Tobago is an island country to the north of South America lying off the coast ofnortheastern Venezuela and south of Grenada in the Lesser Antilles. It is comprised of two majorislands. The 5,128-square-kilometer country is home to 1.3 million people and has a 362-kilometershoreline.
The country has one tidal gauge, Port of Spain, which has collected data between 1983 and 1992 with 83percent coverage, and UNESCO/IOC collecting and compiling more recent data. Historical data on flood,surge, and cyclone events are available at the EM-DAT website and include:
• Flood events (1900-2013): Two events caused 5 casualties, impacted 210, and caused anunknown amount in damage.

40
3.3 Step 3: Vulnerability and Risk Assessment
• Cyclone events (1900-2013): Seven events caused 40 casualties, impacted 51,560, and caused$39 million in damage.
3.3.3.2 Sensitivity
Sensitivity is the degree to which a system will be affected by, or responsive to, climate stimuli (Smith etal. 2001). This assessment focuses on the sensitivity for common IDB project types. To understand themagnitude of impact, it is first necessary to identify system susceptibility. This process includes collectingdata on project characteristics and other stressors. A sensitivity assessment of eight IDB project types isprovided below.
Agriculture
Agriculture in the Caribbean remains a major industry and is strongly affected by changes inprecipitation patterns and droughts, as well as rising temperatures. In general, islands depend onperched fresh water aquifers of varying thicknesses for water supply. As sea level rises, there is greaterpotential of intrusion of sea water into aquifers, reducing the available fresh water volume. Agriculturalprojects could be developed to better cope with climate change including designing proper drainage,using drought-tolerant species, purchasing insurance, and using natural protective plantings.
Other stressors include water quality, disease, land use changes, increasing population, and pests.
Tourism
Tourism is a major source of foreign exchange and a key driver of several Caribbean economies. Twomajor risks that are unique to this sector are greater erosion and loss of beaches due to sea level riseand reduction and loss of coral reef areas. For beaches, where the inland areas are not developed, thebeaches will continue moving inland as sea level rises. This is not possible where the inland areas aredeveloped. In these cases, the effects of climate change could be addressed by greater structuralprotection (such as offshore breakwaters) and beach replenishment. Long-term planning needs toensure that future development occurs at a safe distance from the active beach zone. Coral reefs areaffected by temperature and ocean chemistry changes that are impossible to manage, but future planningmust ensure other stressors such as pollution and overfishing are minimized.
Other stressors include overdevelopment near beaches, loss of mangroves and wetlands, waterpollution, and overfishing.
Oil and Gas
Oil and gas infrastructure design characteristics can influence how a system copes with floods andhurricanes. Several Caribbean nations have significant offshore facilities for production, and associatedonshore facilities for processing and transport. Offshore facilities are subject to hurricane risk, whichcould modestly increase under future conditions. Onshore facilities, however, are subject to greater riskas a result of sea level rise and greater potential of flooding. Forward-looking elevation, weather alerts,and disaster operations plans might reduce sensitivity to floods and hurricanes.
Other stressors include environmental concerns, security concerns, and poor construction materials orpoor construction quality.
Transportation
Transportation elements of concern include ports and harbors as well as roads and bridges. Ports andharbors could be at risk of higher water elevation and flooding/erosion. Roadway infrastructure designcharacteristics can influence how a system copes with floods and hurricanes. Forward-looking elevationestimates; scour countermeasures; water retention ponds; and other drainage solutions, weather alerts,and disaster operations plans might reduce sensitivity to floods and hurricanes.

41
3.3 Step 3: Vulnerability and Risk Assessment
Other stressors (that are exacerbated by extreme climatic events), include poor construction materialsor poor construction quality.
Hydropower
Hydropower design characteristics can influence how a system copes with floods and hurricanes.Climate change might also affect water availability, demand, and quality. Designing reservoir size toaccommodate climate predictions, flood-proofing, elevating critical components, designing an adequatespillway, and integrating a disaster response plan into operations can all reduce sensitivity to floods.Design configuration might reduce sensitivity to high wind speeds.
Other stressors which might exacerbate climate change impacts on a hydropower project include wateravailability, water demand, water quality, land use changes, increasing population, and poor constructionmaterials or poor construction quality.
Water and Sewer
Water and sewer infrastructure design characteristics can influence how a system copes with floods andhurricanes. Wastewater treatment plants are typically located near the coast and subject to flooding.Elevation, separate storm and sanitary systems, condition monitors, and properly trained personnelmight reduce sensitivity to floods and hurricanes.
Other stressors include water availability, water demand, land use changes, increasing population, andpoor construction materials or poor construction quality.
Manufacturing and Other Infrastructure
Other infrastructure can be designed to better cope with climate change including using wet flood-proofing, which allows floodwaters to enter a building but cause little damage; dry flood-proofing, whichcreates a watertight seal so floodwaters cannot enter the structure using waterproof coatings;impermeable membranes, or supplemental layers of masonry or concrete; designing the structure onpiers or other elevated foundation types; implementing hurricane straps (roof-wall connections) into thebuilding design; using a larger roof nail size and reducing nail spacing; adding shutters to a design; using awarning system; adding protective plantings; receiving building configuration design input from a windengineer; and building redundant systems.
Other stressors include poor construction materials or poor construction quality.
3.3.3.3 Adaptive Capacity
Adaptive capacity refers to the potential or capability of a system to adjust to climate change, includingclimate variability and extremes, so as to moderate potential damages, to take advantage ofopportunities, or to cope with consequences (Smit and Pilifosova 2001). To understand a project’sability to adapt to climate change, it is first necessary to determine the institutional resources and abilityto absorb shocks. The preceding sections outline some of the changes that a project might be subject to,but others will become apparent with the passage of time and might not have been predicted. Thisprocess includes collecting data on the financial resources available and institutional capacity toimplement changes. In many cases, the adaptation actions will be phased in over the life of the project,or will be implemented based on some trigger identified during the risk assessment process. In othercircumstances there might be a need for an emergency response plan. For these projects it is necessaryto ensure the organization has the capacity to carry out necessary measures at the appropriate time.The assessment should include an institutional review and plan that clearly spells out the roles,responsibilities, and budget requirements. The project management needs to ensure sufficientmanagement support, including human and financial resources to guarantee that agreed-upon actions willbe implemented on schedule.

42
3.3 Step 3: Vulnerability and Risk Assessment
3.3.3.4 Understanding Basic Vulnerability Assessment Results
To begin evaluating whether a project is vulnerable to climate change, the project’s exposure, sensitivity,and adaptive capacity should be evaluated. As an example, if a manufacturing project was beingconsidered in the Dominican Republic, the project location could be evaluated looking at a map andterrain model to determine exposure. Then, the facility itself could be evaluated to ensure its designtakes this exposure into account.
The Central America Probabilistic Risk Assessment (CAPRA) is a tool which can be used to support abasic vulnerability assessment. CAPRA is a free modular platform for risk analysis and decision makingusing probabilistic for hazard and loss assessment in Latin America. This software now includes a climatechange module. CCORAL could also be used to assist with a basic vulnerability assessment.
3.3.4 Step 3b: Detailed Risk Assessment
A detailed risk assessment will produce more granular information concerning project structural design,support for cost-benefit analysis, siting information, and economic loss estimates. However, thesedetailed risk assessments can be costly and take a longer time to complete.
Before a risk assessment can proceed, the project’s assets must be defined in detail (such as designdrawings, surveys, and economic data). Other quantifiable characteristics must also be compiled. Similarto the vulnerability assessment, these assets can be the infrastructure itself, such as a manufacturingfacility or hydropower plant, and can also include coral reefs or beaches if the project is tourism-based.
The next two sections have been developed around the two risk components: (1) a hazard assessmentand (2) a consequence assessment. Figure 3-18 provides more detail on how the risk assessmentcomponents work to generate quantifiable results.
Figure 3-18. Risk assessment components.

43
3.3 Step 3: Vulnerability and Risk Assessment
3.3.4.1 Hazard Assessment
The hazard assessment takes the outputs from the climate assessment conducted in Section 3 andintegrates that data into traditional hazard models. The hazard models are run using future conditionsfrom the climate models. There are different types of hazard assessment approaches and tools;however, they usually involve a mapping component. The objective of the hazard assessment is tounderstand where the hazard could occur and identify probable characteristics. Three hazardassessment examples include:
• Historical: High water marks could be collected for arecent storm and used with a digital elevation model todocument the extents and depths of flooding. This couldbe used for response and recovery and to validatemodeling efforts.
• Scenario-Based: These assessments will not describe anactual event but might look at a series of potentialevents. The figure on the right (3-19) is an example of ascenario-based event created by the U.S. NationalOceanic and Atmospheric Administration (NOAA). It isa storm surge zone map created by a Sea, Lake, andOverland Surge Hurricane (SLOSH) model. In this case,the output was derived by looking at all of the possiblecategory 3 hurricanes and inundated the coastline with the resultant surge. No one hurricanewould produce this surge, but the scenario analysis can be useful for planning purposes.
• Probabilistic: This is a risk-based map developed using a probabilistic analysis. These maps aretypically developed using historical hazard information to identify an event and assign likelihood tothat event occurring in the future. A common likelihood, also known as a return period, is a onepercent annual chance event (commonly referred to as the 100-year event). Other methods,including Monte Carlo Simulations, assign a return period to an event of a particular magnitude.
For a detailed climate change risk assessment, the probabilistic approach is recommended. It isimportant to use downscaled data for input into the models since the historical events might not beindicative of future events. Also, using longer time scales produce a better estimate of the extremeevents. For example, 200 years of data will provide a better indication of what a 500-year event wouldlook like compared to 30 years of data. For this reason, a stochastic weather simulation model, alsoknown as a weather generator, can be used to simulate longer time periods and identify those extremeevents. Two basic types of stochastic weather generators are available: the “Richardson” type(Richardson 1981; Richardson and Wright 1984) and the “serial” type (Racsko et al. 1991; Semenov etal. 1998). Both weather generator types require initial calibration based on observed station data.
In a Richardson-type weather generator (e.g., WGEN) precipitation occurrence is modeled using a first-order two-state Markov procedure, which describes two precipitation classes (i.e., wet or dry) andtakes into account precipitation occurrence on the previous day only. More complex models mightinvolve more than one precipitation class as well as the occurrence of precipitation on a number of daysprior to the current day, rather than on just the previous day. One of the main criticisms of Richardson-type weather generators is their inability to adequately describe the length of wet or dry series.
The serial-type weather generator was developed to attempt to overcome problems identified with theRichardson type. The first step in the process is the modeling of the sequence of dry and wet series ofdays. The precipitation amount and the remaining climate variables are then generated dependent on thewet or dry series. The serial-type weather generator is freely available.
Figure 3-19. Scenario-Based (Source:NOAA, 2008).

44
3.3 Step 3: Vulnerability and Risk Assessment
Riverine Flood Assessment
In a riverine flood hazard assessment, two processes must be understood: (1) the hydrology of thewatershed and (2) the channel hydraulics. Hydrologic models estimate the distribution of rainfall, withthe ultimate goal of obtaining a discharge and flood hydrograph for the streams and rivers. Hydraulicmodels take the output from the hydrologic models, along with the stream channel morphology, togenerate flood elevations. These flood elevations are used to create a flood elevation grid, which is thensubtracted from the digital elevation model to produce a flood depth grid. Specialized models have alsobeen developed for reservoir modeling for hydropower facilities.
Illustrative models appropriate for conducting a riverine flood assessment are listed below. Thesemodels require specialized expertise to run and many are focused on particular environments andgeographic scales. An engineer should be consulted before selecting a model. 16
3.3.4.2 Hydrologic Models (focused on estimated of flow volumes)
• HEC-1 and HEC-HMS – The Hydrologic Engineering Center models are produced by the U.S.Army Corps of Engineers and are provided free of charge. More information and a freedownload is found here.
• SWMM – The Storm Water Management Model is produced by the U.S. EnvironmentalProtection Agency and designed for urban centers. It is also free of charge.
• MIKE11 – The Microcomputer-based Modeling System for Rivers and Channels is produced bythe Danish Hydrology Institute and is provided in several different languages.
• TR – The Technical Release models were developed by the U.S. Department of Agriculture,Natural Resources Conservation Service and are provided free of charge. WinTR-55 wasdesigned to be run with smaller watersheds.
3.3.4.3 Hydraulic Models (focused on estimation of flood elevation)
• HEC-2 and HEC-RAS – The Hydrologic Engineering Center models are produced by the U.S.Army Corps of Engineers and are provided free of charge. More information and a freedownload are found here.
• WSPRO – The Water-Surface PROfile computations model was produced by the U.S. GeologicalSurvey and is free of charge. It can accommodate flow through bridges and culverts.
• MIKE11 and SWMM also contain hydraulic models.
Coastal Flood Assessment
In a coastal flood hazard assessment, three components must be understood: (1) the coastal erosionprocess, (2) the wave height analysis, and (3) the wave run-up analysis. Sea level rise is producing higherrates of erosion and this process needs to be understood and quantified at the beginning of a coastal floodor hurricane surge assessment. The wave height and run-up analysis will result in a coastal flood elevation.
Illustrative coastal models appropriate for conducting a coastal flood assessment are listed below. Thesemodels require specialized expertise to run and many of the models are focused on particularenvironments and geographic scales. An engineer should be consulted before selecting a model.17
16 When selecting a climate risk consultant, there are several types of experience which should be verified,including past performance: (1) using downscaled climate data, (2) using applicable hazard models, (3) usingapplicable environmental models, (4) identifying and evaluating adaptation strategies, and (5) familiarity with cost-benefit analysis.17 When selecting a climate risk consultant, there are several types of experience which should be verified,including past performance: (1) using downscaled climate data, (2) using applicable hazard models, (3) using
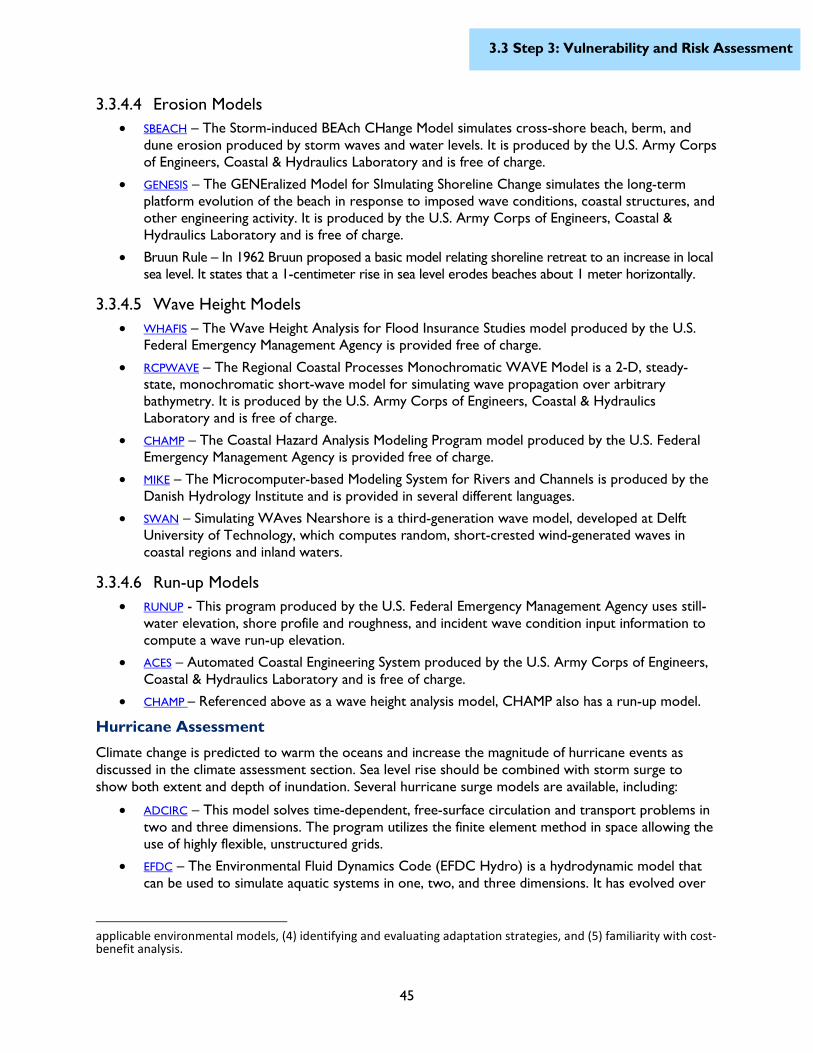
45
3.3 Step 3: Vulnerability and Risk Assessment
3.3.4.4 Erosion Models
• SBEACH – The Storm-induced BEAch CHange Model simulates cross-shore beach, berm, anddune erosion produced by storm waves and water levels. It is produced by the U.S. Army Corpsof Engineers, Coastal & Hydraulics Laboratory and is free of charge.
• GENESIS – The GENEralized Model for SImulating Shoreline Change simulates the long-termplatform evolution of the beach in response to imposed wave conditions, coastal structures, andother engineering activity. It is produced by the U.S. Army Corps of Engineers, Coastal &Hydraulics Laboratory and is free of charge.
• Bruun Rule – In 1962 Bruun proposed a basic model relating shoreline retreat to an increase in localsea level. It states that a 1-centimeter rise in sea level erodes beaches about 1 meter horizontally.
3.3.4.5 Wave Height Models
• WHAFIS – The Wave Height Analysis for Flood Insurance Studies model produced by the U.S.Federal Emergency Management Agency is provided free of charge.
• RCPWAVE – The Regional Coastal Processes Monochromatic WAVE Model is a 2-D, steady-state, monochromatic short-wave model for simulating wave propagation over arbitrarybathymetry. It is produced by the U.S. Army Corps of Engineers, Coastal & HydraulicsLaboratory and is free of charge.
• CHAMP – The Coastal Hazard Analysis Modeling Program model produced by the U.S. FederalEmergency Management Agency is provided free of charge.
• MIKE – The Microcomputer-based Modeling System for Rivers and Channels is produced by theDanish Hydrology Institute and is provided in several different languages.
• SWAN – Simulating WAves Nearshore is a third-generation wave model, developed at DelftUniversity of Technology, which computes random, short-crested wind-generated waves incoastal regions and inland waters.
3.3.4.6 Run-up Models
• RUNUP - This program produced by the U.S. Federal Emergency Management Agency uses still-water elevation, shore profile and roughness, and incident wave condition input information tocompute a wave run-up elevation.
• ACES – Automated Coastal Engineering System produced by the U.S. Army Corps of Engineers,Coastal & Hydraulics Laboratory and is free of charge.
• CHAMP – Referenced above as a wave height analysis model, CHAMP also has a run-up model.
Hurricane Assessment
Climate change is predicted to warm the oceans and increase the magnitude of hurricane events asdiscussed in the climate assessment section. Sea level rise should be combined with storm surge toshow both extent and depth of inundation. Several hurricane surge models are available, including:
• ADCIRC – This model solves time-dependent, free-surface circulation and transport problems intwo and three dimensions. The program utilizes the finite element method in space allowing theuse of highly flexible, unstructured grids.
• EFDC – The Environmental Fluid Dynamics Code (EFDC Hydro) is a hydrodynamic model thatcan be used to simulate aquatic systems in one, two, and three dimensions. It has evolved over
applicable environmental models, (4) identifying and evaluating adaptation strategies, and (5) familiarity with cost-benefit analysis.

46
3.3 Step 3: Vulnerability and Risk Assessment
the past two decades to become one of the most widely used and technically defensiblehydrodynamic models in the world.
• TABS-MD – This multidimensional numerical modeling system was one of the first widely usedcollections of programs designed for studying multidimensional hydrodynamics in rivers,reservoirs, bays, and estuaries. The hydrodynamic engine for the system is the RMA2 engine.RMA2 and RMA4 were written by Resource Management Associates and modified by WES.
These models require specialized expertise to run and many of the models are focused on particularenvironments and geographic scales. An engineer should be consulted before selecting a model.18
3.3.4.7 Consequence Assessment
Consequence assessment focuses on the characteristics of the people, environment, and infrastructureexposed to the hazard and determines an impact. The hazard assessment in 4.3.1 produces data onriverine and coastal flood depths, surge depths, and hurricane wind speeds. These outputs can then beused to calculate losses in terms of direct and indirect economic losses, population at risk, andenvironmental habitat impacts. It is important to consider not only infrastructure losses, but also howother social and environmental losses could impact the financial rate of return for the proposed project.
To convert the hazard assessment information into a loss estimate, a fragility curve also known as adamage function or a damage curve is used. In this case of flood risk, the flood depths are related to amean damage ratio (the damage sustained divided by the total value of the structure). Similar damagefunctions exist for different building types and different hazards. Wind hazards would apply estimatedwind speed data for loss estimates (instead of flood depth data).
An example from the Flood Insurance Administration of a flood damage function is shown in Figure 3-20. The graph shows that for different levels of water, there will be different levels of damage,corresponding to different building types and foundation types. This damage percentage is then used tocalculate a loss using the replacement value of a structure. Damage curves have been developed for theCaribbean region building stock in the CAPRA software described below. Other infrastructure, such asbridges, ports, and utilities also have unique damage functions. More information on the damagefunctions can be found in the U.S. Army Corps of Engineers Economic Guidance Memoranda.
Figure 3-20. Flood damage function.
18 When selecting a climate risk consultant, there are several types of experience which should be verified,including past performance: (1) using downscaled climate data, (2) using applicable hazard models, (3) usingapplicable environmental models, (4) identifying and evaluating adaptation strategies, and (5) familiarity with cost-benefit analysis.
Water Depth (ft.)
Da
ma
ge
(Pe
rce
nt)
47
3.3 Step 3: Vulnerability and Risk Assessment
The IFC climate risk pilot projects provide examples of risk assessment methodologies as they apply to:hydropower (run of the river), hydropower (reservoir), port, manufacturing, and agriculture. The two toolslisted below can be used to support this more detailed risk assessment:
• Central America Probabilistic Risk Assessment (CAPRA) – A free modular platform for riskanalysis and decision making using probabilistic for hazard and loss assessment in Latin America.This software now includes a climate change module.
• HAZards U.S. (HAZUS) – HAZUS is risk assessment software which contains models forestimating potential losses from earthquakes, floods, and hurricanes. HAZUS uses GIStechnology to estimate physical, economic, and social impacts of disasters. Although theprogram is US-based, some damage functions may be extracted from the model and used in aCaribbean assessment as long as the building types are similar (for example, HAZUS has beensuccessfully used in Puerto Rico due to the similarity in building construction types).
48
4.0 Conclusions
4.0 ConclusionsThis paper provides a summary of the methods and information needed to perform a climate changerisk assessment, specifically tailored to the Caribbean region, and focused towards the types of projectsIDB might support. A fact sheet was also developed that summarizes the disaster and climate changerisk assessment approach and describes the tools that are recommended to help project proponentsconduct a climate change risk assessment.
Climate projection data available for the region are in the public domain, and are often easily accessiblethrough Web-based interfaces. Key data sources for typical climate change risk assessments arepresented in this paper. It is expected that additional sources and levels of detail of data will increasinglybecome available. An examination of the climate projections for the Caribbean region and elsewhereshows that there is near-term climate variability, with substantial departures from current conditionsbeginning to occur by mid-21st century and beyond. Although certain uncertainties are associated withquantifying climate change impacts, there is a pressing need to plan for these impacts.
Insurance products are available in the commercial market to address known extreme events such ashurricanes and intense rainfall events. The Caribbean Catastrophe Risk Insurance Facility (CCRIF)provides country-level insurance for such major events, but to the best of our knowledge, these addresscurrent risks, rather than risks due to events that might occur a decade or two into the future.Although insurance provides coverage from catastrophic events in the near-term, looking over the long-term, a project’s design and adaptive capacity must ensure some level of resilience from future climatechange-associated events.
The climate change risk assessment for a new project, for existing infrastructure, or even for a specificsector of the economy (such as tourism or transportation) can be performed at different levels of detaildepending on the project scope, resources available, and the potential risk due to the climate changeimpacts. At this time, it is safe to assume that the projected climate database available will be the sameno matter what level of risk assessment is performed. This is because climate modeling is performedglobally by multiple modeling groups, and it is not likely that any such effort will be replicated to servelocal needs. Even regional climate modeling, when performed over a suite of multiple models, is unlikelyto be developed at a local level. Given the same climate data, however, climate change risk assessmentscan vary greatly in the level of detail with which the impacts are assessed. Typically, each sector will havedetailed tools for designing the pertinent infrastructure, and these detailed tools will need to considerwhat the response will be if climatic conditions will be different from the historical range. For example,this might include the largest storm a roadway is designed to withstand, or the level of storm surge acoastal facility such as an oil handling terminal is protected against, or the level of drought a water supplysystem is designed for. These analyses must focus on the location-specific design elements of theinfrastructure or investment project in question. This paper is not focused on this detailed level ofanalysis, but provides a general roadmap that can be followed if specific investments require this level ofeffort.
Although climate risks to a project can be quantified within bounds of uncertainty, no effective guidelineexists to help determine an acceptable level of “climate-proofing” for a specific infrastructure or asystem (such as a city or a transportation network). Design for a future project can identify a range ofoptions at different costs, such that a project proponent or lender can identify the best cost-benefitoption. Adaptation of existing infrastructure can consider a variety of operational and structuralmodifications, again with a range of costs, such that a reasonable balance can be achieved between costsand benefits. Because of the complexity and diversity of projects with the projects with which IDB isinvolved, workable guidelines for different sectors cannot be established a priori, but are expected toevolve as different climate risk assessments are performed within a general framework such as thatpresented in this document. Regardless of the approach chosen, it is important to emphasize the rapidly

49
4.0 Conclusions
evolving nature of climate science, particularly in the domain of extreme events. Reductions inuncertainty, or more specific projections for the Caribbean, will have a strong bearing on future riskassessment processes and the development of future guidelines for climate resilience.

50
5.0 Recommendations for Next Steps
5.0 Recommendations for Next StepsThe input of IDB staff (including that of the ESG, Climate Change and Sustainability Division, andInvestment Officers) and other stakeholders (such as the World Bank/IFC and private sector projectsponsors) would strengthen this paper and help to refine and support implementation of the proposedapproach. The approach is structured as a tiered process, and provides the flexibility to conduct a low-cost project screening, a basic vulnerability assessment, or more complex risk assessment depending onthe projected climate change risks to individual projects. The study team recommends that the criteriafor assessing climate change risk and whether a project proponent should move to the next step in theassessment process is further defined in consultation with the IDB ESG.
Additional recommendations for next steps are provided below. It should be noted that these are consideredadditional measures that IDB’s ESG could take to strengthen the utility of this guidance. The study teamrecognizes that the recommendations are subject to IDB ESG programming and institutional discretion.
Intersection of climate change planning and IDB standards and processes.Additional guidance on where/how climate change risk assessment intersects with IDB’senvironmental and social safeguard requirements, as well as with the project cycle for non-sovereign guaranteed operations, would better assist private sector project sponsors inunderstanding and meeting IDB borrowing requirements.
Internal capacity-building on climate change risk. It will be important that IDB staffand independent reviewers are knowledgeable of climate risks and mitigation to ensure thatthe climate change risk process is effectively carried out (risk realized, mitigation optionsidentified and implemented). Developing training programs on climate change and riskassessment, creating platforms for collaboration, and sharing lessons learned and commonproblems could be useful in building internal capacity.
Conducting one or more pilot projects to refine the proposed approach. It isrecommended that the climate change risk assessment approach is tested on a pilot projectbasis to ensure effectiveness and utility. A pilot project could evaluate the strengths andlimitations of the data and methodologies applied and uncertainties associated with themodeling and data inputs/outputs. Pilot projects can be designed several different ways; twoare suggested below (which could also be combined):
— Evaluate effectiveness of project screening, basic, and in-depth vulnerabilityassessment results. Compare the results of each type of assessment within thecontext of a specific project and project site.
— Assess the approach and tools across multiple sectors and geographic locations.Compare the modeling and data inputs/outputs across different sectors (such ascoastal oil and gas infrastructure versus inland infrastructure project).
External capacity-building on climate change risk assessment process and tools.Raising the awareness of climate change risks and providing further guidance on how toconduct a climate change risk assessment could strengthen the results of individual projectassessments and also assist the private sector with better conceptualizing projects.Identifying lessons learned from other institutions and exchanging experiences with themwould facilitate the integration of best practices.

51
6.0 References
6.0 ReferencesBBC. 2009. Average and Record Conditions at Bridgetown, Barbados. BBC Weather. Archived from the
original on February 20, 2007.
Benestad, R. E. 2001. A comparison between two empirical downscaling strategies. International Journal ofClimatology 21(13): 1645‒1668.
Benson, C. and J. Twigg. 2007. Tools for Mainstreaming Disaster Risk Reduction. ProVentionConsortium Secretariat. Geneva Switzerland.
Biasutti, M., A.H. Sobel, S.J. Camargo, and T.T. Creyts. 2012. Projected changes in the physical climate ofthe Gulf Coast and Caribbean. Climatic Change 112(3‒4): 819‒845.
Bruun, P. 1962. Sea-level rise as a cause of shore erosion. Journal of the Waterways, Harbors, and CoastalEngineering Division 88(1‒3):117‒130.
Bueno, B., C. Herzfeld, E. Stanton, F. Ackerman. 2008.The Caribbean and Climate Change: The Costs ofInaction. Accessed January 2013. http://www.gdae.org/CaribbeanClimate.html.
Caribbean Community Secretariat. 2008. Caribbean Risk Management Guidelines for Climate ChangeAdaptation Decision-Making. Caribbean Community Secretariat, Belize.
Economics and Climate Adaptation Working Group. 2009. Shaping Climate-Resilient Development: AFramework for Decision-making. Accessed December 2013.http://ccsl.iccip.net/climate_resilient.pdf.
EM-DAT: The OFDA/CRED International Disaster Database. Université catholique de Louvain, Brussels,Belgium. Accessed December 2013. http://www.emdat.be/country-profile.
Emanuel K.A. 1987. The dependence of hurricane intensity on climate. Nature 326: 483–485.
Fussel, H.M., and R.J.T. Klein. 2006. Climate change vulnerability assessments: an evolution of conceptualthinking. Climatic Change 75: 301‒329. doi: 10.1007/s10584-006-0329-3.
GIZ (Deutsche Gesellschaft für Internationale Zusammenarbeit). 2011. Climate Proofing for Development”Adapting to Climate Change, Reducing Risk. Accessed December 2013.http://www.preventionweb.net/files/globalplatform/entry_bg_paper~giz2011climateproofing.pdf.
Holland G.J. 1997. The maximum potential intensity of tropical cyclones. Journal of the AtmosphericSciences 54: 2519–2541.
IDB (Inter-American Development Bank). 2004. Evaluation of the Bank’s Policy and Operational PracticeRelated to Natural and Unexpected Disasters. Office of Evaluation and Oversight. Document RE-292. Washington, D.C: Inter-American Development Bank, 2004.
IDB. 2006. IDB Environmental, Social Safeguards and Disclosure Policies and Implementation Guidelines,Sustainable Development Department. Washington, DC: IDB.
IDB. 2007a. Implementation Guidelines for the Environment and Safeguards Compliance Policy. Availableonline: <http://idbdocs.iadb.org/wsdocs/getdocument.aspx?docnum=35597106>.
IDB. 2007b. Disaster Risk Management Policy. Available online:<http://idbdocs.iadb.org/wsdocs/getdocument.aspx?docnum=35004515>.
IDB. 2008. Disaster Risk Management Policy Guidelines. Available online: <-http://idbdocs.iadb.org/wsdocs/getdocument.aspx?docnum=360026>.

52
6.0 References
IFC (International Finance Corporation). 2010. Climate Risk and Business. Accessed December 2013.http://www.ifc.org/wps/wcm/connect/09deed804a830d0f85e6ff551f5e606b/ClimateRisk_Business.pdf?MOD=AJPERES.
IPCC (Intergovernmental Panel on Climate Change) TAR WG2 (2001), McCarthy, J. J.; Canziani, O. F.;Leary, N. A.; Dokken, D. J.; and White, K. S., ed., Climate Change. 2001. Impacts, Adaptation andVulnerability, Contribution of Working Group II to the Third Assessment Report of theIntergovernmental Panel on Climate Change, Cambridge University Press, ISBN 0-521-80768-9(pb: 0-521-01500-6).
Intergovernmental Panel on Climate Change (IPCC). 2007. Climate Change 2007: Synthesis Report.Contribution of Working Groups I, II and III to the Fourth Assessment Report of theIntergovernmental Panel on Climate Change, IPCC.
IPCC (Intergovernmental Panel on Climate Change). 2007. Climate Change 2007: The Physical Basis.Contribution of Working Group I to the Fourth Assessment Report of the IntergovernmentalPanel on Climate Change. Ed. S. Solomon, D. Qin, M. Manning, Z. Chen, M. Marquis, K.B. Averyt,M. Tignor, and H.L. Miller. Cambridge, UK: Cambridge University Press. 996 pp.
IPCC. 2012. Managing the Risks of Extreme Events and Disasters to Advance Climate ChangeAdaptation. A Special Report of Working Groups I and II of the Intergovernmental Panel onClimate Change. Cambridge, UK and New York, Cambridge University Press.
IPCC, 2013: Summary for Policymakers. In: Climate Change 2013: The Physical Science Basis.Contribution of Working Group I to the Fifth Assessment Report of the Intergovernmental Panelon Climate Change [Stocker, T.F., D. Qin, G.-K. Plattner, M. Tignor, S.K. Allen, J. Boschung, A.Nauels, Y. Xia, V. Bex and P.M. Midgley (eds.)]. Cambridge University Press, Cambridge, UnitedKingdom and New York, NY, USA.
IPCC. 2014. Climate Change 2014: Impacts, Adaptation, and Vulnerability. Part A: Global and SectoralAspects. Contribution of Working Group II to the Fifth Assessment Report of theIntergovernmental Panel on Climate Change [Field, C.B., et al]. Cambridge, United Kingdom andNew York, NY, USA: Cambridge University Press.
Iqbal, F. and P. Suding. 2011. Options Paper: Reducing Climate Risk in IDB Operations. IDB Technical Note488, Inter-American Development Bank, Washington, D.C.
Jones, R., and B. Preston. 2011. Adaptation and Risk Management; Focus Article. John Wiley and Sons, Inc.Accessed December 2013. http://wires.wiley.com/WileyCDA/WiresArticle/wisId-WCC97.html.
Knutson T.R., J. McBride, J. Chan, K.A. Emanuel, G. Holland, C. Landsea, I. Held, J. Kossin, A.K.Srivastava, and M. Sugi. 2010. Tropical cyclones and climate change. Nature Geoscience 3:157–163.doi: 10.1038/ngeo779.
Mearns, L. O., M. Hulme, T. R. Carter, R. Leemans, M. Lal, and P. Whetton. 2001. Climate ScenarioDevelopment. In Climate Change 2001: The Scientific Basis, ed. J. T. Houghton, pp. 739‒768.Cambridge University Press, New York, NY.
National Academy of Sciences. 2012. Sea-Level Rise for the Coasts of California, Oregon, and Washington:Past, Present, and Future. The National Academies Press, Washington, D.C.
National Oceanic and Atmospheric Administration (NOAA). 2008. Climate Adaptation for CoastalCommunities. NOAA Coastal Services Center, Charleston, SC.http://www.csc.noaa.gov/digitalcoast/training/climate-adaptation.

53
6.0 References
National Oceanic and Atmospheric Administration (NOAA). 2013. Caribbean Strategy. AccessedDecember 2013. http://www.regions.noaa.gov/secar/wp-content/uploads/2013/05/NOAA-Caribbean-Strategy-for-Public-Review-May-2013.pdf.
National Research Council (NRC). America's Climate Choices: Panel on Adapting to the Impacts ofClimate Change. National Academy of Sciences, 2010. Available online:<www.nap.edu/catalog.php?record_id=12783>.
OECD(Organisation for Economic Co-Operation and Development). 2009. Integrating Climate ChangeAdaptation into Development Co-operation, Policy Guidance. Accessed January 2014.http://www.oecd.org/dac/43652123.pdf.
Racsko, P., L. Szeidl, and M.A. Semenov. 1991. A serial approach to local stochastic weather models.Ecological Modelling 57: 27‒41.
Richardson, C.W. 1981. Stochastic simulation of daily precipitation, temperature and solar radiation.Water Resources Research 17: 182‒190.
Semenov, M.A., R.J. Brooks, E.M. Barrow and C.W. Richardson. 1998. Comparison of WGEN andLARS-WG stochastic weather generators for diverse climates. Climate Research 10: 95-107.
Simpson, M., D. Scott, and U. Trotz. 2011. Climate Change’s Impact on the Caribbean’s Ability to SustainTourism, Natural Assets, and Livelihoods. (Technical Note: IDB-TN-238), Inter-AmericanDevelopment Bank, Washington, D.C.
Smit, B., and O. Pilifosova. 2001. Adaptation to Climate Change in the Context of SustainableDevelopment and Equity. Chapter 18 in Climate Change 2001: Impacts, Adaptation, and Vulnerability.Contribution of Working Group II to the Third Assessment Report of the IntergovernmentalPanel on Climate Change. Cambridge University Press, Cambridge, UK.
Smith, J.B., et al. 2001. Vulnerability to Climate Change and Reasons for Concern: A Synthesis, Sec.19.6.1. Chapter 19 in The Irregular Face of Climate Change. IPCC TAR WG2 2001.
Swiss Agency for Development and Cooperation. 2010. Climate, Environment, and Disaster Risk ReductionIntegration Guidance. Accessed December 2013. http://www.sdc-drr.net/cedrig.
Trenberth, K. 2010. More Knowledge, Less Certainty. Vol. 4 in Nature Reports Climate Change.
Vecchi GA, Knutson TR. 2008. On estimates of historical North Atlantic tropical cyclone activity. Journalof Climate 21: 3580‒3600. doi: 10.1175/2008JCLI2178.1.
Vermeer, M., and S. Rahmstorf. 2009. Global sea level linked to global temperature. In Proceedings of theNational Academy of Sciences 106(51): 21527‒21532.

54
Annex 1: Tools and Resources
Annex 1:Tools and Resources
Tools and Resources for Conducting a Climate ChangeRisk Assessment in the Caribbean
Tool/Resource GeneralResource
Relevant Step
Step 1:Screening
Step 2:Data
Collection
Step 3a:Basic
VulnerabilityAssessment
Step 3b:Complex
RiskAssessment
ADCIRC - hurricane model
Automated Coastal Engineering System (ACES) - run-upmodel
Caribbean Climate Online Risk and Adaptation TooL(CCORAL) - Guidance and regional climate data
Caribbean Community Climate Change Centre - Guidancedocuments and regional climate data
Caribbean Disaster Information Network – for historical dataon hazard events
Caribbean Disaster Mitigation Project (CDMP) – for stormsurge data
Caribbean Hurricane Network – for hurricane data
Caribbean Institute for Meteorology and Hydrology (CIMH)
Central America Probabilistic Risk Assessment – for riskassessment/decision support
Coastal Hazard Analysis Modeling Program model (CHAMP)- wave height and run-up model
Economic Guidance Memoranda – for consequenceassessment
Effects of climate change on the coast of Latin America andthe Caribbean – Guidance documents
Effects of climate change on the coast of Latin America andthe Caribbean – Database
Environmental Fluid Dynamics Code (EFDC Hydro) -hurricane model
EQUECAT - for storm surge and flooding
GENEralized Model for Simulating Shoreline Change model(GENESIS)– erosion model
Global Risk Data Platform - for hurricane and flood data
Global Sea Level Observing System – for tidal gauges
Google Earth software
HAZards US (HAZUS) – for complex risk assessment
HEC-1 and HEC-HMS - hydrologic model
HEC-2 and HEC-RAS models - hydraulic model
IDB-World Bank Pilot Program for Climate Resilience in theCaribbean – Guidance documents
Intergovernmental Panel on Climate Change - Guidancedocuments
International Finance Corporation Climate Risk Pilot Projects– for guidance on complex risk assessment

55
Annex 1: Tools and Resources
Tools and Resources for Conducting a Climate ChangeRisk Assessment in the Caribbean
Tool/Resource GeneralResource
Relevant Step
Step 1:Screening
Step 2:Data
Collection
Step 3a:Basic
VulnerabilityAssessment
Step 3b:Complex
RiskAssessment
LARS- Weather Generator (LARS-WG) – serial weathergenerator
Microcomputer-based Modeling System for Rivers andChannels (MIKE) - wave height model
Microcomputer-based Modeling System for Rivers andChannels-11 (MIKE 11) - hydrologic and hydraulic model
National Communications for the United Nations FrameworkConvention on Climate Change (UNFCCC) - Guidancedocuments on country vulnerability and adaptation priorities
North American Regional Climate Change AssessmentProgram (NARCCAP) - for dynamically downscaledprojections
Permanent Service for Mean Sea Level (PSMSL) – for tidalgauge data
Providing Regional Climates for Impacts Studies (PRECIS) -for regional downscaled projection for the Caribbean
Regional Coastal Processes Monochromatic WAVE Model(RCWAVE) - wave height model
RUNUP- run-up model
Sea Level Station Monitoring Facility – for tidal gauges
Shuttle Radar Topography Mission (SRTM) - for LIDAR data
Simulating WAves Nearshore (SWAN) - wave height model
Storm-induced BEAch CHange Model (SBEACH) – erosionmodel
TABS-MD- hurricane model
Technical Release models (TR) - hydrologic model
The International Disaster Database, also referred to asthe Emergency Events Database (EM-DAT) – for historicaldata on hazard events
The Storm Water Management Model (SWMM) - hydrologicand hydraulic model
Tsunami Alert System - for tidal gauge data
Water-Surface PROfile computations model (WSPRO) -hydraulic model
Wave Height Analysis for Flood Insurance Studies model(WHAFLS) – wave height model
World Bank’s Climate Change Knowledge Portal - Guidancedocuments and regional climate data
WorldClim – for CMIP5 projections