climate change and the sustainability of agricultural productivity in ...
98
GABRIELLE FERREIRA PIRES CLIMATE CHANGE AND THE SUSTAINABILITY OF AGRICULTURAL PRODUCTIVITY IN BRAZIL Tese apresentada à Universidade Federal de Viçosa, como parte das exigências do Programa de Pós- Graduação em Meteorologia Aplicada, para obtenção do título de Doctor Scientiae. VIÇOSA MINAS GERAIS – BRASIL 2015
Transcript of climate change and the sustainability of agricultural productivity in ...

GABRIELLE FERREIRA PIRES
CLIMATE CHANGE AND THE SUSTAINABILITY OF AGRICULTURAL PRODUCTIVITY IN BRAZIL
Tese apresentada à Universidade Federal de Viçosa, como parte das exigências do Programa de Pós-Graduação em Meteorologia Aplicada, para obtenção do título de Doctor Scientiae.
VIÇOSA MINAS GERAIS – BRASIL
2015


ii
À minha mãe Margarida Ferreira Pires.
Ao meu pai Sebastião Tarcísio Pires.

iii
“Não seja o de hoje.
Não suspires por ontem....
Não queiras ser o de amanhã.
Faze-te sem limites no tempo. ”
Cecília Meireles

iv
ACKNOWLEDGMENTS
À Deus, por tantas bênçãos em minha vida e por dar-me força, proteção, sabedoria
e saúde.
À minha mãe Margarida, ao meu pai Tarcísio e à minha irmã Monique pela
compreensão, pelo amor incondicional, pelo apoio constante, pelos ensinamentos e
incentivos e por toda a confiança depositada em mim.
Ao meu marido e melhor amigo Ulisses (Uli), por todo o amor e leveza, pela
fortaleza e proteção, pelo essencial incentivo e apoio nas horas de dificuldade, pela
dedicação, pelos exemplos de pessoa e de caráter.
Ao meu orientador, Professor Marcos Heil Costa, me faltam palavras para
agradecer todos os ensinamentos e oportunidades de aprendizagem que me foram
proporcionadas durante a carreira científica. Prof. Marcos é meu grande exemplo de
cientista e dedicação à docência, e fez-me fascinar pela carreira. Agradeço imensamente
pela amizade, por toda a confiança depositada em mim, pelos ensinamentos preciosos,
pelo apoio profissional e pessoal, pelos exemplos de profissionalismo e competência. O
sentimento é de profunda gratidão e admiração.
Ao Gabriel e à Livia Brumatti, agradeço por toda a ajuda, amizade, dedicação e
pró-atividade. Foram muito valiosas a convivência e a troca de experiências. Aprendi
muito com vocês nesses anos, e sem vocês esta jornada não teria sido a mesma.
Aos demais colegas do Grupo de Pesquisas em Interação Atmosfera-Biosfera da
UFV, Lívia, Pauline, Vítor, Emily, Aninha, Raphael, Fabiana, Carol, Matheus, Telmo,
Fernando, Argemiro, Hewlley, Carla, Leydimere, Marcos Paulo, Ana Cláudia e Richard,
pela agradável convivência e por toda a ajuda, incentivos, disponibilidade e parceria.
À querida amiga Paula, companheira de república por tantos anos, pelas risadas,
parceria e pelo carinho da convivência.

v
Agradecimentos especiais a Victor Brovkin (Max Planck Institute), Chris Jones e
Spencer Liddicoat (Hadley Centre), e Etsushi Kato (The Institute of Applied Energy,
Japan) por toda a atenção e pela ajuda com os dados do experimento LUCID.
Ao Milton Pereira e sua equipe de coleta dos dados relativos ao cultivo de
Brachiaria Brizantha, pelo fornecimento dos dados.
À Universidade Federal de Viçosa e ao Departamento de Engenharia Agrícola pela
oportunidade de concluir o Doutorado em Meteorologia Aplicada.
Ao Conselho Nacional de Desenvolvimento Científico e Tecnológico (CNPq),
pela concessão de bolsa de estudos. À Fundação Gordon and Betty Moore (Moore
Foundation), pelo apoio financeiro.
A todos os professores do programa de pós-graduação em Meteorologia
Agrícola/Aplicada, pelos conhecimentos transmitidos.
À Graça, excelente secretária da Meteorologia Aplicada/Agrícola, pela ajuda e
amizade ao longo do Doutorado.
A todos que contribuíram direta ou indiretamente para a realização desse trabalho.

vi
BIOGRA PHY
GABRIELLE FERREIRA PIRES, filha de Sebastião Tarcísio Pires e
Margarida Ferreira Pires, nasceu em 02 de janeiro de 1987, na cidade de Belo
Horizonte - MG.
Iniciou a graduação em Engenharia Ambiental em março de 2005, obtendo o
título de Engenheira Ambiental em janeiro de 2010 pela Universidade Federal de
Viçosa (UFV).
Em fevereiro de 2012 concluiu o mestrado em Meteorologia Agrícola na
Universidade Federal de Viçosa (UFV).
Em março de 2012 iniciou o curso de pós-graduação em nível de doutorado,
em Meteorologia Aplicada na Universidade Federal de Viçosa (UFV).

vii
CONTENTS
LIST OF FIGURES ix
LIST OF TABLES xi
LIST OF SYMBOLS xii
LIST OF ACRONYMS xiv
RESUMO xvi
ABSTRACT xviii
GENERAL INTRODUCTION 1
CHAPTER 1 INCREASED CLIMATE RISK IN BRAZILIAN DOUBLE CROPPING
AGRICULTURE SYSTEMS UNTIL 2050 AND IMPLICATIONS FOR LAND USE
IN NORTHERN BRAZIL 6
1.1 INTRODUCTION 6
1.2 MATERIALS AND METHODS 10
1.2.1 Productive regions 10
1.2.2 Climate models and input data 12
1.2.3 Crop model description 16
1.2.4 Experiment design 17
1.3 RESULTS AND DISCUSSION 24
1.3.1 Effects of climate change in ESOY and HSOY productivity 24
1.3.2 Implications for double-cropping systems in central-northern Brazil 31
1.4 CONCLUSIONS 35
CHAPTER 2 EFFECTS OF CLIMATE CHANGE IN PASTURE PRODUCTIVITY
AND IMPLICATIONS FOR LAND USE IN BRAZIL 39
2.1 INTRODUCTION 39
2.2 MATERIALS AND METHODS 41

viii
2.2.1 Productive regions 41
2.2.2 Climate models and input data 43
2.2.3 Pasture model description 44
2.2.4 Experiment design 46
2.3 RESULTS 47
2.4 DISCUSSION AND CONCLUSIONS 51
CHAPTER 3 GENERAL CONCLUSIONS 55
3.1 THESIS OVERVIEW 55
3.2 CONCLUSIONS 57
3.3 RECOMMENDATIONS FOR FUTURE RESEARCH 61
GENERAL REFERENCES 63
APPENDIX A 69

ix
LIST OF FIGURES
Figure 1.1 – Analyzed productive regions. Each 1o x 1o pixel shown here had at least 10%
of its area planted with soybean in 2012 according to Dias et al. (submitted).
11
Figure 1.2 - Daily mean precipitation (mm/day) for the period 1979-2000 during the
phases of the South American Monsoon System (SAMS). Data is shown for
Global Precipitation Climatology Project data (GPCP) (a-d) and simulated by
MIROC-ESM (e-h), MRI-CGCM3 (i-l), NorESM1-M (m-p) and HadGEM2-
ES (q-t). 14
Figure 1.3 ‒ Daily mean precipitation for each month of the period 1979-2000 as in Global
Precipitation Climatology Project (GPCP) and as simulated by the models:
MIROC-ESM, MRI-CGCM3, NorESM1-M and HadGEM2-ES. The monthly
averages are calculated over each one of the soybean productive regions in
Brazil (Figure 1.1). The average results of the model ensemble is also shown
15
Figure 1.4 – Scenarios of total Amazon and Cerrado deforested area according to RCP8.5
as implemented in models HadGEM2-ES and MIROC-ESM and to Pires and
Costa (2013). 23
Figure 1.5– Percentage change in soybean yield from 2011-2020 to 2041-2050 after
climate change. In (a) and (b) atmospheric composition and land use trajectories
are according CMIP5’s RCP8.5 scenario. In (c) and (d), atmospheric
composition trajectories are according to CMIP5’s RCP8.5 scenario, but land
use trajectories are according to Pires and Costa (2013) tropical deforestation
scenarios. 27
Figure 1.6 – Change in precipitation (%) from 2011-2020 to 2041-2050 for the months of
September, October, November and December for the different soybean
productive regions considered in this study, as in RCP8.5 (circles and solid lines
are the average and the models range, respectively) and LUCID+PC13 5

x
(triangles and dashed lines are the average and the models range, respectively).
30
Figure 1.7 – Soybean productivity change [Yd(2041-2050) / Y09/25(2011-2020), where d
are the planting dates assessed in this study] after climate change. Full black
boxes (circles) represent soybean planting dates that lead to a high probability
of double-cropping viability according to RCP8.5 (LUCID+PC13). Full gray
boxes (circles) represent soybean planting dates that lead to a medium
probability of double-cropping viability, also according to RCP8.5
(LUCID+PC13). Empty boxes (circles) represent soybean planting dates that
may lead to unviable double-cropping according to RCP8.5 (LUCID+PC13).
Dashed boxes indicate the sowing windows. 34
Figure 2.1 – Analyzed productive regions. Each 1o x 1o pixel shown here had at least 10%
of its area covered by pasturelands in 2012. 42
Figure 2.2 – Daily mean precipitation for each month of the period 1979-2000 as in GPCP
and as simulated by the models: MIROC-ESM, MRI-CGCM3, NorESM1-M
and HadGEM2-ES. The monthly averages are calculated over each one of the
soybean productive regions in Brazil. 44
Figure 2.3 – Percentage change in pasture productivity from 2011-2020 to 2041-2050 after
climate change. In (a) atmospheric composition and land use trajectories are
according CMIP5’s RCP8.5 scenario. In (b) atmospheric composition
trajectories are according to CMIP5’s RCP8.5 scenario, but land use trajectories
are according to Pires and Costa (2013) tropical deforestation scenarios. 49
Figure 2.4 – Change in yearly precipitation (mm/yr) from 2011-2020 to 2041-2050 after
climate change to the most productive Brazilian regions, as in RCP8.5 (circles
and solid lines are the average and the models range, respectively) and
LUCID+PC13 5 (triangles and dashed lines are the average and the models
range, respectively). 51

xi
LIST OF TABLES
Table 1.1 – Main soybean productive regions in Brazil and their total production. Data for
Brazilian states are from IBGE (2015). Total Brazilian production in 2014 is
~8.68x10⁷ ton. 11
Table 1.2 – List of CMIP5 models used in this study 13
Table 1.3 – Change in soybean productivity from 2011-2020 to 2041-2050 for different
Brazilian productive regions, for short cultivars (1600 GDD) planted in Sep
25th (ESOY). In the second column, both atmospheric composition and land-
use change trajectories are according to RCP8.5. In the third column,
atmospheric composition is according to RCP8.5 and land use change is
according to (Pires and Costa, 2013). 28
Table 2.1 – Main cattle productive regions in Brazil and their total production
(IBGE, 2015). Total Brazilian production in 2014 is 2.12x10⁸ heads. 42
Table 2.2 – Change in pasture productivity from 2011-2020 to 2041-2050 for different
Brazilian productive regions. In the second column, both atmospheric
composition and land-use change trajectories are according to RCP8.5. In the
third column, atmospheric composition is according to RCP8.5 and land use
change is according to (Pires and Costa, 2013). 50

xii
LIST OF SYMBOLS
Cdf ‒ final daily climate input (emission + land use change scenario)
Cd ; LUCID ‒ daily LUCID climate variable
Cm ; A10C60 ‒ monthly mean climate for A10C60 Pires and Costa (2013) scenario
Cm ; scenario ‒ monthly mean Pires and Costa (2013) climate variable (A20C60 from 2009 to
2020; A30C65 from 2021 to 2035; A40C70 from 2036 to 2050)
ESOY ‒ Early soybean cultivar (average cycle duration of 100 days) planted right after
the end of the sanitary break (September 25th)
HSOY ‒ Highly productive soybeans
LUCID+PC13 ‒ Climate change scenario which assumes that climate change leads to a
radiative forcing of about 8.5 Wm- 2 in 2100, but deforestation scenarios are as Pires and
Costa (2013)
P ‒ Pasture productivity
P2011-2020 ‒ Average pasture productivity in 2011-2020
P2041-2050 ‒ Average pasture productivity in 2041-2050
PC13 ‒ Deforestation scenarios from Pires and Costa (2013)
RCP8.5 ‒ Climate change scenario which assumes that climate change leads to a radiative
forcing of about 8.5 Wm- 2 in 2100
Y ‒ Soybean productivity
Y2011-2020 ‒ Average soybean productivity in 2011-2020
Y2041-2050 ‒ Average soybean productivity in 2041-2050
YLUCID+PC13 ‒ ESOY productivity under the RCP8.5 scenario
YRCP8.5 ‒ ESOY productivity under the RCP8.5 scenario

xiii
YMAXLUCID+PC13 ‒ HSOY productivity under the RCP8.5 scenario
YMAXRCP8.5 ‒ HSOY productivity under the RCP8.5 scenario

xiv
LIST OF ACRONYMS
CB – Central Brazil
CMIP5 – Coupled Model Intercomparison Project Phase models 5
COP – Conference pf the Parties
EMBRAPA – Empresa Brasileira de Pesquisa Agropecuária
ESM – Earth System Model
FAO – Food and Agriculture Organization
GCM – Gridded Crop Models
GDD – Growing Degree-Days
GDP – Gross Domestic Product
GPCP – Global Precipitation Climatology Project data
HadGEM2-ES – Hadley Centre Global Environmental Model, version 2
IBGE – Brazilian Institute of Geography and Statistics.
IBIS – Integrated Biosphere Simulator
INLAND – Integrated Model of Land Surface Processes
INDC - intended Nationally Determined Contribution
IPCC AR5 – Intergovernmental Panel on Climate Change – Assessment Report #5
ITCZ – Inter Tropical Convergence Zone
LAI – Leaf Area Index
LUCID – Land-Use and Climate, Identification of Robust Impacts Project
MAE – Mean Absolute Error

xv
MATOPIBA – Maranhão, Tocantins, Piauí and Bahia
MT – Mato Grosso
MIROC-ESM – Model for Interdisciplinary Research on Climate
MRI-CGCM3 – the Meteorological Research Institute Coupled Atmosphere–Ocean
General Circulation Model, version 3
NB – Northern Brazil
NorESM1-M – Norwegian Earth System Model, version 1
PFT – Plant Functional Type
PPCDAm – Plano de Ação para Prevenção e Controle do Desmatamento na Amazônia
Legal
PPCerrado – Plano de Ação para Prevenção e Controle do Desmatamento e das
Queimadas no Cerrado
PRODES – Projeto de Monitoramento da Floresta Amazônica Brasileira por Satélite
SACZ – South Atlantic Convergence Zone
SAMS – South American Monsoon System
SB – Southern Brazil

xvi
RESUMO
PIRES, Gabrielle Ferreira, D.Sc., Universidade Federal de Viçosa, dezembro de 2015. Mudanças climáticas e a sustentabilidade da produtividade agrícola no Brasil. Orientador: Marcos Heil Costa.
Há uma grande expectativa global de que produção agrícola total do Brasil irá aumentar
como em nenhum outro país do mundo para atender ao aumento da demanda por alimentos
até 2050. Ao tentar atender a essa expectativa, o Brasil terá de enfrentar os efeitos de uma
grave mudança climática induzida pela mudança na composição atmosférica. Além disso,
se o futuro aumento da produção total se assemelhar a dinâmica do passado e a fronteira
agrícola avançar sobre biomas naturais como a Amazônia e o Cerrado, corremos um
grande risco. Estudos recentes indicam que o desmatamento em grande escala causa
mudanças significativas na disponibilidade de água no ambiente e poderia ter implicações
para os sistemas agrícolas. Esta tese investiga como a mudança climática e o
desmatamento adicional podem afetar a produtividade das principais commodities
exportadas pelo país até 2050: soja e pastagens para criação de gado. Foi utilizado um
modelo de culturas agrícolas para avaliar os efeitos do clima simulado por quatro modelos
do CMIP5 sob o cenário RCP8.5 do IPCC AR5 na produtividade de soja e pastagens.
Estes resultados foram contrastados com um segundo grupo de simulações que
representam os efeitos de cenários de desmatamento mais severos da Amazônia e do
Cerrado no clima regional. As simulações de soja indicam que, dentre as regiões mais
produtivas no centro-norte do Brasil, os efeitos das alterações climáticas são dependentes
das datas de plantio. A produtividade das cultivares de soja plantadas em setembro,
semeadas mais cedo por agricultores que optam por adotar sistemas safra-safrinha (duas
culturas no mesmo espaço no mesmo calendário agrícola) deve diminuir expressivamente.
No entanto, cultivares de soja que são plantadas em datas posteriores (novembro-
dezembro), semeadas principalmente por agricultores que optam por cultivar apenas uma
cultura no mesmo calendário agrícola, mostram um aumento da produtividade. A
diminuição da produtividade para datas precoces está relacionada a uma tendência de
diminuição mais acentuada da precipitação durante estes meses do ano, enquanto o
aumento da produtividade em datas mais tardias é devido a um déficit hídrico menor e os

xvii
efeitos positivos de um aumento da concentração de CO2 atmosférico. Regiões produtoras
do Sul do Brasil também mostram aumento da produtividade de soja até o meio do século,
independentemente da data de plantio. Para as regiões produtivas do centro e norte do
Brasil, movendo-se as datas de plantio de setembro para datas posteriores pode levar a um
aumento da produtividade de soja, mas diminui a probabilidade de adoção de sistemas
safra-safrinha. Além disso, cenários de desmatamento mais severos levam a um aumento
da perda de produtividade de soja. As simulações de produtividade de pastagens mostram
que, assim como no caso da soja, a produtividade das pastagens deve diminuir em regiões
centrais e do norte do Brasil e aumentar ligeiramente nas regiões sul. Além disso, níveis
mais elevados de desmatamento provocam maior redução da produtividade, e conduzem
a perdas de produtividade pelo menos duas vezes maiores. De acordo com todas as
simulações deste trabalho, as regiões mais afetadas são onde estão localizados os maiores
produtores agrícolas nacionais (Mato Grosso) ou em regiões que começaram a ser
exploradas mais recentemente e ainda guardam elevado potencial agrícola como o
MATOPIBA, indicando que investimentos do governo nessas regiões sem a consideração
apropriada dos riscos climáticos é uma estratégia de elevado risco. Finalmente, em face
às mudanças climáticas e com reduzida evidência de que o desmatamento na Amazônia e
no Cerrado estejam chegando a um fim, o Brasil deverá rever suas políticas agrícolas e
conservacionistas e alcançar imediatamente níveis de desmatamento zero nestes biomas,
e criar mecanismos para identificar e traçar soluções para adaptar sua agricultura às
mudanças climáticas.

xviii
ABSTRACT
PIRES, Gabrielle Ferreira, D.Sc., Universidade Federal de Viçosa, December, 2015. Climate change and the sustainability of agricultural productivity in Brazil. Adviser: Marcos Heil Costa.
There is a wide global expectation that Brazilian total agricultural output will increase like
no other country in the world to meet the projected higher demand for food until 2050.
While trying to meet this expectation, Brazil will face the effects of a severe climate
change induced by the change in atmospheric composition. In addition, if the future
increase in total production resembles the dynamics of the past and increasingly deforest
natural biomes as the Amazon and the Cerrado, we run a great risk, as recent studies
indicate that large-scale deforestation drives significant changes in water availability and
could have implication for agricultural systems. This thesis investigates how climate
change and additional deforestation may affect the productivity of the main commodities
exported by the country until 2050: soybeans and cattle pasture. We used a gridded crop
model to assess the effects of the climate simulated by four CMIP5 models under the
IPCC AR5 RCP8.5 scenario on soybean and pasture productivity. We contrasted these
results with a second group of simulations that account for the effects of more severe
Amazon and Cerrado deforestation scenarios on regional climate. Soybean simulations
show that, for central-northern Brazilian productive regions, the effects of climate change
are dependent on the planting dates. The productivity of soybean cultivars planted in late
September, sowed early by farmers who choose to adopt double-cropping systems (two
crops on the same land in the same agricultural calendar) is predicted to expressively
decrease. However, soybean cultivars that are planted in later dates (November-
December), mainly sowed by farmers who choose to grow only one crop in the agricultural
calendar, show increased productivity. The decrease in productivity for earlier dates is
related to a sharper decreasing trend in precipitation during these months of the year, while
the increased productivity in later dates is due to a smaller water deficit and the positive
effects of an increased atmospheric CO2 concentration. Southern Brazilian productive
regions also show increased soybean productivity until the middle of the century, despite

xix
the planting date. For central-northern Brazilian productive regions, moving planting
dates from September to later dates expressively increases soybean productivity, but
decreases the probability of adopting double-cropping systems. In addition, increased
levels of deforestation lead to increased soybean productivity loss. Pasture simulations
show that, as well as in the case of soybeans, pasture productivity is predicted to decrease
in central-northern Brazilian regions and slightly increase in southern regions. In addition,
higher deforestation levels causes further productivity decrease, and lead to at least twice
as large productivity losses. According to all simulations in this work, the regions most
affected are either the major Brazilian production region (Mato Grosso) or where the
exploration has begun more recently and still hold an expressive agriculture potential as
MATOPIBA, indicating that government investments in these regions without the proper
consideration of the climate risks are a high-risk strategy. Finally, in the face of climate
change and with little evidence that deforestation in Amazonia and Cerrado is ending,
Brazil needs to review its agriculture and conservation policies and immediately shift to a
new standard of zero deforestation in Amazonia and Cerrado, and create mechanisms to
identify and trace solutions to adapt its agriculture to climate change.

1
GENERAL INTRODUCTION
Historically, agribusiness is one of the pillars of Brazilian economy, representing
20-30% of its Gross Domestic Product (GDP) (CEPEA, 2014). Initially, Brazil was a
producer of large monocultures such as sugarcane and coffee, but diversified its
production and became the third largest agricultural exporter in 2010 (WTO, 2010),
exporting meat, fruit, grains and cereals. Brazil became a world leader in meat exportation,
but consequently replaced the Cerrado and Amazonia biomes by pasture (Leite et al.,
2012). The country is also a leader in soybean production, expanding farms from the
Southern region to Cerrado, and more recently, Amazonia.
Although vast areas of Amazonia and Cerrado have been replaced by farmlands,
Brazil still holds the largest share of tropical vegetation in the world (Lapola et al., 2014).
The country is also one of the few places on Earth with plenty of sun, water and land to
allow a major expansion in agriculture (Tollefson, 2010), and there is a wide expectation
that it will provide a great share of the increased global food production to meet the
increased demand until 2050, mainly meat and soybean. Global demand for food will
increase between 80 and 110% by 2050 (demand for bovine meat will increase more than
50% and demand for soybeans will increase more than 100%, (Alexandratos and
Bruinsma, 2012) as a consequence of the combined effects of demographic changes (~2.5
billion additional people), increased affluence and changes in diets. Brazilian agriculture
is predicted to grow faster than other countries, increasing by 40% from 2010 to 2019
(OECD-FAO, 2010). Nelson et al. (2014), who used agroeconomical models to assess the
2
future development of world agriculture, predicted that Brazil will have the largest
increase in planted area in the world until 2050.
It is clear that the increasing population and consumption will place
unprecedented demands on agriculture and natural resources (Foley et al., 2011).
However, if a significant part of the increase in agricultural production in Brazil occurs
by expanding the agriculture frontier and degrading biomes, we run a great risk. Recent
studies indicate that large-scale deforestation drives significant changes in water
availability and could have strong implications for agricultural production systems and
food security in some regions (Lawrence and Vandecar, 2015). Simulations show that the
replacement of forest or savanna by crops and pastures can cause a regional climate
change mainly characterized by significant reductions in local precipitation (Sampaio et
al., 2007; Costa et al., 2007; Walker et al., 2009; Pires and Costa, 2013) and increased dry
season length (Costa and Pires 2010).
In modelling studies, these effects on precipitation have a magnitude comparable
to the effects of a climate change induced by an alteration in atmospheric composition
(Costa and Foley, 2000; Oliveira et al., 2013). Such average and seasonal precipitation
change after large-scale deforestation, hereafter referred to as regional climate change,
could lower soil moisture and reduce yields in rainfed agriculture. In addition, these
changes in water availability previously predicted by modeling studies are increasingly
being confirmed by observational studies (e.g. Butt et al., 2011; Spracklen et al., 2012).
In other words, large-scale agriculture expansion in Brazil can degrade ecosystem services
it relies on, as climate regulation (Oliveira et al., 2013).

3
On the other hand, the pressure to reduce the Amazon deforestation rates has
increased both nationally and internationally, and the levels of deforestation in Amazonia
unprecedentedly decreased 77% from 2005 to 2011 when compared to 1995 to 2005 rates
(Nobre, 2012, PRODES 2015, Hansen et al., 2013), despite the high meat and soybean
prices in the international market. This reduction in the Amazon deforestation rates was a
consequence of a number of factors: state and federal governance, increased surveillance
and the voluntary adoption of soybean and meat moratorium (Boucher, 2014). However,
most of the curbed deforestation in the Amazon leaked to the Cerrado biome, the world
richest savanna in biodiversity and the main agriculture hotspot in Brazil, where
conservation policies are weak (Gibbs et al., 2015).
Nevertheless, subsequently to 8 years of dramatic reductions in Amazon
deforestation rates, in 2013 the decreasing trends reversed and started to increase again
until 2015, according to PRODES (Projeto de Monitoramento da Floresta Amazônica
Brasileira por Satélite). This increase in deforestation rates may also be related to the
revision of the Forest Code in 2012, that according to Soares-Filho et al. (2014), may
allow additional deforestation. Gibbs et al. (2015) also argue that, with the end of Soy
Moratorium by May 2016, Federal enforcement mechanisms are unlikely to effectively
keep low deforestation levels in the soy supply chain. Therefore, currently there is little
evidence that agriculture expansion is coming to a halt in Cerrado and Amazonia
(Bowman et al., 2012; Lapola et al., 2014).
In addition to the possibility of increased deforestation in Brazil until 2050,
Brazilian agriculture will face a great threat to its increasing productivity: the climate

4
change induced by the change in atmospheric composition, hereafter referred to as global
climate change. This type of climate change leads to a warming of the surface and is also
predicted to change precipitation patterns, especially during the dry season (Malhi et al.,
2008; Fu et al., 2013). On the other hand, besides the radiative effects of carbon dioxide
(CO2) as a greenhouse gas, there is also an additional effect on the vegetation
physiological processes as higher atmospheric CO2 concentrations may stimulate canopy
photosynthesis and decrease stomatal conductance (Sellers et al., 1996), increasing water
use efficiency, especially in C3 plants (as soybeans). However, according to Clark (2004),
the increased temperature and drought may limit these positive physiological effects
related to increased atmospheric CO2 concentration. Despite the scenario of global climate
change, strong negative effects are expected across the globe, especially higher levels of
warming at low latitudes (Rosenzweig et al., 2014).
Thus, the great challenge to national agriculture is to increase total output while
agricultural systems reduce the degradation of land, water, biodiversity and the climate to
meet sustainability needs, while this goal may be strongly affected by climate change
induced by the expansion of the agricultural frontier (regional climate change) and caused
by the change in atmospheric composition (global climate change). Therefore, the
objective of this thesis is to assess how climate change until the middle of this century
may affect the main agricultural commodities produced by Brazil: soybeans and cattle
planted pasture. These two crops currently represent at least 58% of the total agricultural
area in Brazil (Dias et al., submitted). This study is organized in two chapters. Chapter 1
investigates the effects of two climate change scenarios (the main difference between

5
scenarios is the level of deforestation in Amazonia and the Cerrado) in soybean
productivity, and contrasts its effects of early planted (as a first crop of double-cropping
systems) and late planted soybean cultivars. Chapter 2 investigates the effects of the same
climate change scenarios in planted pasture productivity.

6
CHAPTER 1
INCREASED CLIMATE RISK IN BRAZILIAN DOUBLE CROPPING AGRICULTURE SYSTEMS UNTIL 2050 AND IMPLICATIONS FOR LAND
USE IN NORTHERN BRAZIL
1.1 INTRODUCTION
Brazil is the second largest soybean producer and the third largest maize producer
in the world, contributing with 30% and 7%, respectively, of the global harvest of these
crops in 2013. While global production of these commodities nearly doubled from 1993
to 2013, Brazil soybean and maize production increased three-fold. This increase in
production in the last 20 years is greater than the increase observed in the United States,
the main producer of these commodities worldwide (FAO, 2015).
A great share of the dramatic increase in grain production during the last decade
in Brazil was possible due to the extensive adoption of double-cropping systems, in which
farmers sow a second crop (mainly maize, but cotton is also common) in the same space
after soybean has been harvested. The second crop production was not relevant until a
decade ago, but in 2014 it represented nearly 58% of the total maize harvested area, thanks
to the expressive technological progress that took place in the main productive regions in
the country (CONAB, 2015).
According to Arvor et al. (2014), double-cropping systems are favored by high
annual rainfall, a long rainy season and a low variability of the onset of the rainy season.

7
In some productive regions in the country, the rainy season is about 6-7 months long and
in order to the double-cropping system to be agronomically viable, it is necessary to
anticipate soybean cycle so that it is harvested in time for the second crop to grow, flower
and fill grains while climatic conditions (precipitation and temperature) are still favorable,
or more specifically, before the rainy season ends. Therefore, considering that the sowing
operation may be as long as 2 to 4 weeks since central-northern Brazilian soybean ranch
may be as extensive as 10,000 ha, farmers who aspire to use double-cropping systems
typically choose to sow early soybean cultivars and as soon as possible, right after the end
of the sanitary break, when rainfall conditions are just marginally favorable in central
Brazil.
The sanitary break, adopted by Brazil and Paraguay, is a 2-3 month period of
absence of living soybean plants in the field, as a measure to control infection with Asian
soybean rust (Phakopsora sp), and typically lasts from June 15 to September 15 or 30 in
Brazil. In the case of sowing soybean at the end of the sanitary break, even though climate
risk is relatively high, sanitary risk is small since the probability of infection with rust is
still low and early crops remain less time in the field exposed to infection. Another
incentive for farmers is the higher market prices for soybean harvested earlier than in the
peak of the harvesting season.
As a highly productive agricultural system, Brazilian production is projected to
rise, and meet part of the increasing global demand for food. The Food and Agriculture
Organization (FAO) estimates that Brazilian soybean and maize production may increase
37% and 13%, respectively, in the next 10 years (OECD/FAO, 2015). Similarly, the

8
Brazilian Ministry of Agriculture, Livestock and Supply (MAPA, from the acronym in
Portuguese) estimates that the production of these commodities will increase 33.9% and
26.3%, respectively, mainly for exportation. In order to be sustainable, the potential
increase in food production in Brazil must not rely on a proportional increase in cultivated
area (Foley et al., 2011), and double-cropping systems might play an important role to
achieve this objective.
While total grain production is expected to increase, recent long-term climate
forecasts indicate potential unfavorable climate conditions in Brazilian productive
regions. The dry season in southern Amazonia may be becoming longer (Butt et al., 2011;
Costa and Pires, 2010; Fu et al., 2013), due to both deforestation and the change in
atmospheric composition, and such evolution may be incompatible with the adoption of
double-cropping systems (Arvor et al., 2014).
Previous modeling studies that assessed the effects of climate change in soybean
productivity typically consider either fixed or optimum planting dates and cultivars, the
existence of only one crop in the same agricultural calendar and neglect the probability of
plant infection, therefore oversimplifying the representation of soybean cultivars and
plantings dates that Brazilian farmers currently adopt and their likely adaptation after
climate change in Brazil, and failing to diagnose potential threats to double-cropping
systems. Even the more recent and sophisticated studies, while succeeding to overcome
some of the previous limitations, still missed the analysis of double-cropping systems.
Oliveira et al. (2013) used fixed planting date and cultivar during computer simulations
to estimate change of agricultural productivity in the Legal Amazon, therefore missing the

9
role of adaptation of planting dates and cultivars in response to climate change.
Rosenzweig et al. (2014) assessed the change in agricultural productivity in the global
scale, but used either fixed planting dates and cultivars or methods to estimate these
parameters according to favorable climatic conditions, therefore failing to represent
farmers’ decision to sow soybeans under unfavorable climatic conditions to plant two
crops in the same agricultural calendar.
Brazilian agriculture, however, is more complex, and in addition to recommended
planting dates and cultivars that lead to high productivity, higher levels of profit are also
determined by important aspects as the farmer’s choice to plant one or more crops in the
same space in the same crop year, and the low incidence of plant diseases. Although
important, the large-scale aspects of these features are understudied for Brazil and a more
realistic estimate of a change in soybean yield under climate change scenarios, that also
includes farmer’s choice and the incidence of disease, is still missing.
Here we examine these patterns by using one gridded crop model and four climate
models to assess how regional and global climate change may affect soybean productivity
until 2050 under the following management practices, which aim to represent realistic
scenarios:
(i) farmers who choose to plant early soybean cultivars immediately after the end
of the sanitary break to plant two crops in the same agricultural calendar;
(ii) farmers who choose to plant only one crop in the agricultural calendar, and
therefore may sow soybean only under favorable climate conditions to obtain
the highest productivity.

10
The results presented here may be critical to create effective solutions to mitigate
the negative effects of climate change in soybean productivity and to maintain high levels
of production in the productive regions.
1.2 MATERIALS AND METHODS
1.2.1 Productive regions
We evaluated individually the results of soybean productivity change in the main
productive regions in Brazil (Figure 1.1), identified by the following acronyms: Mato
Grosso (MT); MATOPIBA, which aggregates results for Maranhão, Tocantins, Piauí and
Bahia states; Central Brazil (CB), with results from Mato Grosso do Sul, Goiás, Minas
Gerais and São Paulo states; and Southern Brazil (SB), for Paraná, Santa Catarina and Rio
Grande do Sul. Together, these regions produce 98% of the soybean produced in Brazil in
2014 (IBGE, 2015 - Table 1.1).
In all Brazilian productive regions, we used the soybean planted area from Dias et
al. (submitted) to filter the pixels that have at least 10% of its area planted with soybeans
in 2012 (Figure 1.1).

11
Figure 1.1 – Analyzed productive regions. Each 1o x 1o pixel shown here had at least 10%
of its area planted with soybean in 2012 according to Dias et al. (submitted).
Table 1.1 – Main soybean productive regions in Brazil and their total production. Data for
Brazilian states are from IBGE (2015). Total Brazilian production in 2014 is
~8.68x10⁷ ton.
Region Acronym Production in 2014
(ton) % from total Brazilian
production in 2014 Maranhão, Tocantins,
Piauí and Bahia MATOPIBA 8.66 x 10⁶ 9.99
Mato Grosso MT 26.5 x 10⁶ 30.54
Central Brazil CB 20.3 x 10⁶ 23.43
Southern Brazil SB 29.6 x 10⁶ 34.14
Total 8.51 x 10⁷ 98.10

12
1.2.2 Climate models and input data
With the objective to select suitable Climate/Earth System Models to represent
future climate, we chose to evaluate simulated historical precipitation, since this is one of
the most poorly simulated physical processes in Earth System Models (ESMs) (Flato et
al., 2013), and is determinant to rainfed agriculture productivity.
Here we assess the historical simulations (1979-2000) of four global models from
the Coupled Model Intercomparison Project Phase models 5 - CMIP5 (Taylor et al., 2012)
that contributed to the Intergovernmental Panel on Climate Change Fifth Assessment
Report (IPCC AR5) (Table 1.2). The seasonal climatology of simulated precipitation over
South America for the last 21 years of the 20th century (1979 to 2000) was evaluated based
on the Global Precipitation Climatology Project data (GPCP) (Adler et al., 2003).
Figure 1.2 shows the daily mean precipitation (mm/day) for different South
American Monsoon System (SAMS) phases (December – February (DJF), March – May
(MAM), June – August (JJA) e September – November (SON)) as in GPCP and as
simulated by the four selected CMIP5 models. During the DJF and MAM periods,
although general patterns are similar to GPCP, models show some limitations. MIROC-
ESM underestimates the South Atlantic Convergence Zone (SACZ) and therefore is drier
than GPCP. Other models as MRI-CGCM3, NorESM1-M and HadGEM2-ES
overestimate the intensity of the Inter Tropical Convergence Zone (ITCZ). However,
models performance seems to be more appropriate during the JJA period, with good
agreement with GPCP in Central-South America. In SON, months that represent the
beginning of the growing season and when soybean is usually sowed in Brazil, all the

13
models seem to slightly underestimate precipitation in central-Brazil. MIROC-ESM and
NorESM1-M also underestimate precipitation for Southern regions, but HaGEM2-ES and
MRI-CGCM3 seem to represent it well.
According to the precipitation annual cycle for soybean productive regions
(Figure 1.3), virtually all models represent well the season cycle, even though the
magnitude of simulated precipitation varies among models.
Table 1.2 – List of CMIP5 models used in this study
Model name Acronym Institute
Model for Interdisciplinary Research on Climate, version
5 MIROC-ESM
Atmosphere and Ocean Research Institute (The University of Tokyo), National Institute for
Environmental Studies, and Japan Agency for Marine-
Earth Science and Technology
Meteorological Research Institute Coupled
Atmosphere–Ocean General Circulation Model, version 3
MRI-CGCM3 Meteorological Research
Institute (MRI), Japan
Norwegian Earth System Model, version 1 (medium
resolution) NorESM1-M
Norwegian Climate Centre (NCC)
The Hadley Centre Global Environmental Model,
version 2 HadGEM2-ES
Hadley Centre, United Kingdom

14
Generally, models underestimate precipitation in comparison to GPCP in nearly
all months of the seasonal cycle. From all models, HadGEM2-ES has the best performance
and is reasonably closer to GPCP, although it slightly overestimates precipitation from
June to January.
Figure 1.2 - Daily mean precipitation (mm/day) for the period 1979-2000 during the
phases of the South American Monsoon System (SAMS). Data is shown for
Global Precipitation Climatology Project data (GPCP) (a-d) and simulated by
MIROC-ESM (e-h), MRI-CGCM3 (i-l), NorESM1-M (m-p) and HadGEM2-
ES (q-t).

15
Figure 1.3 ‒ Daily mean precipitation for each month of the period 1979-2000 as in Global
Precipitation Climatology Project (GPCP) and as simulated by the models:
MIROC-ESM, MRI-CGCM3, NorESM1-M and HadGEM2-ES. The monthly
averages are calculated over each one of the soybean productive regions in
Brazil (Figure 1.1). The average results of the model ensemble is also shown
Besides precipitation (mm/day), the climate variables used as input to INLAND
simulations are specific humidity (kgH2O/kg air), solar radiation (W/m2), average wind
speed (m/s) and average, maximum and minimum temperatures (oC).
0
2
4
6
8
10
12
14
Jan
Feb
Mar
Apr
May Ju
nJu
lA
ug Sep
Oct
Nov
Dec
(b) MT
0
2
4
6
8
10
12
14
Jan
Feb
Mar
Apr
May Ju
nJu
lA
ug Sep
Oct
Nov
Dec
(c) CB
GPCP
Ensemble
0
2
4
6
8
10
12
14
Jan
Feb
Mar
Apr
May Ju
nJu
lA
ug Sep
Oct
Nov
Dec
(d) SB
NorESM1-M HadGEM2-ESMRI-CGCM3 MIROC-ESM
0
2
4
6
8
10
12
14
Jan
Feb
Mar
Apr
May Ju
nJu
lA
ug Sep
Oct
Nov
Dec
(a) MATOPIBA
Ave
rage
mon
thly
pre
cipi
tatio
n (m
m/d
ay)

16
1.2.3 Crop model description
We use a mechanistic gridded crop model (GCM) to evaluate the change in
soybean productivity after climate change: the Integrated Model of Land Surface
Processes (INLAND, Costa et al., in prep.).
INLAND is a fifth-generation land surface model that simulates the exchanges of
energy, water, carbon and momentum in the soil-vegetation-atmosphere system, the
canopy physiology (photosynthesis, stomatal conductance and respiration) and the
terrestrial carbon balance (net primary productivity, soil respiration and organic matter
decomposition). Total carbon assimilation is allocated to leaf, stem, root or grains
depending on the phenological stage. More specifically, the allocation scheme considers
three phenological stages controlled by Growing Degree-Days (GDD): (i) from planting
to leaf emergence; (ii) from leaf emergence to end of silking; (iii) from grain fill to
physiological maturity. Soybean productivity is estimated based on the percentage of dry
matter allocated to grains. Processes are organized in a hierarchical framework, and
operate in time-steps of 60-min. This model is an evolution of Agro-IBIS (Integrated
Biosphere Simulator) (Kucharik and Twine, 2007) and has been developed by Brazilian
researchers as part of the Brazilian Earth System Model project, aiming to better represent
biomes (as Amazon and Cerrado) and processes (as fire, flooding and agriculture) that
take place in Brazilian territory. We use the version 2.0, which includes the representation
of four crops, in addition to 12 natural plant functional types.
The model was run for the entire South America, with a grid resolution of 1ox1o
(~110km x 110km).

17
1.2.4 Experiment design
1.2.4.1 Planting dates and cultivars
In each individual simulation in this work (sets of simulations are described in
section 1.2.4.2) we simulated 10 planting dates (09/15, 09/25, 10/05, 10/15, 10/25, 11/05,
11/15, 11/25, 12/05 and 12/15) and 5 cultivars, that vary according to the accumulation of
growing degree-days (GDD) needed to achieve physiological maturity - from the shortest
to the longest cultivar: 1500, 1600, 1700, 1800 and 1900 GDD (base temperature 10oC),
with typical total cycle duration from 100 to 130 days. Therefore, for every
model/scenario considered in this study, we have 50 possible configurations of planting
dates and cultivars for each pixel. We then focus our analysis on two specific cases:
ESOY: Short-cycle soybean cultivar (average cycle duration of 100 days) planted
early right after the end of the sanitary break (September 25th), to represent farmers
who choose to harvest soybean in time to plant a second crop in the same agricultural
calendar;
HSOY: Highly productive soybeans, representing farmers who choose to plant only
one crop in the same agricultural calendar, and therefore may sow soybean under
favorable climate conditions. In this case, planting dates and cultivars at each pixel
are the ones that lead to highest yields among all of the 50 simulated configurations.

18
1.2.4.2 Land use and climate change scenarios
We conducted two sets of simulations, from 2011 to 2050, to estimate the change
in soybean productivity after climate change, as follows.
Effects of land-use change and change in atmospheric composition on climate as in
CMIP5 (RCP8.5)
This group of simulations accounts for the effects of land-use change and the
change in atmospheric composition on climate with both land use and atmospheric
composition according to the CMIP5 (Coupled Model Intercomparison Project Phase 5)
experiment. Here we assess the RCP 8.5 W.m-2 scenario (RCP8.5, Riahi et al., 2011)
which assumes that climate change leads to a radiative forcing of about 8.5 Wm- 2 in 2100,
and CO2 concentrations increase from 387 to 541 ppmv from 2011 to 2050. This is
considered a high emission scenario and although is the most pessimistic among all four
IPCC AR5 scenarios, it is also the one that best represents the 2005-2014 emissions (Fuss
et al., 2014).
We run simulations for RCP8.5 with climate data from the four climate models
evaluated in section 1.2.2: the Hadley Centre Global Environmental Model, version 2
(HadGEM2-ES), the Model for Interdisciplinary Research on Climate (MIROC-ESM),
the Meteorological Research Institute Coupled Atmosphere–Ocean General Circulation
Model, version 3 (MRI-CGCM3) and the Norwegian Earth System Model, version 1
(NorESM1-M). The following variables were used as inputs for these simulations: mean,
maximum and minimum temperature (oC), precipitation (mm/day), incoming solar

19
radiation (W/m2), wind speed (m/s) and specific humidity (kg H2O/kg air). These
simulations also consider the physiological effects of elevated CO2 concentration on
carbon assimilation by plants. We run simulations in the crop model with input of all
climate models, in a total of four simulations.
RCP8.5 shows a very comprehensive description of land use change until the end
of the 21st century, including the representation of transition from primary land to
cropland, pasture, urban areas and also the shift from all of these previous uses to the
others. However, regardless of the completeness of the transitions depicted, each Earth
System Model (ESM) implements it differently, following the structure of their land
surface models. We examined land use data used in HadGEM2-ES and MIROC-ESM (the
main ESMs used in this study). In these models, the amount of Amazonia and Cerrado
deforested until the middle of the century seems to be low: until 2050, total deforested
area in these biomes is smaller than 20% and 60%, respectively (Figure 1.4). These levels
of deforestation are close to the current ones, and these land use scenarios are most likely
underestimated for the year 2050. For this reason, we run additional simulations to account
for the biogeophysical effects of a more severe land-use change in these biomes until the
middle of the century, as follows.

20
Effects of land-use change as in Pires and Costa (2013) and change in atmospheric
composition as in CMIP5 on climate (LUCID+PC13)
In a pioneer study, Oliveira et al. (2013) concluded that the isolated effects of a
regional climate change induced by intense land-use change in Amazonia could negatively
affect soybean productivity in a magnitude comparable to the global climate change
induced by a change in atmospheric composition. Therefore, considering that CMIP5’s
land use change scenarios appear to be modest for the central-northern South America
until 2050 and that it could lead to an underestimation of the effects of climate change in
soybean productivity, we chose to conduct a more conservative analysis and assess a
second group of simulations with more intense land use trajectories.
In this set of simulations we use deforestation scenarios as in
Pires and Costa (2013), hereafter referred to as PC13, and CO2 trajectories according to
CMIP5 experiment (RCP8.5 scenario). We consider that, according to a pessimistic
perspective as RCP8.5, until 2050 deforestation could reach ~40% in Amazonia and ~70%
in Cerrado. We assessed only four out of the 20 scenarios published by Pires and Costa
(2013): those that assume that deforestation in Pan-Amazonia will reach 10%, 20%, 30%
and 40% by 2050, combined with Cerrado deforestation, ranging from 60 to 70%. The
Amazon deforestation scenarios are based on Soares-Filho et al. (2006)’s scenarios. The
A10C60 (10% of Amazon deforestation and 60% of Cerrado deforestation) scenario is the
control run, as it represents the average situation in the period 1970-2000. Starting from
an average 20% of Amazon deforestation and 60% of Cerrado deforestation (A20C60) in
2011-2020 period, we assume that by 2035, 30% of the Amazon and 65% of Cerrado will

21
be deforested (A30C65), and by 2050, 40% of Amazonia and 70% of Cerrado will be
deforested (A40C70).
Instead of using original CMIP5 simulations, where the biogeophysical effects of
land-use change are simulated (but underestimated), we use similar CMIP5 simulations
where land-use is fixed so that we could add to them climatic anomalies related to PC13
deforestation scenarios. Simulations with emissions according to RCP8.5 and fixed land-
use were previously run as a part of the LUCID project (Land-Use and Climate,
Identification of Robust Impacts) (Brovkin et al., 2013), in the L2A85 experiment
(atmospheric composition of RCP8.5 W.m-2, but land-use fixed as in 2005). We use
outputs for two models, HadGEM2-ES and MIROC-ESM.
To combine RCP8.5 and PC13 to create synthetic time evolution of global climate
change with more severe land-use trajectories than RCP8.5, we adjusted LUCID climate
outputs (precipitation; average, maximum and minimum temperature; wind speed;
specific humidity and solar radiation) to PC13 climate anomalies, creating a new climate
input for crop models referred to in this work as LUCID+PC13. More specifically, we
adjusted LUCID daily data (Brovkin et al., 2013) to the monthly difference (or ratio)
between a deforestation scenario of PC13 (A20C60, A30C65 A40C70) and A10C60 (control)
scenario.
For each month of the 2011-2050 period, we calculated the difference between the
deforestation scenario and the control run for mean, maximum and minimum
temperature (oC) (Equation 1.1):

22
� = � ; �� � + � ; � � − � ; � (1.1)
Cdf = final daily climate input (emission + land use change scenario);
Cd ; LUCID = daily LUCID climate variable;
Cm ; scenario = monthly mean Pires and Costa (2013) climate variable (A20C60 from 2009 to 2020;
A30C65 from 2021 to 2035; A40C70 from 2036 to 2050)
Cm ; A10C60 = monthly mean climate for A10C60 Pires and Costa (2013) scenario.
For precipitation (mm/day), incoming solar radiation (W/m2), wind speed (m/s)
and specific humidity (kgH2O/kgair) we used the same approach described above, but
calculated the ratio, instead of the difference, between the climate scenario and the control
run (A10C60) (Equation 1.2):
� = � ; �� � � � ; � �� ; � (1.2)
Even though adding the climate anomalies of two different types of simulations
(regional climate change and global climate change) may miss second order processes or
feedbacks, it allows the representation of the most relevant processes involved. Indeed,
Costa and Foley (2000), who conducted a full climate experiment to assess climate change
caused by these different types of climate change, concluded that the interaction between
the two processes is less than 10% of the sum of the individual processes.

23
In the crop growth model, we run five ensembles for each climate model
(HadGEM2-ES and MIROC-ESM), totaling 10 simulations.
Figure 1.4 – Scenarios of total Amazon and Cerrado deforested area according to RCP8.5 as
implemented in models HadGEM2-ES and MIROC-ESM and to Pires and Costa
(2013).
1.2.4.3 Significance tests
For each group of simulations described in section 1.2.4.2, we averaged the outputs
of simulations of all ensembles (each individual simulation of crop model forced by each
climate model is considered a member of the ensemble) and created an average time-series

24
(from 2011 to 2050) of soybean productivity, therefore reducing the uncertainty and
model-related bias. We then calculated the percentage change (Equation 1.3) and tested
the hypothesis that the average soybean productivity changes from the first to the last
decade in the 2011-2050 period due to climate change.
∆� % = ( � − − � −� − ) � (1.3)
In other words, we test the hypothesis that soy productivity in 2041-2050 (Y2041-
2050) is different from the average soybean productivity in 2011-2020 (Y2011-2020), being
this difference related to the climate change that occurred between these periods. We used
the Student’s t test, with a 5% level of significance and n = 10 years to test this hypothesis,
in the two groups of simulations described in section 1.2.4.2.
1.3 RESULTS AND DISCUSSION
1.3.1 Effects of climate change in ESOY and HSOY productivity
According to both RCP8.5 and LUCID+PC13 simulations, the magnitude and the
sign of the average change in soybean productivity (Y) varies spatially and according to
the planting date in Brazil (Figure 1.5). The change in Y for each individual climate model
used is available in Appendix A (Figures A1, A2, A3 and A4 and Tables A1, A2, A3 and
A4).

25
For early cultivars planted right after the end of the sanitary break in rainfed
conditions (ESOY), Y is projected to expressively decrease in Central-Northern Brazilian
regions until 2050 (Table 1.3 and Figure 1.5-a and Figure 1.5-c). In these cases, according
to both RCP8.5 and LUCID+PC13, the physiological effects of an increased CO2
atmospheric concentration is not sufficient to prevent a dramatic decrease in Y in response
to a more severe climate. This drop in ESOY productivity is induced by a sharp decrease
in precipitation during the transition from dry to wet season when large-scale land-ocean
interactions are less influent (Lawrence and Vandecar, 2015). Costa and Pires (2010)
demonstrate the importance of both the native Cerrado and tropical Amazon forest on the
early onset of the rainy season in these regions. In fact, precipitation in MATOPIBA, MT
and CB decreases more in September-October than in November-December (Figures 1.6-
a, 1.6-b and 1.6-c), with sharper decreases in the LUCID+PC13 scenario. This event is
timed with the moment when double-cropping farmers are sowing soybean in these
regions.
This decrease in precipitation in transition months causes an increase in the dry
season duration, and has been widely reported in the literature, including modeling (Costa
and Pires, 2010; Fu et al., 2013) and observational (Butt et al 2011) studies. Regional
assessment of CMIP5 scenarios indicate that a longer dry season in these regions could be
the norm through the 21st century (Boisier et al., 2015; Fu et al., 2013). In addition, since
CMIP5 scenarios have underestimated future changes in land cover in South America, and
increases in the duration of the dry season have been associated to deforestation (Butt et
al., 2011), the CMIP5 projections for the increase in the duration of the dry season in
southern Amazonia are most likely underestimated.

26
Our simulations also show that MATOPIBA is predicted to be the most affected
region, and may lose 16% (43.4%) of ESOY productivity according to RCP8.5
(LUCID+PC13). MT and CB ESOY productivity are also negatively affected by climate
change until 2050, and RCP8.5 simulations show a more moderate decrease (11 and 7.3%,
respectively) than LUCID+PC13 (27.4 and 14.4%, respectively) (Table 1.3). As
LUCID+PC13 land-use scenarios are more drastic than those of RCP8.5 in central-
northern Brazil (MT, CB and MATOPIBA), this difference in productivity decrease
between the two groups of simulations is probably related to a stronger negative
biogeophysical signal associated to tropical deforestation.
In Southern Brazil, where the amount of deforested area is similar in RCP8.5 and
LUCID+PC13, both groups of simulations agree that ESOY productivity may increase by
11.9-15.6% until the middle of the century (Table 1.3). In these cases, the change in
precipitation from 2011-2020 to 2041-2050 is small (Figures 1.6-d), and this increase is
most likely due to higher levels of CO2.
For Central-Northern Brazilian regions, the circumstances are completely different
if soybean is planted under optimum climate conditions. As mentioned before, HSOY
planting dates occur in November-December, when there are smaller negative effects of
climate change in precipitation (Figure 1.5). According to both RCP8.5 and
LUCID+PC13, HSOY productivity may increase in Brazil until 2050 (Table 1.4),
showing that adaptation through changes in planting dates or cultivars can offset the
effects of climate change.

27
Figure 1.5– Percentage change in soybean yield from 2011-2020 to 2041-2050 after
climate change. In (a) and (b) atmospheric composition and land use
trajectories are according CMIP5’s RCP8.5 scenario. In (c) and (d),
atmospheric composition trajectories are according to CMIP5’s RCP8.5
scenario, but land use trajectories are according to Pires and Costa (2013)
tropical deforestation scenarios.
(c) (d)
(a) (b)
ESOY / RCP8.5 HSOY / RCP8.5
ESOY / LUCID+PC13 HSOY / LUCID+PC13
28
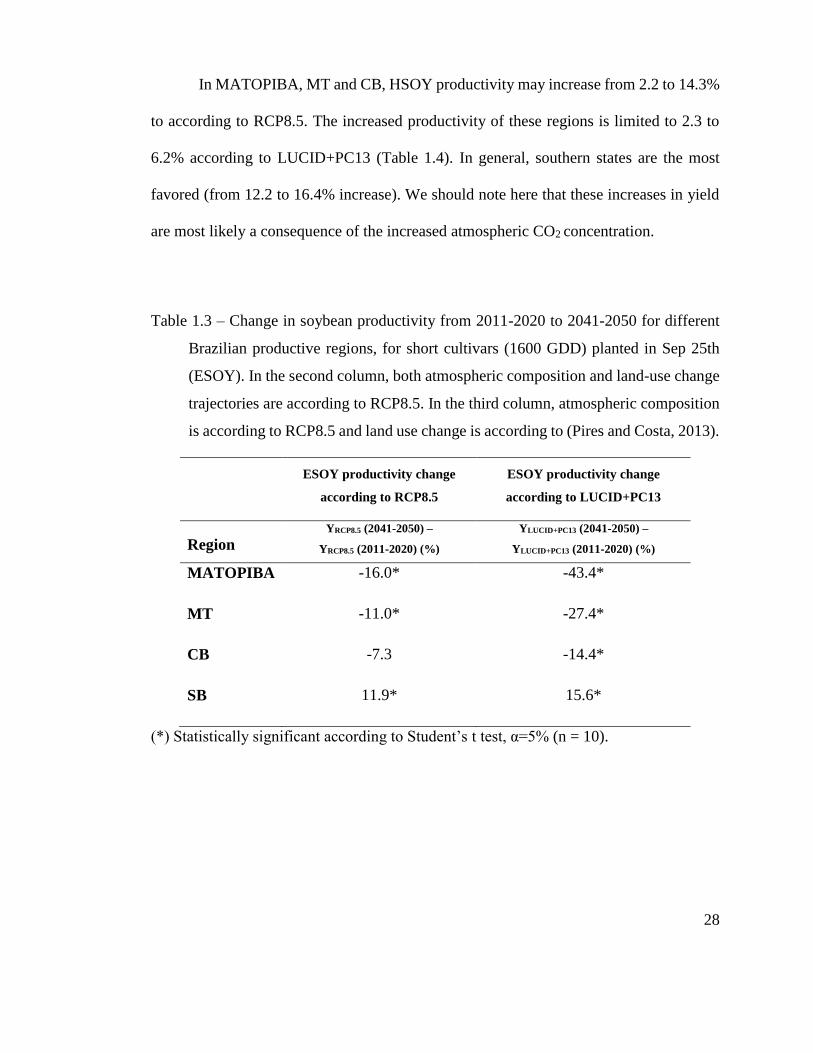
In MATOPIBA, MT and CB, HSOY productivity may increase from 2.2 to 14.3%
to according to RCP8.5. The increased productivity of these regions is limited to 2.3 to
6.2% according to LUCID+PC13 (Table 1.4). In general, southern states are the most
favored (from 12.2 to 16.4% increase). We should note here that these increases in yield
are most likely a consequence of the increased atmospheric CO2 concentration.
Table 1.3 – Change in soybean productivity from 2011-2020 to 2041-2050 for different
Brazilian productive regions, for short cultivars (1600 GDD) planted in Sep 25th
(ESOY). In the second column, both atmospheric composition and land-use change
trajectories are according to RCP8.5. In the third column, atmospheric composition
is according to RCP8.5 and land use change is according to (Pires and Costa, 2013).
ESOY productivity change
according to RCP8.5
ESOY productivity change
according to LUCID+PC13
Region YRCP8.5 (2041-2050) –
YRCP8.5 (2011-2020) (%) YLUCID+PC13 (2041-2050) –
YLUCID+PC13 (2011-2020) (%)
MATOPIBA -16.0* -43.4*
MT -11.0* -27.4*
CB -7.3 -14.4*
SB 11.9* 15.6*
(*) Statistically significant according to Student’s t test, α=5% (n = 10).

29
Table 1.4 – Change in soybean productivity from 2011-2020 to 2041-2050 for different
Brazilian productive regions, for optimum cultivar and planting date (HSOY). In the
second column, both atmospheric composition and land-use change trajectories are
according to RCP8.5. In the third column, atmospheric composition is according to
RCP8.5 and land use change is according to (Pires and Costa, 2013).
HSOY productivity change
according to RCP8.5
HSOY productivity change
according to LUCID+PC13
Region YMAX
RCP8.5 (2041-2050) –
YMAXRCP8.5 (2011-2020) (%)
YMAXLUCID+PC13 (2041-2050) –
YMAXLUCID+PC13 (2011-2020) (%)
MATOPIBA 14.3* 2.3
MT 2.2* 2.8
CB 6.6* 6.2*
SB 12.2* 16.4*
(*) Statistically significant according to Student’s t test, α=5% (n = 10).

30
Figure 1.6 – Change in precipitation (%) from 2011-2020 to 2041-2050 for the months of
September, October, November and December for the different soybean
productive regions considered in this study, as in RCP8.5 (circles and solid
lines are the average and the models range, respectively) and LUCID+PC13 5
(triangles and dashed lines are the average and the models range,
respectively).
-70-50-30-1010305070
S O N D
(a) MATOPIBA
-70-50-30-1010305070
S O N D
(b) MT
-70-50-30-1010305070
S O N D
(c) CB
-50
-30
-10
10
30
50
S O N D
(d) SB
RCP8.5 LUCID+PC13
Pre
cip
itatio
n ch
ange
fro
m 2
01
1-2
02
0 to
20
141
-20
50 (
%)

31
1.3.2 Implications for double-cropping systems in central-northern Brazil
Our simulations strongly indicate that future climatic conditions may be
unfavorable to early-planted soybeans in central-northern Brazilian productive regions,
where ESOY productivity may decrease expressively until the middle of the century,
regardless of the scenario. On the other hand, although climatic conditions become worse
during the first dates of the crop calendar, Y improves for later dates (HSOY), showing
that adapting planting dates can offset soybean productivity losses caused by climate
change.
Based on the hypothesis that delaying planting dates improves productivity
responses after climate change, we assess the opportunity to maintain highly productive
double-cropping systems by delaying the soybean planting dates to times of the year when
the climate may be more favorable. Although relatively simple, this may not be a
straightforward analysis since, as mentioned before, commodity agriculture in central-
northern Brazil happens in large ranches, where soybean cropland may be as extensive as
10,000 ha in a single ranch, and the sowing operation may last from 2 to 4 weeks to be
completed. To simplify this analysis, we consider an average planting operation duration
of ~3 weeks (20 days).
Thus, we evaluate this possibility by testing new planting dates for early cultivars
and choosing a threshold date that soybean may reach physiological maturity so that
farmers have time to harvest it and plant maize. Reckoning that farmers may take 3 weeks
to harvest soybeans and sow maize, that maize cycle lasts about 120 days and must reach
physiological maturity in May (time of the year when the dry season has already started

32
in these regions, which may negatively affect its productivity) we consider that there is a
high probability that a double cropping system is viable when soybean, the first crop,
reaches physiological maturity (when it can be harvested) by the beginning of January.
Similarly, we consider that there is medium probability that a double-cropping system is
still viable after climate change if soybean reaches physiological maturity by the middle
of January, and after that date, double-cropping systems may become not be viable.
Figure 1.7 shows how productivity of early soybean cultivars change in
MATOPIBA (Figure 1.7-a) and MT (Figure 1.7-b) after adapting the beginning of the
planting operation from Sept-25 to Oct-5, Oct-15, Oct-25, Nov-5, Nov-15, Nov-25, Dec-
5 and Dec-15 after climate change. The three-week sowing operation is marked by dashed
boxes. Values greater than the unit indicates an increase in yield. Black symbols indicate
scenarios of high probability of successful double-cropping systems (physiological mature
soybean by January 1st), while grey symbols indicate medium probability of success
(physiological mature soybean by January 15th), and white symbols indicate low
probability of success (soybean reaches physiological maturity after the dates mentioned
above), and a second crop would fail. As expected, for all panels in Figure 1.7 it is clear
that progressively adapting planting dates to later than September 25 gradually decreases
productivity losses (values smaller that the unit) and, at some point, Y starts to increase
(values greater than the unit). Considering that behavior, it is possible to conjecture until
what time of the year adapting planting dates would lead to a minimum loss (or, say, to
an increase) in Y while there is still high probability to maintain a double-cropping system.

33
In MATOPIBA (Figure 1.7-a), according to RCP8.5 delaying the beginning of the
planting operation to October 5 in 2041-2050 may lead to an increase of Y (relative to
soybean planted in 09/25 in the first decade - Y09/25(2011-2020)) during virtually all the
planting operation. But, in this case, there is medium to low probability that a double-
cropping system is viable in this region by the middle of the century. However, according
to LUCID+PC13 delaying the beginning of the planting operation to October 5 in 2041-
2050 may lead to a decrease of Y in the first 10 days of the planting operation (as opposite
to RCP8.5) and to a moderate increase in Y for the last 10 days. In this case, a double-
cropping system would be viable only in half of the large farms (those planted until
October 15). Delaying the beginning of the planting operation to later than October 15
still does not allow a second crop, but soybean productivity is higher due to favorable
climatic conditions and increased atmosphere CO2 concentration.
In MT (Figure 1.7-b), the scenario is more pessimistic. According to both RCP8.5
and LUCID+PC13, even though delaying the beginning of the planting operation to
October 5 leads to improvement in Y, the probability to plant two crops in the same
agricultural calendar lowers (medium probability) in virtually the total extensions of the
farms. Starting to plant soy after October 15 leads to essentially low probability to plant a
second crop. Again, the main difference between the two simulations is that
LUCID+PC13 leads to lower Y than RCP8.5. In summary, regardless of the scenario, the
sustainability of highly productive double-cropping systems may be threatened in Mato
Grosso.

34
Figure 1.7 – Soybean productivity change [Yd(2041-2050) / Y09/25(2011-2020), where d
are the planting dates assessed in this study] after climate change. Full black
boxes (circles) represent soybean planting dates that lead to a high probability
of double-cropping viability according to RCP8.5 (LUCID+PC13). Full gray
boxes (circles) represent soybean planting dates that lead to a medium
probability of double-cropping viability, also according to RCP8.5
(LUCID+PC13). Empty boxes (circles) represent soybean planting dates that
may lead to unviable double-cropping according to RCP8.5 (LUCID+PC13).
Dashed boxes indicate the sowing windows.
1/4
1/2
1
2
4
(b) MT
1/4
1/2
1
2
4
(a) MATOPIBA
□ RCP8.5 ○ LUCID+PC13
Soy
bea
n pr
oduc
tivity
cha
nge
(Y d(20
41-2
050)
/ Y 0
9/25
(201
1-20
20))

35
1.4 CONCLUSIONS
Sowing early soybean cultivars right after the end of the sanitary break has been
economically attractive for Brazilian farmers in recent years: the probability of infection
with rust is low, early cultivars remain less time in the field and less time exposed to
infection, the market prices for soybean harvested earlier is higher than in the peak of
harvesting season, and there is the climatic possibility to plant a second crop in the same
agricultural calendar. Usually, profit offsets the risk of sowing soybean under uncertain
climatic conditions (mainly precipitation) in the beginning of the rainy season.
However, the results of this assessment strongly suggest that the average climate
risk may increase for soybean planted right after the end of the sanitary break in the main
productive regions in Central/Northern Brazil until 2050, regardless of the scenario or
climate model used. This result is associated to an important reduction of precipitation
during the transition months from the dry to the wet season, when double-cropping
farmers are sowing soybean. As expected, the positive physiological effects of increased
atmospheric CO2 concentration is not sufficient to offset the negative effects of dry
conditions during the early soybean cycle. In addition, more severe deforestation levels
may lead to sharper decreases in productivity until 2050, indicating that the expansion of
the agricultural frontier may cause negative feedbacks on agricultural productivity.
On the other hand, according to our simulations, adapting planting dates of early
cultivars from September 25 to October 5 in MATOPIBA and MT may slightly increase
early soybean productivity without the requisite of any sophisticated technological

36
technique, but it decreases the probability to plant a second crop in the same land in the
same agricultural calendar. Again, stronger deforestation levels limits productivity
responses and may lead to more moderate increase in productivity than in lower
deforestation levels.
In case farmers still choose to adopt viable double-cropping systems in central
Northern Brazil, the future sowing windows would have to narrow substantially (to 10
days, at maximum) in the case of large farms that currently need several weeks to complete
the planting operation. Therefore, the simulations in this study indicate that the
sustainability of double-cropping systems may be threatened in central Northern Brazil,
and that clearing additional to area to offset productivity loss may cause negative
feedbacks on the existing farms, further decreasing soybean productivity.
In contrast, sowing soybean in November-December, when rainfall conditions are
more favorable, may reduce climate risk and even expressively increase productivity in
Southern Productive regions since soybean photosynthetic processes may be favored in a
high atmospheric CO2 scenario. Nevertheless, sowing later in November-December may
also imply in an increased phytosanitary risk when compared to the early sowers, and on
unviable double-cropping systems, and the total grain output (soybean + maize) would
significantly decrease in these regions.
In summary, soybean farmers may face a trade-off situation: plant right after the
sanitary break and increasingly risk to lose an expressive part of soybean productivity, but
be able to plant a second crop; or plant later and gain in Y at a higher sanitary risk, but
risk not to be able to plant a second crop. In either cases, our simulations suggest that,
37
without adaptation, the total soybean + maize output may not be sustainable in some
productive regions in Brazil until the middle of the century.
In the view of this scenario, effective adaptation strategies are required. Some
suggestions of adaptation strategies to maintain highly productive double-cropping
systems until the middle of the century are:
technological solutions focused on the initial stages of soybean cycle,
especially for early cultivars, when water deficit will be larger (for example,
new drought tolerant seeds to current cultivars, or the development of new
drought tolerant cultivars);
investment in productive early soybean and maize cultivars (90-100 days
cycle each) – such cultivars do exist today, but have low yields;
and the incorporation of climate prediction in the Climate Risk Agricultural
Zoning (or Zoneamento Agrícola De Risco Climático, in portuguese)
recommendations. These recommendations, that are criteria for agricultural
credit in Brazil, are based on past climate time-series and may miss some the
dynamics introduced by climate change, especially the shortening of the rainy
season.
Finally, if the adaptation strategies above fail and if the scenario of expressive
productivity losses caused by the shortening of the rainy season is confirmed, farmers may
decide to shift their ranches to areas with more favorable precipitation regimes further
deforesting land. As discussed before, additional deforestation leads to further reductions
in the rainy season and reductions in September and October rainfall, feeding back again

38
on the yields. In other words, large-scale agriculture expansion in northern Brazil leads to
the degradation of the climate regulation ecosystem it relies on.
The results presented in this chapter demonstrate that it is essential to anticipate
risks related to climate change, including climate change caused by the expansion of the
agriculture frontier, reinforce measures to halt deforestation in Northern Brazilian, both
in Amazonia and the Cerrado, where deforestation rates are high and there is a weak
conservation governance. In addition to obvious benefits (as biodiversity conservation,
for example) the preservation of tropical biomes in South America is proving to be of
great importance to maintain highly productive agricultural farms in Brazil.

39
CHAPTER 2
EFFECTS OF CLIMATE CHANGE IN PASTURE PRODUCTIVITY AND IMPLICATIONS FOR LAND USE IN BRAZIL
2.1 INTRODUCTION
The past development of agriculture in Brazil has been intimately connected with
the substitution of natural biomes by pasturelands. The main reason why cattle ranching
was the most usual activity driving the extension of agricultural frontiers in Brazil is that
it is the least expensive and most efficient way to occupy and ensure ownership of large
expansions of land (Bowman et al., 2012; Dias-Filho, 2013; Lapola et al., 2014). Due to
the intensive grazing and low levels of technology adoption, these pasturelands would
quickly become unproductive and were usually left behind or occupied by new
agricultural uses. This process persisted for many years and resulted in a large herd that is
fed essentially with pastures in low-productive cattle ranches, which contrasts with the
high yields observed in many crops in the country.
Although a fraction of these pastures has been increasingly replaced by
mechanized commodities, as soybeans for example, it is still the dominant land-use in
Brazil (nearly 68% of the total agricultural area in the country, Dias et al., submitted).
Indeed, Brazil is the second largest beef exporter in the world (FAO, 2014), with a total
herd of 212 million heads (IBGE, 2015), and its total production is projected to continue
to expressively increase in the next years (21% until 2025 according to CONAB (2015)).

40
As the current pasturelands are underproductive (in terms of heads per hectare), a
great opportunity to sustainably increase productivity is to close yield gaps on the existing
farms while breaking the cycle of environmental degradation (Foley et al., 2011). Such
farms could expressively increase productivity with the combination of the adoption of
relatively simple management practices such as cattle rotation and pasture fertilization, as
recommended by EMBRAPA (Empresa Brasileira de Pesquisa Agropecuária) and
economic policies, as a tax on cattle from conventional pasture and a subsidy for cattle
from semi-intensive pasture (Cohn et al., 2014). In these cases, productivity on the
existing farms could increase by 2.5-fold in comparison to conventional systems and spare
land for deforestation. Such elements have been extensively studied and applied in
experimental farms in Brazil, but have not yet been widely adopted.
However, besides management practices and economic incentives, a third factor
to determine productivity is climate change, which could limit forage availability for
cattle. In a previous study, Oliveira et al., (2013) assessed how pasture productivity would
change in the Legal Amazon in response to climate change in 2050 and concluded that it
decreases mainly in Tocantins and Maranhão states, as a result of the decreased
precipitation in those regions after climate change. However, this previous study missed
important Brazilian productive regions outside the Legal Amazon and considered that
only the effects of deforestation on forest itself would affect regional climate, missing the
effects of Cerrado deforestation in causing additional water deficit in central-northern
Brazil.

41
Here we conduct an updated assessment of the effects of climate change until 2050
in pasture productivity in the main productive regions in Brazil. We use a calibrated large-
scale ecosystem model to assess the effects of a high emission scenario (RCP8.5), and
contrast it to an alternative scenario where levels of deforestation in Amazonia and
Cerrado are increased. The results presented here may be critical to assess the
sustainability of forage availability on the existing farms in Brazil and if the previously
proposed solutions (management and economic incentives) to increase meat production
in Brazil may be effective, even in a future climate change scenario.
2.2 MATERIALS AND METHODS
2.2.1 Productive regions
We evaluated individually the results of pasture productivity change in the main
cattle productive regions in Brazil (Figure 2.1), identified by the following acronyms:
Northern Brazil (NB); aggregating results from Mato Grosso, Pará and Rondônia states;
MATOPIBA, which aggregates results for Maranhão, Tocantins, Piauí and Bahia states;
Central Brazil (CB), with results from Mato Grosso do Sul, Goiás, Minas Gerais and São
Paulo states; and Southern Brazil (SB), for Paraná, Santa Catarina and Rio Grande do Sul.
Together, these regions hold about 90% of the total Brazilian herd in 2014 (Table 2.1).
We used the pasture planted area from Dias et al. (submitted) to filter the pixels
that have at least 10% of its area planted with pastures in 2012 (Figure 2.2).

42
Figure 2.1 – Analyzed productive regions. Each 1o x 1o pixel shown here had at least 10%
of its area covered by pasturelands in 2012.
Table 2.1 – Main cattle productive regions in Brazil and their total production
(IBGE, 2015). Total Brazilian production in 2014 is 2.12x10⁸ heads.
Region Acronym Production in 2014 (heads)
% from total Brazilian production
in 2012 Maranhão, Tocantins,
Piauí and Bahia MATOPIBA 2.8 x 10⁷ 13.33
Northern Brazil NB 6.1 x 10⁷ 28.84
Central Brazil CB 7.6 x 10⁷ 35.97
Southern Brazil SB 2.7 x 10⁷ 12.92
Total 1.92 x 10⁸ 90.06

43
2.2.2 Climate models and input data
Essentially, the simulated climates of the same four Earth System Models from
CMIP5 used to simulate soybean productivity (section 1.2.2) were used to estimate future
pasture productivity – HadGEM2-ES, MIROC-ESM, MRI-CGCM3 and NorESM1-M
(Table 1.1). Reassessment of the annual precipitation cycle for the pasture planted area in
Brazil indicates that these models simulate, in average, monthly precipitation according
to GPCP from January to June. However, from July to December, ESMs generally
underestimate precipitation in pasture areas in Brazil (Figure 2.1).
In addition, input climate variables are also the same as those used for soybean
simulations: precipitation (mm/day), specific humidity (kgH2O/kg air), solar radiation
(W/m2), average wind speed (m/s) and average, maximum and minimum temperatures
(oC).

44
Figure 2.2 – Daily mean precipitation for each month of the period 1979-2000 as in GPCP
and as simulated by the models: MIROC-ESM, MRI-CGCM3, NorESM1-M
and HadGEM2-ES. The monthly averages are calculated over each one of the
soybean productive regions in Brazil.
2.2.3 Pasture model description
The simulations of pasture productivity were run with the same surface model used
for the estimation of soybean productivity (Chapter 1), the Integrated Model of Land
Surface Processes (INLAND). As mentioned before, the version used in this study
02468
101214
Jan
Feb
Mar
Apr
May Ju
nJu
lA
ug Sep
Oct
Nov
Dec
(d) SB
NorESM1-M HadGEM2-ESMRI-CGCM3 MIROC-ESM
02468
101214
Jan
Feb
Mar
Apr
May Ju
nJu
lA
ug Sep
Oct
Nov
Dec
(c) CB
GPCP
Ensemble
02468
101214
Jan
Feb
Mar
Apr
May Ju
nJu
lA
ug Sep
Oct
Nov
Dec
b) NB
02468
101214
Jan
Feb
Mar
Apr
May Ju
nJu
lA
ug Sep
Oct
Nov
Dec
(a) MATOPIBA
Ave
rage
mon
thly
pre
cipi
tatio
n (m
m/d
ay)

45
(version 2.0) includes the representation of 16 plant functional types (PFTs): 12 of them
are natural (one of which was used to simulate the growth of pastureland as C4 grasses),
and the remaining four are crops (soybeans, corn, wheat and sugarcane).
Crops and natural ecosystems share the same Equations to simulate the balance of
energy and mass, which operates at scales ranging from 60 minutes to 1 year (Foley et al.,
1996). However, the methodology for the simulation of phenology and carbon allocation
are different for natural and agricultural ecosystems. For natural ecosystems plant
functional types, net primary production (NPP) is calculated through the integration of
primary production throughout the year and discounting maintenance and growth
respiration. Then, NPP is allocated in three carbon pools: leaves (CL), wood and roots.
The changes in the leaf carbon pool are expressed by the differential Equation 2.1 (Senna,
2008):
����� = ����� − ���� − �. �� (2.1)
Where �� represents the fraction of assimilated carbon to leaves; �� represents the
residence time of carbon in leaves and � is a generic parameter for disturbances (fires and
herbivory, for example) and is fixed in these simulations. Differently than crops, INLAND
considers that the parameters of carbon allocation to different reservoirs in natural
ecosystems are fixed in space and time.

46
The model was calibrated using data from a field experiment held in Viçosa (20º
45' S; 42º 52' W), where Brachiaria brizantha cv. Marandu was cultivated from
September 2013 to April 2014 in no-grazing conditions. Prior to sowing, soil was prepared
conventionally, fertilized and had acidity controlled. Using the data from that experiment,
the model was optimized to CL. The leaf area index (LAI) of each PFT is obtained by
dividing leaves carbon (CL) by specific leaf area. In this study, we derived the specific
leaf area parameter from field data experiment, which was set to 6 m2.kgC-1. The
calibration process involved executing a large number of simulations and, in each one of
them, a different value for ��. In each simulation, the results of the simulated CL are
compared against observed filed data, seeking to minimize the mean absolute error
(MAE). The optimum value of ��and used in INLAND simulations was 2.4 years.
The simulations with the calibrated model of pasture productivity were also run
for the entire South America, with a grid resolution of 1ox1o (~110km x 110km).
2.2.4 Experiment design
2.2.4.1 Land use and climate change scenarios
Similarly to the numerical experiment designed to assess the change in soybean in
response to climate change until the middle of the century, we also conducted two sets of
simulations, from 2011 to 2050, to estimate the change in pasture productivity. We also
assessed and contrasted two extreme climate change scenarios, RCP8.5 and
LUCID+PC13 (with more intense land use), which were fully depicted in section 1.2.4.2.

47
2.2.4.2 Significance tests
For each group of simulations described in section 1.2.4.2, we averaged the outputs
of simulations of all ensembles and created an average time-series (from 2011 to 2050) of
pasture productivity (P, kgC.ha-1yr-1), therefore reducing the uncertainty and model-
related bias. We then calculated the percentage change (Equation 2.2) and tested the
hypothesis that the average pasture productivity changes from the first to the last decade
in the 2011-2050 period due to climate change.
∆� % = ( � − − � −� − ) � (2.2)
In other words, we test the hypothesis that pasture productivity in 2041-2050
(P2041-2050) is different from the average soybean productivity in 2011-2020 (P2011-2020),
being that difference related to the climate change that occurred between these periods.
We used the Student’s t test, with a 5% level of significance and n = 10 years to test this
hypothesis, in the two groups of simulations described in section 1.2.4.2.
2.3 RESULTS
In general, pasture productivity (P) is predicted to decrease in almost all Brazilian
territory until 2050, according to both RCP8.5 and LUCID+PC13 simulations, even
though they differ in the magnitude of the change (Figure 2.3). The change in pasture

48
productivity for each individual climate model used is available in Appendix A (Figures
A5, A6, A7 and A8 and Tables A5 and A6).
In RCP8.5, pasture productivity decreases modestly in most of the study area,
ranging from 0 to 10% decrease, except for southern Bahia and northern Minas Gerais,
where the reductions are slightly higher and reach values close to 15% (Figure 2.3-a).
However, although for LUCID+PC13 simulations, where deforestation levels are higher,
the general spatial patterns of pasture productivity decrease resembles the results from
RCP8.5 simulations, it declines more sharply. The most affected regions are located in an
area extended from southern to northern cost of Bahia state, northeastern Minas Gerais,
western Mato Grosso, Mato Grosso do Sul and Rondônia states, where it decreases more
than 20% from 2011-2020 to 2041-2050 (Figure 2.3-b).
In addition, in southern regions pasture productivity slightly increases (< 5 %)
according to both RCP8.5 and LUCID+PC13 simulations.
Regional averages for the most productive Brazilian regions show that, as well as
in the soybean simulations, MATOPIBA pasture productivity is predicted to be the most
affected after climate change, losing 6% according to RCP8.5 and 11.5% according to
LUCID+PC13. NB and CB pasture productivity decreases very similarly to MATOPIBA,
dropping 4% and 3% in RCP8.5 and 10% and 9% in LUCID+PC13, respectively (Table
2.2).

49
Figure 2.3 – Percentage change in pasture productivity from 2011-2020 to 2041-2050 after
climate change. In (a) atmospheric composition and land use trajectories are
according CMIP5’s RCP8.5 scenario. In (b) atmospheric composition
trajectories are according to CMIP5’s RCP8.5 scenario, but land use
trajectories are according to Pires and Costa (2013) tropical deforestation
scenarios.
In contrast to the other regions, SB pasture productivity is predicted to slightly
increase until 2050 according to simulations. This simulated slight increase, although not
statistically significant, may be a consequence of the increased CO2 atmospheric
concentration (Table 2.2).
(a) (b)

50
Table 2.2 – Change in pasture productivity from 2011-2020 to 2041-2050 for different
Brazilian productive regions. In the second column, both atmospheric
composition and land-use change trajectories are according to RCP8.5. In the
third column, atmospheric composition is according to RCP8.5 and land use
change is according to (Pires and Costa, 2013).
Pasture productivity change
according to RCP8.5
Pasture productivity change
according to LUCID+PC13
Region PRCP8.5 (2041-2050) –
PRCP8.5 (2011-2020) (%) PLUCID+PC13 (2041-2050) –
PLUCID+PC13 (2011-2020) (%)
MATOPIBA -6.0* -11.5*
NB -4.0* -10.4*
CB -3.4 -9.2*
SB 2.1 3.4
(*) Statistically significant according to Student’s t test, α=5% (n = 10).
Similarly to soybeans simulation, in Central-Northern Brazilian regions,
LUCID+PC13 show sharper decrease in pasture productivity than RCP8.5. Sharper
decreases in LUCID+PC13 simulations may also be related to a sharper decrease in
precipitation in LUCID+PC13 than in RCP8.5 scenario (Figure 2.4). However, for
southern Brazilian regions, which are relatively far from the additional Amazon and
Cerrado deforested area in LUCID+PC13, both scenarios agree on the change in
precipitation (Figure 2.4), leading to a similar simulated trend in pasture productivity until
2050.

51
Figure 2.4 – Change in yearly precipitation (mm/yr) from 2011-2020 to 2041-2050 after
climate change to the most productive Brazilian regions, as in RCP8.5 (circles
and solid lines are the average and the models range, respectively) and
LUCID+PC13 5 (triangles and dashed lines are the average and the models
range, respectively).
2.4 DISCUSSION AND CONCLUSIONS
Clearing and burning natural forests and savannas and replacing it by cattle
ranches has been the main driver of agricultural expansion and environmental degradation
in central-northern Brazil. As a low-cost manner to own land, the implementation of
pastures were the main primary use of land after deforestation, and were pushed into new
areas whereas gradually replaced by other agricultural uses, as soybeans, for example. As
-400
-300
-200
-100
0
100
200MATOPIBA NB CB SB
Pre
cipi
tatio
n ch
ang
e fr
om 2
011
-20
20 to
204
1-20
50 (
mm
/yr)
RCP8.5 LUCID+PC13

52
a result, it currently represents around 68% of the total agricultural area in Brazil, with a
great share of degraded and underproductive pasturelands due to the long-lasted
unsustainable use of land resources.
Given this current scenario, it is clear that to increase total meat output while
meeting sustainability needs requires the restoration of vast areas of degraded pasture and
improvements in cattle management practices. Such practices have been shown to be
successful when tested in Brazilian experimental farms, but not extensively adopted by
farmers. However, besides management practices there is another factor that may
determine the successful increase in cattle meat output in the future: climate change.
As the results of this work indicate, global climate change may cause negative
impacts in pasture productivity in nearly entire main Brazilian productive regions, despite
the scenario or climate model used. In addition, although global climate change has
limited negative impact in pasture productivity until 2050 (regional averages to the most
productive regions lead to less than 6% of productivity decrease), continued deforestation
may cause productivity loss at least twice as large in the existing pasturelands in central-
northern Brazilian productive regions. As well as in the case of soybeans, MATOPIBA is
predicted to be the most affected region, followed closely by Northern Brazilian states of
Mato Grosso, Pará and Rondônia. However, even though climate change will negatively
affect pasture productivity until 2050, non-simulated elements have been shown to be of
great importance in increasing stocking rates in Brazil: as well as Cohn et al. (2014) who
showed that economic incentives can increase productivity by 2.5 times, Pedro and

53
Zimmer (2011) show that the recovery of degraded pastures in Mato Grosso can increase
stocking rate by 2.6 times.
Despite the limited negative impact in pasture productivity in the most productive
Brazilian regions, this study demonstrates that the increased productivity loss for higher
deforestation levels reinforces the recommendations of intensification of cattle ranching
in the existing low-productive farms – a country average 1.36 heads per hectare in 2010
(IBGE, 2010) – as a win-win strategy. Intensification, as opposed to extensification, brings
obvious ecological benefits (less environmental degradation and biodiversity
preservation, for example) but also directly benefits crops through climate regulation, an
ecosystem service that agriculture relies on.
Finally, these results reinforce the need to continue and to expand important
governmental public policies and programs that directly or indirectly help to curb the
expansion of the agricultural frontier in central-northern Brazil and to preserve the
services it provides. Examples of existing programs that aim to directly curb deforestation
are: (i) the Action Plan for Prevention and Control of Deforestation in the Legal Amazon
(Plano de Ação para Prevenção e Controle do Desmatamento na Amazônia Legal –
PPCDAm); (ii) the Action Plan for Prevention and Control of Deforestation and Fires in
the Cerrado (Plano de Ação para Prevenção e Controle do Desmatamento e das
Queimadas no Cerrado - PPCerrado). In addition, as important to sustainable livestock
agriculture as the previous mentioned programs, is other national policy to reduce
greenhouse gas emissions as the Sector Plan for Mitigation and Adaptation to Climate
Change for the consolidation of a Low Carbon Economy in Agriculture, also called Plan

54
ABC (Low Agriculture Carbon Emission), which indirectly contributes to the
maintenance of this ecosystem service provided by Amazon and the Cerrado.

55
CHAPTER 3
GENERAL CONCLUSIONS
3.1 THESIS OVERVIEW
The world will face the challenge to feed more than 2 billion additional people
until the middle of this century while agriculture moves to a new standard of not driving
environmental degradation and while severe climate changes take place, and Brazilian
agriculture will play an important role to achieve this goal. Currently, greenhouse gas
emissions are high and very close to IPCC’s most pessimistic scenario (Fuss et al., 2014)
and there is limited evidence that deforestation in Brazil is coming to its end (Lapola, et
al., 2014).
This thesis investigates if the effects of these two forcings ‒ global climate change
until the middle of the century and additional deforestation ‒ will affect the productivity
of the main agricultural commodities produced in Brazil (soybeans and cattle pasture)
using the climate simulated by four climate models in two different climate change
scenarios as input to a gridded crop model. To study this subject, this thesis is divided in
two chapters, one for each crop, and the conclusion of each chapter is summarized below.
Chapter 1 investigates the effects of two climate change scenarios (the main
difference between them is the amount of deforested area) in soybean productivity of the

56
main Brazilian productive regions, contrasting its effects in different planting dates. The
main conclusions are:
In central-northern Brazilian productive regions, if soybeans are planted early
(planted right after the end of the sanitary break, in September-October, in case
farmers choose to adopt double-cropping systems and want to grow maize right after
soybean has been harvested), productivity is predicted to decrease. This is related to
a more intense decreasing trend in precipitation during these months of the year, when
large-scale land-ocean interactions are less influent.
For all regions, if soybean is planted in later dates (November-December, when
climate conditions are more favorable, and farmers do not choose to plant a second
crop), its productivity increases due to a smaller water deficit and the positive effects
of an increased atmospheric CO2 concentration.
Simulations also show that the continuation of deforestation until 2050 causes
increased water deficit, particularly in regions that are close to the deforested area,
and leads to more intense productivity loss in the existing Brazilian soybean
productive regions.
Finally, moving the planting operation in MATOPIBA and MT regions to later dates
diminishes productivity losses or even leads to an increase in yields, but lowers the
probability to adopt double-cropping systems. Therefore, results indicate that the total
soybean + maize output in Brazil may be threatened until the middle of the century.

57
Chapter 2 assesses the effects of the same climate change scenarios in pasture
productivity. The main conclusions are:
Simulations show that, as well as in the case of soybeans, pasture productivity is
predicted to decrease in central-northern Brazilian regions and slightly increase in
southern regions.
The most affected regions is also MATOPIBA, followed closely by Northern
productive regions as Mato Grosso, Pará and Rondônia states.
Finally, as well as for soybean simulations, the continuation of deforestation until
2050 causes increased water deficit and lead to at least twice as large productivity
losses in Brazilian cattle productive regions than in the scenario with lower
deforestation levels.
3.2 CONCLUSIONS
In conclusion, climate change mainly characterized by reductions in precipitation,
especially in the transition months from the dry to the wet season, may negatively affect
the productivity of the main agriculture commodities produced in Brazil until 2050. Early
soybean cultivars planted in central-northern Brazil in the transition from dry to wet
season are the most negatively affected in our simulations, followed by pasture
productivity. Soybeans planted in months when the wet season is established may increase
in response to the positive physiological effects of an increased CO2 concentration and a

58
smaller water deficit. Additional deforestation to create new farms to compensate
productivity loss and increase production may be a self-defeating strategy as it feedbacks
negatively on yields and causes further productivity loss.
The analysis of the results found in chapters 1 and 2 indicates that climate change
may pose the challenge to sustain the current levels of productivity and total output in the
existing farmlands in Brazil. While pasture productivity is less negatively affected than
soybeans and non-simulated existing elements may counteract climate-induced negative
trends, total output of double-cropping systems may be unsustainable until the middle of
the century if technological advances do not take place. Therefore, before considering
increase in the production, in the next decades the first challenge in Brazil will be to
maintain the current levels of productivity in the imminence of climate change. To this
end, the halt of deforestation and technological solutions focused on the initial stages of
soybean cycle, the development of new productive cultivars that have shorter cycles than
the current ones, the widespread recovery of degraded pasturelands and the adoption of
recommended pasture management practices are solutions required to avoid such
productivity losses.
According to all simulations, the regions most affected are either the major
Brazilian production region (Mato Grosso) or where the exploration has begun more
recently and still hold an expressive agriculture potential as MATOPIBA, a region that
has attracted farmers from different parts of the country due to particularities as the low
prices of land and a suitable-for-mechanization topography. This latter productive region
may be the last expanding agriculture frontier in the world, and is considered by the

59
Brazilian Ministry of Agriculture as strategic to the economic development of the country.
While the government intends to support the development of local farmers (Decree no
8.447), there is not an indication that adaptation to climate change is considered in the
MATOPIBA development strategy. However, the results presented here imply that the
ongoing massive investments in such regions, in the absence of adequate consideration of
the climate risks associated to global and regional climate change, are a high-risk
government strategy.
In addition, the results presented here are crucial for two ongoing debates. First, in
case these scenarios are confirmed and existing farmlands increasingly become less
productive, there is a potential for the pressure of clearing new lands and continue to
increase output to meet global demand for food. However, this study demonstrates that
increasing total output by expanding the planted area over natural vegetation may be a
self-defeating strategy. Sustainably increasing agricultural production requires halting
deforestation in Brazil, not just for biodiversity preservation purposes, but also to the
health of the agricultural system itself. This information makes clear that increasing
agricultural performance and the preservation of natural ecosystems are part of the same
sustainability goal.
Second, such type of climate projections need to be increasingly incorporated into
planning, decision and policymaking. The information collected in crop-climate
projections are important in at least three cases: the identification of potentially threatened
regions (the cases of Mato Grosso and MATOPIBA), which should concentrate adaptation

60
and mitigation efforts; the definition of new technology-developing goals and serve as a
subsidy to biomes governance, territory planning and sustainable development.
In this later point, crop-climate projections could motivate an improvement in
Brazilian conservation performance by conciliating agriculture (main driver of
deforestation) and environmental protection. So far, Brazilian conservation policies are
weak, and while it may fail to protect the biomes (only 46% and 7% of Amazonia and
Cerrado, respectively, are under protection – Soares-Filho et al., 2014), it still may not
safeguard a sustainable highly productive agriculture. Brazilian revised Forest Code
allows an additional 39.9 Mha and 7.3 Mha of legal deforestation in Cerrado and
Amazonia, respectively, consisting in an environmental “surplus” of native vegetation
(Soares-Filho et al., 2014). Also, even though undeniable progress has been made in the
recent years to preserve the Amazon, similar efforts to preserve other Brazilian biomes,
such as the Cerrado, are not on course. According to the Forest Code, landowners are
required to set a Legal Reserve of 80% of their property area in Amazonia, while the
amount required in Cerrado are is low as 35%. In addition, Brazil’s most recent Intended
Nationally Determined Contribution (INDC) communicated at the Conference of the
Parties (COP) in Paris in 2015, indicates the country’s intention to curb illegal (not total)
deforestation in the Amazon only in 2030 (15 years from now), while there is no mention
to similar commitments to other biomes as the Cerrado, or even the mention to halt total
deforestation.
Finally, to succeed in the challenging task as a global protagonist in increasing
food production until 2050, Brazil will need to review its agriculture and conservation
61
policies and immediately shift to a new standard of zero deforestation in Amazonia and
Cerrado, and create mechanisms to identify and trace solutions to adapt its agriculture,
especially double-cropping systems, to climate change.
3.3 RECOMMENDATIONS FOR FUTURE RESEARCH
The results presented in this thesis, while elucidated some points, also provoked some
new questions. Therefore, I recommend that future work should investigate the following
themes:
Further simulations of the effects of climate change on double-cropping systems, but
with explicit reproduction of the maize cycle after soybean is harvested. This more
detailed assessment would certainly improve our knowledge of double-cropping
dynamics in the future.
Field measurements of different soybean cultivars, cultivated in different climates
around the country, to improve the parameter calibration in crop models. Such
measurements should cover the entire cycle and include as many variables simulated
by the model as possible.
The development of a new pasture module in INLAND. The current phenological
representation of pastures in the model is simplistic and was developed with the focus
to simulate dynamic vegetation in the long-term time-scale. A new model, with an
entire new perspective, with the dynamics represented in a daily time-step would be
more suitable for studies that include the explicit representation of cattle grazing.

62
Field measurements of the growth of different forage cultivars around the country to
parametrize the new pasture model. As well as in the case of soybeans, these
measurements should cover the entire cycle and include as many variables as
possible.
Future climate trends explain just part of the problem when it comes to agricultural
production. Another important element is the dynamics of the economy, which
controls prices, allocation of land, etc. Therefore, new studies that include partial or
general equilibrium economical models coupled to the existing crop models are
needed to an improved assessment of the development of agriculture in the future.
Finally, the development of new modeling structure covering all the land use –
climate – agricultural production – economics chain, with fully coupled and
operational models could significantly increase our understanding of all the processes
involved while simulating the individual factors, the interactions between them and
the feedbacks.

63
GENERAL REFERENCES
ADLER, R.F.; HUFFMAN, G.J.; CHANG, A.; FERRARO, R.; XIE, P.-P.; JANOWIAK, J.; RUDOLF, B.; SCHNEIDER, U.; CURTIS, S.; BOLVIN, D.; GRUBER, A.; SUSSKIND, J.; ARKIN, P.; NELKIN, E. The Version-2 Global Precipitation Climatology Project (GPCP) Monthly Precipitation Analysis (1979–Present). Journal of Hydrometeorology, v. 4, p. 1147–1167, 2003. doi:10.1175/1525-7541(2003)004<1147:TVGPCP>2.0.CO;2
ALEXANDRATOS, N. and BRUINSMA, J. World agriculture towards 2030/2050: the 2012 revision. ESA Working paper No. 12-03, 2012. Disponível em: http://www.fao.org/docrep/016/ap106e/ap106e.pdf. Acesso: Nov/2015
ARVOR, D.; DUBREUIL, V.; RONCHAIL, J.; SIMÕES, M.; FUNATSU. B.M. Spatial patterns of rainfall regimes related to levels of double cropping agriculture systems in Mato Grosso (Brazil). International Journal of Climatology , v. 34, p. 2622-2633, 2014. doi:10.1002/joc.3863
BOISIER, J.P.; CIAIS, P; DUCHARNE, A.; GUIMBERTEAU, M. Projected strengthening of Amazonian dry season by constrained climate model simulations. Nature Climate Change, v. 5, p. 656-661, 2015. doi:10.1038/nclimate2658
BOUCHER, D. How Brazil Has Dramatically Reduced Tropical Deforestation. Solutions Journal, v. 5, n. 2., p. 66-75, 2014.
BROVKIN, V.; BOYSEN, L.; ARORA, V.K.; BOISIER, J.P.; CADULE, P.; CHINI, L.; CLAUSSEN, M.; FRIEDLINGSTEIN, P.; GAYLER, V.; VAN DEN HURK, B.J.J.M.; HURTT, G.C.; JONES, C.D.; KATO, E.; DE NOBLET-DUCOUDRE, N.; PACIFICO, F.; PONGRATZ, J.; WEISS, M. Effect of anthropogenic land-use and land-cover changes on climate and land carbon storage in CMIP5 projections for the twenty-first century. Journal of Climate, v. 26, p. 6859–6881, 2013. doi:10.1175/JCLI-D-12-00623.1
BOWMAN, M. S; SOARES-FILHO, B.S.; MERRYE, F. D.; NEPSTAD, D.; RODRIGUES, H.; ALMEIDA, O. Persistence of cattle ranching in the Brazilian Amazon: A spatial analysis of the rationale for beef production. Land Use Policy, v. 29, p. 558–568, 2012.
BUTT, N.; DE OLIVEIRA, P.A.; COSTA, M.H. Evidence that deforestation affects the onset of the rainy season in Rondonia, Brazil. Journal of Geophysical Research, v. 116, p. 2–9, 2011. doi:10.1029/2010JD015174
CENTRO DE ESTUDOS AVANÇADOS EM ECONOMIA APLICADA (CEPEA). PIB do Agronegócio - Dados de 1994 a 2011. 2013. Disponível em: <http://cepea.esalq.usp.br/pib/> Acesso em Abril/2014.

64
CLARK, D. A. Sources or sinks? The responses of tropical forests to current and future
climate and atmospheric composition. Philosophical Transactions of the Royal Society B 359, 477– 491. 2004 doi:10.1098/rstb.2003.1426
COHN, A.S; MOSNIERC, A.; HAVLÍCK, P.; VALINC, H.; HERREROD, M.;
SCHIMDE, E.; O’HAREF, M.; OBERSTEINE, M. Cattle ranching intensification in Brazil can reduce global greenhouse gas emissions by sparing land from deforestation. Proceedings of the National Academy of Sciences, v. 111, n. 20, p. 7236–7241, 2014.
CONAB – Companhia Nacional de Abastecimento. Acompanhamento da safra brasileira
de grãos Safra 2014/15, 1-109, 2015. (www.conab.gov.br)
COSTA, L.C.; JUSTINO, F.; OLIVEIRA, L.J.C.; SEDIYAMA, G.C.; FERREIRA, W.P.M.; LEMOS, C.F. Potential forcing of CO2, technology and climate changes in maize (Zea mays) and bean (Phaseolus vulgaris) yield in southeast Brazil. Environmental Research Letters, v. 4, 014013, 2009. doi:10.1088/1748-9326/4/1/014013
COSTA, M.H.; FOLEY, J. Combined effects of deforestation and doubled atmospheric CO2 concentrations on the climate of Amazonia. Journal of Climate, v. 13, p. 18–34, 2000. doi:10.1175/1520-0442(2000)013<0018:CEODAD>2.0.CO;2
COSTA, M.H.; YANAGI, S.N.M.; OLIVEIRA, P.J.; RIBEIRO, A.; ROCHA, E.J.P. Climate change in Amazonia caused by soybean cropland expansion, as compared to caused by pastureland expansion. Geophysical Research Letters, v. 34, L07706, 2007. doi: 10.1029/2007GL029271.
COSTA, M. H.; PIRES, G. F. Effects of Amazon and Central Brazil deforestation scenarios on the duration of the dry season in the arc of deforestation. International Journal of Climatology, v. 30, p. 1970-1979, 2010. doi: 10.1002/joc.2048.
DIAS, L. C. P.; PIMENTA, F. M.; SANTOS, A. B.; COSTA, M. H.; LADLE, R. J. Patterns of land use, extensification and intensification of Brazilian agriculture, submitted.
DIAS-FILHO, M. B. Recuperação de pastagens e segurança alimentar: uma abordagem histórica da pecuária na Amazônia. Bebedouro: Editora Scot Consultoria, 2013.
FAO. Food and Agriculture Organization of the UN, Statistics Division (FAOSTAT). Disponível em: http://faostat3.fao.org/home/E. Acesso em: jul. 2015.
FLATO, G.; MAROTZKE, J.; ABIODUN, B.; BRACONNOT, P.; CHOU, S. C.;
COLLINS, W.; COX, P.; DRIOUECH, F.; EMORI, S.; EYRING, V.; FOREST, C.; GLECKLER, P.; GUILYARDI, E.; JAKOB, C.; KATTSOV, V.; REASON, C.;

65
RUMMUKAINEN, M. Evaluation of Climate Models. In: STOCKER, T. F.; QIN, D.; PLATTNER, G.-K; TIGNOR, M.; ALLEN, S.K.; BOSCHUNG, J.; NAUELS, A.; XIA, Y.; BEX, V.; MIDGLEY, P.M. (eds.). Climate Change 2013: The Physical Science Basis. Contribution of Working Group I to the Fifth Assessment Report of the Intergovernmental Panel on Climate Change. Cambridge: Cambridge University Press, 2013.
FOLEY, J.A.; PRENTICE, I.C.; RAMANKUTTY, N.; LEVIS, S.; POLLARD, D.;
SITCH, D.; HAXELTINE, A. An integrated biosphere model of land surface processes, terrestrial carbon balance, and vegetation dynamics. Global Biogeochemical Cycles v. 10, p. 603–628, 1996.
FOLEY, J.; RAMANKUTTY, N.; BRAUMAN, K.; CASSIDY, E.S.; GERBER, J.S.; JOHNSTON, M.; MUELLER, N.D.; O’CONNELL, C.; RAY, D.K.; WEST, P.C.; BALZER, C.; BENNETT, E.M.; CARPENTER, S.R.; HILL, J.; MONFREDA, C.; POLASKY, S.; ROCKSTRÖM, J.; SHEEHAN, J.; SIEBERT, S.; TILMAN, D.; ZAKS, D.P.M. Solutions for a cultivated planet. Nature, v. 478, p. 337–342, 2011. doi:10.1038/nature10452
FU, R.; YIN, L.; LI, W.; ARIAS, P.; DICKINSON, R.E.; HUANG, L.; CHAKRABORTY, S.; FERNANDES, K.; LIEBMANN, B.; FISHER, R.; MYNENI, R.B. Increased dry-season length over southern Amazonia in recent decades and its implication for future climate projection. Proceedings of the National Academy of Sciences, v. 110, p. 18110–5, 2013. doi:10.1073/pnas.1302584110
FUSS, S.; CANADELL, J.G.; PETERS, G.P.; TAVONI, M.; ANDREW, R.M.; CIAIS, P.; JACKSON, R.B.; JONES, C.D.; KRAXNER, F.; NAKICENOVIC, N.; LE QUÉRÉ, C.; RAUPACH, M.R.; SHARIFI, A.; SMITH, P.; YAMAGATA, Y. Betting on negative emissions. Nature Climate Change, v. 4, p. 850–853, 2014. doi:10.1038/nclimate2392
GIBBS, H.K; RAUSCH, L.; MUNGER, J.; SCHELLY, I.; MORTON, D.C.; NOOJIPADY, P.; SOARES-FILHO, B.; BARRETO, P.; MICOL, L.; WALKER, N.F. Brazil’s Soy Moratorium: Supply-chain governance is needed to avoid deforestation. Science, v. 347, p. 377-378. doi: 10.1126/science.aaa0181
HANSEN, M.C.; POTAPOV, P. V.; MOORE, R.; HANCHER, M.; TURUBANOVA, S. A.; TYUKAVINA, A.; THAU, D.; STEHMAN, S. V.; GOETZ, S. J.; LOVELAND, R.; KOMMAREDDY, A.; EGOROV, A.; CHINI, L.; JUSTICE, C. O.; TOWNSHEND, J. R. G. High-resolution global maps of 21stcentury forest cover change. Science, v. 342, p. 850-853, 2013. doi: 10.1126/science.1244693.

66
INSTITUTO BRASILEIRO DE GEOGRAFIA E ESTATÍSTICA (IBGE). Sistema IBGE de Recuperação Eletrônica (SIDRA). 2015. Disponível em: http://www.sidra.ibge.gov.br/. Acesso em: jun. 2015.
KUCHARIK, C.J.; TWINE, T.E. Residue, respiration, and residuals: Evaluation of a dynamic agroecosystem model using eddy flux measurements and biometric data. Agricultural and Forest Meteorology, v. 146, p. 134–158, 2007. doi:10.1016/j.agrformet.2007.05.011
LAPOLA, D.M.; MARTINELLI, L.A.; PERES, C.A.; OMETTO, J.P.H.B.; FERREIRA, M.E.; NOBRE, C.A.; LEITE, C.C.; MOUTINHO, P.; SAMPAIO, G.; STRASSBURG, B.B.N.; VIEIRA, I.C.G. Pervasive transition of the Brazilian land-use system. Nature Climate Change, v. 4, p. 27-35, 2014. doi: 10.1038/NCLIMATE2056.
LAWRENCE, D.; VANDECAR, K. The impact of tropical deforestation on climate and links to agricultural productivity. Nature Climate Change, v. 5, p. 27-36. 2015. doi:10.1038/nclimate2430
LEITE, C. C.; COSTA, M. H.; SOARES-FILHO, B. S.; HISSA, L. B. V. Historical land use change and associated carbon emissions in Brazil from 1940 to 1995, Global Biogeochemical. Cycles, v. 26, GB2011, 2012. doi:10.1029/2011GB004133.
MALHI, Y.; ROBERTS, J. T.; BETTS, R. A.; KILLEEN, T. J.; LI, W.; NOBRE, C. A. Climate Change, Deforestation and the Fate of the Amazon, Science, v. 319, p. 169-172, 2008. doi: 10.1126/science.114696.
NELSON, G.C.; VALIN, H.; SANDS, R.D.; HAVLÍK, P.; AHAMMAD, H.; DERYNG, D.; ELLIOT, J.; FUJIMORI, S.; HASEGAWA, T.; HEYHOE, E.; KYLE, P.; LAMPE, M. V.; LOTZE-CAMPEN, H.; D’CROZ, D. M.; MEIJL, H. V.; MENSBRUGGHE , D. V. D.; MULLER, C.; POPP, A.; ROBERTSON, R.; ROBINSON, S.; SCHMID, E.; SCHMITZ, C.; TABEAU, A.; WILLENBOCKEL, D. Climate Change effects on agriculture: Economic responses to biophysical shocks, Proceedings of the National Academy of Sciences, v. 111, p. 3274- 3279, 2014. doi 10.1073/pnas.1222465110.
NOBRE, C. A. UNsustainable? Science, v. 336, p. 1361-1361, 2012. doi: 10.1126/science.1225343
OECD-FAO. 2010. Agricultural Outlook 2010-2019. Disponível em http://www.oecd.org/site/oecd-faoagriculturaloutlook/. Acesso em nov/2013
OECD/FAO (2015). OECD-FAO Agricultural Outlook 2015-2024. doi: 10.1787/agr_outlook-2015-en

67
OLIVEIRA, L.J.C.; COSTA, M.H.; SOARES-FILHO, B.S.; COE, M.T. Large-scale expansion of agriculture in Amazonia may be a no-win scenario. Environmental Research Letters, v. 8, 024021, 2013. doi:10.1088/1748-9326/8/2/024021.
PEDREIRA, B. C.; ZIMMER, A. H. Estratégias de recuperação de pastagens. Cuiabá:
Embrapa Agrossilvipastoril e Embrapa Gado de Corte, nov./2011. 164p. PIRES, G. F.; COSTA, M. H. Deforestation causes different sub-regional effects on the
Amazon bioclimatic equilibrium. Geophysical Research Letters, v. 40, p. 1-6, 2013. doi:10.1002/grl.50570.
PRODES – Monitoramento da Floresta Amazônica Brasileira por Satélite. Instituto
Nacional de Pesquisas Espaciais (INPE), São José dos Campos, São Paulo. Disponível em: www.obt.inpe.br/prodes
RIAHI, K.; RAO, S.; KREY, V.; CHO, C.; CHIRKOV, V.; FISCHER, G.; KINDERMANN, G.; NAKICENOVIC, N.; RAFAJ, P. RCP 8.5-A scenario of comparatively high greenhouse gas emissions. Climate Change, v. 109, p. 33–57, 2011. doi:10.1007/s10584-011-0149-y
ROSENZWEIG, C.; ELLIOTT, J.; DERYNG, D.; RUANE, A. C.; MÜLLER, C.; ARNETH, A.; BOOTE, K.J.; FOLBERTH, C.; GLOTTER, M.; KHABAROV, N.; NEUMANN, K.; PIONTEK, F.; PUGH, T. A. M.; SCHMID, E.; STEHFEST,E.; YANG, H.; JONES, J.W. Assessing agricultural risks of climate change in the 21st century in a global gridded crop model intercomparison. Proceedings of the National Academy of Sciences, v. 111, p. 3268-3273, 2014. doi: 10.1073/pnas.1222463110.
SAMPAIO, G.; NOBRE, C.A.; COSTA, M. H.; SATYAMURTY, P.; SOARES-FILHO,
B. S.; CARDOSO, M. Regional climate change over eastern Amazonia caused by pasture and soybean cropland expansion. Geophysical Research Letters, v. 34, L17709, 2007. doi:17710.11029/12007GL030612.
SELLERS, P. J.; BOUNOUA, L.; COLLATZ, G.J.; RANDALL, D.A.; DAZLICH, D.A.;
LOS, S.O.; BERRY, J.A.; FUBG, I.; TUCKER, C.J.; FIELD, C.B.; JENSEN, T.G. Comparison of radiative and physiological effects of doubled atmospheric CO2 on climate. Science, v. 271, p. 1402-1406, 1996.
SENNA, M. C. A. Capacidade de regeneração da floresta tropical amazônica sob
deficiência nutricional: resultados de um estudo numérico da interação biosfera-atmosfera. 2008, 139p. PhD thesis in Agricultural Meteorology, Federal University of Viçosa, Viçosa, MG.
SOARES-FILHO, B.S.; NEPSTAD, D.C.; CURRAN, L.M.; CERQUEIRA, G.C.; GARCIA, R.A.; RAMOS, C.A.; VOLL, E.; MCDONALD, A.; LEFEBVRE, P.;

68
SCHLESINGER, P. Modelling conservation in the Amazon basin. Nature, v. 440, p. 520–523, 2006. doi:10.1038/nature04389
SOARES-FILHO, B.S.; RAJÃO, R.; MACEDO, M.; CARNEIRO, A.; COSTA, W.; COE, M.; RODRIGUES, H.; ALENCAR, A. Cracking Brazil’s Forest Code. Science, v. 344, p. 363-364, 2014. doi: 10.1126/science.1246663
SPRACKLEN, D. V.; ARNOLD, R. S.; TAYLOR, C.M. Observations of increased tropical rainfall preceded by air passage over forests. Nature, v. 489, p. 282–85, 2012. doi:10.1038/nature11390.
TAYLOR, K. E.; STOUFFER, R. J.; MEEHL, G. A. An overview of CMIP5 and the experiment design. Bulletin of the American Meteorological Society, v. 93, p. 485–498, 2012. doi: http://dx.doi.org/10.1175/BAMS-D-11-00094.1
TILMAN, D.; BALZER, C.; HILL, J.; BEFORT, B. L.. Global food demand and the sustainable intensification of agriculture. Proceedings of the National Academy of Sciences, v. 108, p. 20260-20264, 2011. doi:10.1073/pnas.1116437108
TOLLEFSON, J. The Global Farm – With its plentiful sun, water and land, Brazil is
quickly surpassing other countries in food production and exports. But can it continue to make agricultural gains without destroying the Amazon? Nature, v. 466, p. 554-556, 2010. doi: doi:10.1038/466554ª
WALKER, R.; MOORE, N.J.; ARIMA, E.; PERZ, S.; SIMMONS, C.; CALDAS, M.;
VERGARA, D.; BOHRER, C. Protecting the Amazon with protected areas. Proceedings of the National Academy of Sciences USA, v. 106, p. 10582−10586, 2009. doi:10.1073/pnas.0806059106
WORLD TRADE ORGANIZATION (WTO). Trade in Agricultural Products. 2010.
Disponível em: <http://www.wto.org/english/res_e/statis_e/world_commodity_profiles09_e.pd f.> Acesso em Abril/2014.

69
APPENDIX A
A1 – Soybean productivity change according to each climate model
Figure A.1 – Percentage change in soybean yield from 2011-2020 to 2041-2050 after
climate change, as simulated by HadGEM2-ES. In (a) and (b) atmospheric
composition and land use trajectories are according CMIP5’s RCP8.5
scenario. In (c) and (d), atmospheric composition trajectories are according to
CMIP5’s RCP8.5 scenario, but land use trajectories are according to Pires and
Costa (2013) tropical deforestation scenarios.
(c) (d)
(a) (b)
ESOY / RCP8.5 HSOY / RCP8.5
ESOY / LUCID+PC13 HSOY / LUCID+PC13

70
Figure A.2 – Percentage change in soybean yield from 2011-2020 to 2041-2050 after
climate change, as simulated by MIROC-ESM . In (a) and (b) atmospheric
composition and land use trajectories are according CMIP5’s RCP8.5
scenario. In (c) and (d), atmospheric composition trajectories are according to
CMIP5’s RCP8.5 scenario, but land use trajectories are according to Pires and
Costa (2013) tropical deforestation scenarios.
(c) (d)
(a) (b)
ESOY / RCP8.5 HSOY / RCP8.5
ESOY / LUCID+PC13 HSOY / LUCID+PC13

71
Figure A.3 – Percentage change in soybean yield from 2011-2020 to 2041-2050 after
climate change, as simulated by MRI-CGCM3 , with atmospheric
composition and land use trajectories according CMIP5’s RCP8.5 scenario.
Figure A.4 – Percentage change in soybean yield from 2011-2020 to 2041-2050 after
climate change, as simulated by NorESM1-M , with atmospheric composition
and land use trajectories according CMIP5’s RCP8.5 scenario.
(a) (b)
ESOY / RCP8.5 HSOY / RCP8.5
(a) (b)
ESOY / RCP8.5 HSOY / RCP8.5

72
Table A.1 – Change in soybean productivity from 2011-2020 to 2041-2050 for different
Brazilian productive regions, according to different climate models, for early
cultivars (1600 GDD) planted in Sep 25th (ESOY). Both atmospheric
composition and land-use change trajectories are according to RCP8.5.
YRCP8.5 (2041-2050) – YRCP8.5 (2011-2020) (%)
Region HadGEM2-ES MIROC-ESM MRI-CGCM3 NorESM1-M
MATOPIBA 13.4 -62.8 -56.2 -40.9
MT -6.6 -76.1 24.8 -26.0
CB -3.5 -18.0 7.1 -25.8
SB 8.5 17.5 17.8 9.1
Table A.2 – Change in soybean productivity from 2011-2020 to 2041-2050 for different
Brazilian productive regions, according to different climate models, for early
cultivars (1600 GDD) planted in Sep 25th (ESOY). Atmospheric composition
is according to RCP8.5 and land use change is according to (Pires and Costa,
2013).
YLUCID+PC13 (2041-2050) –Y LUCID+PC13 (2011-2020) (%)
Region HadGEM2-ES MIROC-ESM
MATOPIBA -49.8 -79.3
MT -46.1 -93.6
CB -11.1 -54.2
SB 22.0 12.2

73
Table A.3 – Change in soybean productivity from 2011-2020 to 2041-2050 for different
Brazilian productive regions, according to different climate models, for
optimum cultivar and planting date (HSOY). Both atmospheric composition
and land-use change trajectories are according to RCP8.5.
YRCP8.5 (2041-2050) – YRCP8.5 (2011-2020) (%)
Region HadGEM2-ES MIROC-ESM MRI-CGCM3 NorESM1-M
MATOPIBA 12.4 14.8 2.8 39.4
MT 8.2 -6.0 6.6 17.7
CB 7.9 5.3 5.9 28.4
SB 14.4 9.0 12.5 10.9
Table A.4 – Change in soybean productivity from 2011-2020 to 2041-2050 for different
Brazilian productive regions, according to different climate models, for
optimum cultivar and planting date (HSOY). Atmospheric composition is
according to RCP8.5 and land use change is according to (Pires and Costa,
2013).
YLUCID+PC13 (2041-2050) –Y LUCID+PC13 (2011-2020) (%)
Region HadGEM2-ES MIROC-ESM
MATOPIBA -1.4 14.6
MT 9.1 5.0
CB 7.0 4.7
SB 20.1 11.2

74
A2 – Pasture productivity change according to each climate model
Figure A.5 – Percentage change in pasture productivity from 2011-2020 to 2041-2050
after climate change, according to HadGEM2-ES. In (a) atmospheric
composition and land use trajectories are according CMIP5’s RCP8.5
scenario. In (b) atmospheric composition trajectories are according to
CMIP5’s RCP8.5 scenario, but land use trajectories are according to Pires and
Costa (2013) tropical deforestation scenarios.
(a) (b)

75
Figure A.6 – Percentage change in pasture productivity from 2011-2020 to 2041-2050
after climate change, according to MIROC-ESM . In (a) atmospheric
composition and land use trajectories are according CMIP5’s RCP8.5
scenario. In (b) atmospheric composition trajectories are according to
CMIP5’s RCP8.5 scenario, but land use trajectories are according to Pires and
Costa (2013) tropical deforestation scenarios.
(a) (b)

76
Figure A.7 – Percentage change in pasture productivity from 2011-2020 to 2041-2050
after climate change, according to MRI-CGCM3 . Atmospheric composition
and land use trajectories are according CMIP5’s RCP8.5 scenario.
Figure A.8 – Percentage change in pasture productivity from 2011-2020 to 2041-2050
after climate change, according to MRI-CGCM3 . Atmospheric composition
and land use trajectories are according CMIP5’s RCP8.5 scenario.

77
Table A.5 – Change in pasture productivity from 2011-2020 to 2041-2050 for different
Brazilian productive regions, according to different climate models. Both
atmospheric composition and land-use change trajectories are according to
RCP8.5.
PRCP8.5 (2041-2050) – PRCP8.5 (2011-2020) (%)
Region HadGEM2-ES MIROC-ESM MRI-CGCM3 NorESM1-M
MATOPIBA -5.8 -4.4 -11.3 15.5
MT -3.6 -9.4 -1.8 -0.7
CB 0.7 -11.5 -5.2 13.3
SB 8.0 -0.7 10.1 -7.6
Table A.6 – Change in pasture productivity from 2011-2020 to 2041-2050 for different
Brazilian productive regions, according to different climate models.
Atmospheric composition is according to RCP8.5 and land use change is
according to (Pires and Costa, 2013).
PLUCID+PC13 (2041-2050) –P LUCID+PC13 (2011-2020) (%)
Region HadGEM2-ES MIROC-ESM
MATOPIBA -13.8 -10.7
MT -9.3 -12.1
CB -6.1 -14.3
SB 7.8 -4.2
![Agricultural Productivity, Comparative Advantage, and ...lib.cufe.edu.cn/upload_files/other/4_20140530024310_[59]matsuyama... · Agricultural Productivity, Comparative Advantage,](https://static.fdocuments.in/doc/165x107/5b1eab367f8b9a22028bd7eb/agricultural-productivity-comparative-advantage-and-libcufeeducnuploadfilesother42014053002431059matsuyama.jpg)