Climate Change and Health Impacts: How Vulnerable Is...
93
1 Climate Change and Health Impacts: How Vulnerable Is Bangladesh and What Needs to Be Done? Draft Final Report April 18, 2014 DISASTER RISK AND CLIMATE CHANGE UNIT, SUSTAINABLE DEVELOPMENT DEPARTMENT, SOUTH ASIA REGION .
Transcript of Climate Change and Health Impacts: How Vulnerable Is...

1
Climate Change and Health Impacts: How Vulnerable Is Bangladesh and What Needs to Be Done?
Draft Final Report
April 18, 2014
DISASTER RISK AND CLIMATE CHANGE UNIT, SUSTAINABLE DEVELOPMENT
DEPARTMENT, SOUTH ASIA REGION
.

2
Contents Abbreviations .................................................................................................................................. 6
Foreword ......................................................................................................................................... 7
Acknowledgments........................................................................................................................... 9
Executive Summary ...................................................................................................................... 10
Organization of the report ......................................................................................................... 11
A summary of the key findings ................................................................................................. 11
Chapter 1: Health and Climate Change Pathways and the Bangladesh Context .......................... 14
1.1 Pathways from Climate to Health ....................................................................................... 15
1.2 The Bangladesh Context ................................................................................................ 16
Climate conditions and climate change projections .............................................................. 16
Major health issues ................................................................................................................ 17
Chapter 2: Quantifying the Health Impact of Climate Variability on Childhood Illnesses .......... 22
2.1 Key Data Sources ................................................................................................................ 23
Weather data .......................................................................................................................... 23
The Bangladesh national health surveys ............................................................................... 24
2.3 Quantifying the Health Impact of Climate Variability........................................................ 27
The analytical model ............................................................................................................. 27
Seasonality of disease incidence ............................................................................................ 28
The impact of climate on disease incidence .......................................................................... 29
Impact of household environmental conditions on health ..................................................... 32
2.3 Summary of Results ............................................................................................................ 35
2.4 Projecting Future Health Burden......................................................................................... 35
2.6 Key Messages ...................................................................................................................... 39
Chapter 3: Vector-Borne Diseases: Hotspots and Climate Linkages ........................................... 41
3.1 The Epidemiology of Vector-Borne Diseases ..................................................................... 42
3.2 Key Data Sources and Issues for VBDs .............................................................................. 43
3.3 The Temporal and Spatial Distribution of VBDs................................................................ 45
Temporal and seasonal trends ................................................................................................ 45
Disease hotspots .................................................................................................................... 46
3.4 Statistical Correlation between Climate Conditions and VBDs.......................................... 47
Dengue fever .......................................................................................................................... 47
Malaria ................................................................................................................................... 48
Kala-azar ................................................................................................................................ 49

3
3.5 Summary of Results ............................................................................................................ 50
3.6 Key Messages ...................................................................................................................... 51
Chapter 4: Population Dynamics and Spatial Targeting: Implications for Climate Change and
Health ............................................................................................................................................ 52
4.1 Key Features of Population Dynamics ................................................................................ 52
4.2 Measuring Health Adaptation Capacity .............................................................................. 55
4.3 Assessing the Efficiency of Geographic Targeting ............................................................. 56
4.4 Key Messages ...................................................................................................................... 59
Chapter 5: Cost-Effectiveness Analysis of Health Adaptation Interventions ............................... 61
5.1 Why Cost-Effectiveness Analysis Rather Than Cost-Benefit Analysis? ............................ 62
5.2 An Application of Cost-Effectiveness Analysis in Health Adaptation Interventions ......... 63
Benefit estimation .................................................................................................................. 63
Cost estimation ...................................................................................................................... 65
Cost-effectiveness analysis: An illustration .......................................................................... 66
5.3 Key Messages ...................................................................................................................... 68
Chapter 6: Conclusions and Way Forward ................................................................................... 69
6.1 Key Messages ...................................................................................................................... 69
6.2 Way Forward ....................................................................................................................... 70
Appendix A: Data Source for Water- and Vector-Borne Diseases ............................................... 72
Appendix B: Climate and Natural Disaster Data .......................................................................... 74
Appendix C: National Health and Facility Survey ....................................................................... 76
Health Facility Survey ............................................................................................................... 76
Urban Health Survey ................................................................................................................. 76
Appendix D: Analytical Results ................................................................................................... 78
Table D.1 Logit Regression Results Using Full Sample (Odds Ratio) (Random-Effect
Estimation) .................................................................................................................................... 78
Table D.2 Logit Regression Results Using Urban Households (Odds Ratio) (Random-Effect
Estimation) .................................................................................................................................... 79
Table D.3 Logit Regression Results Using Rural Households (Odds Ratio) (Random-Effect
Estimation) .................................................................................................................................... 80
Table D.4 Estimation of Marginal Impact on the Incidence of Childhood Illness and Malnutrition
(Odds Ratio), 2011 DHS ............................................................................................................... 81
Table D.5 District-Level Change in Population, 2001–2010 ....................................................... 83
Table D.6 Spatial Analysis: Disease Incidence versus Local Capacity, 2011 .............................. 85
Appendix E: Policy Simulation of Health Impact ........................................................................ 87
References ..................................................................................................................................... 89

4
92
Boxes
Box 1.1 Weather and Climate Variability vs. Climate Change
Box 2.1 The Model
Box 2.2 Key Assumptions for Projection of Disease Burden by 2050 Box 3.1 Major VBDs in Bangladesh
Box 4.1 Issue of Sampling Bias Box 5.2 Cost of Adaption Options
Box 5.3 Two Major Nutrition Projects of Inclusive Impact
Figures
Figure 1.1 Pathways from Climate Change to Health
Figure 2.1 Average Monthly Weather Variables by Region and Month
Figure 2.2 Maps of 2004 and 2007 DHS Survey Locations
Figure 2.3 Spatial Distribution of Disease Incidence, Temperature, and Floods by 2050
Figure 3.1 Trends and Monthly Disease Patterns of VBDs
Figure 3.2 Geographic Distributions of VBDs in 2011
Figure 4.1 Population Density and Growth
Figure 4.2 Spatial Distribution of Overall Health Adaptation Capacity
Figure 4.3 Correlation between Health Facility and Disease Incidence: 2010 District Level Data
Tables
Table 1.1 Estimated Total Deaths by Cause: Bangladesh
Table 1.2 Child Health: Incidence of Illnesses and Malnutrition (%)
Table 1.3 Major Infectious Diseases: Cases and Deaths
Table 2.2 Household Distribution in 2004 and 2007 DHS by Region and Survey Month
Table 2.3 Summary of Key Variables in 2004 and 2007 DHS
Table 2.4 Disease Incidence by Survey Month and Season: 2004 and 2007 DHS
Table 2.5 The Impact of Climate Variables on Disease Incidence: 2004 and 2007 DHS
Table 2.6 The Impact of Water and Sanitation Facilities on Disease Incidence (2004 and 2007):
Odds Ratio
Table 2.7 Health Burden Projection by 2050
Table 2.8 Health Impact Simulation by 2030: Development vs. Climate Change
Table 3.1 Key Data Sources for VBDs
Table 3.2 Spearman Rank Correlation of Dengue Cases and Climatic Factors
Table 3.3 Spearman Correlation between Malaria Cases and Climate Conditions
Table 3.4 Spearman Rank Correlations of Kala-azar Cases and Climatic Factors
Table 4.1 Spatial Analysis: Disease Incidence vs. Local Capacity (2011)
Table 4.1.1 Potential Bias of Health Indicators of Urban Population: An Example of Dhaka

5
Table 4.2 Pearson Correlation Coefficient between Adaptation Capacity and Disease Incidence:
2011
Table 5.1 Summary of Methods for Benefit Quantification
Table 5.2 Major Cyclones (1970-2009)
Table 5.3 Cost Benefit Analysis: Comparison of Three Adaptation Options
Table A.1 Health MIS: Diseases and Coverage
Table A.2 IEDCR Data Sources
Table A.3 Diarrheal Disease and Enteric Infection Surveillance
Table A.4 Bangladesh Demographic and Health Survey (DHS)
Table B.1 Weather and Disaster Management Data System
Table C.1 The Number of Health Facilities Selected for the 2011 Health Facility Survey
Table D.1 Logit Regression Results Using Full Sample (Odds Ratio)
Table D.2 Logit Regression Results Using Urban Households (Odds Ratio) (Random-Effect
Estimation)
Table D.3 Logit Regression Results Using Rural Households (Odds Ratio)
Table D.4 Estimation of Marginal Impact on the Incidence of Childhood Illness and
Malnutrition: Odds Ratio from 2011 DHS
Table D.5 District-Level Population Change between 2001 and 2010
Table D.6 Spatial Analysis: Disease Incidence versus Local Capacity, 2011

6
Abbreviations
AIDS Acquired immunodeficiency syndrome
ARI Acute respiratory infection
BCCRF Bangladesh Climate Change Resilience Fund
BDHS Bangladesh Demographic and Health Survey
BINP Bangladesh Integrated Nutrition Project
BMD Bangladesh Meteorological Department
BWDB Bangladesh Water Development Board
CBA Cost-Benefit Analysis
CCHPU Climate Change and Health Promotion Unit
CDC Communicable Disease Control
CEA Cost-Effectiveness Analysis
CPP Cyclone Preparedness Program
DALY Disability-adjusted life years
DGHS Directorate General of Health Services
DHS Demographic and Health Survey
DMB Disaster Management Bureau
DMIN Disaster Management Information Network
ENSO El Nino-Southern Oscillation
ESD Essential Service Delivery
FFWC Flood Forecasting and Warning Centre
GBM Ganges-Brahmaputra-Meghna
GDP Gross domestic product
GIS Geographic information system
HFA Height for age
HFS Health Facility Survey
HIV Human immunodeficiency virus
ICDDR,B International Center for Disease and Diarrhoeal Research, Bangladesh
IEDCR Institute of Epidemiology, Disease Control, and Research
MDG Millennium Development Goal
MIS Management Information System
MoHFW Ministry of Health and Family Welfare
NIPORT National Institute of Population Research and Training
NNP National Nutrition Project
PCDS Priority communicable disease surveillance
SS Sentinel surveillance
TRMM Tropical Rainfall Measuring Mission
UHS Urban Health Survey
USAID U.S. Agency for International Development
VBD Vector-Borne Disease
WFH Weight For Height
WHO World Health Organization

7
Foreword
Bangladesh is one of the most climate vulnerable countries in the world. It is already facing
enormous challenges due to extreme events such as droughts, land and coastal flooding, and
other extreme weather events. Added to these challenges are the demographic and socio-
economic factors, such as rapid population growth and fast urbanization, poor health conditions
of population, water scarcity and inadequate sanitary conditions. Climate change is, therefore, an
additional stressor that is expected to increase the burden of diseases, in terms of increased
morbidity and mortality.
The Government of Bangladesh has recognized this as an import challenge and already is taking
a number of proactive steps. The 2008 Bangladesh Climate Change Strategy and Action Plan,
highlights the need for implementing surveillance systems for existing and new disease risks and
ensure health systems are geared up to meet future demands. Bangladesh became one of the first
countries to establish the Climate Change and Health Promotion Unit (CCHPU) under the
Ministry of Health and Family Welfare tasked to conduct research and evaluate and monitor
programs related to health promotion and climate change. The Ministry of Environment has
identified the need to conduct an in-depth study focusing on climate sensitive diseases that is
national in scope, to fill in the important knowledge gap in the area of health in the context of
climate change.
This study was jointly undertaken by the Climate Change and Health Promotion Unit of the
Ministry of Health and Family Welfare, the International Centre for Diarrhoeal Disease
Research, Bangladesh, and the World Bank. This study had the two broader objectives:
(1) to assess national vulnerability and impact on major diseases of increased climate
variability and extreme events in Bangladesh; and
(2) to assess existing institutional and implementation capacity, and financial resources at the
local level, and existing public programs targeted at climate sensitive diseases.
Three key messages emerge from this study:
First, the health impacts of increased climate variability and extreme weather events are
projected to be significant by 2050, but well-targeted development investment can
mitigate the excess health burden attributable to climate change.
Second, rapid urbanization, migration and a growing urban slum population are quickly
changing the population dynamics in Bangladesh and this has implications for climate-
induced health risks.
Third, given the seasonality effects and the role of confounding factors, the allocation of
public resources to deal with climate health risks in the future should be spatially targeted
to reach the most vulnerable locations that are likely to be at high climate and health risk
to ensure cost-effectiveness.

8
Overall, climate change imposes a considerable additional burden on the society, which falls
disproportionately on the vulnerable poorer groups of population having lower adaptive capacity.
The study, with its limitations, furthers the understanding of the health impacts of climate change
in the context of Bangladesh and provides evidence to the effect.

9
Acknowledgments
This study was undertaken jointly by the Climate Change and Health Promotion Unit of the
Ministry of Health and Family Welfare, the International Centre for Diarrhoeal Disease Research,
Bangladesh, and the World Bank. The study was led by Muthukumara Mani (task team leader
and senior environmental economist), Disaster Risk Management and Climate Change Unit in
the South Asia Sustainable Development Department (SASDC) under the guidance of Bernice K.
Van Bronkhorst (sector manager, SASDC). The core team comprised Limin Wang, Shaphar
Selim, Ahmed-Al Sabir, Sharif Hossain, Mohammad Shafiul Alam, and Wasif Ali Khan.
The team greatly appreciates guidance provided by Kabir Iqbal, coordinator of the Climate
Change and Health Promotion Unit of the Ministry of Health and Family Welfare, and Peter Kim
Streatfield, head of the Population Programme, ICDDR,B, at various stages and all the seminar
participants in the World Bank Dhaka office and Washington, DC. John Henry Stein, sector
director of the South Asia Sustainable Development Department, and Johannes Zutt, country
director for Bangladesh, guided the overall effort.
In preparing the study, the team benefited greatly from detailed comments received from peer
reviewers Kirk Hamilton, Anil Markandya, and Kanta Kumari Rigaud. The team would
especially like to thank Jin Di, Hrishi Patel, Keith Miao, Mahmud Khan and Sushenjit
Bandyopadhyay for their excellent guidance and assistance in data preparation and mapping
work. The team was ably assisted by Angie Harney, Lilian MacArthur, and Marie Florence Elvie.
Finally, the team gratefully acknowledges the financial support provided by the Bangladesh
Climate Change Resilience Fund, a multi-donor trust fund supported by the governments of the
United Kingdom, Denmark, Sweden, Switzerland, Australia, the United States, and the European
Union.

10
Executive Summary
Bangladesh is one of the most climate-vulnerable countries in the world. Climate variability and
extreme weather events, such as inland and coastal floods, droughts, tropical cyclones, and storm
surges, are projected to become more frequent and severe as average temperatures rise with
climate change (MoEF 2008). Added to the climate risks are rapid but unplanned urbanization,
with a growing slum population, inadequate access to safe drinking water and sanitary facilities,
high levels of poverty and population density, and high prevalence of malnutrition and disease
incidence among children. Without doubt, the adverse health consequences of increased climate
risks are likely to worsen the situation if well-targeted and cost-effective health adaptation
measures are not put in place now.
Over the past few decades, with support from donor agencies, Bangladesh has invested
extensively in health and education, basic environmental services, and disaster risk reduction
measures, all of which are central to improving health outcomes. The Bangladesh Climate
Change Resilience Fund (BCCRF), with about US$188 million, was established in 2010 to
finance climate adaptation projects and programs. With the financial support of the BCCRF, the
Government of Bangladesh is ready to roll out new projects and programs as well as scale up and
leverage existing investments to strengthen its overall capacity to adapt to and build resilience to
climate change. However, one pertinent question is whether major investment decisions will be
cost-effective and well-targeted, particularly in areas that are most vulnerable to health and
climate risk in the coming decade.
The health impact of climate variability and extreme weather events is a major area highlighted
in the 2008 Bangladesh Climate Change Strategy and Action Plan. This study was requested by
the Government of Bangladesh and endorsed by the BCCRF Management Committee as a
priority research project to inform the design and implementation of health adaptation policies
and programs in Bangladesh in the next 10 to 15 years. The key objectives are (1) to identify the
temporal and spatial distribution of major water-borne and vector-borne diseases; (2) to assess
the health impact of both climate variability and socio-environmental conditions and project the
future health burden of climate variability; and (3) to identify cost-effective health adaptation
interventions.
Given that Bangladesh has uniquely rich data sources, this study also aims to assess and review
the quality of existing data with the objective of developing a spatial database that integrates
national health surveys, a disease surveillance system for collecting local climate information,
and an environmental infrastructure for monitoring and targeting future programs. The analysis
and assessment carried out in this study use data sources currently available in Bangladesh,
including many waves of geographically referenced national health surveys, national health
facility surveys, the national disease surveillance system, census data, and weather station data,
together with qualitative data collected from focus group interviews.

11
The methodology includes multilevel (hierarchical) modeling and econometric analysis using
household survey data, correlation analysis of disease incidence and climate variables,
vulnerability assessment using geographic targeting, and cost-effective analysis of possible
adaptation interventions.
Organization of the report
This study consists of five chapters. Chapter 1 provides an overview of pathways between health
and climate and the Bangladesh context in the area of climate change and health. Chapter 2
carries out an empirical analysis to estimate the impact of climate variability on the incidence of
three major childhood illnesses (diarrhea, acute respiratory infection or ARI, and fever),
controlling confounding factors. These childhood illnesses are major causes of under-five deaths,
accounting for about a quarter of total child deaths in Bangladesh. Future vulnerability and
health burdens associated with these illnesses are projected, and a simulation exercise is carried
out to quantify how much investment in health adaptation interventions can mitigate the adverse
impacts of climate on health.
Chapter 3 presents the seasonal and spatial patterns of vector-borne diseases (dengue fever,
malaria, and kala-azar) and investigates the statistical links between climate conditions and cases
of vector-borne disease in high-prevalence regions in Bangladesh. These three vector-borne
diseases, although less significant as a share of total health burden, are predicted to become
larger health concerns in the future as climate change affects the patterns of seasonality,
temperature, and precipitation, which are likely to become more conducive to disease outbreaks.
Chapter 4 analyzes the evolution of population dynamics over the past decade and assesses
vulnerability using geographic targeting to compare health adaptation capacity with disease
incidence. Chapter 5 presents an illustration of cost-effectiveness analysis for ranking different
health adaption interventions, including disaster and risk management investment, expansion of
access to safe water and sanitation services, and investment in nutrition-focused programs. The
final chapter presents conclusions and recommendations.
A summary of the key findings
Impact of climate variability on childhood diseases is significant and varies by season, but
investment in traditional areas of development can mitigate to a great extent the excessive
health burden attributable to climate change. The results from a combined data set that
integrates data from geographically referenced national health surveys with data from local
weather stations located across the country, spanning more than 30 years, confirm a significant
impact of climate variability on the incidence of three childhood illnesses (diarrhea, fever, and
ARI). The health impact of climate variability differs greatly between pre-monsoon and
monsoon seasons. The estimated impact of an incremental change in climate variables
(temperature, humidity, and rainfall) is relatively small, but the event of extreme precipitation
has a large and statistically significant impact on disease incidence.

12
Lack of access to sanitation facilities, particularly in urban areas, is identified as a key
confounding factor determining the incidence of childhood illnesses (fever and ARI). The health
burden associated with these three childhood illnesses is projected to be about 14 million
disability-adjusted life years (DALY), accounting for about 3.4 percent gross domestic product
(GDP) by 2050. Policy simulations also suggest that excess health burden attributable to climate
change can be mitigated completely through targeted investment in the traditional areas of
development—namely, improving access to basic environmental services (water, sanitation, and
electricity), female education, and child nutrition.
Strong seasonal patterns are identified between climate variability and vector-borne diseases
(VBDs), but future efforts should focus on filling the evidence gap on cost-effectiveness of
various control and management programs. Using monthly surveillance data in regions with a
high incidence of VBDs, this study reveals strong patterns of seasonality for VBDs, but no clear
trends over the past decade. The strong statistical correlation between short-term climate
variability and VBD cases is also established. In the case of dengue fever and malaria, all climate
variables (temperature, rainfall, and humidity), both current and lagged, have a strong correlation
with the disease caseload. However, only temperature is significantly correlated with kala-azar
cases.
Although VBDs are projected to increase with climate change in Bangladesh, as highlighted in
the government’s 2008 Climate Change Strategy and Action Plan, it is important to recognize
that VBDs account for a significantly small proportion of total health burden, compared with
water-borne diseases such as diarrhea or malnutrition. On average, about 1 and 0.9 percent of
deaths are reported from malaria and dengue fever, respectively, compared with 10.7 percent
from diarrhea (even higher when taking account of malnutrition). Priorities in the short term
should therefore be placed on improving the collection of data on VBDs from both public and
private health facilities to identify changes in seasonal patterns and the geographic distribution of
VBDs to improve monitoring and surveillance. While Bangladesh historically has had a strong
vector control program, data collection focusing on the impact and cost of a variety of VBD
programs in Bangladesh is critical for identifying cost-effective interventions, ranging from
community-based awareness initiatives and projects to improve access to rapid diagnostic
devices and essential drugs.
Rapid urbanization and a growing urban slum population are quickly changing the
population dynamics in Bangladesh, which has implications for climate-induced health risks.
However, the initial spatial targeting assessment provides strong evidence of the poor geographic
targeting of public resources. One of the key features of population dynamics in Bangladesh is
the large rural-urban migration and the fast growth of urban slum areas where about a third of the
urban population currently reside. The spatial assessment conducted in this study, which uses
data from population censuses, provides strong evidence of poor targeting of public investment,
with districts of high disease prevalence particularly lacking in access to health and basic
environmental services.
The total population of Bangladesh is projected to increase by 64.6 million between 2010 and
2030, reaching about 217.9 million people in 2030, with three-fourths of that growth expected to
occur in urban areas. Therefore, the health implications of population dynamics and rapid
population growth in urban slums areas should be rigorously assessed. Policy makers need to

13
recognize the full scale of the health threat that is posed by rapid but poorly planned urbanization
in Bangladesh.
Cost-effectiveness analysis (CEA) should be fully implemented by both government units and
donor agencies to inform the allocation and prioritization of public resources. Despite the
significant investment in health over the past two decades in Bangladesh, evidence on the cost-
effectiveness of different interventions is lacking. The CEA of different health adaptation
interventions in Bangladesh, including investment in an early warning system and risk reduction
measures, projects to improve access to safe drinking water and sanitation services, and
nutrition-focused programs, is carried out using a variety of data sources. The CEA results
suggest that nutrition programs are more cost-effective than the other interventions, although the
findings should be interpreted with caution due to weakness in the data.
Given that a significant amount of financial resources, such as the BCCRF, will be committed to
the area of climate change adaptation and resilience in Bangladesh, CEA should be used
routinely in allocating resources to programs and projects. The results of CEA should be
disseminated widely among stakeholders as a means to improve transparency as well as to
develop an evidence-based decision-making process for selecting of projects or programs and
identifying new areas of policy interventions. Without concerted efforts to collect reliable data
on the cost and impact of different projects and programs and to implement CEA with rigor and
consistency, evidence-based policy making will remain simply an empty promise.

14
Chapter 1: Health and Climate Change
Pathways and the Bangladesh Context
It has been recognized for centuries that weather fluctuations and seasonal-to-interannual climate
variability affect health outcomes. The geographic distribution of and seasonal variations in
many infectious diseases are clear evidence of the links between climate and health. However, to
understand the links between climate and health, it is important to distinguish between weather
and climate variability and climate change (see box 1.1).
Most climate change studies so far have focused on the effect of rising temperatures on the
intensity of El Nino-Southern Oscillation (ENSO) events (IPCC 2001. The ENSO cycles
influence interannual variability in temperature and rainfall and the likelihood of extreme
weather events such as floods, storms, and droughts, which, in turn, have implications for local
conditions. Therefore, the impact of global warming on local temperatures, precipitation,
humidity, and seasonal patterns is likely to vary substantially across regions.
Most global climate models project that climate change will increase the frequency and severity
of extreme weather events in the coming decades and consequently lead to more serious and
adverse health consequences globally (Confalonieri et al. 2007; McMichael, Woodruff, and
Hales 2006; WHO 2009; IPCC 2001). However, climate variability is not the only factor that
will determine health outcomes. Many other factors, such as health system capacity, socio-
economic conditions, and demographic characteristics, can have a larger effect on health, either
independently or by modifying climate effects (WHO and PAHO 2010).
Box 1.1 Weather and Climate Variability versus Climate Change
Weather and climate variability refers to the day-to-day change in meteorological parameters
including temperature, precipitation, humidity, and winds. Extreme weather events are
significant deviations of meteorological variables, such as floods caused by excessive rainfall,
droughts, storm surges, and heat waves (extreme temperature).
Climate variability refers to short-term changes in the average meteorological conditions over a
time scale, such as a month, a season, or a year. In contrast, climate change refers to changes in
average metrological conditions and seasonal patterns over a much longer time horizon, often
over 50 or 100 years. Recent studies show that climate change is projected to shift the mean
value of temperature and precipitation, increase climate variability and the frequency and
intensity of extreme weather events, and alter seasonal patterns (for example, delay the onset of
the monsoon season or lengthen the hot season).

15
1.1 Pathways from Climate to Health
The complex pathways through which climate conditions affect population health are shown in
figure 1.1. Climate conditions affect health outcomes both directly and indirectly. The direct
impacts on health include outbreaks and spread of infectious diseases, thermal stress-related
mortality from extreme high temperature, and mortality and morbidity from extreme weather
events such as floods and storms.
Climate variability and extreme weather events also affect health indirectly through their effect
on the replication and spread of microbes and vectors. For example, epidemiological evidence
shows that vector-borne diseases such as dengue fever, malaria, and yellow fever are associated
with warm and humid weather conditions; influenza becomes more prevalent during cooler
seasons. In the tropics, diarrheal diseases typically peak during and after the monsoon season,
and both flood and droughts are found to be linked to an increased risk of diarrhea.
Extreme weather events, such as droughts, floods, and cyclones, can contaminate drinking water,
cause water shortages that result in poor hygienic conditions, and, in the event of natural
disasters, cause outbreaks of disease among displaced populations in overcrowded shelters.
During heat waves, excess mortality is greatest among the elderly and those with preexisting
conditions. There is comprehensive literature (Hales, Edwards, and Kovatz 2003; Patz et al.
2010; Burke et al. 2001) on the links between climatic and weather conditions and various
infectious diseases and health outcomes.
However, the impact of climate and weather variability on population health can be modified
significantly by non-climatic factors. These include improving access of the population to basic
environmental infrastructure, such as safe drinking water and sanitation facilities, and improving
the capacity of institutions to adapt, such as better climate forecasting, disaster management, and
health service provision. Further, locational characteristics such as population density and the
geographic characteristics that determine local vulnerability to climate-related risk also play
important roles. Over the long run, many unforeseeable social and environmental changes,
human adaptation in response to climate-related risks, and advancement in vaccine and drugs can
all modify the impact of climate change on health and the probability of disease outbreaks.

16
Figure 1.1 Pathways from Climate Change to Health
Source: WHO 2003.
1.2 The Bangladesh Context
Climate conditions and climate change projections
Bangladesh is one of the most climate-vulnerable countries in the world, ranked sixth on the
2011 United Nations national disaster risk index. Climate variability and extreme weather events,
such as inland and coastal floods, droughts, tropical cyclones, and storm surges, are projected to
become more frequent and severe as the average temperature rises with climate change (World
Bank 2010).
Bangladesh is located at the tail end of a delta formed by three major rivers—the Ganges, the
Brahmaputra, and the Meghna—and two-thirds of the country is less than 5 meters above sea
level.1
The southwest summer monsoon is the major hydrologic driver in the Ganges-
1Bangladesh is a subtropical country located between latitudes of 22°N and 27°N, with distinct seasonal
climatic patterns. The winter season is from November to March, and the hot and humid summer season
is from April to October. The incidence of rainstorms is highest during the hot season from March to May,

17
Brahmaputra-Meghna (GBM) basin, with more than 80 percent of annual precipitation occurring
during this period. Its geographic location and the hydrologic impact of the GBM basin render it
particularly vulnerable to a range of climate risks, including various types of flooding (inland
monsoon flooding, tropical cyclones, and storm surges) and periodic droughts. Once every three
to five years, up to two-thirds of Bangladesh is inundated by floods, resulting in loss of life,
outbreaks of disease, and damage to infrastructure, housing, agriculture, and livelihoods (World
Bank 2010).
Future changes in temperature and precipitation in Bangladesh have been projected based on 16
global circulation models for three emissions scenarios (Yu et al. 2010). Temperature is
predicted to rise during all months and seasons relative to the historical data for 1980–99, with
the median warming prediction of 1.55°C (degrees Celsius) by the 2050s. Annual and wet season
precipitation is projected to increase, with a median increase in precipitation of 4 percent by the
2050s. The extent of land flooding is also projected to increase, given the existing flood
protection infrastructure, with an average increase in flooded area of 3 percent in 2030 and 13
percent in 2050. The proportion of flooded area is projected to be highest during July through
September, peaking in August. Sea-level rise is projected to be one of the most critical climate
risks for Bangladesh due to its long coastline and high population density.
Major health issues
The 2008 Bangladesh Climate Change Strategy and Action Plan prepared by the government of
Bangladesh highlighted the need to implement surveillance systems for existing and new disease
risks and to ensure that health systems are prepared to meet future demands. According to the
strategy document,
Climate change is likely to increase the incidence of water-borne and air-borne
diseases. Bacteria, parasites, and disease vectors breed faster in warmer and
wetter conditions and where there is poor drainage and sanitation. In view of this,
it will be important to implement public health measures (immunization,
improved drainage, sanitation, and hygiene) to reduce the spread of these diseases
and to improve access to health services for those communities likely to be worst
affected by climate change. Unless these steps are taken, the health of many of the
poorest and most vulnerable people will deteriorate. Acute illness is known to be
one of the main triggers driving people into extreme poverty and destitution in
Bangladesh.
and about 70 percent of total annual rainfall occurs during the monsoon season from May to September.
Rainfall varies significantly across regions, with annual average rainfall reaching about 1,500 millimeters
at Rajshahi, 2,150 millimeters at central Dhaka, rising to 2,900 millimeters in the southeast at Chittagong,
and 4,200 millimeters in the northeast at Sylhet (U.K. Meteorological Office).

18
Table 1.1 summarizes the leading causes of death among children (ages 0–14) based on the
World Health Organization (WHO) data and verbal autopsies from the 2007 Bangladesh
Demographic and Health Survey (DHS) for children ages 0–5. The large discrepancies in the
causes of death (proportion of all deaths) from the two data sources are likely due to several
factors, including differences in the data sources, population covered, ages covered, and
definitions of diseases, illnesses, and infection.2
Table 1.1 Estimated Total Deaths, by Cause, 2007–08
WHO data, 2008 (ages 0–14)
DHS data, 2007
(ages 0–5)
Cause of death
Number (thousands) % %
All causes
221.7 100.0 100.0
Infectious and parasitic diseases
57.5 25.9 15.1
Diarrheal diseases
23.8 10.7 2.0
Malaria
2.3 1.0 —
Dengue
2.1 0.9 —
Respiratory infections
38.3 17.3 — Lower respiratory infections 38.2 17.2 — Upper respiratory infections 0.1 0.1 — Otitis media
0.0 0.0 — Pneumonia
— — 22.0
Perinatal conditions
91.0 41.0 25.8 Prematurity and low birth weight 28.6 12.9 — Birth asphyxia and birth trauma 30.3 13.7 — Neonatal infections and other conditions
32.1 14.5 —
Nutritional deficiencies
4.5 2.0 0.4
Injuries and drowning 12.2 5.5 9.2
Source: WHO data for 2008 and 2007 DHS.
Note: — = not available.
Table 1.2 presents the trends in key indicators of child health for the decade of the 2000s
covering three childhood illnesses and two measures of child malnutrition.
Childhood illnesses. Diarrhea, acute respiratory infection (ARI), and fever3 are major causes of
under-five deaths, accounting for about a quarter of total childhood deaths in Bangladesh. A
range of climate variables, living conditions, and socio-economic factors can have an impact,
directly and indirectly, on the incidence and geographic distribution of these childhood illnesses.
Repeated common childhood infections can also result in child malnutrition because they reduce
the child’s ability to absorb nutrients during or even beyond the period of sickness.
2The WHO estimates rely on vital statistics that are collected from primary health facilities, while the
estimated proportions in the DHS data come from verbal autopsies, relying primarily on the recall of the
child’s caretaker in the households selected in the 2007 DHS. Only a few illnesses and diseases are
defined in the verbal autopsy, whereas the vital statistics have much wider coverage, including illnesses,
diseases, and conditions.
3Fever is a symptom of many childhood illnesses. It was not recorded in the DHS during the two-week
survey period, and it is not classified by the WHO as a cause of death.

19
Child malnutrition. The rates of child malnutrition in Bangladesh are among the highest in the
world. About half of preschool-age children, equivalent to more than 9.5 million children, are
stunted, and more than 36 percent are classified as underweight.4 Recurring natural disasters
exacerbate malnutrition by wiping out crops, homes, safe water sources, and livelihoods. Recent
evidence from a large number of countries highlights the two-way causal relationship between
malnutrition and the frequency of childhood illnesses.5 Children with poor nutritional status face
far greater risk of mortality and severe illness due to common childhood infections, such as
pneumonia, diarrhea, malaria, human immunodeficiency virus (HIV), acquired
immunodeficiency syndrome (AIDS), and measles, suggesting that the health burden associated
with childhood illnesses and malnutrition can be even higher with higher climate risk.
Table 1.2 Child Health: Incidence of Illnesses and Malnutrition, 2000–11
% of children
Year ARI Diarrhea Wasting Stunting Underweight
2000 18.3 6.1 10.3 44.7 47.7
2004 20.8 7.5 15.3 51.2 43.2
2007 13.1 9.8 17.4 43.4 41.1
2011 5.8 4.6 16.2 41.2 36.2
Sources: DHS, 1999–2000, 2004, 2007, and 2011.
Vector-borne diseases. Dengue fever, malaria, and kala-azar, although less significant as a share
of total health burden (accounting for about 2 percent of total deaths each year), are projected to
become more prevalent in the coming decades in Bangladesh. This is due to fact that climate
change is projected to affect the patterns of seasonality—in particular, prolonging the monsoon
season and raising temperatures, which will affect the abundance and spread of many disease
vectors. The number of malaria cases reported increased from 1,556 in 1971 to 51,773 in 2011.
Table 1.3 summarizes the major vector and water-borne diseases for the total population in
Bangladesh.
Dengue fever was an unfamiliar disease in Bangladesh until its outbreak in the summer of 2000
in three major cities—Dhaka, Chittagong, and Khulna—with the highest caseload recorded at
6,132 in 2002. During the period of 2000–11, a total of 23,518 cases and 239 deaths from dengue
fever were reported in Bangladesh. No deaths from kala-azar were reported, although it is
4Three of the most commonly used measures of child nutritional status are underweight, stunting, and
wasting. Stunting (height for age) refers to shortness, reflecting growth achieved pre- and postnatal, that
is, long-term and cumulative effects of inadequate nutrition and poor health status. Wasting (weight for
height) is a measure of an acute or short-term effect of an occurrence of illness, such as a bout of diarrhea
that causes loss of body fluids and the consequent reduction in calorie intake. Underweight (weight for
age) is a good indicator for children under 24 months, but it does not take height into account.
5Based on a UNICEF report (UNICEF 2013) a child who is severely underweight (weight for height) is
9.5 times more likely to die of diarrhea than a child who is not, and the risk of death of a stunted child is
4.6 times higher. Moreover, malnutrition is also a consequence of infections and repeated episodes of
illness.

20
considered an important vector-borne disease in Bangladesh. Despite the recent attention paid to
vector-borne diseases in the public health discussions of climate change, water-borne diseases, in
particular diarrhea, are a more important health concern with regard to the total number of deaths
in the population (see table 1.3).
Table 1.3 Major Infectious Diseases: Number of Cases and Deaths, by Cause, 2000–11
Malaria Dengue Kala-azar Diarrhea
Year Cases Deaths Cases Deaths Cases Cases (thousands) Deaths
2000 54,223 478 5,551 93 7,640 1,556 475
2001 54,216 490 2,430 44 4,283 1,866 521
2002 62,269 588 6,132 58 8,110 2,599 1,022
2003 54,654 577 486 10 6,113 2,287 1,282
2004 58,894 535 3,934 13 5,920 2,246 1,170
2005 48,121 501 1,048 4 6,892 2,152 929
2006 32,857 307 2,200 11 9,379 1,962 239
2007 59,857 228 466 0 4,932 2,335 537
2008 84,690 154 1,153 0 4,824 2,295 393
2009 63,873 47 474 0 4,301 2,619 360
2010 55,873 37 409 0 2,810 2,427 345
2011 51,773 36 1,362 6 2,534 2,268 70
Source: Ministry of Health.
Note: There were no reported deaths caused by kala-azar.
Mortality and emerging health issues associated with natural disasters. In Bangladesh, natural
disasters such as flooding, cyclones, and storm surges have been a major source of health threats
to the population, in terms of lives lost, injuries, and disease outbreaks. Bangladesh has a long
history of natural disasters. According to data collected by the European Detailed Mortality
Database, between 1980 and 2010, Bangladesh experienced 234 natural disasters, causing more
than US$17 billion in total damage. The total number of people killed as a result of natural
disasters between 1980 and 2010 was about 191,836; on average, 6,188 people are killed each
year.
Many outbreaks of water-borne diseases have been recorded during and after major floods.
While complete records of disease cases in the aftermath of major natural disasters are not
available, officials from risk management and disaster management units have reported evidence
of outbreaks of various infectious diseases as a result of overcrowding in temporary shelters with
inadequate drinking water and poor sanitation. The displaced population is particularly exposed
to the risks of infectious diseases when humans and livestock share shelters.
In the coastal regions, the contamination of drinking water by salinity as a result of storm surges
caused by cyclones, rising sea levels, cyclone and storm surges, and upstream withdrawal of
freshwater has been identified as the main cause of emerging health problems. The rising
incidence of several health conditions and diseases, including hypertension, premature delivery
due to pre-eclampsia, ARI, and skin diseases has also been recorded among populations living in
the coastal regions (Khan et al. 2011).
The following two chapters analyze the statistical links between climate variability and health.
Chapter 2 quantifies the impact of climate variability on the incidence of three childhood

21
illnesses using nationally representative health surveys that collect childhood diseases among
children under the age of five. Chapter 3 focuses on the statistical correlation between climate
conditions and vector-borne diseases using aggregate disease records collected by the Ministry of
Health covering the entire population.

22
Chapter 2: Quantifying the Health Impact of
Climate Variability on Childhood Illnesses
This chapter aims to quantify the impact of climatic variability on the incidence of childhood
illnesses—diarrhea, acute respiratory infection (ARI), and fever—while controlling non-climatic
confounding factors. While climate conditions such as weather fluctuations and seasonal and
interannual climate variability influence many infectious diseases, disease incidence can be
modified by many non-climatic factors. These include drinking water sources, sanitation
facilities, sewerage system infrastructure, the capacity of public health services (such as disease
surveillance, control, and treatment systems), human adaptation responses to health risks and
climate variability, and population migration. In the context of Bangladesh, these non-climatic
factors are particularly important in urban areas, where population density is high and the slum
population is rapidly increasing as a result of massive rural-urban migration over the past decade.
Quantifying the health impact of both climate and non-climatic factors provides valuable
information for the formulation of public policies in two areas. First, knowledge of the relative
importance of different health determinants can inform the design of measures to maximize the
health benefits of interventions. Second, the statistical links between climate variability and
disease incidence provide critical parameters for projecting future health burdens attributable to
climate change. While these projections are subject to large uncertainties due to the complex
pathways from climate conditions to health, they provide some benchmark estimates that help
policy makers to plan health adaptations in a medium- to long-term time frame.
The following analysis is conducted at the national level using information from the
geographically referenced national health surveys and local weather stations located across the
country and spanning more than 30 years. This study is based on uniquely rich data sources—
combining health, a wide range of socio-environmental information, and local climate
conditions—and large in spatial and temporal scale. It attempts to address limitations in current
research in the area of health and climate links by controlling confounding factors and taking
account of seasonality effects.6
6A few studies have been carried out to analyze the statistical links between climate variables and
infectious diseases in Bangladesh, focusing on diarrhea, cholera, kala-azar, and malaria. These are district
case studies, covering the drought-prone district of Rajshahi, the flood-prone district of Manikganj, the
salinity-affected district of Satkhira, and the malaria-epidemic region of Chittagong Hill Tracts (Matsuda
et al. 2008; Pascual and Dobson 2005; Islam and Uyeda 2007; Hashizume et al. 2007) examine the
association between climate variability and diarrhea cases in Dhaka City. While these studies provide
useful information on the statistical association between climate variables and disease incidence, they are
of local scale and do not control important confounding factors, such as household drinking water,
sanitation facilities, and socio-economic conditions, that are important determinants of disease incidence
(with the exception of Hashizume et al. 2007). Del Ninno and Lundberg (2005) use an indirect measure of
extreme weather events—the household flood index—to estimate the impact of floods on the nutrition of
under-five children in Bangladesh.

23
2.1 Key Data Sources
Quantifying the impact of climate variability on disease incidence or health in general remains a
formidable empirical challenge because of data requirements and the complex pathways from
climate conditions to health. The analyses are extremely data intensive, requiring local
information on a sufficiently large spatial and temporal scale (taking account of seasonality) and
covering health, local climate conditions, the features of ecosystem and topography, as well as a
wide range of socio-economic conditions.7 The complete list of data sources in this study is
summarized in appendixes A, B, and C. In the following analysis, the extensive weather station
data are matched to the primary sampling units or clusters (villages in rural areas and
neighborhoods in urban areas) of the two nationally representative health surveys using
geographic information system (GIS) information.
Weather data
The Bangladesh Meteorological Department has been collecting monthly weather data since
1970 in 35 weather stations located across the country. The five weather variables (rainfall,
average temperature, maximum temperature, minimum temperature, and relative humidity) have
been collected daily,8 but only monthly data are made publicly available. Figure 2.1 summarizes
monthly average weather variables constructed from the 35 weather stations from 1970 to 2010
for six regions.
The monthly climate variables provide important climate features for Bangladesh. While there is
little spatial variation in temperature (maximum, minimum, and average) and humidity, monthly
rainfall varies substantially across regions, in particular during the monsoon season of May to
September. The average monthly temperature starts to rise in April, reaches the peak (around
30°C) in May, and starts to fall in September. The maximum temperature during the hot season
can vary between 30°C and 35°C. The humidity level starts to rise in April, reaching the peak in
June and continuing through September.
Both incremental changes in average climate variables and climate variability—in particular,
extreme weather events—affect disease outcomes. In the following analysis of the statistical
links between climate conditions and the incidence of disease, both the level and variability of
climate variables are matched to the GIS-referenced national health surveys.
7Many leading researchers in the field of public health and climate change (Burke et al. 2001; Patz et al.
2010; McMichael, Woodruff, and Hales 2006; Hales, Edwards, and Kovats 2003; Gage et al. 2008;
Rogers and Randolph 2006) have called for concerted efforts to improve the collection of data on health,
local socio-economic conditions, and environmental infrastructure by integrating GIS and remote-sensing
data on a wide variety of environmental parameters that are known to affect local disease risks (for
example, forest coverage and soil conditions).
8The completeness of these observations for the five variables varies across the 35 weather stations.

24
Figure 2.1 Average Monthly Weather Variables, by Region and Month, 1970–2011
Note: The monthly averages are constructed using monthly data from 1970 to 2011 collected from 35
weather stations located across the six regions.
Excessive precipitation (floods) or extreme low rainfall (droughts) is conventionally defined as
when rainfall at a given location and month is bigger (smaller) than 1 (or 2) standard deviation
from the long-term average. The location and monthly long-term average climate conditions are
established using the monthly weather station data from 1970 to 2010. The extreme temperature
is similarly defined—the extreme hot (cold) month is defined as when the temperature is higher
(lower) than 1 (or 2) standard deviation from the long-term mean at a specific month and
location.
The Bangladesh national health surveys
The Bangladesh nationally representative Demographic and Health Survey (DHS) is used in the
analysis. The survey’s sample framework covers the entire population residing in private
dwelling units in the country based on the enumeration areas created in the 2001 census.9 Map
9Bangladesh is divided into six administrative divisions; each division is divided into zilas, and each zila
is divided into upazilas. Each urban area in the upazila is divided into wards, and each ward is divided
into mahallas; each rural area in the upazila is divided into union parishads, and each union parishad is
0
100
200
300
400
500
600
700
800
Jan
Mar
May Ju
l
Sep
Nov
a. Rainfall (millimeters)
Barisal
Chittagone
Dhaka
Khulna
Rajshahi
Sylhet
NATIONAL 0
20
40
60
80
100
b. Average humidity (%)
Barisal
Chittagone
Dhaka
Khulna
Rajshahi
Sylhet
NATIONAL
0
5
10
15
20
25
30
Jan
Mar
May Ju
l
Sep
No
v
c. Minimun temperature (0C)
Barisal
Chittagone
Dhaka
Khulna
Rajshahi
Sylhet
NATIONAL
0
5
10
15
20
25
30
35Ja
n
Mar
May Ju
l
Sep
No
v
d. Average temperature (0C)
Barisal
Chittagone
Dhaka
Khulna
Rajshahi
Sylhet
NATIONAL
0
5
10
15
20
25
30
35
40
Jan
Ap
r
Jul
Oct
e. Maximum temperature (0C)
Barisal
Chittagone
Dhaka
Khulna
Rajshahi
Sylhet
NATIONAL

25
2.1 displays the locations of primary sampling units or clusters (villages in rural areas and
neighborhoods in urban areas).
Map 2.1 DHS Survey Locations, 2004 and 2007
a. 2004 DHS clusters b. 2007 DHS clusters
The 2004 and 2007 DHS, the fifth and sixth waves of health surveys that have been conducted
since 1993, are chosen for analyzing the links between health and climate. The choice of these
two surveys is driven by the survey months and the availability of GIS information in the
surveys. The survey months are from January to May in the 2004 DHS and from March to
August in the 2007 DHS, presenting the opportunity to analyze the effect of climate variability
for pre-monsoon and monsoon seasons separately. Table 2.2 presents the sample distribution for
the 2004 and 2007 DHS by survey month and by region.
The 2004 and 2007 DHS collected GIS information for each primary sampling unit. The GIS
data provide the critical link for spatially matching disease incidence as well as socio-economic
information collected in the DHS with the weather station data at a relatively high resolution.
In addition to detailed information on childhood diseases, the DHS collects information on
household-level access to a wide range of basic services, such as drinking water sources,
sanitation facilities, and electricity, as well as socioeconomic conditions. The key household-
level variables are summarized in tables 2.2 and 2.3. It is notable that there is little variation in
water or the availability of electricity over the time period. There is, however, some variation in
sanitation and education, but one would expect much more improvement over the period.
divided into mouzas. The urban areas are stratified into three groups: (1) standard metropolitan areas, (2)
municipalities, and (3) other urban areas.

26
Table 2.2 Household Distribution in 2004 and 2007 DHS, by Region and Survey Month
Survey year
and month Barisal Chittagong Dhaka Khulna Rajshahi Sylhet Total
2004 DHS
January 304 490 546 — — 521 1,861
February 314 27 1 258 261 367 1,228
March 134 352 155 374 321 56 1,392
April — 498 403 203 314 — 1,418
May — 136 426 31 416 — 1,009
Total 752 1,503 1,531 866 1,312 944 6,008
2007 DHS
March 207 133 — — — 139 479
April 455 421 34 — — 591 1,501
May 129 586 139 104 102 388 1,448
June — 135 379 257 355 — 1,126
July — — 356 353 497 — 1,206
August — — 377 — 13 — 390
Total 791 1,275 1,285 714 967 1,118 6,150
Note: — = no households surveyed.
Table 2.3 Summary of Key Variables in 2004 and 2007 DHS
Variable 2004 DHS 2007 DHS
Sample size 6,908 6,150
Water sources (%)
Piped water = 1 7.32 6.03
Tube well = 2 84.52 80.36
All other = 9 8.16 13.61
Sanitation
Septic tank = 11 11 24.36
Slab latrine = 21 15 0.00
Pit latrine = 22 33 16.73
Open latrine = 23 27.51 31.33
All other = 99 13.52 27.58
Has electricity 41.06 42.33
Has TV 24.57 28.39
Religion
Islam = 1 91.26 91.19
Hindu = 2 8.26 8.06
Other = 99 0.48 0.62
Location
Urban = 1 30.01 34.26
Rural = 2 69.99 65.74
Sex head of household
Male 93.01 90.86
Mother’s education
No education = 0 36.78 27.25
Primary = 1 31.09 31.33
Secondary = 2 26.45 34.05
Higher = 3 5.67 7.37

27
2.3 Quantifying the Health Impact of Climate Variability
The analytical model
The links between the incidence of childhood illnesses and climate variability are analyzed here
using the multilevel (hierarchical) modeling approach. The statistical presentation of this model
is summarized in box 2.1. This modeling approach has several analytical advantages over the
existing biological and statistical modeling approaches that are widely used in epidemiology to
study the links between climate and health. First, it allows the incorporation of both climate
variables and a range of individual, household, and community-level covariates, that is,
confounding factors. Therefore, the estimated impact of climate variability can be interpreted as
a causal effect as opposed to a statistical correlation between climate and disease incidence.
Box 2.1 The Model
The probability of event (Y)— a child who lives in household h located in village i experiences
an episode of illness at survey month t—is assumed to follow the logistic distribution:
(B.2.1.1) Phi = E(Y = 1 | Xi) =
.
The odds ratio defined as
is commonly used in the medical field and epidemiology. The
logistic regression model, which is the log transformation of equation B2.1.1, has a linear
relationship between the odds ratio and Xi, the covariates. The specification of the logistic
regression model is as follows:
(B2.1.2) Log (
) = α + β1 Climatei + β2 SEhi + β3 Villagei + β4 Vi + uhi.
Where, Climatei is the vector of climate variables (both level and variability) in villagei, SEhi is
the vector of individual- and household-level variables (for instance, age, gender, birth order,
drinking water source, type of sanitation facilities, and other key socio-economic characteristics
such as mother’s education level or religion). Villagei is a vector of village-level variables, such
as the proportion of households with access to safe water and sanitation, access to health
facilities, presence of a village drug store or village medical personnel, and presence of a health
outreach program. Vi is the unobservable village-specific random effect, which is likely
correlated with Villagei, and uhi is the residual following i.i.d. distribution and is not correlated
with the included explanatory variables.
The model specification incorporates both the level of precipitation and extreme rainfall events.
Excessive rainfall can have different health consequences depending on the season and
topography as well as household and community environmental infrastructure (for example,
drinking water sources, sanitation facilities, waste discharge, and sewerage systems).

28
Second, the multilevel model can be extended to test various health adaptation policy variables.
For example, what is the differential effect of extreme rainfall on disease incidence between
households with sanitary toilets and those with open latrines, holding all other factors constant?
This interactive effect can be tested by incorporating in the model an interactive term (for
example, extreme precipitation event * toilet types). Another example is identifying the synergy
effect of integrated health interventions—whether the combination of improving both drinking
water sources and sanitary facilities (for example, access to water * access to sanitation) is more
effective in reducing disease incidence than the sum of two separate interventions (improving
drinking water sources and sanitation facilities).
Seasonality of disease incidence
In the DHS, cases of diarrhea, ARI, and fever are collected for children under the age of five.
The information is recorded based on the mother’s response to the question asking whether her
children had experienced episodes of any of the three illnesses during the period two weeks
preceding the survey date. Diarrhea is not defined medically, and answers to this question are left
to the mother’s perception and diagnostics. This means that reporting biases may arise as
mothers with more education are more likely to recognize the symptoms associated with diarrhea
than mothers with less or no education. A child is recorded to have experienced ARI if the
mother reported any one of three symptoms, including short but rapid breathing, difficulty
breathing, or labored respiration.10
The DHS does not collect information on malaria or dengue fever, which are major vector-borne
diseases in Bangladesh. However, fever can be a major manifestation of malaria, which is more
prevalent after the end of the rainy season, as well as a symptom of a wide range of acute
infections that can occur through all seasons in Bangladesh.11
It is estimated that the proportion
of malaria among all fever cases in Bangladesh, on average, is about 12 percent (ICDDR,B
2007).
Table 2.4 summarizes the incidence of illness by month and season estimated from the 2004 and
2007 DHS. During the pre-monsoon season, ARI is more prevalent among young children, with
an incidence of 14 percent compared to 10 percent during the monsoon season. The incidence of
fever is higher in the monsoon season than during the pre-monsoon season. Based on the two
health surveys, the incidence of diarrheal illness appears constant through all seasons. However,
using the hospital data for both children and adults, Teshima et al. (2007) find two peak seasons
10
The combined symptoms that are associated with ARI are similar to pneumonia or bronchiolitis. In the
diagnosis guidance of the World Health Organization (WHO), the symptoms of ARI include convulsions,
shrunken eyes, high respiratory counts, noisy breathing, and high body temperature.
11
Fever can be a common symptom of many non-life-threatening illnesses, including both vector- and
water-borne diseases such as ARI and diarrhea, and of life-threatening illnesses, including cerebral
malaria, meningitis, septicemia, and typhoid. Its causes can be associated with local endemic and
epidemic diseases that may or may not be seasonal.

29
for diarrhea in Bangladesh: the pre-monsoon (March and April) and the end of the monsoon
season.
A direct comparison of disease incidence by month and season using the 2004 and 2007 DHS is
complicated by the fact that the primary sampling unit locations changed between 2004 and 2007
(map 2.1). For example, the average disease incidence for the same survey months (March–May)
is markedly different in the 2004 and 2007 surveys. This indicates that the location effect is
particularly important in estimating disease incidence. Therefore, for disease monitoring
purposes, the national disease surveillance system should be considered a more reliable source of
data than the national health surveys.
Table 2.4 Disease Incidence, by Survey Month and Season, 2004 and 2007
Survey year and month Fever Diarrhea ARI
2004 DHS
January 27.18 7.50 17.39
February 35.2 6.64 15.30
March 39.36 6.69 20.63
Cold season: January–February 29.89 7.21 16.68
April 44.98 7.26 19.53
May 41.29 6.22 15.06
Pre-monsoon: March–May 41.97 6.76 18.61
Total 37.19 6.94 17.85
2007 DHS
March 43.60 6.02 17.10
April 34.22 10.00 16.20
May 31.43 9.91 11.59
Pre-monsoon: March–May 34.06 9.43 13.98
June 33.22 7.48 9.65
July 41.19 9.38 12.14
August 39.84 12.24 11.35
Monsoon: June–August 37.68 9.07 10.98
Total 36.07 9.23 12.32
The impact of climate on disease incidence
The regression results using the multi-level model confirm that climate variability is strongly
linked with the incidence of childhood illnesses and that the impact of climate varies by season.
Table 2.5 summarizes the estimated impact of climate variables on the odds ratio of fever,
diarrhea, and ARI among children under the age of five, controlling for confounding factors at
multiple levels: child, household, and community. The full regression results from the complete
model specification are presented in tables D.1, D.2, and D.3 in appendix D.
Effect of temperature and humidity. During the pre-monsoon season (January–April), results
from the 2004 DHS show that high temperature and humidity levels increase the incidence of
fever and ARI. A 1° increase in average temperature increases the odds ratio of fever by about 21
percent and ARI by 14 percent, respectively, controlling for household socio-environmental
factors; a one-unit increase in humidity increases the incidence by 4 and 6 percent, respectively.

30
No statistically significant effect is found for diarrhea during the pre-monsoon season, although
Hashizume et al. (2007) confirm a positive association between the number of cases and
temperature, using weekly diarrheal cases collected in Dhaka hospitals from January 1996 to
December 2002.
The effect of temperature and humidity levels during the monsoon season of May to August
(2007 DHS survey) is, however, markedly different from that of the pre-monsoon season. Higher
temperature is associated with a lower incidence of ARI, but higher humidity has no significant
effect. The differential impact of climate conditions on disease incidence across seasons may be
due to the distinct seasonal patterns of climate variables in Bangladesh.
Table 2.5 Impact of Climate Variables on Disease Incidence, 2004 and 2007 DHS
Pre-monsoon season Monsoon season
Climate variable Fever Diarrhea ARI Fever Diarrhea ARI
Temperature at survey month 1.21*** 0.87 1.14* 0.92 0.88 0.51*
Relative humidity at survey month 1.04* 1.04 1.06* 1.01 1.01 0.97
Rainfall at survey month
Rainfall level (log form) 0.81* 1.39 0.76 1.32 0.95 0.78
Extreme rainfall event (dummy variable; base case =
normal rainfall)
Heavy rainfall event 1.82* 1.23 1.47 0.67* 0.74 1.03
Low rainfall event 0.96 1.27 0.89 1.44 0.95 0.96
Rainfall-one month lag
Rainfall level (log form) 0.84*** 1.04 0.87 1.27* 1.25 1.02
Extreme rainfall event (dummy variable; base case =
normal rainfall)
Heavy rainfall event 1.18 1.09 1.28 0.72 0.56* 1.08
Low rainfall event No No No 0.96 0.85 0.89
Non-climatic covariates (included)
Child age and gender Yes Yes Yes Yes Yes Yes
Household socio-economic factors (water sources,
sanitation, mother’s education, religion) Yes Yes Yes Yes Yes Yes
Community factors (clinic, health program) Yes Yes Yes Yes Yes Yes
Note: The estimates of all non-climatic covariates are presented in appendix B.
*** p<0.001; * p<0.05.
During the pre-monsoon season when the average temperature in Bangladesh is in the range of
15–28°C before peaking at 30°C in May, an increase in temperature is likely to foster the
development and spread of a wide range of pathogens and parasites, causing more illnesses such
as fever and ARI among young children. The temperature reaches above 30°C during the
monsoon season, possibly approaching the limit of physiological tolerance for pathogens, as an
increase in temperature can destroy many types of pathogens, reducing the disease incidence.
The nonlinear relationship between temperature and the survival of a wide range of pathogens
has also been documented in epidemiological studies for other countries (Patz et al. 2010).

31
The effect of extreme heat (temperature) on health is also investigated in the analysis. An
extreme hot (cold) event is defined as when the temperature is higher (lower) than 1 (or 2)
standard deviations from the long-term mean at a specific month and location. However, unlike
precipitation, extreme heat events were very rare in the months and locations surveyed in 2003
and 2004; therefore, it is not possible to use the model to test the effect of extreme heat events on
disease incidence.
Effect of precipitation. The effect of precipitation on disease incidence is more complex, and a
distinction should be made between excessive rainfall (floods) events and an incremental
increase in precipitation. The results from the DHS data show that an incremental increase in the
level of precipitation during the pre-monsoon season, both at the survey month and with a one-
month lag, decreases the incidence of fever, but has no effect on diarrhea or ARI, everything else
being the same (the full results include socio-economic variables and household access to basic
services and are reported in the appendix D, tables D.1, D.2, and D.3). This finding can possibly
be explained by the fact that higher rainfall during dry seasons makes groundwater more
plentiful, improving the quantity of drinking water available from safe sources12
as well as the
hygienic environment overall.
Compared to the incremental change in precipitation, excessive rainfall events have a much
larger effect on the incidence of fever. Relative to normal rainfall conditions, excessive rainfall
events increase the odds ratio of fever by 82 percent during the pre-monsoon season, but reduce
it by 33 percent during the monsoon season, controlling for all other variables. What explains the
nonlinear relationship between rainfall and fever incidence across seasons? Some studies show
that, in tropical and subtropical regions, high precipitation may cause the outbreak of diarrhea,
whereas excessive rainfall may reduce vector-borne diseases by flushing larvae from their habitat
in pooled water, reducing the vector population (McMichael, Woodruff, and Hales 2006), or
improving water quality through the dilution of pathogens in an environment where water quality
is poor.13
The nonlinear health impact of precipitation may be attributable to seasonal patterns in
precipitation in Bangladesh. As shown in figure 2.2, the average monthly rainfall normally peaks
in June and continues through July and August. Therefore, a heavy rainfall event during the
monsoon season may generate a positive health benefit by reducing the vector population and
diluting the contamination of pathogens in groundwater sources (as reflected in the estimated
negative impact of heavy rainfall events on the odds ratio of fever, 33 percent.
Caveats on data limitations. While national health surveys are valuable for analyzing the links
between climate and health, the lack of integrated climate information collected at the survey
12
Using DHS data from 25 countries in Africa, Bandyopadhyay, Wang, and Kanji (2011) find that high
rainfall during the survey period in the dry season reduces the prevalence of diarrheal disease by around 3
percentage points.
13
For example, 51 percent of water-borne disease outbreaks were preceded by precipitation events above
the 80th percentile of the monthly average for the particular weather station using a database of all
reported outbreaks of water-borne disease in the United States from 1948 to 1994.

32
locations limits their usefulness. The reliance on matching 35 weather stations to the survey
location can result in large imprecision in the measurement of local climate conditions and,
consequently, in the estimated impact of climate variability on the incidence of diseases.
Rainfall is widely regarded to be the most challenging meteorological parameter to measure due
to its spatial and temporal variability. Along the spatial dimension, rainfall can vary over short
distances and interacts with local climate and topography. The availability of low-cost modern
rain gauges and advances in remote-sensing precipitation products that estimate global and high-
resolution precipitation open up the possibility to carry out more local-level validation studies to
explore the best options for collecting rainfall data for research in the area of climate change and
health.14
Islam and Uyeda (2007) validate precipitation data by comparing rainfall data collected
from satellite-based Tropical Rainfall Measuring Mission (TRMM) and from the rain gauge
network from 1998 to 2002 in Bangladesh. They conclude that TRMM is useful for estimating
the average values of rainfall in Bangladesh, but that satellite data overestimated the rainfall
during the pre-monsoon period and in dry regions and underestimated it during the monsoon
period and in wet regions.
The review of existing literature on health and climate change—in particular, the links between
climate variability and infectious disease, malnutrition, and other climate-sensitive diseases—
shows that this important area is still in its infancy. Leading researchers and experts have called
for future analytical efforts focusing on empirical studies that use a wide range of analytical
methods and data to assess the consistency of the climate-disease relationship in different
societal contexts and across a variety of temporal and spatial scales. The analysis presented here
takes an important first step in this direction.
In the context of Bangladesh, future studies should seek to use disease data collected from the
national surveillance system and other sources of climate data, including both weather stations
and remote-sensing precipitation data, to supplement studies using national health surveys. In
particular, these studies should investigate the impact of extreme precipitation on infectious
diseases by season. Research efforts should focus particularly on flood-prone areas where
population density is high, as credible evidence is needed to assist policy makers in designing
health adaptation programs.
Impact of household environmental conditions on health
The estimation of the health impact of household environmental services focuses on drinking
water sources and sanitation facilities, as well as their interactive effect with an extreme
precipitation event (defined as the dummy variable in the model). The drinking water sources
and sanitation facilities are markedly different in urban and rural households; therefore, a
separate analysis is carried out for urban and rural areas (the full estimation results are presented
14
In particular, the spatial resolution of satellite-based products may have become less a concern, with
several precipitation products (including RFE, ARC, and CMORPH) achieving high spatial resolution of
0.1 x 0.1 (degree), covering an area of about 11 square kilometers). Such a level of resolution is likely
adequate for measuring village-level precipitation in many rural areas.

33
in appendix D, tables D.1, D.2, and D.3). The estimated impact of household environmental
conditions on health is summarized in table 2.6.
Table 2.6 Impact of Water and Sanitation Facilities on Disease Incidence, Odds Ratio, 2004 and 2007
Survey and variable
Number of
households Fever Diarrhea ARI
Pre-monsoon season, 2004 DHS
Urban
Access to water sources
Relative to piped water 473
Tube well and other 1,598 1.072 0.525 1.165
Sanitation facility
Relative to septic sink 555
Slab latrine 435 1.34 0.807 1.933**
Pit latrine 465 1.241 0.76 1.924*
Open latrine 483 1.202 1.15 1.859*
No toilet 133 1.251 0.771 2.943**
Rural
Access to water sources
Relative to tube well 4,574
Surface and other 254 1.058 0.862 1.435
Sanitation facility
Relative to septic or slab 824
Pit latrine 1,790 1.011 0.882 0.774
Open latrine 1,415 1.159 1.179 0.902
No toilet 800 1.09 1.241 0.761
Monsoon season, 2007 DHS
Urban
Access to water sources
Relative to piped water 350
Tube well 1,535 1.268 0.968
Surface and other 222 1.853 1.384
Sanitation facility
Relative to flush or septic sink 649
Flush to pit 345 1.834*** 1.42
Pit latrine 311 1.802** 1.562
Open latrine 425 1.284 0.943
No toilet 377 1.654* 1.477
Rural
Access to water sources
Relative to tube water 3,435
Surface and other 608 0.832 0.937 1.124
Sanitation facility
Relative to flush or septic sink 504
Pit latrine 718 0.787 0.782 0.643*
Open latrine 1,502 0.8 0.675 0.767
No toilet 1,319 0.788 1.004 0.676
*** p<0.001; ** p<0.01; * p<0.05.

34
Poor sanitation facilities are identified as a key determinant of disease incidence in urban but not
in rural areas. During the pre-monsoon season in urban areas, a child living in a household with
unsanitary toilet facilities (slab, pit, or open latrine) is two times as likely as a child living in a
household with access to a flush toilet (septic sink) to experience an episode of ARI and nearly
three times as likely if living in a household with no toilet, holding all other factors constant.
During the monsoon season, unsanitary toilet facilities significantly increase the incidence of
fever. Given that fever is a symptom of many infectious diseases, this finding suggests that
households with poor sanitary facilities are likely to be located in areas with unsanitary living
environments, which are conducive to the development and spread of a wide range of pathogens
and disease vectors.
The results are consistent with findings of the World Bank Water and Sanitation Program (WSP
2011), which are based on the 2007 DHS. That study found that inadequate sanitation is
responsible for economic losses of about US$4.22 billion, equivalent to 6.3 percent of the
country’s gross domestic product (GDP) each year.
Contrary to findings in other studies, no statistically significant effect of drinking water sources
on disease incidence is established in these two national surveys. The estimated impact of
drinking water sources shows that a child living in a household using surface water is more likely
to contract diseases, such as fever and ARI, although the estimates are not statistically
significant.15
The lack of variation in drinking water sources is likely the underlying reason for
the lack of statistical significance. In 2004 about 77 percent of urban households and 72 percent
of rural households had a tube well. In 2007, about 95 percent of urban households had piped
water, and 85 percent of rural households had a tube well.
The impact of water contamination is investigated by incorporating lagged precipitation
variables in the model. In general, surface water is quickly contaminated in the event of heavy
rainfall in areas where sewerage systems and sanitation services are poorly constructed, but it
can take a much longer time to observe the impact of groundwater contamination after heavy
rainfall. This suggests that the time period for observing the occurrence of disease outbreaks
varies by season and depends on the quality of local water supply and sewerage infrastructure.
The regression results with lagged climate variables, however, do not show a statistically
significant effect of extreme rainfall on the incidence of the three childhood illnesses.
15
The interactive effect of extreme rainfall and household environmental services (drinking water sources
and sanitation facilities) is also investigated. The regression results show no statistically significant
interaction effect on health. This finding is at odds with widely held perceptions that the impact of
extreme precipitation on disease incidence depends on the household’s source of drinking water and type
of sanitation facilities.

35
2.3 Summary of Results
While these results are broadly consistent with evidence from the existing epidemiological
studies that focus on the impact of climate change on disease transmission and incidence, new
findings emerge from this analysis:
First, the impact of climate variability on disease incidence varies sharply between pre-
monsoon and monsoon seasons. The estimated impact of an incremental change of a
climate variable (temperature, humidity, and rainfall) is relatively small, but the impact of
extreme precipitation on disease incidence is large and statistically significant. The
impact of extreme precipitation on disease incidence varies by season.
Second, as expected, household environmental conditions are identified as an important
determinant of the incidence of childhood diseases, although the interactive effect of
extreme precipitation with drinking water sources or sanitation facilities is not
statistically significant. The estimation results show that unsanitary toilet facilities are a
key factor determining the incidence of fever and ARI, but only in urban areas.
Third, on average the incidence of childhood illnesses estimated from the national
surveys varies by survey month and is strongly influenced by survey location. Therefore,
using disease surveillance data to estimate disease incidence at disaggregate levels may
be more reliable than using national health surveys.
Finally, the findings provide useful information on the links between health- and climate-
related conditions, but they should be interpreted with caution. The pathways from
climate conditions to health are complex, and non-climatic factors and human adaptation
responses to climate variability are often important underlying determinants of disease
dynamics and population health. These factors are difficult to account for in some cases
due to data deficiency and limitations in the existing analytical approaches.
The most effective means to improve our understanding of the links between health and climate
change may include (a) improving the collection and use of ecological and environmental data
using remote-sensing technologies and meteorological conditions from satellites at higher levels
of resolution and (b) building a base of data for sufficiently long periods of time and across
regions. The analysis in this section takes a first step in this direction in the context of
Bangladesh.
2.4 Projecting Future Health Burden
The statistical relationship between climate variation and disease incidence estimated in the
previous section provides critical parameters for projecting future health burden in the context of
climate change. It is important to acknowledge that the health impact of climate change and
variability remains highly uncertain, and extrapolating future health impacts of climate
variability based on estimated statistical relationships at the local level can be highly imprecise
(National Research Council 2001). However, projections are useful for understanding the
potential economic and social implications of disease burden. In this section, future disease
burden is projected under several assumptions (see box 2.2).

36
The climate projection is taken from the global circulation models adopted in World Bank (2009)
which studies climate adaptation in Bangladesh. The vast majority of climate change predictions
relevant to Bangladesh have been made using regional climate models. These models project that
the rate of warming in South Asia will be significantly faster than that seen in the twentieth
century and more rapid than the global mean rate of warming. During December, January, and
February, warming is expected to be at its greatest and to be associated with a decrease in
precipitation, while the consensus of regional models is that summer rainfall will increase.
Box 2.2 Key Assumptions for Projecting Disease Burden by 2050
First, the projection of future temperature and precipitation is based on 16 global circulation
models from the fourth report of the Intergovernmental Panel on Climate Change (Yu et al.
2010), which predicted temperature rises during all months and seasons. The median warming
prediction for Bangladesh across the models by the 2050s is 1.55°C. The projected monthly
precipitation assumes that both annual and monsoon season precipitation increases, but that
precipitation during the post-monsoon dry season does not rise. A median increase in
precipitation of 4 percent by the 2050s compared with the baseline of 1980 for Bangladesh is
assumed.
Second, the level of public investment in water and sanitation in the coming four decades is
assumed to be sufficient to improve access to safer drinking water and sanitation services taking
account of population growth. It is assumed that by 2050 all households currently without safe
water sources will be connected to piped water and that households currently using open latrines
will be provided with sanitation facilities that connect to a septic tank.
Extreme weather events are projected to become more frequent in South Asia, including heat
waves and excessive rainfall. Tropical cyclone intensity is also expected to rise by 10–20 percent
and sea surface temperature is expected to increase by 2–4°C. Glacial and sea-ice melt and the
expansion of the oceans due to higher mean temperature suggest that sea-level rise is certain (the
minimum rise of about 40 centimeters by the end of the century is projected based on the most
conservative climate change estimates; Map 2.2 presents the projected spatial distribution of
disease incidence, temperature, and floods by 2050.

37
Map 2.2 Spatial Distributions of Disease Incidence, Temperature, and Floods by 2050
a. Disease incidence b. Temperature c. Floods
Table 2.7 summarizes the projection results by 2050. Under the scenario of a rise in average
temperature of 2°C and increased frequency of excessive rainfall events across all regions (from
30 to 40 percent) in Bangladesh, the incidence of ARI and fever is projected to increase, but the
incidence of diarrhea is projected to remain unchanged. The future health burden of these three
childhood illnesses is projected to be about 14 million disability-adjusted life years (DALY),
accounting for about 3.4 percent of GDP by 2050, based on the United Nations population
projections for Bangladesh for 2050.16
This projection should also be regarded as the lower-bound estimate for at least two reasons.
First, it covers only three childhood illnesses. Many studies in Bangladesh show that other
diseases in adults, including hypertension due to water salinity caused by coastal flooding,
malnutrition due to both increased food insecurity and high disease incidence (the two-way
causation between nutrition and childhood illnesses, and mental disorders, have already become
more prevalent in recent years and could be attributed to climate change.
Second, in the coming decades, the population—in particular, in urban and coastal areas—is
likely to be more exposed to a variety of health risks of much bigger magnitude as the frequency
of extreme weather events rises.
16
The calculation of DALY for children under the age of five is the sum of morbidity and mortality from
three illnesses. Morbidity is estimated from the projected disease cases for 2050, assuming that the
average length per episode is four days, a DALY disability severity weight of 0.11 and a DALY age
weight of 0.31, taken from WHO guidelines (Murray and Lopez 1997). Mortality is calculated based on
total disease cases for 2050, which are estimated based on the conditional probability of mortality for
each illness and discounted years of life lost per child, based on WHO guidelines.
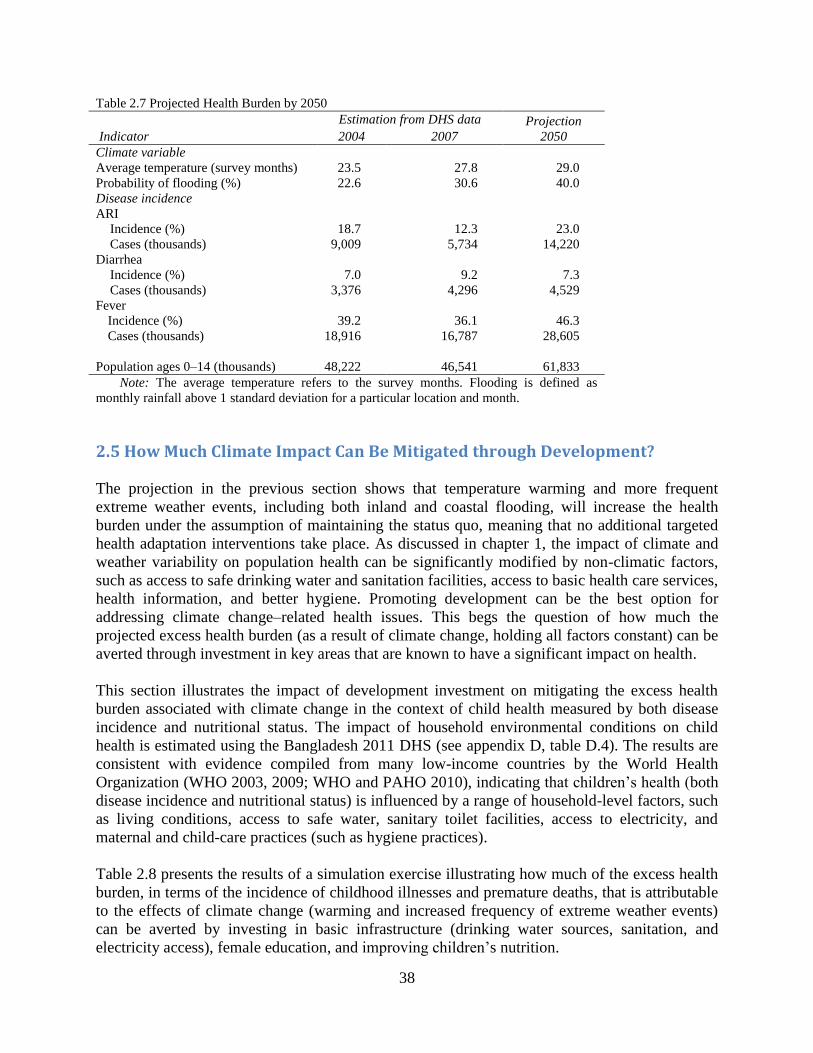
38
Table 2.7 Projected Health Burden by 2050
Estimation from DHS data Projection
Indicator 2004 2007 2050
Climate variable
Average temperature (survey months) 23.5 27.8 29.0
Probability of flooding (%) 22.6 30.6 40.0
Disease incidence
ARI
Incidence (%) 18.7 12.3 23.0
Cases (thousands) 9,009 5,734 14,220
Diarrhea
Incidence (%) 7.0 9.2 7.3
Cases (thousands) 3,376 4,296 4,529
Fever
Incidence (%) 39.2 36.1 46.3
Cases (thousands) 18,916 16,787 28,605
Population ages 0–14 (thousands) 48,222 46,541 61,833
Note: The average temperature refers to the survey months. Flooding is defined as
monthly rainfall above 1 standard deviation for a particular location and month.
2.5 How Much Climate Impact Can Be Mitigated through Development?
The projection in the previous section shows that temperature warming and more frequent
extreme weather events, including both inland and coastal flooding, will increase the health
burden under the assumption of maintaining the status quo, meaning that no additional targeted
health adaptation interventions take place. As discussed in chapter 1, the impact of climate and
weather variability on population health can be significantly modified by non-climatic factors,
such as access to safe drinking water and sanitation facilities, access to basic health care services,
health information, and better hygiene. Promoting development can be the best option for
addressing climate change–related health issues. This begs the question of how much the
projected excess health burden (as a result of climate change, holding all factors constant) can be
averted through investment in key areas that are known to have a significant impact on health.
This section illustrates the impact of development investment on mitigating the excess health
burden associated with climate change in the context of child health measured by both disease
incidence and nutritional status. The impact of household environmental conditions on child
health is estimated using the Bangladesh 2011 DHS (see appendix D, table D.4). The results are
consistent with evidence compiled from many low-income countries by the World Health
Organization (WHO 2003, 2009; WHO and PAHO 2010), indicating that children’s health (both
disease incidence and nutritional status) is influenced by a range of household-level factors, such
as living conditions, access to safe water, sanitary toilet facilities, access to electricity, and
maternal and child-care practices (such as hygiene practices).
Table 2.8 presents the results of a simulation exercise illustrating how much of the excess health
burden, in terms of the incidence of childhood illnesses and premature deaths, that is attributable
to the effects of climate change (warming and increased frequency of extreme weather events)
can be averted by investing in basic infrastructure (drinking water sources, sanitation, and
electricity access), female education, and improving children’s nutrition.

39
Table 2.8 Simulation of the Health Impact of Climate Change (Warming and Flooding) by 2030 under Two
Scenarios: Current versus Higher Levels of Investment
Scenario 2: Additional investment to promote development
Impact
Scenario 1: Current level
of investment Infrastructure Education Nutrition
All three
combined
Incidence of illness (base
line: 0.42 in 2011) 0.432–0.474 0.395 0.396 0.400 0.371
Averted deaths in children
ages 0–14 (thousands) 464 −224 −215 −160 −605
Note: The incidence of childhood illness is projected based on regression estimation using the 2011 DHS, assuming
that (a) average temperature increases by 1.5°C and (b) the probability of flooding increases from the current level of 0.225 to
0.35 by 2030 across the whole country. The population between the ages of 0 and 14 was 51 million in 2011(based on WHO
figures) and is projected to be 66 million in 2020, and 61.8 million in 2030, based on U.S. projections. Overall development
investment achieves (a) universal access to safe drinking water (that is, tube well in rural areas and piped water in urban areas),
sanitary toilet facilities, and household access to electricity; (b) secondary female education attainment; and (c) elimination of
child stunting in 2030.
Table 2.8 presents the simulated impact on the incidence of childhood illnesses and premature
deaths averted under two scenarios by 2030. The first one is the case where total investment is
only sufficient to keep up with population growth, which means that the current levels of access
to basic services, female education, and child nutrition status remain the same in 2030. The
projected child deaths attributable to climate change would be around 464,000 in 2030.
The second scenario assumes that additional investments are made to achieve the following
targets: (1) universal access to basic environmental services; (2) secondary female education
attainment; and (3) elimination of child stunting by 2030. These targets are set in reference to
both the current level estimated from 2011 DHS and the Millennium Development Goal (MDG)
targets set for 2015 (see box E.1 in appendix E). In this scenario, about 605,000 child deaths
would be averted. This is more than the total deaths that are projected to occur as a result of
climate change, which indicates that targeting social investment in areas that are particularly
important to child health could mitigate completely the excess child deaths attributable to climate
change. The message is clear: while climate change is indeed an important issue and can affect
health both directly and indirectly, focusing resources on traditional areas of development, such
as improving access to safe drinking water, sanitation, electricity, female education, and child
nutrition, is the best option for mitigating the adverse health impacts of increased climate risks.
2.6 Key Messages
Given that resource limitations (for example, medical personnel and drug availability)
have always been one of the key constraints in Bangladesh, findings from this chapter—
that the impact of climate variability on the incidence of childhood illnesses varies
sharply between pre-monsoon and monsoon seasons—suggest that policy makers should
focus on selectively targeting the implementation of disease control programs, both
temporally (focusing on peak seasons) and spatially to reach the most vulnerable
locations in terms of climate and health risks.

40
The identification of vulnerable locations should be based on a comprehensive spatial
database, which covers climate-sensitive diseases (incidence and outbreaks) and their
seasonal patterns, patterns of extreme climatic events (such as heavy rainfall or prolonged
periods of drought), and local environmental infrastructure (drinking water sources,
sanitation, sewerage system, and waste management). The spatial database should be at a
disaggregate level, such as unions in rural areas or slum and non-slum areas in urban
areas.
The disease data collected from the national surveillance system and the climate data
collected from various sources, including both weather station and remote-sensing
precipitation equipment, should supplement the national health surveys. Research efforts
should focus particularly on flood-prone areas with high population density to provide
location- and context-specific information for improving the implementation of disease
management programs in these locations.
While the adverse health consequences of climate change have gained recognition in
recent years, it is important not to lose sight of the importance of socio-environmental
conditions for health. A simple message is that focusing resources on traditional areas of
development, such as improving access to safe drinking water, sanitation facilities,
electricity, female education, and child nutrition and improving resilience and risk
management capacity, can be the best health adaptation option in the face of increased
climate risk.
41
Chapter 3: Vector-Borne Diseases: Hotspots
and Climate Linkages
Epidemiological studies across the world show that climate variability has a direct influence on
the replication and movement of microbes and vectors of many vector-borne diseases (VBDs).
The temporal and spatial changes in temperature, precipitation, and humidity affect the biology
and ecology of vectors and intermediate hosts and, consequently, the risk of vector-borne disease
transmission among the exposed population. Socio-economic and environmental conditions—in
particular, rapid urbanization and population migration—are also identified as important
determinants of the spread and outbreak of VBDs.
The Bangladesh government, in the 2008 Climate Change Strategy and Action Plan, highlighted
the importance of addressing the emerging public health risks associated with three VBDs:
malaria, dengue fever, and kala-azar (see box 3.1). However, studies that focus on the links
between climate conditions and the incidence of VBDs in Bangladesh are extremely limited,
with the exception of malaria. This scarcity of empirical studies in the area of VBDs is largely a
result of poor data sharing and underuse of VBD information and weather station data that are
readily available in Bangladesh.
Box 3.1 Major VBDs in Bangladesh
Malaria is one the most common vector-borne diseases in tropical regions, and pathogens are
protozoan that are transmitted to humans by the Anopheles mosquito. Anopheles mosquitos tend
to prefer a temperature range from 24°C to 27°C. If the overall temperature rises, their habitat
may be reduced, and the breeding period may be shifted and prolonged, leading to a possible
change in malaria distribution in Bangladesh.
Dengue fever is transmitted by Aedes aegypti, a type of mosquito that feeds primarily on
humans and thrives especially in urban environments where still water and plant containers are
abundant. The intensity of dengue vectors is determined mainly by the availability of breeding
sites such as water containers. Based on studies in some areas of Bangkok, the abundance of
vectors is largely independent of rainfall.
Kala-azar is caused by the female sand fly Phlebotomus argentipes on the Indian subcontinent,
including Bangladesh. The disease is lethal if left untreated and affects approximately 500,000
new patients annually worldwide, with 60 percent of new cases on the Indian subcontinent.
Climate adaptation measures (for example, building more embankments in response to sea-level
rise) may be conducive to the spread of visceral leishmaniasis vectors, increasing the number of
cases of kala-azar. Kala-azar cases in Bangladesh are found to cluster near flood control
embankments.
42
This chapter provides some evidence on the links between climate conditions and these three
VBDs using several data sources that are available in Bangladesh. Section 3.1 summarizes the
epidemiology of VBDs. Section 3.2 reviews existing data sources on key disease data in
Bangladesh. Section 3.3 analyzes the temporal and spatial distribution of the three VBDs using
the most recently available data in high-prevalence regions. Section 3.4 presents a statistical
analysis of the correlation between climate variables and the incidence of VBDs.
3.1 The Epidemiology of Vector-Borne Diseases
Malaria, dengue fever, and kala-azar are all transmitted between human hosts by vectors.17
The
effect of climate variability on the incidence and caseload of VBDs is mediated through its
impact on each component of the transmission cycle of different pathogens. The transmission
components include pathogen (viral, bacterial, and parasites), vector (mosquito), non-biological
vehicle (water, soil), non-human reservoir (mice, rodent), and human host.
Many studies show that climate variables such as temperature, precipitation, and humidity affect
the life cycle of many disease pathogens and vectors and, consequently, the outbreak and
incidence of disease.18
Changes in temperature are therefore likely to have the biggest impact on
the transmission of vector-borne diseases. Transmission occurs at two ranges of temperature: 14–
18°C at the lower end and 35–40°C at the upper end.19
An increase in temperature in the lower
range has a significant and nonlinear impact on the extrinsic incubation period and consequently
on the transmission of disease (Watts et al. 1987). A rise in temperature above 34°C generally
has a negative impact on the survival of vectors and parasites (Rueda et al. 1990), reducing
transmission risks. However, at around 30–32°C, vector capacity can increase substantially as
result of a reduction in the extrinsic incubation period.20
Reeves et al. (1994) find that extremely
17
In epidemiology, infectious diseases are broadly classified as anthroponoses if the natural reservoir of
the pathogen is human and zoonoses if it is animal. Direct transmission is defined as when the pathogen is
transmitted directly between human hosts or between animals through physical contact or droplet
exposure, while indirect transmission is defined as when the pathogen is transmitted between human hosts
by either a physical vehicle (water) or a biological vector (mosquito).
18
For example, Hales, Edwards, and Kovats (2003) show that warm ambient temperature and high
humidity increase the probability of transmission by shortening the time for mosquitos to become
infectious, resulting in higher vector-borne incidence.
19
Jetten and Focks (2006) find that warming temperature increases the incidence of dengue fever up to a
threshold and that, when passing the threshold, rising temperature reduces the incidence of many vector-
borne diseases. For regions where cases of dengue are already present, the impact of an increase in
average temperature is substantial—the aggregate epidemic risk is increased by an average of 31–47
percent for a 1°C increase in mean temperature (Patz et al. 1996).
20The relationship between temperature and the survival of a wide range of pathogens is complex and
nonlinear (Patz et al. 2010). Extreme temperatures (too high and too low) are destructive to the survival of
pathogens because their physiological tolerance has a limit. But a gradual increase in temperature in the
spectrum of moderate temperatures is likely to increase the survival and spread of pathogens and viruses.

43
high temperatures can actually increase mosquito mortality, which decreases the transmission of
arboviral disease (related to dengue fever).
Several studies have shown that rainfall is positively associated with dengue incidence. Rainfall
could facilitate the spread and transmission of vector-borne diseases by expanding breeding sites.
Heavy rainfall contributes to inland water bodies and flooding almost every year in Bangladesh,
creating a suitable environment for the vector.
Humidity is another critical climatic factor that can influence the survival and transmission of
VBD pathogens and vectors. Most studies that include the humidity variable show a consistent
pattern of rising humidity being positively associated with disease incidence, suggesting that a
high level of humidity is conducive to the replication and survival of many pathogens and
viruses. Humidity is found to be one of the most critical determinants of dengue fever (Hales,
Edwards, and Kovatz 2003).
While these climate variables are correlated with a high incidence of VBDs, the seasonal patterns
of infectious diseases are one major pathway through which climate change can have a
potentially drastic effect on the dynamics and outbreaks of disease (Pascual and Dobson 2005).
For example, long-term climate change affects seasonal patterns, altering the timing of the onset
of the monsoon season or lengthening the hot season, all of which can affect the key components
of the transmission cycle. A longer monsoon season may affect the reproduction rate of
pathogens and increase the coverage of still water to facilitate the geographic spread of
mosquitos and, consequently, the spread of VBD risk.
However, the impact of climate variability on the incidence of many vector-borne and water-
borne diseases can be significantly modified by local environmental conditions and human
adaptation responses. For example, in a tropical region such as Bangladesh, drought can lead to
an increase in dengue fever because more people may store water in open containers in areas
where access to piped water is limited, thus increasing the number of breeding sites for
mosquitos. Another striking example of the importance of non-climatic factors on VBDs is the
sharp difference in dengue fever cases along the United States and Mexico border, with about
5,033 cases reported on the Mexico side, compared with only 100 cases on the United States side
between 1980 and 1996; given the identical climatic conditions, the difference is attributable
almost entirely to socio-environmental factors.
3.2 Key Data Sources and Issues for VBDs
Three main institutions in Bangladesh are directly involved in the collection of data on major
water- and vector-borne diseases. These include (1) the Directorate General of Health Services
(DGHS) under the Ministry of Health and Family Welfare (MoHFW); (2) the Institute of
Epidemiology, Disease Control, and Research (IEDCR); and (3) the International Center for
Disease and Diarrhoeal Research, Bangladesh (ICDDR,B).
The DGHS is responsible for the Management Information System (MIS) of the health system,
which records a wide range of diseases collected from health facilities across the country. The
IEDCR also collects information on water- and vector-borne diseases through disease

44
surveillance and disease outbreak investigations. ICDDR,B has also developed a surveillance
system for diarrheal disease and vector-borne infections (malaria) over the past decade. In
addition, the incidence of water- and vector-borne diseases among children under the age of five
is collected through nationally representative Demographic and Health Surveys (DHSs) at
regular intervals of every three years by the National Institute of Population Research and
Training (NIPORT). Table 3.1 summarizes the data sources for these three VBDs.
Table 3.1 Key Data Sources for VBDs
Indicator Dengue Malaria Kala-azar
Source Disease Control Room of
Directorate General of
Health Services (DGHS)
National Malaria Control
Program (NMCP) of
DGHS
Malaria and Parasitic
Disease Control Unit
(M&PDC) of DGHS
Period and frequency Monthly from 2000 to
2011
Monthly from 2007 to
2011; yearly 2000 to
present
Yearly from 1994 to 2007;
monthly from 2008 to
2011
Level District District Yearly data at district
level; monthly data at
upazila (subdistrict) level
Comments Cases were confirmed by
different government and
private hospitals of
Bangladesh
Cases were confirmed by
different government
hospitals (mostly upazila
health complex) and
nongovernment
organizations
Cases were confirmed by
different government
hospitals (mostly upazila
health complex)
As part of the capacity assessment, focus group interviews were conducted to identify major data
issues and ascertain the quality of data from different agencies in charge of collecting health data
in Bangladesh. Poor data quality and inadequate institutional capacity, ranging from the primary
data sources (the health facility level) to the final centralized data system (health MIS) were
identified as the key problems by all agencies.
The inaccuracy of disease data result largely from lack of computer facilities and designated staff
for data collection and database management at the facility level, in particular hospitals. The
responsibility for collecting and recording disease data rests on doctors and nurses who are
already overloaded with health service delivery. The information collected on VBDs is often not
based on laboratory tests due to lack of diagnostic devices. Also, the data are not collected using
a standardized health format; for this reason, the data reported to the health MIS is likely to be
incomplete and inconsistent across regions and over time.
Another important data deficiency is the omission of disease cases reported from private health
practitioners where a large proportion of VBD patients are treated. It was estimated that more
than half of total annual cases of disease are not recorded in the health MIS because cases treated
in private sector health facilities are not included.
The MoHFW has taken some initiatives to improve the health MIS to ensure the delivery of
timely and reliable disease information. These include regular and timely publication of health
bulletins, modernization of the data collection and storage system in a central department, and

45
creation of an assessment report using Health Metric Network assessment tools. The key findings
from the focus group interviews suggest that efforts to improve the quality of health data should
target lower-tier facilities, such as subdistrict-level hospitals and clinics where the regulator’s
collection of disease data is taking place, and include private health facilities. Data should be
verified using multiple data sources to check consistency and reliability before they are
published in the health MIS.
3.3 The Temporal and Spatial Distribution of VBDs
Temporal and seasonal trends
Figure 3.1, panel a, presents the trends of three VBDs from 2000 to 2011 and their seasonal
patterns based on monthly VBD cases collected from the government disease surveillance
system managed by the DGHS. The caseloads for all three VBDs vary erratically from year to
year, with no clear trends of increase or decrease observed for this period.
Figure 3.1 Trends and Monthly Disease Patterns of VBDs, 2000–11
For dengue fever, a total of 23,518 cases and 239 deaths were reported during the period of
2000–11. The highest caseload was recorded in 2002 (6,132), followed by 2000 (3,964), and the
lowest caseload was in 2010 (409). In the case of kala-azar, a total of 104,313 cases were
recorded from the 36 districts during 1994–2011. A declining trend of cases is seen from 2004 to
2011. The number of malaria cases remained stable between 2000 and 2005 but spiked in 2008.
However, due to inconsistent data collection across locations and over time, caution should be
taken in reaching any conclusions regarding the trends of VBDs using these data sources.
Figure 3.1, panel b, presents the seasonal patterns of three VBDs using the average monthly
number of disease cases constructed for the period 2000–11. A clear seasonality pattern is
0
10000
20000
30000
40000
50000
60000
70000
80000
90000
0
1000200030004000
50006000
7000
80009000
10000
20
00
20
01
20
02
20
03
20
04
20
05
20
06
20
07
20
08
20
09
20
10
20
11
Mal
aria
Kal
a-az
ar a
nd
den
gu
e
(a) Trends of VBDs in Bangaldesh 2000-11
Kala-azar case Dengue case Malaria case
0
2000
4000
6000
8000
10000
12000
0100200300400500600700800900
Jan
uar
y
Feb
ruar
y
Mar
ch
Ap
ril
May
Jun
e
July
Au
gust
Sep
tem
ber
Oct
ob
er
No
vem
ber
Dec
em
ber
Mal
aria
Kal
a-az
ar a
nd
den
gu
e
(b) Monthly disease pattern in Bangladesh
Kala-azar case Dengue case Malaria case

46
evident for dengue fever and malaria, but not for kala-azar. The dengue fever season starts in
July, peaks in August (accounting for 37.5 percent of total annual cases on average), and declines
in October (20.5 percent). In the Dhaka area where more than 98 percent of cases are reported,
no cases were found from January through April during 2000–11. An outbreak of dengue fever
and dengue hemorrhagic occurred in Dhaka in 2000, with more than 5,551 hospitalized cases and
93 reported deaths between July and December.
While malaria cases are recorded throughout the year, the malaria season starts in June
(accounting for about 13.2 percent of annual total cases), peaks in July (15.1 percent), and
declines from September onward (accounting for about 12.2 percent in September). The seasonal
pattern of kala-azar disease is less obvious, with the caseload rising gradually from March and
declining from October onward.
Disease hotspots
In general, the infectious disease hotspots are likely to change over time, depending on local
climate conditions, geographic shift of seasonal patterns, local environmental conditions, and
population movement. Map 3.1 presents the spatial distribution of dengue fever, kala-azar, and
malaria using the most recently available data of 2011.
The cases of dengue fever were reported primarily in two cities, Dhaka and Khulna. Using
geographic information system (GIS) technology, Ali et al. (2005) showed that dengue clusters
are less identifiable in areas farther away from major hospitals, suggesting that proximity to
hospitals determines whether cases of dengue are diagnosed.
In Bangladesh, 45 out of 64 districts are recorded to have kala-azar cases. Mymensingh is the
most endemic region, accounting for about 48.5 percent of total cases, followed by Pabna (11.4
percent) and Tangail (9.4 percent) (Rahman et al. 2008). Five upazilas in the Mymensingh
District have the highest number of kala-azar cases. At the aggregate level, about 5,000 new
cases of kala-azar are reported every year, although officially recorded cases are likely an
underestimation due to lack of access to diagnostic devices and an inadequate public health
surveillance system in many parts of the high-endemic areas.
The map of malaria shows that the majority of malaria cases occurred in 13 districts close to the
areas bordering India and Myanmar, accounting for 98 percent of the reported cases of malaria
identified in Bangladesh. These 13 districts are difficult to reach due to the hilly terrain and lack
of surveillance and information systems. Therefore, substantial underreporting of malaria cases
in this region by the Ministry of Health is highly plausible. Bandarban, Khagrachari, and
Rangamati, collectively known as the Chittagong Hill Tracts districts, recorded the highest
incidence of malaria in Bangladesh. Rangamati District has the highest number of cases of
malaria throughout the year, followed by the districts of Bandarban and Khagrachari.
Moulvibazar District, situated in the northeast part of the country, is also classified as a high-
malaria-risk area, with malaria cases rising significantly from June to August in 2011 to reach
the level of Chittagong District.

47
Map 3.1 Geographic Distribution of Vector-Borne Diseases in 2011
a. Malaria cases b. Dengue cases c. Kala-azar cases
3.4 Statistical Correlation between Climate Conditions and VBDs
In this section, the statistical correlation between climate variables and VBD cases is analyzed
using the monthly disease cases collected from the health surveillance system managed by
DGHP and validated by ICDDR,B. The Spearman rank correlation coefficient is used to assess
the strength of correlation. Both current and lagged climate variables are used in the correlation
analysis to allow for the long incubation period of many of the vectors.21
Dengue fever
The analysis focuses on Dhaka District, where most (about 92 percent) of the total number of
dengue cases were recorded during the period 2000–11. The results presented in table 3.2 show a
strong correlation between lagged climate variables (rainfall, temperature, and humidity) and
dengue cases. Monthly rainfall (both current rainfall and rainfall lagged up to three months) is
positively correlated with dengue cases, with the highest correlation observed in two-month
lagged rainfall (0.73). The average temperature (lags of up to three months) is also significantly
correlated with dengue cases, as is humidity level. These results provide important evidence on
the links between climate variability and dengue fever in Bangladesh.22
21
For example, research shows that the dengue vector, Aedes mosquito, takes 7 to 45 days to become an
adult from an egg.
22
Other studies have found similar results in the other settings. In Rio de Janeiro, Brazil, dengue
incidence was significantly correlated with a 0-month time lag for minimum and maximum temperature
and a 1-month time lag for accumulated rainfall. Minimum relative humidity and total rainfall at a 2-
month time lag and minimum and maximum temperature at a one-month time lag were correlated with
dengue incidence in Guangzhou, China. In Guadeloupe, French West Indies, dengue incidence was most
positively correlated with three climatic factors: relative humidity with a 7-week lag, minimum

48
The findings of stronger correlation between lagged climate variables (lags of up to two to three
months) and the cases of dengue fever are particularly useful. They suggest that closer
monitoring of climate conditions (rainfall, temperature, and humidity) in June and July (one or
two months preceding August, the expected peak month for dengue fever) can provide some
prediction of the caseload of dengue fever in August and thereby help in preparedness. For
example, preventive and case control measures should be put in place in high-risk locations such
as Dhaka when abnormal climate (for example, higher rainfall and hotter weather than long-term
means) is observed one or two months preceding the peak month of August.
Table 3.2 Spearman Rank Correlation of Dengue Cases and Climatic Factors
Factor Lag 0 Lag 1 Lag 2 Lag 3
Total rainfall 0.39 0.64 0.73 0.54
Average minimum temperature 0.43 0.66 0.67 0.55
Average maximum temperature 0.05*
0.26 0.44 0.58
Average humidity 0.60 0.74 0.65 0.33
* Statistically not significant. Highest correlations are marked as bold.
Malaria
The statistical analysis is based on monthly data collected by ICDDR,B from three hilly districts
(Khagrachhari, Rangamati, and Bandarban) and one coastal district (Cox’s Bazar) from 2007 to
2011. Table 3.3 presents the results, which show that high rainfall is positively correlated with
malaria cases in Rangamati and Khagrachhari, while in Bandarban the positive association is
strongest with one-month lagged rainfall. High humidity is also positively correlated with
malaria cases. In all the four districts, high temperature increases the number of malaria cases
with a one- to two-month lagged effect, and the correlation between climate variables and
malaria cases becomes stronger as the location of the district is farther away from the coastal
area, with the correlation in Cox’s Bazar (an inland district) being the weakest.
temperature at a 5-week lag, and mean temperature at an 11-week lag. In Barbados, the strongest
correlation was found between dengue incidence with vapor pressure at a 6-week lag, precipitation at a 7-
week lag, minimum temperature at a 12-week lag, and maximum temperature at a 16-week lag. In
Kaohsuing City in Taiwan, China, amount of rainfall, relative humidity, and minimum and maximum
temperature were positively correlated at a 2-month lag with dengue incidence for 1995–2000 and at a 3-
month lag for 2001–08 . For 1992–2001, dengue incidence in Jakarta, Indonesia, was correlated with a 2-
month lag of rainfall and 1-month lag of temperature.

49
Table 3.3 Spearman Correlation between Malaria Cases and Climate Conditions
District and
climatic factors Lag 0 Lag 1 Lag 2 Lag 3
Khagrachhari District
Total rainfall 0.73 0.63 0.36 0.04*
Average minimum temperature 0.7 0.66 0.48 0.16*
Average maximum temperature 0.15* 0.38 0.57 0.57
Average humidity 0.65 0.38 0.01* –0.41*
Rangamati District
Total rainfall 0.7 0.66 0.49 0.08*
Average minimum temperature 0.71 0.72 0.53 0.19*
Average maximum temperature 0.20* 0.5 0.6 0.53
Average humidity 0.7 0.39 0.02* –0.37*
Bandarban District
Total rainfall 0.59 0.66 0.46 0.16*
Average minimum temperature 0.66 0.8 0.72 0.43
Average maximum temperature 0.34 0.57 0.62 0.48
Average humidity 0.76 0.67 0.45 0.15*
Cox’s Bazar District
Total rainfall 0.39 0.44 0.24* 0.02*
Average minimum temperature 0.29 0.43 0.5 0.35
Average maximum temperature –0.08* 0.21* 0.57 0.68
Average humidity 0.44 0.38 0.22 –0.07*
*Statistically not significant. Highest correlations are marked as bold.
Kala-azar
Table 3.4 presents the Spearman correlation analysis for kala-azar. The correlation between kala-
azar cases and climate variables is much weaker than that for dengue fever and malaria. The
Spearman rank correlation coefficients are statistically significant only for temperature
(minimum and maximum). Unlike the results for dengue fever and malaria, no lagged climate
variables are correlated with kala-azar cases.
Another noteworthy finding is that the correlation changes from positive to negative after two- or
three-month lags, although the lagged correlation is statistically insignificant. For example, the
correlation between the current monthly average temperature and kala-azar cases is 0.34, but it
changes to –0.15 for temperature with a two-month lag and to –0.2 with a three-month lag. The
results show a strong positive correlation between temperature and number of cases. Average
humidity is also positively correlated with kala-azar cases, but weaker than temperature and
rainfall variables.
Table 3.4 Spearman Rank Correlations of Kala-azar Cases and Climatic Factors
Factor Lag 0 Lag 1 Lag 2 Lag 3
Total rainfall 0.26 0.25 0.05 –0.10
Average minimum temperature 0.34* 0.17 –0.15 –0.20
Average maximum temperature 0.34* 0.14 0.01 –0.11
Average humidity 0.14 0.11 –0.04 –0.14
*Statistically significant. Highest correlations are marked as bold.

50
While we did not find a significant correlation between climate variables and kala-azar, some
research has been conducted in this area in Bangladesh. Using data collected in the highly
endemic district of Mymensingh from 2000 to 2004, Alam (2005) investigated the links between
the abundance of the kala-azar vector and environmental factors, focusing on soil conditions
(temperature, moisture, pH level, and organic composition) and housing structure. The results
show that organic composition is significantly correlated with the abundance of vector species
and that houses with mud walls are twice as likely to have vector species than houses with walls
made of tin.
In another study, using active surveillance data from 2006 to 2009 collected jointly by ICDDR,B
and the University of Tsukuba in Trishal upazila of the Mymensingh District, establishes a
statistically significant correlation between the kala-azar caseload and household location as well
as a gender effect on the incidence of kala-azar disease (in general, males have a higher risk of
contracting kala-azar than females).
3.5 Summary of Results
The findings presented here shed light on the seasonal patterns of three VBDs and their
sensitivity to climate variables. The results confirm a strong correlation between short-term
climate variability and VBD cases in high-prevalence regions of Bangladesh. In the case of
dengue fever and malaria, all climate variables (temperature, rainfall, and humidity), both current
and lagged, have a strong correlation with disease caseload. For kala-azar, only temperature is
significantly correlated with the number of cases. Soil conditions and housing structure were also
found to be correlated with the abundance of the kala-azar vector in the high-incidence district of
Mymensingh.
However, the correlation analysis does not control for local socio-economic and environmental
conditions and therefore has limitations for projecting future VBD burden or mapping the
geographic distribution of VBDs in Bangladesh.23
The findings suggest that the implementation
of VBD control programs should target resources (diagnostic equipment and medical staff) not
only in high-risk locations but also in seasons with high caseloads.
Interdisciplinary approach should be promoted for research on VBDs and climate links. For
example, the epidemiological research that is based on laboratory or field experiments and
mathematical modeling of the dynamics of infectious disease epidemics can be combined with
the dose-response between the exposure of pathogens and the disease incidence to assess the
health impact of future climatic risk factors. This approach has been used by the U.S.
Environmental Protection Agency to develop controls for key water-borne disease agents and by
the World Health Organization, which conducted a global assessment of the health impact of
climate change (Campbell-Lendrum, Corvalan, and Pruss-Ustun 2010).
23
Although socio-economic factors may influence individual cases, the data collection methods used
preclude us from understanding their influence on specific cases.

51
3.6 Key Messages
While the incidents of VBDs are projected to increase with climate change in
Bangladesh, as highlighted in the government’s Climate Change Strategy and Action
Plan, VBDs pose a less critical public health threat than water-borne diseases such as
diarrhea or the high prevalence of malnutrition. This is due to the fact that a wide range
of non-climatic factors (ecological, environmental, and socio-economic factors) are
known to influence the incidence of VBDs and that the health burden associated with
VBDs has remained relatively small (1 and 0.9 percent of deaths from malaria and
dengue, respectively, compared with 10.7 percent from diarrhea, which is even higher
when taking account of malnutrition).
Addressing existing and emerging VBDs in Bangladesh, future studies should focus on
filling in the information gap on the cost-effectiveness of various VBD control
interventions. Given the large uncertainties about the impact of climate variability, social
and environmental conditions, as well as urbanization and population migration on the
replication and movement of microbes and vectors, it is plausible that vector-control
programs in the context of Bangladesh may be less cost-effective than case management
interventions. However, lack of rigorous cost-effectiveness analysis in this area limits the
possibility of providing concrete answers to questions of this nature.
A first step in this direction is to collect data on the impact and cost of a variety of VBD
programs in Bangladesh, covering vector control programs, community-based awareness
initiatives, and projects designed to improve access to rapid diagnostic devices and
essential drugs.
To provide information for improving the targeting of resources to address VBDs, efforts
should focus on three key areas: (1) improving data collection on VBDs from both public
and private clinics to identify correctly the changes in seasonal patterns and geographic
distribution of VBDs; (2) integrating epidemiological data with environmental and
climate data and promoting interdisciplinary research to improve the robustness of the
evidence; and (3) conducting spatial assessment of local health facilities (availability of
trained medical staff to diagnose and treat VBD cases and essential drugs and diagnostics
equipment) against the projected risk of VBD outbreaks in high-prevalence locations.

52
Chapter 4: Population Dynamics and Spatial
Targeting: Implications for Climate Change
and Health
One of the key features of population dynamics in Bangladesh is the rapid but poorly planned
urbanization process that has been taking place over the past few decades, with the share of
urban population rising from about 19 percent in the 1980s to about 30 percent in 2012. The
large population movement and the increased population density in urban areas—in particular,
the rapid expansion of urban slums, driven by a combination of poverty and recurring natural
disasters—are likely to alter the patterns and spread of disease, exposing the population to health
risks.
The results from the previous two chapters show strong geographic and seasonal patterns of
infectious diseases in Bangladesh. While these spatial and temporal characteristics of the
transmission of vectors and diseases can be influenced by climate variability and extreme
weather events, local adaptation—in particular, living conditions and the treatment and control of
disease—play a critical role in mitigating the adverse health consequences of climate risk. For
example, malaria was once common in many parts of Europe, but it is no longer found in these
regions as a result of improved living conditions (water supply infrastructure, sewerage system,
and screening of homes in addition to aggressive vector-control programs).
Therefore, assessing the geographic targeting of measures to fight the prevalence of disease, at
the disaggregate level, provides critical information for informing the design and implementation
of health adaptation interventions. Such an assessment would help the Government of
Bangladesh and its development partners to improve their ability to plan, prioritize, and target
policy interventions and investments to reach the population that is most vulnerable to infectious
diseases in locations where the health adaptation capacity is more limited.
This chapter focuses on three issues. First, it looks at how population dynamics have evolved
over the past decade in Bangladesh. Second, it presents the measurement of adaptation capacity
using complementary data sources. Finally, it conducts a spatial mapping of geographic targeting
of public financing of health adaptation capacity, including basic environmental infrastructure
and health facilities and disease prevalence.
4.1 Key Features of Population Dynamics
According to the United Nations population projections, the Bangladesh population will reach
218 million by 2050, from around 147 million in 2012, with urban areas estimated to absorb the
additional 70 million of total population growth. While the growth of rural population is

53
projected to halt by 2025,24
the urban population will increase from the current 34 million to
more than 100 million by 2050, predominantly as a result of rural-urban migration (Streatfield
and Zunaid 2008).
More alarming, the fastest growth is taking place in urban slums, at around 7 percent a year,
twice the average growth rate of the urban population. Based on the most recent data, the
proportion of slum population in urban areas is about 35.2 percent on average, but in Dhaka,
more than one-third (37.4 percent) of the total population (9,136,182) is currently living in slum
areas, compared with about 19.5 percent in Khulna City Corporation.
The rapid population growth and rural-urban migration have shaped the spatial distribution of
population density. While Bangladesh is the third most densely populated country in the world,
substantial variations exist across regions. Map 4.1 presents the current population density in
2011 and changes between 2001 and 2011 for 66 districts using the 2001 and 2011 population
censuses. In 2011, the most populated districts were Dhaka, Chittagong, Comilla, Mymensingh,
Tangail, Sylhet, Gazipor, and Bogra (ranging from 12 million in Dhaka to 3.4 million in Bogra).
The least populated districts were Bandarban, Rangamati, Khagrachhari, Meherpur, Jhalkati,
Narail, and Borguna (population between 390,000 in Bandarban to 918,000 in Borguna).
Map 4.1 Population Density and Growth
The population growth rate also varies substantially by region. Over the period of 2001 to 2011,
the average district population growth rate was about 1.2 percent. However, some districts grew
much faster (Gazipur, 6.7 percent; Dhaka, 4.2 percent; Narayanganj, 3.6 percent; Sylhet, 3.4
24
Another approximately 30 million will be added to the current 108 million people living in rural areas
by 2050.

54
percent), while a few districts shrank (Barisal, −0.13 percent; Jhalkati, −0.17 percent; Khulna,
−0.25 percent; and Bagerhat, −0.47 percent). The underlying reasons for the negative population
growth in these districts are not fully established, although extreme weather events, natural
disasters, and poverty are all likely to have contributed to the large outflows of population. The
complete list of population growth by district is summarized in table D.5 in appendix D.
Box 4.1 Issue of Sampling Bias
National household surveys such as the DHS omit the urban slum population. The health
indicators for urban areas across regions, therefore, do not capture a significant proportion of the
urban slum population. The recent joint initiatives by the government and the U.S. Agency for
International Development (USAID) have attempted to address this issue. The major outcomes
of this joint effort are the three waves of Urban Health Surveys (UHSs) conducted in 2006, 2011,
and 2013, covering slum and non-slum areas of the major city corporations, including Dhaka,
Chittagong, Khulna, Rajshahi, Barisal, and Sylhet.
A comparison of health indicators using the 2006 UHS and the 2007 DHS reveals the extent of
sampling bias as a result of inadequate coverage of the slum population in national health
surveys. Table B4.1.1 presents the incidence of diarrhea and stunting for Dhaka areas using the
two surveys. The comparison shows large discrepancies in these two health indicators. Diarrhea
incidence was about 11.3 percent in Dhaka using the DHS data, while it was much lower
according to the 2006 UHS (4.3 percent in non-slum areas, 8.2 percent in small- and medium-
size slum areas, and 6.8 percent in large slum areas).
Table B4.1.1 Potential Bias of Health Indicators of Urban Population: An Example of Dhaka
2006 UHS
Data source Large slum
Medium, small
slum Non-slum
2007 DHS,
all areas
Number of observations 721 664 546 960
Health indicators
Diarrhea incidence (%) 6.8 8.2 4.3 11.3
Stunting rate (%) 59.4 51.2 39.6 28.2
Note: The survey months are March–July for the 2006 UHS and April–August for the 2007
DHS for urban Dhaka area.
Child malnutrition status in urban areas is significantly underestimated using the DHS data: the
average stunting rate among children under five in Dhaka is about 28 percent using the 2007
DHS, compared with the estimate using the 2006 UHS (39 percent in non-slum areas in Dhaka,
51 percent medium- and small-size slums, and 59 percent in large slums).
The district-level information, however, presents only a partial picture, concealing variations of
population density between rural and urban areas and, more important, within urban areas. The
rapid but poorly planned urbanization in Bangladesh has been associated with many emerging
health problems, particularly in urban slums where the population growth rate is the highest.
However, the health status of the urban slum population is imprecisely estimated due to sampling
biases in current nationally representative household surveys such as the Demographic and
Health Surveys (DHSs) and household expenditure surveys. These surveys are important sources

55
of information on the spatial distribution of health status and social-economic conditions, but the
sampling design has not adequately captured the new features of population dynamics—in
particular, the rapid increase in urban-slum population (see box 4.1).
The average population density in an urban area is about 23,378 per square kilometer (ranging
from 7,152 in Barisal City Corporation to 29,857 in Dhaka Metropolitan Area). In Dhaka slums,
population density is around 205,415 per square kilometer, which is about 8 times the average
for urban areas and almost 300 times the average for rural areas (755 per square kilometer)
(Streatfield and Zunaid 2008).
Changing population dynamics and spatial distribution have important implications for public
health and the spread of infectious disease. The risk of disease endemics can be heightened
significantly in locations where public investment in basic environmental services such as safe
drinking water, sanitation facilities, and sewerage systems are lacking as a result of poor urban
planning. A challenge in policy making is to determine how to prioritize and allocate public
resources to support the development of health adaptation capacity in locations where the local
population is most vulnerable to health risk and climate shocks and local health and basic
environmental infrastructure is particularly lacking.
4.2 Measuring Health Adaptation Capacity
The local capacity to mitigate health risks associated with population migration and high density
as well as climate change depends on both health and non-health sectors. Therefore, a
comprehensive measure of local health adaptation capacity should cover local preventive and
treatment health services (disease surveillance systems and availability of medical staff and
essential drugs), local basic environmental infrastructure, and a risk and disaster management
system, to name a few. Both public and private sector capacity to address current and future
health risks should be incorporated in the measurement of capacity.
In reality, however, information that covers comprehensive measures of adaptation capacity at a
disaggregate level are often incomplete or not available. This limits the scope of adaptation
capacity assessments that are urgently needed to inform decisions on public resource allocation
across both sectors and locations. In this section, the district-level measures of health adaptation
capacity are constructed using complementary data sources, including the 2011 Bangladesh
health facility survey (HFS) and the 2011 census.
The 2011 HFS collected data on the availability of medical inputs (equipment, drugs, and
personnel), the provision of various types of health services, and information on consumer or
client satisfaction obtained from both public and private facilities covering all tiers of
administrative units (from community clinics to district hospitals). One of the important aspects
of health sector capacity is the delivery of quality health services. This capacity, in turn, depends
on the availability of equipment, skills, and training of medical personnel and the overall level of
management at the facility level. Information on these aspects of health care are often difficult to
collect in national health surveys.

56
In the following analysis, four core health sector–related indicators, covering equipment
availability, essential drug availability, staffing quality, and patient satisfaction, are constructed
from the 2011 HFS to measure the quality of health service delivery. Capacity in the non-health
sector is measured by indicators of environmental infrastructure constructed from the 2011
census, covering the proportion of households with access to safe drinking water, access to
sanitary toilet facilities, and access to electricity. The spatial distribution of overall health
adaptation capacity in 2011 is presented in map 4.2.
Map 4.2 Spatial Distribution of Overall Health Adaptation Capacity
According to the 2011 census, the districts that have inadequate access to sanitation facilities
(defined as less than 30 percent of a population with access to sanitary facilities) include
Bandarban, Thakurgraon, Gaibandha, Sunamganj, Nilphamari, Nawabganj, Naogaon, and
Rangama. The districts that have inadequate access to safe drinking water (defined as less than
80 percent of the population with access to safe drinking water) include Bangamati, Bandarban,
Bagerhat, Khagrachhari, and Sylhet.
These district-level measures of health adaptation capacity, constructed from the 2011 HFS and
the 2011 census together with disease data, provide critical information for assessing how well
public resources are spatially targeted. That is, do districts with high disease incidence have
adequate adaptation capacity measured by the availability of health services and the level of
basic environmental infrastructure? The following section assesses the efficiency of spatial
targeting using these district-level indicators.
4.3 Assessing the Efficiency of Geographic Targeting
Spatial assessment of adaptation capacity involves identifying disease hotspots and analyzing
spatial correlation between disease incidence and level of local adaptation capacity. Malaria is

57
concentrated in three districts (Bandarban, Rangamati, and Khagrachhari), which accounted for
about 92 percent of total cases during 2007–11. The cases of dengue fever were reported
primarily in Dhaka, and the cases of kala-azar were reported mainly in five upazilas of
Mymensingh District.
From a public health point of view, information on the availability of diagnostic equipment and
essential drugs in high-endemic regions is essential for assessing whether public recourses are
well targeted to address the risks of VBDs. Unfortunately, no such information is collected in
Bangladesh. However, focus group interviews found that in many locations at high risk of
VBDs, lack of diagnostic devices and poorly equipped surveillance systems have been a key
issue in monitoring VBDs, suggesting that inadequate resources are being allocated to disease-
prevalent locations.
Diarrhea is the most common infectious disease in Bangladesh, accounting for about 10 percent
of total deaths every year. The national disease surveillance system provides relatively reliable
records of diarrhea cases across the country. The top 12 districts with high incidence of diarrhea
cases in 2011, ranked in descending order, are Kushtia, Kishoreganj, Munshiganj, Manikganj,
Bandarban, Randarban, Rajshahi, Khagrachhari, Magura, Hennaidah, Satkhira, and Shariyatpur.
Table 4.1 presents the spatial distribution of the incidence of diarrheal disease against the
ranking of health and environmental services for the top 12 districts of high-diarrhea prevalence.
The ranking provides some evidence of poor targeting, with districts of high diarrhea prevalence
ranked low in access to safe water and sanitation as well as in essential drug availability.
Table 4.1 Spatial Analysis: Disease Incidence versus Local Capacity, 2011
Zila
Diarrhea
incidence (%)
Improved
sanitation (1
best; 65 worst)
Safe drinking
water (1 best;
65 worst)
Health equipment
availability (1 best;
25 worst)
Essential drug
availability (1 best;
25 worst)
Kushtia 4.96 38 14 5 19
Kishoreganj 3.83 52 41 10 21
Munshiganj 3.80 6 27 7 20
Manikganj 3.63 20 19 — —
Bandarban 3.57 64 63 — —
Rajshahi 3.48 42 28 — —
Khagrachhari 3.46 56 61 11 6
Magura 3.38 13 6 — —
Jhenaidah 3.37 41 10 1 23
Satkhira 3.36 39 57 11 16
Shariyatpur 3.34 5 33 9 1
Khulna 3.30 12 56 9 6
Rajbari 3.11 10 15 — —
Rangamati 3.10 57 64 11 6
Note: — = no data.
The efficiency of geographic targeting is further assessed using the Pearson correlation
coefficient between the incidence of diarrhea and a range of adaptation capacity indicators for 66
districts in 2011.25
Adaptation capacity is defined as previous investments in water supply and
sanitation and in public health service delivery. The results of the correlation analysis, as
25
The choice of diarrhea reflects the wide geographic coverage of cases, as all the vector-borne diseases
under study are concentrated in limited geographic locations.

58
presented in table 4.2 and figure 4.1, show that, with the exception of access to electricity, all
capacity indicators are negatively correlated with the incidence of diarrheal disease. For
example, the Pearson correlation between diarrhea incidence and safe water access is −0.3,
equipment availability (−0.1), essential drug availability (−0.08), staffing index (−0.04), and
patient satisfaction index (−0.03).
These findings provide strong evidence of poor geographic targeting of public resources in the
area of health adaptation interventions; locations with larger disease burden, in general, have
weaker adaptation capacity. Given that diarrhea is the most common infectious disease in
Bangladesh, similar results may be found for other health indicators, suggesting that overall
public resources for health adaptation are poorly targeted in Bangladesh.
Table 4.2 Pearson Correlation Coefficient between Adaptation Capacity and Disease Incidence: 2011
Indicator Pearson correlation Median
Basic infrastructure capacity
% of households with access to safe drinking water (tap and tube
well are defined as safe drinking water) −0.30 96.30
% of households with access to sanitary toilet facility (water-
sealed and non-water-sealed toilets are defined as sanitary) −0.04 61.45
% of households with access to electricity 0.17 48.65
Basic health service provision capacity
Equipment availability index (%) −0.10 66.67
Essential drug availability index −0.08 50.00
Staffing index −0.04 61.48
Patient satisfactory index −0.03 75.20
Incidence of diarrhea (%)
1.39
Sources: Basic infrastructure indicators are from 2011 census, and health service indexes are from
2011 HFS.
Figure 4.1 Correlation between Health Facility and Disease Incidence: 2010 District-Level Data
0
20
40
60
80
100
120
0.0 1.0 2.0 3.0 4.0 5.0 6.0
Eq
uip
men
t a
va
ila
bil
ity
in
dex, m
ea
n =
80
Incidence of diarrhea (%), mean = 1.7
a. Medical equipment availability and health
0
10
20
30
40
50
60
70
80
90
0.0 1.0 2.0 3.0 4.0 5.0 6.0
Dru
g av
aila
bili
ty in
de
x, m
ean
= 6
0
Incidence of diarrhea (%), mean = 1.7
b. Essential drug availability and health

59
The finding of poor geographic targeting of public resources in the area of public health is
consistent with findings from other studies in Bangladesh. Two important spatial assessments
have been carried out in Bangladesh in recent years, including poverty mapping at the subdistrict
level using the income/expenditure measure of poverty (World Bank 2013) and the spatial
assessment of multiple indicators covering education and health outcomes, access to health
services, and access to safe water and sanitation facilities (UNICEF 2013).
Combining spatial information from both assessments, the 2009 UNICEF report highlights the
strong spatial correlation between lack of access to basic social services and income/expenditure
poverty. The report recommends the policy of “blanket geographic targeting” of basic social
services to the most deprived geographic areas of Bangladesh as a means of achieving MDGs
related to equity as well as accelerating the overall reduction in poverty.
The World Bank (2010) also shows that public resources in the health sector are not spent
effectively and health facilities are not adequately financed and staffed. In particular, the current
resource allocations are not effectively reaching the poor. Inequalities in access to health services
remain a key issue and contribute to disparities in health outcomes between the rich and poor.26
4.4 Key Messages
The results from this chapter, combined with evidence from other spatial assessment
studies (World Bank 2010; UNICEF 2013) provide strong evidence of the poor
geographic targeting of public resources in health and basic environmental infrastructure
in Bangladesh. While these findings are not linked directly to climate change, they
suggest that locations with high disease risk are particularly lacking in access to health
and basic environmental services that are essential in reducing health risk. However, the
findings are only applicable at the aggregate level (districts) because data are lacking at a
more disaggregate level in rural areas and in urban slum and non-slum areas. These
findings point to the need for better targeting of resources in the future, given the
increasing risk of climate change and disease incidence.
The sampling design of nationally representative surveys such as DHS and expenditure
surveys has not been updated to capture adequately the fast-growing urban slum
population, one of the most important features of population dynamics in Bangladesh.
Indicators constructed from these national surveys should be treated with caution. Given
the inadequate sampling of the urban slum population, spatial analysis based on existing
national surveys may provide misleading information, in particular, for the spatial
targeting of programs or projects to improve access of the population to basic services
and disease control.
26
The recent Multiple Indicator Cluster Survey conducted in 2009 shows huge geographic disparities in
health outcomes in Bangladesh, with the under-five mortality rate, one of the important measures of
population health, ranging from 102 deaths per 1,000 births in the district of Sherpur to only 43 per 1,000
in Pabna.

60
The issue of inadequate water and sanitation in urban areas is urgent and needs to be
addressed. As the total population of Bangladesh is projected to increase by 64.6 million
to about 217.9 million people between 2010 and 2030, with three-fourths of that growth
occurring in urban areas, the health implications of these population dynamics and the
rapid population growth in urban slums should be rigorously assessed. Policy makers
need to recognize the full scale of the health threat posed by rapid but poorly planned
urbanization in Bangladesh. The threat will continue to worsen if climate change is
overlaid on these existing capacity constraints. It is therefore important for the
Government of Bangladesh to act quickly on the issue of inadequate safe water and
sanitation services, particularly in slums where the urban population has been growing
the fastest.
61
Chapter 5: Cost-Effectiveness Analysis of
Health Adaptation Interventions
Over the past few decades, Bangladesh has invested extensively in health and education, basic
infrastructure, and risk and disaster reduction measures, such as early warning systems and
construction of embankment and shelters. These policy interventions have strengthened the
country’s overall adaptation capacity and resilience to climate risks, contributing to the
improvement in development outcomes, especially health outcomes from the reduction in
premature deaths. With the support of multilateral and bilateral development partners, the newly
established Bangladesh Climate Change Resilience Fund (BCCRF), with about US$188 million,
has been earmarked to finance adaptation projects and programs to mitigate climate risk. It
provides critical financial assistance to the Government of Bangladesh to scale up current
investments and strengthen its capacity to address the increased climate risk in the coming
decades. The fundamental policy challenge, for both decision makers in the government and
development partners administering the BCCRF, is how to maximize the cost-effectiveness of
resources in a fiscally constrained environment.
Cost-effectiveness analysis (CEA) and cost-benefit analysis (CBA) are useful tools for
identifying adaptation interventions (programs and projects), guiding decisions about where
public resources should be prioritized to maximize development outcomes. In reality, however,
these tools are rarely used, which is evident at all levels of policy making. For example,
according to some estimates, bilateral and multilateral development partners currently allocate 98
percent of their disaster management funds for relief and reconstruction and only 2 percent for
investment in an early warning system and risk reduction measures (Mechler 2005. This is
clearly not a cost-effective solution. The review of four decades of World Bank project appraisal
documents by the World Bank’s Independent Evaluation Group (IEG 2010) concludes that the
application of CBA in project appraisal often lacks consistency and objectivity, varies greatly in
quality and rigor, and often fails to use the existing data sources and results from impact
evaluation studies that are widely available in the published literature for individual countries
where projects are taking place.
In Bangladesh, despite extensive public investment over the past several decades, little is known
about the cost-effectiveness of different interventions. This is particularly true in the area of
health due to the scarcity of impact evaluation studies and cost data. For example, no conclusive
impact studies have examined the two large-scale national nutrition projects—the Bangladesh
Integrated Nutrition Project (BINP) and the National Nutrition Project (NNP)—despite the
significant amount of resources committed to the two projects (see Hossain et al. 2002; White
2006).27
This chapter illustrates the use of CEA for evaluating health adaptation interventions using a
variety of data sources available in Bangladesh. The first section explains why CEA is preferred
27
The BINP was carried out between 1996 and 2002, with funding of US$59.8 million, and the NNP was
implemented between 2002 and 2011, with funding of US$124.42 million.

62
to CBA in the context of health adaptation options. The second illustrates how CEA can be
applied to rank investment in three key areas central to averting premature deaths, including
investment in an early warning system and risk management measures, in improving access to
safe drinking water, sanitation services, and electricity, and in nutrition-focused interventions.
5.1 Why Cost-Effectiveness Analysis Rather Than Cost-Benefit Analysis?
A large body of literature has been developed to guide practitioners on how to conduct CEA and
CBA in different contexts (Levin and McEwan 2001; U.S. Department of Health and Human
Services 1996; U.K. Government 2011). CEA calculates the costs of a program in relation to its
targeted outcomes (often a single outcome such as children’s school enrollment rate or
malnutrition rate). In CEA, the ratio of quantifiable outcome or impact of a program or project to
a given cost associated with its implementation (or the inverse ratio measuring the amount of
cost required to achieve a given impact, referred to as the cost-effectiveness ratio) is calculated to
compare cost-effectiveness across alternative programs.
CBA takes this process one step further by comparing costs with total program benefits rather
than just the single outcome that is central to the program. For example, many nutrition-focused
programs generate multiple benefits, including child health, school attendance, and future
earnings. In CEA, only the nutrition benefit is quantified, but in CBA all benefits (nutrition,
schooling, and future earnings) are estimated. In CBA, the net benefit is calculated as total
benefits minus total costs, discounted back to the present value in the base year of the program
when the costs and impact last over many periods. CBA is most useful when policy analysts are
studying a single program or policy to determine whether its total benefits to society exceed the
costs or when comparing alternative programs in order to identify the one that is achieving the
greatest net benefit to society. Decision makers in line ministries, such as health and education,
often consider this question.
As a practical tool for guiding decision makers on where to target limited resources for achieving
a specific outcome cost-effectively, CEA is generally preferred to CBA in two situations. First,
CEA is most useful when policy makers have identified a policy target (for example, reducing
the incidence of childhood disease) and want to determine which alternative program or project
will achieve the greatest outcome for the given budget. In contrast, the question posed in CBA is
broader and may not be of immediate concern to policy makers in line ministries, whose primary
objectives are to improve specific outcomes of the population, such as health, education, or
employment.
Second, CEA is a better option in cases where the central outcomes or targets are either
intangible or otherwise difficult to monetize. For example, placing a monetary value on health,
including mobility and mortality, is particularly controversial and subject to large uncertainties.
The commonly adopted measure of population health—disability-adjusted life years (DALY)—
combines in one measure the time lived with disability and the time lost due to premature
mortality. The calculation of DALY imposes several subjective assumptions, including societal
preferences for giving different weights to the health of people of different ages and to
disabilities. The monetary value per DALY is far from agreed on among policy analysts. In this
context, CEA is less restrictive, allowing users to apply their own judgment to quantify the

63
health benefits or to avoid placing a monetary value simply by using the number of averted
premature deaths as a measure of program impact. For a good review on the choice of CEA and
CBA and the applications of CEA, see Dhaliwal et al. (2012) .
In the context of health adaption interventions in Bangladesh, all three key areas of policy
interventions (investment in early warning system and risk reduction measures, improved access
to safe drinking water and sanitation services, and nutrition-focused programs) have one central
objective in common: averting premature deaths. Therefore, CEA is preferred to CBA.
5.2 An Application of Cost-Effectiveness Analysis in Health Adaptation Interventions
It is often said that development is the best form of adaptation. This means, while the risk of
climate change adds additional challenges to development, policy interventions in traditional
areas, such as access to basic services (health care, safe drinking water, and sanitary toilet
facilities), female education, and child nutrition, will continue to be important in improving
development outcomes, including health. In addition, investment in early warning systems and
risk management will enhance the population’s resilience to climate shocks, generating
substantial benefits measured by a reduction in economic losses, mortality, and disease outbreaks
from natural disasters.
This section presents a simplified CEA to compare three interventions with the central objective
of reducing premature deaths: (1) achievement of universal household access to safe drinking
water, sanitation, and electricity; (2) elimination of stunting through targeted nutrition and health
programs; and (3) investment in early warning and risk management capacity.28
Benefit estimation
The major difficulty with CEA or CBA is that it is challenging to identify as well as place
monetary values on all benefits and costs associated with a program or project. The benefit of
policy interventions, in the context of health adaptation, should be measured as the change in
health outcomes by comparing the scenarios with and without interventions (that is, the
counterfactual), controlling for all confounding factors. Many complementary methods, such as
randomization experiments and regression-based methods, have been developed to estimate the
benefit of various policy interventions with the choice of methods, depending on data availability
(for a review of methods, see Gertler et al. 2010).
28
These policy targets include (1) universal access to safe drinking water (that is, tube well in rural areas
and piped water in urban areas), sanitary toilet facilities, and electricity; (2) female attainment of a
secondary education; and (3) elimination of child stunting. They are set in reference to the current level of
access to basic services, female education, and child malnutrition estimated from the 2011 DHS and the
Millennium Development Goal targets set for 2015 (see appendix 5A, box 5.1).

64
In the following CEA analysis, the number of deaths avoided is used as the measure of health
benefit from the three interventions. The methods used to quantify the health benefits are
summarized in table 5.1.
Table 5.1 Summary of Methods for Quantifying Benefits
Intervention Method Outcome indicator
Reaching 100% household access
to safer water, sanitation, and
electricity in 2011
The marginal impact of access to water,
sanitation, and electricity on the incidence
of childhood illness is estimated using
regression method.
Child deaths averted are estimated using
simulation based on the estimated
marginal impact and the WHO estimate of
25% of child deaths from illnesses.
Child deaths averted (under 14
years of age)
Eliminating stunting by 2011 Based on estimates from existing studies;
about 35–55 percent of deaths among
children under five are estimated to be
caused by malnutrition (Pelletier et al.
1995; Black et al. 2008; Hossain and
Bhuyan 2009)
Child deaths averted (under 15
years of age)
Investing in early warning and risk
reduction systems
Control and treatment method Deaths averted (all ages)
The estimated health benefit from the first option—achieving 100 percent household access to
safe water, sanitation, and electricity—is about 133,000 child deaths averted in 2011 using the
World Health Organization (WHO) estimate of 25 percent of deaths caused by childhood
illnesses and 2011 population data. The health benefit from the second option—nutrition
programs that eliminate stunting—is taken from the policy simulation carried out by USAID and
FANTA (2012), which shows that about 160,000 child deaths could be averted through the
reduction of stunting in 2011.
The benefit of investing in early warning and risk reduction systems is measured as the number
of deaths avoided using mortality data from past major natural disasters in Bangladesh, focusing
on cyclones. Table 5.2 summarizes the major cyclones crossing the Bangladesh coast from 1970
to 2009.
Table 5.2 Major Cyclones, 1970–2009
Landfall date Landfall location
Wind speed
(kilometers
per hour)
Storm surge
(meters)
Human
casualties
(number)
November 12, 1970 Bhola, Meghna, Estuary 224 10 300,000
April 29, 1991 Noakhali Chittagong 235 7.6 133,882
November 15, 2007 Sundarban, Borguna 250 6–8 2,388
November 15, 2007 Burma 240 6–8 138,366
Sources: EMDAT.
The 1970 and 1991 cyclones were similar in severity, as measured by wind speed and storm
surge, and so were the 2007 cyclones that hit Bangladesh and Burma. Therefore, the reduced

65
death tolls from these cyclones can be used to measure the avoided deaths as a result of
investments in an early warning system and other disaster risk management measures or the
benefit of these interventions. The reduced deaths are about 170,000 by comparing the 1970 and
1991 cyclones and 136,000 by comparing the 2007 cyclones in Bangladesh and Burma. The
health benefit—averted mortality—can be attributed largely to investment in an early warning
system and other risk mitigation measures, although overall development (such as better housing
and roads) also played an important role, suggesting that these numbers are likely the upper-
bound estimation of benefits from investing in an early warning system.
Cost estimation
Quantifying the cost of a program (or policy intervention), covering both investment costs (for
example, construction of water pipes) and recurrent costs (like maintenance and management)
can also be challenging. First, program costs depend on a wide range of local factors, in
particular, local implementation capacity; therefore, cost data are context specific and not easily
transferable if no cost data are collected. Second, in most cases, incremental cost, rather than unit
cost, should be used to measure program costs, which is not easily constructed. For example, the
incremental cost of expanding household access to piped, safe drinking water can be quite low in
areas where the system of underground water supply has been built compared with locations
without a source of water. The same applies to costing the investment in early warning and risk
management systems. A review of the literature shows that very few program impact studies in
developing countries report comprehensive cost estimates (Dhaliwal et al. 2012).
In Bangladesh, despite extensive investments in water supply and sanitation and child nutrition
programs, the cost data on these projects are hard to come by. Data on operation and
maintenance costs, on institutional overhead costs, and on the costs of community-driven health
programs, are especially scarce. However, the recent study by USAID and FANTA (2012)
provides a good example for estimating the costs of implementing a comprehensive national
program for nutrition in Bangladesh for the period of 2011–21.29
In the following, the cost estimation of a national nutrition program is taken from the FANTA
study. It estimates that the cost of providing effective nutrition services covering the entire
territory of Bangladesh is in the range US$130 million–$170 million per year (which is relatively
small compared with the annual health sector budget).
The cost estimation of the disaster risk mitigation investment shows that, since 1971, the
Government of Bangladesh, with support from international development agencies, has invested
more than US$10 billion to make the country more resilient to climate change, covering many
areas such as risk and natural disaster management, transportation, and agriculture. This is
equivalent to an annualized cost in the range US$120 million–US$200 million. However, it is
not possible to disaggregate the total cost of investment to obtain the cost of investment in risk
29
The FANTA estimation exercise covers five procedures: (1) identifying an appropriate structure for the
program, (2) selecting the necessary interventions and activities, (3) determining a management structure
and a method of service provision, (4) identifying the inputs and obtaining the unit costs of each activity
and input, and (5) estimating the program costs for duration of the project.

66
and natural disaster management for the CEA or the annual incremental cost of investment in
risk mitigation for the CEA.
The cost data for the three interventions of interest here are summarized in box 5.2.
Box 5.2 Cost of Adaption Options
Early warning system. More than US$10 billion has been invested in reducing disasters
and risks in Bangladesh over the past 50 years. These investments include infrastructure
(polders, cyclone shelters, and cyclone-resistant housing) and early warning systems.
These investments have significantly reduced the damages and losses from extreme
weather events, in particular, the number of deaths and injuries avoided. The average
annual cost is assumed to be in the range US$120 million–US$200 million.
Nutrition. The FANTA study estimates that the cost of providing effective nutrition services
covering all of Bangladesh are in the range US$130 million–US$170 million per year. This is
relatively small compared with the annual health sector budget, and it is achievable.
Safe water and sanitation investment. A water sanitation project report for Bangladesh (World
Bank 2005) estimates that the cost of constructing a water point and connecting 500 people to a
location is about US$25 per household, for sanitation, it is US$45 per household.
Cost-effectiveness analysis: An illustration
The benefit-cost ratio estimated using FANTA’s benefit and cost estimation is presented in the
last column of table 5.3. The results show that nutrition programs are highly cost-effective in
preventing premature deaths in Bangladesh (more than 600 deaths of children under 14 averted
per US$1 million), compared with the other two options. Carrera et al. (2012) carried out a CEA
using data from 14 countries on the impact of national health programs on the number of under-
five deaths averted. Their results show that about 81 deaths in children under five can be averted
by investing US$1 million in national health programs such as early and exclusive breastfeeding,
complementary infant feeding, and improved water, sanitation, and hygiene practices. However,
these estimates should be interpreted with caution due to uncertainties about some of the model
parameters and baseline data.
The result from the CEA should also be treated with caution due to data weakness, and the
results should be used mainly for illustration purposes. Drawing policy conclusions regarding the
cost-effectiveness of different interventions requires further efforts to collect data on costs, more
rigorous impact evaluation studies using a variety of data sources and validation of data, and
impact studies using complementary approaches.
Over the past few years, a significant amount of resources have been channeled to improving
malnutrition in Bangladesh. Unfortunately, little evidence has been generated from properly
designed impact evaluation studies in this area (see box 5.3). Existing studies show a limited
impact of nutrition-based programs. It is plausible that nutrition programs can have a much

67
larger impact in reducing malnutrition and disease prevalence when combined with sanitation
projects and a hygiene education campaign targeted at mothers. This is obvious based on the
well-established medical evidence of the two-way causal effect of disease incidence and
malnutrition among young children and the important health determinants of access to safe
water, sanitary toilet facilities, and electricity. Impact evaluation studies on whether integrated
programs in health adaptation interventions—such as nutrition, water and sanitation, and hygiene
education targeted to the caretakers of children—can effectively reduce child malnutrition as
well as disease incidence would provide valuable information needed to guide the design and
implementation of future health adaptation interventions.
Table 5.3 Cost-Benefit Analysis: Comparison of Three Adaptation Options
Benefit-cost ratio
Policy option
Annualized
cost
(US$ million)
Annualized benefit
(number of deaths
averted)
Number of
deaths averted
per US$1 million DALY per US$1
100% access of safer water
and sanitation 300–500 133,000 (under 14) 260-443 0.04-0.06
Elimination of stunting 130–170 160,000 (under 14) 627-820 0.07-0.09
Early warning and risk
management systems 120–200 14, 000 (all ages) 70-116 0.004-0.01
Note: The total number of households is 31,863,396 based on the 2011 census, which is used to estimate
the cost of achieving 100% access to safe water and sanitation. The number of deaths avoided from natural disasters
as a result of the early warning and risk management systems is calculated under the assumption of a return period
of 10 years (that is, a probability of 10 percent for every year). The annualized cost of eliminating stunting is
adjusted by a 50% increase from FANTA cost estimates. The DALY is estimated using a disability weight of 0.02
and life expectancy of 75.
Box 5.3 Two Major Nutrition Projects
The Bangladesh Integrated Nutrition Project, with funding of a US$59.8 million, was
implemented between 1996 and 2002, covering a population of 15.6 million in 59 thanas (a
locality with a population of approximately 200,000–450,000 people). The impact evaluation
study (Hossain, Duffield, and Taylor 2005) shows no evidence that the project achieved its
objectives of reducing child malnutrition, measured by the prevalence of underweight children
under the age of two.
The Bangladesh National Nutrition Project, with funding in the amount of US$124.42 million
(which is about 7.5 percent of annual aid received by the country), began in 2000, with the
objective of supporting the government’s 15-year vision to extend community nutrition services
to the entire country. Project impact studies found no conclusive evidence regarding the impact
of the project (White and Masset 2006).
Based on child nutritional status estimated from the 2000 and 2011 DHS, child nutrition
improved moderately: with the prevalence of underweight and stunting at the national level
reduced from 47 and 36 percent, respectively, in 2000 to 44 and 41 percent, respectively, in
2011. But how much the reductions at the national level can be attributable to the NNP remains
unknown.

68
The analysis presented here illustrates how various complementary approaches, including
regression-based impact analysis and policy simulation exercises, can be used to conduct cost-
benefit analysis to assess different health adaptation interventions. While the cost-benefit ratio
presented in this chapter should be taken with caution due to the weakness of data quantifying
both costs and benefits, the CEA exercise identifies an important information deficiency in
guiding policy makers seeking to target limited resources to maximize health outcomes.
The key data gaps include lack of cost data on projects and programs related to investment in
expanding household access to safe drinking water, sanitation, and electricity, separately for
urban and rural areas, investment in an early warning system, and risk management measures.
Also lacking are impact evaluation studies that use rigorous evaluation methods based on
appropriately collected data including both baseline and follow-up surveys.
5.3 Key Messages
Given the significant amount of public resources, such as the BCCRF, that have been
allocated to improving climate change adaptation and resilience in Bangladesh, CEA
should be used in policy making to guide the allocation and prioritization of resources.
This recommendation should apply both to key government units and to donor agencies.
The results of CEA should be widely disseminated among stakeholders as a means to
improve transparency as well as develop an evidence-based decision-making process for
selecting projects and programs and identifying new areas of policy interventions.
However, without concerted efforts both to collect reliable data on cost and impact of
different projects or programs and to implement CEA with rigor and consistency,
evidence-based policy making will remain simply an empty promise.

69
Chapter 6: Conclusions and Way Forward
Bangladesh is one of many countries already facing enormous challenges due to extreme events
such as droughts and land and coastal flooding. Added to these challenges are demographic and
socio-economic factors, such as rapid population growth and fast urbanization, poverty, poor
health conditions, water scarcity, and inadequate sanitary conditions. Climate change is,
therefore, an additional stressor that is expected to increase the burden of diseases, notably
through increased morbidity and mortality. Bangladesh is particularly vulnerable to outbreaks of
infectious, water-borne, and vector-borne diseases.
These risks and diseases are not new, and the health sector is already tackling them. However,
the capacity to cope with potentially increasing levels of risks and diseases arising from climate
change is still limited in Bangladesh. Furthermore, there is insufficient capacity for assessment,
research, and communication on climate-sensitive health risks, as well as insufficient capacity to
design and implement mitigation and adaptation programs.
Recognizing the importance of climate change in the broader health context, Bangladesh became
one of the first countries to establish a climate change cell in the Ministry of Health. The Climate
Change and Health Promotion Unit (CCHPU) has been established under the Ministry of Health
and Family Welfare. CCHPU’s objectives are (1) to coordinate all health promotional activities
of intra- and interministerial initiatives; (2) to increase awareness of the health consequences of
climate change; (3) to strengthen the capacity of health systems to provide protection from
climate-related risks through e-health and telemedicine; (4) to ensure that health concerns are
addressed in decisions to reduce risks from climate change in other key sectors; (5) to conduct
research and evaluate and monitor programs related to health promotion and climate change; and
(6) to coordinate emergency medical services and school health promotion to reduce health
hazards during disasters and emergencies.
6.1 Key Messages
Three key messages emerge from this study:
First, the health impacts of increased climate variability and extreme weather events are
projected to be significant by 2050, but well-targeted development investment can mitigate
all of the excess health burden attributable to climate change. A simple message is that
focusing resources in traditional areas of development, such as improving access of the
population to safe drinking, sanitation, electricity, female education, and child nutrition, as
well as strengthening the capacity to manage risk can be the best health adaptation option in
the face of increased climate risk.
Second, policy makers need to recognize the full scale of the health threat as a result of rapid
but poorly planned urbanization and act quickly on the issue of inadequate safe water and

70
sanitation services, particularly in urban slum areas with the fastest population growth. The
evidence of poor geographic targeting of past public investment in health and environmental
infrastructure highlights the need to develop a comprehensive spatial database—at a
disaggregate level such as in rural areas and slum and non-slum locations in urban areas—for
monitoring and improving spatial targeting.
Third, despite several decades of experience in programs and projects designed to improve
health in Bangladesh, evidence on the cost-effectiveness of different interventions is lacking.
Significant financial resources will be committed to climate change adaptation and resilience
from programs such as the BCCRF, and cost-effectiveness analysis should be conducted
routinely when allocating resources to programs and projects, both by government units and
by development partners.
The results of CEA should be widely disseminated among stakeholders as a means to improving
transparency as well as developing evidence-based decision making for selecting projects and
programs and identifying new areas of policy interventions. The political economy nature of the
decision-making process in Bangladesh should be fully recognized, but this is a subject beyond
the scope of this study. Without concerted efforts to collect reliable data on cost and impact of
different projects or programs and to implement CEA with rigor and consistency, evidence-based
policy making will remain simply an empty promise.
6.2 Way Forward
There is an urgent need in Bangladesh to incorporate health concerns into the decisions and
actions of sectors, as they plan to mitigate and adapt to climate change, so that these decisions
and actions enhance health. Measures to mitigate the adverse health impacts of climate change
need to be considered beyond the health sector: for example, integrating health sector, water and
sanitation, urban planning, a weather early warning system, and a disaster management system.
Resources should be spatially targeted to reach the most vulnerable locations that are likely to be
at high climate and health risk to ensure cost-effectiveness.
While the study attempts to use all possible data sources, future efforts should focus on
developing the institutional capacity within Bangladesh to develop and manage a database that
integrates GIS, health surveys, and a disease surveillance system with local climate information
and environmental facilities at the national level. Such capacity is needed to improve research in
the area of health and climate change. The research activities should be carried out as part of the
government’s efforts to develop climate adaptation policies to ensure evidence-based policy
making.
To meet these objectives, the CCHPU needs considerable strengthening, particularly in the
capacity to collect and analyze data, to conduct community outreach, to implement and evaluate
pilot projects to reduce climate health risks, and to mainstream health concerns across various
sectors. A stronger CCHPU could play a catalytic role in combating the health impacts of climate
change and protecting human health from current and projected risks due to climate change
through its analytical, advisory, and outreach services and in collaboration with other research

71
organizations like the International Center for Disease and Diarrhoeal Research, Bangladesh. At
the same time, climate change concerns need to be mainstreamed in the Health Nutrition and
Population Sector Program for Bangladesh.

72
Appendix A: Data Source for Water- and
Vector-Borne Diseases
Three main institutions in Bangladesh are directly involved in collecting health information
including data for water- and vector-borne diseases: (1) Directorate General of Health Services
(DGHS) under the Ministry of Health and Family Welfare (MoHFW), (2) the Institute of
Epidemiology, Disease Control, and Research (IEDCR), and (3) the International Center for
Disease and Diarrhea Research in Bangladesh (ICDDR,B). The DGHS is responsible for the
Management Information System (MIS) of the health system, and the IEDCR collects
information on water- and vector-borne diseases by conducting disease surveillance,
investigating outbreaks, and training researchers. The ICDDR,B focuses on diarrheal disease and
vector-borne infection surveillance. In addition, the National Institute of Population Research
and Training (NIPORT) obtains limited data on water- and vector-borne diseases through
nationally representative Demographic and Health Surveys (DHSs) at regular intervals.
The MIS collects information from the regular information systems of different health programs
such as malaria, tuberculosis, Essential Service Delivery (ESD), Communicable Disease Control
(CDC). Hospitals provide the CDC with information related to water- and vector-borne
diseases.30
Table A.1 shows the status of data for water- and vector-borne diseases.
Table A.1 Health MIS: Diseases and Coverage
Key information Coverage (year, region) Name of organization and website
Pneumonia, no pneumonia (cough
and cold), diarrhea, fever (malaria),
fever (not malaria) among under-
five children
2002: 420 upazila in 50 districts and
communities in 15 upazilas
(monthly)
Integrated Management of
Childhood Illnesses (IMCI), (ESD),
DGHS (www.dghs.gov.bd)
Malaria burden, P. falciparum, P.
vivax, death 13 districts of eastern and northern
parts of the country Communicable Disease Control,
DGHS (www.dghs.gov.bd)
Kala-azar (visceral ieishmaniasis),
cases, deaths 1999: 100 upazilas; 2000: 26
districts Communicable Disease Control,
DGHS (www.dghs.gov.bd)
Dengue, cases, deaths 2000: reported from facilities and
individual doctors Communicable Disease Control,
DGHS (www.dghs.gov.bd)
Diarrhea (demographic, etiologic,
clinical, and therapeutic aspects of
patients)
2000: reported from facilities, whole
country Communicable Disease Control,
DGHS (www.dghs.gov.bd) and
ICDDR,B (www.icddrb.org)
The IEDCR collects information on water- and vector-borne diseases through its disease
surveillance system. Table A.2 shows the systems that are collecting information related to
water- and vector-borne disease through the IEDCR surveillance system, the Diarrheal Disease
30
Computers have been provided to all national and regional tertiary hospitals, 64 district health
managers, and many of the 464 subdistrict hospitals. These computers are connected through the Internet.
Hospital-based service data are still collected in formats compiled locally, with limited possibility of
disaggregation.

73
and Enteric Infection surveillance system, and the DHS.31
Priority communicable disease
surveillance (PCDS) and sentinel surveillance (SS) in selected areas obtain information on
various diseases, including water- and vector-borne diseases like diarrheal diseases (acute watery
diarrhea and bloody dysentery), malaria, and kala-azar.
Table A.2 Data Sources of Three Surveillance Systems
System and name of
organization Key information Coverage (years, regions)
IEDCR
Priority communicable
disease surveillance
(PCDS)
Diarrheal diseases (acute watery
diarrhea and bloody dysentery),
malaria, kala-azar
2007 onward; data collected weekly
from at least one upazila in each of
64 districts
Institutional disease
surveillance
Diarrheal diseases (acute watery
diarrhea and bloody dysentery),
malaria, kala-azar
Monthly disease profiles from the
medical college hospitals and
specialized institutions
Sentinel surveillance
(SS)
Diarrheal diseases (acute watery
diarrhea and bloody dysentery),
malaria, kala-azar
Information obtained from eight
selected upazilas of eight selected
districts; discontinued in 2009 and
merged with PCDS
Diarrheal Disease and
Enteric Infection
surveillance system
ICDDR,B
(www.icddrb.org)
Socio-economic, demographic,
housing, and environmental conditions,
feeding practices, use of drugs and fluid
therapy at home, clinical,
anthropometric measurements, and
treatments received at facilities
Dhaka hospital from 1979; Matab
hospital from 1999; extensive
microbiological assessments of
fecal samples (microscopy, culture,
and enzyme-linked immunosorbent
assay)
Demographic and
Health Survey
National Institute of
Population Research
and Training
(NIPORT),
(www.niport.gov.bd)
and ICF-MACRO
(www.measuredhs.com)
Diarrhea, fever, ARI, socio-
demographic characteristics
DHS 1993–94, 1996–97, 1999–
2000, 2004, 2007, 2011 (national
and divisional coverage)
31
Upazila health and family planning officers and civil surgeons are responsible for conducting
surveillance locally.

74
Appendix B: Climate and Natural Disaster
Data
Three key departments are responsible for collecting climate- and disaster-related data: the
Bangladesh Meteorological Department (BMD), under the Ministry of Defense; the Bangladesh
Water Development Board (BWDB); and the Disaster Management Information Network
(DMIN) portal within the Disaster Management Bureau (DMB).
Table B.1 Weather and Disaster Management Data System
Key information Coverage (years, regions) Data source
Rainfall surface data Daily up to 2002; three-hourly
from 2003
35 weather stations of BMD
(www.bmd.gov.bd)
Maximum and minimum temperature Three-hourly
Dew point temperature, relative
humidity, present and past weather,
cloud and height
Daily
Date and time of magnitude and
intensity of earthquake
At the time of occurrence
Voice data High-frequency wireless network,
67 stations
Water data from BWDB: Flood
Forecasting and Warning Centre
(www.ffwc.gov.bd)
Telemetry system satellite imagery 14 stations; GMS, NOAA-12 and
NOAA-14
Monitoring of cloud and depression
movements; estimation of
precipitation from cloud temperature
analysis; cyclone monitoring; flood
forecast modeling: one-dimensional
fully hydrodynamic model (MIKE 11
HD) incorporating all major rivers and
floodplains
Catchment area = 82,000 square
kilometers; total length of modeled
rivers = 7,270 kilometers ; number
of catchments = 216; number of
forecast stations = 30; flood maps
generated from model results via
GIS link to model (MIKE 11 GIS)
Real-time data management: GIS-
based map showing water level and
rainfall status (flood watch); display of
forecast water levels and discharges;
automatic generation of flood forecast
bulletins
Generation of flood status at
upazila level
Climate change database: natural and
geographic; physical and
infrastructure; hydrometrological data
(temperature, rainfall, sunshine,
humidity, evaporation, wind speed,
aerosol, water level, and sea surface
temperature)
Comprehensive Disaster
Management Programme (CDMP),
www.cdmp.org.bd

75
The BMD collects real-time meteorological information from 35 observatories. It also provides
routine weather forecasts for the public, farmers, mariners, and aviators and issues warnings for
severe weather phenomena such as tropical cyclones, tornados, and floods. It maintains a
network of surface and upper-air observatories, radar and satellite stations, agro-meteorological
observatories, geo-magnetic and seismological observatories, and a meteorological
telecommunication system.
The BWDB collects ground and surface water information and monitors floods and drought
situations. The Flood Forecasting and Warning Centre (FFWC) of the BWDB was established in
1972 and became a Division of the Processing and Flood Forecasting Circle of BWDB
Hydrology, which, in turn, is under the control of the chief engineer for hydrology. The FFWC is
working to develop flood forecast and inundation models, disseminate flood forecast
information, and issue warning messages.
The DMIN links 64 districts and 482 subdistrict offices (hardware and software support, Internet,
training in information and communication technology) through its DMIN portal with the DMB,
the BMD, the FFWC, and the Cyclone Preparedness Program (CPP). It plays an important role in
risk reduction by providing information on risks, mapping risk reduction activities, maintaining
information databases on disaster management capacity, and operating a national information
portal. Table B.1 summarizes the data collection from the three key departments.

76
Appendix C: National Health and Facility
Survey
Health Facility Survey
As shown in table C.1, the nationally representative random sample of public sector health
facilities at the district, upazila, and union levels has been selected for the 2011 Health Facility
Survey (HFS). Within each tier, especially for maternal and child health centers, subcategories
are district hospitals, maternal and child welfare centers, upazila health complexes, union health
and family welfare centers, union subcenters and rural dispensaries, and community clinics.
Table C.1 Number of Health Facilities Selected for the 2011 Health Facility Survey
Facility type Sample size Total a
District hospital 40 59
Maternal and child health center 50 97
Upazila health complex 80 414
Union health and family welfare center 532 3,806
Community clinic 758 9,722
Private facilities at district level 43 2,501
a. As reported by the Ministry of Health.
Urban Health Survey
The Government of Bangladesh and the U.S. Agency for International Development jointly
conducted the 2006 Urban Health Survey (2006 UHS) designed to obtain a broad health profile
of the urban population of Bangladesh. The 2006 UHS is a rich, micro-level survey of the health
of communities, households, and individuals throughout the city corporations and a sample of
district municipalities.
The 2006 UHS had three main objectives: (1) to obtain a profile of health problems and health
care–seeking behavior in urban areas of Bangladesh; (2) to identify vulnerable groups and
examine their health profile and health care–seeking behavior; and (3) to examine the individual,
household, and neighborhood factors associated with health outcomes and behaviors in urban
areas. The 2006 UHS was designed to expand the base of knowledge regarding population health
and health-related behavior in urban areas of Bangladesh, with a particular emphasis on
understanding vulnerability and environmental risk in urban settings.
The 2006 UHS was based on a multistage sampling scheme under which the primary sampling
units were crafted explicitly to reflect a meaningful notion of urban community or neighborhood.
The primary sampling units belonged to one of two types of community: slum and non-slum
areas of the city corporations. These units served as the basis for the basic statistical domains of
the study:
• Dhaka Metropolitan Area large slum areas (by population)
• Dhaka Metropolitan Area small and medium slum areas (by population)
• Dhaka Metropolitan Area non-slum areas

77
• Chittagong City Corporation slum areas
• Chittagong City Corporation non-slum areas
• Slum areas of the remaining city corporations (Khulna, Rajshahi, Barisal, and Sylhet)
• Non-slum areas of the remaining city corporations (Khulna, Rajshahi, Barisal, and
Sylhet)
• District municipalities.

78
Appendix D: Analytical Results
Table D.1 Logit Regression Results Using Full Sample (Odds Ratio) (Random-Effect Estimation)
Pre-monsoon season (2004 DHS)
Monsoon season (2007 DHS)
Variable Fever Diarrhea ARI Variable Fever Diarrhea ARI
L_rain_svy | 0.805* 1.392 0.764 L_rain_svy | 1.323 0.953 0.787
rain_heavy1sd_D | 1.815* 1.226 1.473 rain_heavy1sd_D | 0.676* 0.742 1.032
rain_light1sd_D | 0.967 1.278 0.896 rain_light1sd_D | 1.445 0.956 0.963
L_rain_svy_L | 0.837*** 1.035 0.879 L_rain_svy_L | 1.267* 1.246 1.023
rain_heavy1sd~L | 1.18 1.09 1.286 rain_heavy1sd~L | 0.724 0.561* 1.084
rain_light1sd~L |
rain_light1sd~L | 0.963 0.856 0.895
avetemp_svymth | 1.212*** 0.878 1.135* avetemp_svymth | 0.928 0.888 0.514*
hum_svymth | 1.041* 1.047 1.058* hum_svymth | 1.014 1.016 0.976
_Iregion_2 | 2.645 0.739 1.669 _Iregion_2 | 0.541 0.722 0.987
_Iregion_3 | 2.536 0.701 2.307 _Iregion_3 | 0.565 0.752 0.748
_Iregion_4 | 1.329 3.568 2.322 _Iregion_4 | 0.426** 0.627 0.675
_Iregion_5 | 3.353* 0.877 2.089 _Iregion_5 | 0.510* 0.453 0.691
_Iregion_6 | 3.424* 2.422 2.702 _Iregion_6 | 0.188*** 0.425 0.534
_Iarea_2 | 0.731* 0.72 0.741 _Iarea_2 | 0.922 0.852 1.102
_Iwealth_du_2 | 1.003 0.724 1.019 _Iwealth_du_2 | 1.08 0.878 0.917
_Iwealth_du_3 | 0.666** 0.510* 0.682* _Iwealth_du_3 | 1.096 1.062 0.867
_Iwealth_du_4 | 0.600** 0.424* 0.454*** _Iwealth_du_4 | 1.005 0.946 0.704
_Iwealth_du_5 | 0.547** 0.359* 0.493* _Iwealth_du_5 | 0.95 0.587 0.436**
_Iwater_2 | 0.771 0.230*** 0.756 _Iwater_2 | 1.105 0.490* 1.213
_Iwater_9 | 0.905 0.311* 0.939 _Iwater_9 | 0.912 0.422* 0.924
_Itoilet_21 | 1.398 1.107 1.71 _Itoilet_22 | 1.093 0.754 1.003
_Itoilet_22 | 1.219 0.974 1.589 _Itoilet_23 | 1.016 0.607* 0.947
_Itoilet_23 | 1.302 1.345 1.777* _Itoilet_99 | 0.997 0.905 0.899
_Itoilet_99 | 1.412 1.48 1.828* _Iwom_edu_1 | 1.134 1.145 1.015
_Ielect_1 | 1.076 1.4 1.334 _Iwom_edu_2 | 1.141 0.962 0.877
_ITV_1 | 1.316* 0.662 0.914 _Iwom_edu_3 | 0.901 0.367** 0.664
_Ireligion_2 | 0.721 1.415 0.574* _Ibord_new_2 | 0.927 0.892 1.011
_Ireligion_99 | 0.703 1.293 0.549 _Ibord_new_3 | 1.021 0.856 0.981
_Isex_head_2 | 1.014 0.728 0.866 _Ibord_new_99 | 1.065 1.021 0.97
_Iwom_edu_1 | 1.233* 1.273 1.394* age_chd | 0.883 1.164 0.824
_Iwom_edu_2 | 1.291* 1.117 1.429* age_chdsq | 0.991 0.921* 0.991
_Iwom_edu_3 | 1.094 1.141 1.092 _cons | 0.22 2.472 1.71e+09*
_Ibord_new_2 | 0.998 1.162 1.07
_Ibord_new_3 | 1.122 0.892 1.345
_Ibord_new_99 | 1.158 1.004 1.12
age_chd | 1.045 1.039 0.781*
age_chdsq | 0.946* 0.926 1
_cons | 0.001*** 0.085 0.000**
_cons | 0.044*** 0.288* 0.166*** _cons | 0.132*** 0.224*** 0.110***
*** p<0.001; ** p<0.01; * p<0.05.

79
Table D.2 Logit Regression Results Using Urban Households (Odds Ratio) (Random-Effect Estimation)
Pre-monsoon season (2004 UHS)
Monsoon season (2007
DHS )
Variable Fever Diarrhea ARI Variable Fever ARI
rain_heavy1sd_D | 1.292 0.965 1.838 L_rain_svy | 1.225 1.915*
rain_light1sd_D | 1.224 0.897 1.069 rain_heavy1sd_D | 0.747 0.354**
avetemp_svymth | 1.086*** 1.008 0.996 rain_light1sd_D | 1.503 1.599
hum_svymth | 1.023 1.015 0.986 avetemp_svymth | 0.842* 0.752**
_Iwater_urb_2 | 1.072 0.525 1.165 hum_svymth | 1.001 1.038
_Itoilet_ur_21 | 1.34 0.807 1.933** _Iwater_urb_2 | 1.274 0.98
_Itoilet_ur_22 | 1.241 0.76 1.924* _Iwater_urb_3 | 2.362 1.152
_Itoilet_ur_23 | 1.202 1.15 1.859* _Itoilet_ur_2 | 1.835*** 1.4
_Itoilet_ur_99 | 1.251 0.771 2.943** _Itoilet_ur_22 | 1.875** 1.479
_Iregion_2 | 0.803 0.269** 1.169 _Itoilet_ur_23 | 1.278 0.889
_Iregion_3 | 1.026 0.428* 0.747 _Itoilet_ur_99 | 1.684* 1.479
_Iregion_4 | 0.741 0.391* 0.763 _Iregion_2 | 0.699 0.526
_Iregion_5 | 1.178 0.477* 0.711 _Iregion_3 | 1.203 0.452
_Iregion_6 | 1.676 0.516 0.885 _Iregion_4 | 0.981 0.337*
_Iwealth_du_2 | 1.082 1.361 0.975 _Iregion_5 | 1.16 0.298*
_Iwealth_du_3 | 0.929 0.829 0.846 _Iregion_6 | 0.686 0.281
_Iwealth_du_4 | 1.013 1.097 0.796 _Iwealth_du_2 | 0.773 0.65
_Iwealth_du_5 | 1.089 0.552 0.833 _Iwealth_du_3 | 0.751 0.592
_Ielect_1 | 0.778 0.917 1.029 _Iwealth_du_4 | 0.945 0.988
_ITV_1 | 1.01 0.631 0.967 _Iwealth_du_5 | 0.976 0.587
_Ireligion_2 | 0.674 1.425 0.861 _Ielect_1 | 1.684* 1.479
_Ireligion_99 | 2.038 0 5.147 _Ielect_7 | 0.741 1.149
_Isex_head_2 | 1.017 1.357 0.814 _ITV_1 | 0.251 0.595
_Iwom_edu_1 | 1.112 1.033 1.058 _ITV_9 | 0.999 1.00E+00
_Iwom_edu_2 | 1.084 0.895 1.036 _Ireligion_2 | 2.14E+09 0
_Iwom_edu_3 | 0.975 0.986 0.898 _Ireligion_99 | 0.675 0.789
_Ibord_new_2 | 0.89 1.379 0.71 _Isex_head_2 | 1.426 0
_Ibord_new_3 | 1.153 0.597 1.37 _Iwom_edu_1 | 1.256 0.966
_Ibord_new_99 | 1.149 0.878 1.047 _Iwom_edu_2 | 1.517* 0.661
age_chd | 0.951 0.83 0.701* _Iwom_edu_3 | 1.311 0.552*
age_chdsq | 0.964 0.994 1.023 _Ibord_new_2 | 1.148 0.478*
_cons | 0.018** 0.175 0.803 _Ibord_new_3 | 1.017 1.114
_Ibord_new_99 | 1.023 1.108
age_chd | 1.222 1.01
age_chdsq | 1.053 1.14
_cons | 0.953 0.926
16.597 2.439
lnsig2u |
lnsig2u |
_cons | 0.084*** 0 0.062** _cons | 0.134*** 0
*** p<0.001; ** p<0.01; *p<0.05.

80
Table D.3 Logit Regression Results Using Rural Households (Odds Ratio) (Random-Effect Estimation)
Pre-monsoon season (2004 DHS)
Monsoon season (2007 DHS )
Variable Fever Diarrhea ARI Variable Fever Diarrhea ARI
L_rain_svy | 1.052 1.141 1.017
rain_heavy1sd_D | 1.494** 1.539 1.232 rain_heavy1sd_D | 0.769 0.641 1.323
rain_light1sd_D | 1.028 0.843 1.049 rain_light1sd_D | 1.079 1.151 1.398
avetemp_svymth | 1.059*** 0.97 1.021 avetemp_svymth | 0.806*** 0.916 0.835**
hum_svymth | 1.008 1.027 1.023 hum_svymth | 1.018 1.026 1.011
_Iwater_rur_2 | 1.058 0.862 1.435 _Iwater_rur_2 | 0.828 0.925 1.139
_Itoilet_ru_22 | 1.011 0.882 0.774 _Itoilet_ru_22 | 0.796 0.793 0.629*
_Itoilet_ru_23 | 1.159 1.179 0.902 _Itoilet_ru_23 | 0.801 0.688 0.768
_Itoilet_ru_99 | 1.09 1.241 0.761 _Itoilet_ru_99 | 0.78 1.024 0.679
_Iregion_2 | 0.956 1.173 0.738 _Iregion_2 | 0.741 0.962 1.24
_Iregion_3 | 0.657** 0.773 0.570** _Iregion_3 | 0.906 0.922 0.691
_Iregion_4 | 0.672* 1.561 0.76 _Iregion_4 | 0.722 0.9 0.649
_Iregion_5 | 0.872 0.991 0.552** _Iregion_5 | 0.876 0.655 0.768
_Iregion_6 | 0.948 1.02 0.679 _Iregion_6 | 0.490* 0.826 0.912
_Iwealth_du_2 | 0.984 0.777 1.054 _Iwealth_du_2 | 1.122 0.921 0.933
_Iwealth_du_3 | 0.811* 0.79 0.852 _Iwealth_du_3 | 1.096 1.133 0.733
_Iwealth_du_4 | 0.734* 0.909 0.625** _Iwealth_du_4 | 1.043 1.007 0.557**
_Iwealth_du_5 | 0.692* 0.713 0.531** _Iwealth_du_5 | 0.925 0.636 0.406**
_Ielect_1 | 1.183 1.368 1.182 _Ielect_1 | 0.866 1.486* 0.801
_ITV_1 | 1.076 0.470** 0.94 _Ielect_7 | 1.017 0.603 0.702
_Ireligion_2 | 0.703* 1.006 0.703 _ITV_1 | 1.11 0.629* 1.207
_Ireligion_99 | 0.532 1.889 0.401 _Ireligion_2 | 0.638** 0.621 0.841
_Isex_head_2 | 0.942 0.708 0.934 _Ireligion_96 | 0 0 0
_Iwom_edu_1 | 1.058 1.226 1.094 _Ireligion_99 | 0.457 1.459 0
_Iwom_edu_2 | 1.073 1.021 1.009 _Isex_head_2 | 1.14 0.936 1.035
_Iwom_edu_3 | 0.823 0.679 0.522* _Iwom_edu_1 | 0.981 1.139 1.095
_Ibord_new_2 | 1.09 1.389 0.968 _Iwom_edu_2 | 1.063 1.133 0.984
_Ibord_new_3 | 0.952 1.399 0.864 _Iwom_edu_3 | 0.839 0.866 0.648
_Ibord_new_99 | 0.973 1.316 0.827 _Ibord_new_2 | 1.033 0.967 1.023
age_chd | 1.036 1.164 0.788* _Ibord_new_3 | 1.136 0.86 1.093
age_chdsq | 0.950** 0.905** 1.007 _Ibord_new_99 | 1.141 1.087 1.071
_cons | 0.133* 0.020** 0.080* age_chd | 0.827* 1.229 0.765*
age_chdsq | 1.002 0.917* 1.006
_cons | 112.136** 0.112 26.867
_cons | 0.113*** 0.156*** 0.241*** _cons | 0.153*** 0.217*** 0.088***
*** p<0.001; ** p<0.01; *p<0.05.

81
Table D.4 Estimation of Marginal Impact on the Incidence of Childhood Illness and Malnutrition (Odds Ratio), 2011 DHS
Rural sample Urban sample
Variable Illnesses WFH<2sd HFA<2sd Variable Illnesses WFH<2sd HFA<2sd
Monsoon season 1.1 1.2 0.9 Monsoon season 1.07 1.13 0.70*
Water source (reference:
tube well)
Water source (reference:
piped water)
Piped water 1.13 0.61 0.55 Tube well 1.34* 0.63* 1.09
No water 1.35 1.47 1 No water 1.25 0.94 1.58
Sanitation (reference:
improved latrine)
Sanitation (reference:
flush latrine)
Pit latrine 1.16 1.16 1.40** Improved latrine 1.09 1 1.09
Open latrine 1.08 1.08 1.67*** Pit latrine 0.97 1.31 1.42*
No latrine 1.06 1.15 2.00*** Open latrine 1.34 1.29 1.4
Flush 1.17 1.12 0.89 No latrine 0.81 0.65 1.42
Has electricity 0.95 0.89 0.83* Has electricity 0.77 0.78 0.58**
Mother’s education
(reference: secondary and
above)
Mother’s education
(reference: secondary
and above)
Primary education 1.20* 1.14 1.41*** Primary education 1.19 1.3 1.57***
No education 0.97 1.19 1.67*** No education 1.11 1.26 2.07***
Stunted 1.20** 1.40*** Stunted 1.19 1.39*
Sex_head = female 1.24* 0.97 1.04 Sex_head = 2 1.31 0.91 0.93
Child age 0.80*** 1.06* 1.18*** Child age 0.87*** 1.07 1.15***
Constant 0.93 0.10*** 0.22*** Constant 0.76 0.14*** 0.28***
Number of observations 5,200 5,200 5,200 Number of observations 2,135 2,135 2,135
Note: WFH = weight for height; HFA = height for age; sd = standard deviation.
*** p<0.001; ** p<0.01; * p<0.05.
Four types of health adaptation interventions are found to have a statistically significant health
impact: household sanitation facilities, access to electricity, nutritional status, and mother’s
education. The findings in Bangladesh are broadly consistent with evidence compiled from many
low-income countries by the World Health Organization (WHO 2011) showing consistently that
children’s health status (disease incidence and nutrition status) is influenced by a range of
household factors, such as living conditions with access to safe water and sanitary toilet
facilities, the availability of diverse and nutrient-rich food, and maternal and child-care practices
(hygiene practices).
The magnitude of the net impact of these four policy variables is summarized as follows:
Sanitation. Upgrading household’s sanitation facilities has a large impact on reducing
the incidence of chronic malnutrition (stunting). In urban areas, holding all other
conditions constant, a single intervention—upgrading to a flush latrine or a septic sink
from a pit latrine—reduces the incidence of stunting by 42 percent. The health impact is
even bigger in rural areas: upgrading to an improved latrine from a pit, an open, or no
latrine, on average, reduces the incidence of stunting by 40, 67, and 100 percent,
respectively.

82
Electricity. Access to household electricity reduces the incidence of stunting.32
A child
living in a household with electricity is 20 percent less likely to be stunted in rural areas
and 40 percent less likely in urban areas, everything else being the same. This finding
may be linked to food storage. Unsafe food storage due to a shortage of electricity has
been identified as a serious health risk in many parts of Bangladesh due to the long period
of heat and humidity in the summer season.
Nutrition. Children’s nutritional status is an important determinant of childhood
illnesses. Children who are stunted are 20 percent more likely to suffer from illness
(diarrhea, ARI, or fever) and 40 percent more likely to be underweight, holding other
factors constant. The estimated impact of stunting is similar among the urban and rural
populations. This finding indicates that significant health benefits can be generated by
investing in nutrition-focused programs.
Mother’s education. As expected, improving mothers’ education has a large impact on
reducing incidence of disease and prevalence of malnutrition. The results show that a
child living in a household with an uneducated mother is twice as likely to be stunted in
urban areas and 30 percent more likely to be stunted in rural areas than a child living in a
household with a mother with a secondary education, all factors being the same.
Similarly, a child living with a mother with primary education only is about 20 percent
more likely to get sick than a child cared for by a mother with secondary education.
32
The health benefits of household access to electricity are much less discussed in policy, although some
important evidence exists on the impact of access to electricity on reducing child mortality based on
cross-country analysis of DHS data (Wang 2003).

83
Table D.5 District-Level Change in Population, 2001–2010
Population
Zila 2001 2011 Growth rate (%)
Gazipur 2,031,891 3,403,912 6.75
Dhaka 8,511,228 12,043,977 4.15
Narayanganj 2,173,948 2,948,217 3.56
Sylhet 2,555,566 3,434,188 3.44
Bandarban 298,120 388,335 3.03
Cox’s Bazar 1,773,709 2,289,990 2.91
Sunamganj 2,013,738 2,467,968 2.26
Noakhali 2,577,244 3,108,083 2.06
Moulvibazar 1,612,374 1,919,062 1.90
Habiganj 1,757,665 2,089,001 1.89
Brahmanbaria 2,398,254 2,840,498 1.84
Panchagar 836,196 987,644 1.81
Narsingdi 1,895,984 2,224,944 1.74
Rangamati 508,182 595,979 1.73
Comilla 4,595,557 5,387,288 1.72
Khagrachhari 525,664 613,917 1.68
Nilphamari 1,571,690 1,834,231 1.67
Laksmipur 1,489,901 1,729,188 1.61
Pabna 2,176,270 2,523,179 1.59
Feni 1,240,384 1,437,371 1.59
Chapai Nawabganj 1,425,322 1,647,521 1.56
Kurigram 1,792,073 2,069,273 1.55
Chittagong 6,612,140 7,616,352 1.52
Sirajganj 2,693,814 3,097,489 1.50
Thakurgaon 1,214,376 1,390,042 1.45
Mymensingh 4,489,726 5,110,272 1.38
Rajshahi 2,286,874 2,595,197 1.35
Rangpur 2,542,441 2,881,086 1.33
Lalmonirhat 1,109,343 1,256,099 1.32
Dinajpur 2,642,850 2,990,128 1.31
Bogra 3,013,056 3,400,874 1.29
Kishoreganj 2,594,954 2,911,907 1.22
Nator 1,521,336 1,706,673 1.22
Netrokona 1,988,188 2,229,642 1.21
Jhenaidah 1,579,490 1,771,304 1.21
Chuadanga 1,007,130 1,129,015 1.21
Kushtia 1,740,155 1,946,838 1.19
Jessore 2,471,554 276,4547 1.19
Munshiganj 1,293,972 1,445,660 1.17
Magura 824,311 918,419 1.14
Gaibandha 2,138,181 2,379,255 1.13
Meherpur 591,436 655,392 1.08
Rajbari 951,906 1,049,778 1.03
Tangail 3,290,696 3,605,083 0.96
Faridpur 1,756,470 1,912,969 0.89
Jamalpur 2,107,209 2,292,674 0.88
Naogaon 2,391,355 2,600,157 0.87
Manikganj 1,285,080 1,392,867 0.84
Jaipurhat 846,696 913,768 0.79
Shariyatpur 1,082,300 1,155,824 0.68
Satkhira 1,864,704 1,985,959 0.65
Chandpur 2,271,229 2,416,018 0.64
Sherpur 1,279,542 1,358,325 0.62
Borguna 848,554 892,781 0.52
Patuakhali 1,460,781 1,535,854 0.51

84
Bhola 1,703,117 1,776,795 0.43
Narail 698,447 721,668 0.33
Madaripur 1,146,349 1,165,952 0.17
Gopalganj 1,165,273 1,172,415 0.06
Pirojpur 1,111,068 111,3257 0.02
Barisal 2,355,967 2,324,310 −0.13
Jhalkati 694,231 682,669 −0.17
Khulna 2,378,971 2,318,527 −0.25
Bagerhat 1,549,031 1,476,090 −0.47

85
Table D.6 Spatial Analysis: Disease Incidence versus Local Capacity, 2011
Zila
Diarrhea
incidence
(%)
Improved sanitation
(1 best; 65 worst)
Safe drinking
water (1 best;
65 worst)
Health equipment
availability (1
best; 25 worst)
Essential drug
availability (1 best;
25 worst)
Kushtia 4.96 38 14 5 19
Kishoreganj 3.83 52 41 10 21
Munshiganj 3.80 6 27 7 20
Manikganj 3.63 20 19 — —
Bandarban 3.57 64 63 — —
Rajshahi 3.48 42 28 — —
Khagrachhari 3.46 56 61 11 6
Magura 3.38 13 6 — —
Jhenaidah 3.37 41 10 1 23
Satkhira 3.36 39 57 11 16
Shariyatpur 3.34 5 33 9 1
Khulna 3.30 12 56 9 6
Rajbari 3.11 10 15 — —
Rangamati 3.10 57 64 11 6
Bagerhat 2.87 9 62 9 5
Gopalganj 2.80 3 30 — —
Sherpur 2.52 47 42 — —
Chandpur 2.51 28 45 11 19
Sylhet 2.39 32 60 9 13
Netrokona 2.39 55 51 1 1
Dinajpur 2.37 48 4 11 22
Habiganj 2.36 49 53 12 19
Chuadanga 2.24 51 7 — —
Laksmipur 2.17 18 49 9 1
Madaripur 2.12 24 25 — —
Narsingdi 2.04 33 11 — —
Moulvibazar 1.89 43 58 11 4
Meherpur 1.60 50 26 — —
Dhaka 1.60 1 1 1 26
Mymensingh 1.57 53 47 8 1
Narayanganj 1.42 11 20 — —
Gazipur 1.40 7 13 12 20
Comilla 1.37 15 43 11 7
Thakurgaon 1.31 63 3 — —
Jamalpur 1.30 45 21 6 18
Chapai Nawabganj 1.23 59 31 — —
Sunamganj 1.21 61 54 11 15
Cox’s Bazar 1.21 44 52 4 17
Feni 1.20 17 36 — —
Sirajganj 1.08 34 24 5 3
Jhalkati 1.07 2 46 9 20
Naogaon 1.06 58 48 1 20
Tangail 1.01 31 29 5 1
Jaipurhat 0.98 46 23 11 20
Narail 0.86 22 8 — —
Bogra 0.83 29 9 3 10
Brahmanbaria 0.81 25 34 11 12
Jessore 0.80 35 2 4 16
Nator 0.74 27 38 11 1
Nilphamari 0.74 60 22 — —
Chittagong 0.47 14 44 10 14
Faridpur 0.45 8 16 5 2
Bhola 0.44 36 32 — —

86
Sources: Diarrhea incidence is from the health Management Information Service, health facility capacity
measures are from the 2011 national HFS, water and sanitation access are from the 2011 census.
Note: — = no data.
Panchagar 0.41 30 37 13 11
Pirojpur 0.41 16 59 — —
Kurigram 0.39 40 17 2 8
Borguna 0.36 19 55 9 24
Pabna 0.32 26 39 5 13
Lalmonirhat 0.31 37 18 1 4
Patuakhali 0.26 21 12 — —
Barisal 0.13 4 40 1 25
Gaibandha 0.12 62 35 5 9
Noakhali 0.12 23 50 — —
Rangpur 0.11 54 5 1 1

87
Appendix E: Policy Simulation of Health Impact
The health benefit is estimated under the assumption of achieving the following targets by 2020:
(1) universal access to safe drinking water (that is, tube well in rural areas and piped water in
urban areas), sanitary toilet facilities, and electricity; (2) female secondary education attainment;
and (3) elimination of child stunting. These policy targets are set in reference to both the current
level of access to basic services, female education, and child malnutrition estimated from the
2011 Demographic and Household Survey (DHS) and the Millennium Development Goal targets
set for 2015 (see table E.1).
Table E.1 Policy Simulation Targets
Indicator
Current level,
2011
MDG target,
2015
Simulation
target, 2020
Rural area
Access of tube well (%) 85.5 96.5 100
Improved latrine (%) 9.5 55.5 100
Has electricity (%) 43.8 100
Women with secondary and above education (%) 45.8 100
Stunting (height for age z score < 2 standard
deviations) (%)
36.8 0
Population (thousands) 112,510 129,849
Urban area
Access of piped water (%) 38 100 100
Latrine flush to septic (%) 42 85.5 100
Has electricity (%) 82.5 100
Women with secondary and above education (%) 59.7 100
stunting (height for age z score < 2 standard
deviations) (%)
28.7 0
Population (thousands) 26,743 80,399
Source: Current levels are based on the 2011 DHS; 2020 population projection is based on U.S. projection
Table E.2 presents the estimated health benefits from achieving the policy targets set for 2020
and 2030, respectively, taking account of population growth. The health benefit is measured in
terms of the number of reduced cases of illness and malnutrition and the number of deaths
averted among children 0–14 years of age. The simulation results show that improving
household living conditions (access to safe drinking water, better sanitation facilities, and access
to electricity) is estimated to reduce about one-quarter of stunting cases and avert more than 46
percent of deaths among children 0–14 years of age in 2020.33
Achieving female secondary
education attainment alone is projected to reduce about 15 percent of stunting cases and one-
third of child deaths.
33
Using the 2007 DHS data, WPS (2011) shows that inadequate sanitation is responsible for economic
losses of about US$4.22 billion, equivalent to 6.3 percent of the country’s gross domestic product each
year based on estimates from the 2007 DHS data, with premature mortality and other health-related
diseases and disability accounting for about 84.3 percent of total cost. The World Health Organization
(WHO) has estimated that almost 10 percent of the global burden of disease could be prevented through
water, sanitation, and hygiene interventions.

88
Policy interventions in improving nutrition are also shown to generate large health benefits.
While the exact relationship between malnutrition and mortality is not well established, the
policy simulation suggests that eliminating child malnutrition (stunting) could avert more than
93,000 deaths, representing about one-third of total deaths among children 0–14 years of age.34
The policy simulation by USAID and FANTA (2012), which uses different data sources and
modeling methods, found that over the 2011–12 period about 160,000 child deaths could be
averted by reducing the prevalence of stunting. The health benefit from the three policy
interventions combined is estimated to reduce more than one-third of stunting cases and to avert
more than 70 percent of child deaths annually in Bangladesh.
Table E.2 Estimating the Health Benefit of Targeted Policy Interventions
Target Infrastructure Women’s education Nutrition
All
combined
Reduced stunting, ages 0–5 (thousands) 1,908 1,156 none 2,563
% stunted in 2020 24.8 15.0 none 33.3
% stunted in 2030 20.6 12.5 none 27.6
Averted death, ages 0–14 (thousands) 133 96 93 212
% deaths averted in 2020 46.5 33.6 32.4 74.0
% deaths averted in 2030 49.8 35.9 34.6 79.2
Note: The table makes the following assumptions: (1) the proportion of urban population increases
from 28 percent in 2011 to 35 percent in 2020 and to 45 percent in 2030, (2) the population ages 0–14 years
old is 51 million in 2011 (WHO 2009), 66 million in 2020, and 61.8 million in 2030, (3) the total deaths of
people 0–14 years of age is estimated at 221 million in 2011 (WHO and PAHO 2010), 286 million in 2020,
and 267 million in 2030, and (4) the population 0–5 years of age is estimated at 19 million in 2011 (UNICEF
2013), 24.5 million in 2020, and 22.9 million in 2030.
34
In Bangladesh, the number of children under five classified as stunted and wasted was 5,958,000, and
2,251,000, respectively, in 2011 (UNICEF 2013). The projected number of stunting and wasting by 2020,
under the scenario of “business as usual”—meaning that no health adaptation measures are taken—will
rise to 7,690,000 and 2,905,000, respectively (attributable to population growth).

89
References
Alam, M. S. 2005. “Analysis of Kala-Azar Situation in Mymensingh from 2000 to 2004.”
Master’s diss., ICDDR,B.
Ali, A., A. Amani, A. Diedhiou, and T. Lebel. 2005. “Rainfall Estimation in the Sahel. Part II:
Evaluation of Rain Gauge Networks in the CILSS Countries and Objective Intercomparison of
Rainfall Products.” America Meteorology Society 44 (11): 1707–22.
Bandyopadhyay, S., L. M. Wang, and S. Kanji. 2011. “The Impact of Rainfall and Temperature
Variation on Children’s Diarrhea Incidence in Sub-Saharan Africa.” Applied Geography 33
(April): 63–72.
Black, R. E., L. H. Allen, Z. A. Bhutta, L. E. Caulfield, M. Onis, M. Ezzati, C. Mathers, and J.
Rivera. 2008. “Maternal and Child Undernutrition: Global and Regional Exposures and Health
Consequences.” Lancet 371 (9608): 243–60.
Burke, D. et al., eds. 2001. Under the Weather: Climate, Ecosystems, and Infectious Disease.
Washington, DC: National Academy Press.
Campbell-Lendrum, D. H., C. F. Corvalan, and A Pruss-Ustun. 2010. “How Much Disease
Could Climate Change Cause?” In Climate Change and Human Health, ch. 7. Geneva: World
Health Organization.
Carrera, C., A. Azrack, G. Begkoyian, J. Pfaffmann, E. Ribaira, T. O’Connell, and P. Doughty.
2012. “Equity in Child Survival, Health, and Nutrition 2: The Comparative Cost-Effectiveness of
an Equity-Focused Approach to Child Survival, Health, and Nutrition: A Modelling Approach.”
Lancet 380 (9850): 1341–51.
Confalonieri, U., B. Menne, R. Akhtar, K. L. Ebi, M. Hauengue, R. S. Kovats, B. Revich, and A.
Woodward. 2007. “Human Health.” In Climate Change 2007: Impacts, Adaptation and
Vulnerability, edited by M. L., O. F. Canziani, J. P. Palutikof, P. J. van der Linden, and C. E.
Hanson. Contribution of Working Group II to the fourth assessment report of the
Intergovernmental Panel on Climate Change Parry Cambridge University Press, Cambridge,
United Kingdom.
Del Ninno, C., and M. Lundberg. 2005. “Treading Water: The Long-Term Impact of the 1998
Flood on Nutrition in Bangladesh.” Economics and Human Biology 3 (1): 67–96.
Dhaliwal, I., D. E. Duflo, R. Glennerster, and C. Tulloch. 2012. “Comparative Cost-
Effectiveness Analysis to Inform Policy in Developing Countries: A General Framework with
Applications for Education.” J-PAL Working Paper, Massachusetts Institute of Technology,
Abdul Latif Jameel Poverty Action Lab (J-PAL), Boston.

90
Gage, K. L., T. R. Burkot, R. Eisen, and E. Hayes. 2008. “Climate and Vector-Borne Diseases.”
American Journal of Preventive Medicine 35 (5): 436–50.
Gertler, P. J., S. Martinez, P. Premand, L. B. Rawlings, and C. M. J. Vermeersch. 2010. Impact
Evaluation in Practice. Washington, DC: World Bank.
Hales, S., S. J. Edwards, and R. S. Kovats. 2003. “Impacts on Health of Climate Extremes.” In
Climate Change and Human Health, ch. 6. Geneva: World Health Organization.
Hashizume, M., B. Armstrong, S. Hajat, Y. Wagatsuma, Abu S. G. Faruque, T. Hayashi, and D.
A. Sack. 2007. “Association between Climate Variability and Hospital Visits for Noncholera
Diarrhea in Bangladesh: Effects and Vulnerable Groups.” International Journal of Epidemiology
36 (5): 1030–37.
Hossain, S. M., A. Duffield, and A. Taylor. 2005. “An Evaluation of the Impact of a US$60
Million Nutrition Programme in Bangladesh.” Health Policy Plan 20 (1, January): 35–40.
ICDDR,B (Department of International Centre for Diarrhoeal Disease Research, Bangladesh).
2007. “Climate Change and Bangladesh.” ICDDR,B News and Events, October 22.
http://203.190.254.12/news/index.jsp?idDetails=130&typeOfNews=Newspercent20andpercent2
0Events.
IEG (Independent Evaluation Group). 2010. “Cost-Benefit Analysis in World Bank Projects.”
World Bank, Washington, DC.
IPCC (Intergovernmental Panel on Climate Change). 2001. Regional Impacts of Climate
Change. Report of the Third IPCC. Geneva: IPCC.
Islam, N., and H. Uyeda. 2007. “Use of TRMM in Determining the Climatic Characteristics of
Rainfall over Bangladesh.” Remote Sensing of Environment 108: 264–76.
Jetten, T., and D. Focks. 2006. “Potential Changes in the Distribution of Dengue Transmission
under Climate Warming.” Wageningen Agricultural University, Graduate School for Production
Ecology, Department of Entomology, The Netherlands.
Khan, A. E., A. Ireson, S. Kovats, S. K. Mojumder, A. Khusru, A. Rahman, and P. Vineis. 2011.
“Drinking Water Salinity and Maternal Health in Coastal Bangladesh: Implications of Climate
Change.” Environmental Health Perspectives 119 (9): 1328–32.
Levin, H. M., and P. J. McEwan. 2001. Cost-Effectiveness Analysis, 2d ed. Thousand Oaks, CA:
Sage Publications.
Matsuda, F., S. Ishimura, Yukiko Wagatsuma, T. Higashi, Taiichi Hayashi, Abu S. G. Faruque,
David A. Sack, and M. Nishibuchi. 2008. “Prediction of Epidemic Cholera Due to Vibrio
Cholerae O1 in Children Younger Than 10 Years Using Climate Data in Bangladesh.”
Epidemiology and Infection 136 (1): 73–79.

91
McMichael, A., R. Woodruff, and S. Hales. 2006. “Climate Change and Human Health: Present
and Future Risks.” Lancet 367 (9513): 859–69.
MoEF (Ministry of Environment and Forest). 2008. “Protecting Health from Climate Change.”
Climate Change Cell, February.
http://www.climatechangecellbd.org/publications/18protectinghealthfromcc.pdf.
Murray, C. J., and A. D. Lopez. 1997. “Global Mortality, Disability, and the Contribution of
Risk Factors: Global Burden of Disease Study.” 349 (9063): 1436–42.
National Research Council. 2001. Under the Weather, Climate, Ecosystems, and Infectious
Disease. Washington, DC: National Academy Press.
Pascual, M., and A. Dobson. 2005. “Seasonal Patterns of Infectious Diseases.” PLoS Med 2 (1):
e5.
Patz, J. A., P. R. Epstein, T. A. Burke, and J. M. Balbus. 1996. “Global Climate Change and
Emerging Infectious Diseases.” Journal of the American Mosquito Control Association 275 (3):
217–23.
Patz, J. A., A. K. Githeko, J. P. McCarty, S. Hussein, U. Confalonieri, and N. De Wet. 2010.
“Climate Change and Infectious Diseases.” In Climate Change and Human Health, ch. 6. Genva:
World Health Organization.
Reeves, W. C., J. L. Hardy, W. K. Reisen, and M. M. Milby. 1994. “Potential Effect of Global
Warming on Mosquito-Borne Arboviruses.” Journal of Medical Entomology 31: 323–32.
Pelletier, D. L., E. A. Frongillo Jr., D. G. Schroeder, and J.-P. Habicht. 1995. “The Effects of
Malnutrition on Child Mortality in Developing Countries,” WHO Bulletin OMS73, World
Health Organization, Geneva.
Rahman, R., M. Bangali, H. Kabir, F. B. Naher, and S. Mahboob. 2008. “Kala-azar Situation in
Bangladesh.” National Guideline and Training Module for Kala-azar Elimination in
Bangladesh. 1st ed. CDC, DGHS, Ministry of Health and Family Welfare.
Rogers, D. J., and S. E. Randolph. 2006. “Climate Change and Vector-Borne Diseases.”
Advances in Parasitology 62: 345–81.
Rueda, L. M., K. J. Patel, R. C. Axtell, and R. E. Stinner. 1990. “Temperature-Dependent
Development and Survival Rates of Culex Quinquefasciatus and Aedes Aegypti (Diptera:
Culicidae).” Journal of Medical Entomology 27 (5): 892–98.
Streatfield, P. K., and A. K. Zunaid. 2008. “Population Challenges for Bangladesh in the Coming
Decades.” Journal of Health, Population, and Nutrition 26 (3): 261–72.
http://www.icddrb.org/images/jhpn263-Population_Challenges_for_Bangladesh.pdf.

92
Teshima A., M. Yamada, T. Hayashi1, Y. Wagatsuma, and T. Terao. 2007. “Climate Impact on
Seasonal Patterns of Diarrheal Diseases in Tropical Areas.” Working Paper. ICDDR,B.
U.K. Government. 2011. The Green Book: Appraisal and Evaluation in Central Government.
London.
UNICEF (United Nations Children’s Fund). 2013. Improving Child Nutrition: The Achievable
Imperative for Global Progress. Geneva: UNICEF.
USAID and FANTA (Food and Nutrition Technical Assistance). 2012. Investing in Nutrition
Now: A Smart Start for Our Children, Our Future; Estimates of Benefits and Costs of a
Comprehensive Program for Nutrition in Bangladesh, 2011–2021. Washington, DC: FANTA.
U.S. Department of Health and Human Services. 1996. “Cost-Effectiveness in Health and
Medicine: Report to the U.S. Public Health Service by the Panel on Cost-Effectiveness in Health
and Medicine.” Washington, DC: DHHS.
Wang, L. 2003. “Determinants of Child Mortality in Less Developed Countries: Empirical
Findings from Demographic and Health Surveys.” Health Policy 65 (3) 56: 277–99.
Watts, D. M., et al. 1987. “Effect of Temperature on Vector Efficiency of Aedes Aegyoti for
Dengue 2 Virus.” American Journal of Tropical Medicine and Hygiene 36: 143–52.
White, H., and E. Masset. 2006. “The Bangladesh Integrated Nutrition Program: Findings from
an Impact Evaluation.” Journal of International Development 19: 627–52.
WHO (World Health Organization). 2003. “Summary.” In Climate Change and Human Health:
Risks and Responses. Geneva: WHO.
———. 2009. Protecting Health from Climate Change: Connecting Science, Policy, and People.
Geneva: World Health Organization.
WHO and PAHO (Pan American Health Organization). 2010. Protecting Health from Climate
Change: Vulnerability and Adaptation Assessment. Geneva: World Health Organization.
World Bank. 2005. “Water Sanitation Project Report.” World Bank, Washington, DC.
———. 2009. “Economics of Adaptation to Climate Change: Bangladesh.” World Bank,
Washington, DC.
———. 2010. “Bangladesh Public Expenditure and Institutional Review: Towards a Better
Quality of Public Expenditure.” World Bank, Washington, DC.
———. 2013. Bangladesh Poverty Assessment: Assessing a Decade of Progress in Reducing
Poverty, 2000–2010. Washington, DC: World Bank.

93
WSP (Water and Sanitation Program). 2011. “The Economic Impacts of Inadequate Sanitation in
Bangladesh.” World Bank, Water and Sanitation Program, Washington, DC.
Yu, W. H., M. Alam, A. Hassan, A. S. Khan, A. C. Ruane, C. Rosenzweig, D. C. Major, and J.
Thurlow. 2010. Climate Change Risks and Food Security in Bangladesh. Washington, DC:
World Bank.


![Climate Change & Disasters. Climate Change and Disasters “The report [Impacts, Adaptation & Vulnerability, IPCC 2007] confirms our worst fears – vulnerable.](https://static.fdocuments.in/doc/165x107/56649e6b5503460f94b69049/climate-change-disasters-climate-change-and-disasters-the-report-impacts.jpg)