Climate Change and Agriculture in the Great Lakes Region Potential Impacts of Climatic Variability...
26
Climate Change and Agriculture in the Great Lakes Region Potential Impacts of Climatic Variability and Change Jeffrey A. Andresen Dept. of Geography Michigan State University
-
date post
20-Dec-2015 -
Category
Documents
-
view
215 -
download
0
Transcript of Climate Change and Agriculture in the Great Lakes Region Potential Impacts of Climatic Variability...

Climate Change and Agriculture in the Great Lakes Region
Potential Impacts of Climatic Variability and Change
Jeffrey A. Andresen
Dept. of Geography
Michigan State University

Climate Change andAgricultural Productivity
• Crop, forage productivity and production costs– Changing temperature, precipitation
– CO2 enrichment
– Occurrence of extremes
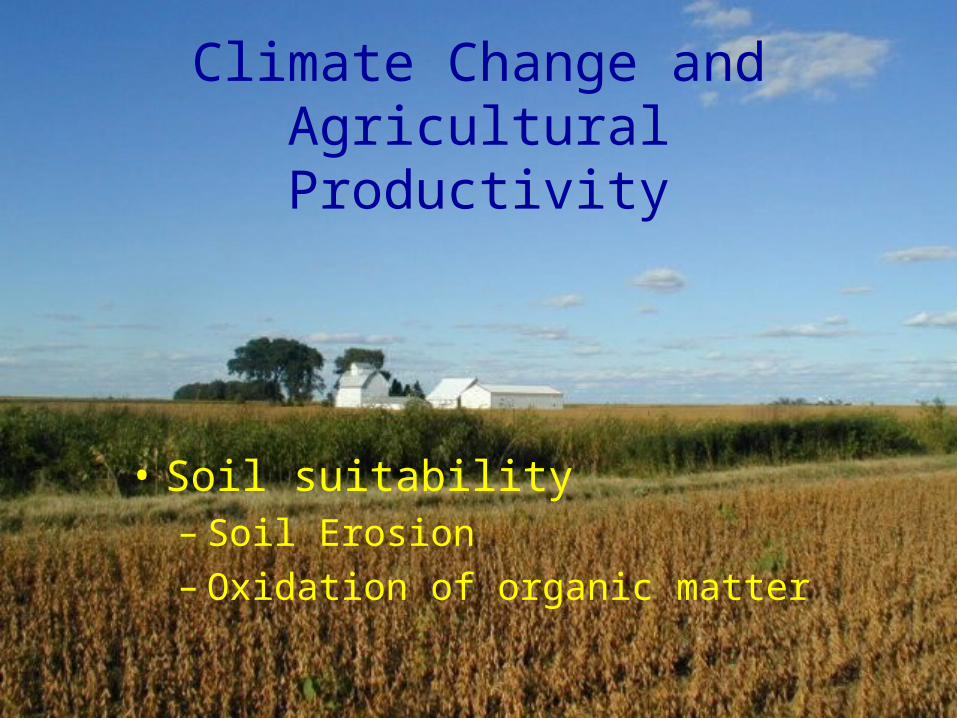
Climate Change andAgricultural Productivity
• Soil suitability– Soil Erosion– Oxidation of organic matter

Climate Change andAgricultural Productivity
• Livestock productivity and production cost
– Animal mortality– Feed conversion rates– Rates of gain– Milk production– Conception rates

Climate Change andAgricultural Productivity
• Irrigation water supply– Changes in precipitation frequency and totals– Changes in groundwater recharge rates– Changes in nonagricultural usage


Annual trends (yr-1) for selected simulated variables, soybean, 1895-1996
StationPPT(mm)
PET(mm)
ET/ PETPAVfp
(mm)
S(mm)
Yield (kg/ha)
WUE (kg/ha/mm)
Chatham .722 .126 .190* .235* -.032 9.188* .024*
Coldwater .066 -.326* .079* .167 -.236* 1.783 .007
Eau Claire .227 -.133* .084* .000 -.233* 4.543* .009*
Grand Rapids
1.881* .090 .224* .250* -.308* 9.652* .020*
Madison .465 .047 .080* .185* -.079 4.944* .010*
Waseca 1.286* -.373* .193* .479* -.294 15.069* .032*
Worthing-ton
-.235 -.564* .126* .167 -.164 6.390* .014*
* Trend significant at =0.05 level

Projected Changes in Climate: Great Lakes Region
• While considerable differences and uncertainty exist, the majority of future climate simulations suggest a warmer and wetter climate across the region.


Estimated changes in national crop production in 2030 relative to 2000
(Reilly et al., 2001)
Crop Dryland Yield
Irrigated Yield
Irrigation Water Use
Corn +11 to +20%
+1 to +21% -32 to +57%
Soybeans +7 to +49% +23% 0 to +18%
Soft Wheat -3 to +58% -5 to +5% -26 to +3%
Potatoes +7 to +8% -4 to –1% -3 to 0%
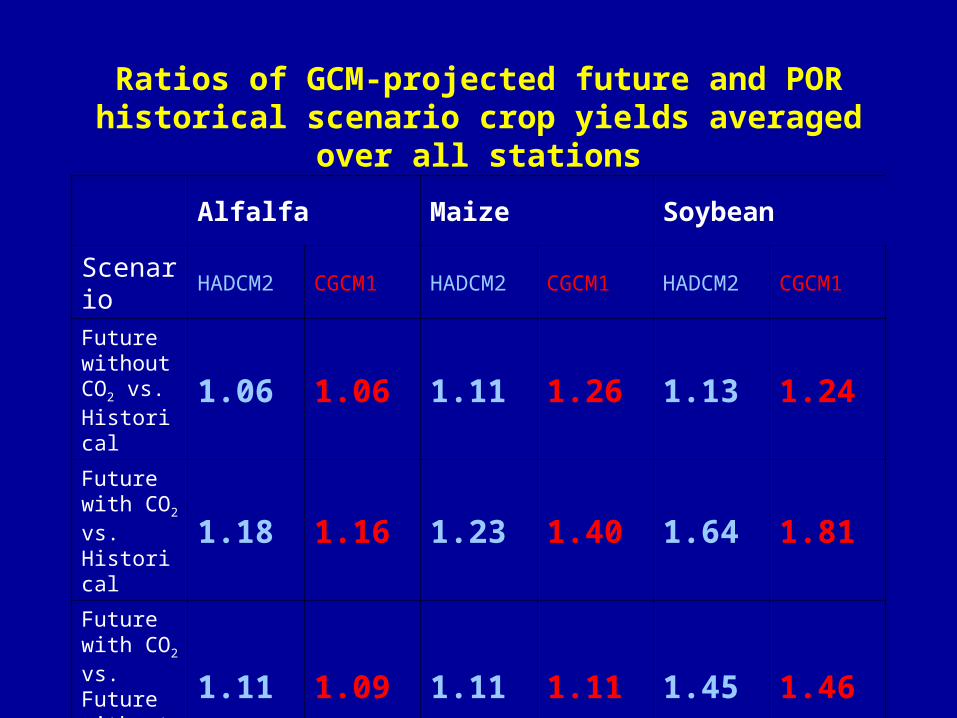
Ratios of GCM-projected future and POR historical scenario crop yields averaged over all stations
Alfalfa Maize Soybean
Scenario HADCM2 CGCM1 HADCM2 CGCM1 HADCM2 CGCM1
Future without CO2 vs. Historical
1.06 1.06 1.11 1.26 1.13 1.24
Future with CO2 vs. Historical
1.18 1.16 1.23 1.40 1.64 1.81
Future with CO2 vs. Future without CO2
1.11 1.09 1.11 1.11 1.45 1.46


Simulated Historical and Projected Future Growing Season and Water Balance for Maize, Bay City, MI
Precipitation (mm)
Evapotrans-piration (mm)
Runoff(mm) Drainage(mm)Change in storage(mm)
Time Period
HAD CGCM HAD CGCM HAD CGCM HAD CGCM HAD CGCM
2026 – 2035 410 314 -460 -432 -50 -20 -7 -5 106 143
2090 – 2099 394 267 -394 -364 -53 -29 -5 -4 57 130
Histor-
ical 321 -410 -48 -7 145

Agricultural strategies for coping with climate change
• Adaptation– Learn to change, adapt
• Mitigation– Reduction of carbon and other GHG
• Carbon sequestration• Production of fuels/energy from biomass/animal waste• Reduction of CH4 and N2O• Use of alternative energy sources in production


Probability Distribution of Simulated Dryland Double Crop Soybean Yields
by Planting DateAdrian, MI, 1895-2000
0
500
1000
1500
2000
2500
00.20.40.60.81
Probability
Yield (kg/ha)
1-Jun
15-Jun
1-Jul
15-Jul

Probability Distribution of Simulated Irrigated Double Crop Soybean Yields
by Planting Date Adrian, MI, 1895-2000
0
500
1000
1500
2000
2500
3000
3500
4000
4500
00.20.40.60.81
Probability
Yield (kg/ha)
1-Jun
15-Jun
1-Jul
15-Jul

Summary
• A changing climate leads to many potential challenges for agricultural production systems.
• Observed climate has become wetter and cloudier in the Great Lakes Region, especially during the last 50 years.
• The single most important climatological variable associated with crop yields regionally is precipitation. Growing season length and GDD accumulation were relatively more important at northern study sites.

Summary (continued)
• The warmer and wetter climate suggested by the many GCM projections for our region would suggest yield increases for many crops. Yields of some crops in the region might decline.
• A significant portion of any future yield increases will be associated with CO2 enrichment.
• Recent research results suggest greater agronomic potential for northern sections of the region, even with less suitable soils.
• More research is needed, especially regarding indirect impacts of climate change and extreme events.