Climate Challenge Fund Climate Change and Carbon … · behaviour of animals. Polar Bears in ......
89
Climate Challenge Fund Climate Change and Carbon workshop
Transcript of Climate Challenge Fund Climate Change and Carbon … · behaviour of animals. Polar Bears in ......
Climate Challenge Fund
Climate Change and Carbon
workshop

Aims of today
A) Increase your understanding of global warming,
greenhouse gas emissions, climate change and how you can take action on these issues.
B) Increase your confidence in your ability to
communicate these issues to your community.
C) Strengthen your commitment to address climate change in your community through word and deed.

3
Structure of the day
• Morning – Science & Politics - the science behind climate change; what the politicians are doing about greenhouse gas emissions; how out climate is changing already.
• Lunch
• Afternoon – Communication and Commitment - responding to some of the myths and excuses; thinking about how we communicate the climate case.
• Finish by 16.00
Keep Scotland Beautiful
Keep Scotland Beautiful is the independent charity which campaigns, acts and educates on a range of local, national and global environmental issues which affect
people’s quality of life.
What is climate change?
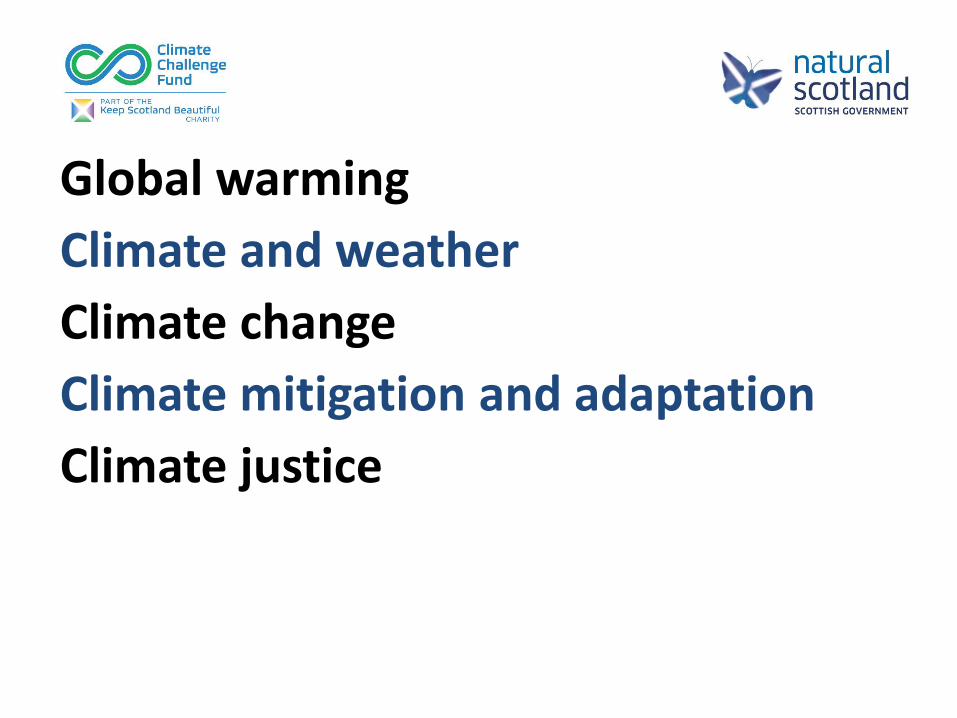
Global warming
Climate and weather
Climate change
Climate mitigation and adaptation
Climate justice

• e.

Why is it happening – causes?
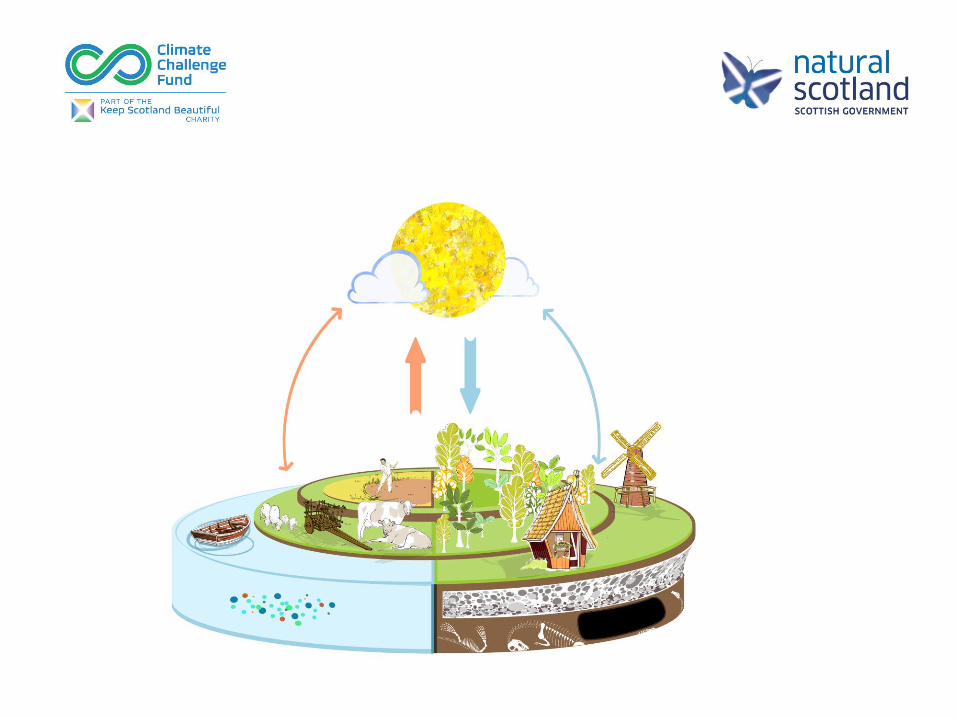
Natural carbon cycle – low human impact
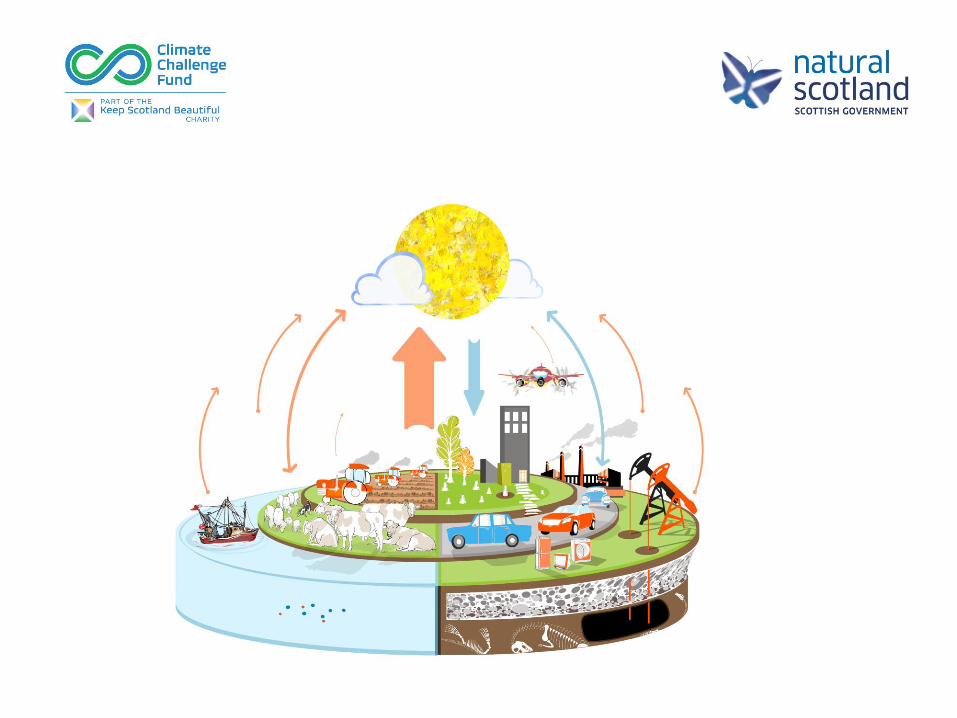
Altered carbon balance - hydrocarbons

Source: insert
1900 2000 2100
0
1
2
3
4
-1
Glo
bal S
urf
ace W
arm
ing
(°
C)
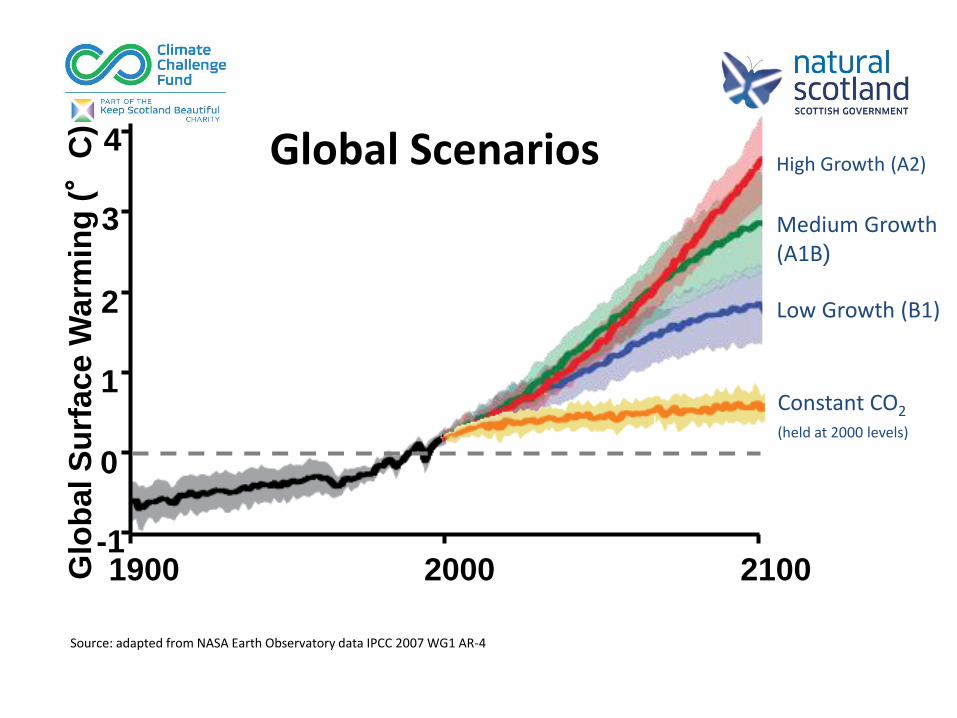
High Growth (A2)
Medium Growth (A1B)
Low Growth (B1)
Constant CO2
(held at 2000 levels)
Source: adapted from NASA Earth Observatory data IPCC 2007 WG1 AR-4
Global Scenarios

Intergovernmental Panel on Climate Change (IPCC) report September 2013

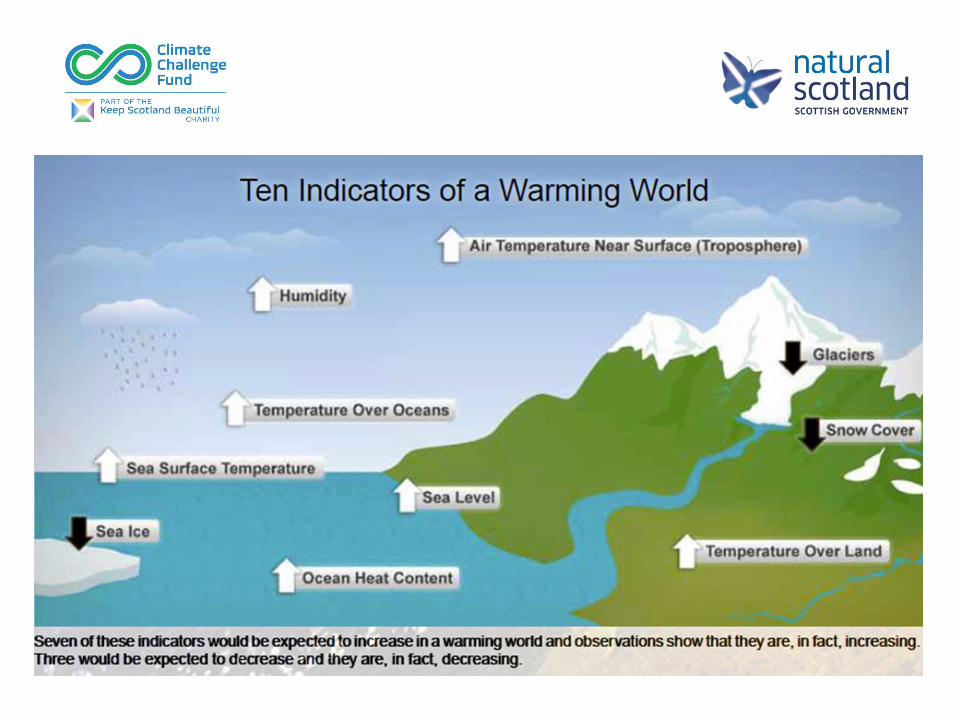
So what evidence is there for
climate change?

Evidence from Ice Cores
Image source: http://planetearth.nerc.ac.uk/news/story.aspx?id=609
Image source:http://en.wikipedia.org/wiki/Ice_core
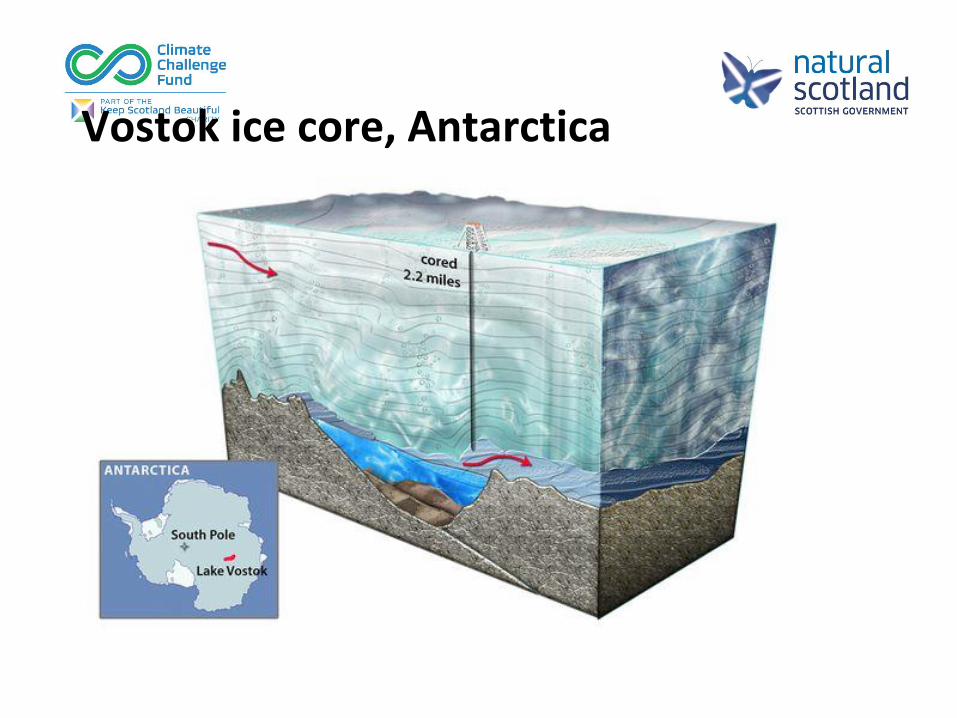
Vostok ice core, Antarctica

Evidence from Graphs
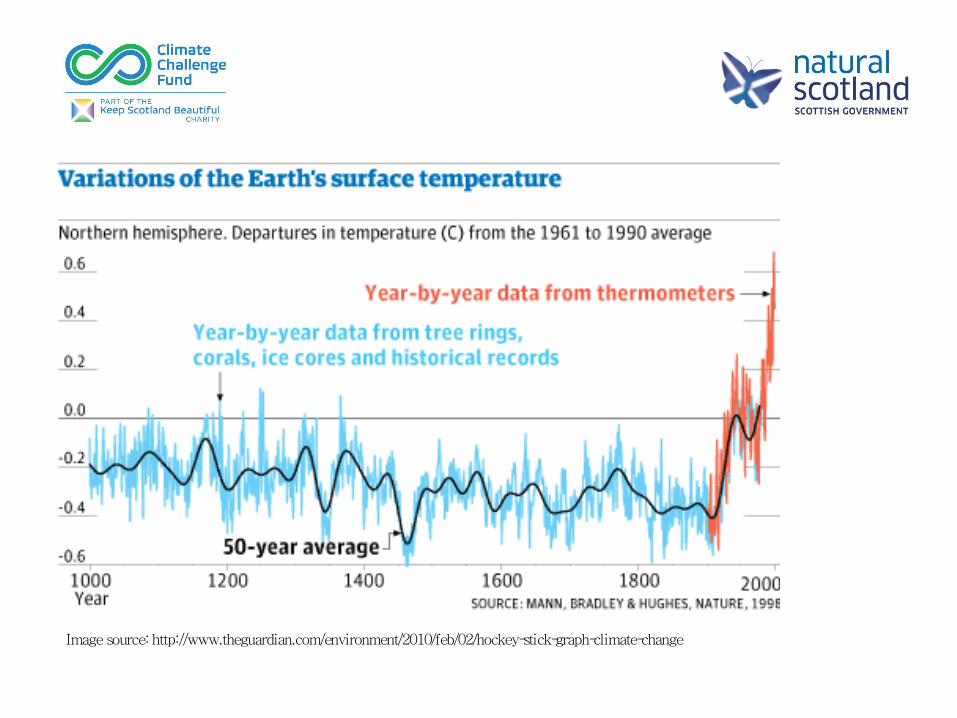
Evidence from graphs
Image source: http://www.theguardian.com/environment/2010/feb/02/hockey-stick-graph-climate-change
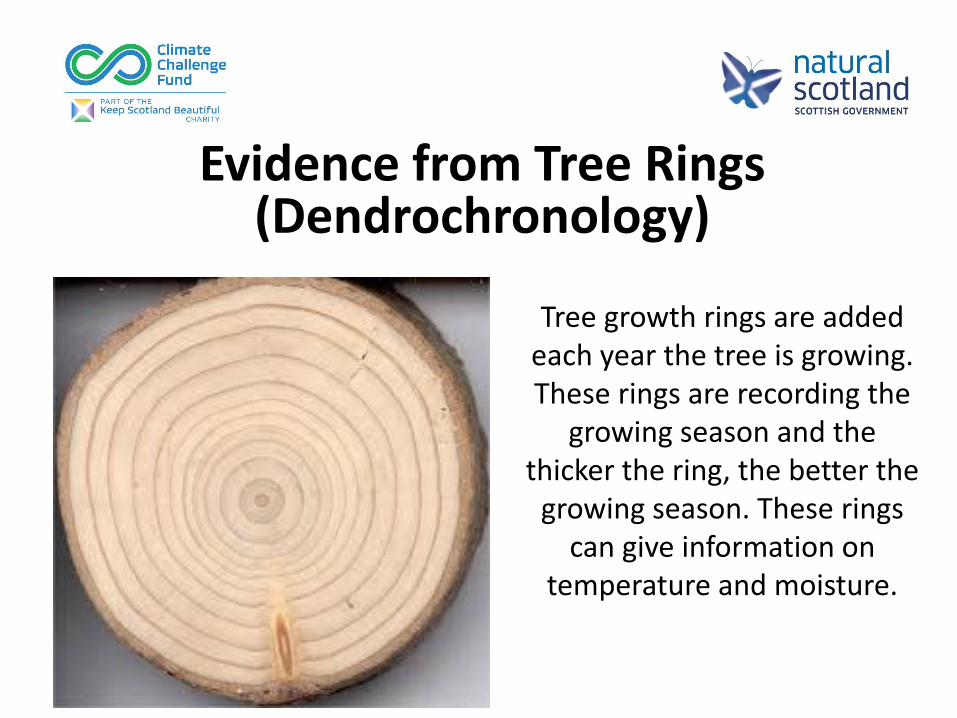
Tree growth rings are added each year the tree is growing. These rings are recording the
growing season and the thicker the ring, the better the
growing season. These rings can give information on
temperature and moisture.
Evidence from Tree Rings (Dendrochronology)

Melting Ice Sheets
Image source: http://www.canyoncountryzephyr.com/blog/2013/06/23/the-brighter-side-of-global-warming-from-the-2007-archives/polar-ice-caps-melting/

Glacial retreat
Image source: http://press-affairs.blogspot.co.uk/2013/04/warning-global-warming.html

Sea Level Rise
• Warming temperatures
• Ice melt
• Oceans expanding
• Sea levels rising
Image source: http://thebritishgeographer.weebly.com/sea-level-change.html

Image source: http://thebritishgeographer.weebly.com/sea-level-change.html

Changing Weather - Heatwaves
Image source: http://www.iac.ethz.ch/staff/fischer/2003.html
• Summer 2003 record breaking heatwave in Europe.
• Many European countries experienced their highest temperature on record.
• According to Met Office this period of extreme heat is thought to be warmest for up to 500 years
• More than 20,000 people died.

Changing Weather – Intensity of Storms
Image source:http://en.wikipedia.org/wiki/Hurricane_Katrina
• Hurricane Katrina August 2005
• Category 5 hurricane and one of worst on record in US history.
• Rising Ocean surface temperatures are fuelling stronger, more intense hurricanes.

Warning Signs from Nature
• Changes in temperature and rainfall can change the distribution and behaviour of animals.
Polar Bears in Hudson Bay, Canada 1,200 polar bears Hunt on the ice during Spring Put on 50-75% of their body fat in these months But: Ice in Hudson Bay melts 3 weeks earlier now Less chance for the bears to feed Come on to shore 10kg lighter
Image source: http://www.mirror.co.uk/news/uk-news/polar-bear-clings-tight-iceberg-882963

Group exercise

Group exercise – Diamond 9 • You have been given 9 cards with evidence for
climate change on them
• Your task is to categorise them into most important to least important causes, like this
Most important
Least important
The Impacts of Climate Change
How is our weather going to change, and how is it already changing?

How has weather affected you over the past few years?
• Do you have a story to tell?
• Home
• Food
• Travel
• Communications
• Friends, family and community – here and abroad?
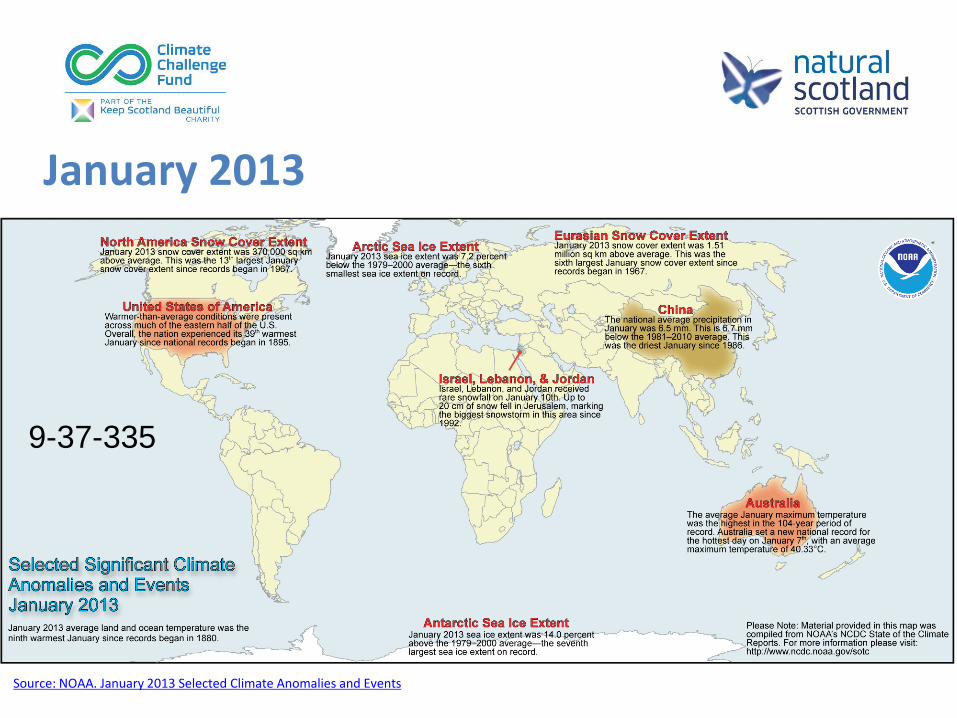
January 2013
Source: NOAA. January 2013 Selected Climate Anomalies and Events
9-37-335

Climate impacts
• Flooding and extreme rainfall events – damage property/people
• Heatwaves and extreme temperature
• Drought and water shortages
• Crop failures – food security, food prices
• Reduced frost and snow, Disease, pests, health and wellbeing
• Disruption to services - transport , energy, IT/communications
• Ecosystems disrupted, threat to habitats and species
• Glacial retreat – floods and eventual droughts
• Sea level rise and storm surges – coastal impacts

Looking at recent climate trends
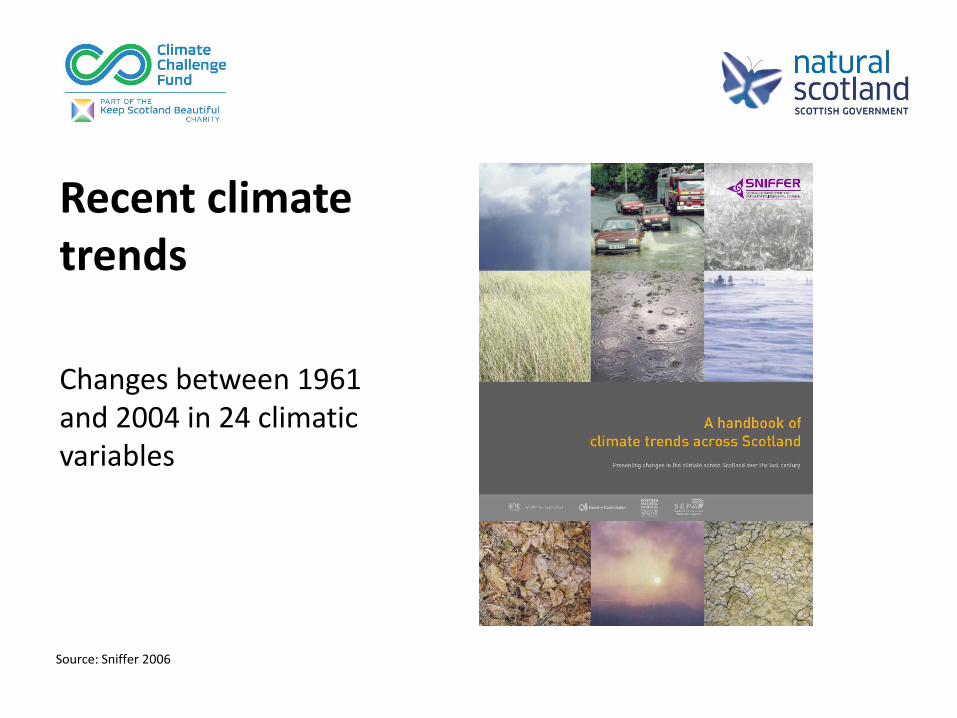
Recent climate trends
Changes between 1961 and 2004 in 24 climatic variables
Source: Sniffer 2006
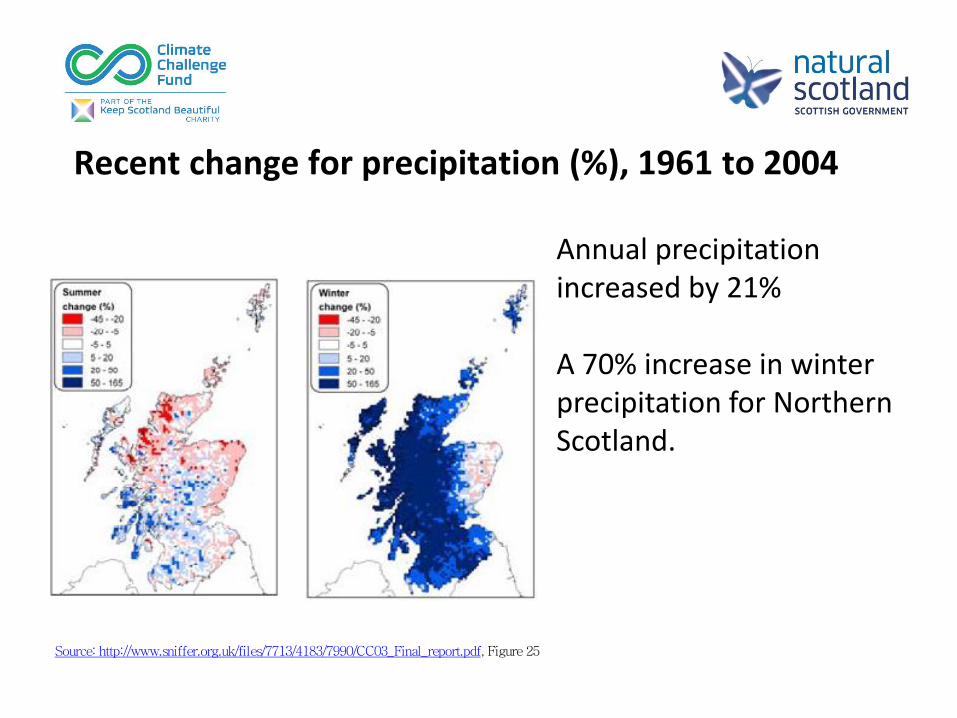
Recent change for precipitation (%), 1961 to 2004
Source: http://www.sniffer.org.uk/files/7713/4183/7990/CC03_Final_report.pdf, Figure 25
Annual precipitation increased by 21% A 70% increase in winter precipitation for Northern Scotland.

Change in mean temperature (°C) from 1961 to 2004
Source: http://www.sniffer.org.uk/files/7713/4183/7990/CC03_Final_report.pdf, Figure 4
Average annual temperature increased by 1 °C
Looking ahead - future climate trends

Projected climate change trends in Scotland • Hotter, drier summers
• Milder, wetter autumn and winters
• Increased in summer heat waves, extreme temperature and drought
• Reduced occurrence of frost and snowfall
• Increase in frequency and intensity of extreme precipitation events
• Sea level rise
2050s
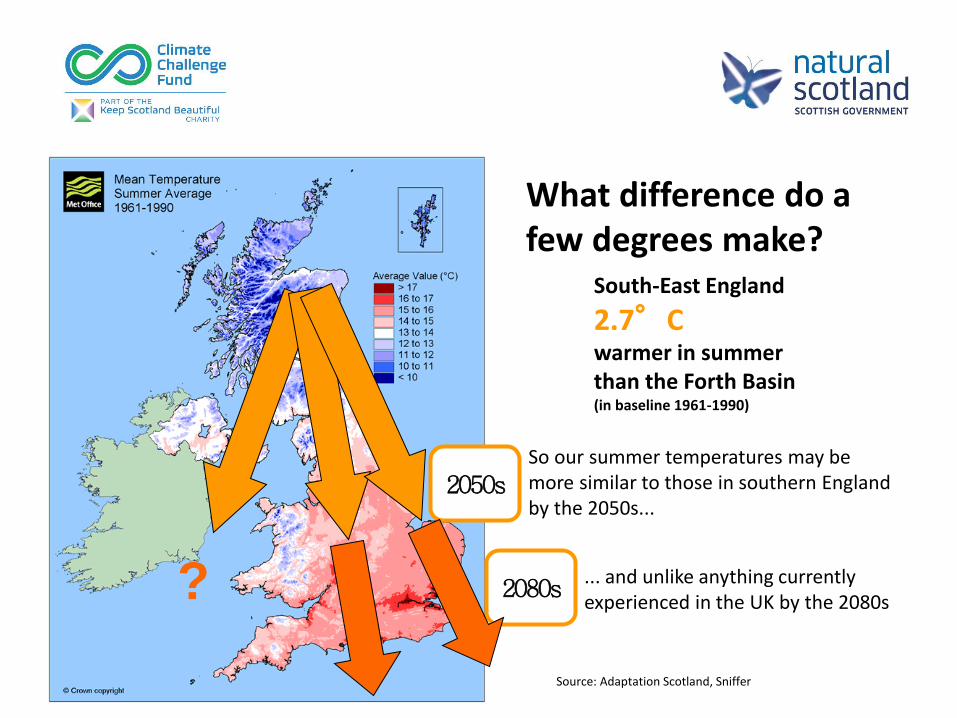
What difference do a few degrees make?
South-East England
2.7°C warmer in summer than the Forth Basin (in baseline 1961-1990)
So our summer temperatures may be more similar to those in southern England by the 2050s...
... and unlike anything currently experienced in the UK by the 2080s
2080s ?
Source: Adaptation Scotland, Sniffer
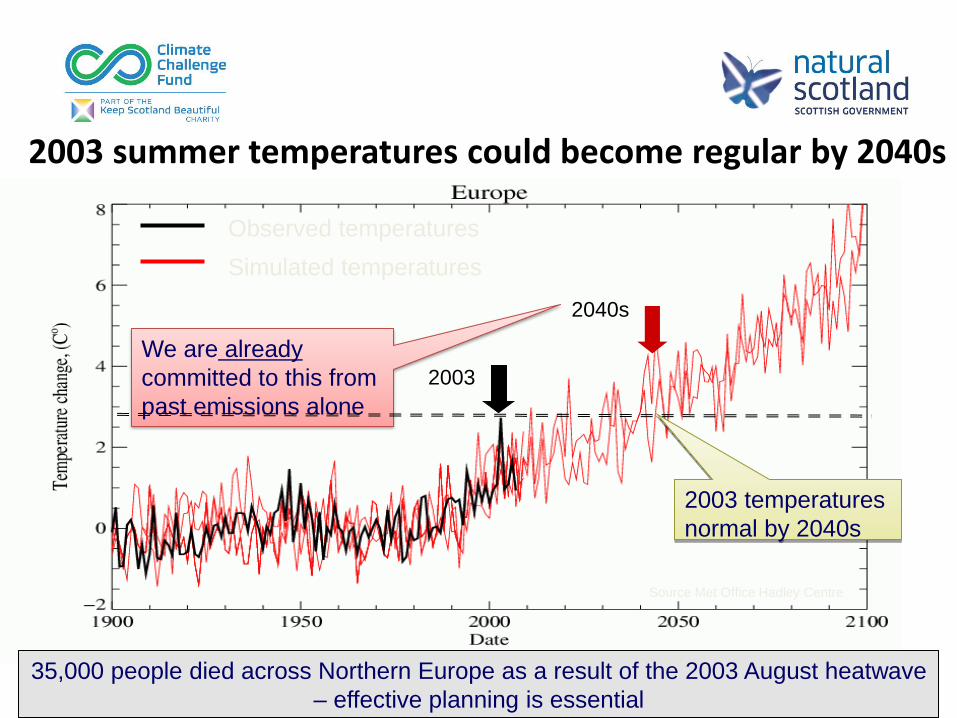
Observed temperatures
Simulated temperatures
We are already
committed to this from
past emissions alone
Source Met Office Hadley Centre
2040s
2003
2003 summer temperatures could become regular by 2040s
35,000 people died across Northern Europe as a result of the 2003 August heatwave
– effective planning is essential
2003 temperatures
normal by 2040s
The climate debate has shifted • The time for equivocation is over. The science is
clear. Climate change is happening. The impact is real. The time for action is now. Ban Ki-moon 2007 (UN
Secretary General.
• Climate change will change the world we live in. As a society we are at the cusp of choosing which world we will pass to our children. Stewart Stevenson
2008 (Scottish Minister for Transport, Infrastructure and Climate Change).

It is extremely likely that human influence has been the dominant cause of the observed warming since the mid-20th century.
IPCC - removed the scientific uncertainty
• Warming of the climate system is unequivocal, and since the 1950s, many of the observed changes are unprecedented over decades to millennia.
• In the Northern Hemisphere, 1983–2012 was likely the warmest 30-year period of the last 1400 years.
• Global surface temperature change for the end of the 21st century is likely to exceed 1.5 C relative to 1850 to 1900.
• It is likely to exceed 2°C for high emissions scenarios
• Warming will continue beyond 2100 under all RCP scenarios except one.
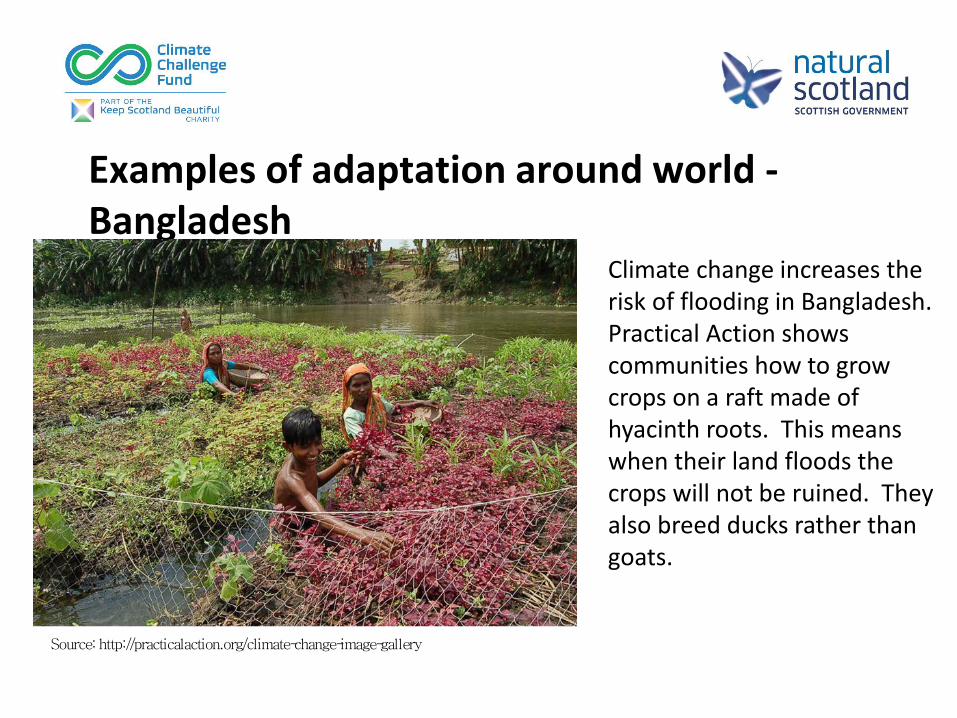
Examples of adaptation around world - Bangladesh
Climate change increases the risk of flooding in Bangladesh. Practical Action shows communities how to grow crops on a raft made of hyacinth roots. This means when their land floods the crops will not be ruined. They also breed ducks rather than goats.
Source: http://practicalaction.org/climate-change-image-gallery

Examples of adaptation around world - Peru
Farmers in Peru grow a wide variety of different potatoes to increase the biodiversity of their crops and reduce the potential impact of climate change
Source: http://practicalaction.org/climate-change-image-gallery
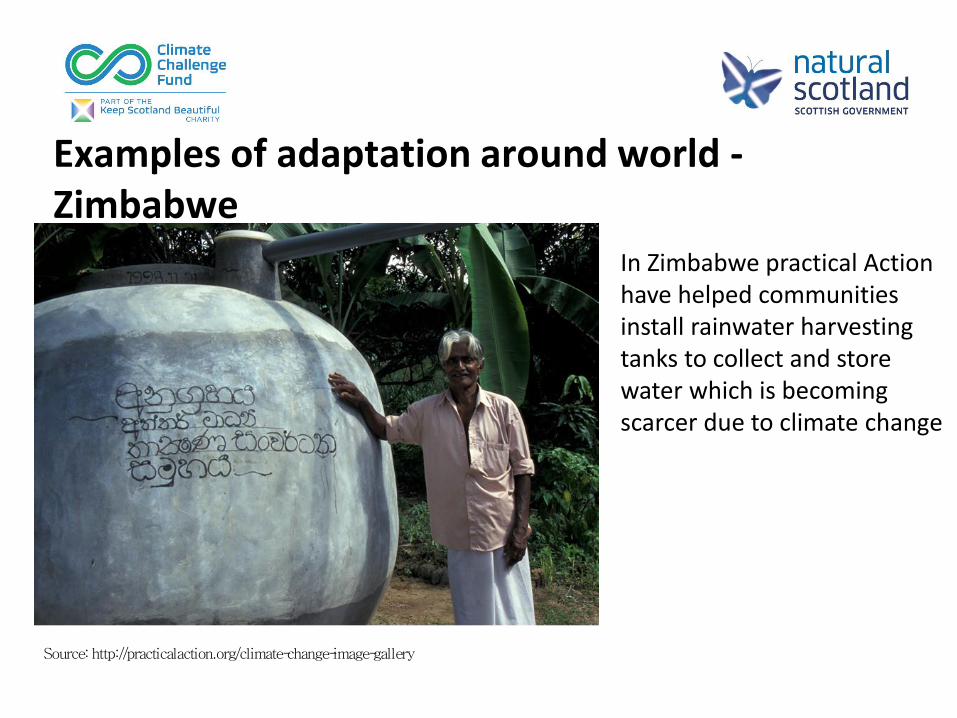
Examples of adaptation around world - Zimbabwe
In Zimbabwe practical Action have helped communities install rainwater harvesting tanks to collect and store water which is becoming scarcer due to climate change
Source: http://practicalaction.org/climate-change-image-gallery

So what is Scotland doing to adapt?
• Scottish Climate Change Adaptation programme sets out what government, businesses, and society are doing to become more climate ready.
• The Climate Change (Scotland) Act 2009 - makes legal arrangements about climate change mitigation and adaption.
• UK Climate Change Risk Assessment
Communities in Scotland?….. • Adaptation Scotland - provides advice and support
to help ensure that Scotland is prepared for, and resilient to, the impacts of climate change.
• Climate Challenge Fund - provide grants for community groups that want to include climate resilience activities in their project applications to run alongside carbon reduction measures.
• Great video on Adaptation Scotland highlighting the responses of different organisations, businesses and communities to climate change.

CO2e emissions; The global picture, Scotland’s
targets and how we are getting there.

Global CO2 emissions per capita - 2009 (UN figures for 196 countries)
0 1 2 3 4 5 6 7 8 910 11 12 13 14 15 16 17 18 19 20 21 22 23 24 25 26 27 28 29 30 31 32 33 34 35 36 37 38 39 40 41 42 43 44 45 46 47 48 49 50
61 countries under 1 tCO2
Pakistan – 0.9 tCO2
UK – 7.7 tCO2
Jamaica – 3.2 tCO2
United States – 17.3tCO2
Bangladesh – 0.3tCO2
Turkey – 4.1 tCO2
Botswana – 2.3 tCO2
Philippines – 0.7 tCO2
Quatar - 45 tCO2
Brazil – 1.9 tCO2
Canada – 15.2 tCO2
China – 5.8 tCO2
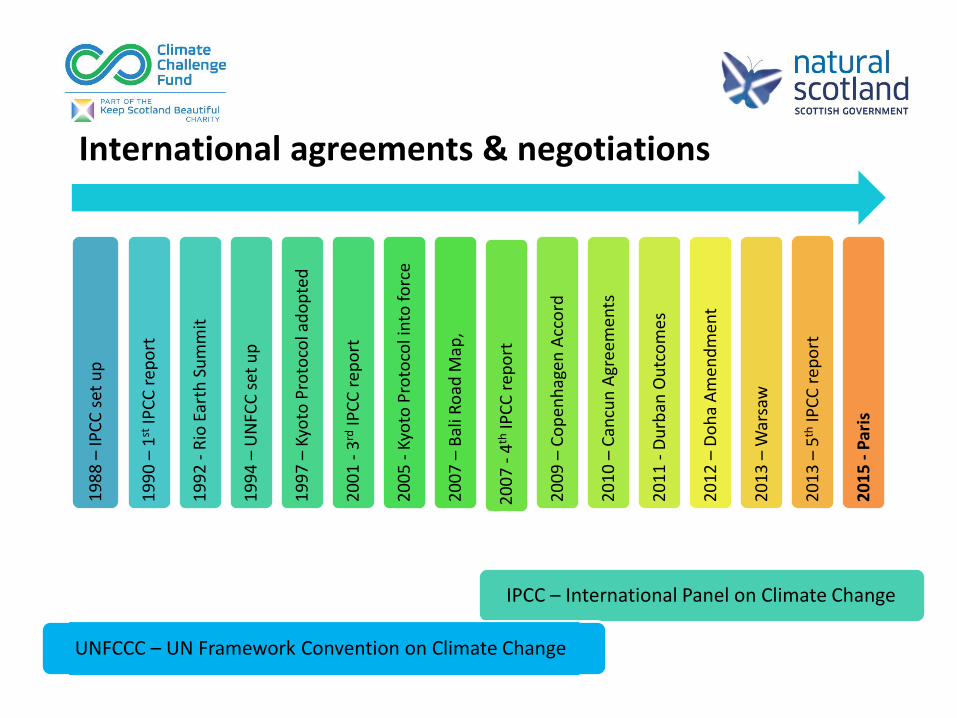
International agreements & negotiations
19
88
– IP
CC
set
up
19
90
– 1
st IP
CC
rep
ort
19
92
- R
io E
arth
Su
mm
it
19
94
– U
NFC
C s
et u
p
19
97
– K
yoto
Pro
toco
l ad
op
ted
20
01
- 3
rd IP
CC
rep
ort
20
05
- K
yoto
Pro
toco
l in
to f
orc
e
20
07
– B
ali R
oad
Map
,
20
07
- 4
th IP
CC
rep
ort
20
09
– C
op
enh
agen
Acc
ord
20
10
– C
ancu
n A
gree
men
ts
20
11
- D
urb
an O
utc
om
es
20
12
– D
oh
a A
men
dm
ent
20
13
– W
arsa
w
20
13
– 5
th IP
CC
rep
ort
20
15
- P
aris
IPCC – International Panel on Climate Change
UNFCCC – UN Framework Convention on Climate Change

Scotland’s Targets
Low Carbon Scotland; Meeting the Emission Reduction Targets 2010-2022 (RPP)
72.28 67.49
55.73
41.92
32.77
23.62
14.46
0.00
10.00
20.00
30.00
40.00
50.00
60.00
70.00
80.00
1990 Base Year 2000 2010 2020 2030 2040 2050
CO2e emissions Mt (including international aviation and shipping) 2011 54.25
42% cut by 2020 80% cut by 2050
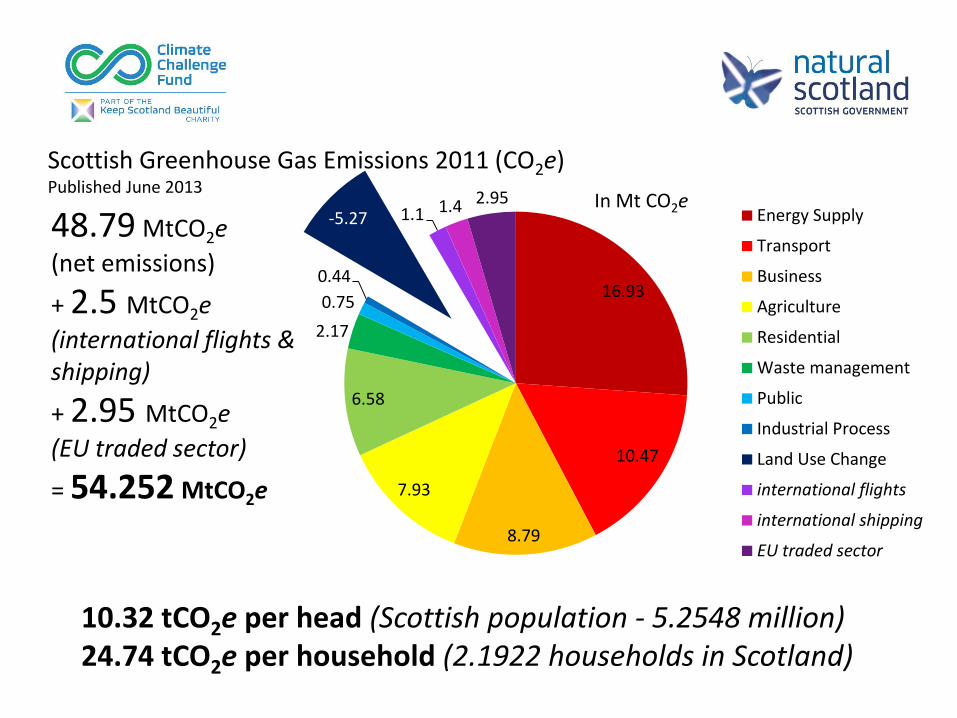
16.93
10.47
8.79
7.93
6.58
2.17
0.75
0.44
-5.27 1.1 1.4 2.95 Energy Supply
Transport
Business
Agriculture
Residential
Waste management
Public
Industrial Process
Land Use Change
international flights
international shipping
EU traded sector
Scottish Greenhouse Gas Emissions 2011 (CO2e) Published June 2013
In Mt CO2e
48.79 MtCO2e
(net emissions)
+ 2.5 MtCO2e
(international flights & shipping)
+ 2.95 MtCO2e
(EU traded sector)
= 54.252 MtCO2e
10.32 tCO2e per head (Scottish population - 5.2548 million) 24.74 tCO2e per household (2.1922 households in Scotland)
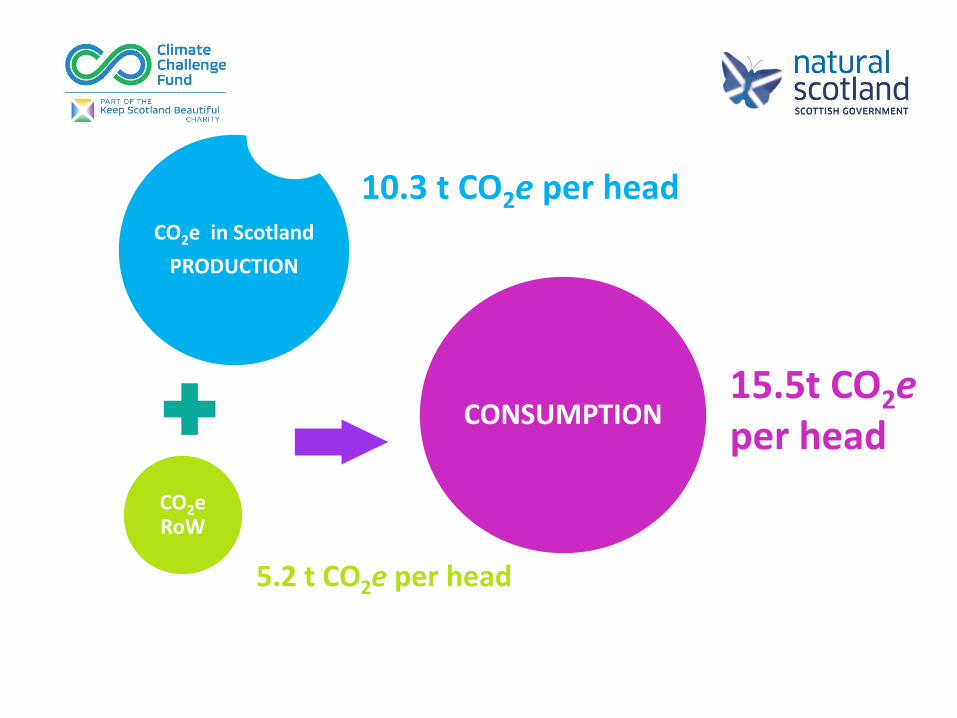
CO2e in Scotland
PRODUCTION
CO2e RoW
CONSUMPTION
10.3 t CO2e per head
5.2 t CO2e per head
15.5t CO2e per head
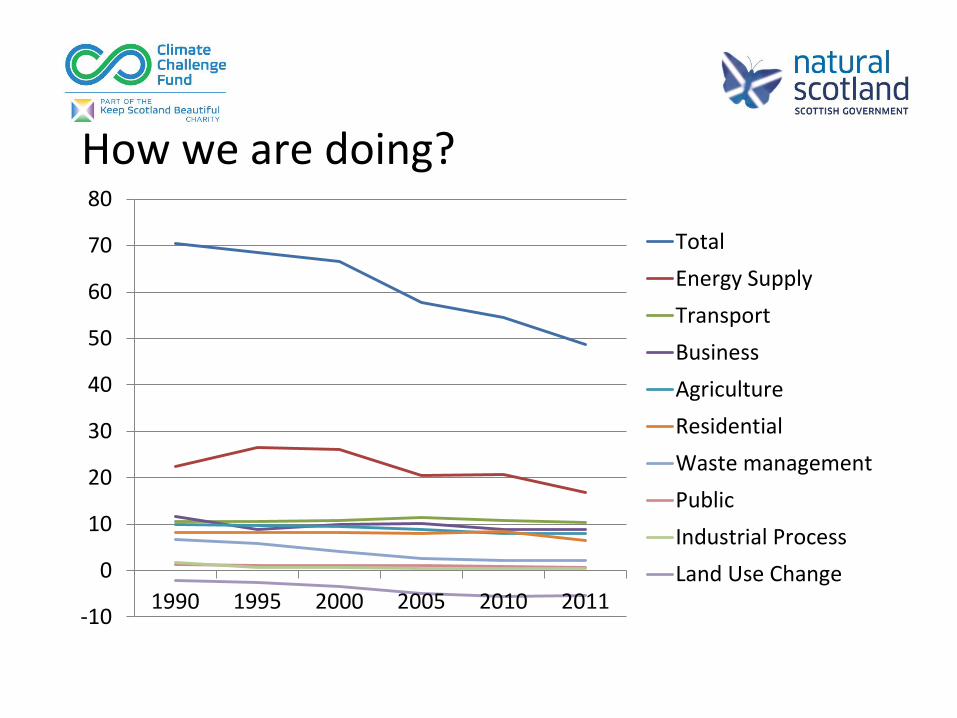
How we are doing?
-10
0
10
20
30
40
50
60
70
80
1990 1995 2000 2005 2010 2011
Total
Energy Supply
Transport
Business
Agriculture
Residential
Waste management
Public
Industrial Process
Land Use Change

Scottish Government Key Commitments in Report on Policies proposals (RPP2)
By 2025
– 75% of all waste recycled
By 2027
– transform energy use in industry, business and the public sectors
– optimise the productive use of natural resources
– enhanced natural carbon capture through expanded woodlands and peat land conservation
By 2030
– de-carbonise electricity generation
– step change in energy efficient homes, both regulations for new and retro-fit of existing.
By 2050
– de-carbonise heat sector
– de-carbonise road transport
– waste designed out the system
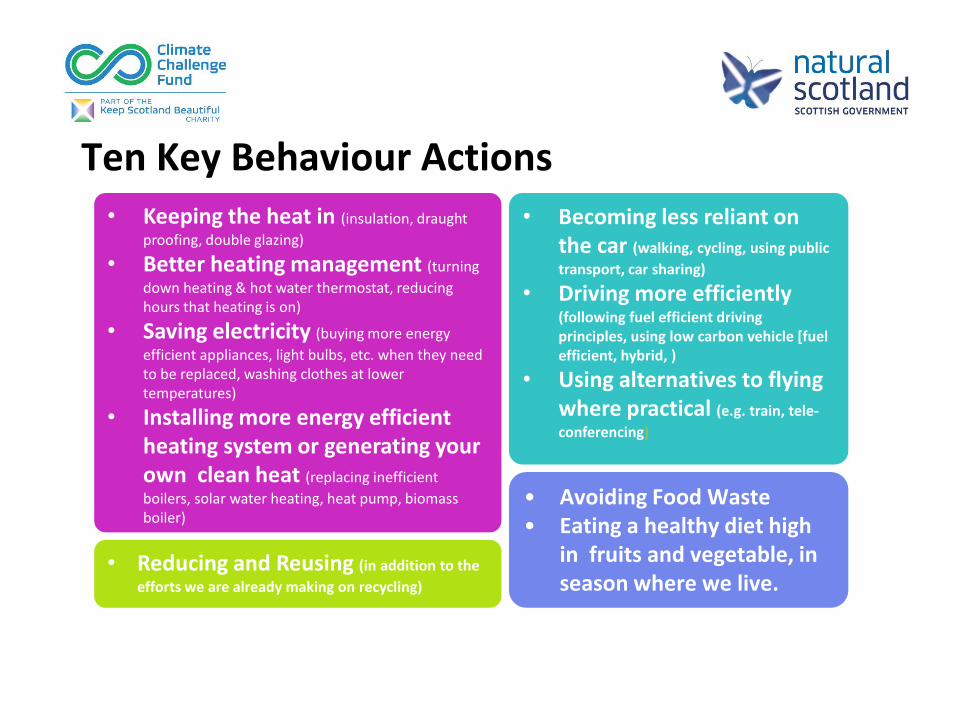
Ten Key Behaviour Actions • Keeping the heat in (insulation, draught
proofing, double glazing)
• Better heating management (turning
down heating & hot water thermostat, reducing hours that heating is on)
• Saving electricity (buying more energy
efficient appliances, light bulbs, etc. when they need to be replaced, washing clothes at lower temperatures)
• Installing more energy efficient heating system or generating your own clean heat (replacing inefficient
boilers, solar water heating, heat pump, biomass boiler)
• Reducing and Reusing (in addition to the
efforts we are already making on recycling)
• Avoiding Food Waste • Eating a healthy diet high
in fruits and vegetable, in season where we live.
• Becoming less reliant on the car (walking, cycling, using public
transport, car sharing)
• Driving more efficiently (following fuel efficient driving principles, using low carbon vehicle [fuel efficient, hybrid, )
• Using alternatives to flying where practical (e.g. train, tele-
conferencing)
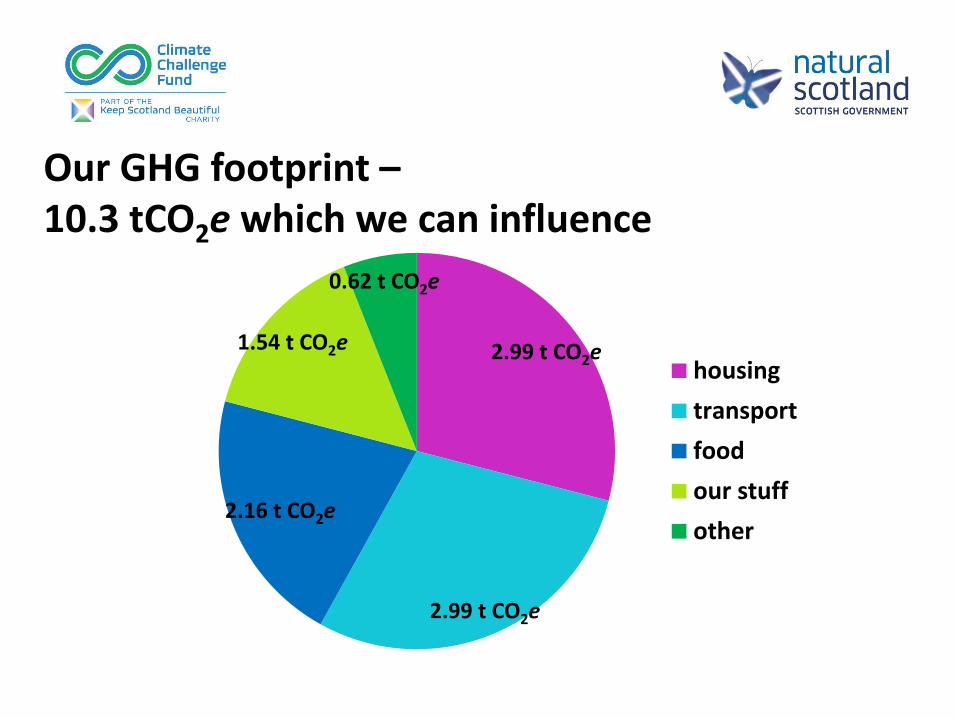
Our GHG footprint – 10.3 tCO2e which we can influence
2.99 t CO2e
2.99 t CO2e
2.16 t CO2e
1.54 t CO2e
0.62 t CO2e
housing
transport
food
our stuff
other

How can we visualise our emissions?
What is one tonne CO2e? = Volume - Six double decker London buses = Volume - 27 feet cubed = 3000 miles in an average car = Weight of
= one adult giraffe, = 10 baby elephants or = 1,000 kittens
OR

63
Dealing with excuses, denial &
busting myths

64
Its all to do with the sun, or volcanoes • Very little change in solar activity since
1950s • Emissions from volcanoes contribute less
than 1% of the CO2 emitted by the human activities. Cooling effect -
• May explain minor variability of last 1000 years, but not significant global warming of last 50 years.
Myths, denial & excuses

What do recent geological records tell us?

66
Myths, denial & excuses

67
Climate change is not really an issue • The worlds climate has been relatively stable for around
the last 10,000 years
• The last 100 years have been the warmest in the last 1000 years
• The models for the next 100 years show global increase in temperatures – not seen in the last 10,000 years. Can people and ecosystems adapt?
• These kind of increases can lead to positive feedback and tipping points, e.g. the melting ice caps and glaciers, ocean acidification, sea level rise
Myths, denial & excuses

68
There are other more important and urgent problems to tackle
• The weather can affect almost anything we do or make.
• Climate change is a compounding factor – it will aggravate our activities, processes and products
Myths, denial & excuses
It’s the fault of the countries like China
• By not accepting our own responsibilities, this is projecting the problem onto others
• We have exported much of our carbon intensive manufacturing to other economies
• We need to recognise our historical global carbon contributions
• Other countries have a right to develop
Myths, denial & excuses

Its not my problem – there is nothing I can do
• 40% of emissions come from the decisions we make as individuals
• Never doubt that a small group of people can change the world….it’s the only thing that ever has. Margaret Mead, Anthropologist)
• Be the change you want to see in the world (Gandhi, Lawyer)
Myths, denial & excuses

72
Communicating
the
Climate
Case

Let’s practice You are having a 2 minute talk with a specific person about climate change – write the script!
• Who are you talking to?
• How would you start?
• What might they say back?
• An easy question and a hard question?

• Develop/finalise your script.
• Into groups of three - two actors and one member of the audience.
• Take turns till all the scripts have been read.
• Feedback within group - what worked well?
• Feedback to everyone o What did you find difficult?
o What are you going to practice?

Marketing Communications
Scottish Government Climate Change Behaviours Segmentation Tool. 1. Wealthy selectively engaged
2. Busy family recyclers
3. Professionals with green habits
4. Rural with good intentions
5. Modest income, disengaged families
6. Engaged younger city dwellers
7. Renters under pressure
8. Senior waste watchers
9. Struggling singles with other priorities

Return on communication investment
Intensity of communication Numbers reached
Level of impact
Minimum – leaflets, posters, mail-outs, etc.
1,000’s Low
Medium – events, newsletters, training, etc.
100’s Medium
Maximum - small groups meeting regularly, one-to-one discussions, individual support at home, etc.
10’s High
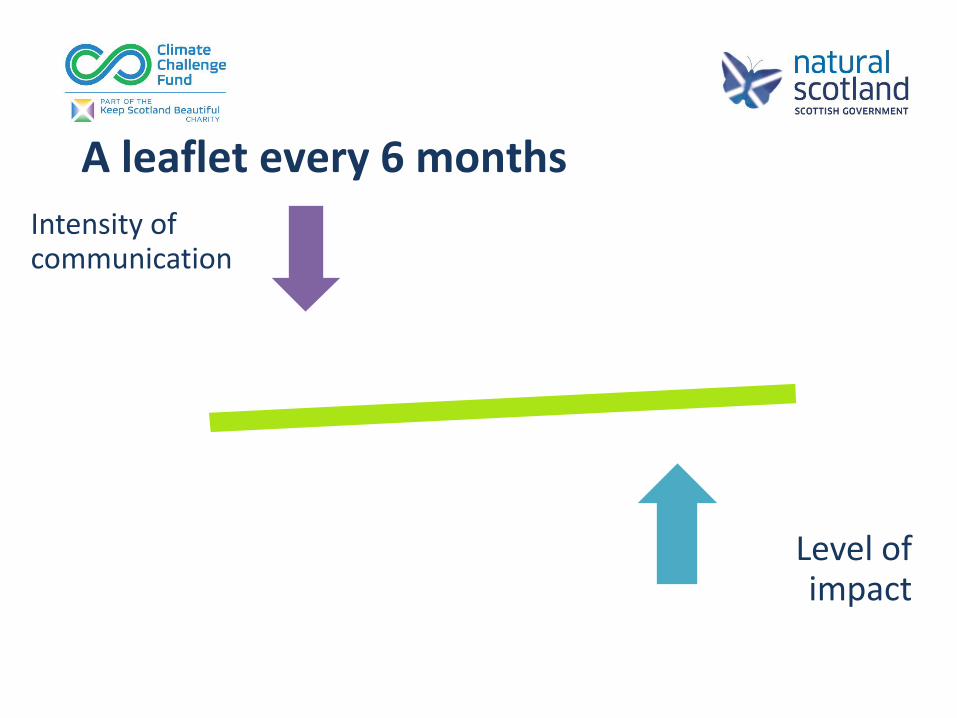
A leaflet every 6 months
Intensity of communication
Level of impact

Regular & frequent conversations Intensity of communication
Level of impact

Those not aware of your project YET
Spheres of influence
Those aware of your project
Those already involved in your project
Core staff & volunteers

What causes people to change their behaviour?
• Because of information and facts?
• To do the ‘right thing’?
• Because it is the easy thing?
• To do what other people are doing, to fit in?
• Because it will save them money?
• Because they are scared?
• Because people have told them to do it?
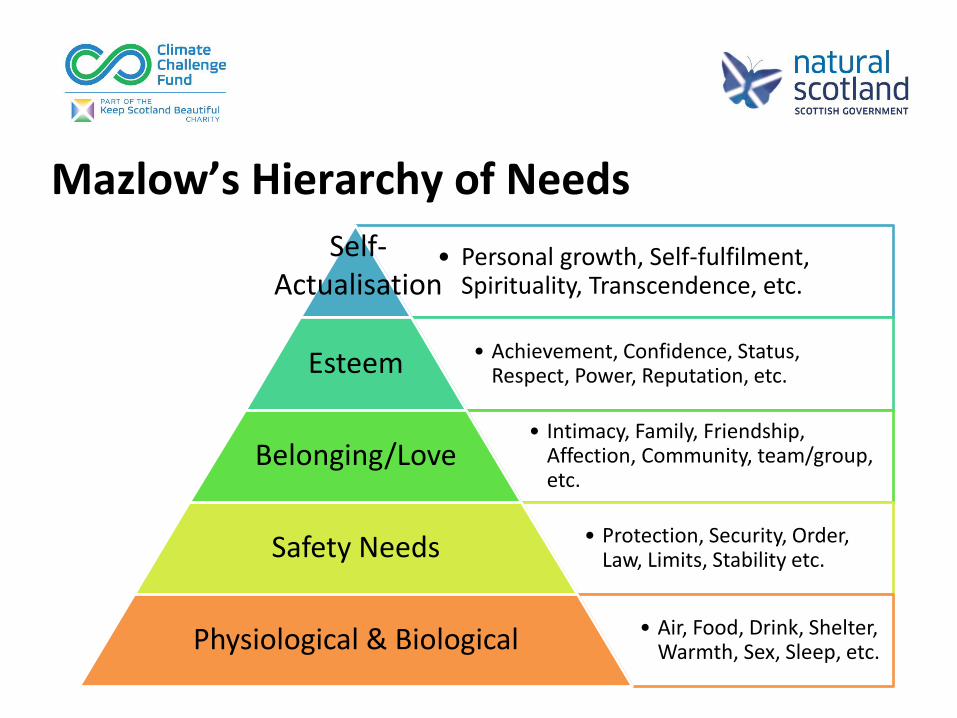
Mazlow’s Hierarchy of Needs
• Personal growth, Self-fulfilment, Spirituality, Transcendence, etc.
• Achievement, Confidence, Status, Respect, Power, Reputation, etc. Esteem
• Intimacy, Family, Friendship, Affection, Community, team/group, etc.
Belonging/Love
• Protection, Security, Order, Law, Limits, Stability etc. Safety Needs
• Air, Food, Drink, Shelter, Warmth, Sex, Sleep, etc. Physiological & Biological
Self-Actualisation
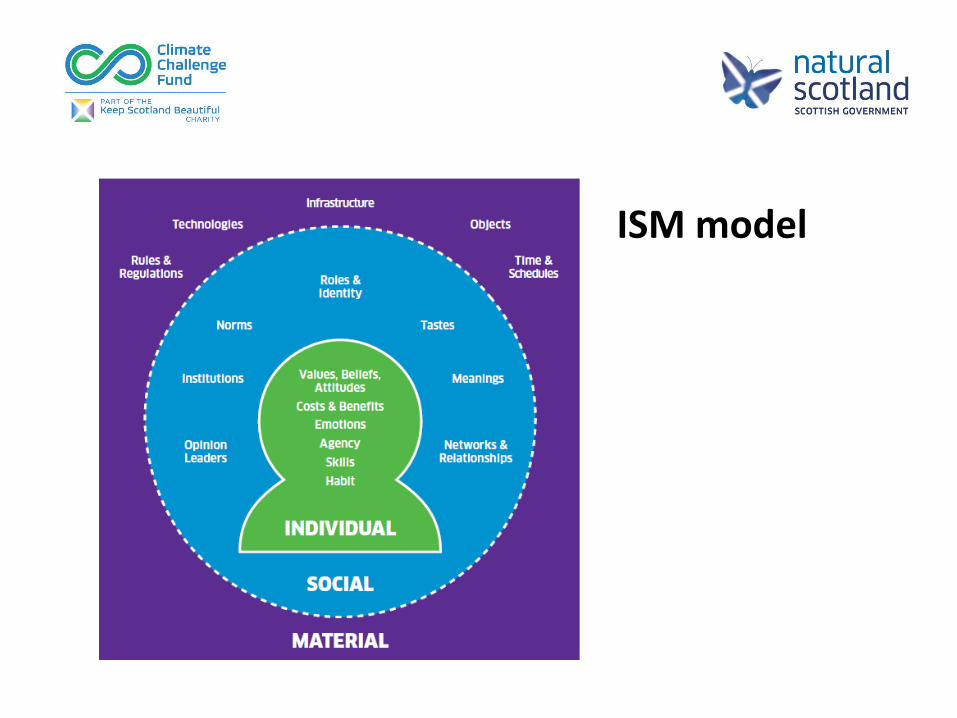
ISM model
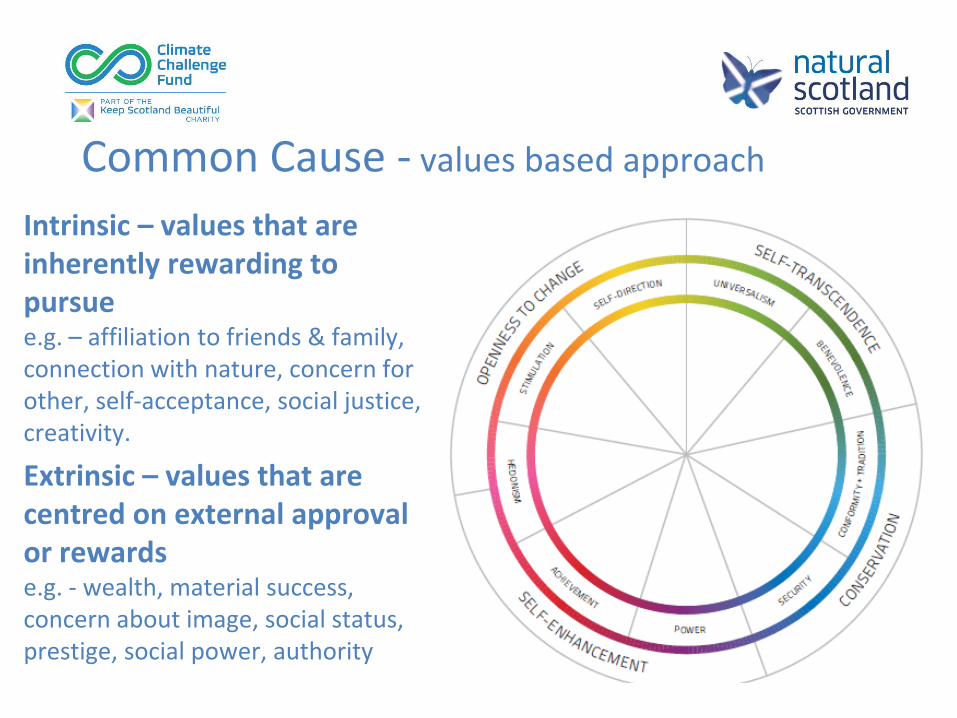
Common Cause - values based approach
Intrinsic – values that are inherently rewarding to pursue e.g. – affiliation to friends & family, connection with nature, concern for other, self-acceptance, social justice, creativity.
Extrinsic – values that are centred on external approval or rewards e.g. - wealth, material success, concern about image, social status, prestige, social power, authority

The Climate Pledge –
Why & What? Why • To encourage communities to be explicit about their
activities. • So groups can be part of something bigger. • To build the legacy for the CCF. What • Three general statements which all projects agree to. • More specific activities and aspirations, which are set by
projects to suit their own circumstances. • Invitation to organisations to sign the Pledge, then report
on progress regularly.

The Climate Pledge
three general statements We will take active steps to reduce our greenhouse gas emissions wherever possible, collectively and individually. We will tell people what we are doing and why we are doing it. We will explore other actions we can take to address climate change.

Your own activities and
aspirations
Specific to your project and your community, and reflecting local interests and opportunities. For example:-
• Cut the use of peat based compost at your allotments
• All board members walk or cycle to meetings
• Buy reconditioned computers
• Stop using throw away plates and cups
The Climate Pledge Process
• Invitation from Keep Scotland Beautiful to your
community group to take the Pledge online at
http://www.keepscotlandbeautiful.org/takethepledge
• You’ll be posted a personalised A3 Pledge Certificate
that a Board member or authorised signatory should
sign.
• We’d love to hear what specific project activities and
aspirations you have adopted
• How will your board receive the invitation?
• What project specific activities or aspirations might you include?
• How you might promote the pledge to your community.
• Discussion about ideas, challenges, approaches and solutions.
Discussion

Tel
• 01786 471333
Web
• www.keepscotlandbeautiful.org/ccf
• Climate Challenge Fund Facebook group
Twitter • @KSBScotland #ClimateChallengeFund
Thank you