Climate Chage Impact on Tanguar Haor
28
PRESENTED BY KAMRUL ISLAM SAJIB INTEKHAB ALAM ANAMUL HAQUE MEHEDI HASAN A Case Study on Climate Change Impact on the Livelihoods of the People in Tanguar Haor
-
Upload
kisajib -
Category
Environment
-
view
253 -
download
4
Transcript of Climate Chage Impact on Tanguar Haor
PRESENTED BY
KAMRUL ISLAM SAJIB
INTEKHAB ALAM
ANAMUL HAQUE
MEHEDI HASAN
A Case Study on Climate Change Impact on the Livelihoods of the
People in Tanguar Haor
Overview
Objective of Study
Haors of Bangladesh
About Tanguar Haor
Climate change, causes & vulnerability
Analysis of climate change parameter
Understanding on livelihood of Tanguar Haor people due to climatechange
Recommendation
Limitations
Objective of Study
Analysis of major climate change parameters
Climate change impacts on agriculture, fisheries andseverity of flash flood, cyclone, drought, and rivererosion etc.
Understanding on livelihood of Haor people due toclimate change
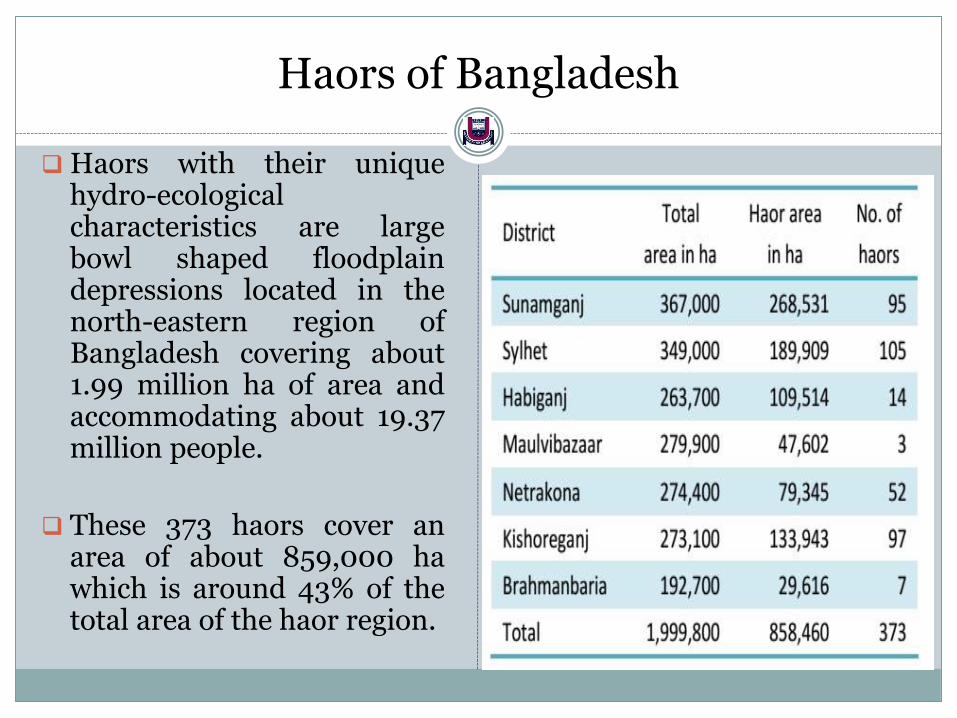
Haors of Bangladesh
Haors with their uniquehydro-ecologicalcharacteristics are largebowl shaped floodplaindepressions located in thenorth-eastern region ofBangladesh covering about1.99 million ha of area andaccommodating about 19.37million people.
These 373 haors cover anarea of about 859,000 hawhich is around 43% of thetotal area of the haor region.
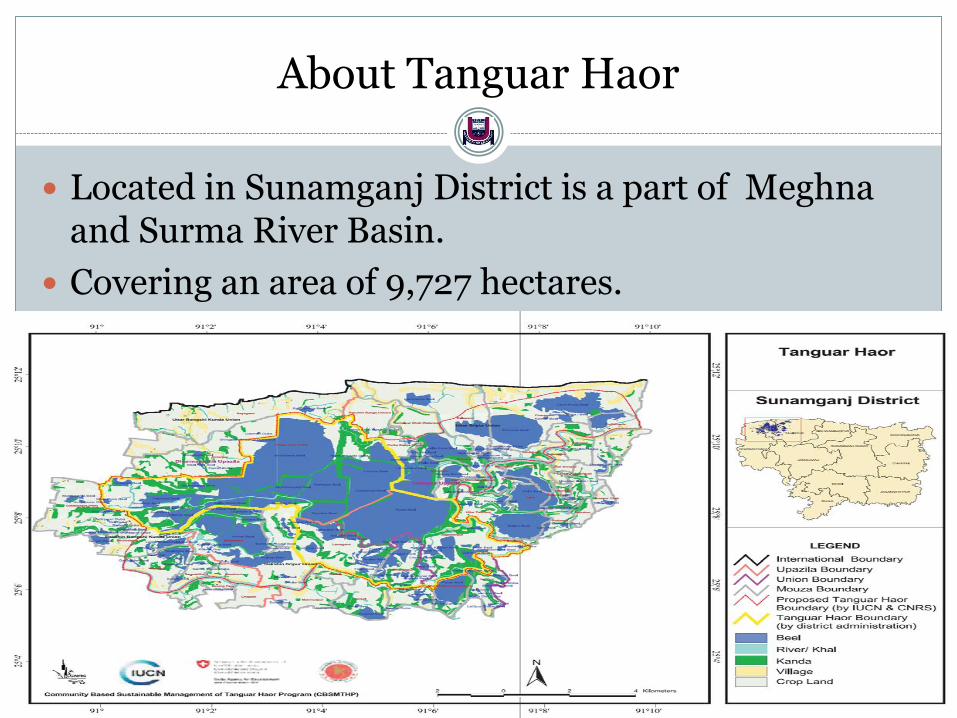
About Tanguar Haor
Located in Sunamganj District is a part of Meghnaand Surma River Basin.
Covering an area of 9,727 hectares.

About Tanguar Haor (cont.)
Tanguar haor exhibits a unique wetland ecosystem.
Considering its ecological importance it has beendeclared as the 2nd Ramsar site of Bangladesh in2000.
The swamp forest land of the haor is another uniqueecological feature of the haor ecology.
It plays an important role in fish production as itfunctions as a 'mother fishery' for the country.

Climate Change
A change in the state of the climate that can beidentified (e.g., by using statistical tests) by changesin the mean and/or the variability of its propertiesand that persists for an extended period, typicallydecades or longer.
Source: IPCC

Causes of climate change
Natural causes
a. Volcanic activity
b. Solar output
Human causes
a. Burning of fossil fuel
b. Conversion of land
c. Greenhouse effect ( co2, CH4, N2O, CFC)
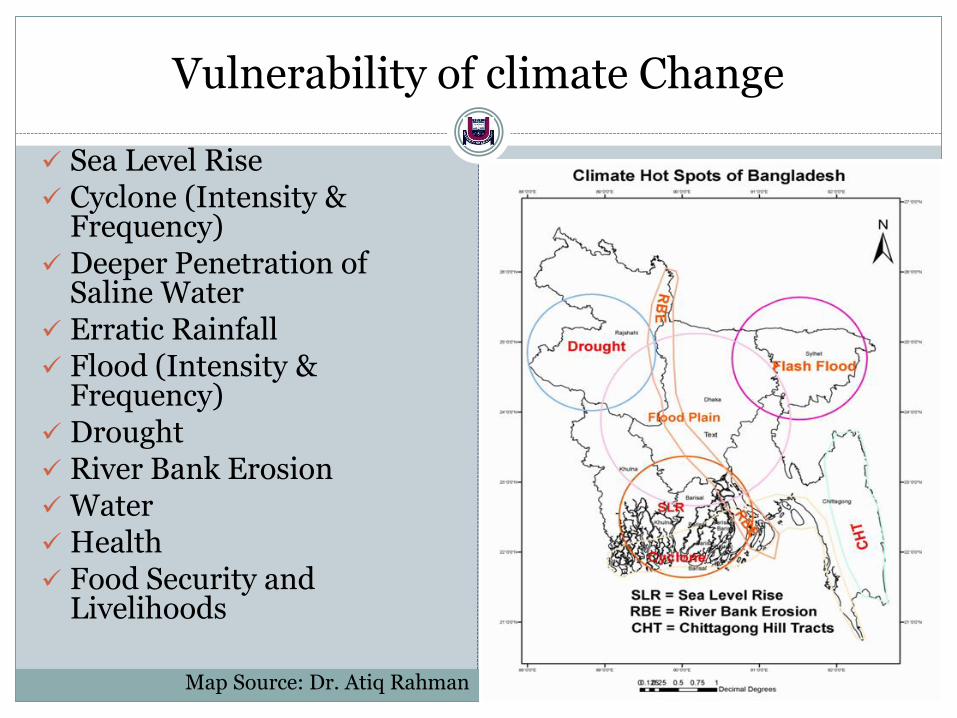
Vulnerability of climate Change
Sea Level Rise Cyclone (Intensity &
Frequency) Deeper Penetration of
Saline Water Erratic Rainfall Flood (Intensity &
Frequency) Drought River Bank Erosion Water Health Food Security and
Livelihoods
Map Source: Dr. Atiq Rahman

Analysis of climate change parameters
Rainfall (1980-2008)
Temperature (1981-2010)
Evaporation (2007-2010)
Water level (1981-2010)
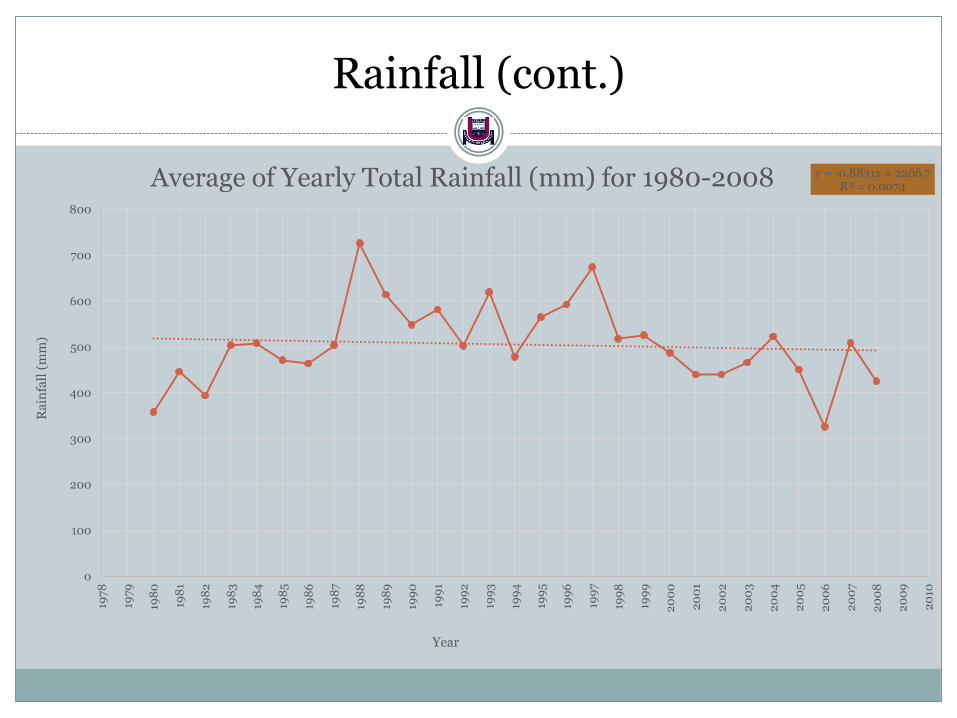
Rainfall (cont.)
y = -0.8831x + 2266.7R² = 0.0074
0
100
200
300
400
500
600
700
800
197
8
197
9
198
0
198
1
198
2
198
3
198
4
198
5
198
6
198
7
198
8
198
9
199
0
199
1
199
2
199
3
199
4
199
5
199
6
199
7
199
8
199
9
20
00
20
01
20
02
20
03
20
04
20
05
20
06
20
07
20
08
20
09
20
10
Ra
infa
ll (
mm
)
Year
Average of Yearly Total Rainfall (mm) for 1980-2008
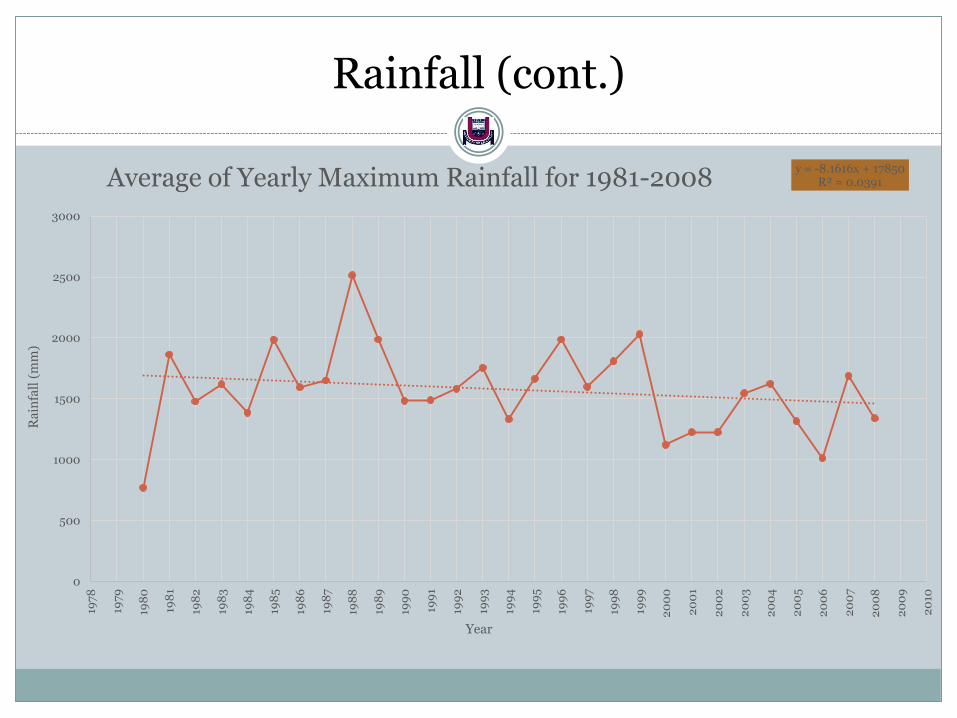
Rainfall (cont.)
y = -8.1616x + 17850R² = 0.0391
0
500
1000
1500
2000
2500
3000
197
8
197
9
198
0
198
1
198
2
198
3
198
4
198
5
198
6
198
7
198
8
198
9
199
0
199
1
199
2
199
3
199
4
199
5
199
6
199
7
199
8
199
9
20
00
20
01
20
02
20
03
20
04
20
05
20
06
20
07
20
08
20
09
20
10
Ra
infa
ll (
mm
)
Year
Average of Yearly Maximum Rainfall for 1981-2008
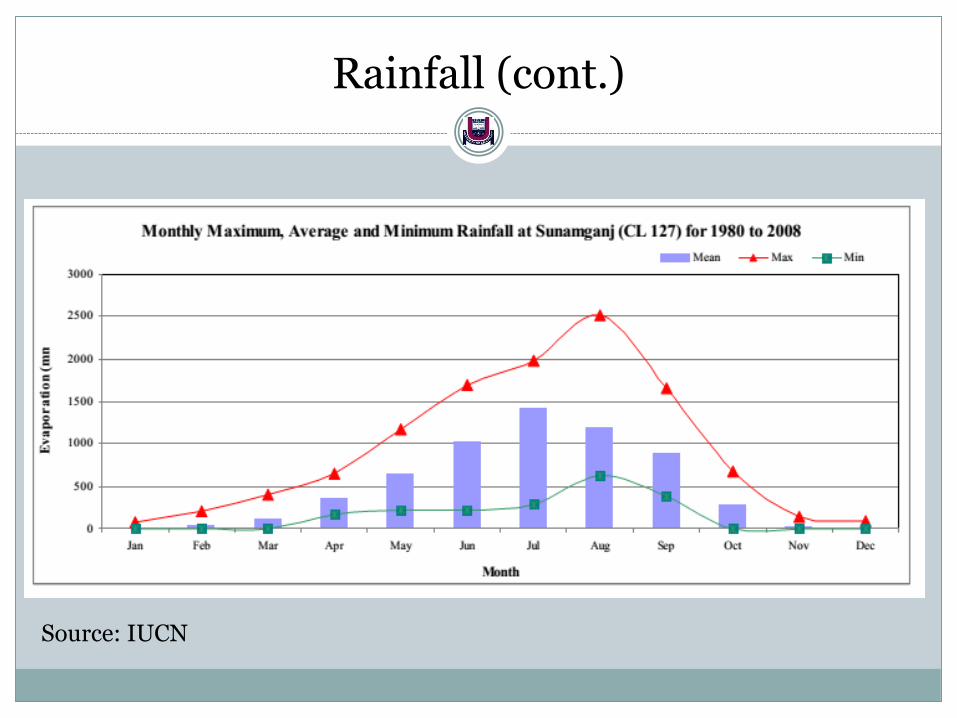
Rainfall (cont.)
Source: IUCN

Temperature
y = 0.0478x - 61.726R² = 0.4945
32.5
33
33.5
34
34.5
35
197
9
198
0
198
1
198
2
198
3
198
4
198
5
198
6
198
7
198
8
198
9
199
0
199
1
199
2
199
3
199
4
199
5
199
6
199
7
199
8
199
9
20
00
20
01
20
02
20
03
20
04
20
05
20
06
20
07
20
08
20
09
20
10
20
11
20
12
Ma
xim
um
Tem
per
atu
re i
n d
egre
e ce
lsiu
s
Year
Average of Maximum Temperature at Sylhet for 1981-2010

Temperature (cont.)
y = 0.0497x - 81.705R² = 0.5053
15.5
16
16.5
17
17.5
18
18.5
197
9
198
0
198
1
198
2
198
3
198
4
198
5
198
6
198
7
198
8
198
9
199
0
199
1
199
2
199
3
199
4
199
5
199
6
199
7
199
8
199
9
20
00
20
01
20
02
20
03
20
04
20
05
20
06
20
07
20
08
20
09
20
10
20
11
20
12
Min
imu
m T
emp
era
ture
in
deg
ree
cels
ius
Year
Average of Minimum Temperature at Sylhet for 1981-2010

Temperature (cont.)
Source: IUCN
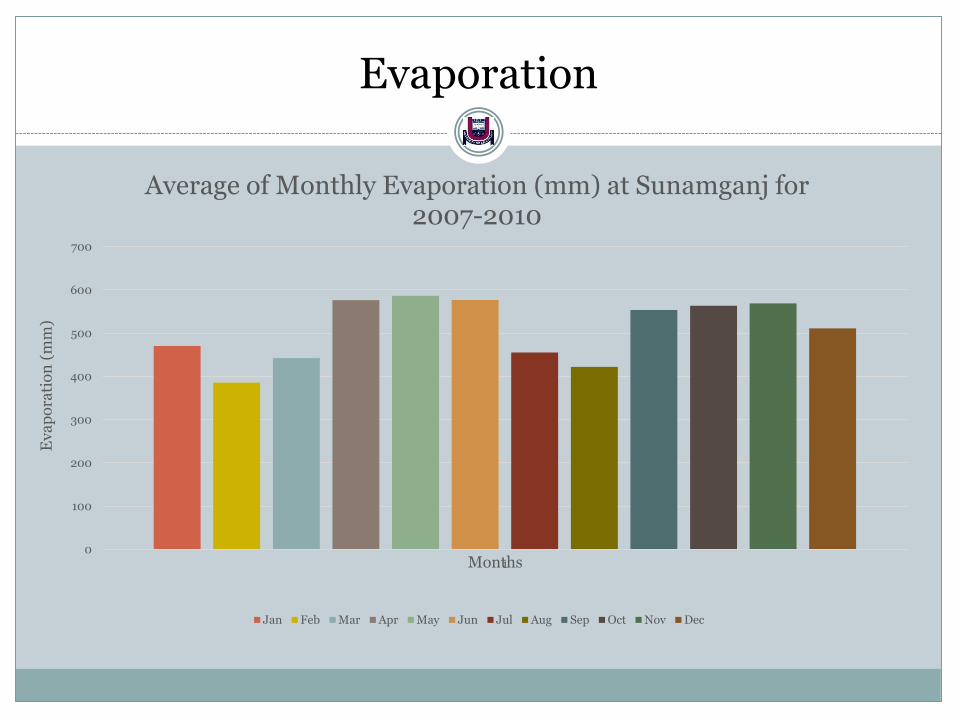
Evaporation
0
100
200
300
400
500
600
700
1
Ev
ap
ora
tio
n (
mm
)
Months
Average of Monthly Evaporation (mm) at Sunamganj for 2007-2010
Jan Feb Mar Apr May Jun Jul Aug Sep Oct Nov Dec

Evaporation (cont.)
Source: IUCN

Water Level
0
1
2
3
4
5
6
7
8
9
0 1 2 3 4 5 6 7 8 9 10 11 12
Wa
ter
Lev
el (
m)
Months
Hydrograph of Surma River at Sunamganj for 1981-2010

Water Level (cont.)
y = -0.008x + 21.195R² = 0.0727
0
1
2
3
4
5
6
7
8
197
9
198
0
198
1
198
2
198
3
198
4
198
5
198
6
198
7
198
8
198
9
199
0
199
1
199
2
199
3
199
4
199
5
199
6
199
7
199
8
199
9
20
00
20
01
20
02
20
03
20
04
20
05
20
06
20
07
20
08
20
09
20
10
20
11
20
12
Wa
ter
Lev
el (
m)
Year
Yearly Average of Mean Daily Water Levelof Surma river at Sunamganj

Our Questionnaire Survey

How their livelihoods affects
Flash flood (spring) Land erosion Norwesters, Tornadoes (early summer & rainy season) Single crop throughout a year Remain under water for several months each year Safe drinking water Seasonal unemployment Emigration Demand for embankment Fishing prohibition Dependency of haor ecosystem Decrease in rice production

“People from outside consider it a natural beauty and many inside think it as a trap of nature!”

“People from outside consider it a natural beauty and many inside think it as a trap of nature!”

Recommendation
Early warning system for flash flood
Building submersible embankment to control pre-monsoon flood
Improve rice production
More jobs for local people
Afforestation

Limitations
Couldn’t consider seasonal variation
Some missing data
Four years of evaporation Data
Considered only three villages of two union for questionnaire