Climate and Green Growth Public Expenditure and Investment ...
102
Climate and Green Growth Public Expenditure and Investment Review in the Mekong Delta (CPEIR-Mekong)
Transcript of Climate and Green Growth Public Expenditure and Investment ...

Climate and Green Growth Public Expenditure and Investment Review in the Mekong Delta (CPEIR-Mekong)Project “Strengthening Capacity and
Institutional Reform for Green Growth and Sustainable Development
in Vietnam” and”Integrated Coastal Management Programme”

GOVERNMENT LEAD DEPARTMENT
Department of Science, Education, Natural Resources and Environment, Ministry of Planning and Investment (MPI)
IMPLEMENTING AGENCIES
Project ‘Strengthening Capacity and Institutional Reform for Green Growth and Sustainable Development in Vietnam’ (CIGG) supported by UNDP and USAID
Integrated Coastal Management Programme (ICMP) implemented by Deutsche Gesellschaft für Internationale Zusammenarbeit (GIZ)
FUNDING AGENCIES
United Nations Development Programme (UNDP)
United States Agency for International Development (USAID)
German Federal Ministry for Economic Cooperation and Development (BMZ)
Australian Department of Foreign Affairs and Trade (DFAT)
AUTHORS
Le Thanh Tung
Pham Thi Diep
Kit Nicholson
Tran Thi Mai Phuong

PAGE 1
ACKNOWLEDGEMENTS
We would like to thank the direction and coordination of the Department of Science, Education, Natural Resources and Environment - Ministry of Planning and Investment; the Project ‘Strengthening Capacity and Institutional Reform for Green Growth and Sustainable Development in Vietnam’ (CIGG), supported by UNDP and USAID; the Integrated Coastal Management Programme (ICMP), implemented by the Deutsche Gesellschaft für Internationale Zusammenarbeit (GIZ); and the Departments of Planning and Investment of 13 provinces in the Mekong Delta. Relevant departments of the provinces also provided support and valuable input and comments during the consultation meetings for the consultants.
We would like to specifically thank the following individuals for guiding and carrying out the research:
Dr. Pham Hoang Mai, Director General, Department of Science, Education, Natural Resources and Environment, MPI (DSENRE); MSc. Nguyen Tuan Anh (Deputy Director General of DSENRE) and MSc. Nguyen Thi Dieu Trinh (focal point for green growth and climate finance, DSENRE).
Research team: Mr. Le Thanh Tung (Consultant, Team leader of UNDP team), Ms. Pham Thi Diep (Consultant of UNDP team), Mr. Kit Nicholson (Consultant, Team leader of GIZ team), Ms Tran Thi Mai Phuong (Consultant for GIZ), Mr. Tran Cong Khanh (Consultant for GIZ), Ms Pham Phuong Thao (Consultant for GIZ).
The project was supervised by Mr. Jiri Dusik and Mr. Glenn Hodes (UNDP) and Ms. Silke Bommersheim and Ms. Pham Minh Anh (GIZ).
In addition, we would like to thank Ms. Bui Hong Phuong, Mr. Le Duc Chung, all the staff of the “Strengthening Capacity and Institutional Reform for Green Growth and Sustainable Development in Vietnam” project and all involved GIZ Vietnam staff for their comments and support to this study.
The views expressed in this research reflect the opinions of the consultants and do not reflect the views of the Government of Vietnam, the Ministry of Planning and Investment, the UNDP, GIZ and the project sponsors.
Representative of CIGG Project Management Unit
NGUYEN TUAN ANH
Department of Science, Education, Natural Resources and Environment - MPI
Deputy National Project Director

PAGE 2
CONTENTS
EXECUTIVE SUMMARY 9
INTRODUCTION 131.1 Context 141.2 Climate change response in the Mekong Delta 151.3 Previous climate public expenditure and investment reviews in Vietnam 181.4 Aim and structure of this report 20
POLICIES AND INSTITUTION 212.1 Policies on climate change response and green growth 222.2 Coordination of climate change response and green growth 232.3 Target programs related to climate change and green growth 262.4 The planning and budgeting cycle 29
METHODOLOGY AND SCOPE 333.1 MPI Guidelines 343.2 Interpretation of the MPI Guidelines by this assignment 373.3 Steps and methodology of this assignment 38
3.3.1 Data collection 383.3.2 Data processing 39

PAGE 3
REVIEW OF CC&GG PUBLIC INVESTMENT IN THE MEKONG DELTA 41 4.1 An overview of CC&GG investment in the Mekong Delta 424.2 Comparison of CC&GG investment by province 454.3 Provincial highlights of CC&GG investment 504.4 The Mid-Term Investment Plan (2016-2020) 554.5 Expenditure per capita and as a % of GRDP 57
CONCLUSIONS AND RECOMMENDATIONS 59
BIBLIOGRAPHY 63
ANNEX: DESCRIPTION OF CC&GG EXPENDITURE BY PROVINCE 65A1.1 Can Tho 65A1.2 Hau Giang 68A1.3 Long An 70A1.4 Tien Giang 72A1.5 Ben Tre 74A1.6 Tra Vinh 76A1.7 Vinh Long 79A1.8 Dong Thap 81A1.9 An Giang 84A1.10 Bac Lieu 87A1.11 Ca Mau 90A1.12 Kien Giang 93A1.13 Soc Trang 96

PAGE 4
LIST OF TABLES
Table 1. Provincial action plans on response to climate change in the MD 17
Table 2. List of target programs for period 2016-2020 27
Table 3. Annexes of the MTIPs 31
Table 4. Budget preparation cycle at the provincial level 32
Table 5. CC&GG investment themes, as defined in Appendix 1 of the MPI Guidelines 35
Table 6. Financial sources at central and local level 38
Table 7. Data collected from 13 provinces 39
Table 8. CC&GG expenditures in 2 years (2016-2017) in 13 MD provinces 44
Table 9. Number of CC&GG projects, CC&GG expenditures by province in 2015-2017 45
Table 10. CC&GG investment by source of funding by province 46
Table 11. Actual annual CC&GG investment in 2016-2017 compared with planned CC&GG investment 55
in the MTIP 55
Table 12. CC&GG expenditure of other South and Southeast Asian countries 58
Table 13. Top 10 projects with the highest expenditure in 2 years (2016 & 2017) of Can Tho 66
Table 14. Funding sources for the 10 biggest CC&GG projects in 2 years (2016 & 2017) in Can Tho 67
Table 15. Top 10 projects with the highest expenditure in 2 years (2016 & 2017) of Hau Giang 69
Table 16. Top 10 projects with the highest expenditure in 2 years (2016 & 2017) of Long An 71
Table 17. Fund allocation for the 10 biggest expenditure projects in 2 years (2016 & 2017) of Long An 71
Table 18. Top 10 projects with the highest expenditure in 2 years (2016 & 2017) of Tien Giang 73
Table 19. Fund allocation for the 10 biggest expenditure projects in 2 years (2016 & 2017) of Tien Giang 73
Table 20. Top 10 projects with the highest expenditure in 2 years (2016 & 2017)of Ben Tre 75
Table 21. Top 10 projects with the highest expenditure in 2 years (2016 & 2017) of Tra Vinh 77
Table 22. Fund allocation for the 10 biggest expenditure projects in 2 years (2016 & 2017) of Tra Vinh 78
Table 23. Top 10 projects with the highest expenditure in 2 years (2016 & 2017) of Vinh Long 80
Table 24. Top 10 projects with the highest expenditure in 2 years (2016 & 2017) of Dong Thap 82
Table 25. Fund allocation for the 10 biggest expenditure projects in 2 years (2016 & 2017) of Dong Thap 83
Table 26. Top 10 projects with the highest expenditure in 2 years (2016 & 2017) of An Giang 85
Table 27. Top 10 projects with the highest expenditure in 2 years (2016 & 2017) of Bac Lieu 88
Table 28. Top 10 projects with the highest expenditure in 2 years (2016 & 2017) of Ca Mau 91
Table 29. Top 10 projects with the highest expenditure in 2 years (2016 & 2017) of Kien Giang 94
Table 30. Top 10 projects with the highest expenditure in 2 years (2016 & 2017) of Soc Trang 97

PAGE 5
LIST OF FIGURES
Figure 1. Thematic Focus of CC&GG Investment in the Provincial MTIPs 10
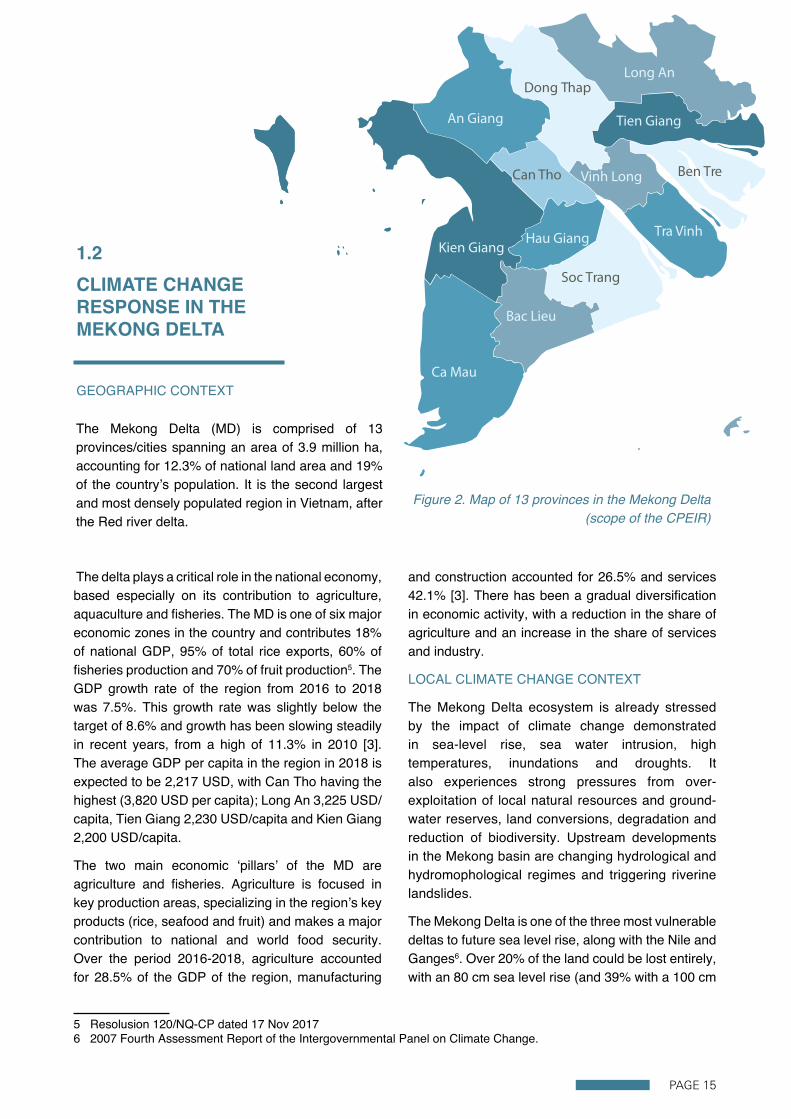
Figure 2. Map of 13 provinces in the Mekong Delta (scope of the CPEIR) 15
Figure 3. Organizational chart of the National Committee for Climate Change 24
Figure 4. Procedure for identification and classification of public investment and expenditures in climate change and green growth 34
Figure 5. CC&GG investment in the Mekong Delta in 2015 (billion VND) 42
Figure 7. CC&GG investment in the MD in 2016 and 2017 by theme 43
Figure 6. Investment share by theme, all provinces in 2015 43
Figure 8. CC&GG investment share by theme, all provinces in 2016 and 2017 44
Figure 9. CC&GG investment and MPI Decisions by Province (VND bill) 47
Figure 10. Balance between mitigation and adaptation by province, in 2016 and 2017 48
Figure 11. Share of CC&GG expenditure in 2016 & 2017 by theme 49
Figure 12. Breakdown of CC&GG investment in 2016 and 2017 50
Figure 13. CC&GG actual expenditure in 2016& 2017 compared to CC&GG budget plan
in MTIP 2016-2020 56
Figure 14. CC&GG investment plan in MTIP 2016-2020 of provinces by theme 57
Figure 15. CC&GG Expenditure 2016 as% of GRDP, % of total budget, and per capita 58
Figure 16. CC&GG expenditure of Can Tho (2016-2017) by theme 65
Figure 17. CC&GG investment in Can Tho by top themes: actual for 2016 & 2017 and MTIP 2016-2020 66
Figure 18. CC&GG expenditure of Hau Giang (2016-2017) by theme 68
Figure 19. CC&GG expenditure in 2 years (2016 & 2017) and CC&GG investment plan in MTIP 2016-2020 of Hau Giang by top themes 69
Figure 20. CC&GG expenditure of Long An (2016-2017) by theme 70
Figure 21. CC&GG expenditure in 2 years (2016 & 2017) and CC&GG investment plan in MTIP 2016-2020 of Long An by theme 70
Figure 22. CC&GG expenditure of Tien Giang (2016-2017) by theme 72
Figure 23. CC&GG expenditure in 2 years (2016 & 2017) and CC&GG investment plan in MTIP 2016-2020 of Tien Giang by theme 72
Figure 24. CC&GG expenditure of Ben Tre (2016-2017) by theme 74
Figure 25. CC&GG expenditure in 2 years (2016 & 2017) and CC&GG investment plan in MTIP 2016-2020 of Ben Tre by theme 75

PAGE 6
Figure 26. CC&GG expenditure of Tra Vinh (2016-2017) by theme 76
Figure 27. CC&GG expenditure in 2 years (2016 & 2017) and CC&GG investment plan in MTIP 2016-2020 of Tra Vinh by theme 77
Figure 28. CC&GG expenditure of Vinh Long (2016-2017) by theme 79
Figure 29. CC&GG expenditure in 2 years (2016 & 2017) and CC&GG investment plan in MTIP 2016-2020 of Vinh Long by theme 80
Figure 30. CC&GG expenditure of Dong Thap (2016-2017) by theme 81
Figure 31. CC&GG expenditure in 2 years (2016 & 2017) and CC&GG investment plan in MTIP 2016-2020 of Dong Thap by theme 82
Figure 32. CC&GG expenditure of An Giang (2016-2017) by theme 84
Figure 33. CC&GG expenditure in 2 years (2016 & 2017) and CC&GG investment plan in MTIP 2016-2020 of An Giang by theme 85
Figure 34. CC&GG expenditure of Bac Lieu (2016-2017) by theme 87
Figure 35. CC&GG expenditure in 2 years (2016 & 2017) and CC&GG investment plan in MTIP 2016-2020 of Bac Lieu by theme 88
Figure 36. CC&GG expenditure of Ca Mau (2016-2017) by theme 90
Figure 37. CC&GG expenditure in 2 years (2016 & 2017) and CC&GG investment plan in MTIP 2016-2020 of Ca Mau by theme 91
Figure 38. CC&GG expenditure of Kien Giang (2016-2017) by theme 93
Figure 39. CC&GG expenditure in 2 years (2016 & 2017) and CC&GG investment plan in MTIP 2016-2020 of Kien Giang by theme 94
Figure 40. CC&GG expenditure of Soc Trang (2016-2017) by theme 96
Figure 41. CC&GG expenditure in 2 years (2016 & 2017) and CC&GG investment plan in MTIP 2016-2020 of Soc Trang by theme 97

PAGE 7
CBF Central budget fund
CC Climate Change
CIGG Project Strengthening Capacity and Institutional Reform for Green Growth and Sustainable Development in Vietnam
CPEIR Climate public expenditure and Institutional Review
DoNRE Provincial Department of Natural Resources and Environment
DPI Provincial Department of Planning and Investment
DRR Disaster risks reduction
EE Energy Efficiency
FDI Foreign Direct Investment
FS Feasibility Study
GG Green Growth
GIZ Deutsche Gesellschaft für Internationale Zusammenarbeit (German Development Cooperation)
GL Government Loans
ICMP The Integrated Coastal Management Programe
INDC Intended Nationally Determined Contributions
LF Lottery Fund
LRF Local/provincial revenue funds
LU Land Use (Tax)
MARD Ministry of Agriculture and Rural Development
MD Mekong Delta
MDP Mekong Delta Plan
MoF Ministry of Finance
MoND Ministry of National Defense
ABBREVIATIONS

PAGE 8
MoNRE Ministry of Natural Resources and Environment
MoPS Ministry of public security
MPI Ministry of Planning and Investment
MTIPs Medium-Term Public Investment Plans
NAPCC National Action Plan on Climate Change
NAPGG National Action Plan on Green Growth
NSCC National Strategy on Climate Change
NSGG National Strategy on Green Growth
NTP National Target Program
ODA Official Development Assistance
PCEIR Private Climate Expenditures and Investments Review for Vietnam
GRDP Local/Provincial gross domestic product
PPC Provincial People's Committees
QD Decision
RE Renewable Energy
TP Target Program
TPCP Government bonds
UNDP United Nations Development Programe
USD United States Dollar
VND Vietnam Dong

PAGE 9
EXECUTIVE SUMMARY
This Climate Public Expenditure and Investment Review (CPEIR) for 13 provinces in the Mekong Delta pilots the use of the Guidelines on Classification of Public Investment for Climate Change and Green Growth (CC&GG)1 issued by the Ministry of Planning and Investment (MPI). The objectives of the CPEIR were: to pilot the MPI Guidelines; to present data on expenditure related to CC≫ to support the integration of CC&GG into planning and budgeting; and to support the monitoring and reporting tasks in Vietnam’s Plan for Implementation of the Paris Agreement.
The support for integration of CC&GG into planning and budgeting involves two key tasks. Firstly, the CPEIR presents trends in CC&GG investment which allows government to check that these trends are consistent with the priority given to CC&GG in national and sectoral policy and to adjust budgets to increase (or reduce) the priority given to CC&GG, if necessary. Secondly, the classification provides a framework within which the design and appraisal of investment can take CC&GG into account.
At present, about 30 countries in the world have undertaken a CPEIR, with a growing focus on the sub-national level. In Vietnam, the focus on the provincial level reflects the fact that many of the most important CC&GG investments are managed at the provincial level. The investment data used in the review has been compiled from two main sources: the Medium-Term Public Investment Plans (MTIPs) for 2016-2020 for each province2; and provincial capital reports on actual disbursement for 2015, 2016 and 2017. Other sources of evidence used in the assessment include: the Climate Change Action Plan; the Green Growth Action Plan; and various strategies and resolutions on sustainable development in the Mekong Delta.
In order to classify projects according to their contribution to CC&GG, the CPEIR relied mainly on project approval decisions and other project documents. However, these were sometimes
1 The guidelines have been officially issued in Decision 1085/QD-BKHDT dated 16 July, 2018. The study used the version applicable in late 2017. The substantial change was to allow reference to appendixes for adaptation/mitigation classification activity in Step 1.2 These are contained in various decisions and resolutions including: Decision Numbers 572/QD- BKHT dated 20/04/2017 for allocating MTIP 2016-2020; Decision 1178/QD-BKHDT on allocating MTIP 2016-2020 (including govern-met bonds) dated August 29th 2017; and Decision 1827/QD-BKHDT on allocating MTIP 2016-2020 (including govern-ment bond) dated 15/12/2017.
difficult to obtain and some projects were classified on the basis of their title and the knowledge of local officials. The data was provided by general planning departments; appraisal divisions of provincial departments of planning; and other departments and agencies in the Mekong Delta provinces.
FINDINGS
The classification of CC&GG investment follows the MPI Guidelines which classify investment according to 28 themes, each of which is divided further into sub-themes. Key findings on CC&GG investment over the period 2015-2017 and the MTIP for 2016-2020 include the following.
● Overall, the vast majority of actual CC&GG investment in all Mekong Delta provinces was devoted to adaptation. For the whole region, 95.3% of CC&GG investment was used for adaptation, with 1.1% for mitigation and 3.6% for both adaptation and mitigation. However, there is currently strong interest in cross-sectoral, inter-regional and multi-purpose projects in the Mekong Delta. This includes some important CC&GG themes that are likely to change the balance of future CC&GG investment, including: solar and wind power in coastal provinces (Ca Mau, Tien Giang ...); food processing; large-scale domestic water supply; multi-purpose irrigation and river bank protection; coastal protection from tides, sea level rise and salinity intrusion; fresh water supplies for production in coastal areas; hi-tech agriculture; water resource protection; and construction of seaports.
● With regard to plans for 2016-2020 period, the main planned CC&GG investments in the MTIP related to: sustainable urban development (30% of total CC&GG investment), sustainable transport (16%), irrigation (10%), agriculture (9%), water resources management (8%) and water supply (4%). These themes were present

PAGE 10
in most of the provinces although the balance of expenditure between themes varied greatly, as shown in the figure below. Coastal protection was important in coastal provinces (i.e. Ca Mau, Bac Lieu, Soc Trang and Kien Giang).
● Actual CC&GG investment in the delta during 2015-2017 predominantly focused on: sustainable urban development including urban flood protection (24% of total CC&GG investment), sustainable transport including roads (20%), irrigation (12%), water resources management and river strengthening (8%), agriculture (7%), coastal protection (7%) and water supply and drainage (6%). Ten further themes accounted for 15% of the total CC&GG investment.
● The thematic shares of actual CC&GG investment closely followed the planned CC&GG investment in the MTIP in 8 provinces, but the shares were markedly different in the other 5 provinces (Tien Giang, Hau Giang, Kien Giang, Soc Trang and
3 The 2015 national level CPEIR for five key ministries found that their CC&GG related expenditure was very roughly USD 200 million a year, confirming the expectation that CC&GG expenditure takes place mainly at the provincial level. However, the methods used in the two CPEIRs are not directly comparable, so this conclusion should be treated with caution.
Ca Mau). Differences between actual and MTIP thematic shares could be caused by changes in priority or by differences in the classification of large projects that contribute to several themes.
● Actual CC&GG investment per capita and as a share of total public expenditure varies considerably and is highest in Hau Giang, Ben Tre, Dong Thap, Tra Vinh, Soc Trang, Ca Mau and Bac Lieu. This is probably because these provinces have a high dependence on natural resources and are most vulnerable to climate change.
● Actual CC&GG investment in the Mekong Delta grew from 367 million USD in 2015 to 426 million USD in 20173. There was, however, a marked
Figure 1. Thematic Focus of CC&GG Investment in the Provincial MTIPs
100%
90%
80%
70%
60%
50%
40%
30%
20%
10%
0%
DRR
Other
Coastal
River
Fisheries
Water
Irrigation
Forestry
Agriculture
Waste
Transport
Urban
TIEN GIANG
HAU GIANG
BEN TRE
VINH LONG
CAN THO
DONG THAP
TRA VINH
LONG AN
KIEN GIANG
SOC TRANG
AN GIANG
CA MAU
BAC LIEU

PAGE 11
decrease in the number of projects (from 1402 to 825) suggesting that CC&GG projects were became larger. At the current rate of CC&GG investment, it will take about 16 years to reach the level of investment that MPI estimates is required in the region.
● The share of total annual public investment accounted for CC&GG investment fell from 33.3% in 2015 to 28.2% in 2017. It is not clear whether this reflects a deliberate policy or is the side-effect of policy changes driven primarily by routine development objectives. It could also be the result of changes in a few large projects that are not driven by policy prioritization.
● Actual CC&GG investment fell in 2017 compared to 2016 in 7 out of 13 provinces (Hau Giang, Ben Tre, Tra Vinh, Long An, Kien Giang, Soc Trang and Ca Mau), with the fall being over 40% in Hau Giang, Kien Giang and Long An. The other 6 provinces experienced an increase in CC&GG investment in 2017, including an increase of 151% in Can Tho (mainly from urban projects), 127% in Vinh Long (mainly from urban, irrigation and rivers); 44% in An Giang, 42% in Tien Giang and 27% in Dong Thap.
● The differences among provinces and over years were often strongly influenced by the startup or termination of larger projects and a longer time period would probably be required to draw conclusions about whether changes reflect real policy and priorities, rather than the more coincidental nature of the timing of large projects.
● The main sources of funding for CC&GG investment varied greatly between provinces and between years. The lottery was the largest source of funding in 6 provinces and the local budget was the largest in 6 provinces. ODA funding was relatively small and less than 10% in all but 3 provinces.
RECOMMENDATIONS
The study was successful in providing basic information and illustrating key patterns in CC&GG investment in recent years. However, there were a number of challenges that need to be addressed, including the following:
● Retrospective classification of investment is difficult because project documents are often not easily available, especially for projects that were started several years earlier. The MPI Guidelines would be easier to apply and more effective if they were applied immediately after the budget was approved.
● The most practical method of identifying CC&GG investment projects is to classify them according to whether they match any of the themes and sub-themes defined in appendixes 1 and 2 of the MPI Guidelines. The official version of the Guidelines issued in July 2018 made changes to allow reference to appendixes in classification step, which is consistent with this recommendation. Using keywords can help to identify CC&GG projects, but the number of keywords required is very broad when dealing with all themes and the evidence from keywords needs to be complemented by sensible judgement about the nature of a project, based on the project documents available.
● There are many projects that contribute to several themes. This applies in particular to projects involving water management that may include contributions to urban flood protection, roads, irrigation, drainage, coastal protection, river management and disaster risk reduction. The MPI Guidelines encourage these projects to be broken down into components, if possible, but the experience of this CPEIR suggests that this is rarely possible, either because it is not clear in project documents or because one activity contributes to several themes. The CPEIR took a practical approach and classified such projects according to the theme that seemed most central to the objectives of project. However, this may have exaggerated some of the patterns in expenditure between provinces and years, especially because some of these projects are very large. There is no easy solution to this challenge.
● Many projects contributed to more than one sub-theme, within a theme. These projects were normally classified under the ‘Other’ sub-theme within the theme, unless one sub-theme was clearly dominant.
● The MPI Guidelines are intended to apply to

PAGE 12
green growth as well as climate change but they currently do not include any themes that concern green growth and not climate change (e.g. pollution prevention, resource efficiency and, potentially, also lifestyles and consumption patterns). This confusion could be resolved either by removing the reference to green growth or expanding the number of themes to cover non-climate green growth themes.
IMPLICATIONS FOR FUTURE PLANNING
The MPI Guidelines have so far been piloted only for retrospective classification of already adopted budgetary plans (i.e. the Mid-Term Investment Plan for 2016-2020) and past actual expenditure. There are valuable opportunities for applying MPI Guidelines to classify expenditure in more timely manner, so that the information provided has a more direct influence on the budget process. The latest year analysed by this CPEIR is 2017 and the results will be available in time to influence the preparation of the 2020 budget (and the next MTIP). When the MPI Guidelines are operational, it should be possible to apply them in the first six months of the year so that they can influence the next year’s budget. For example, if they were applied to the 2019 budget in the first few months of 2019, they would be available to influence the preparation of the 2020 budget. Ultimately, the tables of CC&GG investment could be produced during the budget negotiations, so
that officials could see the implications of budget proposals for trends in CC&GG investment while the budget proposals were being assessed as suggested (see, for example, UNDP’s working paper on Climate Budget Tagging [1]. However, this would require the introduction of tags and/or scores in the budget software, so that CC&GG investment could be calculated automatically and presented as one of the tables included in the documents used for budget negotiation and approval. Some countries (e.g. Indonesia or Pakistan) are piloting such systems, but none is yet fully operational.
The classification of expenditure is useful in raising awareness about past and planned trends and patterns. However, to fully integrate CC&GG into planning and budgeting, it will be necessary to deepen the methodology to consider the effectiveness of CC&GG investment in delivering adaptation and/or mitigation and to apply these methods in the design, appraisal and approval of new projects. This will then allow governments to provide a structured and consistent estimate of the adaptation gap and, hence, to provide strategic guidance over the main options for closing that gap. The MPI Guidelines provide a framework that can be used to encourage the structured integration of CC&GG into existing investment appraisal at a level of detail that is appropriate for the scale of the investment and its importance for delivering adaptation, mitigation and/or green growth.
© GIZ

PAGE 13
INTRODUCTION
01
© GIZ

PAGE 14
1.1 CONTEXT
Climate change is a critical challenge for mankind and will have direct impacts on production, daily life and environment in all countries. Vietnam is listed as among the countries most vulnerable to climate change [1]. Climate change will affect highly populated urban centers and rural areas and will affect many important economic sectors (e.g. agriculture, marine industry, energy, transport and manufacturing) which function as key drivers of poverty reduction, food security, job creation and sustainable development.
Although the economy has been growing continuously in recent years, poor labor productivity and technological skills have resulted in a sharp increase in greenhouse gases (GHG). Over the period 1991 – 2012, GHG emissions in Vietnam have increased by 937%, compared with GDP growth of only 315% [2]. Official documents prepared for the Paris Agreement 2015 show that the total GHG emissions in Vietnam are expected to nearly triple for 2010 – 2030.
The Party and Government have initiated institutional and policy innovations to give a stronger focus on green growth (GG) and climate change (CC). This has involved incorporating CC&GG in strategies and action plans at all levels (i.e. national, ministerial, sectoral and local) and these have been actively implemented using domestic and international resources.
The Vietnamese government has launched many activities to deliver CC&GG investment, with concrete phased commitments and objectives. These include the following.
● For climate change, in December 2011, the Prime Minister issued a decision approving the National Strategy on Climate Change (NSCC) which identifies 10 central missions. In April 2016, Vietnam signed the Paris Agreement on climate change and defined its Nationally Determined Contributions (NDCs), which include a reduction in GHG emissions by 2030, compared with business as usual, of 13% with domestic financing and 28% with strong international support.
4 Resolution No. 73/NQ-CP dated 26/08/2016 on Approving National Target Program s for the period 2016-2020
● For green growth, in September 2012, the Vietnamese government issued the National Strategy on Green Growth (NSGG), with support from UNDP and other sponsors. The first strategic mission of the NSGG is to lessen the intensity of GHG emissions and promote clean and renewable energy sources. The NSGG specifies concrete phased objectives, including, for 2011 – 2020: reducing the intensity of GHG emissions by 8% - 10% over the period; reducing energy consumption per GDP (energy intensity) by 1.0% to 1.5% each year; and reducing GHG emissions in energy consumption activities by 10% to 20%, compared with the business as usual, with half this reduction funded from domestic sources and half from international sources.
● In August 2016, the government approved National Target Programs (NTPs) for the period 2016-2020, including the NTP on Climate Change Response and Green Growth4.
● The Ministry of Natural Resources and Environment (MoNRE) is tasked to lead on Climate Change and MPI is responsible for NSGG actions related to reducing the intensity of GHG emissions.
● In addition, the government is addressing the requirement under the Paris Agreement for member countries to ‘establish guidelines on the monitoring of climate change response investments and expenditures sourced both domestically and internationally, including from both public and private sectors’ and ‘establish a national scale resource allocation mechanism in climate change’.
Thus, there are many institutional and strategic initiatives in place. However, in order to achieve the NDC contributions, a major increase in funding will be required for almost all sectors, including from public and private investment.
PAGE 15
1.2 CLIMATE CHANGE RESPONSE IN THE MEKONG DELTA
GEOGRAPHIC CONTEXT
The Mekong Delta (MD) is comprised of 13 provinces/cities spanning an area of 3.9 million ha, accounting for 12.3% of national land area and 19% of the country’s population. It is the second largest and most densely populated region in Vietnam, after the Red river delta.
The delta plays a critical role in the national economy, based especially on its contribution to agriculture, aquaculture and fisheries. The MD is one of six major economic zones in the country and contributes 18% of national GDP, 95% of total rice exports, 60% of fisheries production and 70% of fruit production5. The GDP growth rate of the region from 2016 to 2018 was 7.5%. This growth rate was slightly below the target of 8.6% and growth has been slowing steadily in recent years, from a high of 11.3% in 2010 [3]. The average GDP per capita in the region in 2018 is expected to be 2,217 USD, with Can Tho having the highest (3,820 USD per capita); Long An 3,225 USD/capita, Tien Giang 2,230 USD/capita and Kien Giang 2,200 USD/capita.
The two main economic ‘pillars’ of the MD are agriculture and fisheries. Agriculture is focused in key production areas, specializing in the region’s key products (rice, seafood and fruit) and makes a major contribution to national and world food security. Over the period 2016-2018, agriculture accounted for 28.5% of the GDP of the region, manufacturing
5 Resolusion 120/NQ-CP dated 17 Nov 20176 2007 Fourth Assessment Report of the Intergovernmental Panel on Climate Change.
and construction accounted for 26.5% and services 42.1% [3]. There has been a gradual diversification in economic activity, with a reduction in the share of agriculture and an increase in the share of services and industry.
LOCAL CLIMATE CHANGE CONTEXT
The Mekong Delta ecosystem is already stressed by the impact of climate change demonstrated in sea-level rise, sea water intrusion, high temperatures, inundations and droughts. It also experiences strong pressures from over-exploitation of local natural resources and ground-water reserves, land conversions, degradation and reduction of biodiversity. Upstream developments in the Mekong basin are changing hydrological and hydromophological regimes and triggering riverine landslides.
The Mekong Delta is one of the three most vulnerable deltas to future sea level rise, along with the Nile and Ganges6. Over 20% of the land could be lost entirely, with an 80 cm sea level rise (and 39% with a 100 cm
Figure 2. Map of 13 provinces in the Mekong Delta (scope of the CPEIR)
Long An
Tien Giang
Vinh Long Ben Tre
Tra Vinh
Soc Trang
Bac Lieu
Ca Mau
Hau GiangKien Giang
An Giang
Dong Thap
Can Tho

PAGE 16
rise), with huge implications for livelihoods, not only in agriculture and fisheries but in all the supporting secondary and tertiary activities. The most severely affected provinces in terms of land loss due to sea level rise would be Hau Giang (81% with a 100cm rise) and Kien Giang (77%).
Sea water intrusion and dried and acid sulphate soil are also a serious problem. Historic data shows that, in the past, sea water intrusion only took place in coastal areas, but has, in the past decade, encroached up to 70 km into the main farming land in 2010 and 90 km in 2016. At present, there are approximately 2.1 million ha of soil impacted by sea water intrusion and 1.6 million ha of dried and acid sulphate soil. High atmospheric temperatures, abnormal droughts, inundations and typhoons are key drivers of these changes. In 2016 saline water intrusion in the MD caused a total loss of 17,000 billion VND and, in just the first 5 months of 2017, it caused a loss of 8,000 billion VND7. It is forecast that by 2030; about 45% of land area in the Mekong Delta will be contaminated with saline water, resulting in an estimated annual loss of 380,000 billion VND (17 billion USD).
Natural disasters will be even more dangerous than sea level rise for the Mekong Delta if no effective adaptation action is taken, especially against strong typhoons. In addition, river flows are containing less alluvium and coastline and riverine erosion are becoming more frequent8.
LOCAL CLIMATE CHANGE RESPONSES
All 13 provinces in the Mekong Delta have prepared and issued their own provincial action plans on climate change responses. These action plans are intended for the period 2011-2020 and divided into two phases, namely 2011-2015 and 2016-2020. They are prepared based on the following principles: sustainable development, evidence-based policy, sectoral and inter-sectoral balance, gender equality, and hunger eradication and poverty reduction. The provincial action plans identify a list of prioritized activities/projects to be implemented in response to climate change and sea level rise. Activities/projects are sorted by order of descending priorities based on their urgency, usefulness, feasibility, level of integration and sustainable development objectives. However, some experts have commented that the provincial action plans in response to climate change
7 MONRE, 12 Jan 2018: Climate resilience for the Mekong Delta starts from sustainable development (link)8 Le Quang Tri, Symposium on Land Management in Mekong Delta
do not cover multi-objectives, cross-region and inter-sectoral connectivity and have insufficient community participation. Details about provincial action plans on response to climate change are presented in below table.
© GIZ

PAGE 17
Table 1. Provincial action plans on response to climate change in the MD 9
9 The total estimated budget for climate change response activities.
NO. PROVINCE ISSUED BY DOCUMENT BUDGET
(BILLION VND)9
INVESTMENT CAPITAL STRUCTURE
1 An Giang 2010 Decision No. 2075/QD-UBND dated 4/11/2010
4,904.05 50% ODA, 30% central state budget, 10% local state budget, 10% enterprise and socialized capital
2 Bac Lieu 2012 Decision No. 2577/QD-UBND dated 26/10/2012
20,140.71 30% ODA, 50% central state budget, 20% local state budget and other social entities
3 Ben Tre 2011 Decision No. 1224/QD-UBND dated 27/5/2011
2,510.50 90% ODA and central state budget, 10% local state budget and other economic sectors
4 Ca Mau 2012 Decision No. 1350/QD-UBND dated 25/9/2012
5,706.80 98.4% ODA, 1.4% central state budget, 4% local state budget
5 Can Tho 2011 Decision No. 1334/QĐ-UBND dated 08/5/2015 and Plan No. 57/KH-UBND dated 17/7/2012
708.01 Investment capital is prepared for 2011-2015. It will be sourced from the international support, central state budget for use by the NTP on climate change and contributions made by enterprises and individuals
6 Dong Thap 2011 Decision No. 97/QĐ-UBND.HC, dated 19/01/2012
2,549.55 Of which, 66.75 billion VND is for 2011-2015 and 2482.8 billion VND for 2016-2020
7 Soc Trang 2011 Decision No. 182/QD-UBND dated 22/7/2011 and Decision No. 242/QD-UBND dated 2/11/2011
2,466.23 Of which, 2466.23 billion VND is for 2011-2015 and 127.9 billion VND for 2016-2020
8 Tra Vinh 2010 Decision No. 264/QD-UBND dated 11/2/2010
78.70 This investment capital is prepared for 2011-2015 and does not show capital structure
9 Kien Giang 2013 Decision No. 1342/QD-UBND dated 30/5/2013
17,652.60 50% ODA, 30% central state budget, 10% local state budget, 10% non-state budget sources and contributions by individuals
10 Vinh Long 2012 Decision No. 705/QĐ-UBND dated 26/4/2013
49,340.96 No data
11 Long An 2013 Decision No. 1674/QD-UBND dated 14/5/2013 and Decision No. 34/QD-UBND dated 06/01/2016
2,256.00 Of which, 1296 billion VND is for 2013-2015 and 960 billion VND for after 2015
12 Hau Giang 2011 Decision No. 1489/QD-UBND dated 16/9/2011
No data
13 Tien Giang 2012 Decision No. 3569/QD-UBND dated 31/12/2012
No data
Total (billion VND) 108,314.10

PAGE 18
According to statistics published by MPI, the Mekong Delta will need 153,000 billion VND to remedy climate change consequences, improve resilience and promote green growth10.
The provinces have all established their lists of prioritized projects for the period 2016-2020 with a focus on: i) growing and recovering coastal mangrove forests in order to provide soft dike protection against sea waves and sea water rise, increased absorption of CO2 and sustainable livelihoods for local residents; ii) building and upgrading fresh water supply systems for domestic uses, saline water control systems, fresh water reservoirs to provide water for irrigation given increasing drought and sea water intrusion; and iii) building and upgrading sea dikes and river banks where needed which may have direct and serious impact on production, human life and livelihoods.
Five provinces (Kien Giang, Hau Giang, Soc Trang, Bac Lieu and Ca Mau) have completed provincial action plans on green growth and these were presented at the workshop in November 2017, jointly organized by MPI and GIZ Vietnam (Macroeconomic Reforms/Green Growth programme and Integrated Coastal Management Programme -ICMP).
10 Dr. Pham Hoang Mai, Director of General Department of Natural Resources and Environment Education, Ministry of Planning and Investment at the discussion about the mechanism for mobilization, allocation and management needed to improve efficiency in using resources in the Mekong Delta in response to climate change, which took place on 26/9/2017 in Can Tho. 11 In Vietnam, the term CPEIR has been used to refer to a Climate Public Expenditure and Investment Review, which reflects the strong focus on investment and the leadership of the MPI. In other countries, the term CPEIR stands for Climate Public Expenditure and Institutional Review. In practice, the CPEIRs in Vietnam do cover institutional issues and the term CPEIR is thus used in the same sense as it is used in other countries.12 In Vietnam, policy concerns related to climate change are usually combined with green growth. In theory, this CPEIR covers both policy concerns, because the MPI Guidelines aim to cover both concerns, even though the CPEIR title does not explicitly refer to green growth. In practice, the MPI Guidelines do not cover some aspects of green growth that are not related to climate change (e.g. pollution and aspects of consumption).
1.3 PREVIOUS CLIMATE PUBLIC EXPENDITURE AND INVESTMENT REVIEWS IN VIETNAM
CLIMATE PUBLIC EXPENDITURE AND INSTITUTIONAL REVIEW (CPEIR11)
As part of the effort to maximize the efficient performance of CC&GG strategies and to mobilize available resources for CC&GG12, in April 2015, the Vietnamese government published a CPEIR, with support from the World Bank and UNDP [4], and became one of about 20 countries in the world have completed a CPEIR.
The 2015 CPEIR reviewed expenditure on climate change related policies that Vietnam implemented in the period 2010–2013 in five ministries: Ministry of Natural Resources and Environment (MoNRE), Ministry of Industry and Trade (MoIT), Ministry of Agriculture and Rural Development (MARD), Ministry of Construction (MoC) and Ministry of Transport (MoT). The CPEIR covered expenditure by the central government and three provinces (Bac Ninh, Quang Nam and An Giang).
The 2015 CPEIR suggested that CC&GG should be promoted in the state budget and provided information about readiness in scaling up such efforts as well as deepening the linkage between CC&GG and sectoral and provincial policies.
The 2015 CPEIR used a methodology that combined a ‘Typology of Climate Change Response Expenditure’ (TCCRE) and a Climate Change Relevance Score (CC%). The TCCRE defined three pillars (policy/governance, capacity and delivery) and divided these into 11 categories and 27 elements, linked to the NCCS and NSGG. The CC% used five categories of relevance (complete, high, medium, low and very low) with associated scores from 1%

PAGE 19
to 100%13. The CPEIR provides the first insights into climate change public expenditure, with the following general conclusions:
● CC&GG expenditure incurred by the five key central government ministries was between 170 – 220 million USD per year in the period 2010 – 2013. It declined in 2011 and 2012 and then recovered in 2013 to a level that was close to the 2010 level.
● Adaptation accounted for 88% of CC&GG expenditure, with 79% of the expenditure managed by MARD and 13% by MoT.
● Although CC&GG expenditure accounted for 15 – 20% of the total budget allocated to the five ministries, most of this expenditure is primarily related to development and makes indirect contributions to CC&GG (e.g. irrigation and transport facilities).
The 2015 CPEIR has been jointly updated by the CIGG project and other related projects with data available as of 2015 and published in April 2016. The updated CPEIR proposes that the resource mobilization mechanism should be reinforced to deliver public investment in CC&GG.
PRIVATE CLIMATE EXPENDITURE AND INVESTMENT REVIEW (PCEIR)
To obtain a clearer picture on private CC&GG investment, in December 2017, the CIGG project produced a Private Climate Expenditures and Investments Review (PCEIR) for the period 2010-2015 [5]. The PCEIR presents some key facts relating to private CC&GG investment, focusing mainly on GHG emission mitigation. It reviewed private investment in: Energy Efficiency (EE) (focusing on the four energy intensive industries of cement, steel, sugar and paper); and Renewable Energy (RE). The research covered stakeholders, financial instruments, the incentive policy framework, international sponsors’ contributions and public private partnership.
The PCEIR found that there was limited investment in EE. Although the four industries covered had good
13 Full relevance is given a score of 100% and is used for projects that have adaptation and/or mitigation (A/M) as the only objective or are dedicated to A/M (e.g. the NTP on CC). High relevance projects (75%-99%) have several objectives or expected outcomes, but the main objective is A/M. Medium relevance (50%-74%) have A/M as a secondary objective/outcome or are mixed projects with several inseparable activities partly delivering A/M. Low relevance (25%-49%) have indirect benefits related to A/M that are not clearly specified in objectives or outcomes. Very low relevance (1%-24%) have only implicit indirect or theoretical benefits related to A/M.14 The OECD-DAC methodology was used (Organisation for Economic Cooperation and Development and its Develop-ment Assistance Committee) for classifying climate expenditure.
opportunities for EE, private investments in EE was only 643 million USD. Projects related to EE in this period concentrated on ‘easy to achieve’ solutions with low investment costs and good opportunities for EE. However, such investment costs remain modest as compared with total opportunities and needs. To fully exploit the potential investments in EE in these sectors, more policy incentives will be required, such as progressive increases in energy sale and purchase prices and strict fulfillment of legal obligations regarding EE, which are already established in Vietnam.
Private investment in RE was over 3.4 billion USD and was mostly for small hydro power plant construction and operation. However, investment in small hydro power has recently been declining because most of the economically viable sites for hydro power development have been utilized. Currently, there is more interest in solar and wind power projects. Many of these projects have been registered and included in related plans, with expected installed capacity higher than those identified in the Renewable Energy Development Plan. This growth has been achieved despite various financial and technical challenges and a complex legal framework, which suggests that, if these challenges can be addressed, there is a good chance for the government to establish new and more ambitious targets for RE.
FIRST MEKONG DELTA CPEIR (2015)
Ca Mau Province, the most southern province in the Mekong Delta, was the first in Vietnam to be introduced to tracking climate change relevant expenditure with support from GIZ under ICMP14. The analysis used official budget documents, published online by the Ministry of Finance (MoF). However, only a very limited number of investment examples were showcased. As much of the investment documentation was not available, only a fraction of investment could be tagged.
In close cooperation with MPI, comprehensive progress was made, with support of GIZ, on climate-responsive budget classification for four provinces (Bac Lieu, Ca Mau, Soc Trang and Kien Giang)

PAGE 20
for the budget years 2013-201515. This showed that, during 2013-2015, three out of four provinces allocated more than 20% of their annual investment budget on measures against the impacts of climate change, mostly focusing on adaptation measures. The four provinces spent between USD 20-30 million per year for climate responsive investments, mostly for dykes, dyke protection and the prevention of salt water intrusion. 16
1.4 AIM AND STRUCTURE OF THIS REPORT
The previous CPEIRs revealed the need for a standard Vietnamese approach to the classification of CC&GG expenditure. This need is reinforced by the commitments of all countries under the Paris Agreement to establish guidelines for monitoring climate change related investment and expenditure. Building on the experience with CPEIRs in Vietnam, MPI developed ‘Guidelines on Classification of Public Investment for Climate Change and Green Growth’ during 2017 and officially issued in July 2018. The current CPEIR pilots the use of the MPI Guidelines in all the provinces of the Mekong Delta.
With the introduction of the MPI Guidelines, a training workshop on “Capacity building for public investment planning & expenditure management” was held in November 2017, with support from CIGG and GIZ. The workshop introduced the Guidelines to representatives from all 13 Mekong Delta provinces, and launched the CPEIR activities as a pilot for wider adoption.
This Mekong Delta CPEIR has the following immediate aims:
a) To verify and finalize a methodology for identification, classification and reporting on CC&GG public investment by MPI, to be applied at the provincial level.
b) To present data on CC&GG investment for each of 13 provinces and for the Mekong Delta as a whole.
c) To explore the potential for using the methods
15 The study applied a synthesized approach using both a UNDP driven Climate Public Expenditure and Investment Review (CPEIR) and the “CC+GG” coefficient.16 GIZ - “Climate Responsive Planning and Budgeting in the Mekong Delta - Monitoring Climate Targets through Bud-get Classification” May 2017
in the MPI Guidelines to support the planning and allocation of investments that take into account CC&GG.
d) To provide support for the establishment of a monitoring, evaluation and reporting system for CC&GG investment.
e) To further reaffirm Vietnam’s efforts in realizing its contributions to the Paris Agreement and mobilizing and calling for international support that enables Vietnam to deliver the NSCC&GG and NSGG.
The wider objectives of this CPEIR are to support the establishment of new practices that will allow provincial and national governments to take CC&GG into account when: a) proposing, negotiating and approving budgets and MTIPs; and b) when designing and appraising investments. The introduction of a classification system should help create the demand within the planning system for analysis of the implications of CC&GG for prioritization.
Following this introductory chapter, the report is structured as follows.
Chapter 2 describes policies and the institutional framework for CC&GG, including planning cycles, local public finances and target programs related to CC&GG.
Chapter 3 presents the methodology for identification, classification and evaluation of planned and actual CC&GG investment, as described in the MPI Guidelines, in line with the duties specified in the relevant strategies (i.e. NSCC&GG and NSGG) and in Vietnam’s NDC.
Chapter 4 offers an analysis of CC&GG investment in the Mekong Delta in general and in each of the provinces in the region, including actual investment for 2015, 2016, 2017, and planned investment for 2016-2020. The analysis covered the level of investment, the status of implementation, showcase projects, financial sources and other related matters.
Chapter 5 provides conclusions on CC&GG investment in the Mekong Delta and recommendations related to data collection and classification and the applicability of the MPI Guidelines.

PAGE 21
POLICIES AND INSTITUTION
02
© UNDP Viet Nam

PAGE 22
2.1 POLICIES ON CLIMATE CHANGE RESPONSE AND GREEN GROWTH
After Vietnam signed and adopted the United Nations Framework Convention on Climate Change (UNFCCC) in 1994 and the Kyoto Protocol in 2002, it developed a range of domestic policies related to climate change response. Below are some key milestones.
● 2008: the National Target Program on climate change response17, for 2012–2015.
● 2011: the National Strategy on Climate Change (NSCC, 2011)18, operationalized by the National Action Plan on Climate Change for 2012-2020 (NAPCC, 2012)19.
● 2012: the National Strategy on Green Growth (NSGG,)20, operationalized by the National Action Plan on Green Growth for 2014-2020 (NAPGG, 2014)21.
Thus, the NSCC&GG and NSGG form the policy framework, which is operationalized by the NAPCC&GG and NAPGG for the period to 2020, including action plans at ministerial, sectoral and local level. The government has also issued some other programs and policies related to climate change responses and green growth, including:
● 2012: Reducing Emissions from Deforestation and Forest Degradation (REDD+) by 202022.
● The National Strategy on Natural Disaster Prevention, Fighting and Mitigation by 2020 (NDPFM Strategy, 2007), the Law on Natural Disaster Prevention and Fighting (2013), the National Strategy on Forestry Development for 2011–2020 (2012) and the National Target Program on Energy Efficiency (2012).
Vietnam signed and adopted the Paris Agreement which includes the ‘Nationally Determined Contributions’ (NDCs, 2016). To fulfill its contributions
17 Decision No. 158/2008/QD-TTg, 2008 and 1183/QD-TTg, 201218 Decision No. 2139/QD-TTg, 201119 Decision No. 1474/QD-TTg dated 05/10/201220 Decision No. 1393/QD-TTg, 201221 Decision No.: 403/QD-TTg dated 20/03/201422 Decision No. 799/QD-TTg, 201223 Decision No. 2053/ QD-TTg, 201624 Tran Van Tho (2013). Middle income trap: Considerations for the SEA member countries. ADBI 421. Tokyo: Asian Development Bank Institute.
to the Paris Agreement, the Vietnamese government has issued the Action Plan on Implementation of the Paris Agreement23, which is divided in two phases: phase 1 (2016-2020) focuses on preparation and phase 2 (2021- 2030) delivers the country’s NDCs.
The following paragraphs review the key policies related to CC&GG and GG.
The NSCC&GG is designed to provide a concrete mechanism and identify climate change response targets. It identifies 10 strategic duties, including climate change adaptation and mitigation targets. For 2011–2015, the strategy identifies the following prioritized programs: the National Target Program on Climate Change Response (for 2012-2015); the Scientific and Technological Program on Climate Change Response, Resources and Environmental Management (for 2016-2020); hydrometeorological forecast and observation; water resources management and climate change response in key river deltas; climate change response in major urban centers; river and sea dike reinforcements; and health care and community-level response. The NSCC&GG has been operationalized by the NAPCC, which defines ten priorities and a list of 65 programs and/or projects, most of which seek to enhance surveillance and warning systems and adaptation.
The NSGG identifies renewable energy and energy efficiency as important drivers of sustainable development and of the transformation of the national economy towards green growth. Green growth has been determined as an important component in the sustainable development process. Using lessons learnt from South Korea24, the NSGG stressed the need to avoid economic operations that over utilize natural resources and labor in order to save Vietnam from the “middle income trap’. Achieving more material economic progress will require industries and services to employ more knowledge and technological innovation and to be more creative and dynamic. Thus, green growth in Vietnam will require more innovation, research and development in order to provide improved labor productivity and efficient

PAGE 23
use of resources25. Green growth can also make significant social contributions, including poverty reduction and hunger eradication and helps with the delivery of the NSCC26. Low carbon development gives Vietnam a chance of new and sustainable growth27.
The NSGG is operationalized by the NAPGG, which describes 66 actions under four themes: (1) enhanced institutions and development of action plans on green growth at local level; (2) reduced GHG emission intensity and promotion of clean and renewable energy sources; (3) greening production; and (4) greening lifestyles and promoted sustainable consumption. Prioritized activities between 2013–2015 include finalization of an institutional framework to speed up restructuring the national economy in accordance with the NSGG and formulation of financial and legal frameworks for green growth. Most of the activities in the NAPGG are focused on GHG emission reductions rather than climate change adaption.
2.2 COORDINATION OF CLIMATE CHANGE RESPONSE AND GREEN GROWTH
CENTRAL LEVEL COORDINATION
The National Committee on Climate Change (CC Committee) is the government’s highest inter-ministerial agency on climate change, established under the Decision No. 43/QD-TTg dated January 2012. The CC Committee is tasked with: providing consultancy to help the government and prime minister with research, proposals, directions, operations and collaboration; promoting inter-sectoral and interdisciplinary missions, national programs and/or strategies on climate change; guidance and coordination in implementing national strategies and/or programs on climate change; and guidance and organization of the implementation of international cooperation in climate change. The Ministry of Natural Resources and Environment (MoNRE), a standing agency of the CC Committee, takes the leading role and cooperates with other ministries, sectors and localities in the management
25 Van Arkadie, Brian, et al. (2010). General national analysis for Vietnam. Document for UN-Vietnam.26 Vietnam National Strategy on Climate Change (2012)27 World Bank (2014). Draft research to formulate a low carbon development road map for Vietnam. WB, ESMAP and DFID.
and implementation of the NSCC.
Members of the CC Committee include the Prime Minister, chairman of the committee, and a Deputy Prime Minister and the Minister of MoNRE as the first and second vice chairmen. Other members are some other ministers (Ministries of Planning and Investment, Finance, Agriculture and Rural Development, Transport, Industry and Trade and Construction) and experts (Figure 4). Members of the CC Committee have specific duties as specified in the Decision No. 25/QD-UBQGBDKH (2012) regarding the regulations on the committee’s operations. Implementing ministries, sectors, provinces and organizations are required to make available bi-annual reports which present analysis and evaluation of the management and implementation of strategies and relevant targets. Such reports are to be compiled into bi-annual and annual reports by a standing office for submission to the CC Committee. The standing office of the CC Committee is situated at MoNRE and tasked with the establishment and implementation of programs where it takes the leading role and cooperates with relevant ministries and agencies in climate change. The standing office is also tasked with evaluation and monitoring of the implementation of national strategies and action plans on climate change, the National Target Program on climate change response as well as other climate change related strategies, programs and projects.
MPI functions as a focal point agency in the implementation of the National Strategy on Green Growth (NSGG) and takes the leading role in organizing the implementation of the NSGG, cooperating with other relevant ministries, agencies and provincial and centrally administered city people’s committees. MPI provides instructions, monitoring, evaluation, inspection and a summary of the current status of implementation of the NSGG for reporting to the Prime Minister periodically. MPI also organizes a 5-year review, a mid-term review in 2020 and a final review in 2030. In cooperation with relevant ministries and agencies, MPI leads the identification of duties and focal point projects in specific periods for submission to the Prime Minister for approval. MPI also takes the leading role and cooperates with the Ministry of Finance and other relevant ministries and agencies in identifying and

PAGE 24
allocating domestic capital sources while coordinating international financial support and providing a proper legal framework for promoting the NSGG.
The implementation of NSGG is coordinated by the Green Growth Steering Committee (GG Steering Committee) under the CC Committee. The GG Steering Committee is supported by an agency currently managed by MPI. The first prioritized activity under the NAPGG is to organize a NGGS Implementation Steering Committee, including the establishment and approval for operational regulations of the committee.
NATIONAL COMMITTEE
FOR CLIMATE CHANGE
Chairman: Prime Minister
Standing Vice President: Deputy Prime Minister
Vice Chairman of the Committee: Minister of Natural Resources and Environment
Minister of Public Security
The Minister-Director of the Office of the Government
Minister of Industry and Trade
Minister of Finance
Minister of Agriculture and Rural Development
Minister of Science and Technology
Health Minister
Minister of Transport
Minister of Planning and Investment
Deputy Minister of Defense
Deputy Minister of Natural Resources and Environment
Deputy Minister of Construction
Deputy Minister of Foreign Affairs
Deputy Chairman of the National Assembly’s Committee for Science, Technology and Environment
Vice Chairman of the Central Committee of the Vietnam Fatherland Front
Deputy Head of the Standing Committee of the South-West Steering Committee*
President of Vietnam Academy of Science and Technology
President of the Vietnam Academy of Social Sciences
President of Vietnam Union of Science and Technology Associations
STANDING OFFICE OF
THE CLIMATE CHANGE
Chief of Office: Deputy Director General Department of Climate Change, Ministry of Natural Resources and Environment
Figure 3. Organizational chart of the National Committee for Climate Change
LOCAL LEVEL COORDINATION
According to the Law on Local Authority Organization28, administrative units of local government in Vietnam include: a) centrally administered provinces and cities; b) districts and towns in cities classified as centrally administered provinces and cities; c) communes, wards and towns; and d) special administrative economic units. Local government has the autonomy to fulfill its obligations, provided what they do is in line with national development policies and strategies. Local government in the Mekong Delta receives most of their income from centrally allocated budget though some local and city authorities make certain contributions to the state budget.
28 Law No.: 77/2015/QH13 by the National Assembly, Law on Local Authority Organization.* The South-West steering committee was dissolved according to Resolution 18/NQ-TW dated 25/10/2017

PAGE 25
Provincial CC Committees have been established to coordinate action plans on climate change at provincial level and most of the provinces, particularly those located in the Mekong Delta, have set up their own climate change offices, officially under the Provincial People’s Committees (PPCs) but normally situated within Departments of Natural Resources and Environment (DoNREs). Provincial authorities play an important role in the establishment, planning and allocation of budget for investment projects, including projects related to climate change.
Provincial CC Committees are therefore influential in advising the PPCs on climate change projects and the standing of the CC Committee is of critical importance in ensuring the monitoring, evaluation and reporting in relation to climate change response nationwide.
Though climate change and green growth are priorities in many provinces, particularly those in the Mekong Delta, this has not been covered by the Law on Local Authority Organization, except for the cases where PPC presidents are authorized to take actions against disasters at local level. Coordination of climate change related matters at local level is handled by DoNRE, which is tasked with: a) preparing and updating provincial level action plans on climate change; b) providing instructions and cooperating in the organization of implementation; c) organizing the implementation of duties specified in the relevant strategies, programs, plans and projects on climate change; d) inspecting the implementation of climate change actions; e) evaluating climate change impacts and thereby proposing climate change response measures; f) guiding and managing the implementation of GHG emission reduction activities. The capacity of DoNREs in the provinces is limited by the government decree on reducing expenditure, which prevents DoNREs from recruiting more officials to fulfill the new duties associated with climate change.
Coordination of regional investments in the Mekong Delta
Integrated regional planning is crucial to efficient and effective resource allocation and to increasing Vietnam’s competitiveness and growth opportunities. With the increasingly widespread negative impacts of climate change, it will be difficult, or even impossible,
29 Decision No. 245/QD-TTg dated 12/02/2014-Approving the socioeconomic development master plan for the Mekong Delta focal point economic zone by 2030.30 Decision 941/QD-TTg issued in 2015 & Decision 2059/QD-TTg
to protect and further develop the Mekong Delta without an integrated regional development approach.
The Government has issued a variety of legal documents that support a regional approach. In 2014, the master plan for socio-economic development for the Mekong Delta Key Economic Region29 was approved, which envisions the economic development pathway for Can Tho, Ca Mau, An Giang and Kien Giang. A steering committee and council to develop the economy in mentioned provinces were then established.30 Prime Minister’s Decision 593 (dated 6th April 2016) and its Action Plan Decision 2220 (dated 17th November 2016) outlines the pilot regional coordination on socio-economic development for the whole Mekong Delta for 2016-2020.
The significance of an integrated regional development approach is further highlighted under the promulgation of Resolution 120 by the Prime Minister on Sustainable and Climate Change Resilient Development for the Mekong Delta (dated 17th November 2017). The Resolution addresses various challenges that the Mekong Delta is facing and indicates the roles and responsibilities of different ministries and departments. It also requires that design documents of projects located in the Mekong provinces must address climate change by supporting the following actions:
● Socioeconomic development that contributes to mitigating climate change
● Typhoon and flood prevention and control and sea water intrusion protection facilities that take into account the impact of climate change and sea level rise
● Innovative technologies for wastewater treatment and waste treatment in industrial parks that may contribute both to mitigation and adaptation
● Modernization of drainage systems for domestic wastewater, wastewater and rain water in urban centers
● Natural disaster prevention and control in areas that are at high risk of erosion, located along rivers and other waterways.
An institutionalized regional mechanism or model

PAGE 26
for regional government for the entire Mekong Delta is not yet in place. This will be envisioned under the scheme for the establishment of a Regional Council, which is listed as one of MPI’s action plans to implement Resolution 120.31 In parallel, there are existing initiatives of Mekong Delta provinces to establish sub-regional coordination. The majority of those are on a voluntary basis of provincial common interests, which could be strengthened to provide a more coherent and coordinated approach for the whole region.32
Master plans for the overall socio-economic development of the Mekong Delta were issued by the Prime Minister in 1998 and 2012. In 2014, a separate Mekong Delta Plan was launched with support from the Netherlands and in collaboration with the Vietnamese scientific community. Although it is not an official government planning document, it has been serving as a reference document for the Government of Vietnam and the international community, offering a long-term strategic vision for a safe, wealthy and sustainable delta, including policy recommendations and solutions.
The 2017 Law on Planning included a requirement of regional planning, as one of the six systems of planning. Based on this law, and in accordance with the Prime Minister’s Resolution 120, MPI has been in 2018 tendering the development of new Mekong Delta Master Plan for 2021-2030 with an outlook to 2050 to foster regional development planning and provide a basis for coherent investment planning33. All sectoral and provincial plans will need to follow this Master Plan. One of the objectives of the CPEIR is to provide information on existing CC-GG investment patterns in the 13 provinces to help in determining a framework for future CC&GG investment in the Mekong Delta Master Plan 2021-2030.
In line with the regional approach as defined within framework of Prime Minister’s Resolution 120 and Decision 593, MPI has also been piloting coordination of regional and inter-provincial projects in 2018. The effort is legalized under MPI’s Decision 625/QĐ-BKHĐT dated 5th May 2017 on issuing the criteria set for identifying inter-provincial projects in the MD for 2016-2020 and follows Guidance on Implementation
31 Decision 337/QD-BHKDT issued 26th March 2018 on Action Plan of MPI to implememt Resolution 120/NQ-CP32 Decision 337/QD-BHKDT issued 26th March 2018 on Action Plan of MPI to implememt Resolution 120/NQ-CP33 The development of MD Master plan is supported by Mekong Delta Integrated Climate Resilience and Sustainable Livelihoods Project by the World Bank.34 Resolution 100/2015/QH13 by National Assembly dated 12 November 2015 on Approving Investment Strategy on National Target Prgrammes for 2016-2020
under Document 4259/ BKHDT-KTDPLT. Decision 593/QD-TT suggests a “minimum amount of 10% of the total investment allocated to the provinces in the region from the state budget to implement regionally coordinated projects and programmes”. Decision 625 defines 3 main areas for piloting including: agriculture; transportation and water resources protection and management; and climate change adaptation. The development of regional project proposals and implementation of such projects will require high level of coordination among involved actors, including ministries, provincial departments, provincial leaders, PPCs and donors.
2.3 TARGET PROGRAMS RELATED TO CLIMATE CHANGE AND GREEN GROWTH
For 2010-2015, half of the 16 National Target Programs (NTPs) contained projects that directly or indirectly supported objectives of the NSCC&GG and NSGG. The eight most relevant NTPs were:
(1) Sustainable poverty reduction;
(2) Safe water and environmental hygiene;
(3) Health care;
(4) Food hygiene and safety;
(5) Energy efficiency;
(6) Climate change responses;
(7) New rural development; and
(8) Environmental pollution medication and improvement.
For the period 2016-2020, the number of NTPs were reduced from sixteen to the following two: (i) Sustainable poverty reduction and (ii) New rural development.34 This reduction in the number of NTPs was made because the sixteen NTPs were considered too broad and because there were insufficient resources and poor organization of implementation, which led to problems with poor performance. The two new NTPs aim to tackle

PAGE 27
national level issues and urgent missions and involve many road and water supply projects related to climate change response.
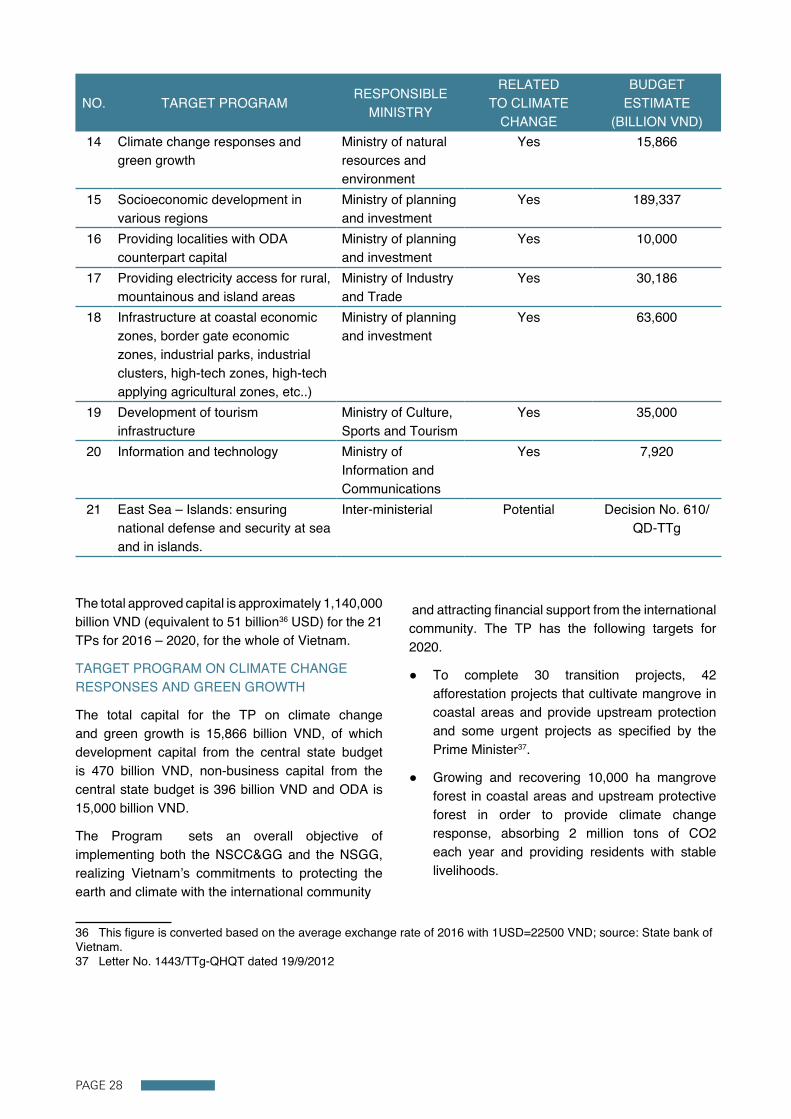
However, some NTPs from the previous period still have active projects and 37 sub-projects in 21 Target Programs (TP)35 were reorganized at a more appropriate scale to achieve better performance. Out of 21 TPs, many are directly and indirectly linked to climate change and green growth. In particular, there is a separate Target Program no. 14 on ‘’Climate change response and green growth’.
Table 2. List of target programs for period 2016-2020
NO. TARGET PROGRAM RESPONSIBLE MINISTRY
RELATED TO CLIMATE
CHANGE
BUDGET ESTIMATE
(BILLION VND)1 Sustainable development of marine
industry economics Ministry of Agriculture and Rural Development
Yes 49,248
2 Sustainable forestry development Ministry of Agriculture and Rural Development
Yes 59,599
3 Agricultural economics restructuring and disaster prevention, control and relief, and life stabilization for general population.
Ministry of Agriculture and Rural Development
Yes 529,935
4 Health care - Population Ministry of Health care
Yes 20,413
5 Development of local health care systems
Ministry of Health care
Yes 22,500
6 Ensuring traffic safety, fire prevention and fighting, crime and drug abuse prevention and fighting.
Ministry of Public Security
Potential 9,227
7 National defense industry to realize the Resolution No. 06-NQ/TW by the Ministry of Political Affairs.
Ministry of National Defense
Potential 27,229
8 National defense, public security in focal point locations
Ministry of planning and investment
Potential 18,985
9 Education in mountainous, ethnic minority people and difficult areas
Ministry of Education and Training
5,100
10 Vocational training, employment and labor safety
Ministry of Labor, War Invalids and Social Affairs
Potential 15,520
11 Development of social support systems
Ministry of Labor, War Invalids and Social Affairs
Potential 11,655
12 Culture promotion Ministry of Culture, Sports and Tourism
Potential 13,267
13 Taking strict actions against seriously polluting establishments, which are of public utilities.
Ministry of natural resources and environment
Yes 4,648
35 Resolution No. 73/NQ-CP- Approving the intention of investing in target programs for 2016-2020.
PAGE 28
NO. TARGET PROGRAM RESPONSIBLE MINISTRY
RELATED TO CLIMATE
CHANGE
BUDGET ESTIMATE
(BILLION VND)14 Climate change responses and
green growth Ministry of natural resources and environment
Yes 15,866
15 Socioeconomic development in various regions
Ministry of planning and investment
Yes 189,337
16 Providing localities with ODA counterpart capital
Ministry of planning and investment
Yes 10,000
17 Providing electricity access for rural, mountainous and island areas
Ministry of Industry and Trade
Yes 30,186
18 Infrastructure at coastal economic zones, border gate economic zones, industrial parks, industrial clusters, high-tech zones, high-tech applying agricultural zones, etc..)
Ministry of planning and investment
Yes 63,600
19 Development of tourism infrastructure
Ministry of Culture, Sports and Tourism
Yes 35,000
20 Information and technology Ministry of Information and Communications
Yes 7,920
21 East Sea – Islands: ensuring national defense and security at sea and in islands.
Inter-ministerial Potential Decision No. 610/QD-TTg
The total approved capital is approximately 1,140,000 billion VND (equivalent to 51 billion36 USD) for the 21 TPs for 2016 – 2020, for the whole of Vietnam.
TARGET PROGRAM ON CLIMATE CHANGE RESPONSES AND GREEN GROWTH
The total capital for the TP on climate change and green growth is 15,866 billion VND, of which development capital from the central state budget is 470 billion VND, non-business capital from the central state budget is 396 billion VND and ODA is 15,000 billion VND.
The Program sets an overall objective of implementing both the NSCC&GG and the NSGG, realizing Vietnam’s commitments to protecting the earth and climate with the international community
36 This figure is converted based on the average exchange rate of 2016 with 1USD=22500 VND; source: State bank of Vietnam.37 Letter No. 1443/TTg-QHQT dated 19/9/2012
and attracting financial support from the international community. The TP has the following targets for 2020.
● To complete 30 transition projects, 42 afforestation projects that cultivate mangrove in coastal areas and provide upstream protection and some urgent projects as specified by the Prime Minister37.
● Growing and recovering 10,000 ha mangrove forest in coastal areas and upstream protective forest in order to provide climate change response, absorbing 2 million tons of CO2 each year and providing residents with stable livelihoods.

PAGE 29
THE CLIMATE CHANGE COMPONENT OF THE TP INCLUDES INVESTMENTS MADE FOR THE FOLLOWING.
● Establishment of a climate change monitoring system, a sea water intrusion monitoring and warning system as part of the national planned natural resources and environment observation system implemented during 2016 - 2025, with a perspective to 2030.38
● Construction and/or upgradation of 6 to 10 lakes and dikes with a total capacity of 100 million m3 for purposes of flood control in rain season and drought prevention in dry season for areas suffering from increasing droughts.
● Construction and/or upgrading of 6 to 8 saline water control and fresh water retention systems in line with the Mekong delta plan, with 2 to 3 systems in coastal areas.
● Construction and/or upgrading of 200 km of poor river and sea dikes in areas that are at risk of threatening production, human life and livelihoods of over 3 million people in riverine and coastal areas.
● Establishment of a national database on climate change and updating of the national action plan on climate change response.
THE GREEN GROWTH COMPONENT OF THE TP INCLUDES INVESTMENTS TO ACHIEVE THE FOLLOWING.
● By 2020, GHG emission reductions by 8% to 10% as compared with 2010 and energy consumption per GDP unit reductions by 1% to 1.5% each year.
● Construction of the center for green construction technologies research, training, application and transfer across an area of 50 ha.
● Replacement of 1,000 inland waterways battery-powered indicator floats with ones using solar power.
● Completion of in-field irrigation facilities for a 100 ha demonstration irrigation site. Establishment of an irrigation works management and operation
38 Decision No. 90/QD-TTg dated 12/01/2016 by the Prime Minister39 The Law on planning No.21/2017/QH14; issued on 24 November 2017, effective from 1 January 2019
model for rice production that takes green growth into account. Construction of a center for research and experiments related to crops, paddy rice and multiplication across an area of 25 ha.
● Procurement of 25 energy verification and audit instruments for the mining industry and 29 for other manufacturing and processing industries.
● Establishment of an action plan on sectoral, regional and local level green growth.
2.4 THE PLANNING AND BUDGETING CYCLE
PLANNING CYCLE
In Vietnam, budget planning, estimation and allocation are conducted on the basis of ten-year socioeconomic development strategies, five-year socioeconomic development plans (along with the associated Mid Term Investment Plans), three- and five-year budget plans and annual budgets.
In November 2017, the Vietnam National Assembly promulgated a Law on Planning, which comes into force on January 1st, 201939. The new law retains the role of the Strategy of Socio-economic development and sectoral development strategies and defines the planning system as consisting of six sub-systems including national planning, regional planning, provincial planning, special administrative-economic planning, urban planning and rural planning. The contents of provincial planning must reflect national level planning and projects as well as regional and inter-provincial level planning and project.
The relevant documents for this CPEIR are the annual budgets for 2016 and 2017, the socioeconomic development plan for 2011–2015 and the socioeconomic development strategy for 2011–2020.

PAGE 30
Ten-year socio-economic development strategy for 2011-202040
The socio-economic development strategy for 2011 – 2020 has been established based on the three pillars of sustainable development, namely economic, social and environmental development, taking into account green economy orientations, including the following.
● Shifting the growth model from purely horizontal development to both horizontal and vertical developments.
● Paying attention to the development of the green economy, which is environmentally friendly. Sustainable production and consumption, progressive development of renewable energy, clean energy, clean production and sustainable consumption.
This strategy also sets prioritized orientations for sectors that make important contributions to climate change response and climate change mitigation. In addition, the strategy addresses the need for hydrometeorological research and forecasting, assessment of climate change impacts and increased international cooperation in climate change related activities. It also emphasizes the importance of disaster preventive measures.
Five-year socio-economic development plan41
The ten-year socioeconomic development strategy is operationalised by socioeconomic development plans for every five years. The current socioeconomic development plan is for 2016-2020. The socioeconomic development plan sets forth prioritized orientations and guidelines on the preparation of annual budget estimates, including commitments and capital allocations to localities. The socioeconomic development plan is implemented at national, sectoral and local level.
The national socioeconomic development plan has been quantified by means of a series of targets, including developmental orientation targets and legal targets, as shown in the table below.
40 Refer to: Vietnamese Communist Party, dated 12/02/2011- Socioeconomic development strategy for 2011-2020.41 Extracted from: Resolution No.: 142/2016/QH13 regarding the 5-year socioeconomic development plan for 2016-2020.
Out of the key targets approved by the National Assembly, those relating to environment and green growth include:
● Percentage of badly polluted establishments receiving treatment;
● Percentage of existing industrial parks and processing zones equipped with a standard-compliant centralized wastewater treatment facility;
● Percentage of forest cover;
● Percentage of rural population having access to safe domestic water supply;
● Percentage of urban population having access to safe water;
● Percentage of urban solid waste being properly collected;
● Savings in energy consumption for generation of one GDP unit.
INDICATORS OF DEVELOPMENT ORIENTATION
Economic indicators
Education, training and science and technology indicators
Social indicators
Indicators of environmental protection and sustainable development.
INDICATORS OF LEGAL TARGET
State budget targets
State Reserve
Credit for development investment and credit for social policy
Tasks of national target programs
The tasks of important national programs and projects and the list of investment projects in group A
List of basic survey projects

PAGE 31
The planning for CC&GG investment projects also needs to follow sectoral planning, including planning in the following sectors:
● Natural disaster planning and irrigation planning, master plan for energy, planning of urban system and planning of fishing port and storm shelter systems for fishing vessels (infrastructure planning)
● The Masterplan for sustainable exploitation and use of coastal resources, water resources planning, forestry planning, planning of aquatic resources exploitation and protection (resource use planning)
● Environmental protection planning
● The Masterplan for biodiversity conservation
BUDGET CYCLE
The budget allocated for public investments is governed by the Law on State Budget 2015 [6] and the Law on Public Investment 2014 [7]. Central state budget items are prepared by the government and adopted by the national assembly. These programs and projects must satisfy one of the following priorities.
● Two national target programs (NTP), namely the NTP on sustainable poverty reduction and the NTP on new rural construction;
● 21 target programs (TP);
● National focal-point projects, which are sometimes referred to as ‘group A projects’.
The classification of A, B, C group projects has been specified in the Law on Public Investment, based on their importance to the country and budget scale. The Prime Minister is responsible for approving the following projects: ‘group A projects’, including the largest projects; projects run by relevant socioeconomic organizations, including the Vietnam Fatherland Front; emergency projects sponsored by the government; and some ODA projects. The central government also determines the percentage of central budget to be allocated to local government.
The fiscal year runs from 1 January to 31 December. Annual budget and 3-years budget plans are prepared at both central and local level. The budget cycle normally starts in July when the Prime Minister issues the “Guidelines on preparation of the annual state budget” and the report on the socioeconomic development plan. The guidelines are provided to make sure budget preparation at local level is in line with 10-year, 5-year and 3-year plans. These guidelines include estimates for budget revenue and ceilings for expenditure at both central and local level, which are jointly determined by the MPI and MoF. The ministries and provinces prepare first spending plans for submission by the end of July and second submission by September.
However, some key targets and objectives of the NSCC&GG have not been included in the socioeconomic development plan. Examples include GHG emission reductions, energy intensity, percentage of electricity generated from renewable energy sources. The socioeconomic development plan for 2016-2020 has taken into account and included climate change in relevant fields and set priorities for building infrastructure in climate
change impact vulnerable areasThe five year socio-economic development plans are complemented by Mid Term Investment Plans (MTIPs) that provide a five year orientation for annual budget plans. The provincial MTIPs are created through both MPI decisions and resolutions approved by Provincial People’s Councils. The MPI Decision relating to the MTIP usually includes three Annexes as shown the table below.
ANNEX 1
Summary, with total figures for local budget (including Local/provincial revenue funds- LRF, Land Use - LU and Lottery Fund- LF) and totals figures for each TP funded by the centre. The provincial MTIPs covered by this CPEIR included 9 of the 21 TPs. (The remaining 12 TPs were presumably implemented at a central level or in other provinces only.)
ANNEX 2
A list of projects funded by the centre through the TPs. This list includes the project number and decision date and the total cost of the project, plus the expenditure to date and the allocation for 2016-2020, under the MTIP. Each of these figures is split into central budget sources and other sources.
ANNEX 3 A list of the ODA funded projects that are ongoing or approved to start during the period.
Table 3. Annexes of the MTIPs
PAGE 32
In provinces, spending plans are prepared by functional departments in consultation with commune authorities and with the instructions provided by the MPI. Spending plans are then reviewed by MPI and MoF and consolidated into a single proposed compound budget plan by the end of October. This is reviewed and discussed by the National Assembly before adoption by the year end.
At local level, people’s committees prepare the budget for the people’s councils to approve. This includes all B and C group projects and any other investment and recurrent expenditure financed by local resources.
The table below summarizes the typical annual budget cycle at the provincial level.
Table 4. Budget preparation cycle at the provincial level
TIME DESCRIPTIONJuly The Prime Minister directs the preparation of the budget estimate for the following
year and the report on the current socioeconomic situation.MPI and MoF issue related circulars to guide ministries, sectors and provinces in preparing their budget estimates.
July Commune people’s committees presents socioeconomic information to the District People's Committee (DPI), the PPC and MPI.
July/August The provincial DPI prepares socio-economic development plans and state budget estimates for the subsequent year according to the Prime Minister's Directive and the guidance of MPI, then submit to PPC and from PPC to MPI and MOF in August.
September The second proposed budget plan is prepared at provincial level and submitted by the PPCs to the MPI and MoF.
September/October MPI and MoF produce proposed consolidated budget plans at central and provincial level.
November/December The government and National Assembly approve the budget plans.
© UNDP Viet nam

PAGE 33
METHODOLOGY AND SCOPE
03
© GIZ

PAGE 34
3.1 MPI GUIDELINES
This review was conducted as a pilot application of the ‘Guidelines on the classification of public investments in climate change and green growth’, issued by MPI, referred to in this report as the ‘MPI Guidelines’. The version in use was applicable one by late 2017. This was then replaced by official version issued in July 201842. The main substantial changes were: a) renumbering appendixes so that Appendix 3 and 4 become Appendix 1 and 2, respectively; and b) addition of the explaanatory note for Step 1, which allows the reference of “listed sub-themes in Appendix 2” for classification of project’s adaptation/mitigation objectives in case of incomplete project documents collection. The report has been adapted to match official appendixes order. The second change is in consistent with the practice used in this CPEIR.
This classification procedure has been formulated in accordance with the principles and contents of Vietnam’s annual and 5-year public investment plans as mentioned in Section 2.3. The MPI Guidelines result in a classification that includes the following categories:
42 The guidelines have been officially issued in Decision 1085/QD-BKHDT dated 16 July, 2018.
● CC&GG ‘objective’ (i.e. adaptation, mitigation or both)
● CC&GG ‘theme’, as defined in Appendix 1 (i.e. A1 - climate information, A2 – energy security, A3 – disaster risk reduction etc.)
● CC&GG ‘sub-theme’, as defined in Appendix 2 (i.e. A1.1, A1.2 etc.)
● Source of finance.
The methods proposed in the MPI Guidelines differ from the classification method which is used in the 2105 CPEIR (see section 1.2), in the following ways: the typology has evolved to include more themes; the MPI Guidelines include no estimating of a score of the degree of CC&GG relevance; the MPI Guidelines refer only to investment, whilst the 2015 CPEIR covered both investment and recurrent expenditure; and the MPI Guidelines proposed dividing projects into sub-projects to add clarity, if there is sufficient evidence.
The MPI Guidelines specify the steps as shown in Figure 4 below.
Collection of dat and project documents related to climate change and green growth
STEP-PR
Identify whether projects contribute to adaptation and/or mitigation
STEP 1
Classify projects according to theme and sub-theme as listed in Appendixes 1 and 2
STEP 2
Review and quality control of classification results
STEP 3
Compiling and reporting the results
STEP 4
Figure 4. Procedure for identification and classification of public investment and expenditures in climate change and green growth

PAGE 35
STEP-PR: PREPARATION
The main tasks in this step involve the collection of data and documents submitted by localities, including but not limited to the following.
● Lists of public investment projects extracted from the detailed public investment form for each project, as used by ministries and central and local agencies43. The lists included information for each Programme and project on public investment allocation and disbursement; including information on sectors, fields, time and location.
● The investment decisions of projects.
● Other project related documents (e.g. pre-feasibility study reports, feasibility study reports and environmental impact assessment reports) that might provide useful information for identifying and classifying CC&GG investments.
43 Decision No. 1989-2016/Bo KH&DT dated 31/12/2016
STEP 1: REVIEW AND IDENTIFICATION OF PROJECTS RELATED TO CC&GG
● From the list of projects obtained in the PR step, Step 1 identifies the projects that contribute to climate change adaptation and mitigation and to green growth. For most projects, this is based on the project approval decisions and any other documents easily available.
● Step 1 also assesses whether it is possible to identify components that allow the project to be split into CC&GG and non-CC&GG investment.
● The sources of finance and current status of the project is identified, if possible.
STEP 2: CLASSIFICATION BY CC&GG THEME AND SUB-THEME
● The projects selected in Step 1 are classified according to the themes and sub-themes listed in Appendixes 1 and 2 of the MPI Guidelines. The themes in Appendix 1 are summarized in the table below.
Table 5. CC&GG investment themes, as defined in Appendix 1 of the MPI Guidelines
SHORT TITLE FULL TITLE EXAMPLESEnergy Efficiency Energy efficiency Mitigation (M1)Planning Enhanced climate information, early
warning and hydromet systemsInformation used mainly for adaptation (A1)
Electricity Low-carbon and resilient energy generation, transmission and distribution
Mainly mitigation (M2), but potentially involves adaptation by improved energy security (A2)
Industry Sustainable industry production Mitigation (M3)DRR Disaster risk reduction Adaptation (A3)Urban Clean and resilient urban
development and constructionMainly adaptation related to flood control (A4), but some mitigation with energy efficient cities (M4)
Transport Sustainable transport Mainly flood proofing and control in roads (A5), some efficiency from public transport (M5)
Waste Waste management and treatment Mainly reduced GHG emissions (M6), plus some proofing of infrastructure (A6)
Agriculture Sustainable Agriculture and Livestock
Mainly resilience in farming systems (A7), plus some reduced GHG emissions (M7)
Forestry Sustainable forest management Most forestry projects have adaptation (A8) mitigation (M8)
Health Health and social services Both adaptation (A9) and mitigation (M9)

PAGE 36
STEP 3: QUALITY ASSURANCE AND QUALITY CONTROL
● Step 3 reviews the classification to make sure that it is based on concrete data and documents and that a proper quality is achieved. This step aims to increase transparency and reliability.
STEP 4: CONSOLIDATION AND PREPARATION OF REPORT
● Step 4 involves the preparation of a report on the current status of CC&GG investment, based on the analysis in the previous steps.
● The report seeks to address such questions as: characteristics of lists of CC&GG projects and programs in a year; share of CC&GG investment for adaptation and mitigation; share of CC&GG investment in total public investment; share of investment to each theme and sub-theme; share of CC&GG investment by funding sources.
● The reports may provide evidence according to province, region and ministry.
SHORT TITLE FULL TITLE EXAMPLESIrrigation Irrigation Mainly irrigation system construction/
development with adaptation (A10) and mitigation (M10) purposes
Water Supply Water quality and supply Improved efficiency of water supply and drainage with adaptation (A11) and mitigation purposes (M11)
Fisheries Sustainable fisheries and aquaculture production
More resilient aquaculture production with adaptation (A12) and mitigation (M12) purposes
Biodiversity Biodiversity and conservation More resilience ecosystems with adaptation (A13) and mitigation (M13) purposes
River Water resource management Construction/development of flood management structures and management of river flows (A14)
Coastal Coastal protection Construction/development of resilient coastal protection infrastructure/system (A15)

PAGE 37
3.2 INTERPRETATION OF THE MPI GUIDELINES BY THIS ASSIGNMENT
The most important task is to determine whether a project is related to CC&GG or not. The MPI Guidelines, Box 1, specifies that:
It is much easier to determine whether a project is related to climate change mitigation than whether it is related to climate change adaptation. After discussions with stakeholders and a review of actual data and project documents collected, we found that there were significant challenges in applying the MPI Guidelines for the following reasons:
● the limited possibility of collecting project data and documents;
● practices in information and data management and archiving in localities;
● the subjectivity of the process defined in Box 1 of the MPI Guidelines.
Therefore, we decided to determine whether projects were related to climate change by considering the
procedure in Box 1 at the same time as assessing whether projects could be classified under the themes and sub-themes listed in appendix 1 and appendix 2 of the MPI Guidelines. Projects falling under the sub-themes described in the appendix 2 were selected, classified and attached with reference codes as specified in the appendixes. We therefore conducted Steps 1 and 2 as a single exercise. This practice has then become consistent with substantial adjustment in the official Guidelines, which allows the reference to appendixes for classification activity in Step 1.
In using appendix 2, the review team added some new types of projects into the list and/or streamlined the list of projects in order to cover more climate change related activities in the Mekong Delta. Lessons on the use of the themes and sub-themes are referred to in chapter 5.
BOX 1 - CRITERIA FOR QUALIFYING AN INVESTMENT AS INVESTMENT IN CLIMATE CHANGE
i. A project is determined as climate change ‘response’ if it targets at reducing human or natural system’s vulnerability to existing and future impacts of climate change, including climate variations, by maintaining or increasing response competency through strengthened adaptability or absorbing stresses, shocks and climate change and/or by mitigating the extent of impacts in face of these factors.
● A project is considered as climate change response when its documents feature the following:
● Specifying the project’s vulnerable context potentially caused by climate change impacts;
● Clearly defining that the project objectives or activities will help tackle vulnerability as a result of climate change impacts; and
● Clearly describing the direct links between the project activities and vulnerability as a result of climate change impacts.
ii. A project considered as climate change ‘mitigation’ if it targets at and has activities in place to promote efforts in GHG emission reductions or increase GHG absorptions.
A project considered as climate change ‘adaptation and mitigation’ if it targets at and has activities in place to achieve aforementioned objectives related to climate change adaptation and mitigation.
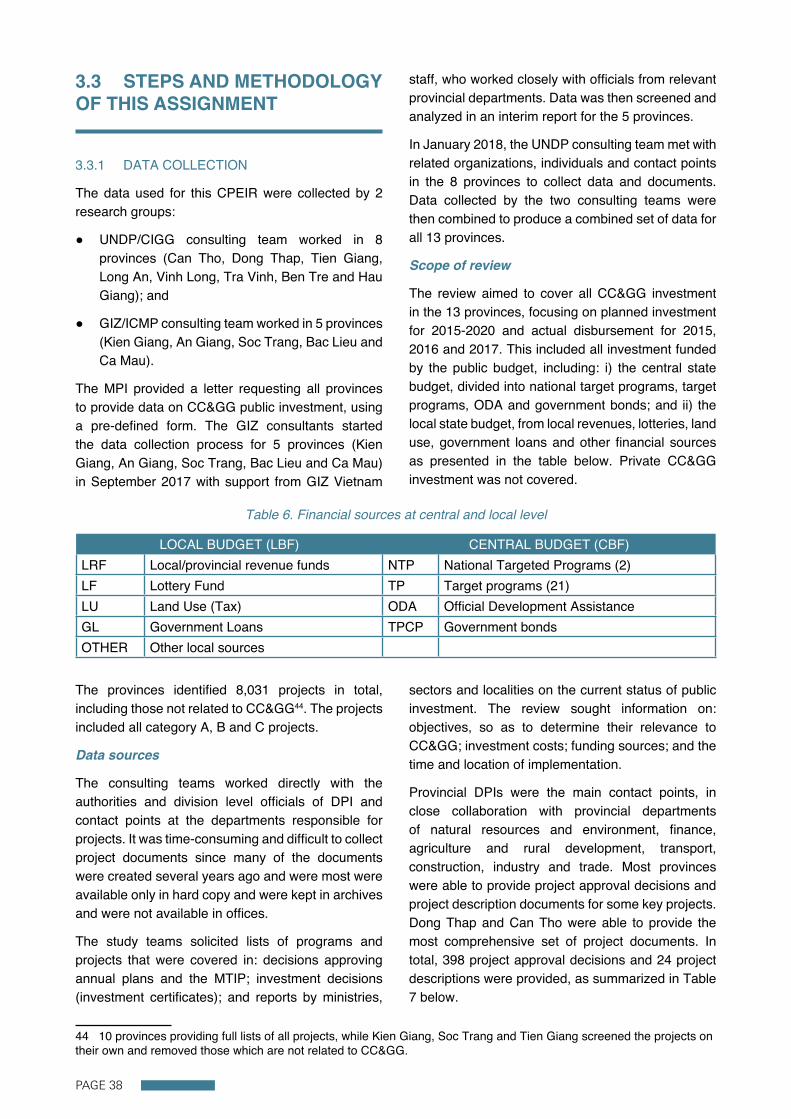
PAGE 38
3.3 STEPS AND METHODOLOGY OF THIS ASSIGNMENT
3.3.1 DATA COLLECTION
The data used for this CPEIR were collected by 2 research groups:
● UNDP/CIGG consulting team worked in 8 provinces (Can Tho, Dong Thap, Tien Giang, Long An, Vinh Long, Tra Vinh, Ben Tre and Hau Giang); and
● GIZ/ICMP consulting team worked in 5 provinces (Kien Giang, An Giang, Soc Trang, Bac Lieu and Ca Mau).
The MPI provided a letter requesting all provinces to provide data on CC&GG public investment, using a pre-defined form. The GIZ consultants started the data collection process for 5 provinces (Kien Giang, An Giang, Soc Trang, Bac Lieu and Ca Mau) in September 2017 with support from GIZ Vietnam
staff, who worked closely with officials from relevant provincial departments. Data was then screened and analyzed in an interim report for the 5 provinces.
In January 2018, the UNDP consulting team met with related organizations, individuals and contact points in the 8 provinces to collect data and documents. Data collected by the two consulting teams were then combined to produce a combined set of data for all 13 provinces.
Scope of review
The review aimed to cover all CC&GG investment in the 13 provinces, focusing on planned investment for 2015-2020 and actual disbursement for 2015, 2016 and 2017. This included all investment funded by the public budget, including: i) the central state budget, divided into national target programs, target programs, ODA and government bonds; and ii) the local state budget, from local revenues, lotteries, land use, government loans and other financial sources as presented in the table below. Private CC&GG investment was not covered.
Table 6. Financial sources at central and local level
LOCAL BUDGET (LBF) CENTRAL BUDGET (CBF)LRF Local/provincial revenue funds NTP National Targeted Programs (2)LF Lottery Fund TP Target programs (21)LU Land Use (Tax) ODA Official Development AssistanceGL Government Loans TPCP Government bondsOTHER Other local sources
The provinces identified 8,031 projects in total, including those not related to CC&GG44. The projects included all category A, B and C projects.
Data sources
The consulting teams worked directly with the authorities and division level officials of DPI and contact points at the departments responsible for projects. It was time-consuming and difficult to collect project documents since many of the documents were created several years ago and were most were available only in hard copy and were kept in archives and were not available in offices.
The study teams solicited lists of programs and projects that were covered in: decisions approving annual plans and the MTIP; investment decisions (investment certificates); and reports by ministries,
44 10 provinces providing full lists of all projects, while Kien Giang, Soc Trang and Tien Giang screened the projects on their own and removed those which are not related to CC&GG.
sectors and localities on the current status of public investment. The review sought information on: objectives, so as to determine their relevance to CC≫ investment costs; funding sources; and the time and location of implementation.
Provincial DPIs were the main contact points, in close collaboration with provincial departments of natural resources and environment, finance, agriculture and rural development, transport, construction, industry and trade. Most provinces were able to provide project approval decisions and project description documents for some key projects. Dong Thap and Can Tho were able to provide the most comprehensive set of project documents. In total, 398 project approval decisions and 24 project descriptions were provided, as summarized in Table 7 below.

PAGE 39
Table 7. Data collected from 13 provinces
PROVINCESPROJECT APPROVAL DECISIONS PROJECT DESCRIPTIONS
PRINTED ELECTRONIC PRINTED ELECTRONICHau Giang 28 4Dong Thap 114 6 4Tien Giang 24 3Long An Only project titlesBen Tre 23 6Tra Vinh 11Vinh Long 1Can Tho 86 1An Giang Only project titlesBac Lieu 41Soc Trang 17Kien Giang 53Ca Mau Only project titlesTotal 251 147 11 13
In addition, Ben Tre and Hau Giang also provided their provincial action plans on green growth45 and Vinh Long provided the implementation schedule of the action plan prepared by the provincial DoNRE as a step towards realizing the National Strategy on Climate Change for 2015-2020, with a perspective to 203046. Can Tho has also established its own action plan but the provincial contact point reported that this was still being finalised. These were valuable documents that helped to give the consulting team a clearer picture of provinces’ action plans, priorities, orientations and strategies related to CC&GG.
Challenges faced during data collection
● During data collection, the consulting team faced the following challenges.
● It is the general planning division under the provincial DPI that keeps project lists. However, project approval decisions, and particularly project descriptions, are normally kept by the division responsible for project appraisal and it is time-consuming to collect these documents.
● For group B and C projects requiring district approval, it often took even more time to collect project documents because there are a large number of these projects and their total costs are small.
45 Hau Giang provided project descriptions and Decision No. 2507/QD-UBND dated 29/12/2017 approving the provin-cial action plan on green growth for 2017-2020, with a perspective to 2025. Ben Tre provided their action plan on green growth for 2016-2020.46 Decision No. 2411/QD-STNMT dated 6/11/2015
● For older projects, particularly those that were implemented in 2015 and have approval decisions issued before that time, document collection faced many difficulties since they are kept in scanned copies of print versions rather than in computer files.
● Since contact persons in charge of CC&GG in the provinces have to do other office works as well, it takes a long time for them to collect and consolidate data.
3.3.2 DATA PROCESSING
Based on the combined list of projects and the MPI Guidelines, the consulting team identified those projects that might contribute to adaptation, mitigation or green growth. These projects were then subject to further examination of the projects’ objectives and background as described in project approval decisions. Where approval decisions were unclear, the assessment also consulted project descriptions, if available.
In addition to the project documents, the analysis consulted: annual budget allocation approvals by MPI; medium-term budget approval resolutions; provincial annual budget allocation plans for 2015,

PAGE 40
2016 and 2017; and annual budget disbursement reports.
Screening
An initial screening was done based on project titles and objectives, as listed in computer files provided by the provinces and budget allocation plans provided by MPI. Two provinces did this screening themselves (Soc Trang & Ca Mau). The lists included 8,031 projects from all provinces and the consulting team selected 2,976 projects (in 2015 and period 2016-2020) that might make explicit or implicit contributions to adaptation, mitigation or green growth.
In theory, the screening process corresponds with Step 1 of the MPI Guidelines. However, the subjectivity involved in Step 1 meant that, in practice, the selection process effectively merged Steps 1 and 2, because the most reliable way of conducting Step 1 was to consider whether a project matched one of the themes or sub-themes contained in appendix 1 (i.e. to conduct Step 2).
One section of the MPI Guidelines states that, for projects to qualify as contributing the adaptation, mitigation or green growth, there must be an explicit reference to climate change in their objectives, background and activities. Other sections imply that any project that fits with the themes and sub-themes described in appendixes 1 and 2 would qualify, even if there was only implicit contribution to adaptation, mitigation or green growth. This CPEIR assumes that an implicit contribution is sufficient, because very few projects included explicit references in their objectives, background and activities and the analysis would have been very limited if it were restricted to these projects.
Explicit contributions
Projects are considered to have explicit contributions when climate change related terms are included in project titles, background and activities, as specified in Box 1 of the MPI Guidelines. Project objectives are normally presented in both the excel and project documents. Climate change related terms included: climate change, adaptation, resilience, minimizing greenhouse gases and sea level rise. Some other climate related terms (e.g. floods, drought, water drainage, dikes, water reserves) do not necessarily indicate that projects were explicitly designed taking into account the change in climate, since they may aim to tackle current climatic conditions. However,
such projects are almost certain to make an implicit contribution to adaptation or green growth.
Implicit contributions
Many projects that contribute to adaptation, mitigation or green growth have not explicitly included terms related to climate change in project documents. These projects are included in the assessment by checking whether they fit with any of the themes and sub-themes listed in Appendixes 1 and 2 of the MPI Guidelines. This can often be determined by the presence of keywords that relate to the MPI typology (e.g. saline water control, erosion, riverine landslide protection, flood control, saline water control, submerging control, flood control, flood relief, water supply, protective afforestation projects, drought prevention, saline water prevention, solar power use, sedimentation support and disaster relief).
Consultation with provinces
Classification results were shared with the provinces for review and feedback and a consultation workshop was held in June 2018 in Can Tho. On the basis of the feedback, the consulting teams updated the data, which was re-submitted to the provinces for further review, until a consensus was achieved. Since not all data is available for all projects, the classification of some projects depended on the experience and comments and of persons in charge of CC&GG, through discussions, workshops and communications via email and telephone.

PAGE 41
REVIEW OF CC&GG PUBLIC INVESTMENT IN
THE MEKONG DELTA
04
© GIZ

PAGE 42
4.1 AN OVERVIEW OF CC&GG INVESTMENT IN THE MEKONG DELTA
This section presents the results of classifying actual CC&GG public investment in the Mekong Delta in 2015, 2016 and 2017, by project objective (i.e. adaption/mitigation or both), by theme (e.g. A1, A2 etc..) and by source of funding. The assessment used the MPI Guidelines and assumed that any project that can be classified according to the themes and sub-themes in Appendixes 1 and 2 qualifies as
CC&GG investment and is included in the analysis.
The data on 2015 investment belonged to the MTIP for 2011-2015 and is assessed only briefly. The review looks more thoroughly into the data on 2016 and 2017 investment, which belonged to the MTIP for 2016-2020.
CC&GG INVESTMENT IN 2015
In 2015, there were in total 927 climate relevant projects implemented in 13 provinces in the Mekong Delta, with total CC&GG investment of 8,210 billion VND, equivalent to 357 million USD. CC&GG investment data by province is given in Figure 5 below.
Adaptation accounted for 93.5% of 2015 expenditure, mitigation for 1.2% and the remaining 5.3% contributed to both adaptation and mitigation.
Figure 6 presents the analysis of CC&GG investment by theme, as defined in the MPI Guidelines and
shows that six themes accounted for 82.9% of total climate expenditure in 2015 (i.e. sustainable transport development, sustainable urban development, and sustainable management of water sources, irrigation, coastline protection and water drainage).
Figure 5. CC&GG investment in the Mekong Delta in 2015 (billion VND)
HAU GIANG
BEN TRE
VINH LONG
CAN THO
DONG THAP
TRA VINH
LONG AN
KIEN GIANG
SOC TRANG
AN GIANG
CA MAU
BAC LIEU
TIEN GIANG
198
12951329
487
848
411
674
261
649
468
262
839
490

PAGE 43
The 2015 CC&GG investment involved 17 themes as described in the MPI Guidelines. Some themes play an important role in the regional economy but have low CC&GG investment (e.g. agriculture accounted for only 3.5% of climate expenditure and fisheries for only 2.6%). This is explained by the fact that many of the other themes are serving agriculture and fisheries (e.g. irrigation, coastal, river, water, transport …) and that most of the investment in agriculture and fisheries is private investment.
CC&GG INVESTMENT IN 2016 AND 2017
Figure 7 shows that the total CC&GG investment in
the MD in 2016 and 2017 was 19,555 billion VND, with an increase of 0.6% from 9,747 billion VND in 2016 to 9,808 billion VND in 2017. The share of CC&GG investment in total investment in the MD declined from 33.3% in 2016 to 28.2% in 2017, showing that, whilst there was an increase in absolute terms in 2017, CC&GG investment took a smaller share of total public investment.
Investment in sustainable urban development, climate change information, agriculture and fisheries experienced an increase in 2017 while the other themes declined, as shown in Figure 7.
Figure 7. CC&GG investment in the MD in 2016 and 2017 by theme
Planning: 0.1%
Electricity: 0.1%
DRR: 2.4%
Urban: 19.1%
Transport: 23.2%
Waste: 2.2%
Agriculture: 3.5%
Forestry: 3.2%
Health: 1.2%
Planning
Electricity
DRR
Urban
Transport
Waste
Agriculture
Forestry
Health
Irrigation: 11.2%
Water: 7.8%
Fisheries: 2.6%
Biodiversity: 1.6%
River: 12.3%
Coastal: 9.4%
Energy Efficiency: 0.0%
Industry: 0.2%
Figure 6. Investment share by theme, all provinces in 2015
Irrigation
Water
Fisheries
Biodiversity
River
Coastal
Energy Efficiency
Industry
Total
2016
9747
0
1000
2000
3000
4000
5000
6000
7000
8000
9000
10000
2017
9808

PAGE 44
CC&GG projects are classified into 3 main objectives: Adaptation (A), Mitigation (M) and adaptation & mitigation (AM). Most of the projects related to forestry and afforestation make contributions to both adaptation and mitigation and these constitute the majority of AM projects. Table 8 below indicates that in 2 years of 2016 and 2017; 2,227 climate change projects in the 13 provinces were implemented, of
which 2,111 projects (94.8%) were for adaptation, 58 projects (2.6%) were for mitigation and 58 projects (2.6%) were for both adaptation and mitigation. The distribution of expenditure followed a similar pattern to that of the number of projects, with 95.3% of total expenditure for adaptation, 1.1% for mitigation and 3.6% for both.
Table 8. CC&GG expenditures in 2 years (2016-2017) in 13 MD provinces
NUMBER OF PROJECTS EXPENDITURE (VND BILL) IN 2 YRSNUMBER % AMOUNT %
Adaptation 2111 94.8% 18,639 95.3%Mitigation 58 2.6% 206 1.1%Both 58 2.6% 710 3.6%Total 2,227 100.0% 19,555 100.0%
Figure 8 presents CC&GG investment by theme, as defined in the MPI Guidelines. Sustainable urban development took 24.4% of total investment, followed by sustainable transport development at 20.4%, irrigation works at 11.8%, sustainable management of water sources at 8.4%, agriculture at 6.7%, coastline protection at 6.5% and water supply at 6.4%. Five other themes each accounted for between 1% and 5% of total CC&GG investment
(DRR, waste, forestry, fisheries, biodiversity). The total for energy, health care, electricity and planning accounted for about 1% of total CC&GG investment. This is partly explained by the fact that much of the CC&GG investment in these themes is private investment and was thus outside the scope of this CPEIR. Industrial wastewater treatment projects are classified under waste management and treatment.
Figure 8. CC&GG investment share by theme, all provinces in 2016 and 2017
Planning: 0.3%
Electricity: 0.2%
DRR: 3.1%
Urban: 24.4%
Transport: 20.4%
Waste: 3.0%
Agriculture: 6.7%
Forestry: 3.0%
Health: 0.7%
Irrigation: 11.8%
Water: 6.4%
Fisheries: 3.3%
Biodiversity: 1.6%
River: 8.4%
Coastal: 6.5%
Energy Efficiency: 0.1%
Industry: 0.1%

PAGE 45
Table 9 below summarizes the number of CC&GG projects and actual CC&GG investment by province in the 3 years of 2015, 2016 and 2017. The number of projects increased in 2016 but declined in 2017. However, CC&GG investment increased by 18.7% in 2016 and 0.6% in 2017. The provinces with the
highest increase in CC&GG investment in the past 3 years were Tien Giang, Vinh Long, Can Tho, Dong Thap and An Giang. The remaining provinces saw a reduction in investment in 2016 and 2017 and the reduction was particularly strong in Kien Giang, Ca Mau, Ben Tre and Hau Giang.
4.2 COMPARISON OF CC&GG INVESTMENT BY PROVINCE
Table 9. Number of CC&GG projects, CC&GG expenditures by province in 2015-2017
PROVINCESNUMBER OF PROJECTS
CC&GG EXPENDITURES (BILLIONS VND)
SHARE OF CC&GG INVESTMENT BY
YEAR OVER MTIP (%)2015 2016 2017 2015 2016 2017 2016 2017
Tien Giang 9 11 24 197.75 211.04 299.76 4.4% 6.3%Hau Giang 287 415 89 1295.32 1039.72 608.33 22.3% 13.1%Ben Tre 18 125 175 1329.25 1033.70 953.83 31.3% 28.9%Vinh Long 124 60 70 486.99 524.41 1191.71 11.6% 26.3%Can Tho 118 50 46 847.98 553.89 1392.47 5.1% 12.9%Dong Thap 47 57 52 410.84 1050.37 1333.65 16.9% 21.4%Tra Vinh 58 110 61 673.61 1622.89 1425.33 24.6% 21.6%Long An 120 416 159 261.08 1013.41 365.09 46.3% 16.7%Kien Giang 24 31 17 648.75 863.73 422.98 30.6% 15.0%Soc Trang 20 27 19 468.28 594.92 503.99 26.4% 22.4%An Giang 13 11 26 261.53 154.07 222.29 15.3% 22.1%Ca Mau 44 40 40 838.52 648.32 611.40 11.4% 10.8%Bac Lieu 46 49 47 490.34 436.30 476.92 20.8% 22.8%Total 928 1,402 825 8210.23 9746.77 9807.75 20.5% 18.5%
CC&GG INVESTMENT BY SOURCE OF FUNDS
The provinces provided data on source of funding at various levels of detail. Data collected from Can Tho, Long An, Dong Thap, Tien Giang and Tra Vinh provided source of funding for each project. In the other provinces, the source of funding was provided by the MPI budget allocation decision which gives the following sources.
● Sources of local capital include land use revenue, constructive lottery capital and preferential loans and other sources.
● Sources of central capital include capital from NTPs and TPs.
● ODA includes funding for the TP on climate change and green growth, which is fully financed
by ODA. It also includes ODA funding for projects that do not come under this TP but still make an implicit contribution to CC&GG.
● The table and figure show the source of funding in provinces in 2016 and 2017, based on the MPI budget allocation decisions.
Table 10 shows that, in all provinces, the majority of total investment, including non-CC&GG investment, was funded by the local state budget, which saw substantial increases associated with health, education and transport. The total investment funded by the central state budget, including non-CC&GG investment, fell in 2017 in all provinces, except for Ben Tre, Dong Thap and Tra Vinh.

PAGE 46
Table 10. CC&GG investment by source of funding by province 47
PROV. YEAR
INVEST. FOR
CC&GG (BILLION
VNĐ)
SHARE OF TOTAL INVESTMENT, INCLUDING NON-CC&GG, BY FUNDING SOURCE ACCORDING TO MPI'S
ALLOCATION DECISIONSHARE
OF CC&GG INVEST.
IN TOTAL INVEST.
(%)
LRF LF CBF OTHER CBF
ODA FOR
CC&GGOTHER
TOTAL INVEST. (BILLION
VND)
Tien Giang
2016 211.04 25% 53% 2% 14% 6% 0% 2,721.0 7.8%2017 299.76 33% 48% 4% 6% 6% 4% 2,620.2 11.4%
Hau Giang
2016 1,039.72 48% 35% 0% 0% 0% 17% 1,172.8 88.7%2017 608.33 95% 0% 0% 0% 0% 5% 1,287.7 47.2%
Ben Tre
2016 1,033.70 29% 48% 18% 0% 5% 0% 1,686.1 61.3%2017 953.83 22% 55% 18% 0% 2% 3% 2,230.5 42.8%
Vinh Long
2016 524.41 19% 65% 0% 0% 0% 16% 2,585.8 20.3%2017 1,191.71 20% 57% 0% 0% 0% 23% 2,709.0 44.0%
Can Tho
2016 553.89 49% 27% 7% 3% 7% 8% 3,887.1 14.2%2017 1,392.47 38% 33% 4% 0% 25% 0% 3,804.9 36.6%
Dong Thap
2016 1,050.37 41% 28% 10% 11% 10% 0% 3,072.3 34.2%2017 1,333.65 30% 42% 8% 10% 10% 0% 4,508.2 29.6%
Tra Vinh
2016 1,622.89 24% 19% 3% 28% 11% 15% 2,773.6 58.5%2017 1,425.33 21% 23% 4% 26% 17% 8% 3,238.0 44.0%
Long An
2016 1,013.41 15% 37% 5% 31% 0% 12% 4,856.1 20.9%2017 365.09 45% 50% 5% 0% 0% 0% 4,509.0 8.1%
Kien Giang
2016 863.73 59% 0% 5% 29% 1% 5% 2,920.0 29.6%2017 422.98 81% 0% 3% 10% 1% 5% 4,014.0 10.5%
Soc Trang
2016 594.92 57% 0% 9% 24% 5% 6% 1,266.0 47.0%2017 503.99 73% 0% 6% 12% 5% 4% 2,032.0 24.8%
An Giang47
2016 154.07 2017 222.29
Ca Mau
2016 648.32 45% 0% 7% 27% 8% 14% 1,495.0 43.4%2017 611.40 65% 0% 2% 13% 3% 17% 1,876.0 32.6%
Bac Lieu
2016 436.30 54% 0% 16% 18% 8% 4% 842.0 51.8%2017 476.92 82% 0% 1% 9% 8% 0% 1,907.0 25.0%
Total 2016 9,746.77 29,277.8 33.3%2017 9,807.75 34,736.5 28.2%
Note: LRF: Local/provincial revenue funds; LF: Lottery Fund; CBF: Central Budget; ODA: Official Development Assistance
Source: MPI Decision
47 An Giang does not have sufficient data on funding sources for 2016 and 2017

Figure 9. CC&GG investment and MPI Decisions by Province (VND bill)
Figure 9 shows that CC&GG investment funded by ODA went up in 2017 for Can Tho, Dong Thap, Tra Vinh, Kien Giang, Soc Trang and Bac Lieu but decreased in Tien Giang, Ben Tre and Ca Mau. The increase was highest in Can Tho, which increased by 3.5 times (from 264 billion VND in 2016 to 932.642 billion VND in 2017) and Bac Lieu, which increased by 2.18 times (from 67 billion VND to 146 billion). The increase in Ca Mau was achieved despite a slight drop in ODA for the TP on climate change and green growth, which shows there was a sharp increase in ODA projects that were not included in the TP on climate change and green growth but made implicit contributions to climate change adaptation and/or mitigation.
2016 2017
TIEN GIANG HAU GIANG BEN TRE
2016 2017 2016 2017 2016 2017 2016 2017 2016 2017 2016 2017 2016 2017 2016 2017 2016 2017 2016 2017 2016 2017
VINH LONG CAN THƠ DONG THAP TRA VINH LONG AN KIEN GIANG SOC TRANG CA MAU BAC LIEU
Local budget Loterry +other local budget Central budget: 6 CC&GG TPs Central budget:
ODA: CC&GG TP Other Budget plan CC&GG project

PAGE 48
EXPENDITURE BY OBJECTIVE
Figure 10 shows that adaptation is the main objective of the large majority of CC&GG investment in all provinces, with very few projects contributing to mitigation or both adaptation and mitigation. Long An, Can Tho and Bac Lieu saw the highest percentages of investment for mitigation projects, with 3.9%, 2.6% and 2.2% respectively. Mitigation projects were in such fields as biological by-products manufacturing, organic fertilizers from animal waste, straw, mud from aquaculture ponds, hospital waste and wastewater treatment (Long An), medical liquid
management, electricity power pump stations (Can Tho), rural electricity supply projects and power substations for rice processing plants (Bac Lieu), solar power traffic indicators and lights (Vinh Long).
Projects that involve both climate change adaptation and mitigation included: drainage and waste water treatment (Can Tho), erosion protection, sedimentation support, mangrove afforestation, improved food quality, biogas (Tien Giang, Ben Tre), forest protection and development (Ben Tre, Hau Giang, Dong Thap, Tra Vinh, Kien Giang, Soc Trang, Bac Lieu).
Figure 10. Balance between mitigation and adaptation by province, in 2016 and 2017
TIEN GIANG
0%
10%
20%
30%
40%
50%
60%
70%
80%
90%
100%
HAU GIANG
BEN TRE
VINH LONG
CAN THO
DONG THAP
TRA VINH
LONG AN
KIEN GIANG
SOC TRANG
AN GIANG
CA MAU
BAC LIEU
Adaptation Mitigation Both

PAGE 49
EXPENDITURE BY THEME
Figure 11 shows the expenditure by theme for each province, as defined in appendix 3 of the MPI Guidelines.
Investment in sustainable urban development accounts for the largest share in the region with 22% of CC&GG investment for the whole region. Provinces with big investments in this theme include: Can Tho 64%, Vinh Long 48%, Dong Thap 41%, An Giang 28%, Kien Giang 27% and Tra Vinh 19%.
Sustainable transport development accounted for 17% of total CC&GG investment in the region. The share of transport in total CC&GG investment was highest in Hau Giang where it was 49%, followed by Long An 42%, Ben Tre 37%, Soc Trang 25%, Dong Thap 24%, Tra Vinh 20% and Vinh Long 19%.
The theme with third largest share of CC&GG investment in the region is irrigation works, with 13% of total CC&GG investment in the region. The provinces with the highest investment on irrigation
were Tien Giang 26% of total CC&GG investment in the province, Long An and Kien Giang 25%, Soc Trang 18%, Ben Tre 17% and Hau Giang 12%.
The share of sustainable management of water resources in total CC&GG investment was 12% for the whole the region, 24% in Tien Giang, 13% in Can Tho and Hau Giang, 10% in Dong Thap and Soc Trang, 8% in Long An 8% and 7% in Kien Giang.
The remaining themes had shares of total CC&GG investment in the region of below 10%, with coastline protection taking 7%, mainly in coastal provinces (e.g. Bac Lieu, Ca Mau, Kien Giang and Tra Vinh). Drainage and water supply and agriculture both account for 7%, natural disaster mitigation 5%, afforestation 4%, and waste management and treatment and irrigation works both 3%. CC&GG
Figure 11. Share of CC&GG expenditure in 2016 & 2017 by theme
TIEN GIANG
0%
10%
20%
30%
40%
50%
60%
70%
80%
90%
100%
HAU GIANG
BEN TRE
VINH LONG
CAN THO
DONG THAP
TRA VINH
LONG AN
KIEN GIANG
SOC TRANG
AN GIANG
CA MAU
BAC LIEU
Planning
Electricity
DRR
Energy Efficiency
Industry
Agriculture
Forestry
Health
Urban
Transport
Waste
Irrigation
Water
Fisheries
Biodiversity
River
Coastal

PAGE 50
investment in fisheries was mainly in Soc Trang and Tra Vinh48.
In the themes of electricity generation and transmission, industry, energy and health care, there were few projects related to CC&GG in the Mekong Delta in 2016 and 2017, with investment of less than 1% the total CC&GG investment.
Figure 12 below presents the thematic breakdown of CC&GG investment in 2016 and 2017, presented in VND billion for each province. The figure shows that there were considerable changes in the thematic composition of expenditure between 2016 and 2017.
48 Projects involved: upgrading raised ponds, irrigation and infrastructure to support aquaculture activities; constructing centers for fisheries testing in order to improve productivity; and research institutes to create better shrimp breeds.
In many cases, this was caused by a few large projects stopping or starting. Over half the total CC&GG investment in the region was accounted for by the following: DRR in Vinh Long; urban projects in Can Tho and Dong Thap; transport projects in Hau Giang, Ben Tre, Dong Thap, Tra Vinh and Long An; agriculture in Ben Tre, Dong Thap and Tra Vinh; forestry in Bac Lieu; irrigation in Ben Tre, Vinh Long, Long An, Kien Giang and Ca Mau; river projects in Hau Giang, Can Tho, Dong Thap and An Giang; and coastal projects in Tra Vinh, Kien Giang, Ca Mau and Bac Lieu.
Waste
Agriculture
Forestry
Irrigation
Water
Fisheries
4.3 PROVINCIAL HIGHLIGHTS OF CC&GG INVESTMENT
This section reviews the key distinctive features of CC&GG investment in each province. The description of the nature of CC&GG investment uses the standard themes, as described in appendix 1 of the MPI Guidelines and listed in Table 5. For simplicity, the description uses the short titles presented in Table
5. ‘Urban’ refers to sustainable urban development (and not to other urban development projects), ‘rivers’ refers to sustainable water resource management and ‘water supply’ includes drainage.
For a more detailed analysis of CC&GG investment in the 13 provinces, please see Appendix 1.
CAN THO
CC&GG investment increased by 150% from 2016 to 2017, mainly because of a very large increase in
Figure 12. Breakdown of CC&GG investment in 2016 and 2017
TIEN GIANG
‘16 ‘17 ‘16 ‘17 ‘16 ‘17 ‘16 ‘17 ‘16 ‘17 ‘16 ‘17 ‘16 ‘17 ‘16 ‘17 ‘16 ‘17 ‘16 ‘17 ‘16 ‘17 ‘16 ‘17 ‘16 ‘17HAU
GIANGBEN TRE
VINH LONG
CAN THO
DONG THAP
TRA VINH
LONG AN
KIEN GIANG
SOC TRANG
AN GIANG
CA MAU
BAC LIEU
CC
&GG
Inve
stm
ent (
VND
Bill)
DRR
Urban
Transport
Biodiversity
River
Coastal
Other

PAGE 51
urban projects and a smaller increase in transport projects. The thematic breakdown of actual expenditure closely matched that of the MTIP, with 64% of investment over the two years going to urban and 26% going to rivers, transport and water supply and drainage. There were a further seven themes that accounted for the remaining 10% of CC&GG investment. This investment picture is in line with the current situation of CC&GG impact in Can Tho, which expects major impact from urban innudation due to flood and sea level rise, river erosion (in rivers of Hau, Can Tho, Cai Rang, Phong Dien, Tra Noc, etc.), salt intrusion and drought49.
The ten largest projects accounted for 87% of total CC&GG investment and were mainly devoted to urban, water resources, transport and water supply and drainage. The Urban Upgrading in Mekong Delta – Can Tho Subproject No.2 accounted for 49% of the expenditure on the top ten projects and the Can Tho City Development and Urban Adaptation Project accounted for 24%. These projects involve a mix of urban infrastructure, including flood control and waste management. Three of the projects involved river embankments and dikes. There was one road project and one bridge project, both with water management dimensions, and one water supply project. Funding for the biggest ten projects came from all sources, including ODA (33%), NTPs/TPs 19%, local budget 16% and lottery 15%.
HAU GIANG
Hau Giang faces droughts, salt intrusion in the two estuaries of Cai Lon and Ngan Dua rivers, water shortage in the dry season, flooding in the districts of Phung Hiep, Vi Thuy, Long My and Vi Thanh city and river bank erosion50.
CC&GG investment in Hau Giang fell by 41% in 2017, despite an increase in total investment of 10%. The fall came largely in transport (which accounted for 49% of total CC&GG investment in 2016 and 2017), water resources (13%) and urban (9%). There were modest increases in investment in irrigation (12%) and water supply (6%). Other sectors were small and accounted for only 11% of total CC&GG investment.
The key CC&GG themes in the MTIP were irrigation, transport, urban and water supply. Actual investment deviated from MTIP significantly, with actual investment on transport and rivers being over double
49 Climate change action plan of Can Tho50 Climate change action plan of Hau Giang51 Climate change action plan of Long An
the MTIP share and actual investment in urban, irrigation and water supply being much less than the MTIP share.
CC&GG investment is spread across a relatively large number of projects with the largest ten projects accounting for only 52% of total CC&GG investment. The ten largest projects included 5 road projects and 5 projects relating to embankments, canals and dykes. No data was available on the source of funding for projects.
LONG AN
The main climate change risks in Long An are: erosion in Vam Co river; inundation in urban areas; salt water intrusion in Rach Dua, Rach Giong, Vam Co Dong rivers; lack of domestic water; and flooding due to sea level rise in Long Huu Dong, Long Huu Tay and Can Duoc districts51.
Long An saw a sharp decrease of 64% in CC&GG investment in 2017, which compares with a decline in total public investment of 7%. The analysis of ten largest projects suggests that the drop in CC&GG investment was caused mainly a large drop in the local budget and the collapse in ODA funding for CC&GG investment. The most important themes in CC&GG investment were transport (35% of total CC&GG investment in 2016 and 2017), water supply (25,9%), irrigation (21% of total) and rivers (7%).
Actual expenditure in 2016 and 2017 follows a roughly similar pattern to that in the MTIP, which focused on transport, irrigation, rivers, water supply and urban. The shares of actual CC&GG investment on urban and on rivers were significantly lower than the MTIP and spending on water supply and irrigation was higher.
The ten largest projects account for 48% of total CC&GG expenditure, suggesting that the province has a large number of CC&GG projects. The largest project is the Water Supply Project Hoa Khanh Tay, which accounts for 16% of total CC&GG investment, followed by the Phuoc Hoa Irrigation Sub-project, which accounts for 10% of total CC&GG investment. The other 8 larger projects involve a range of urban, transport and water related projects. The local budget accounted for 43% of funding for the ten largest projects, with NTPs and TPs accounting for 25%, ODA 14% and lottery 10%.

PAGE 52
TIEN GIANG
Tien Giang faces risks from flooding, sea level rise, salt intrusion, drought, lack of water for domestic and agriculture production and landslides.52
Tien Giang saw an increase in CC&GG investment of 42% in 2017 at a time when there was a drop in total public investment. The largest theme of CC&GG investment was disaster risk reduction (36% of CC&GG investment in 2016 and 2017), followed by irrigation (26%), water resources (24%) and coastal protection (10%). The remaining themes accounted for only 4%. There was a large increase in irrigation expenditure and in water resources and a small drop in disaster risk reduction.
The MTIP allocations to CC&GG investment focused on transport, irrigation, urban and agriculture. Actual CC&GG investment followed a very different pattern to the MTIP, with DRR, irrigation, rivers and coastal all being much higher and urban and transport having no actual expenditure, despite having large MTIP allocations.
The largest ten projects accounted for 88% of total CC&GG investment. Two ADB projects on flood control and salt intrusion (in Ba Rai – Phu An and Go Cong) accounted for 45% of total CC&GG expenditure. Other large projects included work on dykes and embankments, plus a storm shelter for fishermen and an agriculture and biogas project. The data available on funding sources is limited, but 69% came from domestic sources and 31% from ODA.
BEN TRE
Being bordered by the sea, Ben Tre is seriously affected by sea level rise, saline intrusion and river landslide.
Total CC&GG investment in Ben Tre fell slightly despite an increase in total public investment. The fall in CC&GG investment appears to be associated with a decline in ODA funding for CC&GG projects. Transport accounts for 37% of total CC&GG investment in 2016 and 2017, with irrigation (17%) and agriculture (15%) also important. Four other themes (water supply, disaster risk reduction, water resources and biodiversity) each accounted for about 5%. Other themes accounted for 10%.
The MTIP contribution to CC&GG investment focused on transport, agriculture, irrigation and
52 Climate change action plan of Tien Giang
urban. Actual CC&GG investment shares followed the MTIP shares fairly closely, with actual transport and urban shares being slightly lower than MTIP and irrigation and agriculture being slightly higher.
The largest ten projects accounted for 53% of total CC&GG investment with the two largest (in transport and irrigation) accounting for 27% of total CC&GG investment. Four of the top ten projects were in transport and the others were in irrigation, rural infrastructure, storm shelters for fishermen, salinity protection and tourism infrastructure.
TRA VINH
Tra Vinh faces challenges associated with climate change affecting saline intrusion, tides, erosion and sedimentation.
CC&GG investment in Tra Vinh fell by 12% in 2017, compared to an increase in total investment of 17%. The most significant reasons for the fall were declines in coastal, transport and irrigation projects, which were slightly larger than the rise in urban and fisheries projects. There were a wide range of projects, with the most important themes being transport (20% of CC&GG investment in 2016 and 2017), urban (19%), agriculture (14%), coastal (12%) and fisheries (11%). The following themes each contributed between 2% and 5%: forestry, bio-diversity, health, river, DRR, waste and irrigation.
The main CC&GG themes covered by the MTIP were agriculture, transport, urban, irrigation and coastal. The pattern of actual investment was reasonably close to that in the MTIP, although urban, transport, fisheries and coastal were higher and agriculture and irrigation were lower. There was some small actual spending on energy that was not included in the MTIP and a small allocation for CC&GG planning in the MTIP that has not yet featured in actual investment.
The ten largest projects account for 59% of total CC&GG investment and covered a wide range of themes, with all the main themes being represented by at least one of the largest projects. The largest ten projects were funded mainly by NTPs/TPs (47% of total funding for the projects) and ODA (32%).
VINH LONG
Vinh Long is a province located in the core zone of the Mekong Delta between the two main tributaries of the Mekong River, the Tien and Hau Rivers. Climate
PAGE 53
change increases saline intrusion and coastal erosion. In addition, the province faces more severe heat waves resulting in drought in the dry season and severe storms that cause urban floods.
CC&GG investment in Vinh Long increased dramatically by 2.3 times from 2016 to 2017. This increase was caused mainly by the increase in urban projects, combined will significant increases in irrigation and river. The four largest themes (urban, transport, irrigation and water supply) accounted for 91% of total CC&GG investment. This investment picture is consistent with the context of urban flooding and and river bank erosion caused by the impacts of climate change in Vinh Long53.
According to the Vinh Long DPI, the CC&GG investment of Vinh Long increased mainly because of projects related to saline intrusion because, in 2016, Vinh Long was heavily affected by saline water and the agricultural sector has not yet recovered. Therefore, although the budget is still limited, the province has focused on implementing irrigation projects to prevent salinization and transforming plant varieties and livestock to adapt to climate change, reflected in the large projects, including: Mang Thit mangrove cover; Northern Vung Liem saltwater intrusion prevention system; and upgrading and expansion of aquatic breeding farms of Vinh Long province.
The MTIP contribution to CC&GG investment was concentrated in urban, transport and irrigation. The thematic shares of actual CC&GG investment closely followed the distribution in the MTIP, although there was an allocation for DRR in the MTIP that has not yet featured in actual investment.
The ten largest projects accounted for 64% of total CC&GG investment. Half the projects involved river dykes, mostly for urban flood protection. There were also projects related to irrigation, transport and fisheries. The data on funding sources was insufficient to allow for an analysis of the different funding contributions.
DONG THAP
Urban flooding and salinity are the two the biggest impacts of climate change in Dong Thap.
Dong Thap saw a large increase of 47% in total public investment in 2017 and CC&GG investment
53 Vinh Long climate change action plan
increased by 27%. The increase came mainly from urban, transport and agriculture projects and this more than offset a significant reduction in rivers. These four themes accounted for 89% of total CC&GG investment.
The CC&GG projects in the MTIP focused on urban, transport, rivers and agriculture and the thematic composition of actual CC&GG investment in 2016 and 2017 closely followed the composition of the MTIP.
The largest ten projects accounted for 80% of total CC&GG investment in 2016 and 2017. All the largest projects were for the four main themes (i.e. urban, transport, agriculture and river) except for one water supply project. Funding for CC&GG investment came from all four main sources, including ODA (34%), lottery (27%), local budget (20%) and NTPs/TPs (15%).
AN GIANG
Droughts, urban flooding from sea level rise, tides, lack of fresh water and river bank erosion are the major impacts of climate change in An Giang.
There was an increase of 44% in CC&GG investment in An Giang, due largely to a major increase in rivers investment and the introduction of a large investment in agriculture. These more than offset a large reduction in urban investment and smaller reductions in waste and water supply. The three most important themes accounted for 84% of total CC&GG investment in 2016 and 2017, including: rivers (41%), urban (28%) and agriculture (15%). Many of the projects that were classified under the rivers theme also make an important contribution to irrigation.
The MTIP contribution to CC&GG investment was dominated by rivers, urban and agriculture and the thematic shares of actual CC&GG investment closely follow the thematic share in the MTIP.
The ten largest projects accounted for 85% of total CC&GG investment in 2016 and 2017. The largest project was an urban project that had almost no expenditure in 2017. The next five largest projects started in 2017 and were mainly related to water resources (i.e. ‘river’), plus one agriculture project. There was insufficient data to allow for a breakdown of funding sources.
PAGE 54
BAC LIEU
Due to its location next to the East sea and its interlacing river system and low terrain, Bac Lieu is heavily influenced by sea level rise, typhoon, tropical low pressure, flooding, salinity intrusion, tides (East sea and West sea), drought and landslide.
CC&GG investment in Bac Lieu increased by 9% in 2017, caused largely by increases in urban and coastal projects. The other themes all saw a decline in CC&GG investment of varying significance, with the largest declines coming in rivers and irrigation projects. Four themes accounted for 85% of total CC&GG investment in 2016 and 2017, including forestry (28%), coastal (23%), urban (17%) and rivers (17%). Because of the importance of forestry projects, Bac Lieu included a contribution to mitigation which was small, but larger than in most other provinces.
The MTIP in Back Lieu concentrated on forestry and coastal investment and had the highest share of investment for forestry of all the provinces. The thematic distribution of actual CC&GG investment followed the MTIP distribution fairly closely, although the share of actual urban investment was higher than in the MTIP and forestry was lower and there was some actual investment in transport, waste and irrigation which was not included in the MTIP.
The top ten projects accounted for 70% of total CC&GG investment and covered the four main themes for CC&GG investment in the province. The three largest projects related to urban and forestry themes. There was insufficient data to allow for an analysis of funding sources for the top ten projects.
CA MAU
Sea level rise, coastal erosion, urban flooding, erosion and drought are the major impacts of climate change in Ca Mau. In the climate change action plan of Ca Mau, key tasks to address climate change include: flood prevention for urban areas and industrial areas, water resources planning, transportation, conservation of biosphere reserves, restoration and protection of mangroves.
Ca Mau saw a small drop of 6% in CC&GG investment in 2017. This was caused mainly by a major drop in irrigation, plus smaller drops in coastal, water supply and DRR themes. There was a significant increase in urban and forestry projects. About a quarter of the drop was caused by a decrease in funding in the TPs related to CC. The main themes represented were
urban (24% of total CC&GG investment in 2016 and 2017), coastal (21%), irrigation (19%) and DRR (12%).
The MTIP contribution to CC&GG investment focused on coastal and DRR themes. The thematic distribution of actual CC&GG investment in 2016 and 2017 differed significantly from the MTIP, with actual investment being higher for urban, irrigation, water supply and waste and lower for DRR and coastal protection.
The top ten projects for Ca Mau account for 72% of total CC&GG investment and covered a wide range of themes. The four largest were devoted to urban, coastal and transport. There was insufficient data to analyze the sources of funding for each project.
KIEN GIANG
The main risks associated with climate change faced by Kien Giang are sea level rise, urban flooding, salinity intrusion and droughts.
CC&GG investment in Kien Giang dropped by 51% in 2017, despite an increase in total public investment of 38%. The drop in CC&GG investment appears to be caused by the fact that many CC&GG projects stopped in 2016 and were not replaced by new CC&GG projects. The drop was especially marked for irrigation projects which accounted for nearly a third of all CC&GG investment in 2016 and were virtually all stopped in 2017, mainly because of the closure of three large projects. The most important themes were irrigation, urban, coastal and water supply, with significant smaller contributions from rivers and forestry.
The MTIP contribution to CC&GG investment in Kien Giang focused on urban, fisheries, water supply, coastal and forestry projects. Actual CC&GG investment was greatly different to that envisaged in the MTIP, with urban, irrigation and coastal being higher and DRR, waste, forestry, water supply, fisheries and biodiversity being lower.
The top ten projects accounted for 75% of all CC&GG investment, with 42% of all CC&GG investment coming from two large projects, one urban and one irrigation. All the remaining top ten projects were involved in managing water storage, irrigation and flooding. It was not possible to identify the sources of funding for the top ten projects.
According to the province, the above analysis is based on aggregate data from the public investment

PAGE 55
plan approved by the provincial People’s Council for medium and long-term plans, mainly from development investment sources, not including other sources such as environmental care, flood and storm prevention, non-governmental aid, corporate sponsorship etc.. In addition, there are a number of investment projects where some components are related to climate change but which may have been missed in the analysis.
SOC TRANG
Urban flooding, salinity intrusion and drought are the major impacts of climate change in Soc Trang. CC&GG investment fell by 15% in 2017, despite an increase in total investment of 61%. The fall in CC&GG investment was caused largely by falls in transport, waste, forestry, water supply and coastal, despite an increase in irrigation and fisheries. The most important themes of CC&GG investment were transport (25% of total CC&GG investment in 2016 and 2017), irrigation (18%), waste (14%), fisheries (13%) and rivers (10%). The remaining 20% was accounted mainly by coastal, agriculture, water supply and forestry.
The priority CC&GG themes in the Soc Trang MTIP were coastal, waste, irrigation and transport. The actual spending pattern seems to have been guided partially by the MTIP, but actual spending was significantly higher for transport, fisheries and rivers and lower for waste and coastal protection. The MTIP included an allocation for DRR which has not
yet featured in actual investment.
The top ten projects in Soc Trăng accounted for 65% of total CC&GG investment, with the largest projects contributing to fisheries, irrigation, waste and rivers. There were also four large road projects and a coastal project. No data was available on the source of funding.
4.4 THE MID-TERM INVESTMENT PLAN (2016-2020)
The Table below compares the actual CC&GG investment for 2016 and 2017 with the CC&GG investment planned in the MTIP 2016-2020, showing the extent to which actual CC&GG investment is meeting the targets set in the MTIP. Assuming that the MTIP plans for roughly equal expenditure in each year, a province can be considered to be above target if actual investment is over 40% of the MTIP. Of the 13 provinces in the Mekong Delta, six were above target (Ben Tre, Tra Vinh, Long An, Kien Giang, Soc Trang and Bac Lieu. A further four were close to target, with actual investment in 2016 and 2107 at between 35% and 40% of the MTIP (Hau Giang, Vinh Long, Dong Thap and An Giang. The remaining three were significantly below target (Tien Giang, Can Tho and Ca Mau).
NO. PROVINCECC&GG INVESTMENT (VND BILL) CC&GG EXPENDITURE IN 2 YEARS 2016 &
2017 COMPARED WITH PLANNED CC&GG &GG INVESTMENT IN MTIP 16-202016 2017 MTIP 2016-
20201 Tien Giang 211.037 299.762 4782.429 10.7%2 Hau Giang 1039.723 608.334 4657.559 35.4%3 Ben Tre 1033.696 953.825 3302.388 60.2%4 Vinh Long 524.414 1191.711 4529.076 37.9%5 Can Tho 553.891 1392.471 10827.924 18.0%6 Dong Thap 1050.372 1333.651 6224.161 38.3%7 Tra Vinh 1622.891 1425.334 6596.281 46.2%8 Long An 1013.413 365.086 2188.786 63.0%9 Kien Giang 863.727 422.982 2820.701 45.6%10 Soc Trang 594.921 503.986 2701.404 40.7%11 An Giang 154.067 222.290 1007.875 37.3%12 Ca Mau 648.320 611.401 5683.070 22.2%13 Bac Lieu 436.299 476.921 2094.718 43.6%Average of region 38.4%
Table 11. Actual annual CC&GG investment in 2016-2017 compared with planned CC&GG investment
in the MTIP

PAGE 56
Figure 13. CC&GG actual expenditure in 2016& 2017 compared to CC&GG budget plan in MTIP 2016-2020
Figure 14. CC&GG investment plan in MTIP 2016-2020 of provinces by theme
0
2000
4000
6000
8000
10000
12000
CC&GG expenditure in 2 years (2016 & 2017) CC&GG budget plan in MTIP 2016 - 2020
TIEN GIANG
HAU GIANG
BEN TRE
VINH LONG
CAN THO
DONG THAP
TRA VINH
LONG AN
KIEN GIANG
SOC TRANG
AN GIANG
CA MAU
BAC LIEU
Figure 14 below shows the investment in CC&GG themes/fields in the MTIP for each province. 100%
90%
80%
70%
60%
50%
40%
30%
20%
10%
0%
DRR
Other
Coastal
River
Fisheries
Water
Irrigation
Forestry
Agriculture
Waste
Transport
Urban
TIEN GIANG
HAU GIANG
BEN TRE
VINH LONG
CAN THO
DONG THAP
TRA VINH
LONG AN
KIEN GIANG
SOC TRANG
AN GIANG
CA MAU
BAC LIEU

PAGE 57
The MTIP projects were classified according to the CC&GG themes in the MPI Guidelines. In general, the themes covered by actual CC&GG investment in 2016 and 2017 were consistent with the MTIP thematic distribution for all provinces expect Bac Lieu, Tra Vinh and Long An: Bac Lieu had additional projects in transport and waste; Tra Vinh has projects in energy; and Long An has projects in health and energy.
There was considerable variation in the extent to which the thematic shares of actual CC&GG investment followed the same pattern as specified in the MTIP. In eight provinces (Can Tho, Long An, Ben Tre, Tra Vinh, Vinh Long, Dong Thap, An Giang and Bac Lieu), the actual investment followed the MTIP guidance quite closely, but the shares were markedly different in the other provinces. The difference between the annual budget and the MTIP may be due to changes in priorities or differences in the classification of the same project, especially for projects that contribute to multiple themes.
Looking across all 13 provinces, the CC&GG themes that received the highest share of CC&GG investment in the MTIPs were urban (31% of all CC&GG investment) and transport (16%). All provinces have MTIP allocations for urban and all provinces except Bac Lieu have MTIP allocations for irrigation, which accounts for 10.3% of all CC&GG investment in the MTIPs. Coastal protection is particularly important in coastal provinces such as Ca Mau (where it accounts for 28% of total CC&GG investment in the MTIP), Bac Lieu (24%), Soc Trang (21%) and Kien Giang (12%).
4.5 EXPENDITURE PER CAPITA AND AS A % OF GRDP
Figure 15 below shows CC&GG investment per capita as well as the proportion of expenditure on CC&GG by provinces compared to local gross domestic product (GRDP) and as a percentage of total provincial budget, as allocated by MPI. The figure uses the assumption that the GRDP per capita of Bac Lieu is 11.3 million; Ca Mau: 13.3 million; Kien Giang: 12.3 million, etc..
The results in Figure 15 show that Tra Vinh, Hau Giang, Ben Tre, Dong Thap, Long An, Ca Mau, Kien Giang and Bac Lieu are the provinces with the highest CC&GG investment per capita, as well as ratio of CC&GG investment to GRDP and % of the total budget. This may reflect higher levels of vulnerability and higher levels of dependence on natural resource-based activities, including agriculture and fisheries.
The results presented in Figure 15 can be compared with similar studies conducted in countries and governments in South and Southeast Asian countries. Table 13 summarizes a number of indicators related to the ratio of investment to climate change to GDP, as well as to total budget. However, this comparison needs to be treated with caution as it depends on the methodology for identifying and classifying investment in climate change in each country as outlined in the Methodology section.

PAGE 58
Table 12. CC&GG expenditure of other South and Southeast Asian countries
COUNTRY/STATE (% GDP) (% BUDGET) SOURCEBangladesh 4.1 22.6 (Finance 2014)Cambodia 9.2 40.0 (MoE 2015)Nepal 1.8 8.2 (Bhattarai, Bogati et al. 2011)India - Odisha 1.2 4.2 (ACT 2016)India - Kerala 1.8 10.6 (ACT 2016)India - Chhattisgarh 7.3 33.2 (ACT 2016)India - Bihar 7.3 33.2 (ACT 2016)India - Assam 13.4 60.5 (ACT 2016)
CC
&GG
Exp
endi
ture
as
% o
f GR
DP
and
% b
udge
t
CC
&GG
Exp
endi
ture
VN
D/p
erso
n
90%
100%
80%
1,600,000
1,800,000
70%
1,400,000
60%
120,000
50%100,000
40%800,000
30%600,000
20%400,000
10% 200,000
0% 0TIEN
GIANGHAU
GIANGBEN TRE
VINH LONG
CAN THO
DONG THAP
TRA VINH
LONG AN
KIEN GIANG
SOC TRANG
AN GIANG
CA MAU
BAC LIEU
VND per capita %GRDP %Total budget
Figure 15. CC&GG Expenditure 2016 as% of GRDP, % of total budget, and per capita
(Note: An Giang does not provide capital data in the MPI Decision)

PAGE 59
CONCLUSIONS AND RECOMMENDATIONS
05
© GIZ

PAGE 60
This review pilots the use of MPI Guidelines for classifying public investment in CC&GG and offers lessons for reporting on the Nationally Determined Contributions (NDCs) under the Paris Agreement as well as for future reporting requirements for CC&GG investment in the country.
CC&GG investment in the Mekong Delta
CC&GG investment in the Mekong Delta increased from 8,210 billion VND in 2015 to 9,808 billion VND in 2017, equivalent to an increase from 367 to 426 million USD. MPI reported in 2017 that the total requirement for adaptation investment in the Mekong Delta was 153,000 billion VND. It would therefore take about 16 years to deliver this requirement, at the current rate of CC&GG investment. However, further work is required to ensure that the methods used for estimating investment needs are consistent with those used in classifying CC&GG investment. Further work should also focus on the effectiveness of CC&GG investment in delivering the required adaptation.
CC&GG investment accounted for 33.3% of total public investment in 2016 and 28.2% in 2017. Further work is required to determine whether the fall in CC&GG’s share in total investment reflects: a) CC&GG policy; b) the side-effect of policies that give priority to development programmes that are less focused on CC&GG (e.g. health and education); or c) incidental changes in the closure and starting of large projects, without any explicit policy prioritization.
Most CC&GG investment was not explicitly allocated for CC&GG and made only indirect contributions to CC&GG. Adaptation accounted for 95.3% of CC&GG investment, with 1.1% for mitigation and 3.6% for both adaption and mitigation projects (mainly in drainage and waste water treatment, afforestation, agriculture and biogas programs).
The main focus of CC&GG investment was in: urban sustainable development (16% to 33% of total CC&GG investment from 2015 to 2017); sustainable transport (19% to 22%); irrigation (9% to 15%); sustainable management of water resources (7 to 12%) and coastline protection (5.0% to 9.4%). This suggests that much of the focus of public investment is in infrastructure relating to flood protection (including roads and drainage), which is to be expected in a vulnerable delta region. Many of the projects combine investment in the construction of infrastructure and in the efficient management of that infrastructure.
The focus of CC&GG investment in the medium-term
investment plan (2016-2020) is on sustainable urban development (accounting for 30.3% of all CC&GG investment in the MTIP); transport (15.8%); irrigation (10.3%); agriculture (8.8%); sustainable management of water sources (8.1%) and coastline protection (6.7%).
Experience with using the MPI Guidelines
The MPI Guidelines define two distinct steps for classifying CC&GG investment: Step 1 identifies the objectives (i.e. adaptation, mitigation or both) and Step 2 identifies the theme listed in appendix 1 and the sub-theme listed in appendix 2. The experience of this CPEIR was that it was easiest to do these two steps at the same time and, for some projects, it was easiest to start with Step 2. These two steps can often be done initially using the project title and further refinement can then be added by looking into the objectives, background and activities, as described in project approval decisions and project description documents. This recommendation is consistent with the substantial change in the official version issused in July 2018, which allows the reference to appendixes during step 1.
The MPI Guidelines require an explicit mention of CC&GG in project objectives, background and activities. This requirement has the advantage of providing incentives for project designers to demonstrate that they have taken CC&GG into account. However, there are currently very few projects that meet this requirement and the CPEIR has therefore extended the analysis to include also any projects that make an implicit contribution to CC&GG. The CPEIR does this by assessing whether a project relates to any of the themes and sub-themes in appendixes 1 and 2. When classifying according to the themes and sub-themes, it is difficult to use a system based on keywords, because the range of different projects is large and similar concepts may be expressed with different key terms. However, keywords may still provide a useful starting point and the list of keywords that indicate a potential CC&GG project could be extended to include: climate change, adaptation, recovery capability, mitigation, greenhouse gases, sea level rise, the classification should take into account other terms such as saline water intrusion control, riverine landslide protection, flood control, flood relief, saline water control, sea water intrusion prevention, inundation prevention, drought prevention, sedimentation support, inundation relief, disaster relief, enhanced drainage and safe water supply.

PAGE 61
Collecting sufficient project documents (e.g. project descriptions and feasibility study reports) after the project had been implemented was a major challenge and often required more time than was available. This is partly because project documents are often available only in print copies and were kept in document warehouses or with project investors or sponsors. Project approval decisions are easier to collect but this also takes time, particularly for projects where the decisions date back to 2015 or earlier. Furthermore, there are variations across provinces in the practices used for archiving and reporting of data on public investment. Whilst this CPEIR has been able to classify all CC&GG investment by theme and sub-theme, it has only been able to analyse funding source for a sample of the 10 typical largest CC&GG projects, for 2016 and 2017, in 5 of 13 provinces (Can Tho, Long An, Tien Giang, Tra Vinh and Dong Thap).
There are many projects that contribute to several of the themes defined in the MPI Guidelines. This applies particularly for projects involved in water resources which may deliver benefits related to urban development, roads, irrigation, drainage, coastal protection, river management and DRR. The MPI Guidelines encourage such projects to be broken down into components, with each component classified under a different theme. However, this is difficult for two reasons: firstly, it is rare to find evidence on components in the project documents; and, secondly, even if components do exist, they often relate to activities that share the same benefit and contribute to several themes. This CPEIR took a practical approach to this challenge and, if evidence on components was not available, it attempted to identify which of the themes was the most important for the project and classified the whole project as contributing to that theme. There is no easy solution for adopting a more scientific approach to this, without getting involved in more formal appraisal of the various types of benefits related to CC&GG, which is methodologically challenging and would require a major investment in capacity. There may be opportunities for exploring this work in future, but it is unlikely to feature as a routine part of the planning and budget process and will probably be limited to the appraisal of a few large projects or to occasional evaluation studies and academic research.
Within each theme, some CC&GG projects can be classified by one or more sub-themes in Appendix 2 of the MPI Guidelines. The MPI Guidelines include an ‘Other’ sub-theme for each theme and this can
be used to classify projects that contribute to several sub-themes within the theme. For example, forestry projects normally include multiple objectives and it is not easy to place them in one sub-theme. We have classified such projects under the ‘Other’ sub-theme, unless one of the sub-themes is clearly dominant. Many difficulties were also faced with the classification of transport projects. The project documents for road projects rarely mention CC&GG but, when the details in the project descriptions are reviewed, there is often reference to topics related to flood control and prevention, drainage and road base construction as well as to some mitigation benefits. We suggest that there should be clearer guidance on how to classify transport projects related to sub-theme A5.4.
The MPI Guidelines refer to CC&GG and this CPEIR has used the term CC&GG in line with the MPI Guidelines. However, the themes and sub-themes of the MPI Guidelines relate entirely to climate change. Many of these themes and sub-themes also contribute to green growth, but there are some dimensions of green growth that are not covered (e.g. pollution, minerals and some biodiversity projects). For this reason, it is necessary to broaden the list of themes and sub-themes described in Appendix 2 by adding topics that relate to green growth and not to climate change.
The pilot application of the MPI Guidelines suggests that it should be possible to improve the standardization of the way themes and sub-themes are described in the guidelines to improve the objectivity of the classification. In particular, describing case studies of how to deal with projects that address several themes and/or sub-themes would be helpful. The CPEIR also found that retrospective use of the guidelines is time-consuming and the classification would be more efficient and useful if it were applied at the design phase of projects. This would allow it to influence project descriptions and procedures for monitoring and management and would provide a more robust basis for monitoring CC&GG investment.
Finally, the MPI Guidelines include no requirement to distinguish between the relative importance of adaptation and/or mitigation, compared to routine development. Past CPEIRs have done this by adopting a CC&GG relevance score (or CC%). Estimating the CC% is certainly a challenging task and needs to be managed with care. However, ignoring the CC% means that patterns of CC&GG investment tend to be dominated by large infrastructure projects that make relatively small contributions to CC&GG. This leads

PAGE 62
to high estimates of total CC&GG investment and is likely to be a reason for some of the unexpectedly large differences in CC&GG investment between years and provinces. Finally, whilst the estimation of CC&GG relevance is challenging, it provides an essential link to understand the effectiveness of CC&GG investment in reducing the impact of CC, which is essential in estimating the adequacy of CC&GG investment. Once the current MPI Guidelines are embedded, it may be necessary to consider adding an approach to estimating CC&GG relevance.
Implications for future planning and budgeting
This CPEIR has piloted the use of the MPI Guidelines to analyse investment that has already been approved, either in the annual budget or in the MTIPs. A refined version of the MPI Guidelines could also be used to influence the preparation of new annual budgets and the new MTIPs for 2021-2025. This would be likely to show that the new budgets and MTIPs involve an increase in absolute CC&GG investment. It would also show whether the annual increase in CC&GG investment is faster than past increases in CC&GG investment. Finally, and perhaps most important, it would show whether CC&GG investment as a proportion of total public investment continues to decline, as it did in 2017, or whether it will recover in new budgets and MTIPs. This analysis could be provided both in aggregate and by province and theme, so that those provinces and themes that have relatively low rates of increase in CC&GG investment can be investigated to check whether this reflects government policy in the province.
The value of this forward-looking assessment depends strongly on how quickly the analysis can be done. The last year analysed by this CPEIR was 2017 and the CPEIR will be published in time to influence only the 2020 annual budget, as well as the new MTIP. Once the MPI Guidelines are approved, and capacity is built to apply the Guidelines, it should be relatively easy to produce annual CPEIRs in the first few months of each year, classifying the latest budget and hence informing the next year’s budget. Thus, if the guidelines are applied to the 2019 budget in the first months of 2019, the results should influence the preparation of the 2020 budget, as well as the new MTIP. In theory, it should ultimately be possible to apply the MPI Guidelines during the budget preparation process, so that tables of CC&GG investment can be prepared automatically,
54 CCIA involves whatever appraisal practices are normally used (e.g. rapid appraisal, participatory methods, cost benefit analysis…) and conducts the appraisal first without taking climate change into
in September and October, based on the proposals being received from spending departments and being assessed by MPI and negotiated with departments. It should also be possible for the CC&GG investment patterns to be included as an integral part of the MTIP, based on the classification of spending plans in the MTIP.
One of the purposes of the MPI Guidelines is to provide information for policy makers, to integrate CC&GG into investment design and approval process, including investment preparation, appraisal, approval, operation, monitoring, evaluation and revision. In particular, there are opportunities to build on the methods in the MPI Guidelines and use the budget classification process as a way to create incentives for integrating CC&GG into project design and appraisal. For example, Climate Change Impact Appraisal (CCIA) has been piloted extensively in many countries, including in Thailand and Cambodia as well as in India and other countries in South and South East Asia54.
One of the broader objectives of integrating CC&GG into planning and budgeting is to provide policy makers with an indication of the adequacy of the planned CC&GG investment, when compared with the scale of the challenge posed by climate change. This involves estimating the Adaptation Gap, measured in terms of planned adaptation compared with needs to avoid the full impact of climate change. Once the Adaptation Gap is estimated, the evidence used in that estimation can be used to inform a strategic approach to closing the gap, which may include changes in the effectiveness of expenditure and incentives for more private CC&GG adaptation, as well as changes to public CC&GG investment. CPEIRs lay the foundation for this work and many countries are now working on this challenge, often as part of their efforts to report on monitoring progress towards NDCs under the Paris Agreement.
In the context of the new planning law coming into force in 2019, the planning for CC&GG investment will need to ensure the consistency and synergy between planning and strategy, taking into account: the socio-economic development plan; sector management; territorial management; environmental protection; regional and sectoral linkages; and socio-economic issues.

PAGE 63
BIBLIOGRAPHY
[1] UNDP, “UNDP’s working paper on Climate Budget Tagging,” 2015.
[2] Kreft, ECkstein, Dorsch & Fischer, Global Climate Risk Index 2016, Who suffers most from Extreme Weather Events, D-53113 Bonn: Germanwatch e.V. Office Bonn, 2015.
[3] USAID, “Greenhouse Gas Emissions in Vietnam,” 2016.
[4] MPI, “Mid-term review report on socio-economic development and public investment in 2016-2020 and plan for 2019 in the South East and Mekong River Delta,” 2018.
[5] UNDP & WB Group, “Climate Public Expenditure and Institutional Review (CPEIR 2015),” 2015.
[6] MPI, UNDP&USAID, “Research on investment of Private sector in CC&GG in Vietnam,” 2018.
[7] Vietnam National Assembly, Law on state budget, 2015.
[8] Viet Nam National Assembly, Law on public investment 49/2014/QH13, 18 June 2014.
[9] Can Tho PPC, “Decision 3209/QD-UBND of PPC Can Tho on the allocation of capital plan and implementation of mid term public investment in 2016-2020 period in Can Tho city,” 8 December 2017.
[10] MPI, “Decision 572/QD-BKHDT on Mid term public investment plan, state budget in period 2016-2020,” 20 April 2017.
[11] MPI, Decision No.1178 on mid term public investment plan, state budget (inc Government Bonds), period 2016-2020 (time 2), 29 August 2017.
[12] Hau Giang PPC, “Decision No.2335/QD-UBND of PPC Hau Giang on the allocation of medium-term public investment plan for period of 2016-2020,” 8 December 2017.
[13] Long An PPC , “Decision No.76/QD-UBND of PPC Long An on the detail allocation of medium-term public investment plan for period of 2016-2020,” 9 January 2018.
[14] Tien Giang People’s Council, “Resolution No.17/NQ-HDND of People’s Council of Tien Giang province on amending and supplementing Article 1 of Resolution No.24/NQ-HDND dated 8 December 2016 of Provincial People’s Council on the MTIP of Tien Giang province for the period 2016-2020,” 8 December 2017.
[15] Tra Vinh People’s Council , “Resolution No.22/NQ-HDND of People’s Council of Tra Vinh province on the approval of MTIP 05 years 2016-2020,” 7 December 2016.
[16] Tra Vinh People’s Council , “Resolution No.44/NQ-HDND of the People’s Council of Tra Vinh province on approving and amending the MTIP for 05 years 2016-2020,” 13 July 2017.
[17] Tra Vinh People’s Council, “Resolution No.60/NQ-HDND of the People’s Council of Tra Vinh provine on approval of adjustment, supplement of MTIP 05 years 16-20,” 8 December 2017.
[18] World Bank & UNDP, “Financing Vietnam’s response to Climate Change: Smart Investment for a Sustainable Future,” 2015.
[19] Benjamin Hodick- Silke Bommersheim -Bui Hoa Binh- Son Thanh Phuc-Phan Thanh Tinh, “Climate Responsive Planning and Budgeting in the Mekong Delta - Monitoring Climate Targets through Budget Classification,” GIZ - Integrated Coastal Management Programme, 2017.
[20] Tra Vinh PPC, “Decision No.1474/QD-UBND of PPC Tra Vinh on the allocation of MTIP with adjustment and supplementation for the period of 2016-2020 with provincial budget,” 04 August 2017.
[21] PPC Hau Giang, “Decision 2335/QĐ-UBND of People’s Committee on detailing allocation of MTIP 2016-2020,” 08 December 2017.

PAGE 64
[22] Integrated Coastal Management Programme, GIZ, “ICMP Final Report From Innovation to Transformation,” Hanoi, 2018.
[23] Kien Giang People’s Council, “Resolution No.114/2017-ND-HDND dated 08/12/2017 and Resolution No.156/2018/ND-HDND dated 24 July 2018 on the MTIP for period 2016-2020”.
[24] Kien Giang PPC, “Plan No 95/KH-UBND dated 11 May 2018 on the Green Growth action plan of Kien Giang by 2020, vision to 2030”.
[25] Prime Minister, “Decision No.245/QD-TTg on approving master plan on social - economic development of key economic zone in Mekong Delta upto 2020 with orientations to 2030,” 12 February 2014.
[26] Vu and Nghiem, “Analysis of GDP Trends and Inequalities in Vietnam’s Provinces and Groups of Provinces,” Asian Economic and Social Society, vol. 6, no. 7, 2016.
[27] ACT, “Progress with Climate Change Financing Frameworks in selected South Asian Countries,” 2016.
[28] Bhattarai,R.C, R.Bogati, N.Bogati, N.Bird, M.O’Donnell, J.Le and E.R.Sigdel, “Nepal Climate Public Expenditure and Institutional Review,” 2011.
[29] MOE, “Cambodia Climate Change Financing Framework,” 2015.
[30] MDBs, “Joint Report on Multilateral Development Banks’ Climate Finance,” 2015.
[31] Ben Tre PPC, “Decision No.1740/QD-UBND of Ben Tre PPC on detailed allocation of medium-term public investment plan-state budget of Ben Tre province in period of 2016-2020,” 04 August, 2017.
[32] “Reports and Decisions for approving Climate change action plans of provinces”.
[33] “Reports and Decisions for approving Green Growth action plan of Ben Tre and Hau Giang provinces”.
[34] MPI, “Decision No.1827/QD-BKHDT on detailed allocation of medium-term public investment plan with state budget (including government bonds) for period of 2016-2020 (phase 3),” 15 December 2017.
[35] Dong Thap People’s Council, “Resolution No.25/2016/NQ-HDND of Dong Thap People’s Council on approving medium-term public investment plan for 05 years 2016-2020 managed and allocated by Dong Thap province,” 22 March 2016.
[36] Dong Thap DPI, “Official Letter No.2279/SKHDT-NV of Department of Planning and Investment of Dong Thap to MPI on providing documents enclosed with the list of projects,” 29 September 2017.
[37] “Disbursement Report of 2016, 2017 of provinces”.
[38] Vietnam Government, “Resolution No.120/NQ-CP on sustainable development of Mekong delta for adapting to Climate change,” 17 November 2017.
[39] Vinh Long People’s Council, “Resolution No.54/NQ-HDND of Vinh Long People’s Council on approving, adjusting and amending Medium-term public investment plan 2016-2020,” 07 July 2017.
[40] Vinh Long DPI, “Official Letter No.2289/SKHDT-KT of Vinh Long Department of Planning and Investment to MPI on providing documents on budget plan for CC&GG of Vinh Long province,” 18 October 2017.
[41] Prime Minister, “Decision o.245/QD-TTg on approving Master Plan on economic and social development of key economic region in Mekong delta to 2020, with orientation to 2030,” 12 February 2014.
[42] Prime Minister, “Decision No.939/QD-TTg on approving Master Plan on social-economic development of Mekong Delta to 2020,” 19 July 2012.
[42] Prime Minister, “Decision No.939/QD-TTg on approving Master Plan on social-economic development of Mekong Delta to 2020,” 19 July 2012.

PAGE 65
A1.1 CAN THO
In 2017, Can Tho spent 1,392 billion VND for CC&GG investment, which was 2.5 times higher than in 2016 (554 billion VND). Total expenditure for CC&GG in 2016 and 2017 accounts for 18% of the total budget allocated for CC&GG in the MTIP for
2016-2020 [8] [9] [10]. CC&GG investment in 2017 decreased slightly compared to 2016 (by 82 billion VND). For the 10 biggest projects, the decrease in 2017 affected both the local budget and the central budget, although there was an increase in ODA for CC&GG.
There were 11 priority themes related to CC&GG in Can Tho in the past two years. The top four themes accounted for over 90% of CC&GG expenditure, including sustainable urban development, which took 64.4%, sustainable water resources management 12.7%, transportation 6.9% and water supply and drainage 6.6%.
The themes that had a significant increase in expenditure in the past two years in Can Tho were: planning, which increased by 5.3 times; sustainable urban development by 3.7 times; sustainable transportation by 3.5 times; agriculture by 2.8 times and waste treatment and management by 2.2 times. Water supply, irrigation and sustainable water resources management had similar expenditure in 2017 to 2016. The themes that decreased in 2017 were disaster risk reduction, fisheries and energy.
There were no projects in Can Tho in the past two years dealing with afforestation, biodiversity, coastal protection, electricity and industry.
Adaptation accounted for 96.55% of CC&GG investment in 2016 and 2017, with only 3.45% contributing to both mitigation and adaptation. Eleven of the 13 projects that accounted for both adaptation and mitigation were in the fields of wastewater treatment and management.
Figure 17 shows CC&GG investment in Can Tho, comparing actual disbursement in 2016 and 2017 and the MTIP 2016-2020. The figures show reasonable consistency between actual disbursement and the MTIP, with the main themes in the MTIP being: sustainable urban management, sustainable water resources management (river) and irrigation.
Planning
DRR
Urban
Transport
Waste
Agriculture
Irrigation
Water
Fisheries
River
Energy
Total
VND
Bill
1400
1200
2016 2017
1000
800
600
400
200
0
ANNEX : DESCRIPTION OF CC&GG EXPENDITURE BY PROVINCE
Figure 16. CC&GG expenditure of Can Tho by theme

PAGE 66
Figure 17. CC&GG investment in Can Tho by top themes: actual for 2016 & 2017 and MTIP 2016-2020
The ten largest projects account for 87% of the total CC&GG investment in 2016 and 2017 and are mostly adaptation projects related to sustainable urban management, irrigation, transportation, water supply and waste treatment.
Table 13. Top 10 projects with the highest expenditure in (2016 & 2017) of Can Tho
PROJECTSCODES EXPENDITURE (VND BILL)
A M 2016 2017 TOTALUrban upgrading in Mekong Delta – Can Tho subproject (project No.2)
A4.5 244.99 584.75 829.74
Can Tho city development and increasing urban adaptation with 3 components: flood control and environment sanitation, urban corridor development and strengthening urban management in response to CC&GG
A4.5 5.00 401.59 406.59
Embankment of O Mon river A14.3 60.00 120.00 180.00Road connecting Vi Thanh Town. Hau Giang province with Can Tho city (section of Can Tho city), phase 1
A5.1 24.43 46.21 70.64
Can Tho river embankment (section from Ninh Kieu – Cai Son bridge and from Quang Trung bridge to Cai Rang bridge)
A14.3 62.50 62.50
60%
70%
80%
50%
40%
30%
20%
10%
0.4%2.2%
0.4%0.0%
69.1%
64.4%
3.5%6.9%
0.8%2.3%
0.3%0.5%
9.7%
3.4% 2.5%6.6%
0.3%0.3%
12.4%12.7%
0.5%0.7%0%
2 years (2016 & 2017) MTIP 2016-2020
Planning DRR Urban Transport Waste Agriculture Irrigation Water Fisheries River Energy Efficiency

PAGE 67
PROJECTSCODES EXPENDITURE (VND BILL)
A M 2016 2017 TOTALConstruction of Rach Nhum bridge and Rach Tra bridge on provincial road 922, Can Tho city
A5.4 47.31 47.31
Strengthening monitoring capacity and environmental quality analysis to serve the state management of environmental protection
A1.3 2.27 35.00 37.26
Water supply system in Thoi Hung commune, Co Do district
A11.8 24.73 24.73
Subproject construction of dike for protecting fruit orchards of Phong Dien district under the Irrigation Management Project for Rural Development in the Mekong Delta (WB6)
A10.2 20.00 20.00
Medical Solid waste treatment of Geriatric and Lung disease hospitals
M6.6 0.17 19.45 19.62
Total 424.09 1274.31 1698.41As % all CC&GG expenditure in Can Tho 77% 92% 87%
Table 14. Funding sources for the 10 biggest CC&GG projects in 2016-2017 in Can Tho
Unit: VND bill
SOURCE 2016 2017 TOTAL %Local budget 75.695 195.953 271.648 16.0%Central budget (NTPs/TPs) 59.733 260.000 319.733 18.8%ODA 144.996 422.290 567.286 33.4%Lottery 0.170 254.886 255.056 15.0%Government Bonds 62.500 0 62.500 3.7%Other 81.00 141.185 222.185 13.1%Total 424.094 1,274.314 1,698.408 100%
The result in Table 14 illustrates the importance of ODA to CC&GG investment in Can Tho, showing that it is the largest source of funding, with 33.4% of total funding for the 10 largest projects in 2016 and 2017.

PAGE 68
Hau Giang has a significant drop in CC&GG investment in 2017 compared to 2016, down 41% (from 1,040 billion in 2016 to 608 billion in 2017).
The drop occurred despite an increase in total public investment from 2016 to 2017 of 115 billion, equivalent to 9.8% [11] [9] [10].
There are 13 CC&GG themes that have investment in Hau Giang in the past two years, with the largest being transportation, which accounts for 49.1% of total CC&GG investment, followed by sustainable water resources management (river) 12.6%; irrigation 11.9%; sustainable urban management 9.4% and water supply 6.2%. These five themes accounted for 89% of total CC&GG investment. The themes of agriculture, sustainable water resources management (river) waste treatment and management, disaster risk reduction, biodiversity and conservation each have a share of between 1.6% and 2.6% of total investment. The remaining themes of planning (strengthening information on climate change), electricity, forestry account for less than 1% of investment.
The CC&GG investment in the past two years in Hau Giang has not covered the following themes: fisheries, coastal protection, energy and industry.
Only 0.06% of CC&GG investment was not devoted to adaptation in Hau Giang and this was devoted to both adaptation and mitigation.
The figure below shows the share of CC&GG investment in the two years 2016 and 2017 and in the MTIP 2016-2020 by theme.
There are 14 GG&GG investment themes in the MTIP and long term investment plan in Hau Giang including: irrigation, sustainable transport, sustainable urban development, water supply and drainage, sustainable water resources management (river).
Planning
Electricity
DRR
Urban
Transport
Waste
Agriculture
Forestry
Health
Irrigation
Water
Biodiversity
River
TOTAL
A1.2 HAU GIANG
Figure 18. CC&GG expenditure of Hau Giang (2016-2017) by theme
VND
Bill
1000
1200
2016 2017
800
600
400
200
0

PAGE 69
The top 10 projects related to climate change in 2016 and 2017 contributed a total of 52% of the total CC&GG investment, reflecting the large number of projects in Hau Giang. There are 5 transport projects in the top 10, the remaining being for irrigation and sustainable water resources management (river).
Due to insufficient data on the structure of funding sources for the projects, it is not possible to indicate the contribution of each source of funding to the CC&GG projects in Hau Giang.
Figure 19. CC&GG expenditure in 2 years (2016 & 2017) and CC&GG investment plan in MTIP 2016-2020 of Hau Giang by top themes
Table 15. Top 10 projects with the highest expenditure in 2 years (2016 & 2017) of Hau Giang
PROJECTSCODES EXPENDITURE (VND BILL)
A M 2016 2017 TOTALThe road connects Vi Thanh town. Hau Giang province with Can Tho city
A5.1 200 26.468 226.468
Provincial Road 928 A5.1 0.602 159.796 160.398Embankment of Xa No canal. phase 2 A14.3 129.517 129.517Provincial road 930 (section from Long My town to Hau Giang high-tech agricultural area)
A5.1 57.802 31.428 89.230
Construction of sluice system for preventing salinization in the south of Xa No channel
A4.4 26.500 27.400 53.900
Long My - Vi Thanh dyke system A4.3 44.2 8.343 52.543Embankment to prevent erosion of Xang Xa No canal. phase 2
A10.2 41.127 41.127
Embankment by the two sides of the Cai Lon river. Long My district
A14.3 35 35
Total 508.651 343.493 852.144As % all CC&GG expenditure in Hau Giang 49% 56% 52%
50%
40%
30%
20%
10%
0% 1% 1% 2% 2%
9%
23%
49%
24%
2%1% 2% 1%
0.06%0.06%2%
3%
12%
26%
6%
11%
0%0.22%3% 2%
13%
5%
0.44%0%
Planning DRR Urban Transport Waste Agriculture Irrigation Health Water Fisheries Biodiversity River ElectricityForestry
2 years (2016 & 2017) MTIP 2016-2020

PAGE 70
In Long An province, total CC&GG investment in 2017 fell significantly from 2016, down 64.3% (from 1013 billion in 2016 to 365 billion in 2017), compared
with a 7.1% fall in total provincial public investment, although there was an increase in the central budget and local budget in 2017 [12] [9] [10].
There are 11 themes with CC&GG investment in Long An in the past two years, of which the expenditure in sustainable transport development accounts for 35% of total CC&GG investment; followed by water supply 26%, irrigation and drainage 21%; sustainable water resources management (river) 7%. The four largest themes account for 88% of the total. The themes of agriculture, sustainable urban development, waste treatment and management, and biodiversity have 1.9%, 2.7%, 3.0% and 3.7% of total CC&GG investment, respectively. The themes of wetland
conservation, health and electricity have very small expenditure, accounting for less than 1%.
Adaptation account for 96.74% of total CC&GG investment, with 3.26% for mitigation. The mitigation project in Long An focuses on the treatment of hospital waste and the production of organic manure from fishpond sludge and straw.
Figure 21 shows the proportion of CC&GG investment by theme including actual disbursement for 2016 and 2017 and in the MTIP for 2016-2020.
A1.3 LONG AN
Figure 20. CC&GG expenditure of Long An (2016-2017) by theme
40%
30%
20%
10%
0%Urban Transport Waste Agriculture Forestry Irrigation Water Biodiversity RiverElectricity
2 years (2016 & 2017) MTIP 2016-2020
Figure 21. CC&GG expenditure in 2 years (2016 & 2017) and CC&GG investment plan in MTIP 2016-2020 of Long An by theme
VND
Bill
1200
2016 2017
1000
800
600
400
200
0
Electricity
Urban
Transport
Waste
Agriculture
Forestry
Health
Irrigation
Water
Biodiversity
River
TOTAL

PAGE 71
It can be seen that, in the MTIP, sustainable transport development, irrigation, sustainable water resources management (river) and water supply and drainage have a large share of CC&GG investment in the MTIP. Below is the list of 10 largest CC&GG projects in 2016 and 2017 in Long An province.
Table 16. Top 10 projects with the highest expenditure in 2 years (2016 & 2017) of Long An
PROJECTSCODES EXPENDITURE (VND BILL)
A M 2016 2017 TOTALHoa Khanh Tay Water supply project A11.8 224.855 224.855Phuoc Hoa Irrigation Subproject A10.1 115.784 0.5 116.284Renovation and upgrading the system of drainage canals for flood drainage and irrigation water supply (Canal Project 61)
A10.2 50 26.291 76.291
Embankment of Moc Hoa town A14.3 16 38.4 54.4Project to support hospital waste treatment – WB loans - Long An province
M6.6 38.673 2.926 41.599
Thủ Thừa Embankment to protect the Thu Thua town A4.3 28.45 5.503 33.953Construction of the Smart Transportation System of Ho Chi Minh City - Trung Luong Expressway
A5.1 23.322 9.704 33.026
Nhựt Tảo bridge. provincial road 832 A5.4 9 23.4 32.4Renovation and upgrading of provincial road 832 -section of Kinh bridge - Nhut Ninh junction and branch of Nhut Tao wharf
A5.4 12.51 13 25.51
Rạch Tràm - Mỹ Bình Canal A10.2 18 3.8 21.8Total 536.594 123.524 660.118As % all CC&GG expenditure in Long An 53% 34% 48%
From Table 16 above, the 10 projects with the highest CC&GG expenditure in the last two years in Long An included 3 transport projects and 3 projects in irrigation sector, the remaining being in water supply, urban protection and waste treatment projects. These projects contributed for only 48% of the expenditure over the past two years, which reflects the large number of projects in Long An.
Table 17. Fund allocation for the 10 biggest expenditure projects in 2016-2017 of Long An
Unit: VND bill
SOURCE 2016 2017 TOTAL %Local budget 139.92 54.047 193.967 29.4%Central budget (NTPs/TPs) 51.772 57.691 109.463 16.6%ODA 240.052 8.86 248.912 37.7%Lottery 43 2.926 45.926 7.0%Government Bonds 13 0 13 2.0%Other 48.85 0 48.85 7.4%Total 536.594 123.524 660.118 100%
The results in Table 17 show that 46% of expenditure on the top 10 projects in 2016 and 2017 in Long An comes from the state budget (local and central), while ODA contributed 37.7% and Lottery 7.0%. The remaining are from government bond and other funds.

PAGE 72
A1.4 TIEN GIANG
Total CC&GG investment for Tien Giang in 2017 has increased 42% compared to 2016, from 211 billion in 2016 to 300 billion in 2017, despite a decrease in total public investment in the province [13] [9] [10].
There are eight CC&GG themes that have expenditure in 2016 and 2017 in Tien Giang, the largest of which is disaster risk reduction, accounting for 36% of total
CC&GG investment, followed by irrigation 26%, sustainable water resources management (river) 24% and coastal protection 10%. These four themes account for 96% of total CC&GG investment. The remaining four themes have a share of total CC&GG investment that is very low with agriculture 3%, biodiversity 1%, waste water treatment and drainage 0.15% and water quality 0.06% (see Figure 22 illustrated below).
Adaptation accounts for 94.78% of CC&GG investment in 2016 and 2017, with 0.25% for mitigation and 4.97% for both adaptation and mitigation, including: mangrove plantation projects, agricultural products quality improvement and
development and biogas development program.
Figure 23 shows the share of CC&GG investment in the two years (2016-2017) and in the MTIP 2016-2020 by theme.
VND
Bill
300
250
200
2016 2017
150
100
50
0
DRR
Waste
Agriculture
Irrigation
Water
Biodiversity
River
Coastal
TOTAL
Figure 23. CC&GG expenditure in 2 years (2016 & 2017) and CC&GG investment plan in MTIP 2016-2020 of Tien Giang by theme
0%
5%
10%
15%
20%
25%
30%
35%
40%
Planning DRR Urban Transport Waste Agriculture Irrigation Water Biodiversity River Coastal Energy Efficiency
2 years (2016 & 2017) MTIP 2016-2020
Figure 22. CC&GG expenditure of Tien Giang (2016-2017) by theme

PAGE 73
There is no actual investment in sustainable urban development and sustainable transport in 2016 and 2017 despite the fact that these two themes are priority investment areas in the MTIP, accounting for 35.29% and 15.11% of total CC&GG investment. Other CC&GG themes in the MTIP include irrigation, agriculture, coastal protection, sustainable water
resources management (river) and disaster risk reduction.
The 10 largest CC&GG projects in 2016 and 2017 contributed 88% of total CC&GG investment and focused on irrigation, coastal protection, agriculture, disaster risk reduction and sustainable water resources management (river).
Table 18. Top 10 projects with the highest expenditure in 2 years (2016 & 2017) of Tien Giang
PROJECTSCODES EXPENDITURE (VND BILL)
A M 2016 2017 TOTALFlood Risk reduction and Flood Control Project in Ba Rai -Phu An (ADB-GMS1)
A3.2 80.163 71.000 151.163
Sub-project on upgrading salinity intrusion control system in Go Cong (ADB-GMS1)
A14.1 44.723 33.700 78.423
Upgrade of Go Cong sea dyke A15.1 26.000 20.000 46.000Prevention of erosion. stability of Tien River bank in the area of the Tan Long Island
A14.3 45.000 45.000
Storm shelter for fishermen vessels in Soai Rap estuary combining with fish landing Vam Lang
A3.1 17.000 15.000 32.000
The embankment of the west of Ba Rai River A10.2 30.000 30.000Dyke in Go Cong commune A10.2 19.000 9.000 28.000Rach Cho and Thu Ngu cunvert A10.2 3.000 12.000 15.000Planting mangrove trees protecting sea dyke Go Cong Dong (SP-RCC)
A15.1 M13.2 7.312 5.700 13.012
Project on Quality Improvement, Agricultural Product Safety and Biogas Programme Development (QSEAP)
A7.7 M7.4 11.929 0.430 12.359
Total 209.127 241.830 450.957As % all CC&GG expenditure in Tien Giang 99% 81% 88%
Table 19. Fund allocation for the 10 biggest expenditure projects in 2016-2017 of Tien Giang
Unit: VND bill
SOURCE 2016 2017 TOTAL %State budget (including local budget and central budget)
146.054 166.53 312.584 69.3%
ODA 63.072 75.3 138.372 30.7%Total 209.126 241.83 450.956 100.0%
Tien Giang’s reporting system does not provide detailed information on source of funding and only distinguishes between state budget and ODA funds.
Table 19 shows that the state budget accounted for 69.3% of total CC&GG investment, with ODA accounting for the remaining 30.7%.

PAGE 74
A1.5 BEN TRE
The results show that CC&GG investment in Ben Tre in 2017 was about 954 billion VND, which was an a slight decrease of 1 billion, compared with 2016, despite an increase in total public investment in 2017. CC&GG investment from the central and local state budgets increased, with the reduction occurring in ODA funded CC&GG investment.
CC&GG investment covered 12 themes in Ben Tre in 2016 and 2017 with the largest share being
for transport development with 37.3%, followed by irrigation with 16.6% and agriculture 14.7%. The remaining themes account for lower shares with water supply 5.7%, disaster risk reduction 5.3%; sustainable water resources management (river) 5.1%; and biodiversity 4.7%. The themes of sustainable urban development, waste management, fisheries and coastal protection have only 0.9% to 3% of total CC&GG investment in the past two years.
Adaptation accounts for 95.46% of CC&GG investment over the past two years in Ben Tre with only 0.87% for mitigation and 3.66% for both mitigation and adaptation, including projects in forest protection and development, erosion control, mangrove planting, quality improvement of
agricultural products and the development of biogas programs.
Figure 25 below illustrates the share of CC&GG investment of Ben Tre in the two years (2016-2017) and in the MTIP 2016-2020 by theme.
VND
Bill
1000
1200
2016 2017
800
600
200
400
0
DRR
Urban
Transport
Waste
Agriculture
Forestry
Irrigation
Water
Fisheries
Biodiversity
River
Coastal
TOTAL
Figure 24. CC&GG expenditure of Ben Tre (2016-2017) by theme

PAGE 75
The results in the figure show that the themes of sustainable transport development, agriculture, irrigation, sustainable urban development, disaster risk reduction are priorities in the MTIP in Ben Tre.
The following are the top 10 CC&GG projects of the province in 2016 and 2017, focusing on the fields of transport, irrigation, agriculture, disaster risk reduction and sustainable water resources management (river).
0%
10%
20%
30%
40%
50%
60%
Planning DRR Urban Transport Waste Agriculture Forestry Health Irrigation Water Fisheries Biodiversity River Coastal
2 years (2016 & 2017) MTIP 2016-2020
Figure 25. CC&GG expenditure in 2 years (2016 & 2017) and CC&GG investment plan in MTIP 2016-2020 of Ben Tre by theme
Table 20. Top 10 projects with the highest expenditure in 2016 & 2017 of Ben Tre
PROJECTSCODES EXPENDITURE (VND BILL)
A M 2016 2017 TOTALCo Chien bridge-Highway 60 A5.4 117.603 182.923 300.5267027540 - Irrigation project in northern Ben Tre A10.2 163.325 83.000 246.325Construction of 10 bridges on provincial road 883. Binh Dai district
A5.4 89.908 89.908
Route of Giong Trom town. -provincial road 885 A5.4 70.081 13.916 83.997Essential infrastructure supporting development of coconut value chain. Mo Cay Nam district
A7.4 19.000 45.000 64
Phong Nam bridge on district road 173, Chau Thành - Giong Trom district
A5.4 20.000 43.381 63.381
The National Target Program on building new rural areas in the 2016-2020 period
A7.7 59.933 59.933
Storm shelter for fishing vessels combined with Ba Tri fishing port
A3.1 43.000 10.000 53
Salinity prevention works in the area of Thu Cuu culvert A14.1 46.940 46.940Infrastructure for tourism in communes along the Tien River (phase 2) (Section 1: from An Khanh commune to Phu Duc commune)
A13.1 3.492 43.292 46.784
Total 586.343 468.452 1054.795As % all CC&GG expenditure in Ben Tre 57% 49% 53%
At present, the data collected do not record fully the source of funding.

PAGE 76
A1.6 TRA VINH
Figure 26, shows that the CC&GG investment in Tra Vinh province in 2017 has slightly decreased compared to 2016, down 12% from 1.623 billion in 2016 to 1.425 billion in 2017, while the total public investment of the province in 2017 increased 16.7% compared to 2016 [14] [15] [16] .
The themes of forestation and disaster risk reduction have fallen sharply in 2017 compared to 2016 (down 98% and 72% respectively). The analysis shows that most themes experienced a drop in funding in 2017, compared with 2016, except for the 4 themes of sustainable urban development, waste management, fisheries and agriculture.
It can be seen that the range of CC&GG themes covered in Tra Vinh are quite diverse with 14 themes. Sustainable transport development and sustainable urban development accounted for the largest share of total CC&GG investment in the past two years, accounting for 19.5% and 19.2% respectively. In addition, the agriculture, coastal protection and fishery themes also have a high share of CC&GG investment in 2016 and 2017, accounting for 14.3%. 12.4% and 10.5%, respectively. The themes of afforestation, biodiversity, health, sustainable water resources management (river), disaster risk reduction, waste management and irrigation have shares from 1.6% to 5.5%.
Adaptation accounts for 90.11% of CC&GG investment in the last two years in Tra Vinh with only 1.13% for mitigation and 8.76% for both mitigation and adaptation, including projects for forest protection and development, flexible embankment combined with forest plantation to prevent river bank erosion and wastewater treatment.
Figure 27 below illustrates the share of CC&GG investment in the two years (2016-2017) and in the MTIP 2016-2020 by theme.
2016 2017
Electricity
DRR
Urban
Transport
Waste
Agriculture
Forestry
Health
Irrigation
Water
Fisheries
Biodiversity
River
Coastal
TOTAL
VND
Bill
1000
1200
1400
1600
1800
800
600
200
400
0
Figure 26. CC&GG expenditure of Tra Vinh (2016-2017) by theme

PAGE 77
In the MTIP, agriculture, transport, sustainable urban development, irrigation, coastal protection are the priority CC&GG themes in Tra Vinh.
Table 21 lists the top 10 projects of the province,
which account for 59% of total CC&GG investment in 2016 and 2017. The top 10 projects focus on coastal protection (2 projects) , fishery (2 projects), agriculture (2 projects), transport (2 projects) and sustainable urban development (2 projects).
Planning DRR Urban Transport Waste Agriculture Forestry Health Irrigation Water Fisheries Biodiversity River Coastal Electricity
2 years (2016 & 2017) MTIP 2016-2020
0%
5%
10%
15%
20%
25%
30%
Figure 27. CC&GG expenditure in 2 years (2016 & 2017) and CC&GG investment plan in MTIP 2016-2020 of Tra Vinh by theme
Table 21. Top 10 projects with the highest expenditure in 2 years (2016 & 2017) of Tra Vinh
PROJECTSCODES EXPENDITURE (VND BILL)
A M 2016 2017 TOTALUrban upgrading project in the Mekong Delta - Subproject of Tra Vinh city. Tra Vinh province
A4.5 169.900 258.232 428.132
Route 02 (from node N25 to node N28) and bridge C16 - Phase 2 in Dinh An Economic Zone
A5.1 182.853 95 277.853
Sewerage and wastewater treatment in Tra Vinh city. Tra Vinh province
A4.4 M6.6 73.375 143.612 216.987
National Target Program on new rural development A7.7 64.834 151.251 216.085Climate Change Adaptation Project in the Mekong Delta (AMD Tra Vinh)
A7.7 107
26.96 134.406
Infrastructure investment project for shrimp farming industry. Cau Ngang district
A12.4 25.943 100.858 126.801
Provincial road 915B. Tra Vinh province (Phase 1: From Km) +000 to Km10 + 258 - The road from Co Chien bridge to Long Binh 3 bridge
A5.1 50 72.611 122.611
Embankment for protecting the coast of Con Trung hamlet. Truong Long Hoa commune. Duyen Hai district. Tra Vinh province (repetition project)
A15.1 87.202 33.415 120.617

PAGE 78
PROJECTSCODES EXPENDITURE (VND BILL)
A M 2016 2017 TOTALEmbankment for protecting the coast of Hiep Thanh commune. Duyen Hai district (Phase 3)
A15.1 69
16.39 85.234
Investment project to build infrastructure for Canh Dong Nang aquaculture. Long Son commune. Cau Ngang district
A12.4 12.814 69.215 82.029
Total 843.211 967.544 1810.755As % all CC&GG expenditure Tra Vinh 52% 68% 59%
Table 22. Fund allocation for the 10 biggest expenditure projects in 2016-2017 of Tra Vinh
Unit: VND bill
SOURCE 2016 2017 TOTAL %Local budget 63.291 47.968 111.259 6.1%Central budget (NTPs/TPs) 405.42 442.65 848.07 46.8%ODA 282.365 300.21 582.575 32.2%Lottery 0 30 30 1.7%Government Bonds 53.387 0 53.387 2.9%Preferential credit 38.757 146.716 185.473 10.2%Total 843.22 967.544 1,810.86 100.0%
ODA contributes significantly to CC&GG investment in Tra Vinh, contributing 32.2% of investment in the top 10 projects in 2016 and 2017.

PAGE 79
A1.7 VINH LONG
CC&GG investment in Vinh Long in 2017 increased remarkably by 2.3 times from 524 billion in 2016 to 1,192 billion in 2017, at a time when total public investment increased by only 4.8%.
The large increase in CC&GG investment in 2017 comes from: sustainable urban development, which in 2017 increased 5.2 times compared to 2016; irrigation expenditure, which increased 3 times; and water supply and drainage which increased by 2.2 times. Figure 28 below provides more details.
CC&GG investment for the top 4 themes (i.e. sustainable urban development, transport, irrigation and water supply and drainage) accounted for 90.7% of Vinh Long’s total CC&GG investment in 2016 and 2017.
Adaptation accounted for 99.65% of CC&GG investment in the past 2 years, with only 0.35% for
mitigation including the pilot projects of public lighting and traffic warning lights using solar energy, plus wastewater and waste treatment projects.
Below is a comparison of the share of CC&GG by theme for actual disbursement in 2016 and 2017 and in the MTIP for 2016-2020 of Vinh Long.
2016 2017
VND
Bill
1000
1200
1400
800
600
200
400
0
Planning
Urban
Transport
Waste
Agriculture
Irrigation
Water
Fisheries
River
TOTAL
Figure 28. CC&GG expenditure of Vinh Long (2016-2017) by theme

PAGE 80
Urban development, transport, irrigation and water supply are the themes with high investment capital in the MTIP in Vinh Long province.
The 10 largest projects in Vinh Long contribute 64% of the total CC&GG investment, focusing on sustainable urban development, irrigation, sustainable water resources management (river) and transportation.
Planning DRR Urban Transport Waste Agriculture Irrigation Water Fisheries River
2 years (2016 & 2017) MTIP 2016-2020
0%
10%
20%
30%
40%
50%
60%
Figure 29. CC&GG expenditure in 2 years (2016 & 2017) and CC&GG investment plan in MTIP 2016-2020 of Vinh Long by theme
Table 23. Top 10 projects with the highest expenditure in 2 years (2016 & 2017) of Vinh Long
PROJECTSCODES EXPENDITURE (VND BILL)
A M 2016 2017 TOTALDyke of Mang Thit River (stage 2) A4.3 500 500Co Chien river embankment - Vinh Long city A4.3 62.923 80 142.923The irrigation system prevented saltwater in the North of Vung Liem district
A10.2 120 120
Dyke for flooding control in Vinh Long city - Cai Ca river area
A4.3 60 60
Embankment for river bank erosion control in Long Ho town, Long Ho district, Vinh Long province
A14.3 50 50
Con Chim bridge, Vinh Long city A5.4 50 50Project on upgrading and expanding aquatic breeding farms in Vinh Long province
A12.4 29 17 46
The project of traffic infrastructure for tourism development in 04 communes in Long Ho district. Vinh Long province
A5.4 15 30 45
Dyke of Cai Von river, Binh Minh district A4.3 23 20.3 43.3Ngang bridge, Ward 3 A5.4 20 20 40Total 199.92 897.3 1097.223As % all CC&GG expenditure in Vinh Long 38% 75% 64%
There is insufficient data to allow an analysis of the source of funding for the projects.

PAGE 81
A1.8 DONG THAP
CC&GG investment in Dong Thap province in 2017 has increased 27% compared to 2016 from 1,050
billion in 2016 to 1,334 billion in 2017. This compared with an increase in total public investment of 46.7% in the same period from 3.072 billion in 2016 to 4.508 billion in 2017.
Figure 30 shows the themes for CC&GG investment in Dong Thap in the two years 2016 and 2017, with 12 different themes represented. Urban development and transport have the largest share of total CC&GG investment with 40.9% and 24.1%, respectively. They are followed by agriculture 14.4% and water resources management (river) 10.2%. The remaining themes have smaller shares with 2.7% for water and drainage and 2.2% for irrigation 2.2%.
The majority of CC&GG investment in Dong Thap in the past 2 years is for adaptation, which accounts for 99.44% of total CC&GG investment, with only 0.56% for mitigation (for hospital waste management and treatment).
Figure 31 below illustrates the share of CC&GG investment by theme in actual disbursement for the two years (2016-2017) and in the MTIP for 2016-2020.
Planning
DRR
Urban
Transport
Waste
Agriculture
Health
Irrigation
Water
Fisheries
Biodiversity
River
TOTAL
2016 2017
VND
Bill
1000
1200
1400
800
600
200
400
0
Figure 30. CC&GG expenditure of Dong Thap (2016-2017) by theme

PAGE 82
Sustainable urban development, transport, agriculture and sustainable water resources management (river) are priority orientations for the MTIP in Dong Thap.
Table 24 below shows the list of top 10 CC&GG
projects. These projects account for 80% of total CC&GG investment in the 2 years and focus on the fields of sustainable urban management, transportation, agriculture, sustainable water resources management (river) and irrigation.
0%
5%
10%
15%
20%
25%
30%
35%
40%
45%
WasteTransportUrbanDRRPlanning Agriculture Irrigation Water Fisheries Biodiversity River
2 years (2016 & 2017) MTIP 2016-2020
Health
Figure 31. CC&GG expenditure in 2 years (2016 & 2017) and CC&GG investment plan in MTIP 2016-2020 of Dong Thap by theme
Table 24. Top 10 projects with the highest expenditure in 2 years (2016 & 2017) of Dong Thap
PROJECTSCODES EXPENDITURE (VND BILL)
A M 2016 2017 TOTALUrban Upgrading Project - Cao Lanh city (WB) A4.5 367.043 405,408 772,451Investment project on transportation system connecting the infrastructure of tourism and agriculture in Dong Thap province
A5.4 7.181 279,461 286,642
National Target Program for new rural development A7.7 61.884 125,861 187,745Project on building sewerage system of TP. Cao Lanh (Norwegian capital)
A4.4 78.738 108,454 187,192
NTP on new rural development (increasing number of laborers with regular jobs. increasing incomes. reducing poor households. etc..)
A7.7 152,711 152,711
Ring road 848 and Sa Dec 2 Bridge (construction bridge) A5.4 119.999 119,999Embankment to prevent river bank erosion phase III. Sa Dec town. Dong Thap province
A14.3 56.937 4,019 60,956
Embankment to prevent river bank erosion in Binh Thanh market area. Thanh Binh district
A14.3 20 33,4 53,400
Project on upgrading and upgrading the flood drainage canal system and irrigation water supply for Dong Thap Muoi (ADB)
A10.2 34.572 10 44,572

PAGE 83
PROJECTSCODES EXPENDITURE (VND BILL)
A M 2016 2017 TOTALProject on road into the tourist flower village Sa Dec city. Dong Thap province
A5.4 20.782 23,504 44,286
Total 767.136 1142.818 1909.954As % all CC&GG expenditure in Dong Thap 73% 86% 80%
Table 25. Fund allocation for the 10 biggest expenditure projects in 2016-2017 of Dong Thap
Unit: VND bill
SOURCE 2016 2017 TOTAL %Local budget 53.657 329.461 383.118 20,1%Central budget (NTPs/TPs) 125.717 155.552 281.269 ,14,7%ODA 295 344.952 639.952 33,5%Lottery 218.477 288.822 507.299 26,6%Government Bonds 74.285 24.031 98.316 5,1%Total 767.136 1,142.82 1,909.95 100,0%
Funding for CC&GG investment in Dong Thap comes from a variety of sources, as shown in Table 25. ODA accounts for the largest share of funding for CC&GG investment in 2016 and 2017, which is similar to the situation in Can Tho and Tra Vinh.
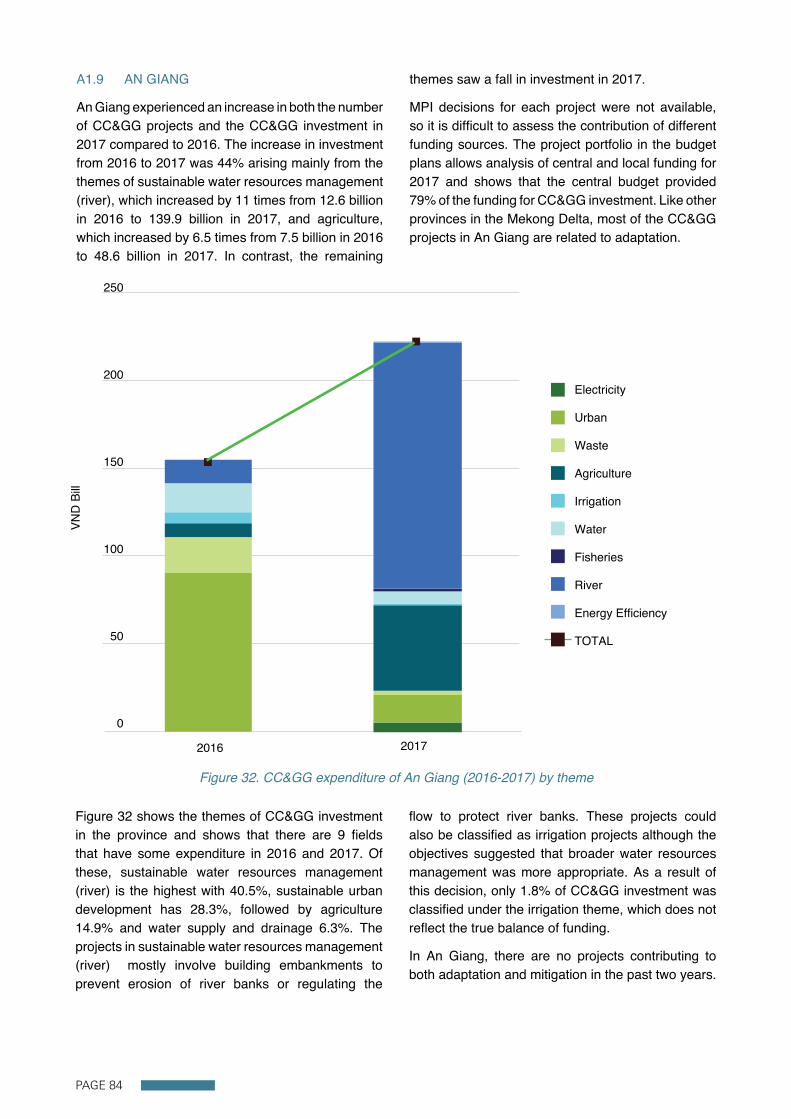
PAGE 84
A1.9 AN GIANG
An Giang experienced an increase in both the number of CC&GG projects and the CC&GG investment in 2017 compared to 2016. The increase in investment from 2016 to 2017 was 44% arising mainly from the themes of sustainable water resources management (river), which increased by 11 times from 12.6 billion in 2016 to 139.9 billion in 2017, and agriculture, which increased by 6.5 times from 7.5 billion in 2016 to 48.6 billion in 2017. In contrast, the remaining
themes saw a fall in investment in 2017.
MPI decisions for each project were not available, so it is difficult to assess the contribution of different funding sources. The project portfolio in the budget plans allows analysis of central and local funding for 2017 and shows that the central budget provided 79% of the funding for CC&GG investment. Like other provinces in the Mekong Delta, most of the CC&GG projects in An Giang are related to adaptation.
Figure 32 shows the themes of CC&GG investment in the province and shows that there are 9 fields that have some expenditure in 2016 and 2017. Of these, sustainable water resources management (river) is the highest with 40.5%, sustainable urban development has 28.3%, followed by agriculture 14.9% and water supply and drainage 6.3%. The projects in sustainable water resources management (river) mostly involve building embankments to prevent erosion of river banks or regulating the
flow to protect river banks. These projects could also be classified as irrigation projects although the objectives suggested that broader water resources management was more appropriate. As a result of this decision, only 1.8% of CC&GG investment was classified under the irrigation theme, which does not reflect the true balance of funding.
In An Giang, there are no projects contributing to both adaptation and mitigation in the past two years.
2016 2017
VND
Bill
250
200
150
50
100
0
Electricity
Urban
Waste
Agriculture
Irrigation
Water
Fisheries
River
Energy Efficiency
TOTAL
Figure 32. CC&GG expenditure of An Giang (2016-2017) by theme

PAGE 85
98.39% of CC&GG investment is for adaptation and 1.61% of investment for mitigation. These mitigation projects are for electricity supply for industrial zones and rural areas.
Figure 33 below illustrates the share of CC&GG investment by theme in An Giang for actual disbursement in the two years (2016-2017) and for the MTIP for 2016-2020.
Sustainable water resources management (river), sustainable urban development and agriculture are the CC&GG priorities in the MTIP in An Giang with shares in total CC&GG investment in the MTIP of 39.5%; 30.2% and 20.1%.
Table 26 below shows the 10 CC&GG projects with the highest expenditure in 2016 and 2017. These projects account for 85% of total CC&GG investment. Four of the projects are related to river embankment.
0%
5%
10%
15%
20%
25%
30%
35%
40%
45%
Urban Waste Agriculture Irrigation Water Fisheries River
2 years (2016 & 2017) MTIP 2016-2020
Electricity Energy Efficiency
Figure 33. CC&GG expenditure in 2 years (2016 & 2017) and CC&GG investment plan in MTIP 2016-2020 of An Giang by theme
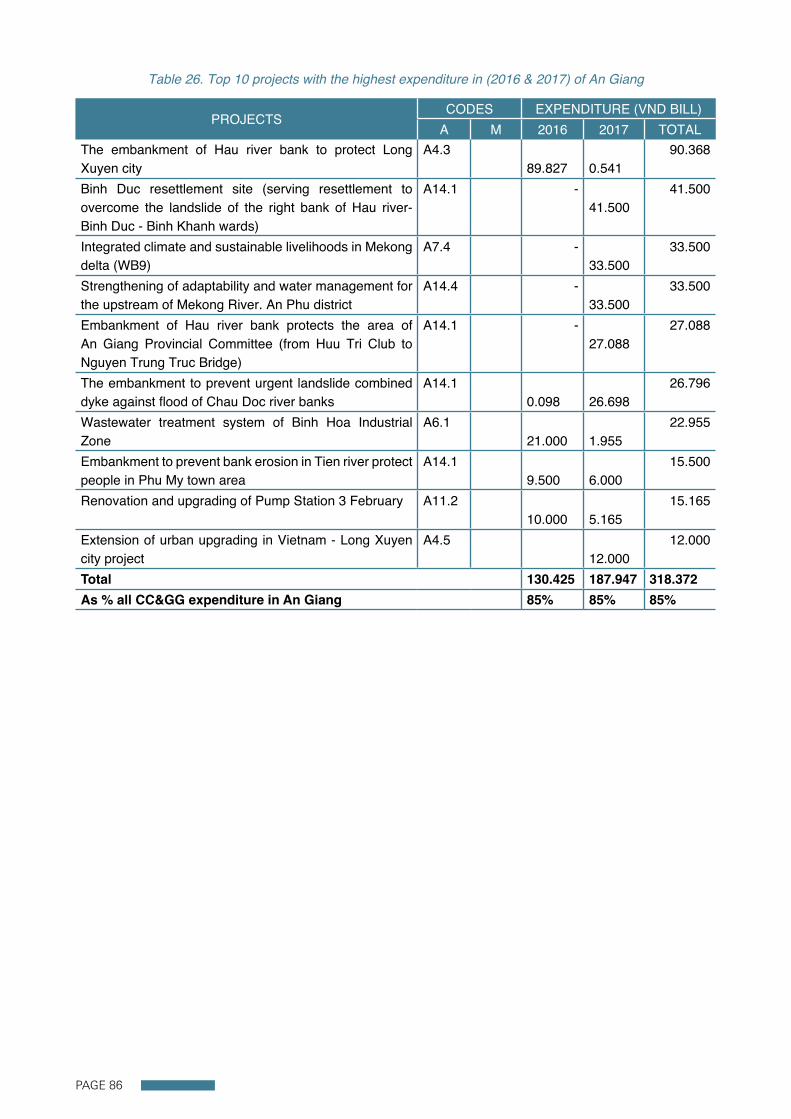
PAGE 86
Table 26. Top 10 projects with the highest expenditure in (2016 & 2017) of An Giang
PROJECTSCODES EXPENDITURE (VND BILL)
A M 2016 2017 TOTALThe embankment of Hau river bank to protect Long Xuyen city
A4.3 89.827
0.541
90.368
Binh Duc resettlement site (serving resettlement to overcome the landslide of the right bank of Hau river- Binh Duc - Binh Khanh wards)
A14.1 - 41.500
41.500
Integrated climate and sustainable livelihoods in Mekong delta (WB9)
A7.4 - 33.500
33.500
Strengthening of adaptability and water management for the upstream of Mekong River. An Phu district
A14.4 - 33.500
33.500
Embankment of Hau river bank protects the area of An Giang Provincial Committee (from Huu Tri Club to Nguyen Trung Truc Bridge)
A14.1 - 27.088
27.088
The embankment to prevent urgent landslide combined dyke against flood of Chau Doc river banks
A14.1 0.098
26.698
26.796
Wastewater treatment system of Binh Hoa Industrial Zone
A6.1 21.000
1.955
22.955
Embankment to prevent bank erosion in Tien river protect people in Phu My town area
A14.1 9.500
6.000
15.500
Renovation and upgrading of Pump Station 3 February A11.2 10.000
5.165
15.165
Extension of urban upgrading in Vietnam - Long Xuyen city project
A4.5 12.000
12.000
Total 130.425 187.947 318.372As % all CC&GG expenditure in An Giang 85% 85% 85%

PAGE 87
A1.10 BAC LIEU
Bac Lieu saw an increase in CC&GG investment in 2017 of 9.3% compared to 2016, from 436 billion in 2016 477 billion in 2017. The increase arose mainly because of increases in sustainable urban development, which increased by 4.72 times, and Coastal protection, which increased by 2.18 times. The remaining 10 themes experienced a decline in
expenditure in 2017.
The budget allocation for the province increased from 841 billion in 2016 to 1,906 billion in 2017. MPI's decision to allocate funds to Bac Lieu reflects a significant increase in funding for the Target Programs for climate change and green growth (from 67 billion to 146 billion).
In Bac Lieu, areas of investment for climate change are diversified with 12 themes featuring in 2016 and 2017. The main focus was on 4 fields: afforestation/forestry, which accounts for 28.2% of total CC&GG investment, followed by coastal protection 23.1%, sustainable urban development 17.2%; sustainable water resources management (river) 16.7%. Thus, these four themes account for 85.2% of total CC&GG investment over the past two years in Bac Lieu.
In Bac Lieu, 92.98% of CC&GG investment is for adaptation, 2.19% for mitigation and 4.83% for both adaptation and mitigation, including planting and protecting forests, preventing erosion and protecting the coast.
Figure 35 shows the share of CC&GG investment by theme in the province for actual disbursement in the two years (2016-2017) and for the MTIP for 2016-2020.
2016 2017
500
400
300
100
200
0
Electricity
Urban
Transport
Waste
Agriculture
Forestry
Irrigation
Water
Fisheries
Biodiversity
River
Coastal
TOTAL
VND
Bill
Figure 34. CC&GG expenditure of Bac Lieu (2016-2017) by theme

PAGE 88
Afforestation, coastal protection, sustainable water resources management (river), agriculture and sustainable urban development are the fields with the largest capital proportion in MTIP in Bac Lieu.
Table 27 below shows the 10 largest CC&GG projects in 2016 and 2017 in Bac Lieu. These projects account for 70% of total CC&GG investment for the 2 years. Most of the projects are in forest plantation, coastal protection works, urban protection and irrigation.
0%
5%
10%
15%
20%
25%
30%
35%
40%
Urban Transport ForestryWaste Agriculture Irrigation Water Fisheries CoastalRiver
2 years (2016 & 2017) MTIP 2016-2020
ElectricityBiodiversity
Figure 35. CC&GG expenditure in 2 years (2016 & 2017) and CC&GG investment plan in MTIP 2016-2020 of Bac Lieu by theme
Table 27. Top 10 projects with the highest expenditure in 2 years (2016 & 2017) of Bac Lieu
PROJECTSCODES EXPENDITURE (VND BILL)
A M 2016 2017 TOTALConstruction of tide and flooding prevention works for Bac Lieu City and surrounding area
A15.1 20.000 100.000 120.000
The construction investment project of emergency natural disaster prevention work and adaptation to climate change (project on construction of works system to prevent flooding in Bac Lieu city and surrounding areas)
A4.3 2.500 100.000 102.500
Project on residential area. resettlement of Bac Lieu protection forest
A8.3 52.000 41.100 93.100
The project of resettlement of protection forest in Bac Lieu city
A8.2 52.000 41.100 93.100
The project to build an embankment to prevent the erosion of two river banks of Bac Lieu city (under the project of river bank embankment in two cities of Bac Lieu province)
A4.3 25.000 30.000 55.000

PAGE 89
PROJECTSCODES EXPENDITURE (VND BILL)
A M 2016 2017 TOTALThe project to build the imperial embankment to prevent erosion and overcome the consequences of natural calamities and storms on the banks of Bac Lieu city (belonging to the project of embankment of two river banks of Bac Lieu city)
A14.3 25.000 30.000 55.000
Project on building embankment of Nha Mat beach in Bac Lieu (on the west bank of canal 30/4).
A14.3 42.605 2.000 44.605
Dong Nang Ren project A10.1 33.000 33.000Planting mangroves to prevent erosion. protecting Ganh Hao sea dykes
A15.1 M8.2 22.000 22.000
Project on erosion control to create mangrove forest to prevent erosion and protect sea dyke Ganh Hao
A8.2 18.030 2.000 20.030
Total 270.135 368.2 638.335As % all CC&GG expenditure in Bac Lieu 62% 77% 70%

PAGE 90
A1.11 CA MAU
Ca Mau experienced a decrease in CC&GG investment in 2017, down 5.7% from 648 billion in 2016 to 611 billion in 2017. According to MPI's
allocation of capital, about one quarter of the decrease in the budget for 2017 is explained by a decrease of about 118 billion VND for all 7 of the Target Programs related to climate change, including the ODA support for climate change and green growth.
CC&GG investment in the two years 2016 and 2017 in Ca Mau focus on sustainable urban development 24%, coastal protection 21.1%, irrigation 19.4% and disaster risk reduction 11.9%.
Adaptation accounted for 88.25% of CC&GG investment in Ca Mau, with 0.47% for mitigation and 11.28% for both mitigation and adaptation, which is
higher than other provinces in the region and involved projects related to plantation and protection, erosion prevention and coastal protection.
Figure 37 below illustrates the share of CC&GG investment by theme in Ca Mau for actual disbursement in the two years (2016-2017) and the MTIP for 2016-2020.
2016 2017
500
600
700
400
300
100
200
0
DRR
Urban
Transport
Waste
Agriculture
Forestry
Irrigation
Water
Fisheries
River
Coastal
Industry
Total
VND
Bill
Figure 36. CC&GG expenditure of Ca Mau (2016-2017) by theme

PAGE 91
Ca Mau is a province with diversified CC&GG investment. Coastal protection has the highest share of total CC&GG investment in the MTIP with 27.7%, followed by disaster risk reduction 26.6%, sustainable urban development 15.8%, agriculture 12.4%, forestation 6.1% and irrigation 5.2%.
Table 28 below shows the list of the 10 projects with the highest CC&GG expenditure in 2016 and 2017. These projects account for 72% of total CC&GG investment. The largest projects span a wide range of themes, reflecting the diversity of climate change challenges that Ca Mau Province is responding to.
0%
5%
10%
15%
20%
25%
30%
Urban Transport ForestryWaste Agriculture Irrigation Water Fisheries CoastalRiver
2 years (2016 & 2017) MTIP 2016-2020
IndustryDRR
Figure 37. CC&GG expenditure in 2 years (2016 & 2017) and CC&GG investment plan in MTIP 2016-2020 of Ca Mau by theme
Table 28. Top 10 projects with the highest expenditure in 2 years (2016 & 2017) of Ca Mau
PROJECTSCODES EXPENDITURE (VND BILL)
A M 2016 2017 TOTALReciprocal urban upgrading project Ca Mau city (NUUP) A4.4 20,000 242,204 262,204The arterial road of Nam Ca Mau economic zone, Ca Mau province (phase 1)
A15.1 100,000 30,000 130,000
Building the southern route connecting the Ong Doc River on Highway 1A (Rach Rang - Song Doc) 1A (Rạch Rạng - Sông Đốc)
A3.1 72,200 50,000 122,200
Investment project to upgrade sea dikes in the west of Ca Mau province
A15.1 42,000 60,000 102,000
+ Sub-region V - Nam Mau A10.1 98,546 98,546+ + Subregion Southern Ca Mau XVII- A10.1 71,948 71,948

PAGE 92
PROJECTSCODES EXPENDITURE (VND BILL)
A M 2016 2017 TOTALInvestment projects in infrastructure construction Ngo Quyen Street, Ca Mau City
A4.4 M3.1 29,500 10,000 39,500
The project supports waste treatment hospital in Ca Mau A6.1 1,473 30,919 32,392Investment projects in infrastructure construction and technical Square Cultural center Ca Mau
A6.1 15,000 10,000 25,000
Investment projects construction of roads from the southern coastal corridor ecotourism point Song Trem
A8.1 23,000 23,000
Total 450,667 456,123 906,790As % all CC&GG expenditure in Ca Mau 70% 75% 72%

PAGE 93
A1.12 KIEN GIANG
Kien Giang experienced a sharp decrease in CC&GG investment in 2017 compared to 2016 with a reduction of up to 51% from 864 billion VND in 2016 to 423 billion VND in 2017. Over the same period, total public investment in the province increased up 37.5% (from 2.920 billion VND to 4.014 billion
VND). The MPI’s decision to allocate funds to the province saw a 31% decrease from 151 billion VND in 2016 to 104 billion VND in 2017, which is one of the reasons for the fall in total CC&GG investment. Another reasons is that, based on a review of the list of projects, a large number of projects were stopped or delayed in 2017.
There are 11 themes that had CC&GG investment in 2016 and 2017. Investment in 2017 was significantly reduced compared to 2016 for irrigation projects, which reduced by 96%, disaster risk reduced by 71%, sustainable water resources management (river) reduced by 65%, coastal protection reduced by 54%, afforestation reduced by 33%; water drainage reduced by 28% and fisheries reduced by 14%.
Adaptation accounted for 92.85% of CC&GG investment, which is similar to other coastal
provinces such as Ca Mau and Bac Lieu. Kien Giang also allocated funds to projects that combine both climate change adaptation and mitigation, which accounted for 7.15% of total CC&GG investment and typically focused on coastal forest protection and development projects and mangrove plantings to prevent erosion and protect the coast.
Figure 39 shows the share of CC&GG investment by theme for actual disbursement in the two years (2016-2017) and the MTIP for 2016-2020 .
2016 2017
500
600
700
800
900
1000
400
300
100
200
0
DRR
Urban
Waste
Agriculture
Forestry
Irrigation
Water
Fisheries
Biodiversity
River
Coastal
TOTAL
VND
Bill
Figure 38. CC&GG expenditure of Kien Giang (2016-2017) by theme

PAGE 94
The themes of sustainable urban development, fisheries, water supply and drainage, coastal protection, afforestation, disaster risk reduction, and biodiversity are the main CC&GG themes in the MTIP of Kien Giang. Investment in irrigation has declined significantly in the MTIP.
Table 29 below provides information on the top 10 projects with the highest CC&GG investment in 2016 and 2017. The 10 largest projects accounted for 75% of total CC&GG investment, with 4 out of the top 10 projects for irrigation, 3 for sustainable urban development and others for sustainable water resources management (river) and water supply.
0%
5%
10%
15%
20%
25%
30%
Urban ForestryWaste Agriculture Irrigation Water Fisheries CoastalRiver
2 years (2016 & 2017) MTIP 2016-2020
BiodiversityDRR
Figure 39. CC&GG expenditure in 2 years (2016 & 2017) and CC&GG investment plan in MTIP 2016-2020 of Kien Giang by theme
Table 29. Top 10 projects with the highest expenditure in 2 years (2016 & 2017) of Kien Giang
PROJECTSCODES EXPENDITURE (VND BILL)
A M 2016 2017 TOTALUrban Upgrading Project -Mekong Delta subproject. Rach Gia city
A4.4 149 194.495 343.495
Irrigation system for rural development Vàm Răng - Ba Hòn
A10.1 189.121 189.121
Sea dyke road running through the city of Rach Gia A15.1 45 47 92Embankments against erosion Giong Rieng district A14.3 35 20 55
Irrigation system for aquaculture An Minh (O 2) A10.1 52.942 52.942An Bien sea dike project - An Ming (27 culverts). A15.1 22.2 29.473 51.673Construction of emergency works to overcome drought. saltwater intrusion riparian zone Cai Be. Chau Thanh district; component: Ca Lang Rach drain.
A15.1 49.5 49.5

PAGE 95
PROJECTSCODES EXPENDITURE (VND BILL)
A M 2016 2017 TOTALBai Nha water reservoir under new construction projects and renovation Kien Hai reservoir groups Hon Ngang. Bai Nha reservoir and repair and upgrading Hon Lon reservoir). Kien Hai district.
A11.1 27 18 45
Irrigation management for rural development in Mekong Delta (WB6) - Inter-communal water supply system An Bien District.
A10.1 32.227 12.309 44.536
Irrigation system for aquaculture An Bien (O 1) A10.1 36.914 36.914Total 638.904 321.277 960.181As % all CC&GG expenditure in Kien Giang 74% 76% 75%
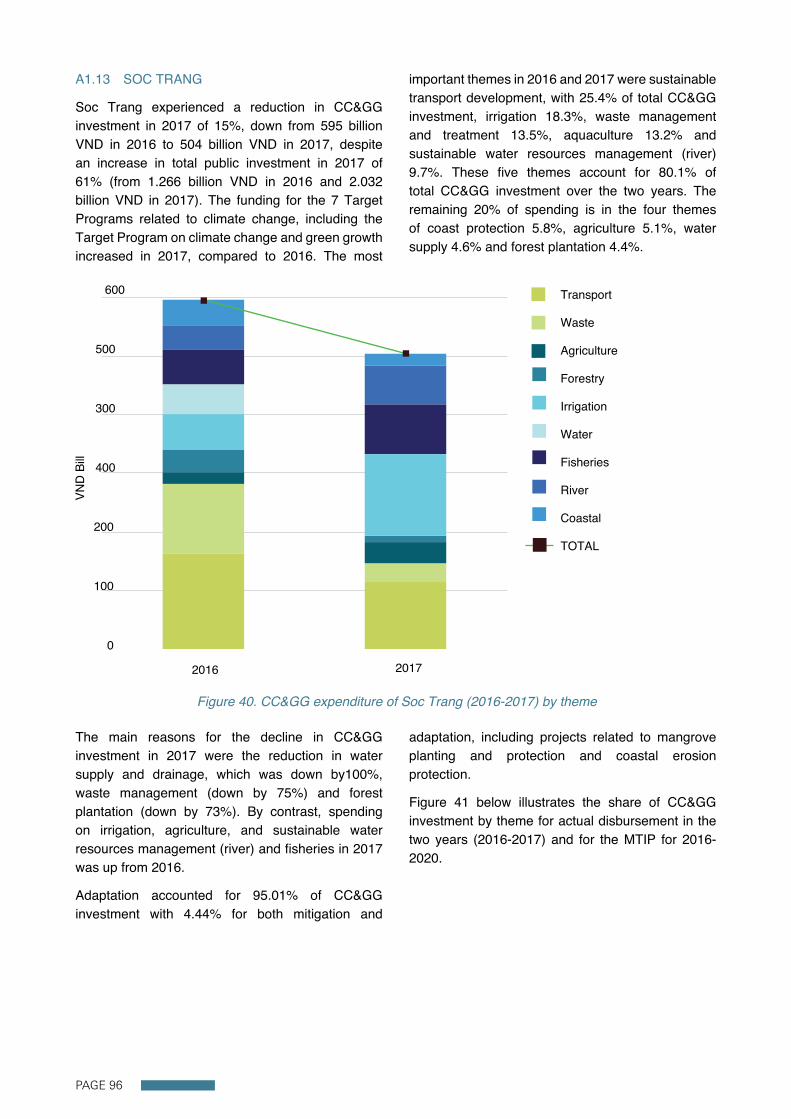
PAGE 96
A1.13 SOC TRANG
Soc Trang experienced a reduction in CC&GG investment in 2017 of 15%, down from 595 billion VND in 2016 to 504 billion VND in 2017, despite an increase in total public investment in 2017 of 61% (from 1.266 billion VND in 2016 and 2.032 billion VND in 2017). The funding for the 7 Target Programs related to climate change, including the Target Program on climate change and green growth increased in 2017, compared to 2016. The most
important themes in 2016 and 2017 were sustainable transport development, with 25.4% of total CC&GG investment, irrigation 18.3%, waste management and treatment 13.5%, aquaculture 13.2% and sustainable water resources management (river) 9.7%. These five themes account for 80.1% of total CC&GG investment over the two years. The remaining 20% of spending is in the four themes of coast protection 5.8%, agriculture 5.1%, water supply 4.6% and forest plantation 4.4%.
The main reasons for the decline in CC&GG investment in 2017 were the reduction in water supply and drainage, which was down by100%, waste management (down by 75%) and forest plantation (down by 73%). By contrast, spending on irrigation, agriculture, and sustainable water resources management (river) and fisheries in 2017 was up from 2016.
Adaptation accounted for 95.01% of CC&GG investment with 4.44% for both mitigation and
adaptation, including projects related to mangrove planting and protection and coastal erosion protection.
Figure 41 below illustrates the share of CC&GG investment by theme for actual disbursement in the two years (2016-2017) and for the MTIP for 2016-2020.
2016 2017
500
600
400
300
100
200
0
Transport
Waste
Agriculture
Forestry
Irrigation
Water
Fisheries
River
Coastal
TOTAL
VND
Bill
Figure 40. CC&GG expenditure of Soc Trang (2016-2017) by theme

PAGE 97
Coastal protection, waste treatment and management, urban, irrigation and transport are the themes with the most CC&GG investment in the Soc Trang MTIP.
Table 30 below shows the top 10 CC&GG projects in
2016 and 2017. These projects account for 65% of the total CC&GG investment. Four of the top 10 projects are in transport, two in irrigation, and the others in the sustainable water resources management (river), fisheries and coastal protection and waste treatment.
0%
5%
10%
15%
20%
25%
30%
Urban ForestryWaste Agriculture Irrigation Water Fisheries CoastalRiver
2 years (2016 & 2017) MTIP 2016-2020
DRR Transport
Figure 41. CC&GG expenditure in 2 years (2016 & 2017) and CC&GG investment plan in MTIP 2016-2020 of Soc Trang by theme
Table 30. Top 10 projects with the highest expenditure in 2 years (2016 & 2017) of Soc Trang
PROJECTSCODES EXPENDITURE (VND BILL)
A M 2016 2017 TOTALProject on coastal resources for sustainable development in Soc Trang
A12.2 60,288 84,615 144,903
Construction of salinity prevention dykes and roads for national security and defense to rescue ships and boats in the coastal area, Tran De district
A10.2 120 120
Solid waste treatment plant in Soc Trang city and surrounding areas
A6.1 97,427 14,664 112,091
Salinity prevention system, stable production of the left bank of Saintard
A14.1 31,776 49,354 81,13
District road 50, My Xuyen district A5.1 31,255 29,186 60,441Renovate and upgrade irrigation systems for aquaculture in Cu Lao Dung District
A10.1 38 20 58
The project in sea dike from My Thanh 2 bridge to boundary Bac Lieu (from My Thanh 2 bridge Tra Set), TXVC, TST (Phase 1)
A15.1 30 20 50
Road to the center of Xuan Hoa commune A5.1 44,8 44,8Road to the center of Xuan Phu commune A5.1 40 40Provincial road 940 A5.1 36,89 36,89Total 373,546 337,819 711,365As % all CC&GG expenditure in Kien Giang 63% 67% 65%

PAGE 98
©GIZ

Published by
Deutsche Gesellschaft für
internationale Zusammenarbeit (GIZ) GmbH
Registered offices:
Bonn and Eschborn, Germany
Integrated Coastal Management Programme (ICMP)
Address:
Room K1A, No.14 Thuy Khue Road, Tay Ho
Hanoi, Viet Nam
www.giz.de/viet-nam
and
United Nations Development Programme (UNDP)
Project ‘Strengthening Capacity and Institutional Reform for Green Growth and Sustainable Development in Vietnam’ (CIGG)
Time of publication:
December 2018
Text
Le Thanh Tung
Pham Thi Diep
Kit Nicholson
Tran Thi Mai Phuong
Photo Credit
GIZ
UNDP Viet Nam
On behalf of the
Australian Department of Foreign Affairs and Trade (DFAT)
German Federal Ministry of Economic Cooperation and Development (BMZ)
United Nations Development Programme (UNDP)
United States Agency for International Development (USAID)
Disclaimer
This study is conducted by the International and national consultants. The conclusions and recommendations expressed in this report do not necessarily reflect the views of GIZ, UNDP or the governments it is commissioned by.
The boundaries, colors, denominations and other information shown on any map in this report do not imply any judgement on the part of GIZ or UNDP.
Copyright: © Project ‘Strengthening Capacity and Institutional Reform for Green Growth and Sustainable Development in Vietnam’ (CIGG) & Integrated Coastal Management Programme (ICMP), 2018

Đánh giá �ầu tư công cho biến �ổi khí hậuvà tăng trưởng xanh tại Đồng bằng Sông Cửu Long(CPEIR-Mekong)Dự án “Hỗ trợ tăng cường năng lực
và đổi mới thể chếthực hiện tăng trưởng xanh
và phát triển bền vững ở Việt Nam” – và”Chương trình Quản lý tổng hợp vùng ven biển”