
Climate Agreement and Technology Diffusion: Impact of the ...Impact of the Kyoto Protocol on...
42
Climate Agreement and Technology Diffusion: Impact of the Kyoto Protocol on International Patent Applications for Renewable Energy Technologies Mai Miyamoto Kenji Takeuchi May 2018 Discussion Paper No.1820 GRADUATE SCHOOL OF ECONOMICS KOBE UNIVERSITY ROKKO, KOBE, JAPAN
Transcript of Climate Agreement and Technology Diffusion: Impact of the ...Impact of the Kyoto Protocol on...
Climate Agreement and Technology Diffusion: Impact of the Kyoto Protocol on International
Patent Applications for Renewable Energy Technologies
Mai MiyamotoKenji Takeuchi
May 2018
Discussion Paper No.1820
GRADUATE SCHOOL OF ECONOMICS
KOBE UNIVERSITY
ROKKO, KOBE, JAPAN
1
Climate Agreement and Technology Diffusion:
Impact of the Kyoto Protocol on International Patent Applications for
Renewable Energy Technologies
Mai Miyamoto* and Kenji Takeuchi†
May 10, 2018
Abstract
This paper examines the Kyoto Protocol’s impact on the international diffusion of renewable
energy technologies. Using patent application data from 133 countries from 1990 to 2013, we
find that the Kyoto Protocol increased international patent applications from the countries with
emission targets. When we focus on countries with more stringent targets, the effect of the
Kyoto Protocol is even stronger. We find a similar effect in international patent applications to
four developing countries that are large emitters of greenhouse gases (GHGs): China, India,
Brazil, and Mexico. These results suggest that the Kyoto Protocol stimulated international pa-
tenting activities from countries that are committed to stringent targets for climate mitigation.
Keywords: Renewable energy; Kyoto Protocol; International patent applications
JEL Classification Numbers: O33, Q42, Q55
* Graduate School of Economics, Kobe University. 2-1, Rokkodaicho, Kobe, Hyogo, 657-8501 Japan. E-mail: [email protected] † Graduate School of Economics, Kobe University. 2-1, Rokkodaicho, Kobe, Hyogo, 657-8501 Japan. E-mail: [email protected]
2
1. Introduction
The Kyoto Protocol commits State Parties to reduce greenhouse gas (GHG) emissions to an av-
erage of 5% against 1990 levels. It sets binding emission reduction targets for countries under
“common but differentiated responsibility and respective capabilities.” Since then, many re-
searchers have investigated the impact of the Kyoto Protocol (“Protocol”) on GHG emissions.
The Protocol’s effect on the reduction of GHG emissions is supported by recent empirical liter-
ature. Several studies find that countries with binding emission targets under the Protocol have
lower GHG emissions than they would have had in the absence of these targets (Aichele and
Felbermayr, 2012; Almer and Winkler, 2017; and Grunewald and Martinez-Zarzoso, 2016).
The impact of the Protocol has also been investigated from the viewpoint of techno-
logical development. For instance, Johnstone and Haščič (2010) examine if the Protocol has an
influence on patent applications for renewable energy technologies and find that a country’s
patent applications for wind and solar energy technologies increased after signing to the Proto-
col, suggesting that future expectations by firms on stricter regulations are important.
Dechezleprêtre et al. (2008) focus on the transfer of GHG mitigation technologies induced by
the Clean Development Mechanism (CDM), which is one of the flexible mechanisms under the

3
Protocol. Based on information collected from the project design documents, they found that
international technology transfer takes place in less than half of CDM projects.
This study investigates whether the Protocol influenced an increase in international
patent applications with respect to renewable energy technologies. Such patent applications are
of interest for two reasons. First, they can be interpreted as a measure of the cross-border diffu-
sion of climate-friendly technologies (Dechezleprêtre et al., 2013; Haščič and Johnstone, 2011).
The cross-border proliferation of knowledge regarding low-carbon technologies is a key factor
in climate mitigation that requires the cooperation of countries across the globe. By focusing on
international patent applications, we can investigate if the Protocol affects the international
transfer of climate-friendly technologies. Second, international patent applications reflect the
economic value of technology by capturing changes in inventor behavior1. When inventors
recognize a higher expected return from a patent, they will want to secure patent protection in
various countries and regions (Nagaoka et al., 2010). In other words, the higher number of in-
ternational patent applications represents higher economic profit from new technology.
1 An international patent application has a strong relation to the “family size” of the patent. Haščič et al. (2010) ex-plain international patent applications from the viewpoint of family size.
4
This paper makes three contributions to the existing literature on the economics of
renewable energy technology. First, we investigate the effect of the Protocol on international
patenting activity. There are several studies that explore technology transfer through the Proto-
col’s Clean Development Mechanism (Dechezleprêtre et al., 2008, 2009; Haščič and Johnstone,
2011). In contrast to these project-level studies, we investigate whether the Protocol affects the
total amount of international patent activity in each country. Second, we compare the pattern of
international diffusion by using several treatment groups and treatment periods. By looking at
the impact of the Protocol in countries with different target levels and in different periods, we
can understand the breadth and strength of the Protocol’s influence on technology diffusion.
Third, we investigate international patent applications to four developing countries that are
fast-growing emerging economies with large GHG emissions: China, India, Brazil, and Mexico.
Focusing on these four countries allows us to explore the “North-to-South” technology diffusion,
which has significant implications for future global GHG emissions.
The structure of this paper is organized as follows. Section 2 reviews previous litera-
ture related to the international diffusion of climate mitigation technologies. Section 3 explains
the model and data used in the analysis. Section 4 presents the results of our empirical analysis.
5
Section 5 analyzes the impact of international patent applications on four developing countries
emitting large amounts of GHGs. Finally, Section 6 concludes the study.
6
2. Literature Review
Several studies have examined technology transfer by using patent data (Lanjouw and Mody,
1996; Popp, 2006; Haščič and Johnstone, 2011; Dechezleprêtre et al., 2013). Lanjouw and Mo-
dy (1996) investigate the invention and diffusion of environmentally friendly technologies and
describe in detail the process of international patents. They use the number of foreign patent
applications as a measure of technology transfer. They found that many of the patents filed in
developed countries are domestic in origin, whereas most of the patents filed in developing
countries are foreign in origin. Haščič and Johnstone (2011) examine the role of the CDM under
the Protocol in the transfer of wind power generation technologies. They analyze patent applica-
tion data between Annex I countries and non-Annex I countries. Using patent data from over
100 countries during the period from 1988 to 2008, their estimation results suggest that the
CDM has had a positive influence on the extent of transfer of wind power technologies from
Annex I to non-Annex I countries. However, the estimated effects of CDM were relatively
small compared with those of other factors and negative when considering the cumulative effect
of CDM projects. Dechezleprêtre et al. (2013) investigate the international diffusion of patented
inventions in climate-friendly technologies between 1995 and 2007. They emphasize the im-

7
portance of intellectual property regimes in the international diffusion of patented knowledge.
Their results suggest that the technological capacity of recipient countries reduces the transfer of
foreign technologies.
This study investigates the effect of the Kyoto Protocol on international patent ap-
plications. An international patent application is defined as one in which the nationality of the
first inventor does not correspond to the country in which the application is filed.2 Some re-
searchers regard patent citations as a measure of technology diffusion (Jaffe et al., 1993; Peri,
2005; Popp, 2006). In contrast to patent citations that reflect knowledge spillover, the number of
international patent applications can be regarded as a proxy for market-driven knowledge flows
(Dechezleprêtre et al., 2013). The number of cross-border patent applications does not reflect
the actual transfer of technologies; instead, it provides a proxy for technology diffusion. In ad-
dition, patent systems are designed to protect new technological inventions from potential imi-
tators (Haščič et al., 2010). Patenting might prevent a technology from being transmitted to oth-
er nations; nevertheless, technology transfer often involves patent filings in the recipient coun-
2 An innovation is legally protected only in a country in which it is patented. Thus, some part of the technology crossing borders will show up as foreign patents and knowing the nationality of inventors allows us to identify these flows (Lanjouw and Mody, 1996).
8
try of new technologies. Therefore, international patenting can be regarded as a channel for
technology diffusion (Eaton and Kortum, 1996).
9
3. Model and Data
3.1 Model
To estimate the effect of the Protocol on international patent applications, we employ a differ-
ence-in-difference (DID) estimator combined with a mix of fixed effects by running the Least
Squares Dummy Variable (LSDV) model. Using the DID method, we compare the change in
the number of international patent applications in countries committed to reducing GHG emis-
sions with that in countries without such commitment. The fixed effects estimation allows us to
control for time-invariant country characteristics that may be correlated with the decision to
commit to emission reduction through the Protocol. The general form of the model adopted in
this analysis can be written as follows:
Patent!" = 𝛽! + 𝛽!𝑇𝑟𝑒𝑎𝑡𝑚𝑒𝑛𝑡×𝑃𝑒𝑟𝑖𝑜𝑑!" + 𝛽!𝑋!" + 𝛿! + 𝛾! + 𝜀!", (1)
where i = 1, …,133 indexes countries as a cross-section unit, t = 1990, …, 2013 indexes the
year as the time unit, X is a set of time-varying country characteristics, δ is a vector of country
dummy, γ is the year dummy, and ε is the error term. The dependent variable (Patent) is the

10
number of international patent applications for renewable energy technologies. As mentioned in
Section 2, an international patent application is defined as a patent in which the nationality of
the first inventor does not correspond to the country of filing. Treatment is the treatment in-
dicator that takes the value one for countries that have emission targets, so-called Annex B
countries, and zero otherwise. We use two treatment groups: 34 Annex B countries that have
quantitative limitations under the Protocol (Treatment 1)3 and 21 countries that have stronger
targets among Annex B countries (Treatment 2)4. Therefore, the control group is the other 99
countries for Treatment 1 and the other 112 countries for Treatment 2. Period represents the
treatment period that takes the value of one for the year during which the Protocol is effective
and zero otherwise. To compare the timing of the treatment, we adopt three treatment periods:
1997–2012 (Period A), 2005–2012 (Period B), and 2008–2012 (Period C). The first treatment
period considers the fact that the Protocol was adopted in 1997. The second treatment period is
3 The 34 countries are Austria, Australia, Belgium, Bulgaria, Canada, Switzerland, Czech Republic, Germany, Den-mark, Estonia, Spain, Finland, France, the United Kingdom, Greece, Croatia, Hungary, Ireland, Iceland, Italy, Japan, Lithuania, Latvia, Netherlands, Norway, New Zealand, Poland, Portugal, Romania, Russian Federation, Sweden, Slovenia, Slovakia, and Ukraine. 4 In this study, we define stronger targets as that is lower than emissions in 1990. The 21 countries are Austria, Bel-gium, Bulgaria, Canada, Switzerland, Czech Republic, Germany, Denmark, Estonia, United Kingdom, Croatia, Hun-gary, Italy, Japan, Lithuania, Latvia, The Netherlands, Poland, Portugal, Romania, Slovenia, and Slovakia. Other countries, such as Portugal, Spain, Russia, and Ukraine, have quantitative targets but they do not have to attain lower emission levels than 1990.
11
based on the fact that the Protocol became effective in 2005. The third treatment period is de-
fined so as to represent the first commitment period of the Protocol.
The number of patent applications is count data and a non-negative integer-valued
random variable. Count data models have been developed to deal with the number of event oc-
currences (Maddala, 1983; Cameron and Trivedi, 1998). Thus, we use a negative binomial
model and maximum likelihood method to estimate Eq. (1). The panel of 133 countries and 24
years (1990–2013) is available, but missing observations for some countries reduce the sample
size in most models estimated.
3.2 Data
Dependent variables: International application
The number of international patent applications is calculated using the Worldwide Patent Statis-
tical Database, PATSTAT (version 2016, autumn). Following Johnstone et al. (2010), we clas-
sify patent data into each renewable energy source according to the IPC codes (see Table A1).
Figure 1 shows the trends in international patent applications for wind and solar energy tech-

12
nologies among the 133 countries5 from 1990 to 2013. There is a clear increase in the number
of international patent applications for both types of renewable energy during the 2000s. After
2010, patent applications decrease and are back to the level of the late 2000s. The trends in do-
mestic patent counts follow a similar pattern. Figures 2 and 3 compare the international applica-
tions for wind and solar energy technologies in Annex B countries with those in other countries.
The trends of international applications in these countries are similar prior to the adoption of the
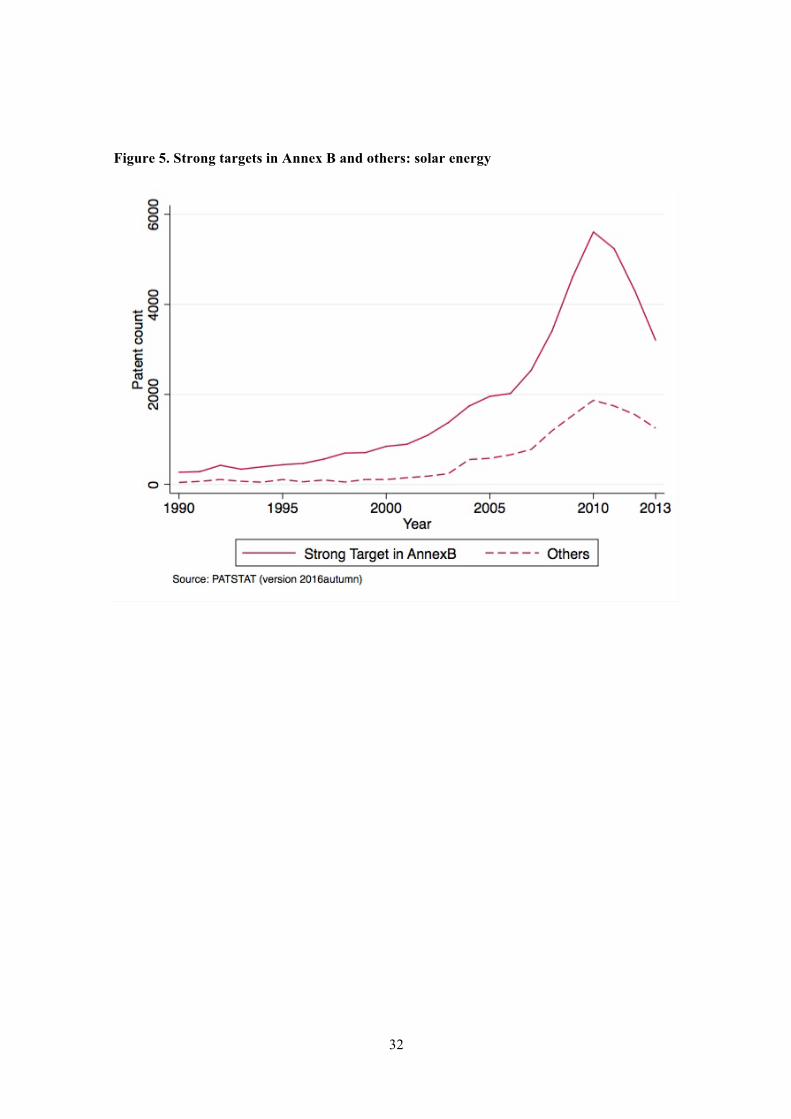
Protocol in 1997, but clearly depart afterwards. Figures 4 and 5 illustrate the trends of interna-
tional applications by Annex B countries that have stringent targets and those of other countries.
The figures also suggest that the trend of international applications is similar before 1997, but
differ after that.
5 The 133 countries are the United Arab Emirates, Antigua and Barbados, Angola, Argentina, Austria, Australia, Azerbaijan, Barbados, Bangladesh, Belgium, Burkina Faso, Bulgaria, Bahrain, Burundi, Benin, Plurinational State of Bolivia, Brazil, Bahamas, Botswana, Belarus, Belize, Canada, Democratic Republic of the Congo, Central African Republic, Congo, Switzerland, Ivory Coast, Chile, Cameroon, China, Columbia, Costa Rica, Cape Verde, Cyprus, Czech Republic, Germany, Denmark, Dominican Republic, Algeria, Ecuador, Estonia, Egypt, Eritrea, Spain, Finland, Fiji, France, Gabon, the United Kingdom, Ghana, Guinea, Equatorial Guinea, Greece, Guatemala, Honduras, Croatia, Haiti, Hungary, Indonesia, Ireland, Israel, India, Iran, Iceland, Italy, Jamaica, Jordan, Japan, Kenya, Kiribati, Repub-lic of Korea, Kuwait, Kazakhstan, Lao People's Democratic Republic, Lebanon, Sri Lanka, Liberia, Lesotho, Lithua-nia, Latvia, Morocco, Moldova, Madagascar, Mali, Mauritania, Malta, Mauritius, Malawi, Mexico, Malaysia, Mozambique, Namibia, Niger, Nigeria, the Netherlands, Norway, New Zealand, Panama, Peru, Papua New Guinea, Philippines, Pakistan, Poland, Portugal, Palau, Paraguay, Romania, Russian Federation, Saudi Arabia, Seychelles, Sweden, Singapore, Slovenia, Slovakia, Sierra Leone, Senegal, El Salvador, Syrian Arab Republic, Swaziland, Chad, Togo, Thailand, Tunisia, Tonga, Turkey, Trinidad and Tobago, Ukraine, Uganda, Uruguay, Bolivarian Republic of Venezuela, Yemen, South Africa, and Zimbabwe. The United State of America is dropped from our dataset because the country withdrew from the Kyoto Protocol in 2001.

13
Control variables
The estimation model includes four types of control variables: GDP per capita, FDI outflows,
international application in all technological fields, and domestic patent stock. We use GDP per
capita evaluated at constant US dollars in 2010 from the World Development Indicators pro-
vided6 by the World Bank. These data capture the size of the economy in each country in each
year. FDI refers to direct investment equity flows in an economy and is included in the model to
control for investment in foreign countries. Data are in current US dollars. We also include the
variable related to international applications in all technology fields to capture the extent of ac-
tivity abroad. The data are calculated from PATSTAT. To capture the supply of inventions in
each country, we include the total number of patent applications in domestic countries in the last
five years.7 A one-year lag is applied to this variable to reflect the time required to invent and
apply for a patent abroad. We take logarithmic form for all continuous variables except for do-
mestic patent stock. Tables 1–4 report descriptive statistics of the dependent and independent
variables used in each estimation. We perform the t-test to examine if the distribution of covari-
ates is the same between the treatment and control groups. There are statistically significant dif-
6 http://databank.worldbank.org/data/home.aspx 7 We also check the estimation results by using patent application flows and domestic application variables without lag and confirm that these estimation results do not differ with the main results.

14
ferences between the mean value of the treatment and control groups. Thus, we employ a fixed
effects DID model using the LSDV approach. Furthermore, the estimation models include other
variables to control these differences, particularly between developed and developing countries.
15
4. Empirical Results
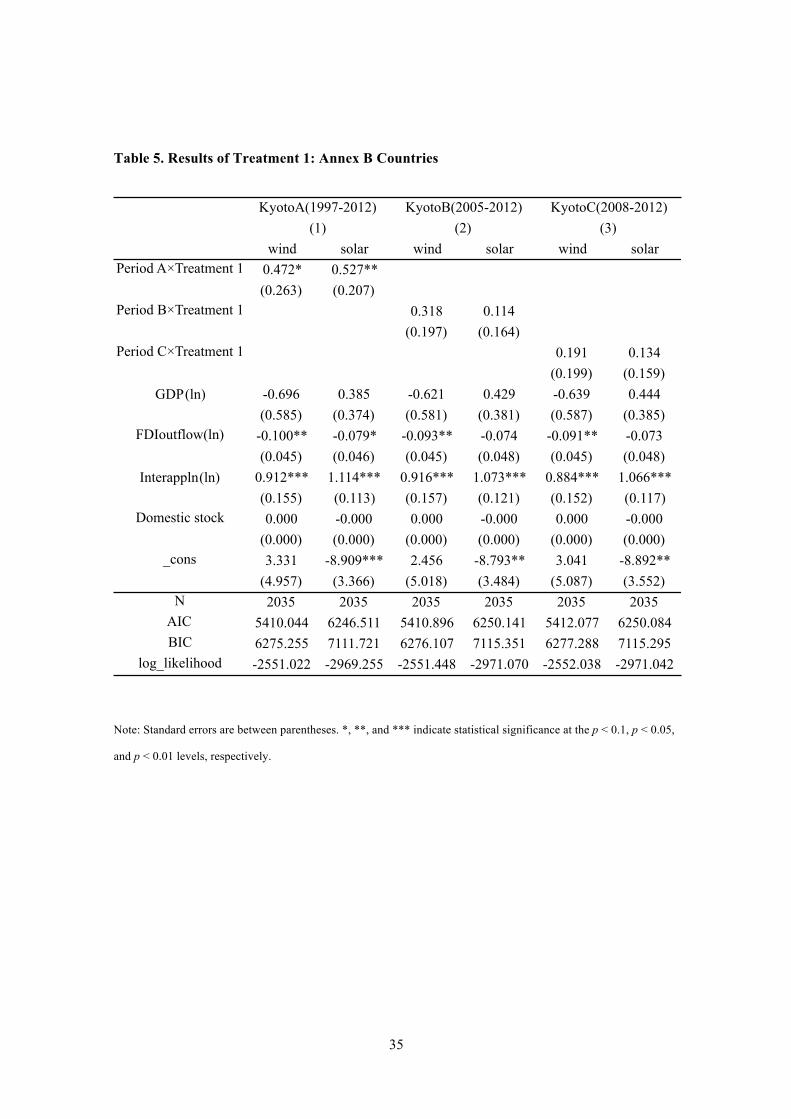
4.1 Effect of the Kyoto Protocol on international patent applications
Table 5 reports the estimation results of models using Treatment 1 that define Annex B coun-
tries as the treatment group. As for the treatment period dummy, specifications (1)–(3) use Pe-
riods A–C, respectively. All models include the country and year dummies. The coefficients of
the interaction term between Period A and Treatment 1 are positive and statistically significant
at the 10% level for wind energy and at the 1% level for solar energy in specification (1). The
results suggest that the Protocol increased international patent applications in Annex B countries
after 1997. In other words, the countries that commit to emission targets of GHGs have higher
numbers of international patent applications than other countries. Johnstone et al. (2010) find
that the Protocol encouraged the domestic patent filings of renewable energy technologies. The
results of our study suggest that the Protocol has also promoted technology diffusion through
international patent applications.
The coefficient of the interaction term between Period B and Treatment 1 is not sta-
tistically significant for both energy types in specification (2). The results suggest that the in-
fluence of the Protocol is not observed when we define the treatment period of the Protocol as

16
between 2005 and 2012. The coefficient of the interaction term between Period C and Treat-
ment 1 is not statistically significant in specification (3). To summarize, the Protocol increased
the number of international patent applications for renewable energy technologies in the earlier
period after its adoption, but the influence is not significant in the first commitment period from
2008 to 2012.
Table 6 reports the estimation results of models using Treatment 2 that define those
among Annex B countries that have a strong target as the treatment group. In specification (4),
the coefficients of the interaction term between Period A and Treatment 2 are positive and sta-
tistically significant at the 1% level for wind energy and at the 5% level for solar energy. The
results suggest that the Protocol increased international patent applications during 1997 and
2012. The coefficient of the interaction term between Period B and Treatment 2 is positive and
statistically significant at the 1 % level for wind energy in specification (5). The coefficients of
the interaction terms between Period C and Treatment 2 are positive and statistically significant
at the 1% level for wind energy and at the 5% level for solar energy in specification (6). These
results suggest that the Protocol increased international patent applications in the countries with
stringent targets during the first commitment period.
17
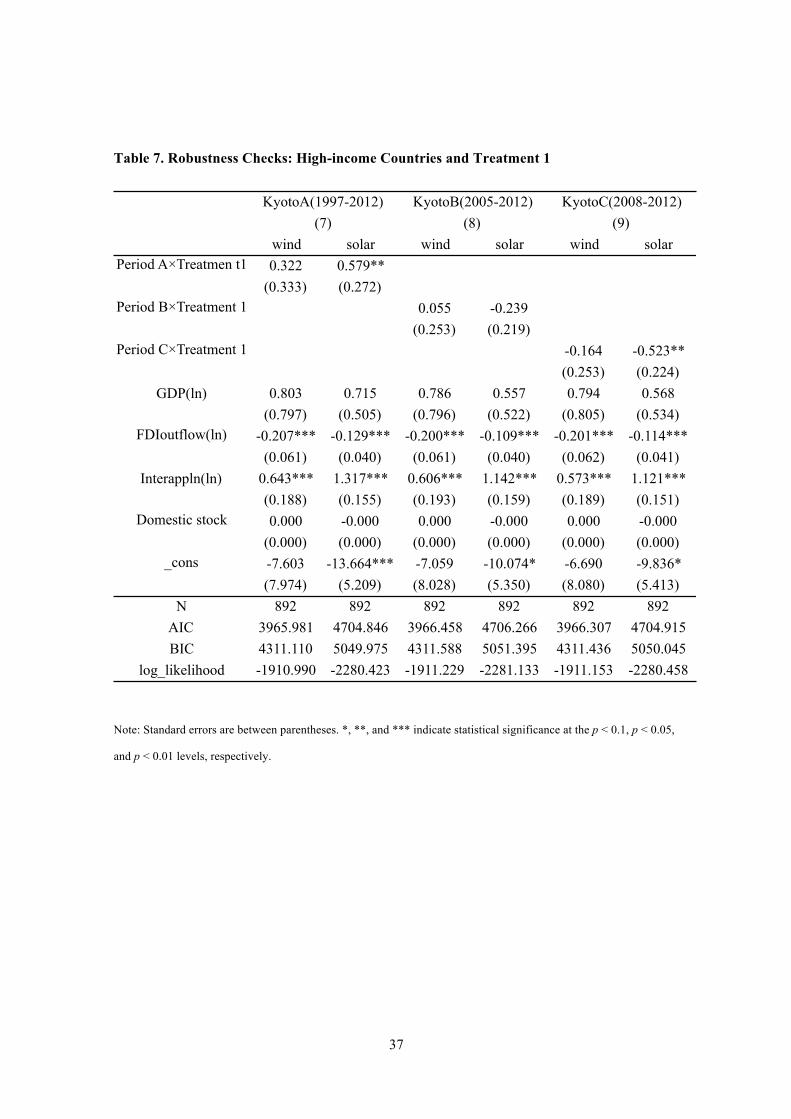
4.2 Robustness check
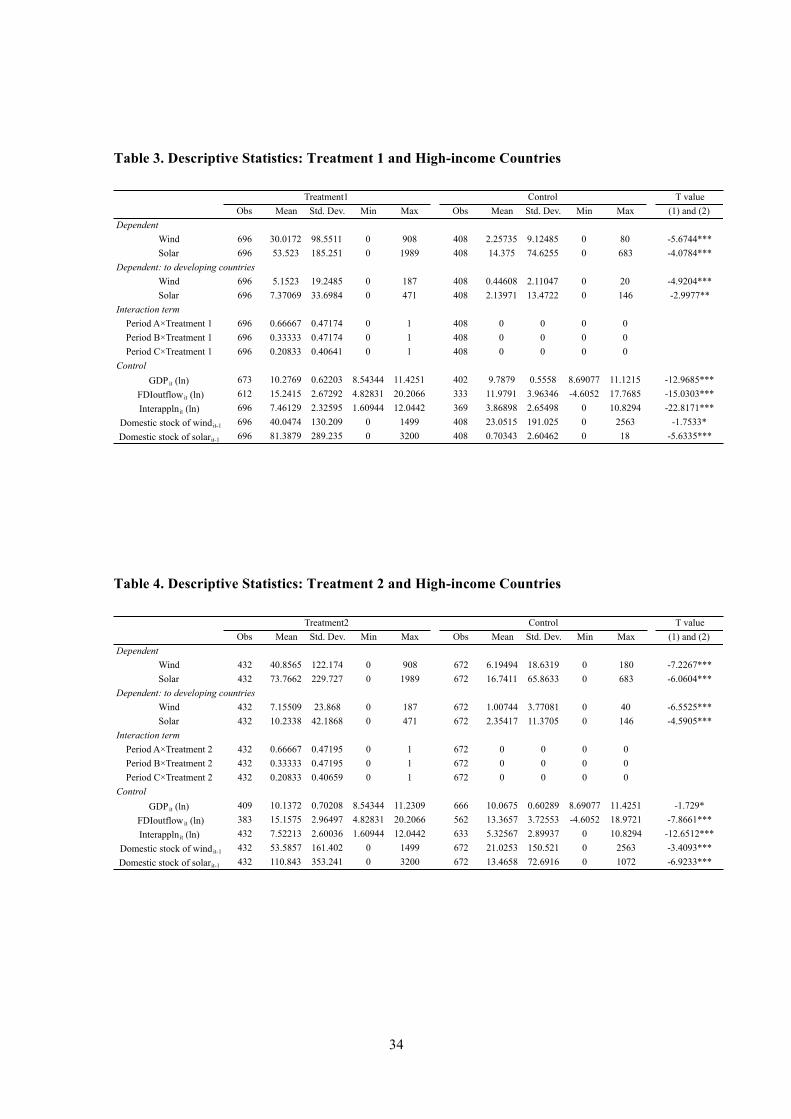
Tables 7 and 8 present the results of the robustness check using the dataset of high-income
countries.8 As shown in Tables 1 and 2, there are statistically significant differences between
the treatment and control groups. To consider the differences, we estimate models using the da-
taset only with high-income countries.
Table 7 reports the estimation results of models using the dataset limited to
high-income countries and Treatment 1. The coefficient of the interaction term between Period
A and Treatment 1 is statistically significant at the 5% level for solar energy. We confirm that
the effect of the Protocol on international patent applications for solar energy technologies is
positive. On the other hand, we do not observe a statistically significant impact in specifications
(8) and (9). The results suggest that the effect of the Protocol is insignificant in the latter period.
Table 8 reports the estimation results of models using Treatment 2. The coefficients
of the interaction term between Period A and Treatment 2 are positive and statistically signifi-
cant at the 1% level for wind energy and at the 5% level for solar energy. The coefficient of the
interaction term between Period B and Treatment 2 is positive and statistically significant at the
8 The definition of “high-income countries” is from the World Bank: https://datahelpdesk.worldbank.org/

18
5% level for wind energy in specification (11). Similarly, the coefficient of the interaction term
between Period C and Treatment 2 is positive and statistically significant at the 1% level for
wind energy. The results suggest that the Protocol increased international patent applications of
wind energy technologies from countries that have stronger targets under the Protocol.

19
5. International patent applications to developing countries
In this subsection, we explore international patent applications to four developing countries:
China, India, Brazil, and Mexico. These countries are chosen as developing countries with high
GHG emissions. The rapid economic growth in these countries not only increases their current
carbon emissions, but is also predicted to result in higher global GHG emissions in the future.
For example, China is currently the largest emitter of energy-related CO2 emissions in the world
and is projected to remain in that position through 2040 (Energy Information Administration,
2017).
Table 9 reports the estimation results. The coefficients of the interaction term be-
tween Period A and Treatment 1 are positive and statistically significant at the 5% level for both
of types of renewable energy technology. The results indicate that the Protocol affects interna-
tional patent applications to these four developing countries. From specifications (14) and (15),
we find that the coefficients of the interaction terms between Period B and Treatment 1 and
between Period C and Treatment 1 are not statistically significant. Thus, the influence of the
Protocol on international patent applications to these four developing countries is not confirmed
in these periods.
20
Table 10 reports the estimation results using Treatment 2. The coefficient of the in-
teraction term between Period A and Treatment 2 is statistically significant at the 5% level for
wind energy in specification (16). The coefficients of the interaction term between Period B and
Treatment 2 are not statistically significant in both energies in specification (17). On the other
hand, the coefficients of the interaction term between Period C and Treatment 2 are statistically
significant at the 5% level for solar energy and at the 10% level for wind energy in specification
(18). These results suggest an increase in applications to the four developing countries even in
the first commitment period.
21
6. Conclusion
This study investigated the effect of the Kyoto Protocol on international patent applications of
renewable energy technologies. Using a DID approach, we find that the Protocol increased pa-
tent applications in developed and developing countries. These findings highlight three im-
portant aspects related to the globalization of renewable energy technologies. First, inventors
increased the number of international applications with respect to renewable energy after the
Protocol was adopted. This effect is observed in the earlier period, particularly in the treatment
period starting from 1997. Second, our results indicate that the impact of the Protocol on tech-
nology diffusion is more evident for Annex B countries with stronger GHG reduction targets.
For these countries, the impact of the Protocol on the number of international patent applica-
tions remains strong even in the first commitment period. Third, the Protocol also increased in-
ternational patent applications to four developing countries. Although these countries are not
obliged to reduce GHG emissions under the Protocol, the estimated results suggest that firms
are expecting higher demand for emission reductions in these countries.
There are two policy implications from this study. First, our results indicate the im-
portance of international agreement on climate change for technology diffusion. The Kyoto
22
Protocol indirectly affects climate chage by increasing international patent applications regard-
ing renewable energy technologies and by reducing future emissions. This effect might result in
further emission reductions because international patent applications can be the first step in
technology transfer (Dechezleprêtre et al., 2013) or a channel for technology diffusion (Eaton
and Kortum, 1996). The second policy implication of our study is that the climate agreement
might affect the expected return from renewable energy technologies. By encouraging R&D of
climate-friendly technologies, international agreement can promote innovation activities that
lead to patent applications. The expectation for expansion of the market for renewable energy
leads to an increase in the number of international applications. The influence of introducing an
international framework can be strong enough to increase international patent applications to
developing countries even though the framework does not require their commitment at the cur-
rent stage.
The Paris Agreement, adopted in 2015, mentioned the importance of technological
development and diffusion, particularly from industrialized countries to developing countries
(UN, 2016). Although the impact of this agreement on technology diffusion is yet to be con-
firmed, different levels of commitment by countries under the Agreement might have different

23
impacts on technology diffusion. Further study on the effect of the climate agreement on tech-
nology diffusion is important to elaborate an international framework for mitigating climate
change.
Acknowledgement
This work was supported by JSPS KAKENHI Grant Number JP16H03006, JP26241033. Help-
ful comments from Taiji Hagiwara, Masanobu Ishikawa, and Kenta Nakamura are gratefully
acknowledged.

24
References
Aichele, R., and Felbermayr, G. (2012). Kyoto and the carbon footprint of nations. Journal of
Environmental Economics and Management, 63(3), 336–354.
Almer, C., and Winkler, R. (2017). Analyzing the effectiveness of international environmental
policies: The case of the Kyoto Protocol. Journal of Environmental Economics and Manage-
ment, 82, 125–151.
Cameron, A. C., and Trivedi, P. K. (1998). Regression analysis of count data. Cambridge Uni-
versity Press, Cambridge, NY
Coe, D., and Helpman, E. (1995). International R&D spillovers. European Economic Review.
39(5), 859–997.
Dechezleprêtre, A., Glachant, M., and Ménière, Y. (2008). The Clean Development Mechanism
and the international diffusion of technologies: An empirical study. Energy Policy, 36, 1273–
1283.
Dechezleprêtre, A., Glachant, M., and Ménière, Y. (2009). Technology transfer by CDM pro-
jects: A comparison of Brazil, China, India and Mexico. Energy Policy, 37, 703–711.

25
Dechezleprêtre, A., Glachant, M., and Ménière, Y. (2013). What drives the international transfer
of climate change mitigation technologies? Empirical evidence from patent data. Environ-
mental Resource Economics, 54, 161–178.
Eaton, J., and Kortum, S. (1996). Trade in ideas patenting and productivity in the OECD. Jour-
nal of International Economics, 40, 257–278.
Energy Information Administration. (2017). International Energy Outlook: 2017. U.S. Depart-
ment of Energy, Washington, DC.
EPO. (2016). World patent statistical database (PATSTAT). European Patent Office, Munich.
Grunewald, N., and Martinez-Zarzoso, I. (2016). Did the Kyoto Protocol fail? An evaluation of
the effect of the Kyoto Protocol on CO2 emissions. Environment and Development Eco-
nomics, 21(1), 1–22.
Haščič, I., and Johnstone, N. (2011). CDM and international technology transfer: Empirical ev-
idence on wind power. Climate Policy, 11(6), 1303–1314.
Haščič, I., Johnstone, N., Watson, F., and Kaminker, C. (2010). Climate policy and technologi-
cal innovation and transfer: An overview of trends and recent empirical results. OECD En-
vironment Working Papers, No. 30, OECD Publishing.

26
Jaffe, A., Tratjenberg, M., and Henderson, R. (1993). Geographic localization of knowledge
spillovers as evidenced by patent citations. Quarterly Journal of Economics, 108(3), 577–
598.
Johnstone, N., Haščič, I., and Popp, D. (2010). Renewable energy policies and technological
innovation: Evidence based on patent counts. Environmental and Resource Economics, 45,
133–155.
Lanjouw, J. O., and Mody, A. (1996). Innovation and the international diffusion of environ-
mentally responsive technology. Research Policy, 25, 549–571.
Maddala, G. S. (1983). Limited-dependent and qualitative variables in econometrics. Cam-
bridge University Press, Cambridge.
Nagaoka, S., Motohashi, K., and Goto, A. (2010). Patent Statistics as An Innovation Indicator.
Handbook of the Economics of Innovation, 2, 1083–1127.
Peri, G. (2005). Determinants of Knowledge Flows and their effect on Innovation. Review of
Economics and Statistics, 87(2), 308–322.
27
Popp, D. (2006). International innovation and diffusion of air pollution control technologies:
The effects of NOX and SO2 regulation in the US, Japan, and Germany. Journal of Environ-
mental Economics and Management, 51(1), 46–71.
Popp, D., Newell, R. G., and Jaffe, A. B. (2010). Energy, the environment, and technological
change. Handbook of the Economics of Innovation, Volume 2, 873–937.
Potterie, B.V.P. D.L., and Lichtenberg, F. (2001). Does foreign direct investment transfer tech-
nology across borders? Review of Economics and Statistics, 83(3), 490–497.
United Nations. (2016). Paris Agreement. United Nations, Paris.
World Bank. (2017). World Development Indicators. The World Bank, Washington, DC.
< http://databank.worldbank.org/data/home.aspx >

28
Figure 1. International patent applications

29
Figure 2. Annex B and non-Annex B countries: wind energy

30
Figure 3. Annex B and non-Annex B countries: solar energy

31
Figure 4. Strong targets in Annex B and others: wind energy
32
Figure 5. Strong targets in Annex B and others: solar energy
33
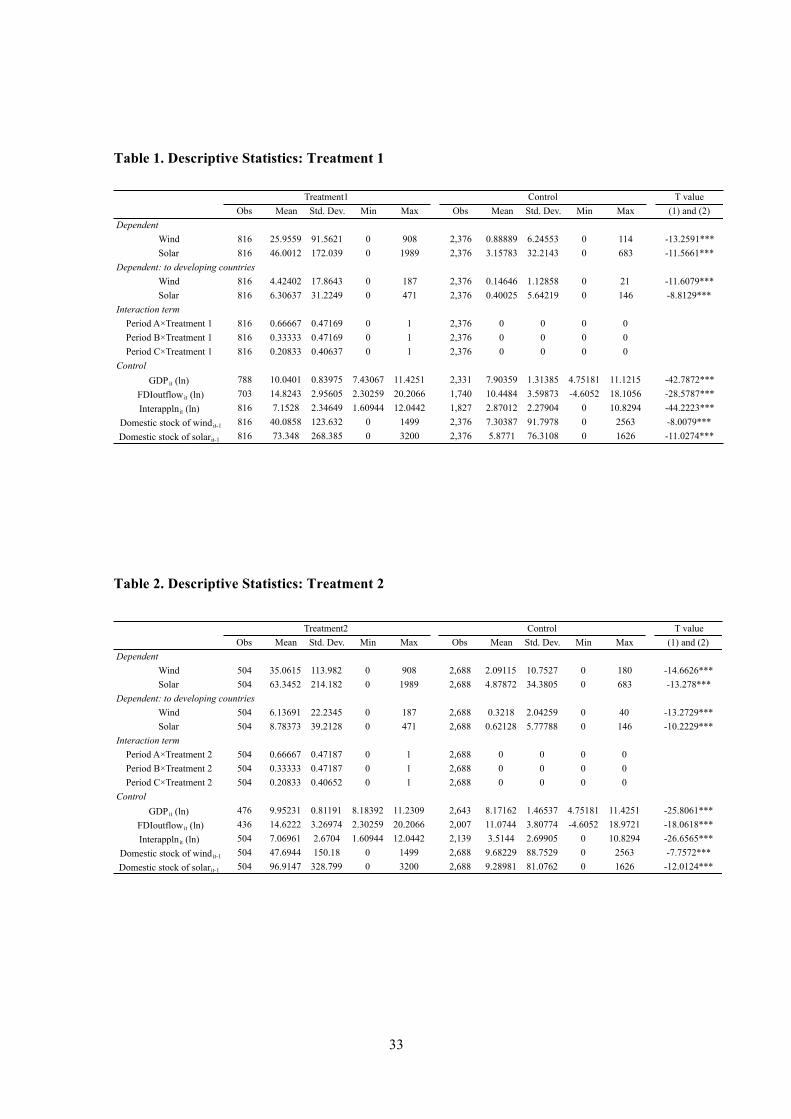
Table 1. Descriptive Statistics: Treatment 1
T valueObs Mean Std. Dev. Min Max Obs Mean Std. Dev. Min Max (1) and (2)
DependentWind 816 25.9559 91.5621 0 908 2,376 0.88889 6.24553 0 114 -13.2591***Solar 816 46.0012 172.039 0 1989 2,376 3.15783 32.2143 0 683 -11.5661***
Dependent: to developing countriesWind 816 4.42402 17.8643 0 187 2,376 0.14646 1.12858 0 21 -11.6079***Solar 816 6.30637 31.2249 0 471 2,376 0.40025 5.64219 0 146 -8.8129***
Interaction termPeriod A×Treatment 1 816 0.66667 0.47169 0 1 2,376 0 0 0 0Period B×Treatment 1 816 0.33333 0.47169 0 1 2,376 0 0 0 0Period C×Treatment 1 816 0.20833 0.40637 0 1 2,376 0 0 0 0
ControlGDPit (ln) 788 10.0401 0.83975 7.43067 11.4251 2,331 7.90359 1.31385 4.75181 11.1215 -42.7872***
FDIoutflowit (ln) 703 14.8243 2.95605 2.30259 20.2066 1,740 10.4484 3.59873 -4.6052 18.1056 -28.5787***Interapplnit (ln) 816 7.1528 2.34649 1.60944 12.0442 1,827 2.87012 2.27904 0 10.8294 -44.2223***
Domestic stock of windit-1 816 40.0858 123.632 0 1499 2,376 7.30387 91.7978 0 2563 -8.0079***Domestic stock of solarit-1 816 73.348 268.385 0 3200 2,376 5.8771 76.3108 0 1626 -11.0274***
Treatment1 Control
Table 2. Descriptive Statistics: Treatment 2
T valueObs Mean Std. Dev. Min Max Obs Mean Std. Dev. Min Max (1) and (2)
DependentWind 504 35.0615 113.982 0 908 2,688 2.09115 10.7527 0 180 -14.6626***Solar 504 63.3452 214.182 0 1989 2,688 4.87872 34.3805 0 683 -13.278***
Dependent: to developing countriesWind 504 6.13691 22.2345 0 187 2,688 0.3218 2.04259 0 40 -13.2729***Solar 504 8.78373 39.2128 0 471 2,688 0.62128 5.77788 0 146 -10.2229***
Interaction termPeriod A×Treatment 2 504 0.66667 0.47187 0 1 2,688 0 0 0 0Period B×Treatment 2 504 0.33333 0.47187 0 1 2,688 0 0 0 0Period C×Treatment 2 504 0.20833 0.40652 0 1 2,688 0 0 0 0
ControlGDPit (ln) 476 9.95231 0.81191 8.18392 11.2309 2,643 8.17162 1.46537 4.75181 11.4251 -25.8061***
FDIoutflowit (ln) 436 14.6222 3.26974 2.30259 20.2066 2,007 11.0744 3.80774 -4.6052 18.9721 -18.0618***Interapplnit (ln) 504 7.06961 2.6704 1.60944 12.0442 2,139 3.5144 2.69905 0 10.8294 -26.6565***
Domestic stock of windit-1 504 47.6944 150.18 0 1499 2,688 9.68229 88.7529 0 2563 -7.7572***Domestic stock of solarit-1 504 96.9147 328.799 0 3200 2,688 9.28981 81.0762 0 1626 -12.0124***
Treatment2 Control
34
Table 3. Descriptive Statistics: Treatment 1 and High-income Countries
T valueObs Mean Std. Dev. Min Max Obs Mean Std. Dev. Min Max (1) and (2)
DependentWind 696 30.0172 98.5511 0 908 408 2.25735 9.12485 0 80 -5.6744***Solar 696 53.523 185.251 0 1989 408 14.375 74.6255 0 683 -4.0784***
Dependent: to developing countriesWind 696 5.1523 19.2485 0 187 408 0.44608 2.11047 0 20 -4.9204***Solar 696 7.37069 33.6984 0 471 408 2.13971 13.4722 0 146 -2.9977**
Interaction termPeriod A×Treatment 1 696 0.66667 0.47174 0 1 408 0 0 0 0Period B×Treatment 1 696 0.33333 0.47174 0 1 408 0 0 0 0Period C×Treatment 1 696 0.20833 0.40641 0 1 408 0 0 0 0
ControlGDPit (ln) 673 10.2769 0.62203 8.54344 11.4251 402 9.7879 0.5558 8.69077 11.1215 -12.9685***
FDIoutflowit (ln) 612 15.2415 2.67292 4.82831 20.2066 333 11.9791 3.96346 -4.6052 17.7685 -15.0303***Interapplnit (ln) 696 7.46129 2.32595 1.60944 12.0442 369 3.86898 2.65498 0 10.8294 -22.8171***
Domestic stock of windit-1 696 40.0474 130.209 0 1499 408 23.0515 191.025 0 2563 -1.7533*Domestic stock of solarit-1 696 81.3879 289.235 0 3200 408 0.70343 2.60462 0 18 -5.6335***
Treatment1 Control
Table 4. Descriptive Statistics: Treatment 2 and High-income Countries
T valueObs Mean Std. Dev. Min Max Obs Mean Std. Dev. Min Max (1) and (2)
DependentWind 432 40.8565 122.174 0 908 672 6.19494 18.6319 0 180 -7.2267***Solar 432 73.7662 229.727 0 1989 672 16.7411 65.8633 0 683 -6.0604***
Dependent: to developing countriesWind 432 7.15509 23.868 0 187 672 1.00744 3.77081 0 40 -6.5525***Solar 432 10.2338 42.1868 0 471 672 2.35417 11.3705 0 146 -4.5905***
Interaction termPeriod A×Treatment 2 432 0.66667 0.47195 0 1 672 0 0 0 0Period B×Treatment 2 432 0.33333 0.47195 0 1 672 0 0 0 0Period C×Treatment 2 432 0.20833 0.40659 0 1 672 0 0 0 0
ControlGDPit (ln) 409 10.1372 0.70208 8.54344 11.2309 666 10.0675 0.60289 8.69077 11.4251 -1.729*
FDIoutflowit (ln) 383 15.1575 2.96497 4.82831 20.2066 562 13.3657 3.72553 -4.6052 18.9721 -7.8661***Interapplnit (ln) 432 7.52213 2.60036 1.60944 12.0442 633 5.32567 2.89937 0 10.8294 -12.6512***
Domestic stock of windit-1 432 53.5857 161.402 0 1499 672 21.0253 150.521 0 2563 -3.4093***Domestic stock of solarit-1 432 110.843 353.241 0 3200 672 13.4658 72.6916 0 1072 -6.9233***
Treatment2 Control
35
Table 5. Results of Treatment 1: Annex B Countries
wind solar wind solar wind solarPeriod A×Treatment 1 0.472* 0.527**
(0.263) (0.207)Period B×Treatment 1 0.318 0.114
(0.197) (0.164)Period C×Treatment 1 0.191 0.134
(0.199) (0.159)GDP(ln) -0.696 0.385 -0.621 0.429 -0.639 0.444
(0.585) (0.374) (0.581) (0.381) (0.587) (0.385)FDIoutflow(ln) -0.100** -0.079* -0.093** -0.074 -0.091** -0.073
(0.045) (0.046) (0.045) (0.048) (0.045) (0.048)Interappln(ln) 0.912*** 1.114*** 0.916*** 1.073*** 0.884*** 1.066***
(0.155) (0.113) (0.157) (0.121) (0.152) (0.117)Domestic stock 0.000 -0.000 0.000 -0.000 0.000 -0.000
(0.000) (0.000) (0.000) (0.000) (0.000) (0.000)_cons 3.331 -8.909*** 2.456 -8.793** 3.041 -8.892**
(4.957) (3.366) (5.018) (3.484) (5.087) (3.552)N 2035 2035 2035 2035 2035 2035
AIC 5410.044 6246.511 5410.896 6250.141 5412.077 6250.084BIC 6275.255 7111.721 6276.107 7115.351 6277.288 7115.295
log_likelihood -2551.022 -2969.255 -2551.448 -2971.070 -2552.038 -2971.042
KyotoA(1997-2012) KyotoB(2005-2012) KyotoC(2008-2012)(1) (2) (3)
Note: Standard errors are between parentheses. *, **, and *** indicate statistical significance at the p < 0.1, p < 0.05,
and p < 0.01 levels, respectively.

36
Table 6. Results of Treatment 2: Annex B Countries with Stronger Targets
wind solar wind solar wind solarPeriod A×Treatment 2 0.653*** 0.345**
(0.230) (0.165)Period B×Treatment 2 0.444*** 0.118
(0.163) (0.128)Period C×Treatment 2 0.484*** 0.308**
(0.170) (0.137)GDP(ln) -0.617 0.444 -0.555 0.436 -0.579 0.461
(0.582) (0.380) (0.586) (0.385) (0.582) (0.385)FDIoutflow(ln) -0.103** -0.078 -0.098** -0.075 -0.093** -0.074
(0.046) (0.047) (0.045) (0.048) (0.045) (0.048)Interappln(ln) 0.901*** 1.074*** 0.900*** 1.064*** 0.889*** 1.071***
(0.153) (0.114) (0.151) (0.117) (0.151) (0.116)Domestic stock 0.000 -0.000 0.000 -0.000 0.000 -0.000
(0.000) (0.000) (0.000) (0.000) (0.000) (0.000)_cons 2.507 -9.048*** 1.962 -8.743** 2.283 -9.108***
(4.973) (3.446) (5.056) (3.511) (4.995) (3.516)N 2035 2035 2035 2035 2035 2035
AIC 5407.335 6248.587 5408.985 6250.108 5409.012 6248.858BIC 6272.546 7113.797 6274.195 7115.318 6274.223 7114.069
log_likelihood -2549.668 -2970.293 -2550.492 -2971.054 -2550.506 -2970.429
KyotoA(1997-2012) KyotoB(2005-2012) KyotoC(2008-2012)(4) (5) (6)
Note: Standard errors are between parentheses. *, **, and *** indicate statistical significance at the p < 0.1, p < 0.05,
and p < 0.01 levels, respectively.
37
Table 7. Robustness Checks: High-income Countries and Treatment 1
wind solar wind solar wind solarPeriod A×Treatmen t1 0.322 0.579**
(0.333) (0.272)Period B×Treatment 1 0.055 -0.239
(0.253) (0.219)Period C×Treatment 1 -0.164 -0.523**
(0.253) (0.224)GDP(ln) 0.803 0.715 0.786 0.557 0.794 0.568
(0.797) (0.505) (0.796) (0.522) (0.805) (0.534)FDIoutflow(ln) -0.207*** -0.129*** -0.200*** -0.109*** -0.201*** -0.114***
(0.061) (0.040) (0.061) (0.040) (0.062) (0.041)Interappln(ln) 0.643*** 1.317*** 0.606*** 1.142*** 0.573*** 1.121***
(0.188) (0.155) (0.193) (0.159) (0.189) (0.151)Domestic stock 0.000 -0.000 0.000 -0.000 0.000 -0.000
(0.000) (0.000) (0.000) (0.000) (0.000) (0.000)_cons -7.603 -13.664*** -7.059 -10.074* -6.690 -9.836*
(7.974) (5.209) (8.028) (5.350) (8.080) (5.413)N 892 892 892 892 892 892
AIC 3965.981 4704.846 3966.458 4706.266 3966.307 4704.915BIC 4311.110 5049.975 4311.588 5051.395 4311.436 5050.045
log_likelihood -1910.990 -2280.423 -1911.229 -2281.133 -1911.153 -2280.458
KyotoA(1997-2012) KyotoB(2005-2012) KyotoC(2008-2012)(7) (8) (9)
Note: Standard errors are between parentheses. *, **, and *** indicate statistical significance at the p < 0.1, p < 0.05,
and p < 0.01 levels, respectively.

38
Table 8. Robustness Checks: High-income Countries and Treatment 2
wind solar wind solar wind solarPeriod A×Treatment 2 0.696*** 0.343**
(0.251) (0.170)Period B×Treatment 2 0.435** -0.032
(0.172) (0.135)Period C×Treatment 2 0.478*** 0.012
(0.182) (0.143)GDP(ln) 1.019 0.746 0.846 0.600 0.762 0.603
(0.798) (0.511) (0.799) (0.519) (0.790) (0.519)FDIoutflow(ln) -0.215*** -0.122*** -0.212*** -0.110*** -0.205*** -0.112***
(0.061) (0.041) (0.061) (0.041) (0.061) (0.041)Interappln(ln) 0.698*** 1.258*** 0.674*** 1.190*** 0.648*** 1.198***
(0.185) (0.145) (0.187) (0.150) (0.186) (0.148)Domestic stock 0.000 -0.000 0.000 -0.000 0.000 -0.000
(0.000) (0.000) (0.000) (0.000) (0.000) (0.000)_cons -10.632 -13.424** -8.393 -11.098** -7.283 -11.213**
(8.055) (5.273) (8.090) (5.298) (7.936) (5.289)N 892 892 892 892 892 892
AIC 3962.037 4705.431 3964.001 4706.651 3964.047 4706.664BIC 4307.166 5050.561 4309.131 5051.781 4309.176 5051.793
log_likelihood -1909.018 -2280.716 -1910.001 -2281.326 -1910.023 -2281.332
KyotoA(1997-2012) KyotoB(2005-2012) KyotoC(2008-2012)(10) (11) (12)
Note: Standard errors are between parentheses. *, **, and *** indicate statistical significance at the p < 0.1, p < 0.05,
and p < 0.01 levels, respectively.

39
Table 9. International Applications in Developing Countries: Treatment 1
wind solar wind solar wind solarPeriod A×Treatment 1 0.771** 0.845**
(0.351) (0.357)Period B×Treatment 1 0.428 0.433
(0.306) (0.293)Period C×Treatment 1 0.169 0.391
(0.316) (0.266)GDP(ln) -2.050 -0.017 -1.902 0.439 -1.954 0.600
(1.626) (0.941) (1.647) (0.880) (1.765) (0.881)FDIoutflow(ln) 0.070 -0.111* 0.089 -0.109* 0.091 -0.103*
(0.107) (0.063) (0.107) (0.061) (0.107) (0.062)Interappln(ln) 1.008*** 0.920*** 1.054*** 0.850*** 1.009*** 0.796***
(0.369) (0.280) (0.358) (0.272) (0.372) (0.266)Domestic stock 0.000 0.000 0.000 0.000 0.000 0.000
(0.000) (0.000) (0.000) (0.000) (0.000) (0.000)_cons 12.096 -3.533 9.764 -7.493 10.901 -8.637
(12.849) (7.940) (13.543) (7.631) (14.665) (7.790)N 2035 2035 2035 2035 2035 2035
AIC 2476.794 2795.828 2478.091 2798.090 2479.269 2798.374BIC 3342.005 3661.038 3343.302 3663.301 3344.479 3663.584
log_likelihood -1084.397 -1243.914 -1085.046 -1245.045 -1085.634 -1245.187
KyotoA(1997-2012) KyotoB(2005-2012) KyotoC(2008-2012)(13) (14) (15)
Note: Standard errors are between parentheses. *, **, and *** indicate statistical significance at the p < 0.1, p < 0.05,
and p < 0.01 levels, respectively.

40
Table 10. International Applications in Developing Countries: Treatment 2
wind solar wind solar wind solarPeriod A×Treatmen t2 0.653** 0.277
(0.330) (0.266)Period B×Treatment 2 0.352 0.271
(0.249) (0.200)Period C×Treatment 2 0.430* 0.479**
(0.228) (0.193)GDP(ln) -2.005 0.398 -1.846 0.482 -1.804 0.570
(1.646) (0.888) (1.692) (0.882) (1.687) (0.883)FDIoutflow(ln) 0.087 -0.111* 0.084 -0.115* 0.091 -0.112*
(0.109) (0.062) (0.108) (0.061) (0.107) (0.062)Interappln(ln) 0.992*** 0.753*** 1.015*** 0.776*** 1.008*** 0.793***
(0.374) (0.259) (0.368) (0.258) (0.370) (0.260)Domestic stock 0.000 0.000 0.000 0.000 0.000 0.000
(0.000) (0.000) (0.000) (0.000) (0.000) (0.000)_cons 11.396 -5.923 9.704 -6.915 9.213 -8.117
(13.036) (7.696) (13.798) (7.739) (13.810) (7.770)N 2035 2035 2035 2035 2035 2035
AIC 2477.214 2798.905 2478.299 2798.713 2477.873 2797.365BIC 3342.425 3664.116 3343.509 3663.924 3343.083 3662.576
log_likelihood -1084.607 -1245.452 -1085.149 -1245.357 -1084.936 -1244.683
KyotoA(1997-2012) KyotoB(2005-2012) KyotoC(2008-2012)(16) (17) (18)
Note: Standard errors are between parentheses. *, **, and *** indicate statistical significance at the p < 0.1, p < 0.05,
and p < 0.01 levels, respectively.
41
Appendix
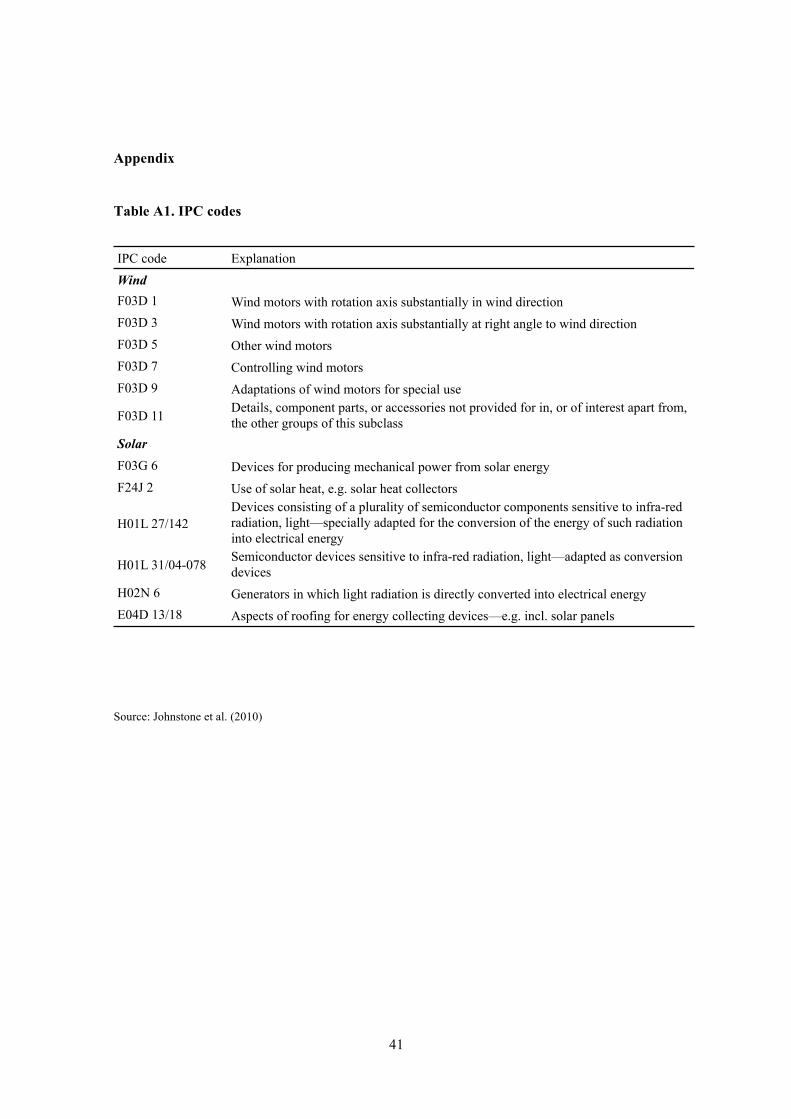
Table A1. IPC codes
IPC code ExplanationWindF03D 1 Wind motors with rotation axis substantially in wind directionF03D 3 Wind motors with rotation axis substantially at right angle to wind directionF03D 5 Other wind motorsF03D 7 Controlling wind motorsF03D 9 Adaptations of wind motors for special use
F03D 11 Details, component parts, or accessories not provided for in, or of interest apart from,the other groups of this subclass
Solar
F03G 6 Devices for producing mechanical power from solar energyF24J 2 Use of solar heat, e.g. solar heat collectors
H01L 27/142Devices consisting of a plurality of semiconductor components sensitive to infra-redradiation, light—specially adapted for the conversion of the energy of such radiationinto electrical energy
H01L 31/04-078 Semiconductor devices sensitive to infra-red radiation, light—adapted as conversiondevices
H02N 6 Generators in which light radiation is directly converted into electrical energyE04D 13/18 Aspects of roofing for energy collecting devices—e.g. incl. solar panels
Source: Johnstone et al. (2010)


![TAMANA / YAMAGA / KIKUCHI - Japan ] · Miyamoto Musashi and other art work. Miyamoto Musashi and Reigando Cave (B-1) Miyamoto Musashi, a great swordsman, is famous for his duel on](https://static.fdocuments.in/doc/165x107/5e43032f18a08e3e0b360185/tamana-yamaga-kikuchi-japan-miyamoto-musashi-and-other-art-work-miyamoto.jpg)
![Musashi Miyamoto - The Book of Five Rings[1]](https://static.fdocuments.in/doc/165x107/577d27011a28ab4e1ea2cabe/musashi-miyamoto-the-book-of-five-rings1.jpg)


