Climate Adaptation Planning Survey Report Adaptation Planning Survey . August 2016 . Minnesota...
67
Minnesota Pollution Control Agency for the Interagency Climate Adaptation Team Climate Adaptation Planning Survey August 2016 Minnesota Management & Budget, 203 Administration Building, 50 Sherburne Avenue, St. Paul, MN 55155 Telephone: 651-259-3800 Fax: 651-797-1311 Website: mn.gov/mmb/mad p-gen4-12
Transcript of Climate Adaptation Planning Survey Report Adaptation Planning Survey . August 2016 . Minnesota...
Minnesota Pollution Control Agency for the Interagency Climate Adaptation Team
Climate Adaptation Planning Survey August 2016
Minnesota Management & Budget, 203 Administration Building, 50 Sherburne Avenue, St. Paul, MN 55155 Telephone: 651-259-3800 Fax: 651-797-1311 Website: mn.gov/mmb/mad
p-gen4-12
Division director Kristin Batson
Assistant division director Beth Bibus
MAD project lead Beth Bibus
MPCA project team Paul Moss Laura Milberg Kevin McDonald
Contact information Telephone: 651-259-3800 Email: [email protected] Fax: 651-797-1311 Website: mn.gov/mmb/mad Address: 203 Administration Building 50 Sherburne Avenue St. Paul, Minnesota 55155
Copies of this report For more information or copies of this report, contact Paul Moss, Minnesota Pollution Control Agency, 651-296-6300 or 800-657-3864, or [email protected].
Management Analysis & Development Management Analysis & Development is Minnesota government’s in-house fee-for-service management consulting group. We have over 30 years of experience helping public managers increase their organizations’ effectiveness and efficiency. We provide quality management consultation services to local, regional, state and federal government agencies and public institutions.
Alternative Formats Upon request, this document can be made available in alternative formats by calling 651-259-3800.
3
Table of Contents Executive Summary ................................................................................................................................................5
Background ..........................................................................................................................................................5 Key survey findings ............................................................................................................................................5
Statewide indicator ..........................................................................................................................................5 Respondents’ planning efforts .......................................................................................................................6 Resources and assistance needed ..................................................................................................................7 Experience with events or trends associated with the changing climate ................................................7
Recommendations for future surveys ..............................................................................................................8
Background and Methods .....................................................................................................................................9
Respondents ............................................................................................................................................................9
Statewide Indicator of Climate Adaptation and Resilience Planning .......................................................12
Survey Respondents’ Planning Efforts ............................................................................................................13
Standalone planning .........................................................................................................................................14 Comprehensive planning .................................................................................................................................14 Health and safety planning ..............................................................................................................................15 Water planning ..................................................................................................................................................15 Natural resources planning ..............................................................................................................................16 Additional planning efforts..............................................................................................................................16 Other types of planning ....................................................................................................................................17 A broader view of planning efforts among survey respondents ................................................................18
Planning efforts by type of plan ..................................................................................................................18 Extent of planning efforts .............................................................................................................................19
Other Survey Results ...........................................................................................................................................19
Identified resources or assistance ....................................................................................................................19 Openness to assistance ..................................................................................................................................20
Experience with events or trends associated with the changing climate ..................................................21 Other comments from survey respondents ...................................................................................................22
Key Survey Findings and Recommendations for Future Surveys ..............................................................23
Key survey findings ..........................................................................................................................................23 Statewide indicator ........................................................................................................................................23 Respondents’ planning efforts .....................................................................................................................23 Resources and assistance needed ................................................................................................................24 Experience with events or trends associated with the changing climate ..............................................24
Recommendations for future surveys ............................................................................................................24
Appendix A. Development of ICAT Indicators ..............................................................................................26
4
Appendix B. Methods Detail ..............................................................................................................................28
Overview ............................................................................................................................................................28 Survey recipients ...............................................................................................................................................28 Survey development .........................................................................................................................................28 Survey administration and analysis ...............................................................................................................29
Appendix C. Survey .............................................................................................................................................30
Appendix D. Survey Respondents by Region and Organization Type .....................................................34
Appendix E. Survey Results by Categories .....................................................................................................35
Appendix F. Survey Results: Cities by Size and Region ..............................................................................51
Appendix G. Small Cities in Greater Minnesota ...........................................................................................59
Appendix H. Survey Results by Experience with Climate-Related Event or Trend ...............................66

5
Executive Summary Background The Minnesota Pollution Control Agency (MPCA) has the lead role in data collection for the Interagency Climate Adaptation Team’s (ICAT’s) statewide indicator to measure progress on climate adaptation and resilience planning in governmental organizations. To develop this indicator, MPCA asked Management Analysis & Development (MAD) to develop, administer, and analyze an online survey of Minnesota cities, counties, watershed districts, soil and water conservation districts, tribal governments, and relevant state agencies.
MAD worked with a team of experts from MPCA to design the survey and conduct analyses that would be useful to ICAT.
The primary purposes of the survey were:
• Develop an estimate of the extent of government agencies’ planning efforts that could serve as ICAT’s indicator
• Learn more about the types of climate adaptation and resilience planning efforts by governmental organizations
• Gain information about what types of resources might be useful to governmental organizations engaged in climate adaptation and resilience planning
Additionally, MPCA hoped that the survey introduction email and the survey itself would increase general awareness of climate adaptation and resilience issues among survey recipients.
Key survey findings This is the first Minnesota statewide survey of climate adaptation and resilience planning. Over 1,000 Minnesota cities, counties, tribal governments, watershed districts, soil and water conservation districts, and key state agencies received the survey, with about 30% responding. Though the responding organizations may not be completely reflective of the state as a whole, the data from the survey can provide useful information to ICAT.
Statewide indicator A realistic indicator of statewide planning efforts can be calculated using survey data: 17.5% of surveyed organizations (a better indicator than responding organizations) report that they have at least one type of plan or planning effort with content that specifically addresses climate adaptation and resilience.

6
Figure 1. Statewide indicator
Respondents’ planning efforts Responding governmental organizations are engaged in a wide range of planning efforts. The majority of responding organizations have plans or are engaged in planning efforts that specifically address climate adaptation and resilience in some way. Most are taking a limited approach, however, with relatively few engaged in many different types of plans or planning efforts related to climate adaptation and resilience.
As shown in Figure 2, specific survey results regarding planning include:
• About 40% of responding organizations are engaged in water plans or planning efforts with climate adaptation and resilience content.
• Over one-third of responding organizations indicated that they are engaged in health and safety planning efforts that include content on climate adaptation and resilience.
• Almost one-fourth of responding organizations indicated that they have natural resources plans or planning efforts with climate adaptation and resilience content.
• Less than one-fourth of responding organizations indicated that they are engaged in some other type of planning effort that includes climate adaptation and resilience.
• Relatively few responding organizations are engaged in standalone climate adaptation planning efforts or in comprehensive planning efforts that include climate adaptation or resilience content.

7
Figure 2. Climate adaptation or resilience content in planning efforts by type of plan1
Response (number of response s) % Engaged in any standalone planni ng activity with relevant content (35 ) 11% Did not engage in a ny standalone pla nning a ctivity with relevant content (29 4) 89% Has a compre hensive pla n with relevant content in pla ce or in proce ss (47) 14% Does not have a compre hensive plan with relevant content in pla ce or in process (282 ) 86% Has relevant health and safety plans or planning e fforts (11 8) 36% Does not have relevant health and safety pla ns or pla nning e fforts (21 1) 64% Has relevant water plans or pla nning e fforts (13 3) 40% Does not have relevant water plans or pla nning e fforts (1 96) 60% Has relevant natural resources plans or planni ng efforts (79) 24% Does not have relevant natural resource s plans or planni ng efforts (250 ) 76% Does not have relevant additional plans or planni ng efforts (259 ) 79%
Resources and assistance needed Responding organizations provided input about the types of resources or assistance that would be helpful to their organization for climate adaptation and resilience planning. Close to two-thirds of respondents identified best practices for climate adaptation and resilience as a helpful resource. Over half of respondents selected planning toolkit and guides, financial assistance, model climate adaptation and resilience plans, and model policies or ordinances as resources that would help their organizations.
Over 40% of respondents provided their contact information in response to a question regarding whether they are interested in receiving assistance on climate adaptation or resilience. This suggests that the organizations responding to this survey are generally interested in learning more (and potentially doing more) about climate adaptation and resilience planning.
Experience with events or trends associated with the changing climate Almost three-fourths of responding organizations indicated that their organization or community experienced extreme rainfall events in the past decade. Milder winters (51%) and increased problems with invasive species (40%) were the next most frequently identified trends or events. Organizations
1 These percentages are based on survey responses. See page 18 for additional information.
8
that experienced one or more climate-related events or trends far more frequently identified plans or planning activities than those organizations that did not.
Recommendations for future surveys MAD’s role in this project was survey development, administration, and analysis, with the expectation that ICAT would identify implications from the survey data and develop next steps. Advice on survey issues may be useful, however, so MAD offers the following recommendations for future surveys.
Survey timing: MAD recommends that ICAT conduct the survey on a roughly 2-3 year cycle. This will provide relatively up-to-date information for measuring progress while simultaneously avoiding survey fatigue and allowing time for changes to take place.
Potential additional or expanded questions: MAD recommends that the group consider adding or refining questions or topics to address certain issues (such as expansion of planning efforts or additional resource needs). Detailed recommendations are on page 24.
Restraint on survey expansion: Although there are benefits to adding questions and collecting additional information, MAD suggests that ICAT be cautious. Maintaining a brief survey with narrow scope will minimize the burden on respondents, and maintaining the survey’s focus on climate adaptation and resilience planning will make it easier to repeat the survey and have consistent data over time.

9
Background and Methods The Minnesota Pollution Control Agency (MPCA) is a member of the Minnesota Interagency Climate Adaptation Team (ICAT). In 2015, ICAT developed a set of five statewide indicators to help track progress towards achieving “a resilient, economically thriving, and healthy Minnesota that is prepared for both short- and long-term climate changes and weather extremes.”2
One of these five indicators focuses on climate adaptation planning by state agencies, local governments, and tribal governments. MPCA has the lead role in data collection for this indicator, and staff asked Management Analysis & Development (MAD) to develop, administer, and analyze an online survey of Minnesota cities, counties, watershed districts, soil and water conservation districts, tribal governments, and relevant state agencies.
MAD worked with a team of experts from MPCA (see team list on inside cover) to design the survey and conduct analyses that would be useful to ICAT. A detailed description of survey methods is in Appendix B, and the full survey is in Appendix C.
The primary purposes of the survey were:
• Develop an estimate of the extent of government agencies’ planning efforts that could serve as ICAT’s indicator
• Learn more about the types of climate adaptation and resilience planning efforts by governmental organizations
• Gain information about what types of resources might be useful to governmental organizations engaged in climate adaptation and resilience planning
Additionally, MPCA hoped that the survey introduction email and the survey itself would increase general awareness of climate adaptation and resilience issues among survey recipients.
The survey was not intended to identify implementation challenges, provide information on content of plans within individual organizations, or solicit opinions about climate change in general.
This report is organized so that the body of the report provides information relevant to the primary purposes of the survey. Appendices D-H provide more detailed survey results for categories of respondents.
Respondents Overall, 329 organizations responded to the survey, representing 30% of all survey recipients. Table 1 below shows the response rates by type of organization and the proportion of all survey responses represented by each group. Cities, the largest group of survey recipients, had a 25% response rate.
2 ICAT, “Using Results-Based Accountability (RBA) to develop statewide indicators,” Appendix A.
10
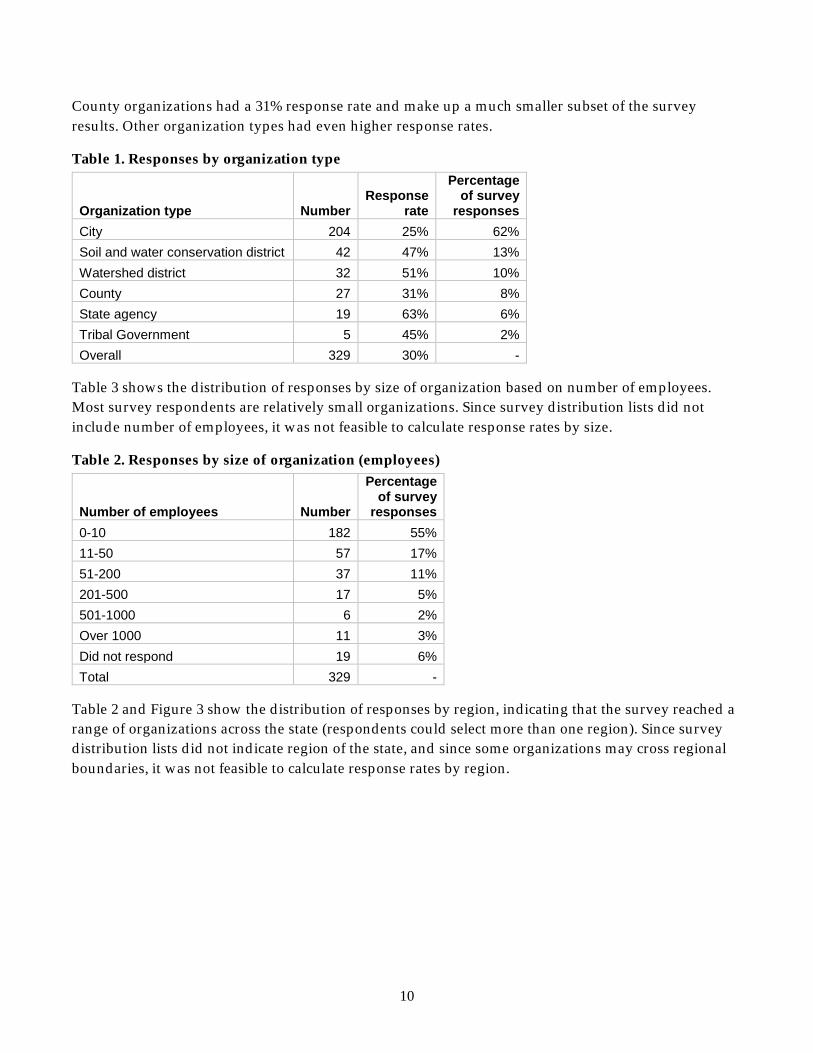
County organizations had a 31% response rate and make up a much smaller subset of the survey results. Other organization types had even higher response rates.
Table 1. Responses by organization type
Organization type Number Response
rate
Percentage of survey
responses City 204 25% 62% Soil and water conservation district 42 47% 13% Watershed district 32 51% 10% County 27 31% 8% State agency 19 63% 6% Tribal Government 5 45% 2% Overall 329 30% -
Table 3 shows the distribution of responses by size of organization based on number of employees. Most survey respondents are relatively small organizations. Since survey distribution lists did not include number of employees, it was not feasible to calculate response rates by size.
Table 2. Responses by size of organization (employees)
Number of employees Number
Percentage of survey
responses 0-10 182 55% 11-50 57 17% 51-200 37 11% 201-500 17 5% 501-1000 6 2% Over 1000 11 3% Did not respond 19 6% Total 329 -
Table 2 and Figure 3 show the distribution of responses by region, indicating that the survey reached a range of organizations across the state (respondents could select more than one region). Since survey distribution lists did not indicate region of the state, and since some organizations may cross regional boundaries, it was not feasible to calculate response rates by region.

11
Table 3. Responses by region
Region Number
Percentage of Survey
Responses Northwest 56 18% Northeast 21 7% Central 70 22% Twin Cities Metropolitan Area 66 21% Southwest 63 20% Southeast 43 14% Organizations with statewide coverage 16 16% Did not respond to this question 13 4% Total 329 --
Figure 3. Responses by region3,4
3 Appendix D contains a chart showing the types of organizations represented in the survey data by region. 4 Respondents were not required to answer questions about region or type of organization, so the data here is not reflective of the entire survey dataset. Results are not shown for organizations that selected “Minnesota statewide” unless they also selected a region.
12
Statewide Indicator of Climate Adaptation and Resilience Planning A primary purpose of this survey was to develop a statewide indicator of government planning efforts related to climate adaptation and resilience. One option for developing this indicator would be to look solely at survey responses—the proportion of respondents that selected planning options, for example. The survey results should be put in context, however: the 30% response rate was good for a survey of this kind, but the organizations responding to the survey may not be reflective of all governmental organizations in Minnesota, so survey results alone would not be a realistic indicator of statewide planning efforts.5
A reasonable (and likely conservative) estimate of statewide planning efforts can be calculated by examining survey data in the context of all surveyed organizations: MAD took the total number of responding organizations that indicated they are engaged in any type of planning efforts with content specifically related to climate adaptation or resilience (189) and divided that by the total number of survey recipients (1079).6 Using this calculation, 17.5% of surveyed organizations report that they have at least one plan or planning effort with content that specifically addresses climate adaptation and resilience.
The data described above can serve as an indicator for evaluating progress in ICAT’s ongoing work to advance climate adaptation in Minnesota. Since specifically increasing standalone planning efforts is not among the overall objectives of ICAT’s work, attention to a separate indicator on standalone planning would not be useful at this time, though a similar methodology could be used (dividing the total number of survey respondents that engage in standalone planning by the total number of survey recipients).
5 Organizations that chose to complete the survey may be more interested or engaged in climate adaptation and resilience planning than organizations in general, which could drive up the number of affirmative responses to survey questions. Conversely, since the survey was typically sent to a generic contact in city or county government, it is possible that the recipient was unfamiliar with existing planning efforts (perhaps not replying at all or not replying fully), which could mean the number of affirmative responses in the survey is not reflective of actual planning efforts. The relatively large proportion of respondents from soil and water conservation districts and watershed districts compared to respondents from city governments also suggests a need for caution in generalizing survey results. 6 A respondent was designated as being engaged in climate adaptation or resilience planning if they selected any response to questions in the survey about climate adaptation or resilience planning efforts. In a few cases, respondents were designated as being engaged in planning if they did not select a planning option from the listed options but described a specific relevant plan or planning effort in their responses to the survey’s open-ended question about other types of planning efforts. MAD relied on MPCA staff for guidance in those instances.
13
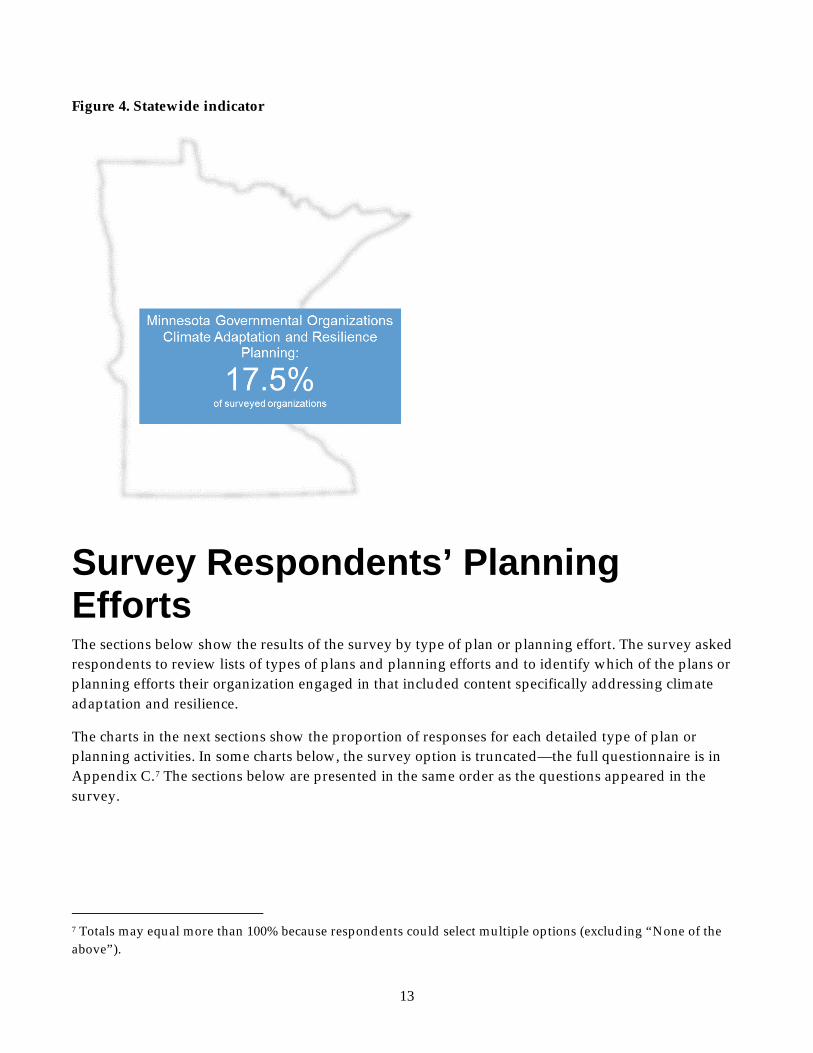
Figure 4. Statewide indicator
Survey Respondents’ Planning Efforts The sections below show the results of the survey by type of plan or planning effort. The survey asked respondents to review lists of types of plans and planning efforts and to identify which of the plans or planning efforts their organization engaged in that included content specifically addressing climate adaptation and resilience.
The charts in the next sections show the proportion of responses for each detailed type of plan or planning activities. In some charts below, the survey option is truncated—the full questionnaire is in Appendix C.7 The sections below are presented in the same order as the questions appeared in the survey.
7 Totals may equal more than 100% because respondents could select multiple options (excluding “None of the above”).

14
Standalone planning Survey question: Has your organization engaged in any of the following standalone planning efforts specifically to address climate adaptation and resilience?
Relatively few responding organizations are engaged in standalone planning efforts. Slightly more respondents indicated that they are engaged in climate vulnerability assessment than strategic framework or climate adaptation planning efforts. More of these efforts are in process than are completed.
Figure 5. Standalone planning
Response (number of response s) % Climate adaptation plan complete d (5 ) 2% Climate adaptation plan in process (7) 2% Strategic framework … compl eted (6 ) 2% Strategic framework ... in process (14 ) 4% Climate vulnera bility assessment completed (7) 2% Climate vulnera bility assessment in pr oce ss (1 6) 5% None of the a bove (291) 89%
Comprehensive planning Survey question: Does your organization have a comprehensive plan with content that specifically addresses climate adaptation and resilience?
Relatively few responding organizations have a comprehensive plan in place or in process that includes climate adaptation or resilience content.
Figure 6. Comprehensive plan
Response (number of response s) % Comprehe nsive Plan with thi s content adopted (11) 3% Comprehe nsive Plan with thi s content in pr ocess (3 6) 11% None of the a bove (279) 86%

15
Health and safety planning Survey question: Does your organization have any health and safety plans or planning efforts with content that specifically addresses climate adaptation and resilience?
Over one-third of responding organizations8 indicated that they are engaged in health and safety planning efforts that include content on climate adaptation and resilience: emergency response (25%), emergency operations (20%), and hazard mitigation (19%) were the most frequently cited types of planning.
Figure 7. Health and safety planning
Response (number of response s) % Hazard mitigation (62 ) 19% Emergency response (79 ) 25% Continuity of operations (33 ) 10% Emergency operations (6 3) 20% Worker safety and work environment (43 ) 13% Public health (ve ctor-borne diseases, e xtreme heat, asthma /air quality...) (28 ) 9% Building codes inspecti on and enforce me nt (34 ) 11% None of the a bove (203) 63%
Water planning Survey question: Does your organization have any water plans or planning efforts with content that specifically addresses climate adaptation and resilience?
About 40% of responding organizations are engaged in water plans or planning efforts with climate adaptation and resilience content: stormwater (22%), watershed (21%), and wellhead protection (21%) were the most commonly reported efforts.
8 For specific calculations on overall responses in each type of planning effort, go to the next section of this report, A broader view of planning efforts among survey respondents, beginning on page 18.

16
Figure 8. Water planning
Response (number of response s) % Sewer system (4 0) 13% Stormwater (69 ) 22% Wastewater treatment fa cilities (2 3) 7% Water quantity (includi ng groundwater) (48 ) 15% Water supply infrastructure (44) 14% Watershed (67 ) 21% Wellhead protection (6 7) 21% None of the a bove (188) 59%
Natural resources planning Survey question: Does your organization have any natural resources plans or planning efforts with content that specifically addresses climate adaptation and resilience?
Almost one-fourth of responding organizations indicated that they have natural resources plans or planning efforts, with invasive species planning (14%) and parks and facilities planning (12%) most often cited.
Figure 9. Natural resources planning
Response (number of response s) % Parks and park fa cilities (38 ) 12% Open/green space (excluding parks ) (18 ) 6% Forest manage ment (17 ) 5% Invasive spe cies (4 4) 14% Urban and community forestry (16 ) 5% None of the a bove (244) 76%
Additional planning efforts Survey question: Has your organization engaged in any additional planning efforts with content that specifically addresses climate adaptation and resilience?
Less than one-fourth of responding organizations indicated that they are engaged in some other type of planning effort that includes climate adaptation and resilience. Strategic planning and land use planning (both 11% of responding organizations) were the most often selected.

17
Figure 10. Additional planning
Response (number of response s) % Capital budg et (9) 3% Economi c development (1 0) 3% Facilities and grounds (excluding parks... ) (7 ) 2% Land use (3 6) 11% Solid waste (8 ) 3% Hazardous waste (9 ) 3% Constr uction & demolition waste (7) 2% Transportation/roads (1 4) 4%
Other types of planning Survey question: Has your organization engaged in any other planning with content specifically related to climate adaptation and resilience?
About 15% of survey respondents offered some comments (excluding responses like “none” or “not applicable”).9 Over half of the commenters appeared to be explaining why the organization had not taken additional action, or to be offering additional detail about their planning efforts. Others (about one-third of those who wrote comments) wrote about efforts that may suggest the need for additional options or clarification in future surveys. These included10:
· One Watershed, One Plan · Cover crop or perennial promotion · Drainage management activities and plans · Erosion control or landscape plans · Modeling for infrastructure planning · Public engagement or organization collaboration activities · Sustainability management plans · Energy or renewable energy plans and promotion
9 A few respondents used the open comment box to include comments disagreeing with the notion of climate change or with the premises of the survey. 10 With the exception of One Watershed, One Plan and cover crop or perennial promotion, which were mentioned by a few respondents each, the efforts listed here were mentioned by only one or two respondents.
18
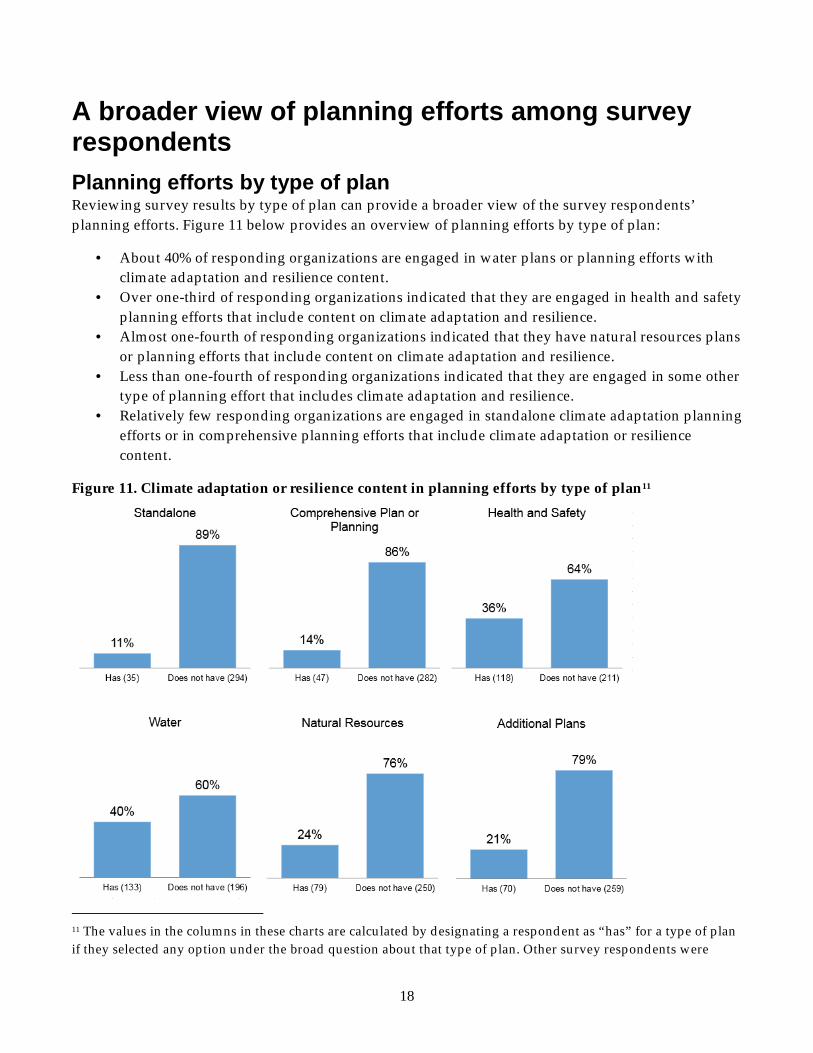
A broader view of planning efforts among survey respondents Planning efforts by type of plan Reviewing survey results by type of plan can provide a broader view of the survey respondents’ planning efforts. Figure 11 below provides an overview of planning efforts by type of plan:
· About 40% of responding organizations are engaged in water plans or planning efforts with climate adaptation and resilience content.
· Over one-third of responding organizations indicated that they are engaged in health and safety planning efforts that include content on climate adaptation and resilience.
· Almost one-fourth of responding organizations indicated that they have natural resources plans or planning efforts that include content on climate adaptation and resilience.
· Less than one-fourth of responding organizations indicated that they are engaged in some other type of planning effort that includes climate adaptation and resilience.
· Relatively few responding organizations are engaged in standalone climate adaptation planning efforts or in comprehensive planning efforts that include climate adaptation or resilience content.
Figure 11. Climate adaptation or resilience content in planning efforts by type of plan11
11 The values in the columns in these charts are calculated by designating a respondent as “has” for a type of plan if they selected any option under the broad question about that type of plan. Other survey respondents were
19
Response (number of response s) % Engaged in any standalone planni ng activity with relevant content (35 ) 11% Did not engage in a ny standalone pla nning a ctivity with relevant content (29 4) 89% Has a compre hensive pla n with relevant content in pla ce or in proce ss (47) 14% Does not have a compre hensive plan with relevant content in pla ce or in process (282 ) 86% Has relevant health and safety plans or planning e fforts (11 8) 36% Does not have relevant health and safety pla ns or pla nning e fforts (21 1) 64% Has relevant water plans or pla nning e fforts (13 3) 40% Does not have relevant water plans or pla nning e fforts (1 96) 60% Has relevant natural resources plans or planni ng efforts (79) 24% Does not have relevant natural resource s plans or planni ng efforts (250 ) 76% Does not have relevant additional plans or planni ng efforts (259 ) 79%
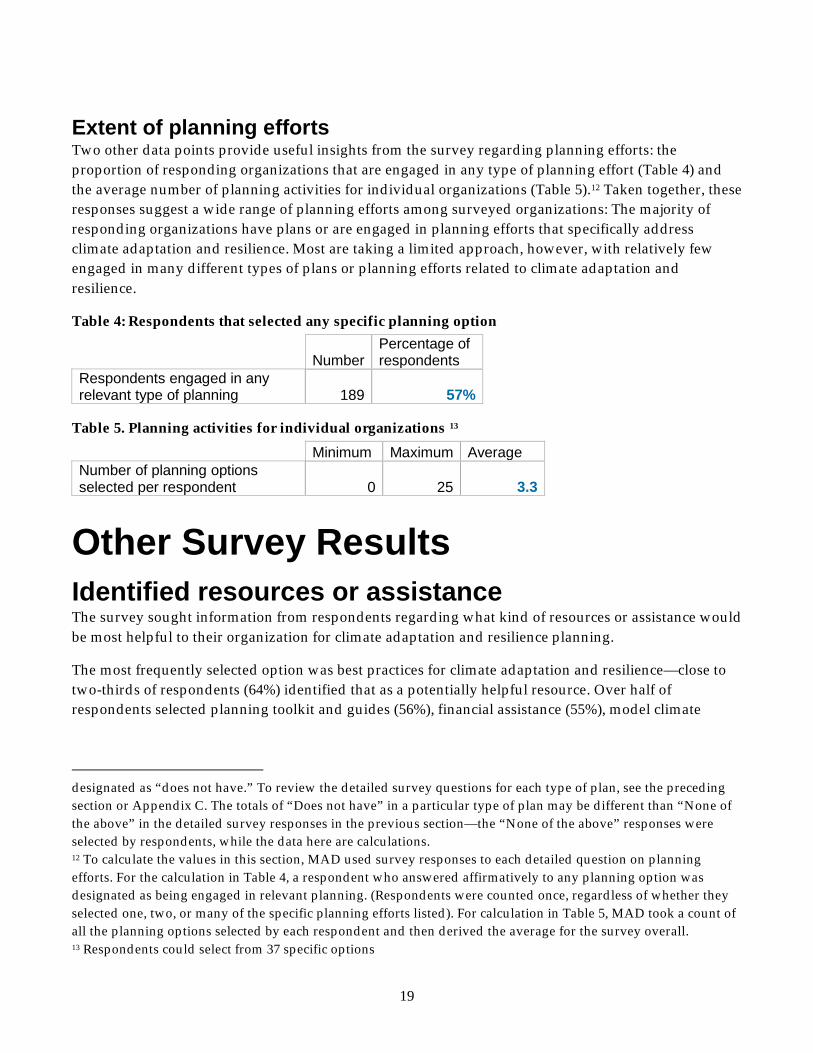
Extent of planning efforts Two other data points provide useful insights from the survey regarding planning efforts: the proportion of responding organizations that are engaged in any type of planning effort (Table 4) and the average number of planning activities for individual organizations (Table 5).12 Taken together, these responses suggest a wide range of planning efforts among surveyed organizations: The majority of responding organizations have plans or are engaged in planning efforts that specifically address climate adaptation and resilience. Most are taking a limited approach, however, with relatively few engaged in many different types of plans or planning efforts related to climate adaptation and resilience.
Table 4: Respondents that selected any specific planning option
nd Number Percentage of respondents
Respondents engaged in any relevant type of planning 189 57%
Table 5. Planning activities for individual organizations 13 nd Minimum Maximum Average Number of planning options selected per respondent 0 25 3.3
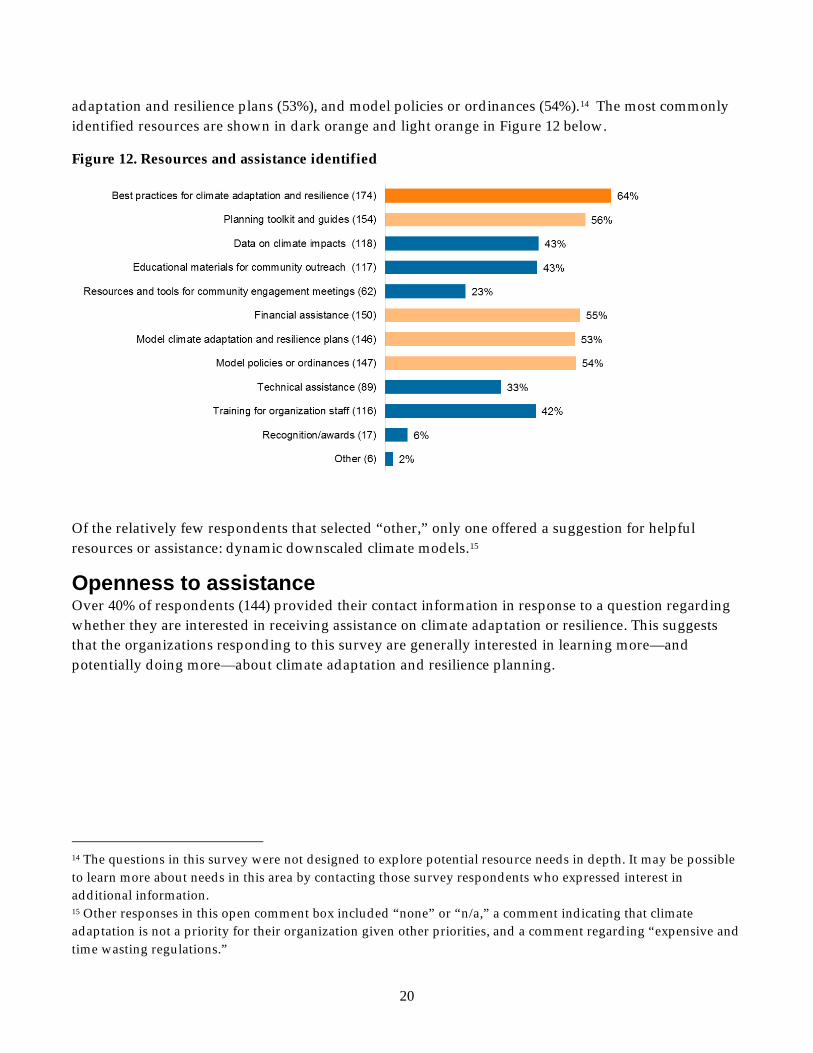
Other Survey Results Identified resources or assistance The survey sought information from respondents regarding what kind of resources or assistance would be most helpful to their organization for climate adaptation and resilience planning.
The most frequently selected option was best practices for climate adaptation and resilience—close to two-thirds of respondents (64%) identified that as a potentially helpful resource. Over half of respondents selected planning toolkit and guides (56%), financial assistance (55%), model climate
designated as “does not have.” To review the detailed survey questions for each type of plan, see the preceding section or Appendix C. The totals of “Does not have” in a particular type of plan may be different than “None of the above” in the detailed survey responses in the previous section—the “None of the above” responses were selected by respondents, while the data here are calculations. 12 To calculate the values in this section, MAD used survey responses to each detailed question on planning efforts. For the calculation in Table 4, a respondent who answered affirmatively to any planning option was designated as being engaged in relevant planning. (Respondents were counted once, regardless of whether they selected one, two, or many of the specific planning efforts listed). For calculation in Table 5, MAD took a count of all the planning options selected by each respondent and then derived the average for the survey overall. 13 Respondents could select from 37 specific options
20
adaptation and resilience plans (53%), and model policies or ordinances (54%).14 The most commonly identified resources are shown in dark orange and light orange in Figure 12 below.
Figure 12. Resources and assistance identified
Response (number of response s) % Best practi ces for cli mate adaptation a nd resilie nce (174 ) 64% Planning toolkit and guide s (15 4) 56% Data on climate i mpa cts (1 18) 43% Educational materials for community outreach (11 7) 43% Resource s and tools for community engage ment meetings (62 ) 23% Financial assista nce (150 ) 55% Model cli mate adaptation and resilie nce plans (146 ) 53% Model policies or ordina nce s (14 7) 54% Techni cal assista nce (89 ) 33% Training for orga nization sta ff (116 ) 42% Recognition/awards (17) 6% Other (6 ) 2%
Of the relatively few respondents that selected “other,” only one offered a suggestion for helpful resources or assistance: dynamic downscaled climate models.15
Openness to assistance Over 40% of respondents (144) provided their contact information in response to a question regarding whether they are interested in receiving assistance on climate adaptation or resilience. This suggests that the organizations responding to this survey are generally interested in learning more—and potentially doing more—about climate adaptation and resilience planning.
14 The questions in this survey were not designed to explore potential resource needs in depth. It may be possible to learn more about needs in this area by contacting those survey respondents who expressed interest in additional information. 15 Other responses in this open comment box included “none” or “n/a,” a comment indicating that climate adaptation is not a priority for their organization given other priorities, and a comment regarding “expensive and time wasting regulations.”
21
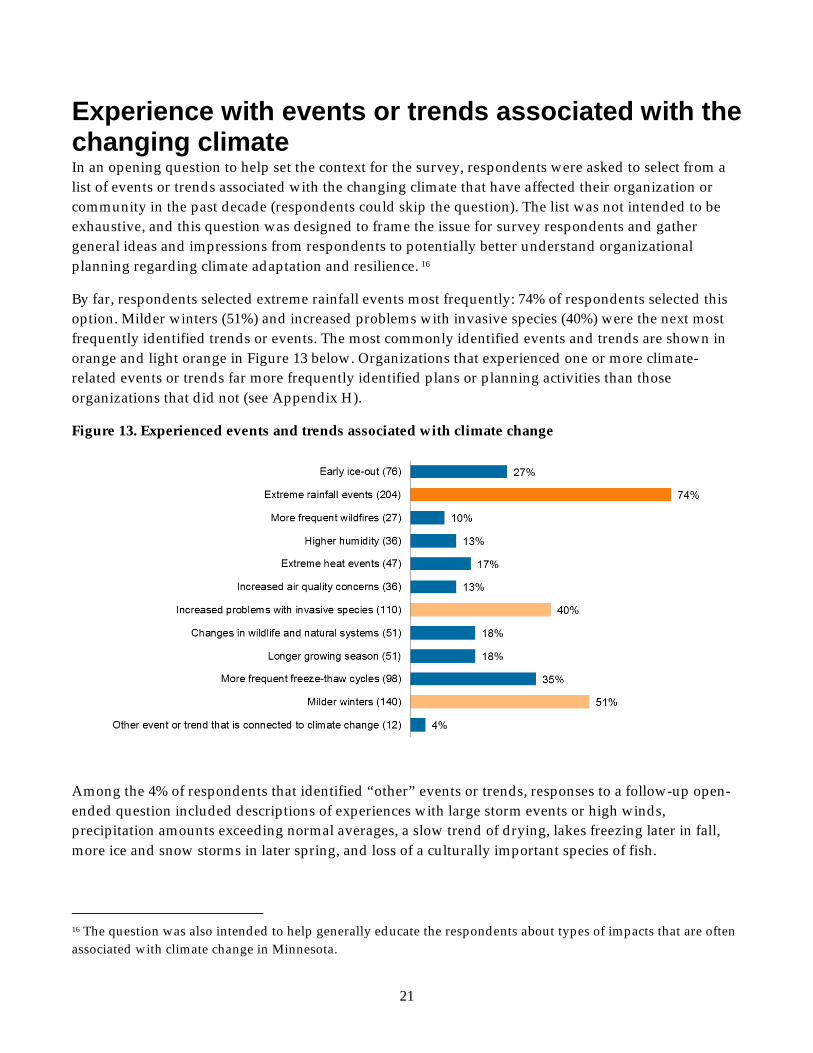
Experience with events or trends associated with the changing climate In an opening question to help set the context for the survey, respondents were asked to select from a list of events or trends associated with the changing climate that have affected their organization or community in the past decade (respondents could skip the question). The list was not intended to be exhaustive, and this question was designed to frame the issue for survey respondents and gather general ideas and impressions from respondents to potentially better understand organizational planning regarding climate adaptation and resilience. 16
By far, respondents selected extreme rainfall events most frequently: 74% of respondents selected this option. Milder winters (51%) and increased problems with invasive species (40%) were the next most frequently identified trends or events. The most commonly identified events and trends are shown in orange and light orange in Figure 13 below. Organizations that experienced one or more climate-related events or trends far more frequently identified plans or planning activities than those organizations that did not (see Appendix H).
Figure 13. Experienced events and trends associated with climate change
Response (number of response s) % Early ice-out (76 ) 27% Extreme rainfall events (204 ) 74% More frequent wildfires (27) 10% Higher humidity (36 ) 13% Extreme heat events (47) 17% Increase d air quality concer ns (36) 13% Increase d problems with invasive spe cies (110 ) 40% Change s in wildlife a nd natural syste ms (51 ) 18% Longer growi ng season (5 1) 18% More frequent freeze -thaw cy cles (98) 35% Milder winters (14 0) 51% Other event or trend that is conne cted to cli mate change (12) 4%
Among the 4% of respondents that identified “other” events or trends, responses to a follow-up open-ended question included descriptions of experiences with large storm events or high winds, precipitation amounts exceeding normal averages, a slow trend of drying, lakes freezing later in fall, more ice and snow storms in later spring, and loss of a culturally important species of fish.
16 The question was also intended to help generally educate the respondents about types of impacts that are often associated with climate change in Minnesota.

22
Other comments from survey respondents At the end of the survey, respondents were offered the opportunity to provide any additional thoughts, ideas, questions, or comments. About 10% of survey respondents provided some response to this question (excluding comments like “none”). A few were complimentary of the survey itself, while a few others took issue with the survey or the topic, or emphasized that climate adaptation should not be a priority. Others offered suggestions for survey questions, specific advice for climate adaptation, or provided more detail on their earlier responses.
Two categories emerged from review of the comments: concerns or ideas specifically from small cities and thoughts and suggestions related to assistance.
Several survey respondents noted that they are small cities. Comments in this category:
· [E]xtremely small community… [This is] sort of unnecessary · Very small city, does not do much to improve... · We are a small town and I'm not sure there is really anything we could do or plan for. What are the
impacts to small town? · We are a very small city... We do not have and [sic] planning regarding climate adaptation. · I think most of us small towns would need just the basics to get started, having been through a flood …,
we adapted quite well on our emergency standing!
Several other respondents offered ideas for assistance that would be helpful or expressed concerns about lack of assistance. Comments in this category:
· Funding for this work, as well as technical assistance for staff on how to "sell" adaptation work to elected officials (the cost-benefit-risk story) will be critical for this work to move forward.
· I am concerned that this will become another responsibility … with no financial assistance for us to implement!
· Planning assistance would be helpful. Perhaps a session [at a conference] on how we can begin this process or incorporate it into our … plans?
· Resources, particularly financial and technical resources, will be essential for planning and mitigating these challenges.
· Thank you for the opportunity to provide input! We are interested in including climate adaptation and resilience in our planning but have not had full city council support. Any help for our staff is appreciated!
· We are just getting started, so we look forward to your assistance.

23
Key Survey Findings and Recommendations for Future Surveys Key survey findings This is the first Minnesota statewide survey of climate adaptation and resilience planning. Over 1,000 Minnesota cities, counties, tribal governments, watershed districts, soil and water conservation districts, and key state agencies received the survey, with about 30% responding. Though the responding organizations may not be completely reflective of the state as a whole, the data from the survey can provide useful information to ICAT.
Statewide indicator A realistic indicator of statewide planning efforts can be calculated using survey data: 17.5% of surveyed organizations (a better indicator than responding organizations) report that they have at least one type of plan or planning effort with content that specifically addresses climate adaptation and resilience.
Respondents’ planning efforts Responding governmental organizations are engaged in a wide range of planning efforts. The majority of responding organizations have plans or are engaged in planning efforts that specifically address climate adaptation and resilience in some way. Most are taking a limited approach, however, with relatively few engaged in many different types of plans or planning efforts related to climate adaptation and resilience.
Specific survey results regarding planning include:
• Within each question about broad types of planning (standalone, health and safety, natural resources, etc.), the most common response was “none of the above.”
• About 40% of responding organizations are engaged in water plans or planning efforts with climate adaptation and resilience content.
• Over one-third of responding organizations indicated that they are engaged in health and safety planning efforts that include content on climate adaptation and resilience.
• Almost one-fourth of responding organizations indicated that they have natural resources plans or planning efforts with climate adaptation and resilience content.
• Less than one-fourth of responding organizations indicated that they are engaged in some other type of planning effort that includes climate adaptation and resilience.
• Relatively few responding organizations are engaged in standalone climate adaptation planning efforts or in comprehensive planning efforts that include climate adaptation or resilience content.

24
Resources and assistance needed Responding organizations provided input on the types of resources or assistance that would be helpful to their organization for climate adaptation and resilience planning. Close to two-thirds of respondents identified best practices for climate adaptation and resilience as a helpful resource. Over half of respondents selected planning toolkit and guides, financial assistance, model climate adaptation and resilience plans, and model policies or ordinances as resources that would help their organizations.
Over 40% of respondents provided their contact information in response to a question regarding whether they are interested in receiving assistance on climate adaptation or resilience. This suggests that the organizations responding to this survey are generally interested in learning more (and potentially doing more) about climate adaptation and resilience planning.
Experience with events or trends associated with the changing climate Almost three-fourths of responding organizations indicated that their organization or community has experienced extreme rainfall events in the past decade. Milder winters (51%) and increased problems with invasive species (40%) were the next most frequently identified trends or events. Organizations that experienced one or more climate-related events or trends far more frequently identified plans or planning activities than those organizations that did not.
Recommendations for future surveys MAD’s role in this project was survey development, administration, and analysis, with the expectation that ICAT would identify implications from the survey data and develop next steps. Advice on survey issues may be useful, however, so MAD offers the following recommendations for future surveys.
Survey timing: MAD recommends that ICAT conduct the survey on a roughly 2-3 year cycle. This will provide relatively up-to-date information for measuring progress while simultaneously avoiding survey fatigue and allowing time for changes to take place.
Potential additional or expanded questions: MAD recommends that the group consider adding or refining questions or topics:
• Consider adding questions to gauge how much an organization may have increased (or decreased) their climate adaptation and resilience planning in recent years, and to estimate how long they have been engaged in climate adaptation and resilience planning efforts.
• Review survey responses to the “other” option regarding planning (see section beginning on page 17). These may offer additional options for questions in future surveys (or may suggest the need for clarification of options): options such as cover crop planning or promotion, drainage control plans, and erosion control plans may be helpful.
• As climate adaptation and resilience planning become more common, consider adding a question to further define resource needs, such as providing more detailed descriptions of options or asking respondents to prioritize among options they select.
• As climate adaptation and resilience planning becomes more common, consider asking a question regarding barriers to implementation.
25
Restraint on survey expansion: Though there are benefits to adding questions and collecting additional information, MAD suggests that ICAT be cautious. Maintaining a brief survey with narrow scope will minimize the burden on respondents, and maintaining the survey’s focus on climate adaptation and resilience planning will make it easier to repeat the survey and have consistent data over time.17
17 If the survey is opened for substantial revision or wider scope, there may be a tendency to modify existing questions substantially, or to ask so many follow-up questions that the survey data is not as comparable from one version to the next.

26
Appendix A. Development of ICAT Indicators The information below is a handout prepared by ICAT. It is included as context for this survey.
Using Results-Based Accountability to develop statewide indicators
The Minnesota Interagency Climate Adaptation Team (ICAT) developed a set of five statewide indicators in late 2015 using the Results-Based Accountability (RBA) process - http://resultsaccountability.com/. Working with Judy Plante of MMB, ICAT members participated in a half-day workshop in September 2015, which was followed up by additional meetings and discussion through which indicators were agreed upon through a consensus-based process. ICAT’s goal is to report initial data for each of the selected indicators by August 2016.
The five statewide indicators, summarized below, will help to track statewide progress towards the team’s common vision: ICAT’s vision is of a resilient, economically thriving, and healthy Minnesota that is prepared for both short- and long-term climate changes and weather extremes.
1) Climate adaptation planning by state agencies, local units of government and tribal governments
Purpose of indicator: • Measure degree to which stand-alone adaptation plans are being prepared by agencies, local
units of government and tribes • Also measure degree to which adaptation is being incorporated into ongoing plans and planning
Data collection strategy: Online survey Lead agency: MPCA
2) Disruptions to the power grid
Purpose of indicator: • Proxy measure of preparedness/resilience for extreme weather and other climate impacts
Data collection strategy: • Utilize existing data sources, i.e., from HSEM, MN Department of Commerce, US Department of
Energy Lead agency: Commerce
3) Hospital data for heat-related health impacts
Purpose of indicator: • Proxy measure of preparedness/resilience for extreme heat on human health
Data collection strategy: • Utilize existing data sources from MDH’s MN Environmental Public Health Tracking Program
(MN EPHT) Lead agency: MDH
4) Inflation adjusted damages from extreme weather
Purpose of indicator: • Proxy measure of preparedness/resilience for climate impacts
27
Data collection strategy: • Utilize existing data sources from HSEM and FEMA
Lead agency: HSEM
5) Canopy cover of urban and community forests
Purpose of indicator: • Proxy measure of implementation of green infrastructure practices for climate adaptation and
degree of vulnerability to climate change Data collection strategy:
• Utilize existing data sources from DNR Lead agency: DNR

28
Appendix B. Methods Detail Overview Number of survey recipients: 1079 Survey in the field: May 17, 2016 to June 7, 2016 Distribution: Contacts in city, county, and tribal governments; contacts for soil and water conservation districts, watershed districts, and selected state agencies (additional description below in Survey recipients section) Weighting: The data are not weighted Data collection: Management Analysis & Development (MAD) Analysis/report: MAD, with input from MPCA Design/sampling: Attempt at a 100% census of the governmental organizations selected
Survey recipients MPCA obtained email lists of cities and counties from the League of Minnesota Cities and the Association of Minnesota Counties, respectively. The contacts for city governments were typically the city administrator, city clerk, city clerk/treasurer, or some combination of those titles. The contacts for counties were typically the county administrator or coordinator. MPCA obtained lists for soil and water conservation districts, watershed districts, and water management organizations from the Minnesota Board of Water and Soil Resources. In these organizations, the survey typically was sent to the district manager or administrator. MPCA supplied contact information for key state agencies, including ICAT contacts and leaders in large state agencies, and for tribal governments. Tribal government contacts were typically in natural resources, environmental, or planning departments. MPCA sent an introductory email to these individuals to explain the survey, identify any outdated email addresses, and offer to change the contact person for the organization. MPCA updated the original list to reflect changes in contact details.
Survey development The MPCA and MAD research team developed the survey questions, focusing on questions that would facilitate the development of an overall indicator for climate adaptation and resilience planning and provide information about the extent of planning efforts across the state. Four additional types of questions were included in the survey: a question regarding resources that might help survey respondents in their planning efforts, a question regarding the types of climate-related events or trends they have experienced, a final open question for respondents to provide any additional feedback, and key descriptive questions about the organizations (type of organization, region, and number of employees). The team intentionally did not include questions about barriers to implementation or attitudes regarding climate change.
MAD tested the questionnaire with its internal survey team and with MPCA staff.
29
Survey administration and analysis MAD administered the survey online using Snap Survey Software, which records data as questionnaires are completed. The survey invitation indicated that MAD was conducting the survey for ICAT, and that MAD would maintain private data from survey respondents. (Survey respondents who asked to receive additional information volunteered to share their contact information.)
The survey was open from May 17, 2016 to June 7, 2016 (the survey was reopened for a short period to accommodate an absent respondent who requested additional time to complete the survey).
To increase response rates, MAD’s survey software sent five reminder emails to non-respondents during the course of the survey, timed with consideration of the Memorial Day holiday; the final email indicated that the survey deadline was extended. When MAD received information from its system indicating that a message was not delivered to an email address, MAD attempted to obtain a valid address or emailed the recipient directly.
Partial responses and data cleaning: The survey dataset includes partial responses, but only those where the respondent advanced past the first question in the survey. In a few instances where a respondent clearly checked an incorrect organization type (a non-tribal organization selecting “Tribal” for example), MAD changed the organization type to match the data from the distribution lists. Since distribution lists did not include size of organization or region information, MAD did not clean this data.
Precision of estimates and representativeness: Researchers can provide information on precision of estimates (level of confidence or margin of sampling error) when survey respondents are selected randomly from a population and when survey response rates are sufficiently high. This survey was designed to collect information from as many representatives of Minnesota local, regional, tribal, and state governmental organizations as possible. Because this was not a truly random sample, it would not be appropriate to calculate measures such as margin of error.
The tables and charts in this report present the information provided by individual organizations that responded to the survey. Some surveys are designed to gauge the attitudes or behaviors of an entire population or group, and the results can be said to be representative. As noted above, this survey was designed to collect input from as many organizations as possible. The organizations that responded to this survey may not be representative of all governmental organizations—the survey respondents may be particularly interested in climate adaptation and resilience or may be more inclined to affirm that they are engaged in planning activities with content that is specifically related to climate adaptation or resilience.
Response rates and response patterns were reasonable, so ICAT and others can use this information to understand current situations and identify patterns and trends.
30
Appendix C. Survey The following text is from the online survey questionnaire. Formatting has been changed.
2016 Climate Adaptation and Resilience Planning Survey Thank you for taking this survey! It will take about 5-10 minutes to complete. This survey has been sent to you as the contact for your organization. Please respond for your organization to the best of your ability. Feel free to ask other people for the answers. If you cannot complete the survey uninterrupted, your responses will be saved automatically and you can return later to complete the survey. All responses will be aggregated in a summary report, and not identified with specific individuals or organizations. What is climate adaptation? Climate adaptation is developing and implementing strategies, initiatives and measures to help human and natural systems respond and become more resilient to our variable and changing climate. Observed and projected climate impacts include: increasing intensity and frequency of heavy rainfall, decline in severity and frequency of extreme cold, more frequent freeze/thaw cycles, and future increased incidence of heat waves and drought. To begin the survey, click the "Next" button below. Tips for using this survey: ·You can exit the survey and return later--your responses will be saved automatically. ·To reset your answers on a page, use the “Reset” button. To go back to a previous page, use the “Back” button. ·If you would prefer a text based version of the survey (for example, if you use a screen reader), click on the "text only" link on the center of the top of the screen. If you have any questions about climate adaptation or resilience, please contact Paul Moss at [email protected] or 651.757.2586. If you have any technical problems with this survey, or if you received a link to the survey without receiving the email explaining the survey’s purpose, please contact Beth Bibus at [email protected] or 651.259.3820. The following types of events and longer-term trends are associated with the changing climate. In the past decade, have any of these affected your organization or community? Please check all that apply.
ÿ Early ice-out ÿ Extreme rainfall events ÿ More frequent wildfires ÿ Higher humidity ÿ Extreme heat events ÿ Increased air quality concerns ÿ Increased problems with invasive species ÿ Changes in wildlife and natural systems ÿ Longer growing season ÿ More frequent freeze-thaw cycles

31
ÿ Milder winters ÿ Other event or trend that is connected to climate change
If you selected "other event or trend," please describe below: Planning for climate change, including resilience measures, is one approach that governmental organizations can take. The next series of questions asks for information about the types of plans your organization may have in place. Each type of plan or planning effort does not apply to every organization—please check only those items that apply. Has your organization engaged in any of the following standalone planning efforts specifically to address climate adaptation and resilience? Please check all that apply then click next:
ÿ Climate adaptation plan completed ÿ Climate adaptation plan in process ÿ Strategic framework for climate adaptation/resilience completed ÿ Strategic framework for climate adaptation/resilience in process ÿ Climate vulnerability assessment completed ÿ Climate vulnerability assessment in process ÿ None of the above
Does your organization have a comprehensive plan with content that specifically addresses climate adaptation and resilience? Please check all that apply then click next:
ÿ Comprehensive Plan with this content adopted ÿ Comprehensive Plan with this content in process ÿ None of the above
Does your organization have any health and safety plans or planning efforts with content that specifically addresses climate adaptation and resilience? Please check all that apply then click next:
ÿ Hazard mitigation ÿ Emergency response ÿ Continuity of operations ÿ Emergency operations ÿ Worker safety and work environment ÿ Public health (vector-borne diseases, extreme heat, asthma/air quality, etc.) ÿ Building codes inspection and enforcement ÿ None of the above
Does your organization have any water plans or planning efforts with content that specifically addresses climate adaptation and resilience? Please check all that apply then click next:
ÿ Sewer system ÿ Stormwater ÿ Wastewater treatment facilities ÿ Water quantity (including groundwater) ÿ Water supply infrastructure ÿ Watershed ÿ Wellhead protection ÿ None of the above

32
Does your organization have any natural resources plans or planning efforts with content that specifically addresses climate adaptation and resilience? Please check all that apply then click next:
ÿ Parks and park facilities ÿ Open/green space (excluding parks) ÿ Forest management ÿ Invasive species ÿ Urban and community forestry ÿ None of the above
Has your organization engaged in any additional planning efforts with content that specifically addresses climate adaptation and resilience? Please check all that apply then click next:
ÿ Capital budget ÿ Economic development ÿ Facilities and grounds (excluding parks and water systems) ÿ Land use ÿ Solid waste ÿ Hazardous waste ÿ Construction & demolition waste ÿ Transportation/roads ÿ Workforce planning and development ÿ Strategic planning ÿ None of the above
Has your organization engaged in any other planning with content specifically related to climate adaptation and resilience? Please provide a description below or click next: What kind of resources or assistance would be most helpful to your organization for climate adaptation and resilience planning? Please check all that apply then click next:
ÿ Best practices for climate adaptation and resilience ÿ Planning toolkit and guides ÿ Data on climate impacts ÿ Educational materials for community outreach ÿ Resources and tools for community engagement meetings ÿ Financial assistance ÿ Model climate adaptation and resilience plans ÿ Model policies or ordinances ÿ Technical assistance ÿ Training for organization staff ÿ Recognition/awards ÿ Other
If you selected "other," please describe the resources or assistance that would be helpful: Please provide information about your organization and geographic area: Organization type
ÿ City ÿ County
33
ÿ State ÿ Tribal government ÿ Watershed district ÿ Soil and water conservation district
Number of employees in your organization
ÿ 0-10 ÿ 11-50 ÿ 51-200 ÿ 201-500 ÿ 501-1,000 ÿ over 1,000
Region (check all that apply)
ÿ Northwest ÿ Northeast ÿ Twin Cities metropolitan area ÿ Central ÿ Southeast ÿ Southwest ÿ Minnesota statewide
Are you interested in receiving assistance on climate adaptation and resilience planning? If so, please provide the following information. This information will be kept separate from your responses to this survey. Name: Organization: Email address:
Please share any additional thoughts, ideas, questions and comments below. Thank you for completing the survey. Please click “Submit”
34
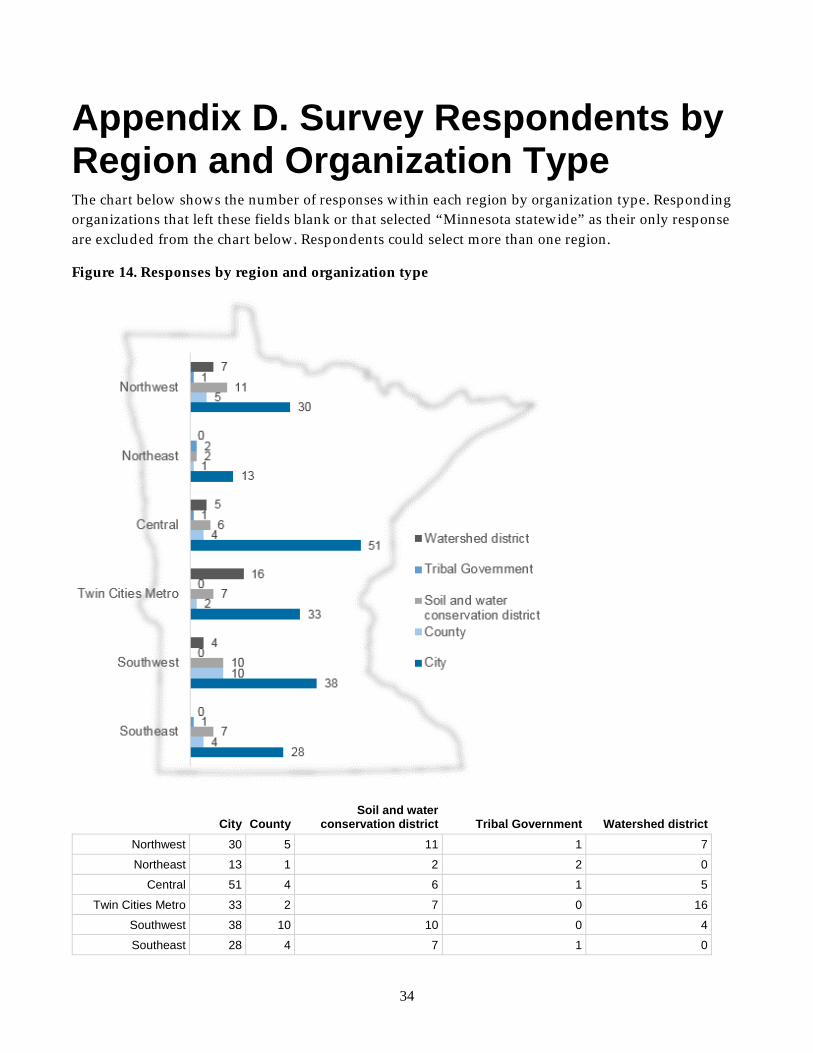
Appendix D. Survey Respondents by Region and Organization Type The chart below shows the number of responses within each region by organization type. Responding organizations that left these fields blank or that selected “Minnesota statewide” as their only response are excluded from the chart below. Respondents could select more than one region.
Figure 14. Responses by region and organization type
City County Soil and water
conservation district Tribal Government Watershed district Northwest 30 5 11 1 7
Northeast 13 1 2 2 0
Central 51 4 6 1 5
Twin Cities Metro 33 2 7 0 16
Southwest 38 10 10 0 4
Southeast 28 4 7 1 0

35
Appendix E. Survey Results by Categories Selected survey results for respondents by organization type, size of organization, and region.
Organization typeExperienced any event or trend connected to climate change
none one or more Total none one or moreCity 48 156 204 City 24% 76%County 1 26 27 County 4% 96%State 1 18 19 State 5% 95%Tribal government 0 5 5 Tribal government 0% 100%
Watershed district 2 30 32 Watershed district 6% 94%Soil and water conservation district 0 42 42
Soil and water conservation district 0% 100%
Total 53 276 329 Total 16% 84%
Engaged in stand-alone planning activity specifically to address climate adaptation and resilience
none one or more Total none one or moreCity 195 9 204 City 96% 4%County 26 1 27 County 96% 4%State 9 10 19 State 47% 53%Tribal government 2 3 5 Tribal government 40% 60%
Watershed district 24 8 32 Watershed district 75% 25%Soil and water conservation district 38 4 42
Soil and water conservation district 90% 10%
Total 294 35 329 Total 89% 11%
24%
4%
5%
0%
6%
0%
16%
76%
96%
95%
100%
94%
100%
84%
City
County
State
Tribal government
Watershed district
Soil and water conservation district
Total
none one or more
96%
96%
47%
40%
75%
90%
89%
4%
4%
53%
60%
25%
10%
11%
City
County
State
Tribal government
Watershed district
Soil and water conservation district
Total
none one or more
36
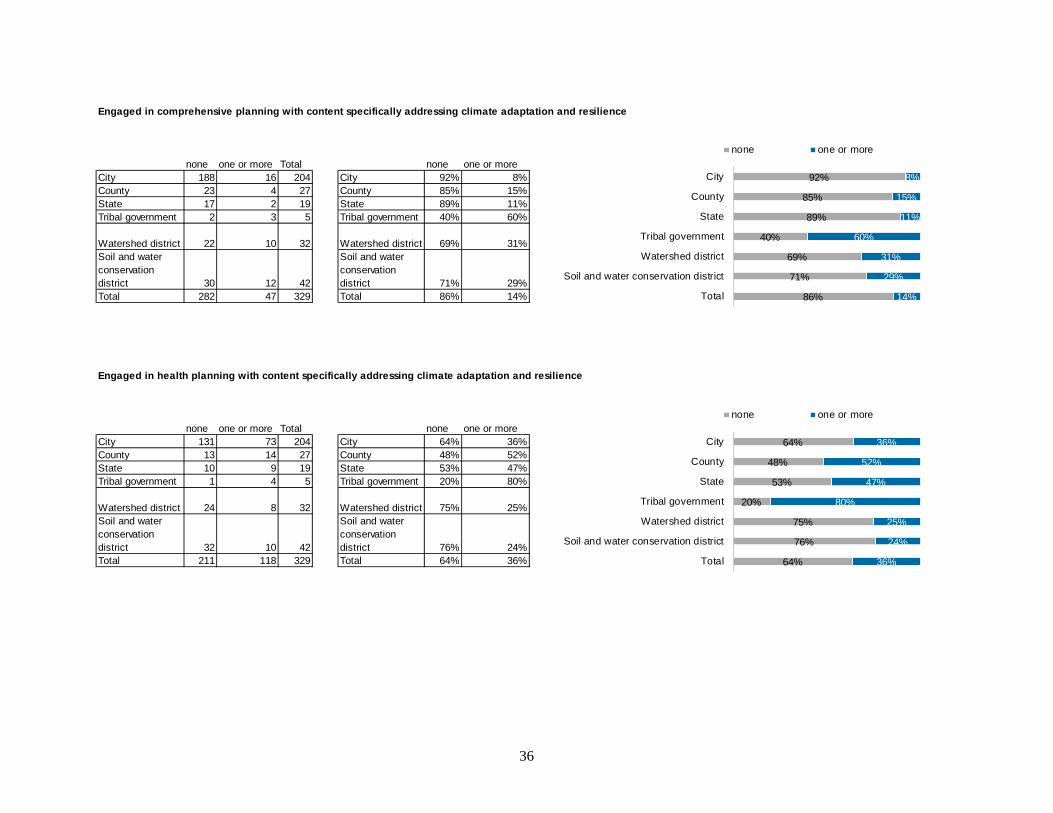
Engaged in comprehensive planning with content specifically addressing climate adaptation and resilience
none one or more Total none one or moreCity 188 16 204 City 92% 8%County 23 4 27 County 85% 15%State 17 2 19 State 89% 11%Tribal government 2 3 5 Tribal government 40% 60%
Watershed district 22 10 32 Watershed district 69% 31%Soil and water conservation district 30 12 42
Soil and water conservation district 71% 29%
Total 282 47 329 Total 86% 14%
Engaged in health planning with content specifically addressing climate adaptation and resilience
none one or more Total none one or moreCity 131 73 204 City 64% 36%County 13 14 27 County 48% 52%State 10 9 19 State 53% 47%Tribal government 1 4 5 Tribal government 20% 80%
Watershed district 24 8 32 Watershed district 75% 25%Soil and water conservation district 32 10 42
Soil and water conservation district 76% 24%
Total 211 118 329 Total 64% 36%
64%
48%
53%
20%
75%
76%
64%
36%
52%
47%
80%
25%
24%
36%
City
County
State
Tribal government
Watershed district
Soil and water conservation district
Total
none one or more
92%
85%
89%
40%
69%
71%
86%
8%
15%
11%
60%
31%
29%
14%
City
County
State
Tribal government
Watershed district
Soil and water conservation district
Total
none one or more

37
Engaged in water planning with content specifically addressing climate adaptation and resilience
none one or more Total none one or moreCity 130 74 204 City 64% 36%County 17 10 27 County 63% 37%State 14 5 19 State 74% 26%Tribal government 1 4 5 Tribal government 20% 80%
Watershed district 15 17 32 Watershed district 47% 53%Soil and water conservation district 19 23 42
Soil and water conservation district 45% 55%
Total 196 133 329 Total 60% 40%
Engaged in natural resources planning with content specifically addressing climate adaptation and resilience
none one or more Total none one or moreCity 168 36 204 City 82% 18%County 18 9 27 County 67% 33%State 14 5 19 State 74% 26%Tribal government 1 4 5 Tribal government 20% 80%
Watershed district 22 10 32 Watershed district 69% 31%Soil and water conservation district 27 15 42
Soil and water conservation district 64% 36%
Total 250 79 329 Total 76% 24%
82%
67%
74%
20%
69%
64%
76%
18%
33%
26%
80%
31%
36%
24%
City
County
State
Tribal government
Watershed district
Soil and water conservation district
Total
none one or more
64%
63%
74%
20%
47%
45%
60%
36%
37%
26%
80%
53%
55%
40%
City
County
State
Tribal government
Watershed district
Soil and water conservation district
Total
none one or more
38
Resp onse Organization type none - count one or more - count Total - count none - % one or more - % Experienced any event or trend connected to climate change City 48 156 204 24% 76% Experienced any event or trend connected to climate change County 1 26 27 4% 96% Experienced any event or trend connected to climate change State 1 18 19 5% 95% Experienced any event or trend connected to climate change Tribal government 0 5 5 0% 100% Experienced any event or trend connected to climate change Watershed d istr ict 2 30 32 6% 94% Experienced any event or trend connected to climate change Soil and water c onservation district 0 42 42 0% 100% Experienced any event or trend connected to climate change Total 53 276 329 16% 84% Engaged in stand-a lone p lanning activity specifically t o addre ss c limate adaptation and resilience City 195 9 204 96% 4% Engaged in stand-a lone p lanning activity specifically t o addre ss c limate adaptation and resilience County 26 1 27 96% 4% Engaged in stand-a lone p lanning activity specifically t o addre ss c limate adaptation and resilience State 9 10 19 47% 53% Engaged in stand-a lone p lanning activity specifically t o addre ss c limate adaptation and resilience Tribal government 2 3 5 40% 60% Engaged in stand-a lone p lanning activity specifically t o addre ss c limate adaptation and resilience Watershed d istr ict 24 8 32 75% 25% Engaged in stand-a lone p lanning activity specifically t o addre ss c limate adaptation and resilience Soil and water c onservation district 38 4 42 90% 10% Engaged in stand-a lone p lanning activity specifically t o addre ss c limate adaptation and resilience Total 294 35 329 89% 11% Engaged in comprehensive p lanning with content specifically addressin g climate adaptation and re silience City 188 16 204 92% 8% Engaged in comprehensive p lanning with content specifically addressin g climate adaptation and re silience County 23 4 27 85% 15% Engaged in comprehensive p lanning with content specifically addressin g climate adaptation and re silience State 17 2 19 89% 11% Engaged in comprehensive p lanning with content specifically addressin g climate adaptation and re silience Tribal government 2 3 5 40% 60% Engaged in comprehensive p lanning with content specifically addressin g climate adaptation and re silience Watershed d istr ict 22 10 32 69% 31% Engaged in comprehensive p lanning with content specifically addressin g climate adaptation and re silience Soil and water c onservation district 30 12 42 71% 29% Engaged in comprehensive p lanning with content specifically addressin g climate adaptation and re silience Total 282 47 329 86% 14% Engaged in health planning w ith content specifically add ressin g climate adaptation and re silience City 131 73 204 64% 36% Engaged in health planning w ith content specifically add ressin g climate adaptation and re silience County 13 14 27 48% 52% Engaged in health planning w ith content specifically add ressin g climate adaptation and re silience State 10 9 19 53% 47% Engaged in health planning w ith content specifically add ressin g climate adaptation and re silience Tribal government 1 4 5 20% 80% Engaged in health planning w ith content specifically add ressin g climate adaptation and re silience Watershed d istr ict 24 8 32 75% 25% Engaged in health planning w ith content specifically add ressin g climate adaptation and re silience Soil and water c onservation district 32 10 42 76% 24% Engaged in health planning w ith content specifically add ressin g climate adaptation and re silience Total 211 118 329 64% 36% Engaged in water p lanning w ith content specifically ad dressin g climate adaptation and re silience City 130 74 204 64% 36% Engaged in water p lanning w ith content specifically ad dressin g climate adaptation and re silience County 17 10 27 63% 37% Engaged in water p lanning w ith content specifically ad dressin g climate adaptation and re silience State 14 5 19 74% 26% Engaged in water p lanning w ith content specifically ad dressin g climate adaptation and re silience Tribal government 1 4 5 20% 80% Engaged in water p lanning w ith content specifically ad dressin g climate adaptation and re silience Watershed d istr ict 15 17 32 47% 53% Engaged in water p lanning w ith content specifically ad dressin g climate adaptation and re silience Soil and water c onservation district 19 23 42 45% 55% Engaged in water p lanning w ith content specifically ad dressin g climate adaptation and re silience Total 196 133 329 60% 40% Engaged in natura l resource s plannin g with content specifica lly addre ssing c limate adaptation and resilience City 168 36 204 82% 18% Engaged in natura l resource s plannin g with content specifica lly addre ssing c limate adaptation and resilience County 18 9 27 67% 33% Engaged in natura l resource s plannin g with content specifica lly addre ssing c limate adaptation and resilience State 14 5 19 74% 26% Engaged in natura l resource s plannin g with content specifica lly addre ssing c limate adaptation and resilience Tribal government 1 4 5 20% 80% Engaged in natura l resource s plannin g with content specifica lly addre ssing c limate adaptation and resilience Watershed d istr ict 22 10 32 69% 31% Engaged in natura l resource s plannin g with content specifica lly addre ssing c limate adaptation and resilience Soil and water c onservation district 27 15 42 64% 36% Engaged in natura l resource s plannin g with content specifica lly addre ssing c limate adaptation and resilience Total 250 79 329 76% 24% Engaged in an y addit iona l plannin g with content specifica lly addre ssing c limate adaptation and resilience City 177 27 204 87% 13% Engaged in an y addit iona l plannin g with content specifica lly addre ssing c limate adaptation and resilience County 19 8 27 70% 30% Engaged in an y addit iona l plannin g with content specifica lly addre ssing c limate adaptation and resilience State 10 9 19 53% 47% Engaged in an y addit iona l plannin g with content specifica lly addre ssing c limate adaptation and resilience Tribal government 2 3 5 40% 60% Engaged in an y addit iona l plannin g with content specifica lly addre ssing c limate adaptation and resilience Watershed d istr ict 22 10 32 69% 31% Engaged in an y addit iona l plannin g with content specifica lly addre ssing c limate adaptation and resilience Soil and water c onservation district 29 13 42 69% 31% Engaged in an y addit iona l plannin g with content specifica lly addre ssing c limate adaptation and resilience Total 259 70 329 79% 21% Engaged in an y type of relevant plannin g activit y (resp ondents who selected plan s or plann ing effort s in an y category) City 105 99 204 51% 49% Engaged in an y type of relevant plannin g activit y (resp ondents who selected plan s or plann ing effort s in an y category) County 9 18 27 33% 67% Engaged in an y type of relevant plannin g activit y (resp ondents who selected plan s or plann ing effort s in an y category) State 3 16 19 16% 84% Engaged in an y type of relevant plannin g activit y (resp ondents who selected plan s or plann ing effort s in an y category) Tribal government 0 5 5 0% 100% Engaged in an y type of relevant plannin g activit y (resp ondents who selected plan s or plann ing effort s in an y category) Watershed d istr ict 11 21 32 34% 66% Engaged in an y type of relevant plannin g activit y (resp ondents who selected plan s or plann ing effort s in an y category) Soil and water c onservation district 12 30 42 29% 71% Engaged in an y type of relevant plannin g activit y (resp ondents who selected plan s or plann ing effort s in an y category) Total 140 189 329 43% 57%
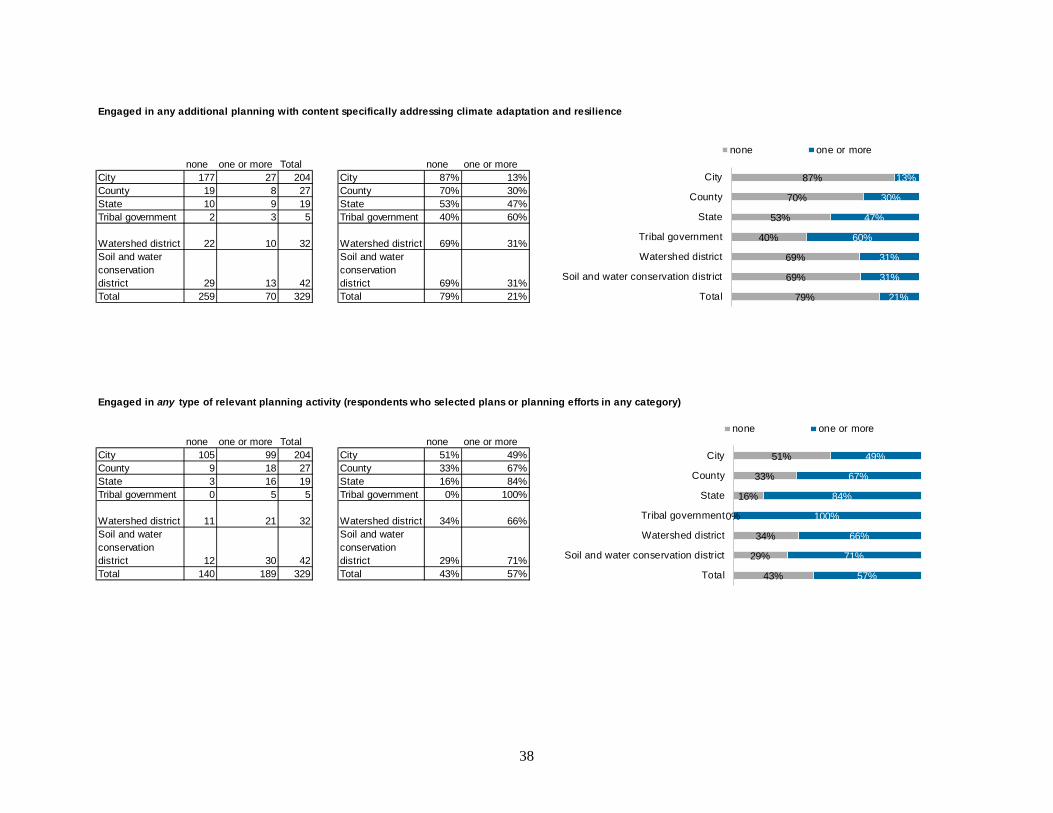
Engaged in any additional planning with content specifically addressing climate adaptation and resilience
none one or more Total none one or moreCity 177 27 204 City 87% 13%County 19 8 27 County 70% 30%State 10 9 19 State 53% 47%Tribal government 2 3 5 Tribal government 40% 60%
Watershed district 22 10 32 Watershed district 69% 31%Soil and water conservation district 29 13 42
Soil and water conservation district 69% 31%
Total 259 70 329 Total 79% 21%
Engaged in any type of relevant planning activity (respondents who selected plans or planning efforts in any category)
none one or more Total none one or moreCity 105 99 204 City 51% 49%County 9 18 27 County 33% 67%State 3 16 19 State 16% 84%Tribal government 0 5 5 Tribal government 0% 100%
Watershed district 11 21 32 Watershed district 34% 66%Soil and water conservation district 12 30 42
Soil and water conservation district 29% 71%
Total 140 189 329 Total 43% 57%
51%
33%
16%
0%
34%
29%
43%
49%
67%
84%
100%
66%
71%
57%
City
County
State
Tribal government
Watershed district
Soil and water conservation district
Total
none one or more
87%
70%
53%
40%
69%
69%
79%
13%
30%
47%
60%
31%
31%
21%
City
County
State
Tribal government
Watershed district
Soil and water conservation district
Total
none one or more

39
RegionRespondents could select more than one region. Organizations that seleted "Minnesota statewide" are included in totals and/or in other regions the respondent may have selected. Total rows represent the full survey data set
Experienced any event or trend connected to climate change
none one or more Total none one or moreNW 14 42 56 NW 25% 75%NE 4 17 21 NE 19% 81%Metro 3 63 66 Metro 5% 95%Central 17 53 70 Central 24% 76%SE 2 41 43 SE 5% 95%SW 9 54 63 SW 14% 86%Total 53 276 329 Total 16% 84%
Engaged in stand-alone planning activity specifically to address climate adaptation and resilience
none one or more Total none one or moreNW 52 4 56 NW 93% 7%NE 17 4 21 NE 81% 19%Metro 53 13 66 Metro 80% 20%Central 64 6 70 Central 91% 9%SE 38 5 43 SE 88% 12%SW 59 4 63 SW 94% 6%Total 294 35 329 Total 89% 11%
25%
19%
5%
24%
5%
14%
16%
75%
81%
95%
76%
95%
86%
84%
NW
NE
Metro
Central
SE
SW
Total
none one or more
93%
81%
80%
91%
88%
94%
89%
7%
19%
20%
9%
12%
6%
11%
NW
NE
Metro
Central
SE
SW
Total
none one or more

40
Engaged in comprehensive planning with content specifically addressing climate adaptation and resilience
none one or more Total none one or moreNW 45 7 56 NW 80% 13%NE 18 3 21 NE 86% 14%Metro 46 20 66 Metro 70% 30%Central 61 9 70 Central 87% 13%SE 39 4 43 SE 91% 9%SW 59 5 63 SW 94% 8%Total 282 47 329 Total 86% 14%
Engaged in health planning with content specifically addressing climate adaptation and resilience
none one or more Total none one or moreNW 42 14 56 NW 75% 25%NE 10 11 21 NE 48% 52%Metro 38 28 66 Metro 58% 42%Central 42 28 70 Central 60% 40%SE 26 17 43 SE 60% 40%SW 44 19 63 SW 70% 30%Total 211 118 329 Total 64% 36%
80%
86%
70%
87%
91%
94%
86%
13%
14%
30%
13%
9%
8%
14%
NW
NE
Metro
Central
SE
SW
Total
none one or more
75%
48%
58%
60%
60%
70%
64%
25%
52%
42%
40%
40%
30%
36%
NW
NE
Metro
Central
SE
SW
Total
none one or more

41
Engaged in water planning with content specifically addressing climate adaptation and resilience
none one or more Total none one or moreNW 35 21 56 NW 63% 38%NE 11 10 21 NE 52% 48%Metro 34 32 66 Metro 52% 48%Central 40 30 70 Central 57% 43%SE 25 18 43 SE 58% 42%SW 39 24 63 SW 62% 38%Total 196 133 329 Total 60% 40%
Engaged in natural resources planning with content specifically addressing climate adaptation and resilience
none one or more Total none one or moreNW 39 17 56 NW 70% 30%NE 14 7 21 NE 67% 33%Metro 45 21 66 Metro 68% 32%Central 51 19 70 Central 73% 27%SE 30 13 43 SE 70% 30%SW 55 8 63 SW 87% 13%Total 250 79 329 Total 76% 24%
63%
52%
52%
57%
58%
62%
60%
38%
48%
48%
43%
42%
38%
40%
NW
NE
Metro
Central
SE
SW
Total
none one or more
70%
67%
68%
73%
70%
87%
76%
30%
33%
32%
27%
30%
13%
24%
NW
NE
Metro
Central
SE
SW
Total
none one or more

42
Resp onse Region none - count one or more - count Total - count none % one or more - % Experienced any event or trend connected to climate change NW 14 42 56 25% 75% Experienced any event or trend connected to climate change NE 4 17 21 19% 81% Experienced any event or trend connected to climate change Metro 3 63 66 5% 95% Experienced any event or trend connected to climate change Central 17 53 70 24% 76% Experienced any event or trend connected to climate change SE 2 41 43 5% 95% Experienced any event or trend connected to climate change SW 9 54 63 14% 86% Experienced any event or trend connected to climate change Total 53 276 329 16% 84% Engaged in stand-a lone p lanning activity specifically t o addre ss c limate adaptation and resilience NW 52 4 56 93% 7% Engaged in stand-a lone p lanning activity specifically t o addre ss c limate adaptation and resilience NE 17 4 21 81% 19% Engaged in stand-a lone p lanning activity specifically t o addre ss c limate adaptation and resilience Metro 53 13 66 80% 20% Engaged in stand-a lone p lanning activity specifically t o addre ss c limate adaptation and resilience Central 64 6 70 91% 9% Engaged in stand-a lone p lanning activity specifically t o addre ss c limate adaptation and resilience SE 38 5 43 88% 12% Engaged in stand-a lone p lanning activity specifically t o addre ss c limate adaptation and resilience SW 59 4 63 94% 6% Engaged in stand-a lone p lanning activity specifically t o addre ss c limate adaptation and resilience Total 294 35 329 89% 11% Engaged in comprehensive p lanning with content specifically addressin g climate adaptation and re silience NW 45 7 56 80% 13% Engaged in comprehensive p lanning with content specifically addressin g climate adaptation and re silience NE 18 3 21 86% 14% Engaged in comprehensive p lanning with content specifically addressin g climate adaptation and re silience Metro 46 20 66 70% 30% Engaged in comprehensive p lanning with content specifically addressin g climate adaptation and re silience Central 61 9 70 87% 13% Engaged in comprehensive p lanning with content specifically addressin g climate adaptation and re silience SE 39 4 43 91% 9% Engaged in comprehensive p lanning with content specifically addressin g climate adaptation and re silience SW 59 5 63 94% 8% Engaged in comprehensive p lanning with content specifically addressin g climate adaptation and re silience Total 282 47 329 86% 14% Engaged in health planning w ith content specifically add ressin g climate adaptation and re silience NW 42 14 56 75% 25% Engaged in health planning w ith content specifically add ressin g climate adaptation and re silience NE 10 11 21 48% 52% Engaged in health planning w ith content specifically add ressin g climate adaptation and re silience Metro 38 28 66 58% 42% Engaged in health planning w ith content specifically add ressin g climate adaptation and re silience Central 42 28 70 60% 40% Engaged in health planning w ith content specifically add ressin g climate adaptation and re silience SE 26 17 43 60% 40% Engaged in health planning w ith content specifically add ressin g climate adaptation and re silience SW 44 19 63 70% 30% Engaged in health planning w ith content specifically add ressin g climate adaptation and re silience Total 211 118 329 64% 36% Engaged in water p lanning w ith content specifically ad dressin g climate adaptation and re silience NW 35 21 56 63% 38% Engaged in water p lanning w ith content specifically ad dressin g climate adaptation and re silience NE 11 10 21 52% 48% Engaged in water p lanning w ith content specifically ad dressin g climate adaptation and re silience Metro 34 32 66 52% 48% Engaged in water p lanning w ith content specifically ad dressin g climate adaptation and re silience Central 40 30 70 57% 43% Engaged in water p lanning w ith content specifically ad dressin g climate adaptation and re silience SE 25 18 43 58% 42% Engaged in water p lanning w ith content specifically ad dressin g climate adaptation and re silience SW 39 24 63 62% 38% Engaged in water p lanning w ith content specifically ad dressin g climate adaptation and re silience Total 196 133 329 60% 40% Engaged in natura l resource s plannin g with content specifica lly addre ssing c limate adaptation and resilience NW 39 17 56 70% 30% Engaged in natura l resource s plannin g with content specifica lly addre ssing c limate adaptation and resilience NE 14 7 21 67% 33% Engaged in natura l resource s plannin g with content specifica lly addre ssing c limate adaptation and resilience Metro 45 21 66 68% 32% Engaged in natura l resource s plannin g with content specifica lly addre ssing c limate adaptation and resilience Central 51 19 70 73% 27% Engaged in natura l resource s plannin g with content specifica lly addre ssing c limate adaptation and resilience SE 30 13 43 70% 30% Engaged in natura l resource s plannin g with content specifica lly addre ssing c limate adaptation and resilience SW 55 8 63 87% 13% Engaged in natura l resource s plannin g with content specifica lly addre ssing c limate adaptation and resilience Total 250 79 329 76% 24% Engaged in an y addit iona l plannin g with content specifica lly addre ssing c limate adaptation and resilience NW 46 10 56 82% 18% Engaged in an y addit iona l plannin g with content specifica lly addre ssing c limate adaptation and resilience NE 14 7 21 67% 33% Engaged in an y addit iona l plannin g with content specifica lly addre ssing c limate adaptation and resilience Metro 46 20 66 70% 30% Engaged in an y addit iona l plannin g with content specifica lly addre ssing c limate adaptation and resilience Central 53 17 70 76% 24% Engaged in an y addit iona l plannin g with content specifica lly addre ssing c limate adaptation and resilience SE 30 13 43 70% 30% Engaged in an y addit iona l plannin g with content specifica lly addre ssing c limate adaptation and resilience SW 55 8 63 87% 13% Engaged in an y addit iona l plannin g with content specifica lly addre ssing c limate adaptation and resilience Total 259 70 329 79% 21% Engaged in an y type of plannin g activity (re sp ondents who selected plan s or plannin g effort s in an y category) NW 31 25 56 55% 45% Engaged in an y type of plannin g activity (re sp ondents who selected plan s or plannin g effort s in an y category) NE 6 15 21 29% 71% Engaged in an y type of plannin g activity (re sp ondents who selected plan s or plannin g effort s in an y category) Metro 17 49 66 26% 74% Engaged in an y type of plannin g activity (re sp ondents who selected plan s or plannin g effort s in an y category) Central 23 47 70 33% 67% Engaged in an y type of plannin g activity (re sp ondents who selected plan s or plannin g effort s in an y category) SE 19 24 43 44% 56% Engaged in an y type of plannin g activity (re sp ondents who selected plan s or plannin g effort s in an y category) SW 34 29 63 54% 46% Engaged in an y type of plannin g activity (re sp ondents who selected plan s or plannin g effort s in an y category) Total 140 189 329 43% 57%
Engaged in any additional planning with content specifically addressing climate adaptation and resilience
none one or more Total none one or moreNW 46 10 56 NW 82% 18%NE 14 7 21 NE 67% 33%Metro 46 20 66 Metro 70% 30%Central 53 17 70 Central 76% 24%SE 30 13 43 SE 70% 30%SW 55 8 63 SW 87% 13%Total 259 70 329 Total 79% 21%
Engaged in any type of planning activity (respondents who selected plans or planning efforts in any category)
none one or more Total none one or moreNW 31 25 56 NW 55% 45%NE 6 15 21 NE 29% 71%Metro 17 49 66 Metro 26% 74%Central 23 47 70 Central 33% 67%SE 19 24 43 SE 44% 56%SW 34 29 63 SW 54% 46%Total 140 189 329 Total 43% 57%
82%
67%
70%
76%
70%
87%
79%
18%
33%
30%
24%
30%
13%
21%
NW
NE
Metro
Central
SE
SW
Total
none one or more
55%
29%
26%
33%
44%
54%
43%
45%
71%
74%
67%
56%
46%
57%
NW
NE
Metro
Central
SE
SW
Total
none one or more
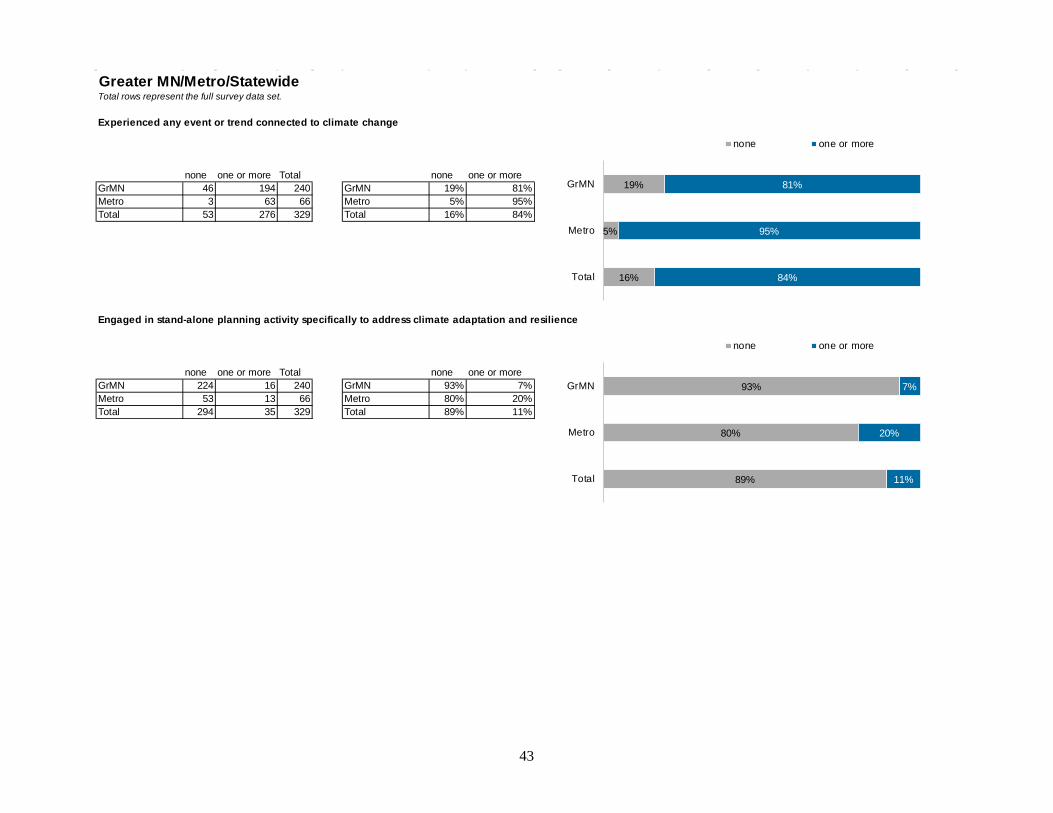
43
Greater MN/Metro/StatewideTotal rows represent the full survey data set.
Experienced any event or trend connected to climate change
none one or more Total none one or moreGrMN 46 194 240 GrMN 19% 81%Metro 3 63 66 Metro 5% 95%Total 53 276 329 Total 16% 84%
Engaged in stand-alone planning activity specifically to address climate adaptation and resilience
none one or more Total none one or moreGrMN 224 16 240 GrMN 93% 7%Metro 53 13 66 Metro 80% 20%Total 294 35 329 Total 89% 11%
93%
80%
89%
7%
20%
11%
GrMN
Metro
Total
none one or more
19%
5%
16%
81%
95%
84%
GrMN
Metro
Total
none one or more

44
Engaged in comprehensive planning with content specifically addressing climate adaptation and resilience
none one or more Total none one or moreGrMN 216 24 240 GrMN 90% 10%Metro 46 20 66 Metro 70% 30%Total 282 47 329 Total 86% 14%
Engaged in health planning with content specifically addressing climate adaptation and resilience
none one or more Total none one or moreGrMN 160 80 240 GrMN 67% 33%Metro 38 28 66 Metro 58% 42%Total 211 118 329 Total 64% 36%
67%
58%
64%
33%
42%
36%
GrMN
Metro
Total
none one or more
90%
70%
86%
10%
30%
14%
GrMN
Metro
Total
none one or more
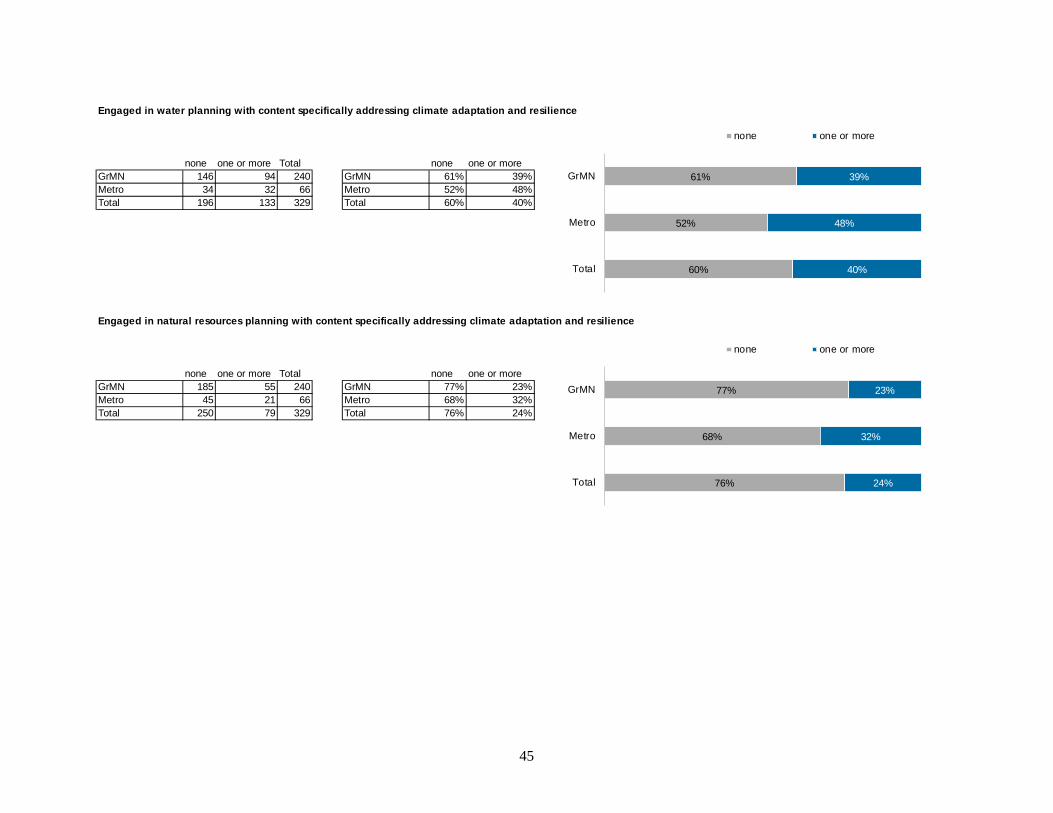
45
Engaged in water planning with content specifically addressing climate adaptation and resilience
none one or more Total none one or moreGrMN 146 94 240 GrMN 61% 39%Metro 34 32 66 Metro 52% 48%Total 196 133 329 Total 60% 40%
Engaged in natural resources planning with content specifically addressing climate adaptation and resilience
none one or more Total none one or moreGrMN 185 55 240 GrMN 77% 23%Metro 45 21 66 Metro 68% 32%Total 250 79 329 Total 76% 24%
77%
68%
76%
23%
32%
24%
GrMN
Metro
Total
none one or more
61%
52%
60%
39%
48%
40%
GrMN
Metro
Total
none one or more

46
Resp onse Region none - count one or more - count Total - count none - % one or more - % Experienced any event or trend connected to climate change GrMN 46 194 240 19% 81% Experienced any event or trend connected to climate change Metro 3 63 66 5% 95% Experienced any event or trend connected to climate change Total 53 276 329 16% 84% Engaged in stand-a lone p lanning activity specifically t o addre ss c limate adaptation and resilience GrMN 224 16 240 93% 7% Engaged in stand-a lone p lanning activity specifically t o addre ss c limate adaptation and resilience Metro 53 13 66 80% 20% Engaged in stand-a lone p lanning activity specifically t o addre ss c limate adaptation and resilience Total 294 35 329 89% 11% Engaged in comprehensive p lanning with content specifically addressin g climate adaptation and re silience GrMN 216 24 240 90% 10% Engaged in comprehensive p lanning with content specifically addressin g climate adaptation and re silience Metro 46 20 66 70% 30% Engaged in comprehensive p lanning with content specifically addressin g climate adaptation and re silience Total 282 47 329 86% 14% Engaged in health planning w ith content specifically add ressin g climate adaptation and re silience GrMN 160 80 240 67% 33% Engaged in health planning w ith content specifically add ressin g climate adaptation and re silience Metro 38 28 66 58% 42% Engaged in health planning w ith content specifically add ressin g climate adaptation and re silience Total 211 118 329 64% 36% Engaged in water p lanning w ith content specifically ad dressin g climate adaptation and re silience GrMN 146 94 240 61% 39% Engaged in water p lanning w ith content specifically ad dressin g climate adaptation and re silience Metro 34 32 66 52% 48% Engaged in water p lanning w ith content specifically ad dressin g climate adaptation and re silience Total 196 133 329 60% 40% Engaged in natura l resource s plannin g with content specifica lly addre ssing c limate adaptation and resilience GrMN 185 55 240 77% 23% Engaged in natura l resource s plannin g with content specifica lly addre ssing c limate adaptation and resilience Metro 45 21 66 68% 32% Engaged in natura l resource s plannin g with content specifica lly addre ssing c limate adaptation and resilience Total 250 79 329 76% 24% Engaged in an y addit iona l plannin g with content specifica lly addre ssing c limate adaptation and resilience GrMN 195 45 240 81% 19% Engaged in an y addit iona l plannin g with content specifica lly addre ssing c limate adaptation and resilience Metro 46 20 66 70% 30% Engaged in an y addit iona l plannin g with content specifica lly addre ssing c limate adaptation and resilience Total 259 70 329 79% 21% Engaged in an y type of relevant plannin g activit y (resp ondents who selected plan s or plann ing effort s in an y category) GrMN 113 127 240 47% 53% Engaged in an y type of relevant plannin g activit y (resp ondents who selected plan s or plann ing effort s in an y category) Metro 17 49 66 26% 74% Engaged in an y type of relevant plannin g activit y (resp ondents who selected plan s or plann ing effort s in an y category) Total 140 189 329 43% 57%
Engaged in any additional planning with content specifically addressing climate adaptation and resilience
none one or more Total none one or moreGrMN 195 45 240 GrMN 81% 19%Metro 46 20 66 Metro 70% 30%Total 259 70 329 Total 79% 21%
Engaged in any type of relevant planning activity (respondents who selected plans or planning efforts in any category)
none one or more Total none one or moreGrMN 113 127 240 GrMN 47% 53%Metro 17 49 66 Metro 26% 74%Total 140 189 329 Total 43% 57%
47%
26%
43%
53%
74%
57%
GrMN
Metro
Total
none one or more
81%
70%
79%
19%
30%
21%
GrMN
Metro
Total
none one or more

47
Number of EmployeesTotal rows represent the full survey data set
Experienced any event or trend connected to climate change
none one or more Total none one or more0-10 31 151 182 0-10 17% 83%11-50 12 45 57 11-50 21% 79%51-200 5 32 37 51-200 14% 86%201-500 1 16 17 201-500 6% 94%501-1,000 0 6 6 501-1,000 0% 100%over 1,000 0 11 11 over 1,000 0% 100%Total 53 276 329 Total 16% 84%
Engaged in stand-alone planning activity specifically to address climate adaptation and resilience
none one or more Total none one or more0-10 170 12 182 0-10 93% 7%11-50 53 4 57 11-50 93% 7%51-200 28 9 37 51-200 76% 24%201-500 16 1 17 201-500 94% 6%501-1,000 2 4 6 501-1,000 33% 67%over 1,000 6 5 11 over 1,000 55% 45%Total 294 35 329 Total 89% 11%
17%
21%
14%
6%
16%
83%
79%
86%
94%
100%
100%
84%
0-10
11-50
51-200
201-500
501-1,000
over 1,000
Total
none one or more
93%
93%
76%
94%
33%
55%
89%
7%
7%
24%
6%
67%
45%
11%
0-10
11-50
51-200
201-500
501-1,000
over 1,000
Total
none one or more
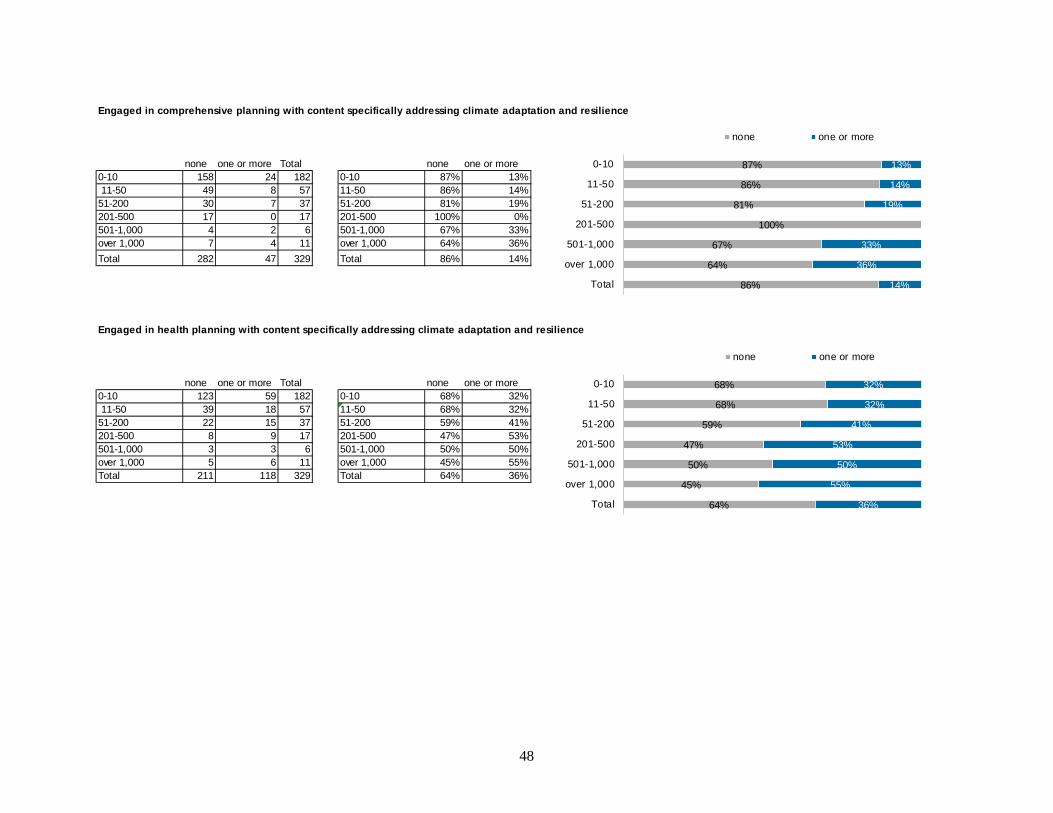
48
Engaged in comprehensive planning with content specifically addressing climate adaptation and resilience
none one or more Total none one or more0-10 158 24 182 0-10 87% 13% 11-50 49 8 57 11-50 86% 14%51-200 30 7 37 51-200 81% 19%201-500 17 0 17 201-500 100% 0%501-1,000 4 2 6 501-1,000 67% 33%over 1,000 7 4 11 over 1,000 64% 36%Total 282 47 329 Total 86% 14%
Engaged in health planning with content specifically addressing climate adaptation and resilience
none one or more Total none one or more0-10 123 59 182 0-10 68% 32% 11-50 39 18 57 11-50 68% 32%51-200 22 15 37 51-200 59% 41%201-500 8 9 17 201-500 47% 53%501-1,000 3 3 6 501-1,000 50% 50%over 1,000 5 6 11 over 1,000 45% 55%Total 211 118 329 Total 64% 36%
87%
86%
81%
100%
67%
64%
86%
13%
14%
19%
33%
36%
14%
0-10
11-50
51-200
201-500
501-1,000
over 1,000
Total
none one or more
68%
68%
59%
47%
50%
45%
64%
32%
32%
41%
53%
50%
55%
36%
0-10
11-50
51-200
201-500
501-1,000
over 1,000
Total
none one or more

49
Engaged in water planning with content specifically addressing climate adaptation and resilience
none one or more Total none one or more0-10 106 76 182 0-10 58% 42%11-50 36 21 57 11-50 63% 37%51-200 26 11 37 51-200 70% 30%201-500 10 7 17 201-500 59% 41%501-1,000 2 4 6 501-1,000 33% 67%over 1,000 5 6 11 over 1,000 45% 55%Total 196 133 329 Total 60% 40%
Engaged in natural resources planning with content specifically addressing climate adaptation and resilience
none one or more Total none one or more0-10 141 41 182 0-10 77% 23% 11-50 46 11 57 11-50 81% 19%51-200 29 8 37 51-200 78% 22%201-500 8 9 17 201-500 47% 53%501-1,000 3 3 6 501-1,000 50% 50%over 1,000 6 5 11 over 1,000 55% 45%Total 250 79 329 Total 76% 24%
58%
63%
70%
59%
33%
45%
60%
42%
37%
30%
41%
67%
55%
40%
0-10
11-50
51-200
201-500
501-1,000
over 1,000
Total
none one or more
77%
81%
78%
47%
50%
55%
76%
23%
19%
22%
53%
50%
45%
24%
0-10
11-50
51-200
201-500
501-1,000
over 1,000
Total
none one or more

50
Resp onse Number of employees none - count one or more - count Total - count none - % one or more - % Experienced any event or trend connected to climate change 0-10 31 151 182 17% 83% Experienced any event or trend connected to climate change 11-50 12 45 57 21% 79% Experienced any event or trend connected to climate change 51-200 5 32 37 14% 86% Experienced any event or trend connected to climate change 201-500 1 16 17 6% 94% Experienced any event or trend connected to climate change 501-1,000 0 6 6 0% 100% Experienced any event or trend connected to climate change over 1,000 0 11 11 0% 100% Experienced any event or trend connected to climate change Total 53 276 329 16% 84% Engaged in stand-a lone p lanning activity specifically t o addre ss c limate adaptation and resilience 0-10 170 12 182 93% 7% Engaged in stand-a lone p lanning activity specifically t o addre ss c limate adaptation and resilience 11-50 53 4 57 93% 7% Engaged in stand-a lone p lanning activity specifically t o addre ss c limate adaptation and resilience 51-200 28 9 37 76% 24% Engaged in stand-a lone p lanning activity specifically t o addre ss c limate adaptation and resilience 201-500 16 1 17 94% 6% Engaged in stand-a lone p lanning activity specifically t o addre ss c limate adaptation and resilience 501-1,000 2 4 6 33% 67% Engaged in stand-a lone p lanning activity specifically t o addre ss c limate adaptation and resilience over 1,000 6 5 11 55% 45% Engaged in stand-a lone p lanning activity specifically t o addre ss c limate adaptation and resilience Total 294 35 329 89% 11% Engaged in comprehensive p lanning with content specifically addressin g climate adaptation and re silience 0-10 158 24 182 87% 13% Engaged in comprehensive p lanning with content specifically addressin g climate adaptation and re silience 11-50 49 8 57 86% 14% Engaged in comprehensive p lanning with content specifically addressin g climate adaptation and re silience 51-200 30 7 37 81% 19% Engaged in comprehensive p lanning with content specifically addressin g climate adaptation and re silience 201-500 17 0 17 100% 0% Engaged in comprehensive p lanning with content specifically addressin g climate adaptation and re silience 501-1,000 4 2 6 67% 33% Engaged in comprehensive p lanning with content specifically addressin g climate adaptation and re silience over 1,000 7 4 11 64% 36% Engaged in comprehensive p lanning with content specifically addressin g climate adaptation and re silience Total 282 47 329 86% 14% Engaged in health planning w ith content specifically add ressin g climate adaptation and re silience 0-10 123 59 182 68% 32% Engaged in health planning w ith content specifically add ressin g climate adaptation and re silience 11-50 39 18 57 68% 32% Engaged in health planning w ith content specifically add ressin g climate adaptation and re silience 51-200 22 15 37 59% 41% Engaged in health planning w ith content specifically add ressin g climate adaptation and re silience 201-500 8 9 17 47% 53% Engaged in health planning w ith content specifically add ressin g climate adaptation and re silience 501-1,000 3 3 6 50% 50% Engaged in health planning w ith content specifically add ressin g climate adaptation and re silience over 1,000 5 6 11 45% 55% Engaged in health planning w ith content specifically add ressin g climate adaptation and re silience Total 211 118 329 64% 36% Engaged in water p lanning w ith content specifically ad dressin g climate adaptation and re silience 0-10 106 76 182 58% 42% Engaged in water p lanning w ith content specifically ad dressin g climate adaptation and re silience 11-50 36 21 57 63% 37% Engaged in water p lanning w ith content specifically ad dressin g climate adaptation and re silience 51-200 26 11 37 70% 30% Engaged in water p lanning w ith content specifically ad dressin g climate adaptation and re silience 201-500 10 7 17 59% 41% Engaged in water p lanning w ith content specifically ad dressin g climate adaptation and re silience 501-1,000 2 4 6 33% 67% Engaged in water p lanning w ith content specifically ad dressin g climate adaptation and re silience over 1,000 5 6 11 45% 55% Engaged in water p lanning w ith content specifically ad dressin g climate adaptation and re silience Total 196 133 329 60% 40% Engaged in natura l resource s plannin g with content specifica lly addre ssing c limate adaptation and resilience 0-10 141 41 182 77% 23% Engaged in natura l resource s plannin g with content specifica lly addre ssing c limate adaptation and resilience 11-50 46 11 57 81% 19% Engaged in natura l resource s plannin g with content specifica lly addre ssing c limate adaptation and resilience 51-200 29 8 37 78% 22% Engaged in natura l resource s plannin g with content specifica lly addre ssing c limate adaptation and resilience 201-500 8 9 17 47% 53% Engaged in natura l resource s plannin g with content specifica lly addre ssing c limate adaptation and resilience 501-1,000 3 3 6 50% 50% Engaged in natura l resource s plannin g with content specifica lly addre ssing c limate adaptation and resilience over 1,000 6 5 11 55% 45% Engaged in natura l resource s plannin g with content specifica lly addre ssing c limate adaptation and resilience Total 250 79 329 76% 24% Engaged in an y addit iona l plannin g with content specifica lly addre ssing c limate adaptation and resilience 0-10 147 35 182 81% 19% Engaged in an y addit iona l plannin g with content specifica lly addre ssing c limate adaptation and resilience 11-50 49 8 57 86% 14% Engaged in an y addit iona l plannin g with content specifica lly addre ssing c limate adaptation and resilience 51-200 26 11 37 70% 30% Engaged in an y addit iona l plannin g with content specifica lly addre ssing c limate adaptation and resilience 201-500 12 5 17 71% 29% Engaged in an y addit iona l plannin g with content specifica lly addre ssing c limate adaptation and resilience 501-1,000 3 3 6 50% 50% Engaged in an y addit iona l plannin g with content specifica lly addre ssing c limate adaptation and resilience over 1,000 5 6 11 45% 55% Engaged in an y addit iona l plannin g with content specifica lly addre ssing c limate adaptation and resilience Total 259 70 329 79% 21% Engaged in an y type of relevant plannin g activit y (resp ondents who selected plan s or plann ing effort s in an y category) 0-10 82 100 182 45% 55% Engaged in an y type of relevant plannin g activit y (resp ondents who selected plan s or plann ing effort s in an y category) 11-50 29 28 57 51% 49% Engaged in an y type of relevant plannin g activit y (resp ondents who selected plan s or plann ing effort s in an y category) 51-200 15 22 37 41% 59% Engaged in an y type of relevant plannin g activit y (resp ondents who selected plan s or plann ing effort s in an y category) 201-500 4 13 17 24% 76% Engaged in an y type of relevant plannin g activit y (resp ondents who selected plan s or plann ing effort s in an y category) 501-1,000 0 6 6 0% 100% Engaged in an y type of relevant plannin g activit y (resp ondents who selected plan s or plann ing effort s in an y category) over 1,000 2 9 11 18% 82% Engaged in an y type of relevant plannin g activit y (resp ondents who selected plan s or plann ing effort s in an y category) Total 140 189 329 43% 57%
Engaged in any additional planning with content specifically addressing climate adaptation and resilience
none one or more Total none one or more0-10 147 35 182 0-10 81% 19%11-50 49 8 57 11-50 86% 14%51-200 26 11 37 51-200 70% 30%201-500 12 5 17 201-500 71% 29%501-1,000 3 3 6 501-1,000 50% 50%over 1,000 5 6 11 over 1,000 45% 55%Total 259 70 329 Total 79% 21%
Engaged in any type of relevant planning activity (respondents who selected plans or planning efforts in any category)
none one or more Total none one or more0-10 82 100 182 0-10 45% 55%11-50 29 28 57 11-50 51% 49%51-200 15 22 37 51-200 41% 59%201-500 4 13 17 201-500 24% 76%501-1,000 0 6 6 501-1,000 0% 100%over 1,000 2 9 11 over 1,000 18% 82%Total 140 189 329 Total 43% 57%
81%
86%
70%
71%
50%
45%
79%
19%
14%
30%
29%
50%
55%
21%
0-10
11-50
51-200
201-500
501-1,000
over 1,000
Total
none one or more
45%
51%
41%
24%
18%
43%
55%
49%
59%
76%
100%
82%
57%
0-10
11-50
51-200
201-500
501-1,000
over 1,000
Total
none one or more

51
Appendix F. Survey Results: Cities by Size and Region
Cities: Types of Planning Activity by Number of Employees in Organization190 respondents in data set
Experienced any event or trend connected to climate change
Number of employees in your organization
0-10 11-50 51-200 201-500 501-1,000over 1,000 Total
25% 24% 22% - - - 24%75% 76% 78% 100% - 100% 76%117 50 18 4 - 1 190
Engaged in stand-alone planning activity specifically to address climate adaptation and resilience
Number of employees in organization
0-10 11-50 51-200 201-500 501-1,000over 1,000 Total
3% 2% 17% 25% - 100% 5%97% 98% 83% 75% - - 95%117 50 18 4 - 1 190
None (145)One or more (45)
Has plan (9)Does not have (181)
Total
Total
97%
98%
83%
75%
95%
3%
2%
17%
25%
100%
5%
0-10
11-50
51-200
201-500
501-1,000
over…
Total
Does not have (181) Has plan (9)
25%
24%
22%
24%
75%
76%
78%
100%
100%
76%
0-10
11-50
51-200
201-500
501-1,000
over…
Total
None (145) One or more (45)
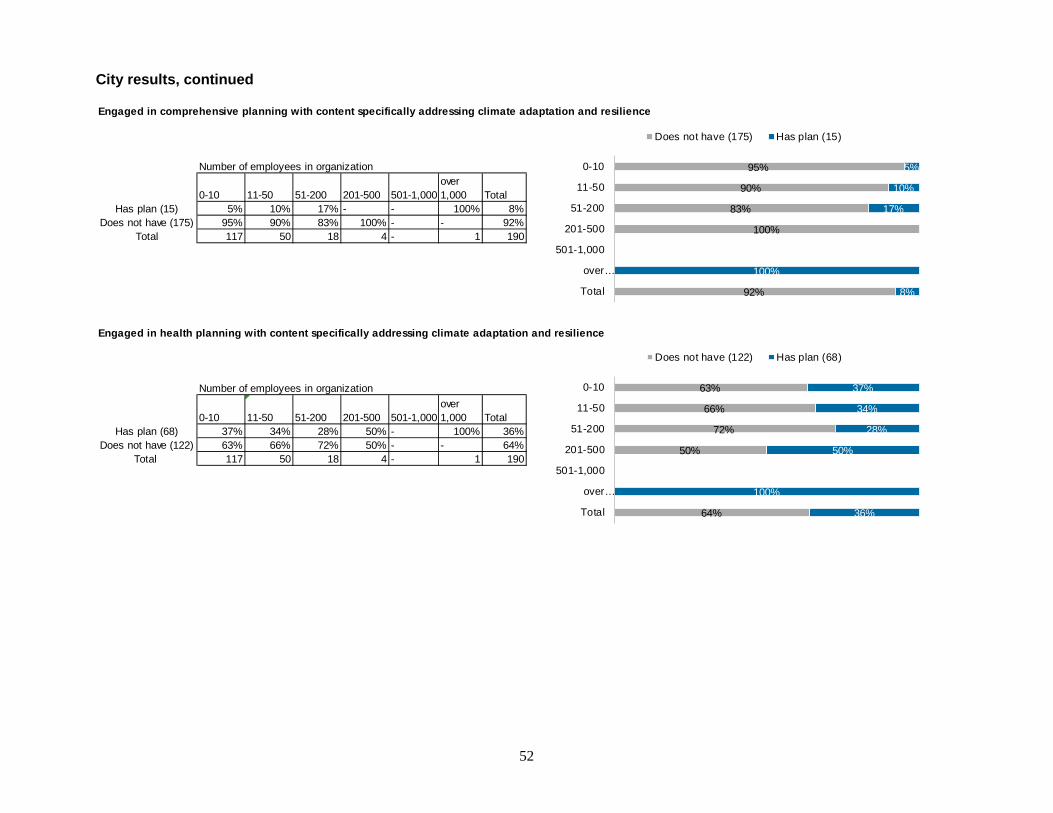
52
City results, continued
Engaged in comprehensive planning with content specifically addressing climate adaptation and resilience
Number of employees in organization
0-10 11-50 51-200 201-500 501-1,000over 1,000 Total
5% 10% 17% - - 100% 8%95% 90% 83% 100% - - 92%117 50 18 4 - 1 190
Engaged in health planning with content specifically addressing climate adaptation and resilience
Number of employees in organization
0-10 11-50 51-200 201-500 501-1,000over 1,000 Total
37% 34% 28% 50% - 100% 36%63% 66% 72% 50% - - 64%117 50 18 4 - 1 190
Total
Has plan (15)Does not have (175)
Has plan (68)Does not have (122)
Total
95%
90%
83%
100%
92%
5%
10%
17%
100%
8%
0-10
11-50
51-200
201-500
501-1,000
over…
Total
Does not have (175) Has plan (15)
63%
66%
72%
50%
64%
37%
34%
28%
50%
100%
36%
0-10
11-50
51-200
201-500
501-1,000
over…
Total
Does not have (122) Has plan (68)
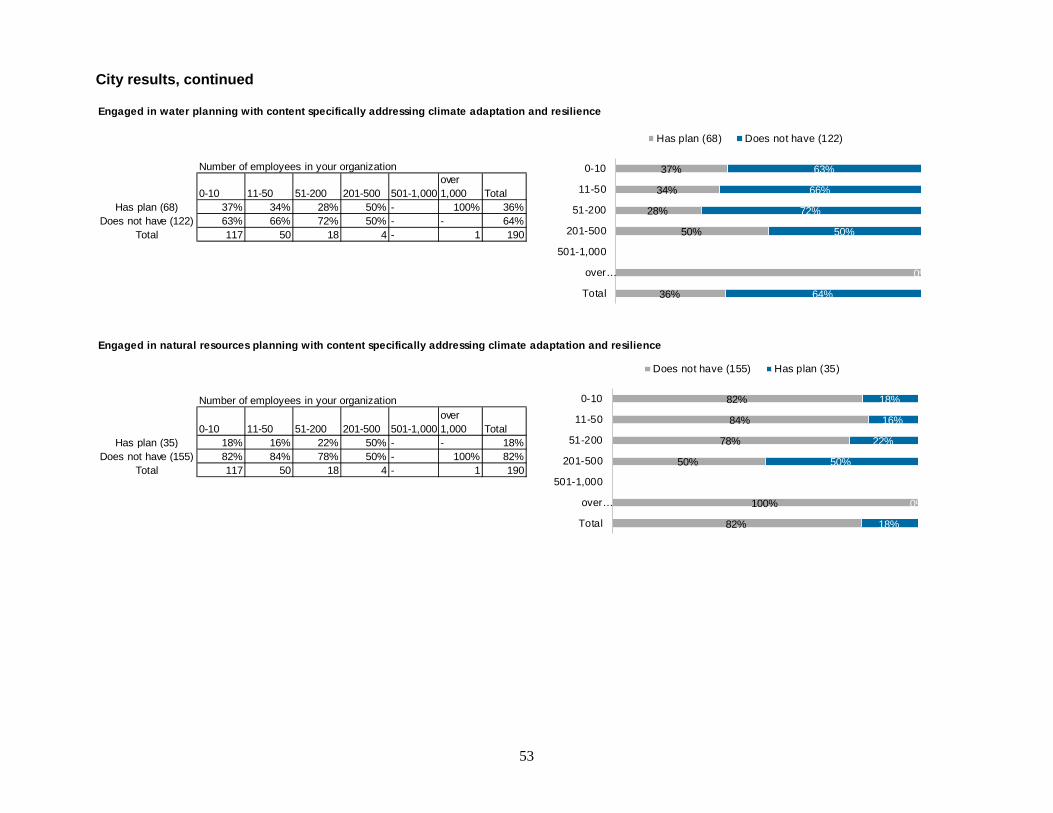
53
City results, continued
Engaged in water planning with content specifically addressing climate adaptation and resilience
Number of employees in your organization
0-10 11-50 51-200 201-500 501-1,000over 1,000 Total
37% 34% 28% 50% - 100% 36%63% 66% 72% 50% - - 64%117 50 18 4 - 1 190
Engaged in natural resources planning with content specifically addressing climate adaptation and resilience
Number of employees in your organization
0-10 11-50 51-200 201-500 501-1,000over 1,000 Total
18% 16% 22% 50% - - 18%82% 84% 78% 50% - 100% 82%117 50 18 4 - 1 190
Has plan (68)Does not have (122)
Total
Has plan (35)Does not have (155)
Total
37%
34%
28%
50%
36%
63%
66%
72%
50%
0%
64%
0-10
11-50
51-200
201-500
501-1,000
over…
Total
Has plan (68) Does not have (122)
82%
84%
78%
50%
100%
82%
18%
16%
22%
50%
0%
18%
0-10
11-50
51-200
201-500
501-1,000
over…
Total
Does not have (155) Has plan (35)
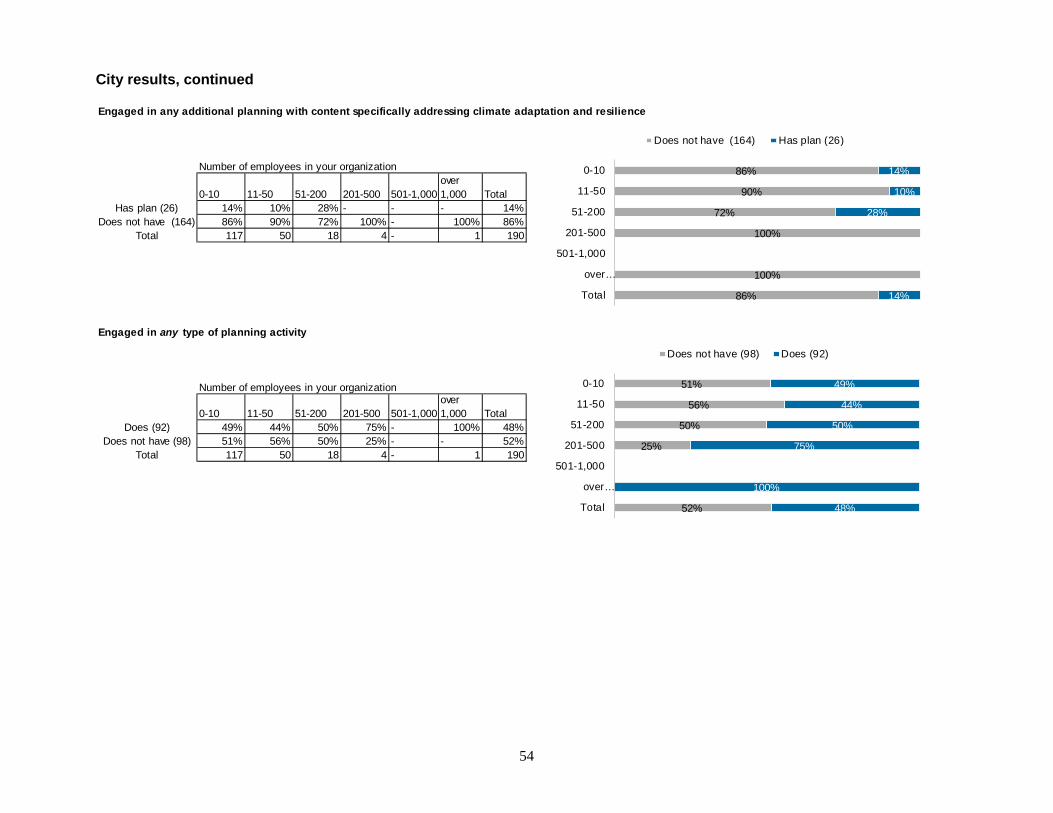
54
City results, continued
Resp onse Detail or p lan status 0-10 11-50 51-200 201-500 501-1,000 over 1,000 Total Experienced any event or trend connected to climate change One or more (45) 25% 24% 22% - - - 24% Experienced any event or trend connected to climate change None (145) 75% 76% 78% 100% - 100% 76% Experienced any event or trend connected to climate change Total 117 50 18 4 - 1 190 Engaged in stand-a lone p lanning activity specifically t o addre ss c limate adaptation and resilience Has plan (9) 3% 2% 17% 25% - 100% 5% Engaged in stand-a lone p lanning activity specifically t o addre ss c limate adaptation and resilience Doe s not have (181) 97% 98% 83% 75% - - 95% Engaged in stand-a lone p lanning activity specifically t o addre ss c limate adaptation and resilience Total 117 50 18 4 - 1 190 Engaged in comprehensive p lanning with content specifically addressin g climate adaptation and re silience Has plan (15) 5% 10% 17% - - 100% 8% Engaged in comprehensive p lanning with content specifically addressin g climate adaptation and re silience Doe s not have (175) 95% 90% 83% 100% - - 92% Engaged in comprehensive p lanning with content specifically addressin g climate adaptation and re silience Total 117 50 18 4 - 1 190 Engaged in health planning w ith content specifically add ressin g climate adaptation and re silience Has plan (68) 37% 34% 28% 50% - 100% 36% Engaged in health planning w ith content specifically add ressin g climate adaptation and re silience Doe s not have (122) 63% 66% 72% 50% - - 64% Engaged in health planning w ith content specifically add ressin g climate adaptation and re silience Total 117 50 18 4 - 1 190 Engaged in water p lanning w ith content specifically ad dressin g climate adaptation and re silience Has plan (68) 37% 34% 28% 50% - 100% 36% Engaged in water p lanning w ith content specifically ad dressin g climate adaptation and re silience Doe s not have (122) 63% 66% 72% 50% - - 64% Engaged in water p lanning w ith content specifically ad dressin g climate adaptation and re silience Total 117 50 18 4 - 1 190 Engaged in natura l resource s plannin g with content specifica lly addre ssing c limate adaptation and resilience Has plan (35) 18% 16% 22% 50% - - 18% Engaged in natura l resource s plannin g with content specifica lly addre ssing c limate adaptation and resilience Doe s not have (155) 82% 84% 78% 50% - 100% 82% Engaged in natura l resource s plannin g with content specifica lly addre ssing c limate adaptation and resilience Total 117 50 18 4 - 1 190 Engaged in an y addit iona l plannin g with content specifica lly addre ssing c limate adaptation and resilience Has plan (26) 14% 10% 28% - - - 14% Engaged in an y addit iona l plannin g with content specifica lly addre ssing c limate adaptation and resilience Doe s not have (164) 86% 90% 72% 100% - 100% 86% Engaged in an y addit iona l plannin g with content specifica lly addre ssing c limate adaptation and resilience Total 117 50 18 4 - 1 190 Engaged in an y type of plannin g activity Doe s (92) 49% 44% 50% 75% - 100% 48% Engaged in an y type of plannin g activity Doe s not have (98) 51% 56% 50% 25% - - 52% Engaged in an y type of plannin g activity Total 117 50 18 4 - 1 190
Engaged in any additional planning with content specifically addressing climate adaptation and resilience
Number of employees in your organization
0-10 11-50 51-200 201-500 501-1,000over 1,000 Total
14% 10% 28% - - - 14%86% 90% 72% 100% - 100% 86%117 50 18 4 - 1 190
Engaged in any type of planning activity
Number of employees in your organization
0-10 11-50 51-200 201-500 501-1,000over 1,000 Total
49% 44% 50% 75% - 100% 48%51% 56% 50% 25% - - 52%117 50 18 4 - 1 190
Does not have (164)Has plan (26)
Total
Does (92)Does not have (98)
Total
86%
90%
72%
100%
100%
86%
14%
10%
28%
14%
0-10
11-50
51-200
201-500
501-1,000
over…
Total
Does not have (164) Has plan (26)
51%
56%
50%
25%
52%
49%
44%
50%
75%
100%
48%
0-10
11-50
51-200
201-500
501-1,000
over…
Total
Does not have (98) Does (92)

55
Cities: Types of Planning Activity by Region192 respondents in data set
Experienced any event or trend connected to climate change
RegionNW NE Metro Central SE SW Total
60% 69% 94% 69% 93% 76% 77%40% 31% 6% 31% 7% 24% 23%
Total 30 13 33 51 28 38 192
Engaged in stand-alone planning activity specifically to address climate adapation and resilience
RegionNW NE Metro Central SE SW Total- 8% 12% 2% 11% - 5%
100% 92% 88% 98% 89% 100% 95%30 13 33 51 28 38 192
One or more (147)None (45)
Has plan (9)Does not have (183)
Total
40%
31%
6%
31%
7%
24%
23%
60%
69%
94%
69%
93%
76%
77%
NW
NE
Metro
Central
SE
SW
Total
None (45) One or more (147)
100%
92%
88%
98%
89%
100%
95%
0%
8%
12%
2%
11%
0%
5%
NW
NE
Metro
Central
SE
SW
Total
Does not have (183) Has plan (9)

56
City results, continued
Engaged in comprehensive planning with content specifically addressing climate adaptation and resilience
RegionNW NE Metro Central SE SW Total- 8% 24% 8% 7% - 7%
100% 92% 76% 92% 93% 100% 93%30 13 33 51 28 38 192
Engaged in health planning with content specifically addressing climate adaptation and resilience
RegionNW NE Metro Central SE SW Total
27% 46% 46% 43% 39% 21% 35%73% 54% 55% 57% 61% 79% 65%
30 13 33 51 28 38 192
Total
Has plan (67)Does not have (125)
Total
Has plan (14)Does not have (178)
100%
92%
76%
92%
93%
100%
93%
0%
8%
24%
8%
7%
0%
7%
NW
NE
Metro
Central
SE
SW
Total
Does not have (178) Has plan (14)
73%
54%
55%
57%
61%
79%
65%
27%
46%
46%
43%
39%
21%
35%
NW
NE
Metro
Central
SE
SW
Total
Does not have (125) Has plan (67)

57
City results, continued
Engaged in water planning with content specifically addressing climate adaptation and resilience
RegionNW NE Metro Central SE SW Total
33% 39% 49% 41% 36% 26% 36%67% 62% 52% 59% 64% 74% 64%
30 13 33 51 28 38 192
Engaged in natural resources planning with content specifically addressing climate adaptation and resilience
RegionNW NE Metro Central SE SW Total
23% 8% 30% 20% 21% 5% 18%77% 92% 70% 80% 79% 95% 82%
30 13 33 51 28 38 192Total
Has plan (69)Does not have (123)
Total
Has plan (34)Does not have (158)
67%
62%
52%
59%
64%
74%
64%
33%
39%
49%
41%
36%
26%
36%
NW
NE
Metro
Central
SE
SW
Total
Does not have (123) Has plan (69)
77%
92%
70%
80%
79%
95%
82%
23%
8%
30%
20%
21%
5%
18%
NW
NE
Metro
Central
SE
SW
Total
Does not have (158) Has plan (34)

58
City results, continued
Response Detail or plan status NW NE Metro Central SE SW Total Experienced any event or trend connected to climate change One or more (147) 60% 69% 94% 69% 93% 76% 77% Experienced any event or trend connected to climate change None ( 45) 40% 31% 6% 31% 7% 24% 23% Experienced any event or trend connected to climate change Total 30 13 33 51 28 38 192 Engaged in stand- alone p lanning activit y specifically to address climat e adaptation and resilience Has plan (9) - 8% 12% 2% 11% - 5% Engaged in stand- alone p lanning activit y specifically to address climat e adaptation and resilience Does not have ( 183) 100% 92% 88% 98% 89% 100% 95% Engaged in stand- alone p lanning activit y specifically to address climat e adaptation and resilience Total 30 13 33 51 28 38 192 Engaged in comprehensive planning with content specif ically addressing climat e adaptation and resilience Has plan (14) - 8% 24% 8% 7% - 7% Engaged in comprehensive planning with content specif ically addressing climat e adaptation and resilience Does not have ( 178) 100% 92% 76% 92% 93% 100% 93% Engaged in comprehensive planning with content specif ically addressing climat e adaptation and resilience Total 30 13 33 51 28 38 192 Engaged in health plann ing with content specifically addressing climate adaptat ion and resil ience Has plan (67) 27% 46% 46% 43% 39% 21% 35% Engaged in health plann ing with content specifically addressing climate adaptat ion and resil ience Does not have ( 125) 73% 54% 55% 57% 61% 79% 65% Engaged in health plann ing with content specifically addressing climate adaptat ion and resil ience Total 30 13 33 51 28 38 192 Engaged in wat er p lanning with cont ent specifically addressing climate adapt ation and resilience Has plan (69) 33% 39% 49% 41% 36% 26% 36% Engaged in wat er p lanning with cont ent specifically addressing climate adapt ation and resilience Does not have ( 123) 67% 62% 52% 59% 64% 74% 64% Engaged in wat er p lanning with cont ent specifically addressing climate adapt ation and resilience Total 30 13 33 51 28 38 192 Engaged in natural resources planning with cont ent specifically addressing climat e adapt ation and resilience Has plan (34) 23% 8% 30% 20% 21% 5% 18% Engaged in natural resources planning with cont ent specifically addressing climat e adapt ation and resilience Does not have ( 158) 77% 92% 70% 80% 79% 95% 82% Engaged in natural resources planning with cont ent specifically addressing climat e adapt ation and resilience Total 30 13 33 51 28 38 192 Engaged in any additional planning with cont ent specifically addressing climat e adaptation and resilience Has plan (25) 7% 8% 24% 10% 25% 8% 13% Engaged in any additional planning with cont ent specifically addressing climat e adaptation and resilience Does not have ( 167) 93% 92% 76% 90% 75% 92% 87% Engaged in any additional planning with cont ent specifically addressing climat e adaptation and resilience Total 30 13 33 51 28 38 192 Engaged in any t ype of relev ant planning activit y (respondent s who selected plans or p lanning efforts in any cat egory) Has plan (93) 37% 62% 67% 59% 46% 32% 48% Engaged in any t ype of relev ant planning activit y (respondent s who selected plans or p lanning efforts in any cat egory) Does not have ( 99) 63% 39% 33% 41% 54% 68% 52% Engaged in any t ype of relev ant planning activit y (respondent s who selected plans or p lanning efforts in any cat egory) Total 30 13 33 51 28 38 192
Engaged in any additional planning with content specifically addressing climate adaptation and resilience
RegionNW NE Metro Central SE SW Total
7% 8% 24% 10% 25% 8% 13%93% 92% 76% 90% 75% 92% 87%
30 13 33 51 28 38 192
Engaged in any type of relevant planning activity (respondents who selected plans or planning efforts in any category)
RegionNW NE Metro Central SE SW Total
37% 62% 67% 59% 46% 32% 48%63% 39% 33% 41% 54% 68% 52%
Total 30 13 33 51 28 38 192Does not have (99)
Has plan (25)Does not have (167)
Total
Has plan (93)
93%
92%
76%
90%
75%
92%
87%
7%
8%
24%
10%
25%
8%
13%
NW
NE
Metro
Central
SE
SW
Total
Does not have (167) Has plan (25)
63%
39%
33%
41%
54%
68%
52%
37%
62%
67%
59%
46%
32%
48%
NW
NE
Metro
Central
SE
SW
Total
Does not have (99) Has plan (93)
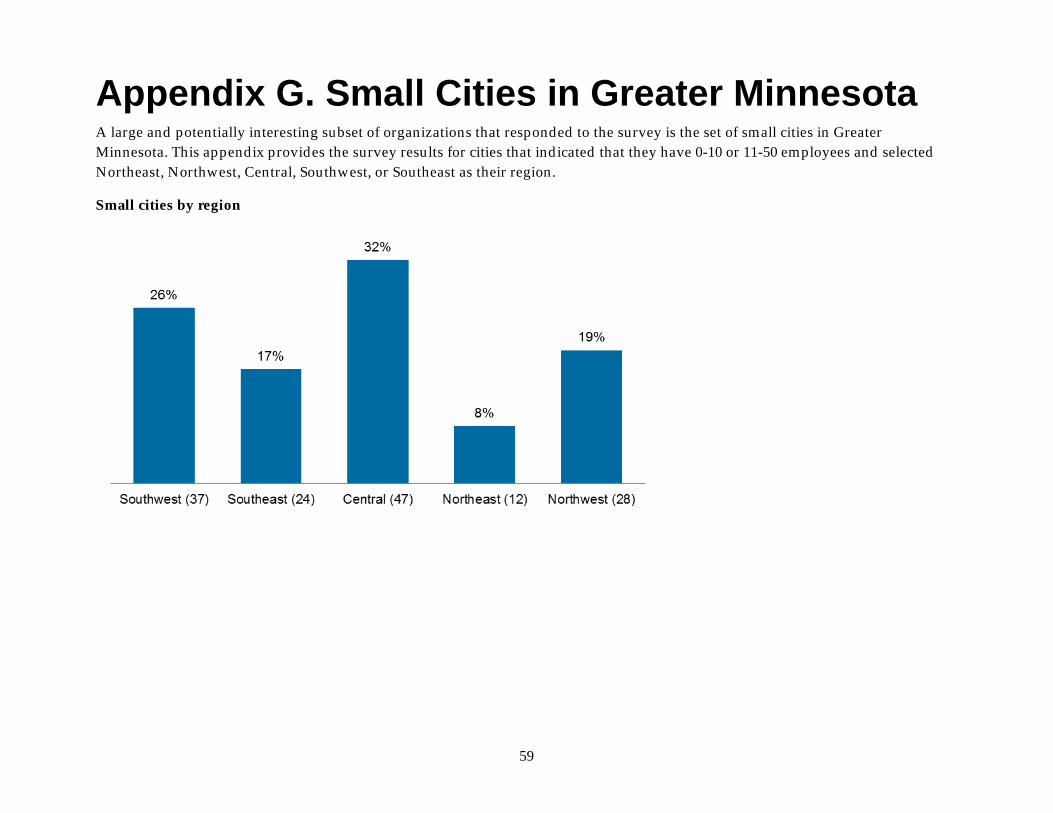
59
Appendix G. Small Cities in Greater Minnesota A large and potentially interesting subset of organizations that responded to the survey is the set of small cities in Greater Minnesota. This appendix provides the survey results for cities that indicated that they have 0-10 or 11-50 employees and selected Northeast, Northwest, Central, Southwest, or Southeast as their region.
Small cities by region
Northwest (28) 19% Northeast (12) 8% Central (47 ) 32% Southeast (24) 17% Southwest (37) 26%

60
Overview: Small cities planning efforts by type of plan (n=145)
type
Has Does not have
Standalone pla nning a ctivity with relevant content 2% 98% Comprehe nsive Plan with relevant conte nt in place or in process 3% 97% Relevant health and safety plans or pla nning e ffort 34% 66% Relevant water plans or planni ng effort 34% 66% Relevant natural resource s plans or planning effort 15% 85% Additional types of plans or planning e fforts 10% 90% Any type of relevant plan or planni ng effort 46% 55%
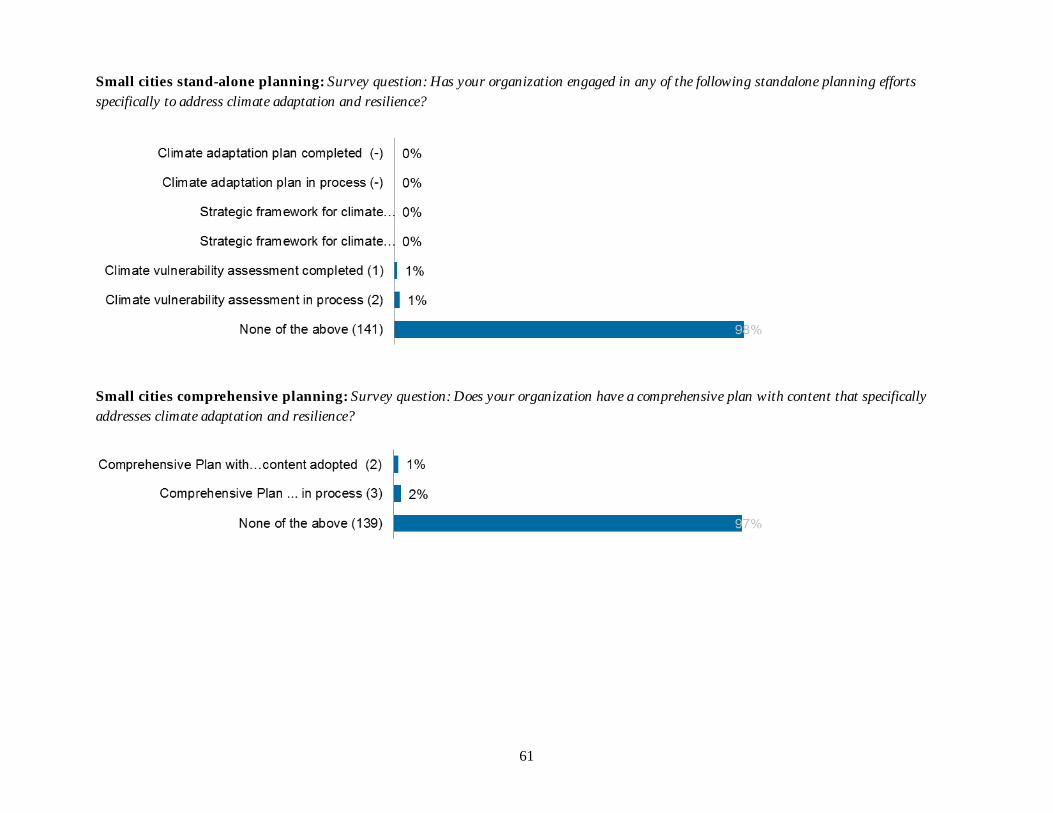
61
Small cities stand-alone planning: Survey question: Has your organization engaged in any of the following standalone planning efforts specifically to address climate adaptation and resilience?
Response (number of response s) % Climate adaptation plan complete d (-) - Climate adaptation plan in process (-) - Strategic framework for cli mate adaptation/resilience completed (-) - Strategic framework for cli mate adaptation/resilience in pr oce ss (-) - Climate vulnera bility assessment completed (1) 1% Climate vulnera bility assessment in pr oce ss (2 ) 1% None of the a bove (141) 98%
Small cities comprehensive planning: Survey question: Does your organization have a comprehensive plan with content that specifically addresses climate adaptation and resilience?
Response (number of response s) % Comprehe nsive Plan with… conte nt adopte d (2 ) 1% Comprehe nsive Plan .. . in process (3 ) 2% None of the a bove (139) 97%
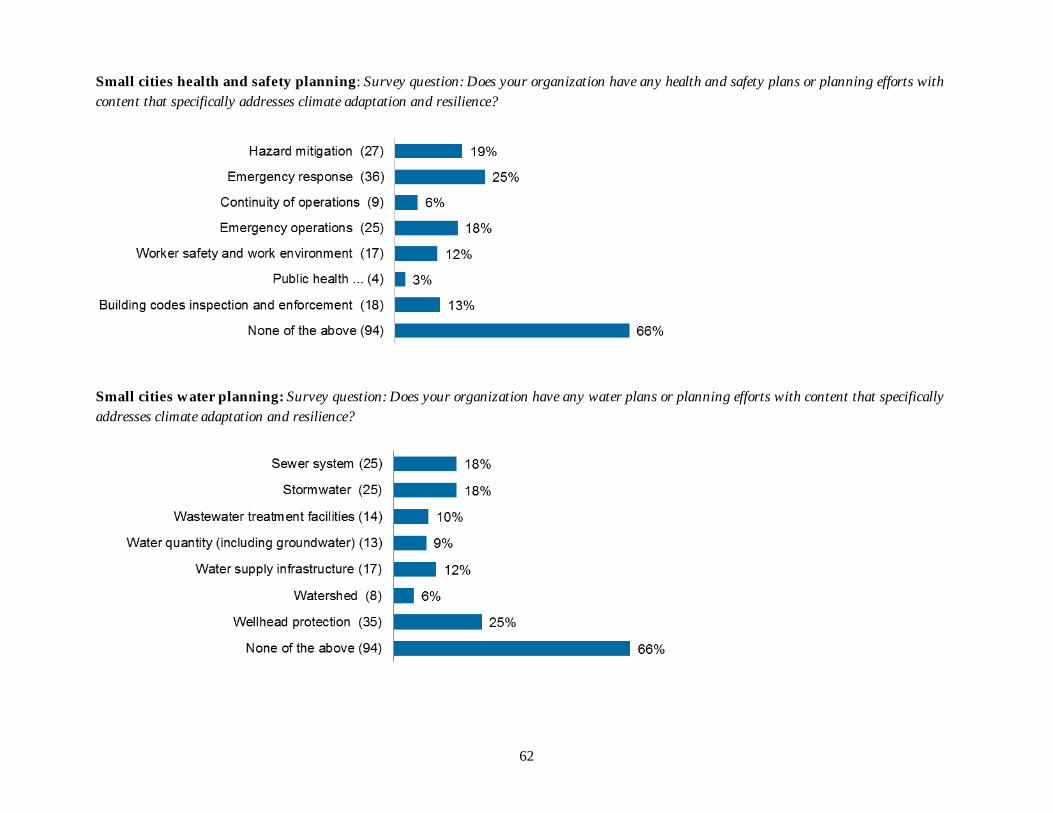
62
Small cities health and safety planning: Survey question: Does your organization have any health and safety plans or planning efforts with content that specifically addresses climate adaptation and resilience?
Response (number of response s) % Hazard mitigation (27 ) 19% Emergency response (36 ) 25% Continuity of operations (9) 6% Emergency operations (2 5) 18% Worker safety and work environment (17 ) 12% Public health ... (4) 3% Building codes inspecti on and enforce me nt (18 ) 13% None of the a bove (94) 66%
Small cities water planning: Survey question: Does your organization have any water plans or planning efforts with content that specifically addresses climate adaptation and resilience?
Response (number of response s) % Sewer system (2 5) 18% Stormwater (25 ) 18% Wastewater treatment fa cilities (1 4) 10% Water quantity (includi ng groundwater) (13 ) 9% Water supply infrastructure (17) 12% Watershed (8) 6% Wellhead protection (3 5) 25% None of the a bove (94) 66%

63
Small cities natural resources planning: Survey question: Does your organization have any natural resources plans or planning efforts with content that specifically addresses climate adaptation and resilience?
Response (number of response s) % Parks and park fa cilities (19 ) 13% Open/green space (excluding parks ) (6 ) 4% Forest manage ment (-) - Invasive spe cies (5 ) 4% Urban and community forestry (2 ) 1% None of the a bove (121) 85%
Small cities additional planning efforts: Survey question: Has your organization engaged in any additional planning efforts with content that specifically addresses climate adaptation and resilience?
Response (number of response s) % Capital budg et (4) 3% Economi c development (5 ) 4% Facilities and grounds (excluding parks... ) (1) 1% Land use (9 ) 6% Solid waste (1 ) 1% Hazardous waste (2 ) 1% Constr uction & demolition waste (3) 2% Transportation/roads (4 ) 3% Workfor ce pla nning and development (3 ) 2% Strategic planning (4) 3% None of the a bove (128) 90%
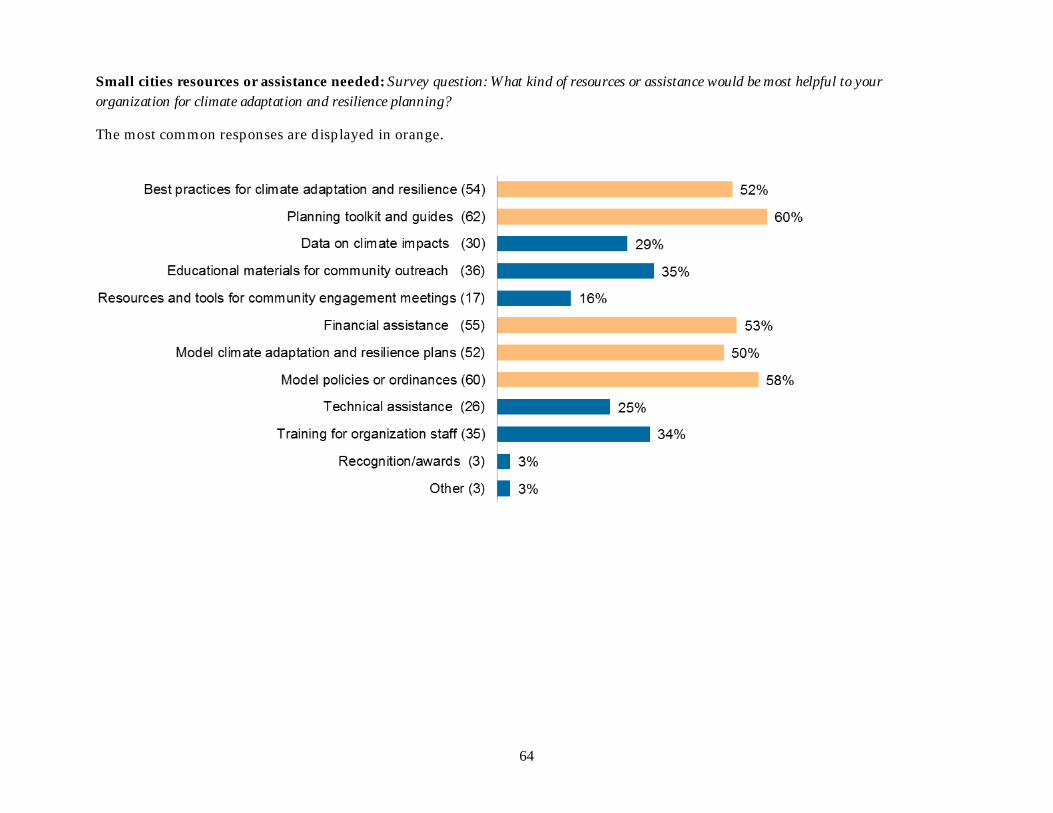
64
Small cities resources or assistance needed: Survey question: What kind of resources or assistance would be most helpful to your organization for climate adaptation and resilience planning?
The most common responses are displayed in orange.
Response (number of response s) % Best practi ces for cli mate adaptation a nd resilie nce (54 ) 52% Planning toolkit and guide s (62 ) 60% Data on climate i mpa cts (30 ) 29% Educational materials for community outreach (36 ) 35% Resource s and tools for community engage ment meetings (17 ) 16% Financial assista nce (55) 53% Model cli mate adaptation and resilie nce plans (52 ) 50% Model policies or ordina nce s (60 ) 58% Techni cal assista nce (26 ) 25% Training for orga nization sta ff (35 ) 34% Recognition/awards (3) 3% Other (3 ) 3%
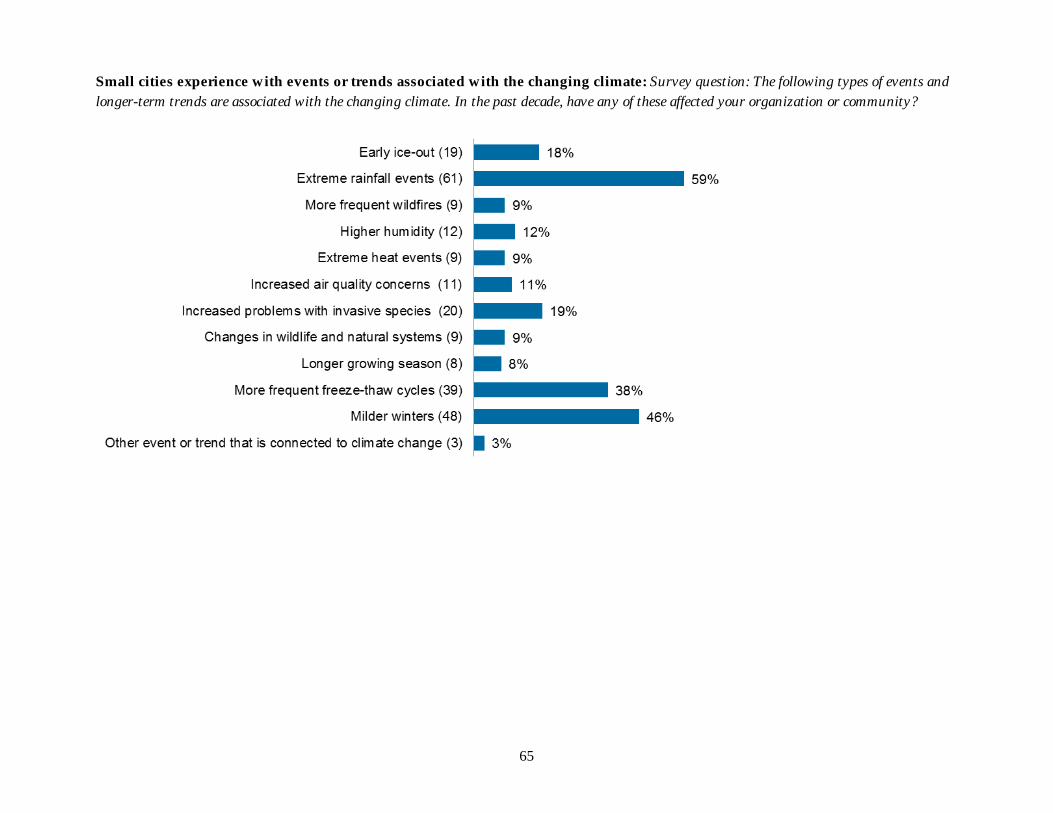
65
Small cities experience with events or trends associated with the changing climate: Survey question: The following types of events and longer-term trends are associated with the changing climate. In the past decade, have any of these affected your organization or community?
Response (number) % Early ice-out (19 ) 18% Extreme rainfall events (61 ) 59% More frequent wildfires (9) 9% Higher humidity (12 ) 12% Extreme heat events (9) 9% Increase d air quality concer ns (1 1) 11% Increase d problems with invasive spe cies (20) 19% Change s in wildlife a nd natural syste ms (9) 9% Longer growi ng season (8 ) 8% More frequent freeze -thaw cy cles (39) 38% Milder winters (48 ) 46% Other event or trend that is conne cted to cli mate change (3) 3%
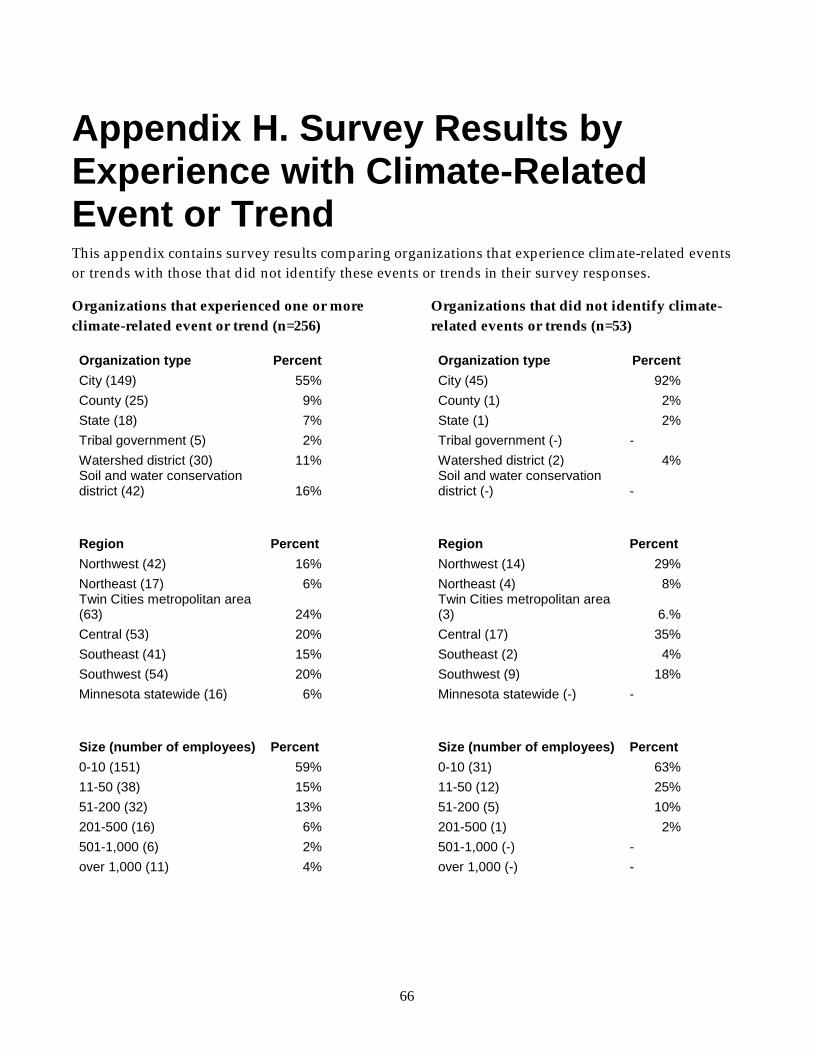
66
Appendix H. Survey Results by Experience with Climate-Related Event or Trend This appendix contains survey results comparing organizations that experience climate-related events or trends with those that did not identify these events or trends in their survey responses.
Organizations that experienced one or more climate-related event or trend (n=256)
Organization type Percent City (149) 55% County (25) 9% State (18) 7% Tribal government (5) 2% Watershed district (30) 11% Soil and water conservation district (42) 16%
Region Percent Northwest (42) 16% Northeast (17) 6% Twin Cities metropolitan area (63) 24% Central (53) 20% Southeast (41) 15% Southwest (54) 20% Minnesota statewide (16) 6%
Size (number of employees) Percent 0-10 (151) 59% 11-50 (38) 15% 51-200 (32) 13% 201-500 (16) 6% 501-1,000 (6) 2% over 1,000 (11) 4%
Organizations that did not identify climate-related events or trends (n=53)
Organization type Percent City (45) 92% County (1) 2% State (1) 2% Tribal government (-) - Watershed district (2) 4% Soil and water conservation district (-) -
Region Percent Northwest (14) 29% Northeast (4) 8% Twin Cities metropolitan area (3) 6.% Central (17) 35% Southeast (2) 4% Southwest (9) 18% Minnesota statewide (-) -
Size (number of employees) Percent 0-10 (31) 63% 11-50 (12) 25% 51-200 (5) 10% 201-500 (1) 2% 501-1,000 (-) - over 1,000 (-) -

67
Type of p lan or plannin g activity Orgs that experienced an event or trend– d oes n ot have this type of plan Orgs that experienced an event of trend– has this type of plan Orgs that did n ot identify an event or trend– d oes n ot have this type of plan Orgs that did n ot identify an event or trend– has this t ype of p lan Engaged in an y standa lone p lanning activity with re levant content 87% 13% 100% - Has a comprehensive plan with re levant content in place or in proce ss 83% 17% 100% - Has relevant health and safety p lans or p lanning eff orts 59% 41% 89% 11% Has relevant water p lans or p lanning eff ort 55% 45% 83% 17% Has relevant natura l resource s plan s or plannin g effort s 73% 28% 94% 6% Has relevant add itiona l plans or planning efforts 75% 25% 100% - Organizations w ith any t ype of re levant plans or p lanning efforts 36% 64% 77% 23%