climate
33
CLIMATE Basic Climatology Oklahoma Climatological Survey Funding provided by NOAA Sectoral Applications Research Project
description
Funding provided by NOAA Sectoral Applications Research Project. climate. Basic Climat ology Oklahoma Climatological Survey. Remember These?. Factor 1: Our Energy Source Factor 2: Revolution & Tilt Factor 3: Rotation! Factor 4: Latitude Factor 5: Altitude - PowerPoint PPT Presentation
Transcript of climate

CLIMATEBasic ClimatologyOklahoma Climatological Survey
Funding provided by NOAASectoral Applications Research Project
Remember These? Factor 1: Our Energy Source Factor 2: Revolution & Tilt Factor 3: Rotation! Factor 4: Latitude Factor 5: Altitude Factor 6: Land & Water are Different

The Influence of Water
Average January / July temperatures for three cities at latitude 35N:Location Januar
yJuly Differe
nceSanta Monica, CA
51.6 63.5
11.9
Oklahoma City, OK
36.7 82.0
45.3
Hatteras, NC 46.1 79.2
33.1

Factors that Influence Climate Which side of the ocean you’re on!
The winds help stir ocean currents. Generally, western shores get cold water from the poles, eastern shores get warm from the equator.

Climate Zones


Limitations to “Naming” Climates
Implies sharp boundary between climate zones in reality there is a gradual transition
(Oklahoma is a great example!) Relates too strongly to vegetation
useful in areas with little climate data, but it is better to use temp/precip measurements
Some of the groups (esp. Moist subtropical mid-latitude) are very broad, including what appear to be very different climate types

A WORD ABOUT NORMALS

What is Normal? A tool helpful when comparing
conditions to the long term A 30-year average Updated every 10 years There are normals for:
Days, months and years Temperature, rainfall, snowfall, and more!

September Rainfall: OKC1971 4.25” 1976 1.53” 1981 1.48” 1986 9.54” 1991 11.85” 1996 5.88”
1972 2.05” 1977 1.21” 1982 2.86” 1987 4.58” 1992 2.92” 1997 1.38”
1973 8.00” 1978 0.96” 1983 0.90” 1988 5.19” 1993 7.17” 1998 4.39”
1974 6.24” 1979 0.72” 1984 1.02” 1989 4.51” 1994 2.15” 1999 4.88”
1975 1.92” 1980 2.21” 1985 4.59” 1990 7.35” 1995 6.05” 2000 1.73”
The average of all these numbers is 3.98” – the normal September rainfall at Oklahoma City.
The 1st Dirty Secret of Normals:Normals only tell you the average for a particular month, day or year.
They don’t tell you anything about natural variability!

All Normals Work the Same Way Oklahoma City’s …
Normal September Rainfall: 3.98” Normal September Temperature: 73.2
degrees Normal September 26th High: 81 degrees Normal “First Freeze of Fall”: November 4
All of these are based on 30 numbers recorded between 1971-2000!
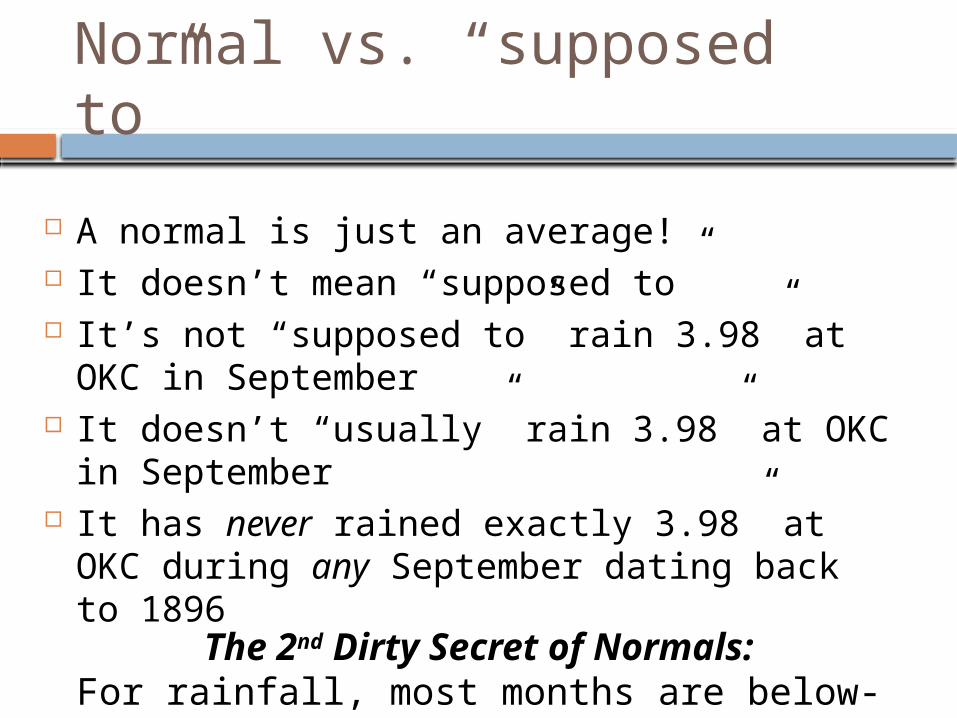
Normal vs. “supposed to”
A normal is just an average! It doesn’t mean “supposed to” It’s not “supposed to” rain 3.98” at OKC in
September It doesn’t “usually” rain 3.98” at OKC in
September It has never rained exactly 3.98” at OKC
during any September dating back to 1896The 2nd Dirty Secret of Normals:
For rainfall, most months are below-normal!

Normal vs. “Supposed To” From 1971-2000, the average OU-OSU
score was OU 31, OSU 14. This doesn’t mean OU is “supposed to” win
31-14 each following year. OU never won 31-14! In 2001, OSU won 16-13. Each year’s score (individual event) was
decided by factors other than the 30-year “normal”
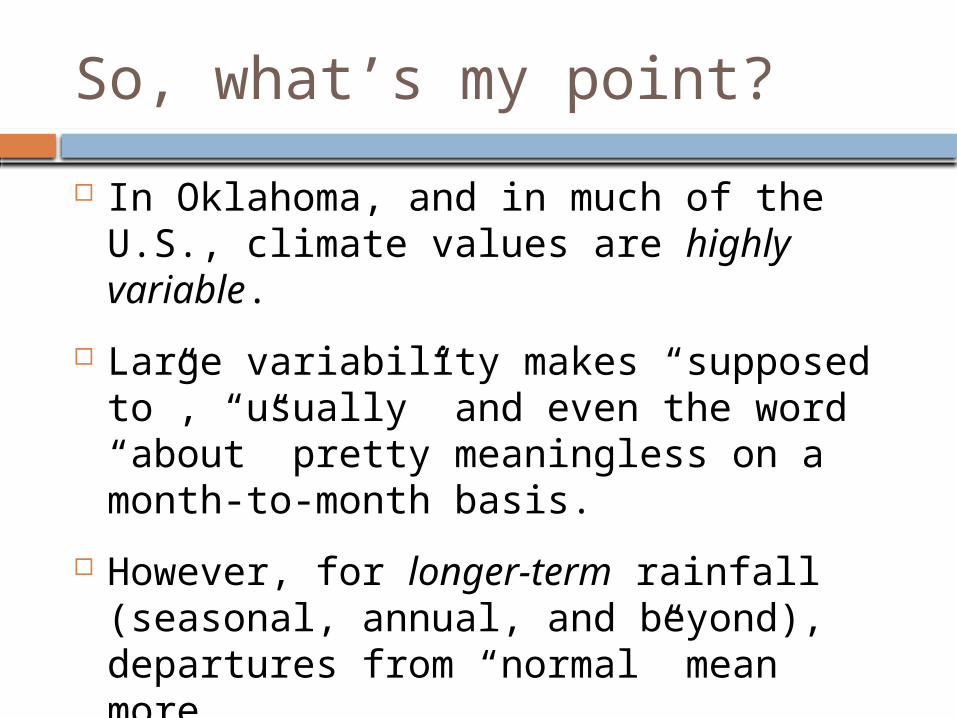
So, what’s my point? In Oklahoma, and in much of the U.S.,
climate values are highly variable. Large variability makes “supposed to”,
“usually” and even the word “about” pretty meaningless on a month-to-month basis.
However, for longer-term rainfall (seasonal, annual, and beyond), departures from “normal” mean more.

So, why have normals? People adjust their practices (ag, water
resources, etc.) based on recent history Normals are exactly that: recent history
About a generation of history, to be exact Normals are a good diagnostic tool to
put events in perspective Normals are a great planning tool (again:
agriculture, water resources, etc.)

OKLAHOMA’S CLIMATE

Oklahoma’s Climate
Remember … the Earth’s average temperature is about 58 degrees
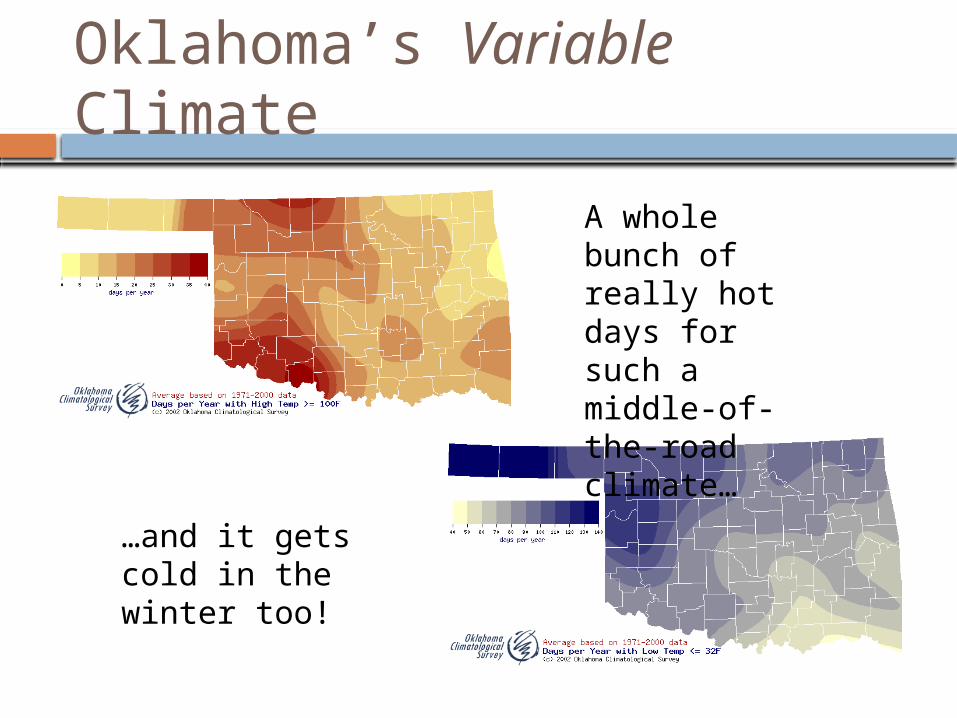
Oklahoma’s Variable Climate
A whole bunch of really hot days for such a middle-of-the-road climate…
…and it gets cold in the winter too!
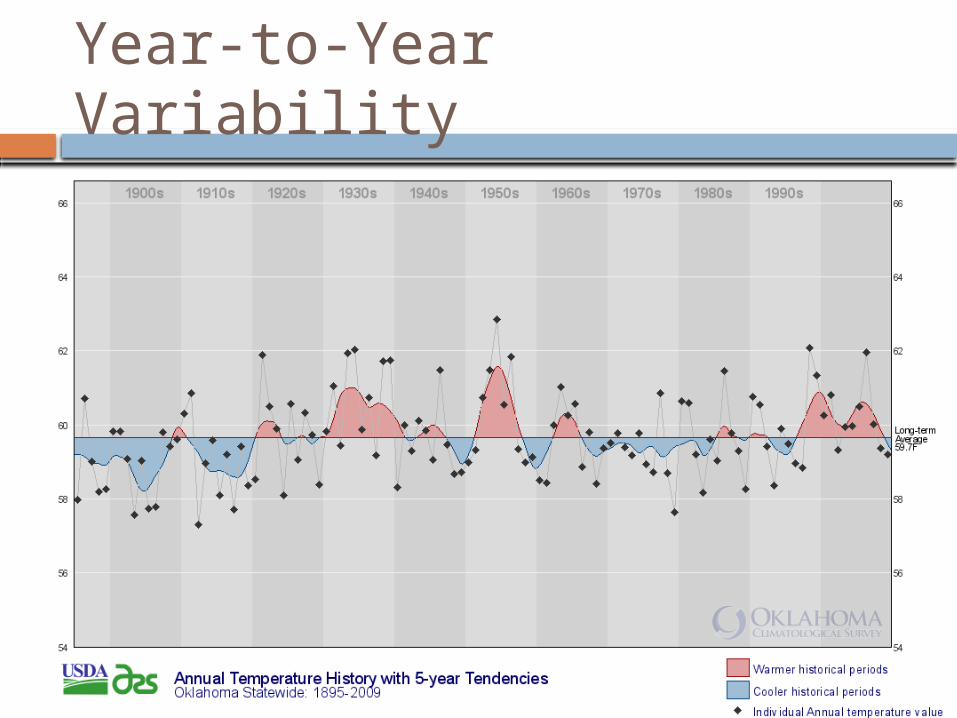
Year-to-Year Variability
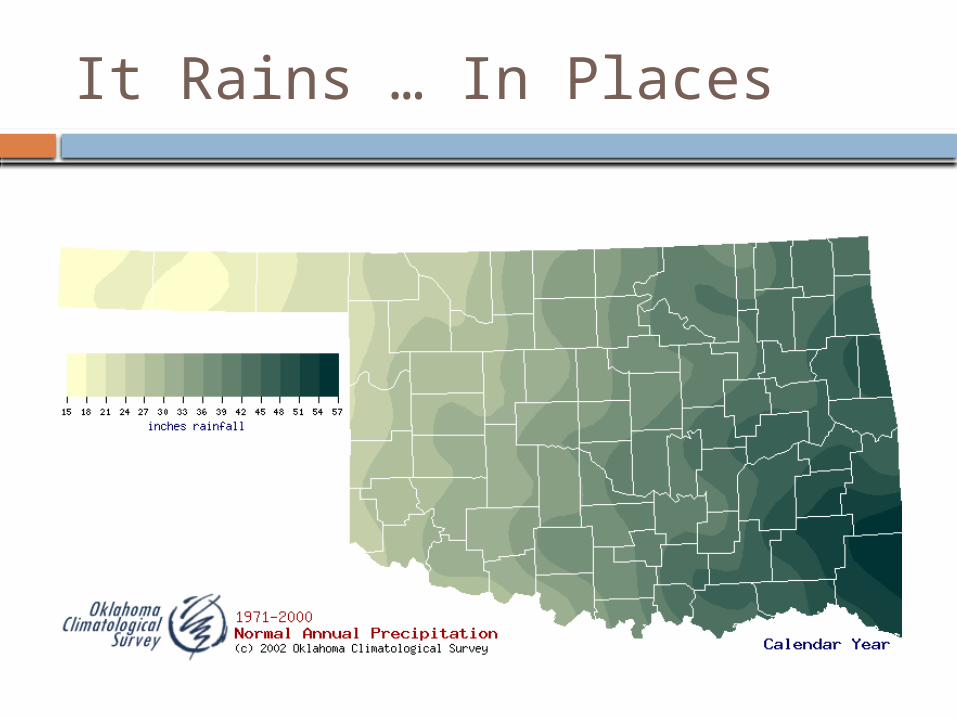
It Rains … In Places
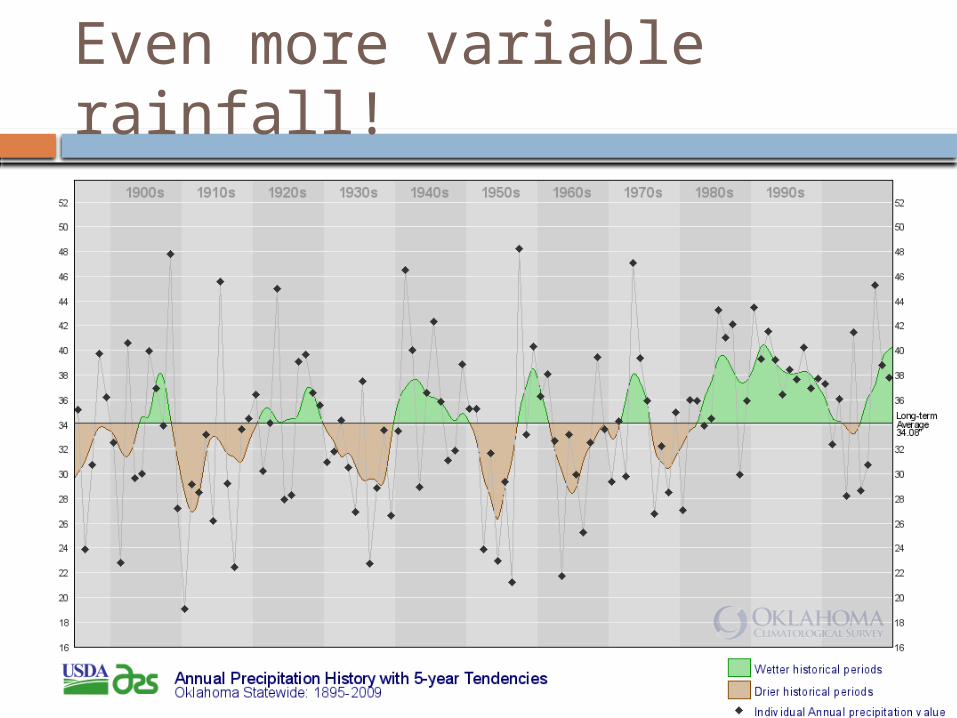
Even more variable rainfall!

It Even Snows!

So How Does This Compare?
Source: National Climatic Data Center

What Makes Oklahoma’s Weather?
Cool, Dry Air
Warm, Dry Air
Warm, Moist Air
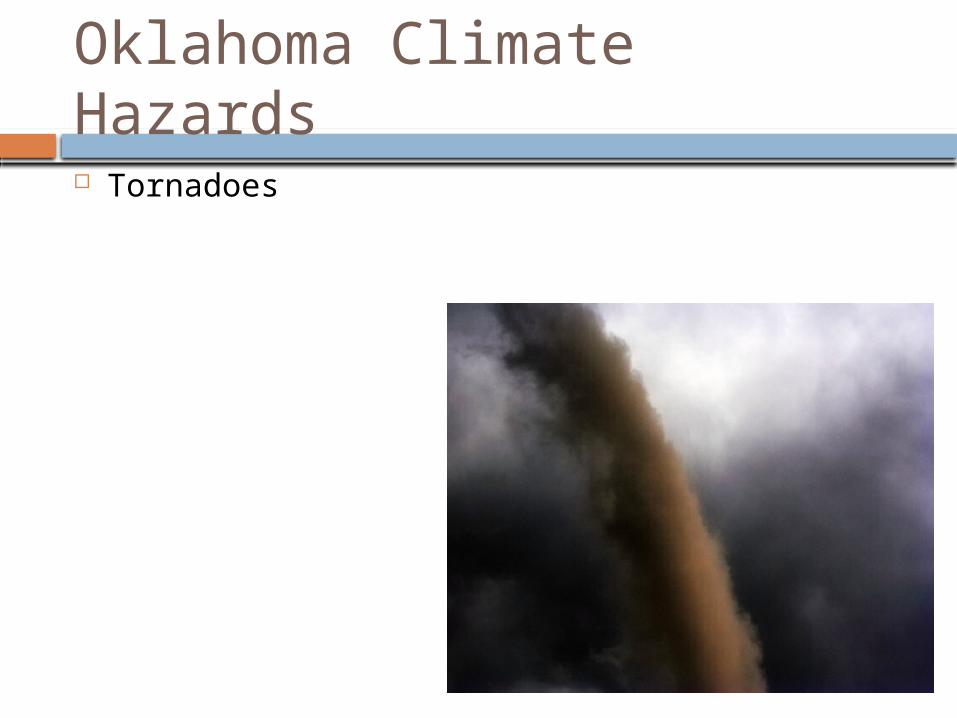
Oklahoma Climate Hazards Tornadoes
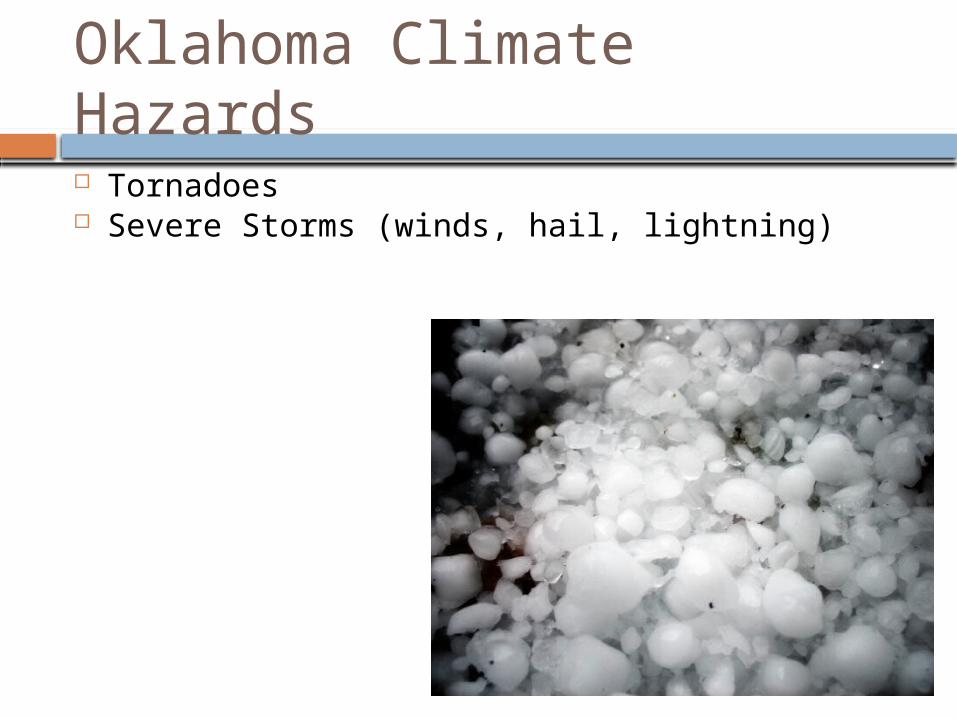
Oklahoma Climate Hazards Tornadoes Severe Storms (winds, hail, lightning)
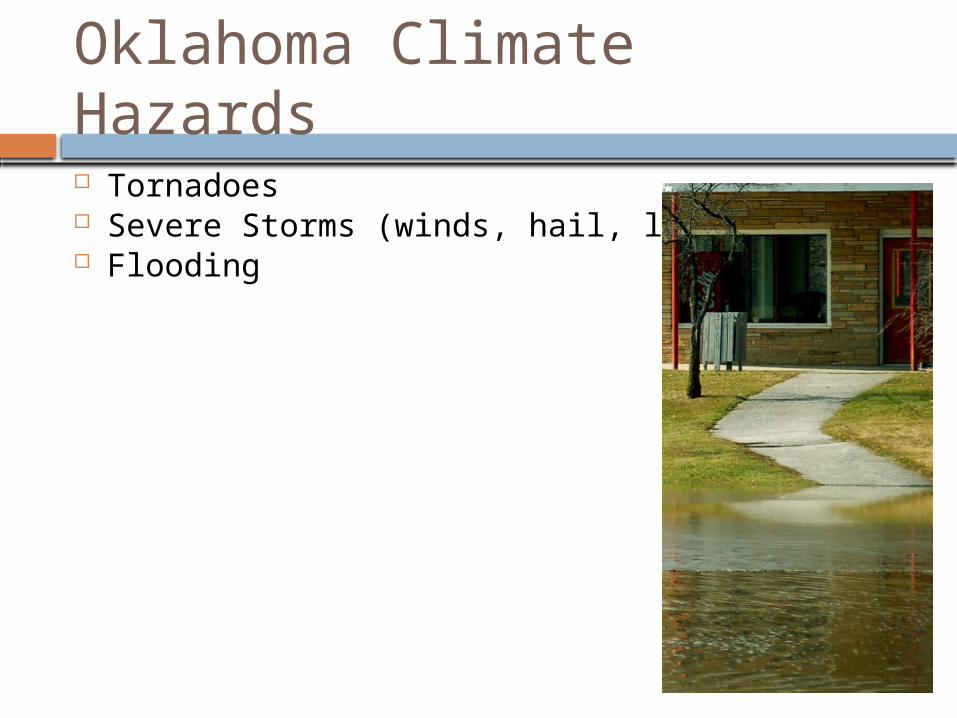
Oklahoma Climate Hazards Tornadoes Severe Storms (winds, hail, lightning) Flooding

Oklahoma Climate Hazards Tornadoes Severe Storms (winds, hail, lightning) Flooding Winter Storms

Oklahoma Climate Hazards Tornadoes Severe Storms (winds, hail, lightning) Flooding Winter Storms Wildfires
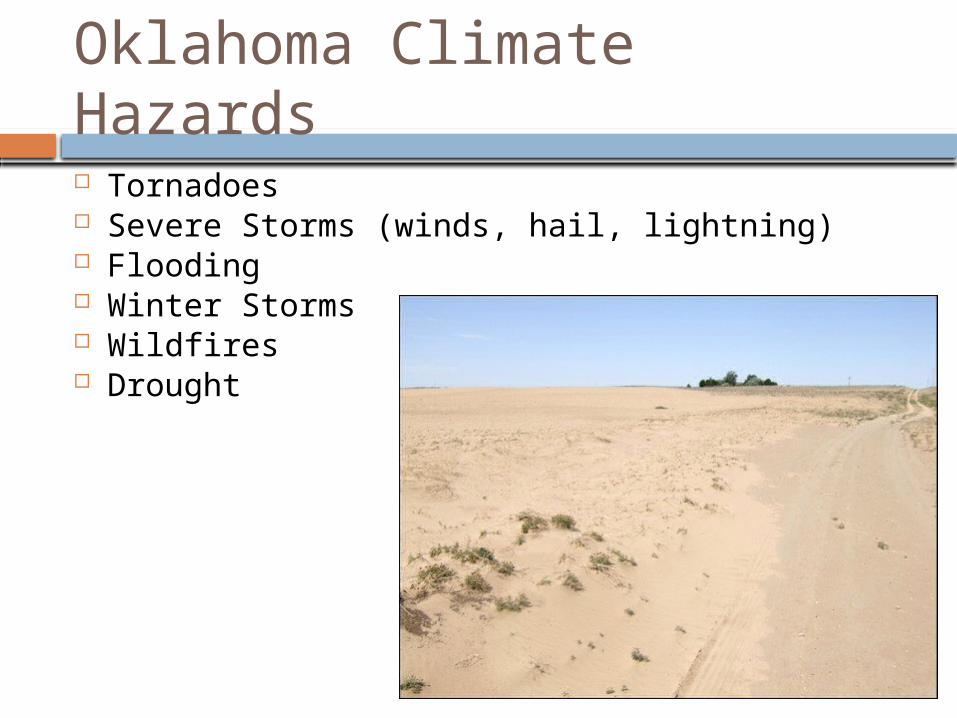
Oklahoma Climate Hazards Tornadoes Severe Storms (winds, hail, lightning) Flooding Winter Storms Wildfires Drought

Oklahoma Climate Hazards Tornadoes Severe Storms (winds, hail, lightning) Flooding Winter Storms Wildfires Drought Extreme Heat

Oklahoma Climate Hazards Tornadoes Severe Storms (winds, hail, lightning) Flooding Winter Storms Wildfires Drought Extreme Heat Expansive Soils
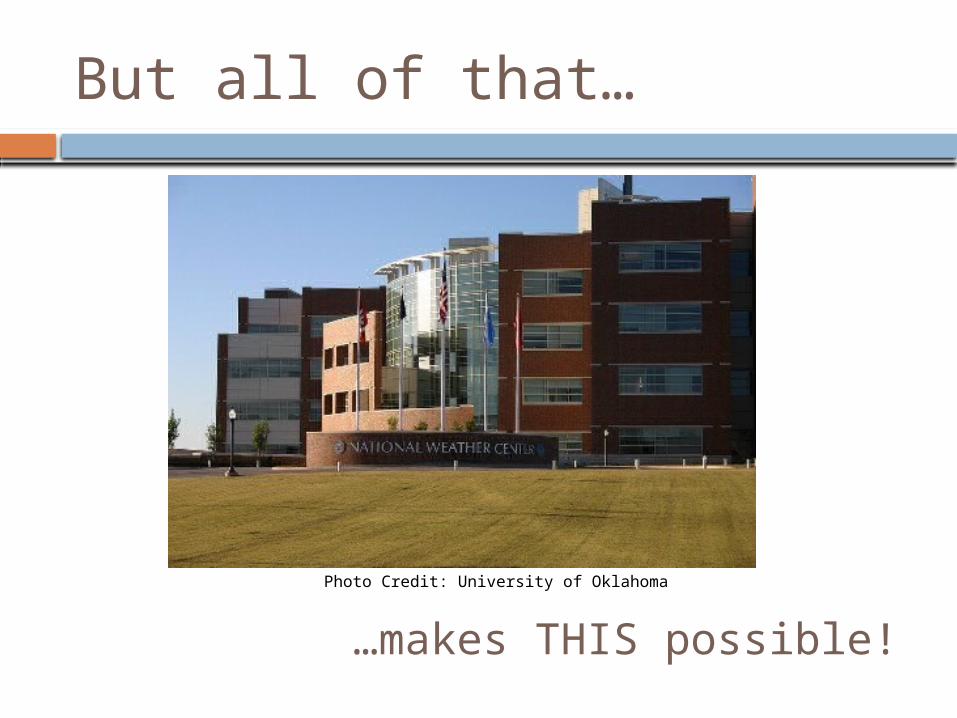
But all of that…
…makes THIS possible!Photo Credit: University of Oklahoma