Client Profile Q1FY22
166
Client Profile – Q1FY22 Christensen Advisory, India. (Christensen Investor Relations is now Christensen Advisory)
Transcript of Client Profile Q1FY22

Client Profile – Q1FY22 Christensen Advisory, India.
(Christensen Investor Relations is now Christensen Advisory)

Disclaimer
2
This document is a report undertaken by Christensen Advisory, India.
The opinions expressed are in good faith and while every care has been taken in
preparing these documents, Christensen Advisory, makes no representations and
gives no warranties of whatever nature in respect of these documents, including but
not limited to the accuracy or completeness of any information, facts and/or opinions
contained therein.
Christensen Advisory, the directors and employees cannot be held liable for the use of
and reliance of the opinions, estimates, forecasts and findings in these documents.
© 2021 Christensen Advisory, India. All Rights Reserved.

Information Technology/ITES/Telecom/Gaming
No. Companies Market Cap (₹ Cr) Location Financials
1 CyberTech Systems and Software Limited 456 Mumbai Click Here
2 Datamatics Global Services Limited 1,694 Mumbai Click Here
3 Eclerx Services Limited 7,976 Mumbai Click Here
4 Expleo Solutions Limited 1,085 Chennai Click Here
5 Firstsource Solutions Limited 14,075 Mumbai Click Here
6 Infobeans Technologies Limited 964 Indore Click Here
7 IRIS Business Services Limited 245 Mumbai Click Here
8 Mastek Limited 6,656 Mumbai Click Here
9 OnMobile Global Limited 1,253 Bengaluru Click Here
10 Saksoft Limited 753 Chennai Click Here
11 Sonata Software Limited 9,212 Bengaluru Click Here
12 Subex Limited 3,010 Bengaluru Click Here
13 Tata Elxsi Limited 28,959 Bengaluru Click Here
14 Xelpmoc Design and Tech Limited 511 Bengaluru Click Here
15 Zen Technologies Limited 665 Hyderabad Click Here
3*Mcap as on 17th August 2021

Financial ServicesNo. Companies Market Cap (₹ Cr) Location Financials
1 General Insurance Corporation of India 27,316 Mumbai Click Here
2 Niyogin Fintech Limited 905 Mumbai Click Here
3 Shriram Transport Finance Co. Limited 32,386 Mumbai Click Here
4*Mcap as on 17th August 2021
No. Companies Market Cap (₹ Cr) Location Financials
1 Ashiana Housing Limited 1,639 Delhi Click Here
2 Eldeco Housing Limited 541 Lucknow Click Here
3 Majesco Limited 225 Mumbai Click Here
No. Companies Market Cap (₹ Cr) Location Financials
1 Anupam Rasayan India Limited 7,447 Surat Click Here
2 Asahi Songwon Colors Limited 416 Ahmedabad Click Here
3 Heranba Industries Limited 3,213 Mumbai Click Here
4 Laxmi Organic Industries Limited 9,759 Mumbai Click Here
Real Estate /Prop Tech
Specialty Chemicals/ Agrochemicals

Pharmaceuticals/Healthcare
5
No. Companies Market Cap (₹ Cr) Location Financials
1 Biocon Limited 44,026 Bengaluru Click Here
2 Caplin Point Laboratories Limited 6,093 Chennai Click Here
3 Cupid Limited 312 Nashik Click Here
4 Dishman Carbogen Amcis Limited 3,009 Ahmedabad Click Here
5 HealthCare Global Enterprises Limited 2,818 Bengaluru Click Here
6 Jagsonpal Pharmaceuticals Limited 440 Delhi Click Here
7 Marksans Pharma Limited 2,974 Mumbai Click Here
8 Neuland Laboratories Limited 2,110 Hyderabad Click Here
9 Sequent Scientific Limited 6,050 Mumbai Click Here
*Mcap as on 17th August 2021
No. Companies Market Cap (₹ Cr) Location Financials
1 ASI Industries Limited 125 Mumbai Click Here
2 MMP Industries Limited 385 Nagpur Click Here
3 Modison Metals Limited 243 Mumbai Click Here
4 Sandur Manganese & Iron Ores Limited 1,843 Karnataka Click Here
Metals/Mining

Others
No. Companies Market Cap (₹ Cr) Location Financials
1 BLS International Services Limited 1,538 Delhi Click Here
2 Butterfly Gandhimathi Appliances Limited 1,366 Chennai Click Here
3 Dodla Dairy Limited 3,547 Hyderabad Click Here
4 Elecon Engineering Co. Limited 1,983 Gujarat Click Here
5 GMM Pfaudler Limited 6,193 Mumbai Click Here
6 Jash Engineering Limited 569 Indore Click Here
7 Nureca Limited 1,645 Chandigarh Click Here
8 Rane Group
- Rane Brake Lining Limited 759 Chennai Click Here
- Rane Engine Valve Limited 211 Chennai Click Here
- Rane Holdings Limited 957 Chennai Click Here
- Rane Madras Limited 456 Chennai Click Here
9 Sirca Paints India Limited 909 Delhi Click Here
10 Time Technoplast Limited 1,749 Mumbai Click Here6
*Mcap as on 17th August 2021
Garment/TextilesNo. Companies Market Cap (₹ Cr) Location Financials
1 Gokaldas Exports Limited 901 Bengaluru Click Here
2 IRIS Clothings Limited 291 Howrah Click Here
3 Welspun India Limited 12,549 Mumbai Click Here

Return On Christensen Portfolio
7
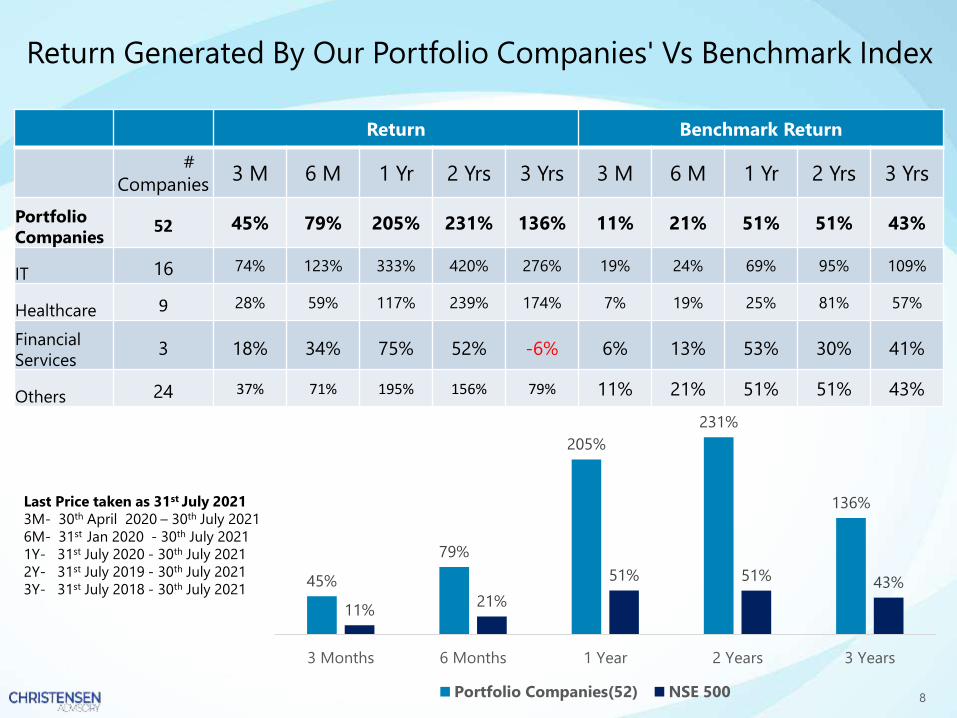
Return Generated By Our Portfolio Companies' Vs Benchmark Index
8
Return Benchmark Return
#
Companies3 M 6 M 1 Yr 2 Yrs 3 Yrs 3 M 6 M 1 Yr 2 Yrs 3 Yrs
Portfolio
Companies52 45% 79% 205% 231% 136% 11% 21% 51% 51% 43%
IT 16 74% 123% 333% 420% 276% 19% 24% 69% 95% 109%
Healthcare 9 28% 59% 117% 239% 174% 7% 19% 25% 81% 57%
Financial
Services3 18% 34% 75% 52% -6% 6% 13% 53% 30% 41%
Others 24 37% 71% 195% 156% 79% 11% 21% 51% 51% 43%
Last Price taken as 31st July 2021
3M- 30th April 2020 – 30th July 2021
6M- 31st Jan 2020 - 30th July 2021
1Y- 31st July 2020 - 30th July 2021
2Y- 31st July 2019 - 30th July 2021
3Y- 31st July 2018 - 30th July 202145%
79%
205%
231%
136%
11%21%
51% 51% 43%
3 Months 6 Months 1 Year 2 Years 3 Years
Portfolio Companies(52) NSE 500

IT/ITES/Telecom/Gaming9

Stock Profile
Incorporated 1995
BSE/NSE 532173/CYBERTECH
Issued Shares (Mn) 27.63
Share Price* (₹) 163.90
Market Cap* (₹ Mn) 4,556
52-week Range (₹) 2084.45 - 48.00
Shareholding Pattern (%)
Promoters 36.94
Public 63.06
▪ CMMI Level 3 Next-Gen Solutions & Services Company – focused on Esri and SAP
Cloud Platforms, SAP S/4 HANA
▪ Global footprint with a team of over 500 professionals
▪ SAP CoE with 100+ SMEs; World’s largest Geospatial CoE with 300+ Geospatial SMEs
▪ Partnerships with leading Technology players - SAP, Esri, Cisco, Salesforce, Microsoft
▪ Locations - USA (Chicago, Philadelphia, Los Angeles, Denver, Salt Lake City) and India
▪ Owns a state-of-the-art development center at Thane
▪ Spatialitics LLC, Spatial Analytics Products and Platforms. Key verticals – GeoShield
(suite for public safety), Spatialitics Utilities, Spatialitics Health (HIPAA-Compliant
Geocoding Service)
Next-Generation Offerings –
CyberTech Systems & Software Limited –
10
*SHP (BSE) as on 30th June ’21
*Share price & Market cap (BSE) as on 17th August ’21
Leader In Next-gen Spatial Analytics
0.0
100.0
200.0
300.0
400.0
500.0
Sep-20 Nov-20 Feb-21 May-21 Aug-21
Relative Price Performance
Sensex BSE IT Cyber Tech

11
CyberTech Systems & Software Limited
Revenue Distribution (Q1FY22)
Income Statement Highlights
Balance Sheet Highlights
(₹ mn.) FY20 FY21 Q4FY21 Q1FY22
Net Revenue 1,128 1,178 298 334
YoY Growth (%) 16.6% 4.4% (1.5%) 10.1%
EBITDA 245 297 58 77
EBITDA margin 20.6% 23.8% 18.6% 21.8%
PAT 132 241 28 39
PAT margin 11.1% 19.3% 9.0% 11.2%
YoY Growth (%) 29.3% 82.2% (77.3%) (23.7%)
Diluted EPS (₹) 4.77 8.58 0.99 1.39
(₹ mn.) FY19 FY20 FY21
Networth 831 941 1148
Total Borrowing 108 28 55
Cash and Cash Eq. 170 79 115
Total Assets 1,322 1,291 1,433
Key Highlights
▪ CyberTech continues to focus on growth opportunities in US market
▪ Traditional Enterprise Business maintains a consistent growth
▪ Continue to focus on SAP S/4Hana and Cloud transformation
▪ Retained strong balance sheet with no debt and continue to generate
substantial cash flow
▪ Revenue and profitability growth is expected to be driven by growth in
Geo 2.0 products and associated cost advantage
▪ Spatialitics Competitive Advantage:
✓ Only player to offer both Products and Platform
✓ IP based offerings - Protected by patents
✓ Spatialitics product lines are now fully cloud ready
✓ Spatialitics Utilities and Spatialitics Health product suites are
receiving interest in the market
70%
12%
5% 13%
By Verticals
Technology State / Local Government Utilities Others
96%
4%By Region
US India

12
CyberTech Systems & Software Limited
Press Release Highlights
▪ Total revenue for Q1FY22 was ₹ 351.0 million. EBITDA grew by 12.2% to ₹ 334.3 million, and PAT grew by 40.6% to ₹ 39.4
million. These demonstrates the efficacy of strategy to focus on enterprise cloud transformation which is gaining
unprecedented momentum in this pandemic era
▪ As per Corporate Reports, Factset, and Piper Sandler, the cloud industry is expected to reach $1,133B in 2030 from the
current size of $220B in 2020. CyberTech is well positioned to be part of this astronomical growth trajectory with its cloud
focused strategy
▪ SAP continues to play a key role in cloud transformation strategy. Company’s HANA GeoDB migration offerings continued
to gain traction through its partnership with the SAP Database Migration Factory. They have been awarded several HANA
cloud migrations through this channel and direct sales channel
▪ Managed ArcGIS Cloud Services offerings continued to grow, booked an additional deal during the quarter and company
is in various stages of discussion with a number of potential clients. Unparalleled expertise in geospatial engineering,
coupled with capability and depth in the areas of cloud transformation and cybersecurity is driving success
▪ A large water utility company has subscribed for Spatialitics Utilities product suite. This customer has a fairly large
enterprise lifecycle value, which is the hallmark of any Spatialitics deal and the deal will translate into a long term recurring
revenue stream for the company
▪ Expanded Spatialitics Public Safety Industry Advisory Board during the quarter. Chief Eric Young of Ogden Police
Department and Lieutenant Corey Solferino of Washoe County Sheriff’s Office have joined as Public Safety Industry
Advisory Board members
▪ Management continue to invest in building a talent pool and in acquiring next-gen digital infrastructure

Stock Profile
Incorporated 1987
BSE/NSE 532528/DATAMATICS
Issued Shares (Mn) 58.95
Share Price* (₹) 287.40
Market Cap* (₹ Mn) 16,942
52-week Range (₹) 329.00 – 62.00
Shareholding Pattern (%)
Promoters 74.29
Public 25.71
▪ Global IT and BPM company that builds intelligent solutions for data-driven businesses to
enhance their productivity and customer experience
▪ Key offerings –
✓ Business Process Management (57% revenue contribution) - Financial Transaction
Processing, Content Management & Publishing, Customer Management
✓ IT Solutions (43% revenue contribution) - Application Management Services, Digital
Solutions (Robotic Process Automation (RPA), Enterprise Mobility, Cloud Solutions),
Automated Fare Collection (AFC)
▪ Multiple Industry Presence – Banking, Financial Services and Insurance, Manufacturing,
Transport, Media & Publishing, Retail & eCommerce, International Organization
▪ Acquired/own products – iPM (BPM), TruBot (RPA), TruFare (AFC), TruBI (Business Intelligence)
▪ Headquartered in Mumbai, have strong presence in USA, Europe, Asia Pacific
▪ Global Delivery Centers in 4 regions; 200+ significant customers; 125+ Channel partners
▪ Promoters
✓ Promoted by Dr. Lalit Kanodia; managed by Rahul Kanodia (Vice Chairman & CEO)
▪ Acquisitions & Divestments -
✓ May 2021, acquired further 49.5% stake in Cybercom Datamatics Information Solution
✓ Jan 2021, entered into a stock redemption agreement with Cignex to dispose off its
entire stake
✓ April 2018, acquired 75% stake in RJGlobus Solutions, voice & text based customer
service provider to enhance Datamatics’ BPO offerings & an alternative low cost
offshore center for ₹ 110 mn
✓ July 2017, acquired 81.1% stake in TechJini Solutions, boutique mobile & web
technology provider (India) to strengthen Datamatics mobility offerings for ₹ 446 mn
Datamatics Global Services Limited –Builds Intelligent Solutions for Data-Driven Businesses
13
*SHP (BSE) as on 30th June ’21
*Share price & Market cap (BSE) as on 17th August ’21
0.0
100.0
200.0
300.0
400.0
500.0
Sep-20 Nov-20 Feb-21 May-21 Aug-21
Relative Price Performance
Sensex BSE IT Datamatics

14
Datamatics Global Services Limited
58%
11%
22%
4% 5%
By Region
USA UK India Europe ROW
Revenue Distribution (Q1FY22)
Income Statement Highlights
Balance Sheet Highlights
(₹ mn.) FY20 FY21 Q4FY21 Q1FY22
Net Revenue 12,033 11,490 2,833 2,878
YoY Growth (%) 6.2% (4.5%) (8.7%) 3.8%
EBITDA 1,236 1,422 419 414
EBITDA margin 10.3% 12.4% 14.8% 14.4%
PAT 617 840 287 396
PAT margin 5.1% 7.3% 10.1% 13.8%
YoY Growth (%) (26.8%) 36.1% 648.4% 193.1%
Diluted EPS (₹) 10.81 13.53 4.86 6.72
₹ mn.) FY19 FY20 FY21
Networth 6,400 6,943 7,159
Total Borrowing 359 965 0
Cash and Cash Eq. 696 1,948 991
Total Assets 8,672 10,100 9,081
26%
18%28%
4%
6%
18%
By Industry
BFSI Technology & Consulting
Education & Publishers Manufacturing
Retail / E-Retail Others
Key Highlights
▪ A globally diverse Digital Solutions, Technology and Business Process Management
company
▪ Developed own products to strengthen its offerings such as TruCap+ in Intelligent
Document Processing (IDP), TruBot in Robotic Process Automation (RPA), iPM Workflow
& TruBI in Analytics, TruAI for Artificial intelligence and TruFare in Automated Fare
Collection (AFC)
▪ Has a strong presence in the AFC space and has executed over 30+ marquee projects
across the globe including New York, London, Hong Kong and Dubai; strong pipeline in
India & USA. Only company in India to have a highly evolved AFC, smart gates and
contactless gates service offerings
▪ Has a strong R&D centre - DataLabs focusing on the new age technology areas such as
AI & Cognitive Science, RPA and Augmented & Virtual Reality
▪ Debt free Company with healthy margins & financials

15
Datamatics Global Services Limited
Concall Highlights
▪ Q1FY22 Revenue at ₹ 2,877.5 million; Up 1.6% QoQ and 3.8% YoY; Without Cignex, up 1.6% QoQ and 21.6% YoY
▪ EBITDA at ₹ 414.2 million; Down 1.0% QoQ and up 45.0% YoY; Without Cignex, down 1.0% QoQ and up 85.5% YoY
▪ EBITDA Margin at 14.4% as compared to 10.3% inQ1FY21; Without Cignex, 14.4% as compared to 9.4% in Q1FY21
▪ PAT at ₹ 395.9 Mn; Up 38.1% QoQ and 193.1% YoY; Without Cignex, up 38.1% QoQ and 266.6% YoY
▪ Added 7 new significant customers in Q1FY22
▪ Declared an Interim Dividend of ₹ 2.50 per Equity Share i.e. 50% on Equity Shares of ₹ 5.00 each for the financial year 2021-22
▪ In terms of Business segment, IT solutions contributed 43% of revenue with an EBITDA of 6.1% and 10.7% EBITDA Margin
without considering investment in products. BPM services contributed 57% of revenue with an EBITDA of 20.7%
▪ Publishing, BFSI and Technology & Consulting were the top three sectors contributing 28%, 26%, 18% respectively to revenue
▪ Q1FY22, USA continues to be major contributor at 58% whereas contributions from UK, Europe, India and Rest of World stood
at 11%, 4%, 22%, and 5% respectively
▪ Management is seeing a strong demand environment and pipeline continues to remain healthy. Pandemic induced challenges
have accelerated the spend and investment in platform based digital solutions like digitization, cloud, automation, artificial
intelligence, and digital experiences, which in turn has created huge opportunities for companies like Datamatics
▪ Company continue to see specific opportunities in the process automation and dynamic content management areas. In line
with this trend, company has increased its our focus on digital transformation opportunities and the US market
▪ Have strengthened its US sales team with a sharper focus on intelligent automation products including TruBot on robotics and
TruCap in intelligent document processing

0.0
100.0
200.0
300.0
400.0
Sep-20 Nov-20 Feb-21 May-21 Aug-21
Relative Price Performance
Sensex BSE IT Eclerx
16
Eclerx Services Limited –Specialist to Manage Complex Data-Driven Processes
Stock Profile
Incorporated 2000
BSE/NSE 532927/ECLERX
Issued Shares (Mn) 34.89
Share Price* (₹) 2,286.00
Market Cap* (₹ Mn) 79,758
52-week Range (₹) 2,395.05 – 660.00
Shareholding Pattern (%)
Promoters 53.81
Public 44.02
Top Institutional Holders (%)
Fidelity Puritan Trust 5.64
HDFC Trustee 6.47
Nippon India Small Cap Fund 3.50
Pinebridge Global Funds 3.40
DSP Small Cap 1.52
ICICI Prudential Technology Fund 1.40
▪ India’s first and only publicly listed KPO company
✓ Provides business process management, automation and analytics
services to number of Fortune 2000 enterprises
▪ Key Promoters
✓ Mr. PD Mundhra, Co-founder and Executive Director
✓ Mr. Anjan Malik, Co-founder and Director
▪ Services Offered
✓ Digital Services (~40% of Total Revenue) - providing expertise and
services in Data Management, Analytics and BI, Content and Commerce,
and Creative services; Acquired CLX Europe to create more integrated
service offering in Digital for €25 mn in 2015
✓ Financial Markets (~40% of Total Revenue) – Operations, Finance and
Control, and Data Management support across client types
✓ Customer Operations (~20% of Total Revenue) - Deliver holistic, hyper-
focused customer support services; provide operational expertise and
process excellence throughout the customer journey
▪ Has 5 delivery centers in India and 1 delivery center in U.S (Fayetteville)
▪ Debt free company, low capex, healthy dividend payout policy, high ROE
▪ 11 Dec 2020, acquired Personiv, headquartered in Austin, Texas, USA; Enterprise
value is USD 34 million
*SHP (BSE) as on 30th June ’21
*Share price & Market cap (BSE) as on 17th August ’21

17
Eclerx Services Limited
Revenue Distribution (Q1FY22)
Key Highlights
▪ Niche in running innovative operations for large portfolios of complex
processes with a highly referenceable client base
▪ Consistent growth in revenues and profits with industry leading margins.
▪ Revenue growth was driven by financial services, digital & customer operations
▪ Company provides critical business operations services to over fifty global
Fortune 500 clients
▪ Building an ecosystem for future by deepening analytics capabilities and
developing competencies in robotics
▪ Board announced maximum Buyback of ₹ 3,030 mn at a maximum price of
₹ 3,200 per share
▪ Managed Services and RPA continue to remain key growth drivers in FY22
Income Statement Highlights
Balance Sheet Highlights
70%
23%
7%
By Region
North America Europe ROW
80%
12%
4%4%By Currency
USD EURO GBP Others
(₹ mn.) FY20 FY21 Q4FY21 Q1FY22
Net Revenue 14,376 15,645 4,728 4,863
YoY Growth (%) 0.5% 8.8% 34.7% 44.5%
EBITDA 3,702 4,825 1,589 1,561
EBITDA margin 25.0% 30.5% 33.3% 31.6%
PAT 2,090 2,826 988 913
PAT margin 14.1.0% 17.9% 20.7% 18.5%
YoY Growth (%) (8.4%) 35.2% 78.3% 76.4%
Diluted EPS (₹) 57.54 81.65 28.81 26.55
(₹ mn.) FY19 FY20 FY21
Networth 13,819 13,068 15,017
Total Borrowing 17 6 9
Cash and Cash Eq. 7,398 7,703 6,572
Total Assets 15,972 17,360 20,081

18
Eclerx Services Limited
Concall Highlights
▪ Operating revenue in dollar terms was at USD 64.7 mn, up 1.4% QoQ in USD terms and 1.2% in CC
▪ Total Revenue in rupee terms was ₹ 4,944 mn, up 3.7% QoQ and up 42% YoY
▪ EBITDA was at ₹ 1,561 mn, drop 1.7% QoQ and up 64.6% YoY
▪ Net profit for quarter was ₹ 913 million, drop of 7.5% QoQ and up 76.4% YoY
▪ All the absolute margin metrics this quarter were up by much more than corresponding revenue increase on YoY basis due to
inclusion of Personiv and last Q1 being severely impacted by COVID.
▪ Company saw a sequential decrease in profitability this quarter because of wage hikes, hiring for ongoing ramp-ups and one-
off Personiv acquisition accounting-related true-ups
▪ On the people side, company continue to work from home for 90% plus of its staff and have been able to get 76% of India
staff and some of their family members vaccinated with at least one dose
▪ Overall demand environment and Personiv's revenue trajectory have remained encouraging in the last few quarters
▪ Board announced maximum Buyback of ₹ 3,030 mm at a maximum price of ₹ 3,200 per share subject to regulatory approvals
▪ Client Count: USD500k-1mn client count was 21; USD1mn-3mn client count was 18; USD3mn+ client count was 10
▪ Total delivery headcount as of June 30, 2021 stands at 12,740 – an increase of 50% YoY
▪ Capex during Q1FY22 is ₹ 171mn vs ₹ 72mn in Q4FY21; Capex is likely to remain volatile with the expected increase in
depreciation due to the new assets taken to support the ongoing head count increase.
▪ Most of the key business metrics now include Personiv and have reached steady state after the full integration
▪ Total Cash and Cash Equivalents of ₹ 7,268 mn for Q1FY’22 vs ₹ 6,572 mn for Q4FY’21
▪ Current book value per share Q1FY’22 ₹ 473.0 vs. ₹ 441.3 Q4FY’21

19
Expleo Solutions Ltd. –
Quality Assurance and Testing Specialist in BFSI Industry
▪ Leading Quality Assurance and Testing specialist company in BFSI Industry
✓ Subsidiary of world’s largest pure-play testing services specialist, SQS AG group
✓ Offers specialised services in testing (tech support, functional/non-functional,
test management) and quality management
✓ Helps its clients with lower time-to-market, reduce software product lifecycle
costs, defect-free rollouts, structured software testing methodologies, offshore
delivery and test automation expertise
✓ Has a track record of successful deployment of a wide range of financial
software products such as Oracle Flexcube, PRIME, MIDAS, Finacle & others
✓ Has achieved over 14mn person hours of testing over 15 years of its existence,
serving ~200 clients across APAC, US, UK and Middle East
✓ Have well certified testing centres: 2 in Chennai and 1 in Pune
▪ Formation
✓ In 1998, incorporated as ‘Relliant Global Services (India) Pvt. Ltd’
✓ In 2008, publicly listed on Stock Exchanges (BSE and NSE)
✓ In Nov 2013, SQS AG (Germany based) acquired 54.5% stake in Thinksoft and
changed the name to ‘SQS India BFSI Ltd.’ in Aug 2014
✓ In Dec 2017, SQS AG acquired by French firm Assystem Tech for £281.3mn
✓ In 2019, SQS India BFSI changed name to ‘Expleo Solutions Ltd’
✓ In July’21, Board of Expleo Solutions and Expleo India Infosystems Private
Limited (EIIPL) entered into a Scheme of Amalgamation involving the merger of
EIIPL (including its subsidiaries and step-down subsidiary) into Expleo Solutions
Stock Profile
Incorporated 1998
BSE/NSE 533121/SQSBFSI
Issued Shares (Mn) 10.25
Share Price* (₹) 1,058.25
Market Cap* (₹ Mn) 10,850
52-week Range (₹) 1,384.00 – 387.70
Shareholding Pattern (%)
Promoters 56.17
Public 43.83
*SHP (BSE) as on 30th June ’21
0.0
100.0
200.0
300.0
Sep-20 Nov-20 Feb-21 May-21 Aug-21
Relative Price Performance
Sensex BSE IT Expleo
*Share price & Market cap (BSE) as on 17th August ’21

20
Expleo Solutions Limited
Revenue Distribution (Q1FY22)
Key Highlights
▪ Global software testing market is projected to expand to US$76 billion by 2022, a
CAGR of 8% from 2019 to 2022. The complexity of testing tools and platforms,
disruptive changes in business models and computing technologies are driving shifts
in testing approaches. (Source: Nasscom)
▪ Helps clients reduce software product life cycle costs and develop ‘business ready
software' within compressed timelines, through intense domain focus, structured
software Testing Methodologies, offshore delivery, and test automation expertise
▪ Has distinction of maintaining high standards in execution, coverage, quality &
confidentiality
▪ Financial software testing services have helped system integrators and product
development companies to achieve near defect-free rollouts of software products
▪ Working to grow revenue from testing automation & output-based pricing model
▪ Debt free company
Income Statement Highlights
Balance Sheet Highlights
₹ mn.) FY20 FY21 Q4FY21 Q1FY22
Net Revenue 2,702 3,009 793 880
YoY Growth (%) (4.4%) 11.4% 5.1% 16.1%
EBITDA 532 699 191 146
EBITDA margin 19.7% 23.2% 24.1% 16.6%
PAT 399 504 109 128
PAT margin 14.8% 16.8% 13.7% 13.9%
YoY Growth (%) 10.3% 26.4% (22.0%) (10.1%)
Diluted EPS (₹) 38.51 49.20 10.72 12.50
(₹ mn.) FY19 FY20 FY21
Networth 1,388 1,522 2,019
Total Borrowing - - --
Cash and Cash Eq. 979 872 1,311
Total Assets 1,932 2,140 2,643
92%
8%
By Distribution
International Domestic
37%
5%39%
20%
By Practice
Banking
Capital Markets & Treasury
Cards & Payments
Insurance
58%
3%
40%
By Region
Europe N.America Asia

21
Expleo Solutions Limited
Concall Highlights
▪ The operating revenue was ₹ 880 million in Q1FY22 as compared to ₹ 793 million in Q4FY22, reflecting a growth of 11% QoQ
▪ EBITDA stood at ₹ 146 million with the margin at 16.6% in Q1FY22. PAT at ₹ 130 million in Q1FY22, a growth of 27.2% QoQ
▪ Net cash position stood at ₹ 1,337 million as on June 30, 2021 as compared to ₹ 1,002 million as on June 30, 2020
▪ Offshore business revenue accounted for 60%+ of total revenues in Q1FY22 versus 48% in Q1FY21
▪ Digital services revenue accounted for 29% of total revenue in Q1FY22 as compared to 15% of total revenues as of March 2020
and grew 22% QoQ. Management indicated that the digital revenue contribution would increase to 33% by the end of CY2021
▪ Total employee count stood at 1,470 in Q1FY22 including around 330 subcontractors
▪ Management continue to see healthy demand for services across all markets in both Asia and Europe regions. The opportunity
for the specialized testing services, automation and digital services continue to see traction and the segment is growing faster
▪ During the first half of the CY21, added 2 key clients - one is based out of Asia Pacific and other client which is a large global
company, which is operating out of India already and they are strengthening their offshore and India presence. And both are
looking to contribute more than $1million during this calendar year
▪ In July 2021, the Board of Expleo Solutions and Expleo India Infosystems Private Limited (EIIPL) had announced a Scheme of
Amalgamation involving the merger of EIIPL (including its subsidiaries and step-down subsidiary) into Expleo Solutions. Post
announcement of the merger of the unlisted companies, company is working on the integration plan, and it is expected to get
completed by Q4FY22. The merger of the Expleo Group’s Indian entities would help the company attract talent and skills in
niche areas, access global clientele, expand markets and leverage cross-selling opportunities
▪ Have signed up for an additional facility in Coimbatore and are rationalising the leased premises in Chennai. This will add
additional capacity by end of the year and should help company in future growth

Shareholding Pattern (%)
Promoters 53.68
Public 43.97
22
Firstsource Solutions Limited –Leading Global Provider of Customized IT BPM Services
▪ Firstsource Solutions, an RP Sanjiv Goenka Group company, is a leading provider
of transformational solutions and services spanning the customer lifecycle across
Healthcare (Payer and Provider), Banking and Financial Services, Communications,
Media and Technology (CMT) and other industries
▪ Offers Data Processing, Collections Management and Customer Management
through its delivery centres across US, UK, Philippines, Ireland and India
▪ ‘Digital First, Digital Now’ approach helps organizations reinvent operations and
reimagine business models, enabling them to build competitive advantage
▪ Productized solutions includes Customer Interaction Analytics (First Customer
Intelligence), Web Chat (First Chat), Process Automation (First Smartomation),
Workforce Management (First WF Suite) and many more
▪ Ownership Change
✓ In 2012, RP-Sanjiv Goenka Group’s CESC Ltd (via wholly owned subsidiary
Spen Liq Pvt. Ltd.) acquired 56.86% stake for ₹ 640 Cr
▪ Deals & Acquisitions:
✓ Aug’07, acquired MedAssist (US) for $330 mn
✓ Oct’12, strategic investment in NanoBi (India) analytic company
✓ Jan’16, acquired BPO division of ISGN (US) for $13 mn
✓ Jun’16, renewed contract for next 10-years with Sky in UK
✓ Dec’20 acquired PatientMatters, a healthcare RCM solutions provider
Stock Profile
Incorporated 2001
BSE/NSE 532809/FSL
Issued Shares (Mn) 696.65
Share Price* (₹) 202.00
Market Cap* (₹ Mn) 140,754
52-week Range (₹) 205.80 – 35.00
Top Institutional/Public Holders (%)
HDFC Small Cap Fund 7.65
ICICI Bank Ltd. 2.30
Steinberg India Fund 1.56
L And T India Value Fund 1.77
UTI Small Cap Fund 1.04
*SHP (BSE) as on 30th June ’21
0.0
100.0
200.0
300.0
400.0
Sep-20 Nov-20 Feb-21 May-21 Aug-21
Relative Price Performance
Sensex BSE IT Firstsource
*Share price & Market cap (BSE) as on 17th August ’21

23
Firstsource Solutions Limited
68%
31%
1%By Region
US UK ROW
52%
20%
27%
2%By Industry
BFSI Comm, Media & Tech
Healthcare Diverse Industries
46%48%
6%
By Segment
Digitally Empowered Contact Center
Intelligent Back Office
Platforms, Automation & Analytics
Revenue Distribution (Q1FY22)
Income Statement Highlights
Balance Sheet Highlights
(₹ mn.) FY20 FY21 Q4FY21 Q1FY22
Net Revenue 40,986 50,780 14,628 14,848
YoY Growth (%) 7.1% 23.9% 35.4% 39.8%
EBITDA 6,289 8,042 2,342 2,383
EBITDA margin 15.3% 15.8% 16.0% 16.1%
PAT 3,397 3,617 467 1,345
PAT margin 8.3% 7.1% 3.2% 9.1%
YoY Growth (%) (10.1%) 6.5% (49.0%) 188.2%
Diluted EPS (₹) 4.89 5.13 0.66 1.91
(₹ mn.) FY20 FY21 Q1FY22
Networth 27,654 27,993 29,727
Total Borrowing 8,369 5,213 6,202
Cash and Cash Eq. 1,908 1,373 1,340
Total Assets 45,871 48,297 50,273
Key Highlights
▪ Strong domain driven operating model –
✓ Leader in US non-bank lender market
✓ Top 3 in chosen Revenue Cycle Management segments in US Healthcare
✓ Leading CX service providers in the UK across Media and BFS segments
✓ Top 5 Consumer debt collections agency in the US
▪ 100+ global clients including 17 Fortune 500 & 9 FTSE 100 companies
▪ Geared up for running a lean marathon for FY22
✓ Flex capacity and costs to align with demand curve
✓ Major operations can now switch seamlessly between office & WFH
✓ Continued Digitization of Sales-Execution-Transformation value chain
for operating a Distributed operations robustly
▪ Continue to invest for strong growth forays in Digital services

24
Firstsource Solutions Limited
Concall Highlights
▪ In Q1FY22, US$ revenue was at $201.3 mn, a growth of 0.7% QoQ and 43.1% YoY (0.5% QoQ and 38.5% YoY on CC basis)
▪ Operating EBITDA was at ₹ 2,383 mn with margin at 16.1% and EBIT Margin was at 12.1%
▪ ROE was at 17.4% and ROCE was at 19.4% on an annualized basis in quarter
▪ Retained the revenue (15%-18% on CC basis) and operating margin guidance (11.8%-12.3%) for FY22
▪ Revenue from top client grew 71.7% YoY and top 2-5 clients grew 41.5% YoY
▪ Within BFS, home-purchase mortgage market continues strong, but mortgage refinance business has tapered. Management is
confident of YoY growth in its mortgage business due to high servicing component. Collections pipeline in the US is
encouraging. UK BFS continue to grow well; pipeline robust; momentum to continue
▪ Healthcare growth momentum strong. The business recorded the highest ACV from clients, old and new. Working with six of the
top-10 health plans in the US. Digital-intake platform making progress in telehealth and remote-patient-monitoring market;
seeing good momentum here. Expanded leadership in the Provider business; Lauralea Tanner to lead the market function for the
Provider business. Revenue break-up of Healthcare: 44% Payer, 56% Provider
▪ The impact of India’s second wave on CMT has now subsided. Sales momentum picking up
▪ FinTech category made good progress (reasonably-sized deals) in digital collections for the lending business; seeing decent
traction in servicing and back-office of non-lending FinTech as well
▪ In Health-tech, currently partnering with three platform providers, piloting solutions, confident that this will grow
▪ Mortgage client extended engagement beyond FY22. FSL has bought back its stake in the mortgage business for $23m on a
deferred payment basis and contingent consideration of $11.25m. FY22 cashflow impact $12m (already paid); FY23 $3.5m, FY24
up to $12m, FY25 up to $6.75m. No more P&L impact; the buyback will be accounted for in shareholder equity on balance sheet

25
Stock Profile
Incorporated 2000
NSE INFOBEAN
Issued Shares (Mn) 24.11
Share Price* (₹) 399.90
Market Cap* (₹ Mn) 9640
52-week Range (₹) 513.80-107.80
Shareholding Pattern (%)
Promoters 74.69
Public 25.31
InfoBeans Technologies Limited –Digital Transformation and Product Engineering outfit
*SHP (NSE) as on 30th June ’21
*Share price & Market cap (NSE) as on 17th August ’21
▪ Headquartered in Indore, InfoBeans was incorporated in 2000 by Avinash
Sethi, Siddharth Sethi and Mitesh Bohra
▪ CMMi level 3 certified company adhering to global standards for software
development processes
▪ Key business segments include Product Engineering and Digital
Transformation, clients include 16 Fortune 500 companies
▪ Key operating sectors -Financial Services, Media & Publishing, Technology
▪ Center of Excellence - Automation, Cloud, Salesforce, ServiceNow
▪ Operates from its state-of-art facilities in India (Indore, Pune, Bangalore &
Chennai); New York city in USA, Munich in Germany & Dubai in Middle
East; 850+ professionals globally
▪ Diversified clientele with more than 100 partners ranges from Startups to
Fortune 500 & Fortune 100 companies.
▪ InfoBeans services wide range of industry segments including distributed
storage systems, multi- platform content delivery and eCommerce & web
mobile platforms for diverse sectors.
▪ Management has clear vision of growing 2x every 2 years, organically and
inorganically. Currently, revenue is growing by about 2x in 3 years
0.0
100.0
200.0
300.0
400.0
500.0
Sep-20 Nov-20 Feb-21 May-21 Aug-21
Relative Price Performance
Sensex BSE IT InfoBeans

26
InfoBeans Technologies Limited
Revenue Distribution (FY21)
Income Statement Highlights
Balance Sheet Highlights
(₹ mn.) FY20 FY21 Q4FY21 Q1FY22
Net Revenue 1,650 1,960 504 552
YoY Growth (%) 37% 14.65% 5% 9.6%
EBITDA 370 540 130 160
EBITDA margin 24% 27.7% 25.4% 28.9%
PAT 210 370 80 110
PAT margin 13% 18.7% 19.7% 19.2%
YoY Growth (%) 11% 75.1% 700% 39.5%
Diluted EPS (₹) 9.00 15.10 4.11 4.36
(₹ mn.) FY19 FY20 FY21
Networth 1,226 1,444 1,810
Total Borrowing 1 1 55
Cash and Cash Eq. 339 109 227
Total Assets 1,310 2,132 2,454
94%
3% 3%By Region
America Europe Middle East
27
InfoBeans Technologies Limited
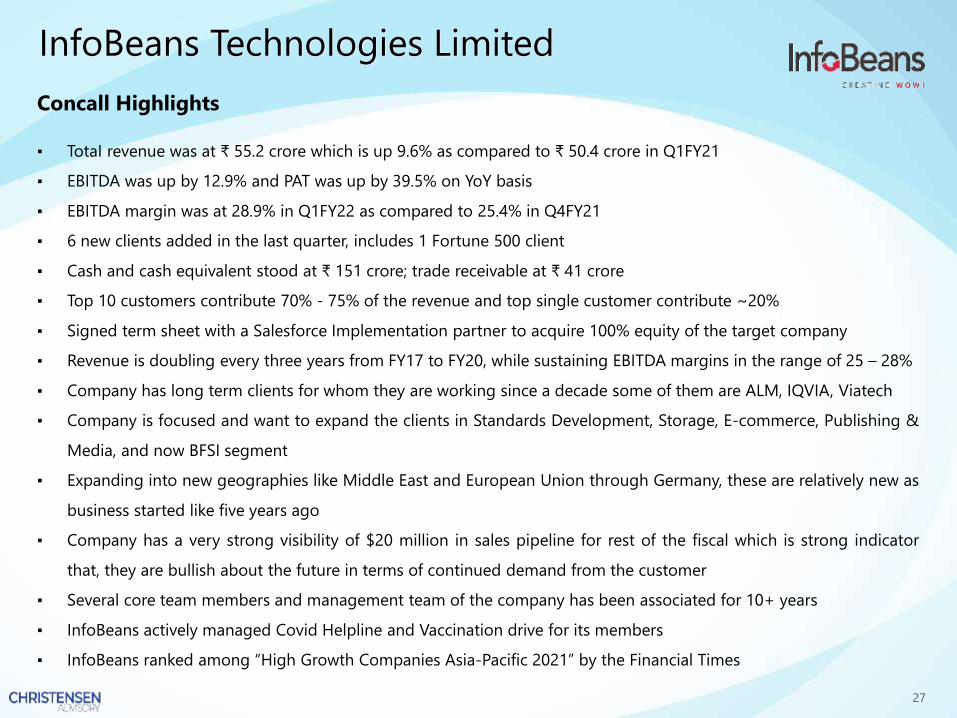
▪ TotaI revenue was at ₹ 55.2 crore which is up 9.6% as compared to ₹ 50.4 crore in Q1FY21
▪ EBITDA was up by 12.9% and PAT was up by 39.5% on YoY basis
▪ EBITDA margin was at 28.9% in Q1FY22 as compared to 25.4% in Q4FY21
▪ 6 new clients added in the last quarter, includes 1 Fortune 500 client
▪ Cash and cash equivalent stood at ₹ 151 crore; trade receivable at ₹ 41 crore
▪ Top 10 customers contribute 70% - 75% of the revenue and top single customer contribute ~20%
▪ Signed term sheet with a Salesforce Implementation partner to acquire 100% equity of the target company
▪ Revenue is doubling every three years from FY17 to FY20, while sustaining EBITDA margins in the range of 25 – 28%
▪ Company has long term clients for whom they are working since a decade some of them are ALM, IQVIA, Viatech
▪ Company is focused and want to expand the clients in Standards Development, Storage, E-commerce, Publishing &
Media, and now BFSI segment
▪ Expanding into new geographies like Middle East and European Union through Germany, these are relatively new as
business started like five years ago
▪ Company has a very strong visibility of $20 million in sales pipeline for rest of the fiscal which is strong indicator
that, they are bullish about the future in terms of continued demand from the customer
▪ Several core team members and management team of the company has been associated for 10+ years
▪ InfoBeans actively managed Covid Helpline and Vaccination drive for its members
▪ InfoBeans ranked among “High Growth Companies Asia-Pacific 2021” by the Financial Times
Concall Highlights

28
IRIS Business Services Limited –Global XBRL Software, Services And Solutions Provider
▪ A global XBRL software, services and
solutions provider with offerings
across the information supply chain,
and working across data standards
▪ Clients include Enterprises, large and
small; Business registries, Central
Banks, Stock Exchanges, and the
governments globally
▪ Over eighteen years of proven
expertise in the financial information
management space
Stock Profile
Incorporated 2000
BSE 540735
Issued Shares (Mn) 18.9
Share Price* (₹) 127.55
Market Cap* (₹ Mn) 2,451.3
52-week Range (₹) 147.55-25.40
Shareholding Pattern (%)
Promoters 38.1
Public 61.9
* SHP (BSE) as on 30th June’21
*Share price & Market cap (BSE) as on 17th August’21
0.0
100.0
200.0
300.0
400.0
500.0
600.0
Sep-20 Dec-20 Apr-21 Aug-21
Relative Price Performance
Sensex BSE IT IRIS Business Services
COLLECT
Offerings range from enterprise software to cloud/ SAAS to create documents ready to be filed with regulato₹
CONSUME
Software tools for data analysis. Plus, a global repository of normalized financial data culled from filings, if available publicly.
CREATE
Software platform for regulators to collectpre-validated submissions from those that they regulate.
Product Portfolio
COLLECT
▪ TAXONOMY &
CONSULTING:
Taxonomy design and
development, Taxonomy
testing and review,
Training, R&D
▪ IRIS IFILE : On Prem
Filing platform for
regulators to help them
receive pre validated
data in XBRL
CREATE
▪ CARBON : SAAS Document
Authoring and Compliance
Reporting Platform
▪ IDEAL :On-Prem
Solution to for banks to
automate their reporting in
XBRL
▪ IRISGST : SAAS An end-to-
end solution to facilitate GST
reporting in India
▪ EINVOICING: SAAS
Facilitates eInvoice creation
and management, seamless
integration with IRISGST
CONSUME
▪ Credixo : DAAS GST data
feeds to facilitate lending
decisions
▪ IRIS PERIDOT: Mobile /
DAAS App to verify
GST compliance, similarly
APIs to pull such data

29
IRIS Business Services Limited
Key Highlights
INCOME STATEMENT HIGHLIGHTS
• Revenue growth of 10% YoY from ₹ 5,157 lakhs in FY20 to ₹ 5,659 lakhs in FY21
• Total expenses growth contained at 8% YoY from ₹ 4,364 lakhs in FY20 to ₹
4,706 lakhs driven by an increase in employee expenses by 10% YoY
• Finance Cost moves up by 9% YoY mainly due to one time loan foreclosure and
loan processing charges of ₹ 38.5 lakhs. Other finance cost have reduced 16%
YoY from ₹ 155 lakhs in FY20 to ₹ 130.5 lakhs in FY21.
• EBITDA growth of 23% from ₹ 826 lakhs in FY20 to ₹ 1,012 lakhs in FY21
• PAT up from ₹ 46 lakhs in FY 20 to ₹ 272 lakhs in FY 21
• Diluted EPS at ₹ 1.44 per share in FY21 compared to ₹ 0.25 per share
BALANCE SHEET AND CASH FLOW HIGHLIGHTS
• Slight increase in paid up capital due to allotment of ESOP shares
• Reduction in loan term borrowings due to repayment of term loan. Long term
borrowings includes finance lease obligations related to leased office
equipment
• Moderate increase in short term borrowings from ₹ 586 lakhs in FY20 to ₹
602 lakhs in FY21
• Cash and Cash equivalents jumps from ₹ 169 lakhs in FY20 to ₹ 845 lakhs in
FY21
• Cash flow from operations increases substantially to ₹ 1,124 lakhs in FY21
from ₹ 180 lakhs in FY 20
• Trade receivables decrease from ₹ 1,748 lakhs in FY20 to ₹ 1,307 lakhs in FY21
Income Statement Highlights
Balance Sheet Highlights
(₹ mn.) FY20 FY21 H1FY21 H2FY21
Net Revenue 516 566 229 337
EBITDA 83 101 26 76
EBITDA margin 16.0% 17.9% 11.2% 22.2%
PAT 5 27 -13 40
PAT margin 1.0% 4.7% -5.7% 11.9%
Diluted EPS (₹) 0.25 1.44 -0.65 2.10
(₹ mn.) FY19 FY20 FY21
Networth 242 246 275
Total Borrowing 105 88 62
Cash and Cash Eq. 59 17 85
Total Assets 634 572 569
Collect,
43%
Create,
52%
Consume, 5%
Revenue By Segment (FY21)

Stock Profile
Incorporated 1982
BSE/NSE 523704/MASTEK
Issued Shares (Mn) 25.27
Share Price* (₹) 2,620.30
Market Cap* (₹ Mn) 66,548
52-week Range (₹) 2,873.20 – 663.35
30
Mastek Limited –An Agile, Digital Transformation Solutions Provider
Shareholding Pattern (%)
Promoters 44.32
Public 55.68
Top Institutional/Public Holders (%)
Abakkus Growth Fund - 1 3.25
Abakkus Emerging Opportunities
Fund – 12.46
Hornbill Orchid India Fund 1.44
IDFC MF 1.98
*SHP (BSE) as on 30th June ’21
▪ A Publicly held global IT Solutions player
✓ Trusted partner in complex Digital & Agile transformation programs with over
30+ years of experience
✓ Worldwide provides new technology and enterprise solutions with a focus on
four key verticals - Government, Retail, Healthcare and Financial and IT services
✓ Key Service offerings - Application development, Oracle Suite & Cloud
Migration, Digital Commerce, Application Support, & Maintenance, BI &
Analytics, Assurance & Testing and Agile Consulting
✓ With digital solutions constituting more than 80% to the business, Mastek is
emerging as one of the leaders in Enterprise Digital Transformation journey
▪ Formation
✓ Founded in 1982 by Ashank Desai, Ketan Mehta, Sudhakar Ram and R. Sundar
✓ In 2015, demerged Insurance business as separate entity ‘Majesco Ltd’
▪ Acquisitions/Demerger
✓ 2020, Acquired Evosys, a platinum partner for Oracle ERP in EMEA-UK
✓ 2016, Digility acquired the Trans American Infosystems (TAISTech) and Mastek
Ltd. acquired the offshore arm of TAISTech for US$23.75 mn
✓ 2015, Demerged Insurance Product & Services Business into Majesco Ltd.
✓ 2015, Acquired agile programme management firm Indigo Blue (UK)
✓ 2010, Acquired Kognitio’s Data migration business
✓ 2007, Acquired Vector Insurance Services in North America
✓ 2000, Acquired Systems Task Group (STG) MCS Global, Inc. (US)
*Share price & Market cap (BSE) as on 17th August ’21
0.0
100.0
200.0
300.0
400.0
500.0
Sep-20 Nov-20 Feb-21 May-21 Aug-21
Relative Price Performance
Sensex BSE IT Mastek

31
Mastek Limited
Revenue Distribution (Q1FY22)
Income Statement Highlights
Balance Sheet Highlights
(₹ mn.) FY20 FY21 Q4FY21 Q1FY22
Net Revenue 10,715 17,219 4,832 5,212
YoY Growth (%) 3.7% 60.7% 43.5% 29.4%
EBITDA 1,967 3,924 1,092 1,175
EBITDA margin 17.7% 22.4% 22.4% 22.5%
PAT 1,138 2,517 757 802
PAT margin 10.2% 14.4% 15.6% 15.4%
YoY Growth (%) 12.2% 121.2% 94.4% 72.2%
Diluted EPS (₹) 42.93 81.9 23.3 26.4
(₹ mn.) FY19 FY20 FY21
Networth 7,164 9,275 10,406
Total Borrowing 725 3,337 2,406
Cash and Cash Eq. 2,445 4,147 8,489
Total Assets 9,869 19,024 22,956
51%34%
12%4%
By Services
Application
Transformation
Enterprise Applications
Digital Commerce &
Experience
Data, Analytics & AI
34%
14%26%
10%
17%
By Industry
Government Retail Services
Health Financial Services
Others
70%
15%
9%
6%By Region
UK & Europe US ME ROW
Key Highlights
▪ Management expects the company to generate premium revenue growth
from its growth engine, Oracle commerce cloud services and better
clients mining strategy
▪ Strong presence in U.K Government
▪ Clean Balance Sheet & constant dividend payout policy
▪ Company changed its strategy from ‘cut & grow’ to ‘cut & invest’ model
▪ Integration of Evosys continues to be in line with company’s expectation
▪ Globally, organizations are accelerating the adoption of digital technology
to strengthen recovery and transform their businesses, this creates a huge
opportunity for Mastek as a Next Generation Services Partner

32
Mastek Limited
Concall Highlights
▪ Q1FY22 Revenue at ₹ 516.5 crore, up by 6.9% on QoQ basis and 33.8% on YoY basis
▪ In Constant Currency terms revenue grew by 4.3% QoQ and 27.2% YoY
▪ EBITDA grew by 7.6% QoQ and 38.5% YoY with the margin at 22.5%
▪ PAT grew by 6.0% QoQ and 72.2% YoY at ₹ 80.2 crore with the PAT margin at 15.4% in Q1FY22
▪ Added 40 new clients; Total client count as of 30th June, 2021 was 651 (LTM) as compared to 639 (LTM) in Q4FY21
▪ 12 month order backlog was ₹ 1,177.7 crore ($158.4mn) in Q1FY22 reflecting a growth of 4.2% in rupee terms and 2.1% in CC terms on
QoQ basis and Rs 764.5 crore ($101.3mn) in Q1FY21, reflecting a growth of 54.0% in rupee terms and 45.5% in CC terms on YoY basis
▪ Won a $6mn account, jointly sold in Europe, showcasing synergy between Evosys and Mastek
▪ Total cash, cash equivalents and fair value of Mutual Funds stood at ₹ 959.8 crore in quarter
▪ Total headcount 4,302 as on 30th Jun’21; 510 added during quarter Mastek is investing in building digital capabilities, training employees
in leadership, building marketing and sales teams and partnerships for the new areas – primarily, the UK private sector and the US
▪ Appointed Hiral Chandrana as new Global Chief Executive Officer (CEO) to move ahead company’s growth story around digital
transformation. He has a strong track record in various facets of IT Services industry and scaling digital businesses. His successful global
leadership experience will help Mastek continue to deliver industry-leading growth, strengthen its global positioning and expand
capabilities in Digital & Cloud. In medium term, the newly-appointed CEO would focus on joint go-to-market strategy, strengthening
Mastek’s presence in the healthcare vertical apart for retail & manufacturing in the US and addition of Fortune-1000/500 clients
▪ Management indicated that it witnesses strong demand in the UK public sector despite slow decision making for spend on technologies
during the last quarter. In the UK private sector vertical, Mastek would leverage Evosys clientele for cross-sell opportunities and
management remains confident that the UK private sector’s growth rate would match the company’s growth rate in coming years

33
OnMobile Global Limited –Global Leader in Mobile Entertainment
▪ Headquartered in Bengaluru, India, provides value added services in
telecommunication business
▪ OnMobile is a pioneer in mobile entertainment for carriers across the globe
▪ Provides end to end mobile entertainment solutions that include platform, apps,
content partnerships, and professional services
▪ Offers a wide array of products – Tones, Contests, Videos, Games
▪ Has a diverse portfolio of digital content, entertainment and infotainment products
▪ Has global operations with 98 customers across the globe
▪ B2B Products deployed with non-telco / digital players such as Samsung Galaxy,
Micromax, PhonePe, bKash
▪ New mobile gaming products – Challenges Arena and ONMO
▪ Invested in AI & Cloud Streaming – RoB0 and Appland
▪ Based on current deployments, OnMobile has over 80.05 million monthly users
▪ Acquisitions
✓ Apr’21, acquired 10% stake in Chigari, a video app for ₹ 31.8 crore
✓ May’20, acquired 25% stake in AI-powered visual retention leader rob0 Inc.
✓ Oct’18, acquired Appland AB, games & kids App Clubs subscription services
✓ Jun’13, acquired Livewire Mobile, a ringtone infotainment company
✓ Oct’10, acquired Dilithium Networks, a developer of 3G video technology
✓ Mar’08, acquired Telisma, a French speech recognition technology company
✓ Dec’06, acquired ITFinity, mobile software company, for $10–20 million
Shareholding Pattern (%)
Promoters 48.59
Public 51.41
Stock Profile
Incorporated 2000
BSE/NSE 532944/ONMOBILE
Issued Shares (Mn) 104.8
Share Price* (₹) 119.00
Market Cap* (₹ Mn) 12,526
52-week Range (₹) 154.35 – 35.40
*Share price & Market cap (BSE) as on 17th August ’21
*SHP (BSE) as on 30th June ’21
0.0
100.0
200.0
300.0
400.0
500.0
Sep-20 Nov-20 Feb-21 May-21 Aug-21
Relative Price Performance
Sensex BSE IT OnMobile

34
OnMobile Global Limited
Revenue Distribution (Q1FY22)
Key Highlights
▪ OnMobile’s extensive mix of local and international content represents a high-
value proposition for carriers
▪ Constantly updated mobile content library provides an additional source of
income to carriers The interest driven by the services increases operator revenue
and improves their margins
▪ Dominating market share in Tones business
▪ Challenges Arena is Mobile Quiz Games app, B2B business model, distributed
through Telcos and OTTs; Launched in April’21
▪ ONMO is Mobile cloud gaming for eSports & social play driven by AI is global
B2C business model; Beta launched in May’21
▪ Debt free company with solid cash position
▪ Stable Dividend Payout
Income Statement Highlights
Balance Sheet Highlights
(₹ mn.) FY20 FY21 Q4FY21 Q1FY22
Net Revenue 5,884 5,760 1,370 1,351
YoY Growth (%) (0.9%) (2.1%) (9.7%) (8.0%)
EBITDA 409 682 154 145
EBITDA margin 7.1% 12.4% 11.8% 11.3%
PAT 276 460 149 164
PAT margin 4.8% 8.3% 11.4% 12.7%
YoY Growth (%) 46.0% 66.6% (16.5%) 35.8%
Diluted EPS (₹) 2.61 4.41 1.42 1.54
(₹ mn.) FY19 FY20 FY21
Networth 5,658 5,900 6,261
Total Borrowing - - -
Cash and Cash Eq. 2,723 2,745 2,662
Total Assets 8,726 8,810 8,996
59%
19%
14%
7%
1%
Sales breakup by Geography
Europe ME&A India Asia Americas
49%
38%
7%
4%
3%
Sales breakup by Product
Videos Tones Games Contest Infotainment

35
OnMobile Global Limited
Concall Highlights
▪ Revenue remains stable at ₹ 135 crore
▪ Cost rationalization efforts are continuing and have yielded savings with a reduction of 11.8% QoQ and 11.6% YoY in
manpower costs
▪ EBITDA at ₹ 145 Mn continues to remain in double digits with a margin of 11.3% for the quarter
▪ PAT grew by 9.8% QoQ and 35.8% YoY to ₹ 164 Mn
▪ DSO improved to 122 days in Q1FY22 vs 137 days in Q1FY21
▪ Net Cash at ₹ 2,272 Mn (₹ 2,662 mn Q4FY21), drop is due to Chingari Investment ₹ 318 Mn & other R&D cost ₹ 71 Mn
▪ Company continue to digitally transform its core existing products. Digital tones showed robust growth of 12.5% QoQ and
17% on YoY basis. This is primarily driven by more digital app installs. Digital app installs grew by 54% YoY to ~21.4 mn
installs which is 8.0% QoQ growth
▪ Challenges Arena is seeing good traction since the launched in April 2021, had 6 customer sign-ups and 2 live customers
with total gross subscribers of ~490,000 and in Q2FY22 it is estimated to see 12 customer signups On track for 25 customer
signups and 20 live customers by Q4 FY22
▪ On the ONMO B2C cloud gaming platform management continue to see huge progress on multiple fronts
▪ In line with company’s strategy to shut down any business entity that does not measure up to stated goals of revenue and
profitability, management is continuing to focus on unprofitable Latin American businesses, and they are in the process of
exiting from those countries; have completed this process substantially in FY21 and full closure of entity is expected in FY22

36
Saksoft Limited –Digital Transformation Solutions Provider
Stock Profile
Incorporated 1999
BSE/NSE 590051/SAKSOFT
Issued Shares (Mn) 10.49
Share Price* (₹) 753.00
Market Cap* (₹ Mn) 7,530
52-week Range (₹) 780.00 – 233.00
Shareholding Pattern (%)
Promoters 69.11
Public 25.82
*SHP (BSE) as on 30th June ’21
• IT software products company and provides end-to-end business solutions across the world that
enables its customers to enhance business performance
• Offers entire gamut of technology solutions ranging from Intelligent Automation, Legacy
Modernization, Managed Infrastructure support, Advanced Analytics, QA across verticals
• Leading digital transformation solution partner for Fintech, Logistics & Transportation, Retail/E-
commerce, Health care and Telecom customers worldwide
• Headquartered in Chennai (India), and has 14 offices across the USA, Europe and Asia
• With ‘String of Pearls’ strategy, Saksoft is a group made up of organisations that are specialists in
specific verticals, region and uniqueness*Share price & Market cap (BSE) as on 17th August ’21
0.0
100.0
200.0
300.0
Sep-20 Nov-20 Feb-21 May-21 Aug-21
Relative Price Performance
Sensex BSE IT Saksoft

37
Saksoft Limited
Revenue Distribution (Q1FY22)
Income Statement Highlights
Balance Sheet Highlights
(₹ mn.) FY20 FY21 Q4FY21 Q1FY22
Net Revenue 3,588 3,858 975 1,021
YoY Growth (%) 0.2% 7.5% 0.0% 8.9%
EBITDA 610 644 156 156
EBITDA margin 17.0% 16.7% 16.0% 15.2%
PAT 387 454 125 177
PAT margin 10.8% 11.8% 12.8% 17.3%
YoY Growth (%) 1.2% 17.6% 10.5% 74.6%
Diluted EPS (₹) 38.67 45.68 12.57 17.76
(₹ mn.) FY19 FY20 FY21
Networth 1,753 2,062 2,593
Total Borrowing 200 255 390
Cash and Cash Eq. 900 429 401
Total Assets 3,652 3,034 2,785
22%
32%
46%
By Region
APAC & Others Europe Americas
Focused Strategy of Growth –
• Inch Wide and Mile Deep - Addressing target markets with services that
differentiate from competition and emerging as one of the fastest-growing
and most profitable across our verticals
• Value Over Volume - Address unoccupied territories represented by projects
with higher profitability
• Consolidating Front End - Consolidating marketing front-end to reach more
clients, accounts, trades and systems with objective to squeeze growth from
our platforms at minimal costs
• String’s Of Pearl - Engage in business complementing M&As that constitute
a ‘string of pearls’ strategy that enhances our competence immediately
following acquisition without corresponding gestation
• Building high performance teams focused on sustainable growth
• Focus on Emerging Sector - Addressing the sweep of digitisation to help
clients enhance operational efficiency
• Being Nimble - We are a mid-tier company with few decision making layers,
enhancing our agility
26%
23%9%6%
9%
27%
By Verticals Fintech
Telecom
Transportation and
LogisticsPublic Sector
Retail & Health Care
Others

38
Saksoft Limited
▪ Revenue at ₹ 102.1 crore v/s ₹ 93.7 crore in Q1FY21, a growth of 8.9% on and 4.8% on QoQ
▪ Operating EBITDA at ₹ 15.5 crore v/s ₹ 14.9 crore in Q1FY21, growth of 4.7% on YoY and flat on QoQ
▪ Operating EBIDTA margin at 15.2% v/s 15.8% in Q1FY21 and 16.0% in Q4FY21
▪ PAT (before minority) at ₹ 17.6 crore v/s ₹ 10.1 crore in Q1FY21, a growth of 74.6% on YoY and 41.4% on QoQ
▪ PAT margin at 17.3% v/s 10.8% in Q1FY21 and 12.8% in Q4FY21
▪ Moved one customer from $0.5Mn to $1Mn segment during the quarter
▪ Added a new customer in the 1Mn segment during the quarter
▪ Revenue mix - 48% onsite and 52% offshore for Q1FY22
▪ Whilst the pandemic has posed many challenges, company’s strategy around farming of existing accounts coupled with the “inch
wide mile deep” philosophy has enabled to get a greater wallet share of IT spend from customers with Saksoft being more and more
recognized as a trusted partner rather than just another supplier.
▪ Continue to focus on our select industry verticals. As continue to steer through this pandemic, keep the health, wellness and safety
of our employees as one of our major priorities.
▪ Digital transformation of clients at the core of our services; customer focus and innovation built in Core values. These values enables
business to stay more relevant in the ever evolving market
▪ Strong Track Record - clean balance sheet, growing revenue and profitability
▪ Focus on the trinity of Fintech, Transportation & Logistics and Retail/Ecommerce with their interconnectivity places us in a sweet spot
to design & address solutions
▪ Experienced and dedicated management team with a diversified board
Press Release Highlights

Stock Profile
Incorporated 1994
BSE/NSE532221/
SONATSOFTW
Issued Shares (Mn) 105.16
Share Price* (₹) 876.00
Market Cap* (₹ Mn) 92,120
52-week Range (₹) 900.60 – 291.35
39
Sonata Software Limited –Differentiated IP Led Player
▪ Global IT services and technology solutions company
✓ Delivers innovative solutions for Travel, Retail & Distribution and Software Product
companies through IP based Platforms, Products and Services.
✓ Key segments – International IT Services (IITS) and Domestic Products & Services (DPS)
✓ Solutions bring together new digital technologies such as Omnichannel commerce,
Mobility, Analytics, Cloud and ERP
✓ Have alliances with Microsoft, SAP, IBM, Oracle, HP to deliver solutions
✓ Have differentiated IP-led (not IP-based) strategy, wherein it focus on creating own IPs,
implement customised solutions across products (Hybris, Microsoft Dynamics Ax Retail)
& offer white labelled solutions. This helps clients to lower IT spends on platform
building & increases customer stickiness for Sonata
✓ Acquired/own built IP products - Rezopia (Travel), Halosys (Mobility), Advanced Supply
Chain software, Retina and Brick and Click (Retail)
▪ Formation
✓ Founded in 1986 as the IT Division of Indian Organic Chemicals
✓ In 1994, it spun off as independent entity and went public in 1998
✓ Promoted by Raheja Group; managed by P. Srikar Reddy (CEO since 2012)
▪ Successful acquisitions over last 6 years -
✓ Jul’21, acquired US based IT services company, Encore Software Services
✓ Mar’20, acquired Melbourne headquartered GAPbusters (GBW) in Customer Experience
✓ Dec’18, acquired US-headquartered Sopris Systems for ₹ 50 crore and Australia based
Scalable Data Systems for ₹ 28 crore to grow its MS Dynamics 365 business
✓ Oct’15, acquired supply chain software and services provider I.B.I.S., Inc.
✓ Aug’15, acquired Halosys, an enterprise mobility technology provider
✓ Aug’14, acquired Rezopia, a cloud-based travel ERP platform
Shareholding Pattern (%)
Promoters 28.17
Public 70.64
Top Institutional/Public Holders (%)
Hemendra M Kothari 10.14
HDFC Trustee 8.59
L&T Mutual Fund 2.22
Goldman Sachs India Limited 1.68
Vanguard Total International
Stock Index Fund 1.00
*SHP (BSE) as on 30th June ’21
50.0
100.0
150.0
200.0
250.0
300.0
Sep-20 Nov-20 Feb-21 May-21 Aug-21
Relative Price Performance
Sensex BSE IT Sonata Software
*Share price & Market cap (BSE) as on 17th August ’21

40
Sonata Software Limited
Revenue Distribution (Q1FY22)
Income Statement Highlights
Balance Sheet Highlights
(₹ mn.) FY19 FY20 FY21
Networth 7,683 6,697 9,055
Total Borrowing 156 860 897
Cash and Cash Eq. 1,743 3,722 6,407
Total Assets 15,281 16,165 19,469
33%
10%18%
21%
9%
2%
7%
By Vertical
ISV Travel
Others Dist & Mfgt
Retail (Essential) Retail (Non Essential)
Comm & Serv Ind.
51%
25%
24%
By Region
US Europe ROW
(₹ mn.) FY20 FY21 Q4FY21 Q1FY22
Net Revenue 37,433 42,281 10,757 12,685
YoY Growth (%) 26.0% 13.0% 16.0% 33.0%
EBITDA 4,312 4,071 1,220 1,291
EBITDA margin 11.5% 9.6% 11.1% 10.2%
PAT 2,769 2,440 831 867
PAT margin 7.4% 5.7% 7.6% 6.8%
YoY Growth (%) 11.0% (12.0%) 34.0% 74.0%
Diluted EPS (₹) 26.66 23.48 7.99 8.34
Key Highlights
▪ Continues to focus on “Platformation” strategy in selected verticals (Retail/Travel/ISV)
▪ Partnering with customers by selling its platform strategy in three flavour’s –
✓ Ready (Brick Click, Rezopia, IBIS)
✓ Accelerate (SAP Hybris, Microsoft Cortana Intelligence)
✓ Custom (Rapid, Halosys)
▪ Five growth engines to drive growth: Alliance led growth, IP-led growth, vertically led
growth, growing existing customers and Transforming India business by becoming a
digital infrastructure services partner
▪ Consistent Track record of Growth and profitability over last 10 years
✓ ROCE and RONW >35%
✓ Revenue Growth at 17% CAGR over last 10 years
✓ EBITDA growth at 31% CAGR over last 10 years
▪ Strong Balance sheet with regular dividend payout

41
Sonata Software Limited
Concall Highlights
▪ International IT Services (IITS) revenue came at $44.5 mn, +1.6% QoQ USD, 21.9% YoY USD. Growth was soft due to higher
absenteeism (impact of second COVID wave). Management mentioned demand environment and deal flow remains robust with
growth likely to recover from Q2FY22 with 3-4% organic growth per quarter
▪ Growth was driven by digital based competencies like Data & Analytics (+10.9% QoQ), Managed Cloud Services (+3.4% QoQ),
Open Source Digital Platform Services (+6.1% QoQ) and Microsoft Digital Platformation Services (+2.5% QoQ)
▪ In terms of verticals, Retail (essential) led the growth with 8.7% QoQ USD. Retail (Non-Essential) recovered strongly with 35.4%
QoQ USD. Growth in travel was modest at 2.9% QoQ USD and is expected to recover when demand for normal operations
reaches close to pre-covid levels (currently at 20%) for largest travel client. Rest all the verticals posted muted growth.
▪ Domestic Product Services (DPS) business grew by +24% QoQ USD, +44% YoY USD, driven by multi-year annuity enterprise
sales. Share of cloud based deals further increased to 76%, +100 bps QoQ, and that of annuity deals increased to 74%, +200
bps QoQ. DPS business has shown very good recovery in last four quarters despite COVID. Strong demand momentum will
sustain led by accelerated demand for cloud transformation. Plus, additional revenues from new alliances with AWS and GCP
will start flowing in from FY22
▪ Sonata acquired Encore IT, a global IT service provider enabling digital transformation with experience in cloud, based out of
San Jose US and delivery center in Chennai. The acquisition provides Sonata access to a wider digitally skilled talent pool (300-
person team in Chennai delivery Centre) and entry into healthcare and pharma vertical. Encore revenues consolidated into
Sonata from 1st Aug 21 and per quarter it will add $3mn revenue and $500K EBITDA. Total consideration payable for the
acquisition is USD 14.62 Mn (INR 1100 mn) which comprises of upfront cash consideration of USD 6.37 Mn (INR 480 mn) and
contingent consideration of USD 8.25 Mn (INR 620 mn) payable over 3 years

0.0
100.0
200.0
300.0
400.0
500.0
600.0
700.0
Sep-20 Nov-20 Feb-21 May-21 Aug-21
Relative Price Performance
Sensex BSE IT Subex42
Subex Limited–Telecom Analytics Solutions Provider
Stock Profile
Incorporated 1992
BSE/NSE 532348/SUBEX
Issued Shares (Mn) 562.00
Share Price* (₹) 53.55
Market Cap* (₹ Mn) 30,095
52-week Range (₹) 74.45 – 9.28
Shareholding Pattern (%)
Promoters 0.00
Public 96.99
*SHP (BSE) as on 30th June ’21
▪ Leading player in the telecommunication space focusing on products to communications
service providers (CSPs) globally to drive digital transformation and competitive differentiation
▪ Founded in 1992, Subex has spent over 25 years in helping Global Communications Service
Providers maximize their revenues and profitability
▪ Having served the market over the last 2 decades by providing world-class solutions for
business optimization and analytics, Subex is now leading the way by enabling all-round Digital
Trust in the business ecosystems of its customers
▪ Focusing on privacy, security, risk mitigation, predictability and confidence in data, Subex helps
businesses embrace the disruptive changes in business landscape & succeed with Digital Trust
▪ Subex’s 3H Strategy for Growth:
*Share price & Market cap (BSE) as on 17th August ’21

43
Subex Limited
Revenue Distribution (Q1FY22)
Income Statement Highlights
Balance Sheet Highlights
(₹ mn.) FY20 FY21 Q4FY21 Q1FY22
Net Revenue 3,650 3,720 962 806
YoY Growth (%) 4.8% 1.9% 2.4% (9.1%)
EBITDA 942 985 232 162
EBITDA margin 25.8% 26.5% 24.1% 20.1%
PAT (2,692) 517 156 135
PAT margin NA 13.9% 16.2% 16.7%
YoY Growth (%) (1,167%) 119.2% (51.2%) (11.1%)
Diluted EPS (₹) (4.94) 0.96 0.28 0.24
(₹ mn.) FY19 FY20 FY21
Networth 7,941 5,154 5,486
Total Borrowing - 58
Cash and Cash Eq. 395 904 1,429
Total Assets 8,965 6,910 7,267
33%
38%
29%
By ServiceManaged Services
Support and Others
Implementation ,
Customisation, License
63%16%
18%3%
By Region
EMEA APAC & ROW America India
Key Highlights
▪ Leader in Digital Trust space and helping businesses thrive by leveraging Digital Trust as a
competitive advantage
▪ Making strong Rsoads in the multi vertical IoT Security space; IoT Security Market is
expected to touch US$ 4.5 billion by 2022
▪ Incubating virtual startups within the organization to diversify into new areas and verticals
▪ Sticky Revenue Model – about 60% of revenue is annuity / recurring and >98% customer
retention
▪ Investing heavily in newer areas like Digital Trust and AI/ML, Deep learning-based anomaly
detection
▪ With launch of HyperSense and progress on IOT-Security and ID Central company
transitioning towards a Platform based SaaS business model
▪ Passionate and committed team led by CEO Vinod Kumar with clear focus to put the
company on growth track

44
Subex Limited
▪ In Q1FY22, reported revenues of ₹ 80.6 crores, drop of 16.2% QoQ and 9.1% YoY. While traditionally, Q1 tends to be lower
than the average quarterly revenues, the delays on account of project deliveries caused by pandemic negatively affected
Q1FY22 revenues
▪ EBITDA was at ₹ 16.2 crores; EBITDA margin was at 20.1% and PAT was at ₹ 13.5 crores
▪ Management expects EBITDA on steady state basis to be in the range of 20%-22% in FY22
▪ As on 30th June 2021, total contracted backlog is US$ 111.34 Mn; out of this the next 12 months backlog is US$ 42.44 Mn
▪ 75% of the business both new and old, come from existing customers
▪ Total Headcount stood at 1,117 v/s 1,081 in Q4FY21 and 902 in Q1FY21
▪ HyperSense continued to create momentum. Have 3 customers where HyperSense platform is under implementation. AI
Studio, which is a very key component of the HyperSense is generating a lot of interest as it provides customers a tool to fast-
track AI/ML deployment and adoption within their organization
▪ The new GTM approach of going via distributors and channel partners has significantly increased company’s reach when it
comes to IoT/OT security. Management is focusing primarily on the critical infrastructure and manufacturing industrial
segment based on the current hype of cyber activities, cyber threat and cyber activities that they are seeing in those segments
▪ In identity analytics IDCentral, company has on boarded customers, both from Indonesia and India, the two markets that they
are currently focused on. In this the target segments here as crypto exchanges, e-wallets, lending, gaming, banks, NBFCs,
brokerage, trading, payment gateways, etc, primarily the new age, ecommerce-based organizations
▪ Recently won a seven-digit, five-year contract from Dhiraagu for integrated revenue assurance & fraud management solution
▪ On boarded Asha Subramanian as new Head of HR. She will be spearheading company’s talent acquisition and management
Concall Highlights

45
Stock Profile
Incorporated 1989
BSE/NSE 500408/TATAELXSI
Issued Shares(Mn) 62.23
Share Price* (Rs) 4,712
Market Cap* (Mn) 2,89,585
52-week Range(Rs) 4,794-1,031
Shareholding Pattern (%)
Promoters 44.53
Public 55.47
Tata Elxsi Limited –World’s leading providers of design and technology services
* SHP (BSE) as on 31st Mar’21
*Share price & Market cap (BSE) as on 17th August ’21
Key Highlights
▪ Incorporated in 1989, Tata Elxsi is part of multi-billion Tata Group and
amongst the world’s leading providers of design and technology services
across industries including Automotive, Media, Communications and
Healthcare.
▪ Tata Elxsi provides technology consulting, new product design,
development, and testing services. By intersecting design and technology,
Tata Elxsi creates innovative products, services and experiences to build
brands and help businesses grow.
▪ Tata Elxsi provides integrated services – from research and strategy, to
electronics and mechanical design, software development, validation and
deployment, and is supported by a network of design studios, global
development centers and offices worldwide. We combine deep domain
expertise with over 30 years of technology and product development
experience, that enable brands to differentiate and win.
▪ Tata Elxsi is helping customers reimagine their products and services
through design thinking and application of digital technologies such as IoT
(Internet of Things), Cloud, Mobility, Virtual Reality and Artificial Intelligence.
0
100
200
300
400
500
Jul-20 Sep-20 Dec-20 Mar-21 Jun-21
Sensex TataElxsi

46
Income Statement Highlights
Tata Elxsi Limited
(INR mn.) FY19 FY20 FY21
Networth 9,428 10,900 13,522
Total Borrowing 0 583 732
Cash and Cash Eq. 5,158 6,642 8,596
Total Assets 11,434 13,890 17,167
Balance Sheet Highlights
(INR mn.) FY20 FY21 Q4FY21 Q1FY22
Net Revenue 16,099 18,262 5,184 5,583
YoY Growth (%) 0.8% 13.4% 18.1% 39.4%
EBITDA 3,430 5,224 1,680 1,500
% margin 21.3% 28.6% 32.4% 26.9%
PAT 2,561 3,681 1,152 1,134
% margin 15.4% 19.7% 21.9% 19.7%
YoY Growth (%) -11.7% 43.7% 40.3% 64.6%
Diluted EPS (₹) 41.12 59.1 18.5 18.2
Revenue Split (FY 21)
TA TA ELX S I ( FY20 - 2 1 )
System Integration (2.5%)
Software Development Services (97.5%)
Industrial Design & Visualization (9.3%)
Embedded Product Design (88.2%)
Transportation (41.2%)
Media & Telecom (44.7%)
Healthcare (9.9%)
Europe
33%
USA
44%
India
14%
RoW
9%
Revenue Break-up
Onsite
27%
Offshore
73%
Fixed
Price
48%
Time &
Material
52%
Operating Metrics
CUSTOMER CONCENTRATION
51%
40%
12%
Top 10
Top 5
Top
5,647
6,618
5.4%
10.2%
Q1FY21 Q1FY22
Data for Q1FY21
EMPLOYEES & ATTRITION
Healthcare (4.3%)

47
Concall Highlights
▪ Growth in this quarter was predominantly volume led, Growth was driven primarily by strong performance in both
our key divisions -- EPD and IDV. EPD division grew by 7.5% Q-Q and 31.4% Y-Y, and the IDV posted a smart
growth of 13.9% Q-Q and 132.1% Y-Y.
▪ Healthcare continues to grow faster than other industry verticals with the growth of 19.3% Q-Q and 80.2% Y-Y.
Media and Communications delivered another steady quarter with 8% Q-Q and 31.6% Y-Y growth. Transportation
business continues to show revival with a 3.4% Q-Q and a 20% Y-Y growth.
▪ Quarter saw good mining in Top 5 customers Top client now is in the Media and Communications space
▪ Entering Q2 with strong Order Book and healthy pipeline which gives confidence on the growth momentum
▪ Headcount addition of 552 during the quarter is to build capacity to address the strong order book
▪ Wage hike will be to the tune of 7-8% and will be effective from July 1st for key people
▪ Confident that margins would be in-line with this quarter US outperformed other markets as company has
invested in sales and consultants in US for some time. Additionally,
▪ Automotive business is largely US centric. Healthcare and Media and Comms is Europe concentrated.
▪ Geography wise, growth was led by the Americas with 17.5% Q-Q and 59.3% Y-Y. Europe grew by 5.4% Q-Q and
30.1% Y-Y. India grew by 2.8% Q-Q and 47.6% Y-Y. Europe growth was relatively lower compared to US, but
management is working on recovery in Europe and should recover on the back of higher spend from Automotive
spend
▪ Utilization improved to 79% during the quarter. Onsite Offshore mix stood at 10%:90% – offshore % has gone up
drastically during lockdown. Once lockdowns open up, onsite would increase but not to pre-COVID levels.
Tata Elxsi Limited

48
Xelpmoc Design and Tech Limited –Technology Services and Solutions Company
▪ Bengaluru based startup providing technology services & end-to-end technology solutions
▪ Key Offerings –
✓ Technology Services:
- Caters to Start up level companies, Corporates, Indian Government Organisations
- Comprises of Data Science, Artificial Intelligence, Machine Learning, Other emerging tools
- Provides wide range of services including mobile application development, prototype
development, thematic product development, query optimization, rapid iteration
✓ Technology Solutions/Products:
- Component library to quickly scale projects without external dependencies
- Data Science capabilities using modern technologies resulting in ease of use
- Has a team of developers and product managers which maintains and enhances existing
services and products along with executing client customizations requirement
▪ Business Model –
✓ Understanding intention of what is to be built & problem recognition
✓ Comprehensive study on the data being utilised to recognise statistical patterns
✓ Highlight points of data collection, quality & type of data to then derive the ML Model
▪ Engaged in ecommerce, transportation and logistics, recruitment, financial services, social
networking, and various other industries
▪ Operates in 4 cities in India; Have 48 clients and 86 Team members
▪ Formation
✓ Incorporated in Sept’15 as Xelpmoc Design and Tech Pvt. Ltd.; went public in Jan’19
✓ In Feb’19, listed on BSE and NSE by issuing IPO of 35,01,442 equity shares of Face Value
of ₹ 10 each at a ₹ 66/- per equity share
✓ Promoted by Sandipan Chattopadhyay, Srinivas Koora and Jaison Jose
Stock Profile
Incorporated 2015
BSE/NSE 542367/XELPMOC
Issued Shares (Mn) 13.71
Share Price* (₹) 372.9
Market Cap* (₹ Mn) 5,113
52-week Range (₹) 514-136
Shareholding Pattern (%)
Promoters 57.27
Public 42.73
* SHP (BSE) as on 30th Jun’21
*Share price & Market cap (BSE) as on 17th August ’21
80
130
180
230
280
330
Sep-20 Nov-20 Feb-21 May-21 Aug-21
Relative Price Performance
Xelpmoc BSE IT Sensex

49
Xelpmoc Design and Tech Limited
Key Highlights
▪ Additional Investment in India’s largest book distributor One Point
Six Technologies, publishing 100+ titles annually and spread across
100 cities.
▪ Additional investment in Slate.ac, a simplified business finance &
accounting platform for SMEs
▪ Investment in Naik TechXP, data science platform for delivering
financial advisory through personalized engagement and decision
assist tools
▪ Continued focus on promising portfolio companies operating in
EduTech and Health Care space and grow Fortigo, Mihup and Slate
Income Statement Highlights
Balance Sheet Highlights
(₹ mn.) FY20 FY21 Q4FY21 Q1FY22
Net Revenue 81 140 35.4 32.5
YoY Growth (%) 33.2% 73.21% 8.58% (7.2%)
EBITDA (27) 46 5.5 5.3
EBITDA margin NA 32.7% 15.4% 16.3%
PAT (22) 40.8 (1.5) (15.3)
PAT margin NA 26.9% NA NA
YoY Growth (%) NA NA NA NA
Diluted EPS (₹) (1.59) 2.98 (0.11) (1.08)
Fortigo Network Logistics Private Limited
Mihup Communications Private Limited
Pencil Publishing Private Limited
Madworks Ventures Private Limited
Key Investments in Various Companies
Snaphunt Pte. Limited
Woovly Private Limited
Kidsstoppress Media Private Limited
Taxi Top Media Private Limited
(₹ mn.) FY19 FY20 FY21
Networth 406 448 591
Total Borrowing - - -
Cash and Cash Eq. 25 5 9
Total Assets 498 535 698

50
Xelpmoc Design and Tech Limited
Quarter Highlights
▪ Newport Asia, a US based investment firm managing US$ 2.6 bn with a focus on long only investments for Asia, invested
in preferential allotment of 0.7 mn equity shares at ₹ 375 per share totalling ₹ 270 mn
▪ Shares subject to 1 year lock in and the allotment amounts to 5% of post issue paid up capital
▪ Preferential allotment issue proceeds to be utilized for augmentation of senior management level personnel, overseas
business expansion and ensuring long term growth of Xelpmoc
▪ Board has appointed Mr. Srinivas Kollipara as the “Group President - Startup Ventures”. Mr. Srinivas Kollipara, with 30 years
of international experience, is the founder of Hyderabad based T-Hub, India’s best known startup engine.
Financial Highlights
▪ Revenue was ₹ 32.5 mn in Q1FY22 on account of focus on maintaining business trajectory
▪ Operating EBITDA excluding ESOP was ₹ 5.3 mn in Q1FY22 as compared to ₹ 5.5 mn in Q1FY21
▪ Operating EBITDA margin was 16.3% in Q1FY22 as against 40.1% in Q1FY21 due to substantial fixed costs non-
occurrences from lockdown and is now coming back to expected mean
▪ Start-up portfolio value was ₹ 480.4 mn as on 30th June 2021 as compared to ₹ 347.3 mn as on 30th June 2020
Outlook
▪ Xelpmoc sees a promising growth in its portfolio companies given that they are concentrating on hitherto unaddressed
areas of the economy.
Concall Highlights

51
Zen Technologies Limited –IT Software / Defence
▪ A pioneer and leader in providing world class state of art Defence Training
Solutions
▪ The company is engaged in indigenous design, development and manufacture
of sensors and simulators technology based defence training systems
▪ The company manufactures land based military training simulators, driving
simulators, Live range equipment and Anti drone Systems.
Stock Profile
Incorporated 1993
BSE/NSE 533339/ZENTEC
Issued Shares (Mn) 79.5
Share Price* (₹) 83.65
Market Cap* (₹ Mn) 6,650
52-week Range (₹) 106.85 – 62.40
Shareholding Pattern (%)
Promoters 60.19
Public 39.81
* SHP (BSE) as on 30th Jun’21
*Share price & Market cap (BSE) as on 17th August ’21
27+YEARS OF
EXPERIENCE
100+CUSTOMERS
SERVED
109+PATENTS
FILED
ORDER
BOOK OF
192+CRORES
~67CRORES OF
INVESTMENTS
IN R&D IN
LAST 5 YEARS
~17%OF
CUMULATIVE
SALES
INVESTED IN
R&D IN THE
LAST 5 YEARS
200+EMPLOYEES
1,000+CUMULATIVE
INSTALLATIONS
Snapshot
Business Model
Sale of
equipmentCombat Training
Centre (CTC)
Annual Maintenance
Contracts
Large size orders with
long closing cycles
resulting in volatile
topline
Big-ticket scalable solutions,
including everything from basic
soldier training to a full-fledged war
training.
Recurring fixed income with
superior profit margins .and
growing service revenue from AMC
ensures profitability even in
absence and lumpiness of new
equipment orders
0.0
100.0
200.0
300.0
400.0
Sep-20 Nov-20 Feb-21 May-21 Aug-21
Relative Price Performance
Sensex BSE IT Zen Technologies

52
Zen Technologies Limited
Key Highlights
INCREASING PREDICTABILITY IN TURNOVER:
We are working towards strategically positioning the business model to reduce
lumpiness. The sale of equipment done in the last couple of years will start
contributing to the top line in terms of Annual Maintenance Contracts.
EQUIPMENT SALE ORDER WINS:
In the next couple of years the contributions from AMC stream will cover the fixed
operating expenses of the business. This will provide stability and predictability to the
business operation. The huge order wins of equipment sale can then offer huge
operating leverage and boost to our bottom line.
STRONG GOVERNMENT SUPPORT TO ACT AS TAILWIND:
The GOI has formulated several measures along with strict implementation timelines.
The governments keen focus on Make in India and Atmanirbhar Bharat campaign has
created a conducive environment to make in India for the defence industry. This
should act as a strong tailwind going forward
FOCUS ON NEW PRODUCTS:
The continuous investments in R&D ensure that the products are technologically
advanced and suited for the customer requirements. This coupled with more than 2
decades of track record of delivering value to our customers has not only made us
the preferred partner of choice but has also ensured enhanced share of their wallet.
Income Statement Highlights
(₹ mn.) Q1FY21 Q4FY21 Q1FY22
Revenue from
Operations 41.6 215.5 99.6
Other Income 6.9 8.9 7.5
Total Income 48.6 224.4 107.1
Total Operating
Expenses 58.6 184.7 109.7
EBITDA (excluding
other income)(17.0) 39.7 (10.1)
EBITDA Margins (40.77%) 18.42% (10.16%)
Interest Cost 1.3 2.9 1.6
Depreciation 12.4 12.6 12.5
Profit Before Tax (23.8) 24.2 (16.7)
Profit After Tax (17.4) 18.3 (15.7)
EPS (0.17) 0.17 (0.14)

Financial Services53

54
Top Institutional Holders (%)
LIC 8.66
General Insurance Corporation of India –Leader In The India Reinsurance Market
▪ Incorporated in 1972, GIC Re is the largest reinsurer in the domestic reinsurance
market in India, with gross written premiums of ₹ 1,34,177 crore and a market share
of approximately 60% in fiscal 2016-17.
▪ It has offices in London, Dubai, Kuala Lumpur and a representative office in
Moscow. In December 2017, GIC Re received approval to set up a syndicate at
Lloyd's of London. Process underway for setting up subsidiary in Russia to focus on
CIS countries.
▪ GIC Re maintains a diversified risk portfolio that includes property, motor,
agriculture, marine, engineering, aviation, health, liability. It leads many of the
domestic companies' treaty programmes and facultative placements.
▪ As a sole reinsurer in the domestic reinsurance market, GIC Re provides reinsurance
to the direct general insurance companies in the Indian market. GIC Re receives
statutory cession of 5 % on each and every policy subject to certain limits.
▪ GIC Re is 10th largest global reinsurer group based on figures for 2017-18 and 7th
largest non-life reinsurer globally
▪ GIC Re enjoys an excellent security rating international rating Agency A. M. Best for
past 5 years
▪ CARE has rated GIC Rs as “AAA (In) Claims Paying Ability” based on the financial
strength.
50
100
150
200Relative Price Performance
Sensex BSE Finance GIC
Shareholding Pattern (%)
Promoters 85.78
Public 14.22
Stock Profile
Incorporated 1972
BSE/NSE 540755/GICRE
Issued Shares (Mn) 1,754.4
Share Price* (₹) 155.70
Market Cap* (₹ Mn) 2,73,160
52-week Range (₹) 243.70/116.00
*Share price & Market cap (BSE) as on 17th August’21
* SHP (BSE) as on 30th June’21

55
Key Highlights
▪ Gross Premium Income of the company was ₹ 14,289.92 crore for
Q1FY22 as compared to ₹ 15,881.55 crore in Q1FY21
▪ Investment Income of ₹ 1,794.60 crore for year ended 30.06.2021 as
compared to ₹ 1,142.83 crore for quarter ended 30.06.2020.
▪ Incurred Claims Ratio is 104.3 % as on 30.06.2021 as compared to 94.2
% as on 30.06.2020.
▪ Loss After Tax for quarter ended 30.06.2021 recorded as ₹771.73 crore
as compared to ₹557.47 crore for quarter ended 30.06.2020.
▪ Combined Ratio is 123.36% for the quarter ended 30.06.2021 as
against 112.16 % for quarter ended 30.06.2020..
General Insurance Corporation of India
28%
17%
5%
37%
3%
3%8%
By Segment
Fire
Motor
Health
Agriculture
Marine
Life
Others
73%
27%
By Region
Domestic
International
Income Statement Highlights Standalone
(₹ mn.) FY20 FY21 Q4FY21 Q1FY22
Gross Premium 5,10,301 4,70,144 88,128 142,899
Net Premium 4,66,554 4,21,975 82,408 129,352
Earned Premium 4,41,454 3,98,659 75,736 113,544
Incurred Claims 4,30,359 3,68,538 62,022 118,374
% of Earned Premium 97.5% 92.4% 81.9% 104.3%
Net Commission 75,084 79,844 17,000 24,093
% of Net Premium 16.1% 18.9% 20.6% 18.6%
Underwriting Profit (63,672) (54,885) (5,351) (28,112)
Profit After Tax (3,591) 19,204 12,604 (7,717)
Combined Ratio (%) 114.4% 112.0% 103.5% 123.4%
Gross Premium Distribution (Q1FY22)

56
▪ The gross premium income of the company was ₹14,289 crores for Q1 FY22 as compared to ₹15,881 crores for Q1 FY21.
▪ The investment income has increased to ₹1794 crores in Q1 FY22 as compared to ₹1142 in Q1 FY21.
▪ Incurred claims ratio increased to 104% in Q1 FY22 as compared to 94% in Q1 FY21.
▪ The combined ratio in Q1 FY22 increased to 123% versus 112% for Q1 FY21. The adjusted combined ratio by taking into
consideration the policy holders investment income works out to 112% for Q1 FY22 as compared to 105% in Q1 FY21.
▪ The company recorded loss before tax of ₹1166 crores in Q1 FY22 as against loss before tax offer ₹811 crores in Q1
FY21 and loss after tax of ₹771 crores in Q1 FY22 against a net loss of ₹557 crores in Q1 FY21.
▪ Net worth of the company without fair value change account, increased to the ₹21,285 crores on 30/06/2021 as against
₹19,714 crores as on 30/06/2020.
▪ Number of claims that have been reported where the cause of death is specifically COVID till date is around ₹ 143
crores.
▪ The hike in the combined is because GIC Re has reserved very prudently for the two cyclones that hit the Eastern and
the Western coast.
▪ Last year the combined ratio was at around 135 for the fire which has come down to 121 for this quarter.
▪ Market value for equity is around ₹ 41,000 cr of which ₹ 12,000 cr is book value.
▪ The cat events are definitely posing a challenge for the reinsurance community in general which has seen pressure on
the return to investors during the last 5 years.
Concall Highlights
General Insurance Corporation of India

57
Niyogin Fintech Limited –Building A Neobank Platform Infrastructure Play
▪ Niyogin Fintech Ltd is India’s publicly listed fintech company with an end-to-end
digital platform that helps to solve financial and non-financial needs of Micro, Small &
Medium Enterprises (MSMEs).
▪ The Company is focused on providing financial services to India’s unserved and
underserved through its tech platform by leveraging the government infrastructure of
Jan Dhan-Aadhar-Mobile (JAM) and UPI.
▪ On a geographical basis, Niyogin has segmented its business to Rural Tech and Urban
Tech.
▪ iServeU, its Rural Tech platform empowers rural retailers to offer financial services to
local communities which hitherto had difficulty in accessing efficient banking services.
▪ The Urban Tech platform enables its semi-urban financial partners to offer a range of
financial solutions to MSMEs in an efficient manner via conversion to digital services.
▪ Niyogin is a profit with purpose enterprise to drive financial inclusion through - rural
reach, accessibility to banking services, and enabling income augmentation for
partners and retailers
▪ Milestones:
✓ 2018: Started offering small ticket unsecured business loans
✓ 2019: Acquired 50.01% in Moneyfront, a digital wealth management platform
✓ 2020: Acquired 51.00% in iServeU, a $500 mn GTV platform for Rural tech
✓ 2021: Achieved Cash Breakeven & initiated the Credit segment in iServeU
Stock Profile
Incorporated 1988
BSE 538772
Issued Shares (Mn) 93.50
Share Price* (₹) 96.8
Market Cap* (₹ Mn) 9,051
52-week Range (₹) 112.9 – 43.0
Shareholding Pattern (%)
Promoters 38.75
Public 61.25
*SHP (BSE) as on June 30, 2021
Top Institutional Holders (%)
Ward Ferry Asian Reconnaissance 13.02
Vikasa India EIF I Fund 7.23
Carmignac Portfolio 6.72
Alchemy India Long Term Fund 2.39
*Share price & Market cap (BSE) as on 17th August, ‘21
70
140
210
280
Sep-20 Nov-20 Feb-21 May-21 Aug-21
Relative Price Performance
Niyogin Sensex BSE Finance

58
Key Highlights
▪ Platform-centric strategy has picked up momentum
▪ Rural retailer base stood at 166,365 up 203.9% YoY and Retail partner
base (Urban Tech) at 4,333; up 58.5% YoY on June 30, 2021
▪ Expanded the product offerings with an upgraded DMT product and
BBPS agent institution
▪ Urban Tech business launched a SaaS based tax solution
▪ Scaling the Aadhar pay solution with Bajaj Finance’s 72,000+ agents –
Agents use a handheld device for EMI collections on loan payments,
these devices are powered by Aadhar pay solution, which are partly
powered by Niyogin.
Income Statement Highlights
Balance Sheet Highlights
(₹ mn.) FY20 FY21
Networth 2,421 3,124
Total Borrowings 0 0
Cash and Cash Eq. 81 681
Total Assets 2,504 3,681
Niyogin Fintech Limited
(₹ mn.) FY20 FY21 Q4FY21 Q1FY22
Net Revenue 280 506 184 221
YoY Growth (%) 22% 81% 116% 177%
EBITDA (203) (20) (40) (3)
EBITDA margin NA NA NA NA
PAT (245) (74) (59) (19)
PAT margin NA NA NA NA
YoY Growth (%) NA NA NA NA
Diluted EPS (₹) (2.80) (0.79) (0.64) (0.16)
Wealth Tech AUM (₹ Mn)
6,827
15,042
Q1FY21 Q1FY22
2,733
4,333
Q1FY21 Q1FY22
Niyogin Partners (#)
18,452
11,881
Q1FY21 Q1FY22
Rural Tech GTV (₹ Mn)
1,873
2,941
Q1FY21 Q1FY22
Rural Tech Average
Transaction Size (₹)

59
Quarter Highlights
▪ Rural Tech –
✓ Niyogin has access to ~90% of rural India through its partners
✓ AePS transaction market stands at US$ 36 bn and DMT market is US$ 20 bn, both totaling to US$ 56 bn GTV
▪ Urban Tech –
✓ Continues to reduce the loan book as it exits the generalized credit segment
✓ All three segments in Wealth platform- MSMEs, large corporates and individuals, have seen rapid adoption, as the AUM
increased over 120% YoY, and stood at more than ₹ 1,500 crores as of Q1 FY22.
✓ Initial customer in this segment is the financial professional, through whom Niyogin gets access to ~300 - 400 MSMEs
Financial Highlights
▪ Revenues grew by 20.0% QoQ to ₹221 mn in Q1FY22, despite Covid-related headwinds
▪ Niyogin remains a zero debt and net cash company
▪ Cash & other liquid assets stood at ₹ 1,682.8 mn on June 30, 2021
▪ Loan book stood at ₹ 348.1 mn on June 30, 2021, down 71.4% YoY, as the company focusses on de-risking its credit book
Outlook
▪ Transaction-led credit in Rural Tech in experimental mode, scale up will happen in the coming quarters
▪ Focusing on increasing the pace of platform adoption in both urban and rural tech
Concall Highlights
Niyogin Fintech Limited

60
Shriram Transport Finance Company Limited–Leader in the Pre-owned CV Finance Market
▪ Incorporated in 1979, Shriram Transport Finance Company Limited (STFCL) is
the leader in the pre-owned Commercial Vehicle finance market serving over
2.11 mn customers
▪ Diversified portfolio of HCV’s, MCV’s, LCV’s, PV’s, Construction Equipment,
Tractor Financing
▪ Pan India network of 1,821 branches including 809 rural centres, 500 private
financier tieups, served by 24,192 employees.
▪ Plays a credible role in financial inclusion of First Time Buyers (FTB’s), Driver
Turned Owner (DTO) by offering affordable finance on Preowned CV’s.
▪ Unique relationship based business model with extensive experience and
expertise in credit appraisal and collection process
▪ Strong credit ratings of CARE AA+ (stable), CRISIL AA+ (stable), India Ratings
AA+ (stable)
▪ Promoters:
○ Shriram Capital Ltd.
○ Shriram Financial Ventures (Chennai) Private Limited
Stock Profile
Incorporated 1979
BSE/NSE 511218/SRTRANSFIN
Issued Shares (Mn) 267.0
Share Price* (₹) 1,280.1
Market Cap* (₹ Mn) 323,865.3
52-week Range (₹) 1512.9-565.7
Shareholding Pattern (%)
Promoters 25.10
Public 74.90
* SHP (BSE) as on 30th June 2021
Top Institutional Holders (%)
Life Insurance Corporation 4.30
Fidelity 4.13
Sanlam Life 2.82
*Share price & Market cap (BSE) as on 17th Aug, ’21
70
120
170
220
Sep-20 Nov-20 Feb-21 May-21 Aug-21
Relative Price Performance
STFC BSE Finance Sensex

61
Key Highlights
▪ NII was ₹21,074 mn in Q1FY22 as against ₹18,425 mn in
Q1FY21.
▪ NIM was 6.38% in Q1FY22 as against 6.42% in Q1FY21
▪ AuM was ₹1,193,010 mn in Q1FY22 compared to ₹
1,117,560 mn in Q1FY21
▪ The liquidity buffer as on June 30, 2021 was ₹ 170.51 bn
Income Statement Highlights
Balance Sheet Highlights
(₹ mn.) FY19 FY20 FY21
Networth 158,086 179,775 215407
Total Borrowing 879,144 943,717 1,061,964
Cash and Cash Eq. 10,291 30,889 110,509
Total Assets 1,052,924 1,141,286 1,296,788
Shriram Transport Finance Company Limited
AuM Distribution (Q1FY22)
(₹ mn.) FY20 FY21 Q4FY21 Q1FY22
Interest income 164,773 173,346 44,676 46,339
Net Interest Income 81,069 81,671 21,511 21,074
Operating Profit 62,335 63,964 16,616 16,742
PAT 25,018 24,872 7,549 1,699
Diluted EPS ₹ 107.44 100.97 30.65 6.64
Cost to Income Ratio % 23.31% 21.20% 21.96% 19.11%
NIM(% of AuM) 7.06% 6.70% 6.80% 6.38%
HCVs and CEs,
47.97%
M&LCVs, 25.31%
Passenger
Vehicles, 20.66%
Working
CapitalLoans,
Business 1.94%
Loans,1.58%
Tractors, 2.51%
Others, 0.03%
Q1 FY22

62
Quarter Highlights
▪ STFC allotted on a preferential basis 13.98 mn equity shares at a price of ₹1,430 per share aggregating to ₹19.99 bn to
eligible QIBs including ICICI Prudential Life Insurance, HDFC Mutual Fund, Societe Generale, BNP Paribas
▪ STFC also allotted on a preferential basis 11.7 mn equity shares at ₹1430 per share aggregarting to ₹ 2.5 bn to the promoter
Shriram Capital Limited
▪ The said preferential allotments will strengthen STFC’s capital base and balance sheet and help the Company to augment the
long term resources for meeting funding requirements of its business activities, financing future growth opportunities,
effectively face COVID-19 induced uncertainties and improve its credit rating
▪ STFC disbursed ₹127,330 mn including ₹ 2,200 mn towards new vehicles and ₹124,620 mn for the used vehicles compared
to ₹9,850 mn in Q1FY21
Financial Highlights
▪ Profit after tax was ₹1699 mn in Q1FY22 compared to ₹ 3,200 mn in Q1FY21
▪ Collections for the month of April, May, June were 92%, 87% and 94% of the demand respectively.
▪ The stage-three NPA stood at 8.18% compared to 7.98% in the previous year.
▪ Overall credit cost in this quarter was 4.16%
Outlook
▪ STFC is confident of double digit growth in FY22 due to large pent up demand
▪ Cost to income ratio will be between 22-23% and Looking to hire 1,500 employees in next 2 years
Concall Highlights
Shriram Transport Finance Company Limited

Real Estate/Prop Tech63

64
Shareholding Pattern (%)
Promoters 61.22
Public 38.78
Ashiana Housing Limited –Indian Real Estate Development Company
▪ Engaged in development of residential real-estate projects for middle income and
senior living group in upcoming industrial areas and towns in India
▪ Projects include Comfort Homes, Senior Living project, Care Homes & Retail
▪ Pan India Presence - Bhiwadi (NCR), South of Gurgaon (NCR), Neemrana, Jaipur,
Jodhpur, Lavasa, Jamshedpur, Halol, Chennai, Kolkata
▪ Has completed 19.4mn sq.ft. of construction; 8,640 units under maintenance
▪ Company does not have intention to foray into affordable housing segment, as for
presence in affordable segment one has to be a price player, whereas Ashiana is a
value player, where they offer projects for which the customers can pay a little extra
for the comfort and value they get
▪ Ashiana’s ticket sizes vary between ₹ 2.5mn to ₹ 10mn, with average ticket size being
in ₹ 3.5‐5mn range
▪ Formation
✓ Incorporated in 1986 as ‘Ashiana Housing & Finance (India) Ltd.’, subsequently
changed the name to ‘Ashiana Housing Ltd.’ in 2007
✓ Founded by O. P. Gupta; managed by Vishal Gupta (Managing Director), Ankur
Gupta (Jt. Managing Director), Varun Gupta (Whole Time Director)
✓ Listed on BSE in 1993 and on NSE in 2011
✓ 2015, raised ₹ 200 Cr equity via QIP for land acquisition/ expansion plan
✓ 2016, successfully obtained shareholders approval for maiden issue of Non-
Convertible Debentures (NCDs); raised ₹ 20 Cr in 1st tranche till 31st Mar, 2016 30
100
170
240
Aug-20 Nov-20 Feb-21 May-21 Aug-21
Relative Price Performance
Sensex BSE Realty Ashiana
Stock Profile
Incorporated 1986
BSE/NSE 523716/ASHIANA
Issued Shares (Mn) 102.35
Share Price* (₹) 160.15
Market Cap* (₹ Mn) 16,392
52-week Range (₹) 186.90/67.10
* SHP (BSE) as on 30th June’21
*Share price & Market cap (BSE) as on 17th August’21
Top Institutional Holders (%)
ICICI Prudential Balanced Fund 5.91
SBI Contra Fund 3.34
PGIM India Trustees 1.17

65
Ashiana Housing Limited
Key Highlights
▪ Booking lower at 14.97 Lakhs Sq. ft.(FY21) vs. 19.82 Lakhs Sq. ft (FY20).
▪ Booking lower at 1.51 Lakhs Sq. ft.(Q1FY22) vs. 8.30 Lakhs Sq. ft (Q4FY21).
The bookings in this quarter were lower due to lockdown and higher
sales in Q4 FY21 due to launch of Ashiana Aditya Ph 2 and Ashiana
Umang Ph 5.
▪ Area constructed lower at 2.90 Lakhs Sq. ft. (Q1FY22) vs 3.90 Lakhs Sq. ft.
(Q4FY21).
▪ Launched Ph-3 of Ashiana Tarang in Bhiwadi and Ph-4 of Ashiana
Dwarka, Jodhpur during the quarter
▪ Phase 3 of Ashiana Dwarka, Jodhpur, has been delivered during the
quarter.
Income Statement Highlights
Balance Sheet Highlights
49%
13%22%
5%10%
1%
Saleable Area of ongoing Projects (Q1FY22)
Jaipur
Bhiwadi
Jamshedpur
Jodhpur
Chennai
Pune45%
30% 2%
12%
7%
1%1%
2%
Break-Up of Area Booked (Q1FY22)
Jaipur
Bhiwadi
Gurgaon
Chennai
Gujarat
Neemrana
Pune
Jodhpur
(₹ mn.) FY20 FY21 Q4FY21 Q1FY22
Total Revenue 3,175 2,593 814 404
YoY Growth (%) (9.4%) (18.3%) (9.3%) 5.9%
EBITDA 7 182 (23) (37)
EBITDA margin 0.2% 7.0% -2.8% -9.1%
PAT (302) 17 (56) (63)
PAT margin (9.5%) 0.7% (6.9%) (15.6%)
YoY Growth (%) - - - -
Diluted EPS (₹) (2.83) 0.40 (0.55) (0.59)
(₹ mn.) FY19 FY20 FY21
Networth 7,818 7,498 7,508
Total Borrowing 1,457 1,040 529
Cash and Cash Eq. 638 929 1,517
Total Assets 11,917 11,725 13,392

66
Ashiana Housing Limited
Concall Highlights
▪ Area book recorded in Q1 FY22 was 1.51 lakhs sq. ft, as compared to 0.81 lakh sq. ft in Q1 FY21.
▪ The Q1 FY22 witnessed launch of phase-3 in Ashiana Tarang in Bhiwadi and phase-4 of Ashiana Dwarka, Jodhpur.
▪ The sales were at 8.3 lakhs sq. ft in the previous quarter, the higher sales in Q4 FY21 were attributable to launch of
Ashiana to Aditya phase 2 in Jamshedpur and Ashiana Umang phase 5 in Jaipur..
▪ The company handed over 0.81 lakhs sq. ft in Q1 FY22 out of which 0.16 lakhs sq. ft was delivered in partnerships. This
was against a delivery of 0.85 lakhs sq. ft in Q1 FY21.
▪ Revenue recognized from completed projects in Q1 FY22 was at ₹24.47 crores vis-a-vis ₹25.19 crores in Q1 FY21.
▪ Total comprehensive income in Q1 FY22 was negative at rupees ₹6.14 crores vis-a-vis negative ₹2.3 crores in Q1 FY21.
▪ Equivalent area constructed was a 2.89 lakhs sq ft in Q1 FY22 versus 3.90 lakhs sq ft in previous quarter, the same was
1.21 lakhs sq ft in Q1 FY21.
▪ The company is looking at reaching 1.5 million sq. ft for the entire year.
▪ Launched two phases in the first quarter., one in Ashiana Tarang, and one in Ashiana Dwarka. In the second quarter
Ashiana Nirmay launch will happen, and in Ashiana Dwarka Ashiana will re-launch the phase, because the phase got
stuck as half the launch happened pre lockdown.
▪ Given the stage of construction in Ashiana Amantran, the company is looking at Q3 FY24 for delivery.

67
Shareholding Pattern (%)
Promoters 54.83
Public 45.17
Eldeco Housing and Industries Limited –Leading Real Estate Development Company in Lucknow
▪ Incorporated in 1985, EHIL has been, for over 3 decades, the market leader in
Lucknow (UP's capital and fastest-growing city).
▪ EHIL is listed on the Bombay Stock Exchange, has an uninterrupted dividend
paying record and a zero long term debt on books.
▪ 41 Projects have been Delivered and 8 are Under Execution. The group has
become well renowned amongst the middle-income segment.
▪ The company is a brand leader in the most populous state.
▪ Management of the Company – Mr. Pankaj Bajaj (Chairman & Managing
Director), Mr. Anil Kumar Dhanda (Chief Financial Officer), S K Jaggi (Chief
Operating Officer), Shrikant Jajodia (Director) etc.
Stock Profile
Incorporated 1985
BSE/NSE 523329/ELDEHSG
Issued Shares (Mn) 1.96
Share Price* (₹) 2,748.7
Market Cap* (₹ Mn) 5,406
52-week Range (₹) 856-3,340
* SHP (BSE) as on 30th June ’21
*Share price & Market cap (BSE) as on 17th August’21
1.9
3.9
2.0
2.92.5
Area Booked (Lakh Sq. Ft.)
FY17 FY18 FY19 FY20 FY21
107.3
80.794.1
63.9
33.6
Value of Construction (₹ in Crore)
FY17 FY18 FY19 FY20 FY21
-
50
100
150
200
250
300
Jul-20 Sep-20 Dec-20 Mar-21 Jun-21
EHIL Sensex

68
COMPLETED PROJECTS ON-GOING PROJECTS
Eldeco Housing and Industries Ltd. (EHIL)
S
NoProject Name Type
Saleable
Area
Area
BookedDate of
Completion
(msf.) (msf.)
Group Housing
1Eldeco
Saubhagyam
Hi-Rise Group
Housing1.20 1.19
2016-
2020*
2 Eldeco EterniaHi-Rise Group
Housing0.36 0.36 Jul-17
3Eldeco City
Breeze
Hi-Rise Group
Housing0.22 0.21 Jul-18
Townships
1 Eldeco City Plots & Villas 2.33 2.04 Jun-16
2 Eldeco Samridhi Plots & Villas 0.17 0.16 Jun-19
3Eldeco Shaurya
(Phase- I)Plots & Villas 0.64 0.58 Oct-17
4 Eldeco Regalia Plots & Villas 0.69 0.61 Oct-20
Commercial
1 Eldeco EleganteRetail Cum
Office Spaces0.05 0.05 Jan-17
2Eldeco Corporate
TowerOffice Spaces 0.08 0.08 Feb-13
3Eldeco City
Arcade 1Shops 0.01 0.01 Jul-18
Total 5.75 5.29
S No Ongoing ProjectsSaleable
Area
Area
Booked
Expected
Completion
(sq. ft.) (sq. ft.)
1 Eldeco Luxa 1,32,736 22,804 Sep-22
2 Eldeco Eternia Arcade 1,728 - Sep-22
3 Eldeco Regalia Arcade 17,759 15,583 Sep-22
4 Eldeco Uday 12,530 12,530 Sep-21
5 Eldeco Joy 17,842 17,842 Sep-21
6 Eldeco City Dreams 72,756 56,219 Dec-21
7 Eldeco Select 63,932 40,936 Nov-21
8 Eldeco South Block 16,330 16,330 Dec-21
9 Eldeco North Block 50,044 50,044 Sep-21
10 Eldeco Inner Circle 41,735 41,735 Jun-22
11Eldeco Shaurya
Arcade20,336 10,377 Jul-23
12 Eldeco East End 62,628 49,135 Mar-23
13 Eldeco Saksham 67,206 67,206 Sep-23
14Eldeco City at Bareily
(40% of 40 acres)8,73,549 5,01,286 Jun-26
Total 14,51,111 9,02,027

69
Key Highlights
▪ During the quarter, revenue from operations was ₹ 15.1 crores as compared
to ₹ 20.0 crores in Q1’21.
▪ EBITDA for the quarter was ₹ 6.5 crores as compared to ₹ 10.1 crores in
Q1’21.
▪ Profit before tax for the quarter was ₹ 6.2 crores as compared to ₹ 9.9 crores
in Q1’21.
▪ Net profit for the quarter was ₹ 4.7 crores as compared to ₹ 7.2 crores in
Q1’21.
▪ The Company launched two projects this quarter namely Eldeco East End,
having saleable area of 62,628 sq. ft. (78% booked) and Eldeco Saksham,
having saleable area of 67,206 sq. ft. (100% booked).
▪ Strong sales registered for Eldeco City (Bareilly) project; 17,266 sq. ft. sold
this quarter.
▪ RERA approval for Eldeco Twin Tower received in this quarter.
▪ The revenues for the quarter were affected due to the corona induced
lockdown during the quarter, however, due to flexible low leverage model,
Company was able to maintain healthy margins.
Income Statement Highlights
Balance Sheet Highlights
(₹ mn.) FY20 FY21 Q4FY21 Q1FY22
Total Revenue 128.5 159.4 40.1 15.1
YoY Growth (%) -22.04% 24% 14.20% -24.50%
EBITDA 54.1 74.5 19.9 6.5
EBITDA margin 46.70% 42.10% 49.60% 43.00%
PAT 39.2 54.2 14.0 4.7
PAT margin 30.50% 34% 34.80% 30.90%
YoY Growth (%) 2.35% 38.40% 14.85% -35.50%
Diluted EPS (₹) 137.04 250.75 66.03 23.68
(₹ mn.) FY19 FY20 FY21
Networth 183.7 210.7 265.0
Total Borrowing 255.15 244.21 17.83
Cash and Cash Eq. 64.03 77.48 118.53
Total Assets 438.88 387.49 396.38
Upcoming Projects Salable Area (Msf)
Eldeco Imperia 0.26
Eldeco Twin Towers 0.15
Eldeco City Plaza 0.01
GH-03 Crest 0.38
Total 0.93
Eldeco Housing and Industries Ltd. (EHIL)

70
Con-call Highlights
▪ A strong demand for bigger and better houses witnesses all around the globe.
▪ The residential real estate market was long due for an upward correction, and the pandemic induced
lockdown has acted as a trigger. Moreover, we are seeing demand to be gravitating towards bigger
and more established players in each geographic market.
▪ Q1’22 saw a revenue recognition momentum slow down due to lockdown restrictions. For two
months the business processes like construction, sales or even getting routine government approvals
were slowed down or completely shut.
▪ Execution was less impacted during second wave compared to first wave as labour migration was
significantly lower this time. However, supply chain disruptions did cause a slow down.
▪ Launched two projects this quarter, which were almost fully booked. Bareilly project saw good sales
volume and pricing. RERA approval received for Twin Tower .
▪ Main takeaway for this quarter has been that thought the quarter was weak in terms of execution and
revenue recognition, the underlying demand trend is becoming stronger.
Eldeco Housing and Industries Ltd. (EHIL)

71
Stock Profile
Incorporated 2013
BSE/NSE 538289/MAJESCO
Issued Shares (Mn) 28.63
Share Price* (₹) 78.55
Market Cap* (₹ Mn) 2244.8
52-week Range (₹) 122.70-8.70
Shareholding Pattern (%)
Promoters 35.04
Public 64.96
Majesco Limited –Digital Transformation in Real Estate by Creating PropTech Ecosystem
*SHP (BSE) as on 30th June ’21
*Share price & Market cap (BSE) as on 17th August ’21
▪ On 22nd March, 2021, Aurum Ventures, a Mumbai based Real Estate group, signed
a definitive share purchase agreement to acquire the 14.78% promoter stake in
Majesco Ltd., through its subsidiary Aurum Platz IT Private Ltd for ₹ 32.58 crore ($4.5
million) at ₹ 77 per share. This triggered an open offer as per Indian law, thus,
Aurum made an open offer to buy up to 26% of Majesco from its public
shareholders for ₹ 57.32 crore ($7.9 million)
▪ The above development came after Thoma Bravo (PE firm) acquired Majesco’s
Nasdaq-listed unit in September 2020 in a deal that valued the cloud insurance
software provider around $729 million. The PE firm then took Majesco USA private.
Majesco Ltd received $514 million from the sale of its US arm
▪ Pursuant to provisional open offer, the control of management of Majesco Limited
is now with the Aurum Group. This acquisition provides Majesco an opportunity to
offer an ideal blend of technology and domain experience of Real Estate
▪ The Board has approved the name change to ‘Aurum PropTech Limited’ in July
2021. Shareholders’ approval is sought at the ensuing AGM for the same
▪ Aurum Ventures is a new-age technology driven Real Estate company with end-to-
end capabilities including acquisition, design development, project management,
property management, hospitality, sales and leasing
▪ It is presently engaged in development of 7 Mn Sq. Ft. of Grade-A Real Estate
spaces including Integrated Township, Grade A+ Information Technology Special
Economic Zone, Residential and Retail Spaces in Mumbai Metropolitan Region
0.0
200.0
400.0
600.0
800.0
1000.0
1200.0
Dec-20 Mar-21 Jun-21
Relative Price Performance
Sensex BSE IT Majesco

72
Majesco Limited
Income Statement Highlights
Balance Sheet Highlights
(₹ mn.) FY20 FY21 Q4FY21 Q1FY22
Net Revenue 184 533 54.1 13.4
YoY Growth (%) -98% 190% -98% -63%
EBITDA 62.3 31008 -53 -31.3
EBITDA margin 34% 5817% NA NA
PAT 902 24129 -20 -24.1
PAT margin 490% 4527% NA NA
YoY Growth (%) 26% 2575% NA NA
Diluted EPS (₹) 8.13 871.28 1.01 -0.84
(₹ mn.) FY19 FY20 FY21
Networth 6770 6980 1753
Total Borrowing 36.3 5 -
Cash and Cash Eq. 1099 3430 5.3
Total Assets 11115 12476 1895
Key Highlights
▪ Indian real estate sector is
anticipated to reach $ 1 Trillion,
contributing more than 10% to
the GDP in 2030
▪ Acquired 51% equity share
capital of K2V2 Technologies
Private Limited for cash
consideration of ₹. 40 cores
▪ Acquisition is expected to be
achieved in two tranches by end
of the December 2022

73
Majesco Limited
▪ Company’s real estate arm is actively engaged in development in Mumbai Metropolitan region. The flagship Project,
Aurum Q Parć is one of the best campuses built in India and hosts Indian and International Banks like Axis, ICICI
▪ PropTech is usage of technology for efficiently creating, monetizing, maintaining and allocating capital to real estate.
Management believe that PropTech is still at emerging stage and will evolve very rapidly in near future
▪ Company’s vision is to build an integrated PropTech Ecosystem providing Data Analytics Platform, Artificial Intelligence &
ML based insights, Customer journey enabled by Augmented & Virtual Reality, Internet of Things (IoT) based solutions,
rolled into one Super App
▪ Company will be following an inorganic and organic path towards building this PropTech ecosystem. Management is in
active conversation with the best PropTech teams across India and look forward to integrating their products
▪ In 2020, the investment in Indian proptech sector is around $300 million to $400 million. Globally, more than 8,000
technology companies in real estate sector are present; Europe and North America which has 17% of their global
population have 73% of these 8,000 companies
▪ Company acquired 51% stake in K2V2 Technologies Private Limited for a consideration of ₹ 40 Crore. K2V2 is a software
technology firm providing SaaS products, services and Enterprise Software required for Real Estate Industry. It has
portfolio of PropTech products like Sell.do and Kylas. It also has a Real Estate Brokerage and Digital marketing business.
▪ With K2V2 acquisition, Company is inline with its strategy of creating India’s first Real Estate technology Ecosystem. This
investment is in line with Majesco’s strategy to bring digital transformation in real estate sector by creating a PropTech
Ecosystem covering Customer Digital Journey, Enterprise Digital Transformation, Property Management Platform, Data
Science and Analytics, and Investment and Financing
Concall Highlights

Specialty Chemicals/Agrochemicals
74

▪ Anupam Rasayan India Ltd. specializes in multi-step synthesis undertaking
complex chemical reactions to produce key specialty chemicals with focus on
developing innovative manufacturing processes
▪ Established Custom Synthesis player with 37 years of track record operating in
two verticals, namely
▪ Life Science related Specialty Chemicals
▪ Other Specialty Chemicals
▪ The Company manufacture a variety of life science related specialty chemicals
comprising products related to agrochemicals, personal care and
pharmaceuticals.
▪ It also manufactures agricultural intermediates and agricultural active
ingredients for the agrochemicals industry.
▪ Its other specialty chemicals are used in diverse end-user segments,
comprising specialty pigments, specialty dyes and polymer additives.
▪ Strong supply chain with backward integrated facilities, GOI recognized three-
star export house
▪ ~24,300 MT Manufacturing Capacity, spread over 6 manufacturing facilities
Anupam Rasayan India Limited –Producing Key Molecules With Innovative Manufacturing Process
75
*SHP (BSE) as on 30th June’ 21
0.0
50.0
100.0
150.0
200.0
Mar-21 Apr-21 May-21 Jun-21 Jul-21
Relative Price Performance
Sensex ANURAS
*Share price & Market cap (BSE) as on 17th August ’21
Shareholding Pattern (%)
Promoters 65.40
Public 34.60
Stock Profile
Incorporated 1984
BSE/NSE 543275/ANURAS
Issued Shares (Mn) 99.92
Share Price* (₹) 748.25
Market Cap* (₹ Mn) 74,465
52-week Range (₹) 849.70 - 472.25

76
Anupam Rasayan India Limited –
23%
50%
10%
10%
5% 2%By Region
Europe
India
Singapore
Japan
China
ROW
Revenue Distribution (Q1FY22)
Income Statement Highlights
Balance Sheet Highlights
88%
12%By Verticals
Life Science
Related Specialty
Chemicals
Other Specialty
Chemicals
(₹ mn.) FY20 FY21 Q4FY21 Q1FY22
Net Revenue 5,398 8,373 2,742 2,380
YoY Growth (%) 4% 55% 66% 77%
EBITDA 1,456 2,202 655 650
EBITDA margin 27% 26% 24% 27%
PAT 532 703 221 321
PAT margin 10% 8% 8% 14%
YoY Growth (%) 8% 32% 113% 77%
Diluted EPS (₹) 6.97 8.56 2.70 3.21
(₹ mn.) FY19 FY20 FY21
Networth 5,071 5,935 15,734
Total Borrowing 6,698 8,185 3,868
Cash and Cash Eq. 71 268 2,957
Total Assets 13,225 16,643 22,980
Key Highlights
• Started working on new molecule for Advance Technologies in telecom
sector and will be one of the few companies manufacturing this
molecule globally
• Revenue from top 10 customers about 84% of the total revenue.
However, there are total 24 products in this of total 44 products as of
Q1FY22.
• Commercialized our new molecules in Q1 FY22 and planning to
commercialize about 10 new molecules in the current financial year
which will contribute significantly to the growth in FY22.
• Total Capital expenditure stood at ₹ 10 crores in Q1 FY22.

77
Anupam Rasayan India Limited
• Gross fixed asset turnover to reach 1.4-1.5X by FY24-25: It was indicated that the ARIL is likely to achieve 1.04x gross
fixed asset turnover in FY22E, which is likely to reach 1.30- 1.35x in FY23E and reach 1.4-1.5x by FY24-25 mainly on account
of newer projects yielding 1.7x fixed asset turns and ramp up of additional capacities.
• EBITDA margins sustainable at 24-27%: Management highlighted that, during the quarter, gross margins were higher at
63% on account of benefits arising out of inventories while the sustainable gross margins are likely to remain in the range of
57-59% and EBITDA margins are sustainable at 24-27% over the long term.
• Discussion on-going for semi-annual price mechanism: Management re-iterated that formal discussion are on-going with
its customers for renegotiating pricing mechanisms to semi-annual basis (from current annual basis) and maybe quarterly
basis post that in the second phase of discussions. As a result, Mar’22 onwards, there should be improvement in working
capital cycle, per the management.
• 60-70 new products in the pipeline for the long term: On a medium to long term basis, management plans to execute 2-
3 new projects and commercialize 4-5 new product every year. Over the next two years, company expects 30-40% of the
overall revenue from 10 new products which are likely to be commercialized this year (70% from crop protection, 10% from
pharma, and 20% from other segments). Management also highlighted that they have 60-70 new molecules in the pipeline,
consisting of both patented and non-patented products.
• Exports to remain at ~60-65% over FY22-23: During the quarter, exports as % of revenues were lower at 50%. Per the
management, exports in FY22 should account of 60% of overall sales while FY23 exports should be ~65% of overall sales
Concall Highlights

78
Asahi Songwon Colors Ltd. –Leading Global Pigments Provider
▪ Asahi Songwon Colors Limited is engaged in the business of manufacturing and
export of color pigments
▪ Largest manufacturer of phthalocyanine pigments (Blue) and derivatives in India
▪ Manufactures phthalo pigments, comprising Copper Phthalocyanine crude (CPC)
blue crude and a range of beta blue pigments
▪ Pigment Alfa Blue 15:0, Pigment Alfa Blue 15:1, Pigment Beta Blue 15:3 and
Pigment Blue 15.4 few of its niche products. They are used in the manufacture of
printing inks, paints, plastics, textiles and paper industries
▪ Manufacturing facilities are located at Padra (Vadodara), manufacturing CPC blue
crude and a range of blue pigments (Blue Activated Blue, Beta 15.4 and Alpha
Blue) with an installed capacity of approximately 14,400 tons per annum
▪ In FY21 company setup and commercialized new facility at Dahej (Bharuch),
manufacturing Azo pigments mainly Red, Yellow & Orange with an installed
capacity of approximately 2,400 tons per annum and expandable up to ~10,000
tons per annum
*SHP (BSE) as on 30th June ’ 21
0.0
100.0
200.0
300.0
400.0
Sep-20 Nov-20 Feb-21 May-21 Aug-21
Relative Price Performance
Sensex ASAHI SONGWON
*Share price & Market cap (BSE) as on 17th August ’21
Shareholding Pattern (%)
Promoters 66.64
Public 33.36
Stock Profile
Incorporated 1991
BSE/NSE 532853/ASAHISONG
Issued Shares (Mn) 12.02
Share Price* (₹) 349.10
Market Cap* (₹ Mn) 4,160
52-week Range (₹) 442.65-170.00

79
Asahi Songwon Colors Ltd
Income Statement Highlights
Balance Sheet Highlights
(₹ mn.) FY20 FY21 Q4FY21 Q1FY22
Net Revenue 2,836 2,830 893 970
YoY Growth (%) -3% 0% 24% 67%
EBITDA 344 495 135 103
EBITDA margin 12% 17% 15% 11%
PAT 233 392 61 47
PAT margin 8% 11% 7% 5%
YoY Growth (%) 25% 40% -28% -52%
Diluted EPS (₹) 18.60 26.29 5.06 3.79
(₹ mn.) FY19 FY20 FY21
Networth 1,936 2,157 2,743
Total Borrowing 567 163 451
Cash and Cash Eq. 2 25 5
Total Assets 3091 2778 3895
Key Highlights
▪ Company’s vision is to be amongst the leading suppliers of the full range of
pigments globally and continue to invest for strong growth forays in Colorant
Industry
▪ Blue division is a strong cash cow, and will continue to generate cash for the
future financing and leveraging growth in other areas
▪ Company continue to leverage its expertise, experience and technical
capabilities to develop products that cater to the diverse needs of clients
▪ Enviable track record of zero product returns from our customers in last 3
decades with more than 80% of repeat business
▪ Azo ramp-up on track, expected to reach 40% utilization levels on month-on-
month basis by Q3FY22.
Revenue Distribution (Q1FY22)
60%
40%
Sales breakup by Geography
Export
Domestic
100.0%
0.0%
Sales breakup by Product
Phthalocyanine
Azo

Heranba Industries Limited –Largest Producer of Synthetic Pyrethroids
▪ Heranba Industries Limited is an India-based crop protection chemical
manufacturer, exporter and marketing company
▪ Company manufactures intermediates, technicals and formulations.
▪ It produces synthetic pyrethroids, such as cypermethrin, alphacypermethrin,
deltamethrin, permitherin, lambda cyhalothrin etc
▪ Its business verticals include:
▪ Domestic Institutional sales of Technicals, which is engaged in
manufacturing and selling of technicals in bulk to domestic companies;
▪ Technicals Exports, which is engaged in exports of technicals in bulk to
customers outside India;
▪ Branded Formulations focused on manufacturing and selling of
formulations;
▪ Formulations Exports, which is engaged in export of formulations in
bulk and customer specified packaging outside India, and
▪ Public Health, which is focused on manufacturing and selling of
general insect control chemicals by participating in public health
tenders issued by governmental authorities and selling to pest
management companies.
*SHP (BSE) as on 30th June’ 21
0.0
50.0
100.0
150.0
Mar-21 Apr-21 May-21 Jul-21 Aug-21
Relative Price Performance
Sensex HERANBA
*Share price & Market cap (BSE) as on 17th August ’21
Shareholding Pattern (%)
Promoters 74.15
Public 25.85
Stock Profile
Incorporated 1996
BSE/NSE 543266/HERANBA
Issued Shares (Mn) 40.01
Share Price* (₹) 803.05
Market Cap* (₹ Mn) 32,130
52-week Range (₹) 944.95 – 602.85

81
Heranba Industries Limited
Revenue Distribution (Q1FY22)
Key Highlights
▪ Currently 65% of revenue contribution is from pyrethroid family which
includes both technical and formulations
▪ As of FY21 company has ~375 registrations both internationally and
domestically and continuous to file new registrations in India and other
geographies
▪ Company plans to launch 10 new products every year in domestic and
export markets.
▪ Company intends to capitalize on opportunities generated by various
technicals going off patent in the coming years by manufacturing and
supplying generic variants of the technical
Income Statement Highlights
Balance Sheet Highlights
24%
29%9%
38%
By Verticals
Branded Formulations Technical Domestic
Formulations Exports Technical Exports
62%
19%
81%
By Geographies
Domestic Exports
Formulations Exports Technical Exports
38%
(₹ mn.) FY20 FY21 Q4FY21 Q1FY22
Net Revenue 9,769 12,257 2,732 3,557
YoY Growth (%) -4% 27% 19% 32%
EBITDA 1,459 2,284 631 691
EBITDA margin 15% 19% 24% 20%
PAT 977 1,542 432 474
PAT margin 10% 13% 16% 13%
YoY Growth (%) 30% 58% 12% 66%
Diluted EPS (₹) 25.00 39.41 11.04 11.84
(₹ mn.) FY19 FY20 FY21
Networth 2,282 3,209 5,281
Total Borrowing 499 431 503
Cash and Cash Eq. 209 32 848
Total Assets 5,604 6,248 8,433

82
Heranba Industries Limited
Concall Highlights
Quarterly Highlights:
▪ Domestic Revenue (forming 61% of the total revenue) grew 57% YoY; Export revenue on the other hand grew at ~ 7%.
Export growth was marginal due to scarcity or containers and backlog. These included ~60% business from pyrethroids
▪ Q1FY22 EBIDTA (incl. other income) margin at 19.66% v/s 16.19% in Q1FY21 and 23.54% in Q4FY21. Higher margins this
quarter due new product launches and passing on of higher freight to customers.
▪ Technical revenue (forming 73% of the total revenue) grew 45%; Formulations grew 10%.
Capacity & Capex Updates:
▪ Capacity Utilization: Technical is around 90%, formulation is around 55%.
▪ Received EC for Sarigam expansion and the construction work is in progress.
▪ ₹ 250 crore Capex outlay planned for the next 3 years, out of which 70% would be for new products. Currently capacity is
around 150,000 MT. This will be expanded to 160,000 (to be funded by internal accruals)
R&D Updates:
▪ On R&D front, five new compounds are being evaluated - two fungicides, two herbicides and one insecticide for exclusive
sale in Europe and United States of America.
Guidance/Outlook:
▪ The company stated that technical to be 65% to 70% of the revenue.
▪ Gross margins to be in the- range of 35-36%, sustainably.
▪ Company is expected to grow 18-20% YoY over the years.

Laxmi Organic Industries Limited –Leading Domestic Producer For Ethyl Acetate &
Only Manufacturer Of Diketene Derivatives
▪ Laxmi Organic Industry Limited incorporated in 1989 is an India based
specialty chemical manufacturer. Company is focused on two key
business segments; Acetyl Intermediates and Specialty Intermediates.
▪ Large scale organic chemical manufacturing for more than three
decades
▪ Combined with YCPL the Company will become the largest
manufacturer of Ethyl Acetate (ETAC) in India and among the top 7 in
the world
▪ Only manufacturer of Diketene derivatives in India with ~55% market
share
▪ Forayed into high margin specialty fluorochemicals by acquisition of
Miteni, Italy
▪ Diversified portfolio of more than 50 products catering to pharma,
agro, paints & coatings, printing & packaging, dyes & pigments
industry segments
▪ Global footprint with offices in Europe, China, Middle-East with stock
points in Europe
▪ 2 DSIR approved R&D facilities with state-of-the-art infrastructure
*SHP (BSE) as on 30th June’ 21
0.0
50.0
100.0
150.0
200.0
250.0
Mar-21 Apr-21 May-21 Jun-21 Jul-21
Relative Price Performance
Sensex LXCHEM
*Share price & Market cap (BSE) as on 17th August ’21
Shareholding Pattern (%)
Promoters 72.29
Public 27.08
Stock Profile
Incorporated 1989
BSE/NSE 543277/LXCHEM
Issued Shares (Mn) 263.66
Share Price* (₹) 370.15
Market Cap* (₹ Mn) 97,594
52-week Range (₹) 143.00 - 402.40
Laxmi Organic
Industries Limited

84
Laxmi Organics Industries Limited
Revenue Distribution (Q1FY22)
Key Highlights
ACETYL INTERMEDIATES:
▪ Strong conversion efficiencies aid consistent contribution margin across
business cycles
SPECIALTY INTERMEDIATES:
▪ Product mix optimization will result into further improvement in
profitability
▪ Acquisition of significant international accounts to expand products
FLUOROSPECIALTY:
▪ R&D in India – Kilo Lab operations have started; R&D in Italy – Plan to start
by end of Q2 FY22
▪ Civil and infrastructure work at Lote, India is more than 50% complete
▪ A team of more than 40 is working in India and Italy
Income Statement Highlights
Balance Sheet Highlights
(₹ mn.) FY20 FY21 Q4FY21 Q1FY22
Net Revenue 15,386 17,684 5,213 7,406
YoY Growth (%) -2% 15% 26% 83%
EBITDA 1,135 2,167 637 1,453
EBITDA margin 7% 12% 12% 20%
PAT 702 1271 364 1,023
PAT margin 5% 7% 7% 14%
YoY Growth (%) 0% 81% 72% 379%
Diluted EPS (₹) 2.86 5.58 1.56 3.88
(₹ mn.) FY19 FY20 FY21
Networth 4,502 4,273 10,350
Total Borrowing 1,413 1,238 906
Cash and Cash Eq. 467 363 5,414
Total Assets 10,145 10,694 18,374
1,062
1,572
2,400
Q1FY21 Q4FY21 Q1FY22
Q1FY22 - SI performance
1,815
2,806
3,674
Q1FY21 Q4FY21 Q1FY22
Q1FY22 - AI performance
82%
18%
Domestic Export
Q1FY22 - Revenue by Geography
Laxmi Organic
Industries Limited

85
Laxmi Organics Industries Limited
Concall Highlights
Quarterly Update:
• Operating Revenues at ₹ 7,364 Mn in Q1FY22; growth of 82% Y-o-Y and 42% Q-o-Q
• EBITDA at ₹ 1,453 Mn in Q1FY22; growth of 246% Y-o-Y and 128% Q-o-Q; EBITDA Margins stood at 19.73% in Q1FY22 and
expanded by 933 bps Y-o-Y and 747 bps Q-o-Q
• Apart from AI(Acetyl) and SI(Speciality) , FI (Fluorochemical business) vertical is also under implementation.
• Low ROCE in recent times is due to investment in newer initiatives where Capex is still going on.
• Product mix shift towards SI and FI business to drive long term growth.
• 20% of SI sales are from exports against near zero of Q1 FY21
• Acetyl business showing an uptick in margins, even when the input cost is rising due to passover of cost. Margins expected to
remain steady
Mahad Flooding: Impact on business
• Due to unprecedented flooding of Mahad area where their SI unit was present and damaged the plant along with all the factories in
the area, though acetyl operations are marginally disrupted.
• Inventories of SI are also impacted and repair work is expected to progress once situation normalizes.
• The loss of SI business due to rain is expected to get recouped after the line restarts, volumes to return slowly.
Guidance/Outlook:
• Domestic demand has been growing at double digit rates over the last five years and expected to maintain trajectory over the next
five as well, while the global demand is growing at a rate of 4% to 6% CAGR.
• Guidance- the revenue should not be lesser than the previous year.
• FI to ramp up from year 1 – target in year one is to reach 70% capacity utilization. FI business capex expected to be around ₹ 280
crores in total and asset turns expected to be around 1.2x.
Laxmi Organic
Industries Limited

Pharmaceuticals/Healthcare86

87
Biocon Limited –India’s Largest Biologics Company
* SHP (BSE) as on 30th June’21
Stock Profile
Incorporated 1978
BSE/NSE 532523/BIOCON
Issued Shares (Mn) 1,200
Share Price* (₹) 366.70
Market Cap* (₹ Mn) 4,40,260.0
52-week Range (₹) 487.70-362.60
Shareholding Pattern (%)
Promoters 60.64
Public 38.45
Top Institutional Holders (%)
Arohi Asset Management 4.8
Life Insurance Corporation 4.3
Blackrock Fund Advisors 1.4
Vanguard 1.2
▪ India’s largest biologics Company and the world’s largest Insulin manufacturer
▪ Largest end-to-end research service provider in India with key relationship with various
global playe₹ ; Publicly listed on the Stock Exchanges on March 2004
▪ Founded by Promoter and Managing-Director Kiran Mazumdar-Shaw in 1978
▪ Utilises its core capabilities in fermentation technology and high-end R&D skills for
manufacturing biopharmaceuticals across small molecule APIs, and large molecule
biologics
▪ Currently has front end presence in India and UAE where it sells Novel and branded
small molecule/ biologic products through its field force
▪ Company is organized into the following reporting segments:
✓ Small Molecule APIs & Generic Formulations
✓ Biologics - Biosimilars (Insulins, MAbs & other biologics) & Novel biologics
✓ Branded Formulations (currently India & UAE)
✓ Research Services (Syngene)
▪ Biocon's key innovations includes
✓ An indigenous recombinant human insulin based on proprietary fermentation
technology, Insugen®
✓ Insulin analog Glargine, Basalog®
✓ India's first indigenously produced monoclonal antibody, BIOMAb-EGFR®;
✓ The world’s first humanized anti-CD6 monoclonal antibody, Itolizumab,
launched as ALZUMAb™ in India
✓ Ogivri™, first biosimilar Trastuzumab approved by US FDA
0
50
100
150
200
Sep-20 Dec-20 Apr-21 Aug-21
Relative Price Performance
Sensex BSE Healthcare Biocon
*Share price & Market cap (BSE) as on 17th August’21

88
Biocon Limited
Revenue Distribution (Q1FY22)
Income Statement Highlights
Balance Sheet Highlights
(₹ mn.) FY20 FY21 Q4FY21 Q1FY22
Net Revenue 65,286 73,603 20,475 18,078
YoY Growth (%) 15% 14% 9% -12%
EBITDA 17,645 19,071 6,411 4,365
EBITDA margin 27% 26% 31% 24%
PAT 7,482 7,405 2532 844
PAT margin 11% 10% 12% 5%
YoY Growth (%) -17% -3% 50% -67%
Diluted EPS (₹) 6.3 6.2 2.1 0.7
(₹ mn.) FY19 FY20 FY21
Networth 60,980 67,058 85,076
Total Borrowing 18,028 18,898 35,558
Cash and Cash Eq. 7,298 9,101 9,531
Total Assets 1,21,924 1 ,44,438 1,85,223
26%
41%
1%
32%
By Segment
Generics Biosimilars
Novel Biologics Research Services
Key Highlights
▪ GENERICS: APIs & Generic Formulations
▪ Q1FY22 revenue at ₹ 486 Crore, down 22% (YoY) from ₹ 621 Crore in
Q1FY21.
▪ Tacrolimus capsules, launched in the US in Q3FY20, has started to see a
gradual ramp up in market share during the quarter.
▪ BIOSIMILARS: Biocon Biologics
▪ Expanded global footprint with entry into seven new markets
▪ Received marketing authorization approval for bBevacizumab (Abevmy*)
from TGA, Australia and MHRA, UK
▪ U.S. FDA schedules pre-approval inspection of our Malaysia facility in Q3
of CY2021 in support of the BLA for bAspart*
▪ Over 50,000 patients benefited from our comprehensive COVID-19
portfolio, cumulatively, by end of Q1FY22
▪ Commissioned rooftop solar power generation at some of our
manufacturing facilities, potentially reducing carbon emissions by 400 tons
annually.
▪ RESEARCH SERVICES: Syngene
▪ Q1FY22 revenue at ₹ 595 Crore, up 41% (YoY) from ₹ 422 Crore in Q1FY21
▪ Syngene signed a five-year agreement with IAVI, a US-based non-profit
scientific research organization, for manufacturing of three anti-HIV
monoclonal antibodies for use in phase I and II clinical trials

89
Biocon Limited
Concall Highlights
▪ Generics
▪ Total ₹ 75 crore of sales impacted in Q1 amid Covid-related operational challenges at API facilities. The company
expects normalisation of sales from Q2
▪ Continued to face pricing pressures in US formulations business but statin formulations portfolio in the US -
Atorvastatin, Simvastatin and Rosuvastatin held on to its market share
▪ Launched two new formulations in the US during the quarter - Labetalol Hydrochloride tablets and Esomeprazole
Magnesium Delayed-Release capsules with estimated market size of US$63 million and US$230 million, respectively
▪ Tacrolimus capsules, launched in the US, Q3FY20, has started to see a gradual ramp up in market share
▪ The company has requested USFDA to consider the recently inspected and certified Biocon Pharma facility by the
MHRA for product approval through mutual recognition agreement
▪ Biocon on track to commission the greenfield Immuno-suppressants API manufacturing facility at Visakhapatnam in
FY22
▪ Novel Biologics
▪ Biocon owns the European rights for Itolizumab wherein The Committee for Orphan Medicinal Products gave an
orphan designation to Itolizumab for the treatment of acute and chronic GVHD
▪ Biocon Biologics
▪ Q1FY22 – EMs to developed market contribution was 60:40. This was 55:45 on annual basis
▪ Received marketing authorisation approval for bBevacizumab (Abevmy) from TGA, Australia and MHRA, UK
▪ USFDA has scheduled pre-approval inspection of Malaysia facility in Q2FY22 for BLA of bAspart
▪ Served over 27,000 patients with Itolizumab by end of Q1FY22
▪ Expanded footprint in emerging markets with the launch of key bTrastuzumab, bGlargine and rh-Insulin in additional
markets
▪ bTrastuzumab recorded a strong uptake in emerging markets like Brazil where it maintained leadership position with
39% market share in retail segment.
▪ Through partnership with Viatris, there was an increase in market share for bTrastuzumab, bPegfilgrastim and
bGlargine in US
▪ US market share: Pegfilgrastim ~ 8.5%, Trastuzumab ~ 9%
▪ Regulatory process for the grant of interchangeability designation to bGlargine is progressing under the 351(k)
pathway for US with progress expected by end of July 2021

50
100
150
200
Sep-20 Nov-20 Feb-21 May-21 Aug-21
Relative Price Performance
NIFTY NIFTY Pharma Caplin
90
Caplin Point Laboratories Limited –Exports Generic Formulations And Branded Products
Stock Profile
Incorporated 1990
BSE/NSE 524742/CAPLIPOINT
Issued Shares (Mn) 75.6
Share Price* (₹) 806.05
Market Cap* (₹ Mn) 60,937
52-week Range (₹) 1,034.00 – 402.00
Shareholding Pattern (%)
Promoters 69.03
DII 1.49
FII 1.15
Others 29.82
*SHP (BSE) as on 30th June ‘21
▪ Caplin Point Laboratories Limited was founded in 1990 and is headquartered in
Chennai, India. Company holds over 2800 product licenses across the globe,
with a dominant position in Latin America.
▪ The company produces, develops, markets, and exports generic formulations
and branded products in its core markets of Latin America and Africa. It
provides liquid injections, lyophilised injections, opthalmic products, liquid
orals, capsules, tablets, softgel capsules, suppositories and ovules, dry syrups,
topicals, inhalers, IV infusion products, dermo cosmetics, and other products, as
well as powders for injection.
▪ Manufacturing Locations:
▪ Pondicherry – OSD and Injectable – RoW markets
▪ Chennai – Injectables and Opthalmics – Regulated Markets
▪ Chennai and Hyderabad – API and Formulation – R&D Centre
▪ Regulatory Approvals:
▪ Pondicherry – INVIMA and WHO GMP
▪ Chennai – US FDA, EU GMP, and INVIMA
▪ Caplin Point Laboratories Limited has been selected on Forbes Asia’s “200 Best
Under a Billion” list for three consecutive years (2014, 2015 & 2016), and was
recently awarded “The Emerging Company of 2018” and “Business Excellence
Award for 2019” by Economic Times.
*Share price & Market cap (BSE) as on 17th August ‘21

91
Income Statement Highlights
Balance Sheet Highlights
(₹ mn.) FY19 FY20 FY21
Networth 6,330 9,566 10,034
Total Borrowing 5 365 171
Cash and Cash Eq. 1,530 2,234 4,596
Total Assets 7,425 11,258 13,636
(₹ mn.) FY20 FY21 Q4FY21 Q1FY22
Net Revenue 8,632 10,613 2,787 3,004
YoY Growth (%) 33.1% 22.9% 29.5% 25.1%
EBITDA 2,601 3,286 857 926
EBITDA margin 30.1% 31.0% 30.7% 30.8%
PAT 2,150 2,514 679 715
PAT margin 24.9% 23.7% 24.4% 23.1%
YoY Growth (%) 21.8% 16.4% 39.0% 31.1%
Diluted EPS (₹) 28.2 31.7 8.6 9.2
New Strategic Initiatives:
• Geographical Expansion:
• India: Entering India with selected injectable products
• Mexico: Expanding to the one major markets of LATAM with
focus on private markets
• Regulated markets: Extending global dossier filed in US to
other regulated markets such as Canada, Australia, Brazil.
• Capacity & Product Expansion:
• Tripling capacities in Injectable plants with new lines for
complex injectables such as Pre-Mix Injectable Bag line, Pre-
Filled Syringe line.
• New plant for Oncology products - Injectables and OSD
• New API Plant to backward integrate 70% of US business and
Majority of RoW business including Oncology
Caplin Point Laboratories Limited
Emerging Markets (LATAM & Africa):
• No. 1 Indian player in Central America
• Increased its LATAM footprint from two countries to 12
countries within a decade
• Entry into Pharmacy sales through Healthcare portal, for
higher margins and offtake
• One of the first few Indian pharmaceutical companies to
extend to West Africa with Brand Marketing
• High Recognition of CPL’s brands across Francophone
and Portuguese Africa
US Business:
• Invested ~ ₹ 450 Crore in Capex and Opex for the 5 years since
2014 through internal accruals to enter the US and Regulated
markets
• Entered US Market in 2017-18 with launch of Ketorolac Inj,
currently owned by Baxter
• Fidelity arms invested INR 218Cr for Minority stake
• Launched 12 products in the US, through partners such as
Fresenius Kabi, Baxter, Sagent, Xellia, Meitheal and others.
• Signed new agreements for registration of products in Canada,
Australia and Brazil. Revenues expected from these markets in next
18 24 months

Concall Highlights
• Financial Highlights:
• Total Revenue of ₹ 309.65 Cr for Q1FY22, registered a growth of 25.6% over Q1FY21 Total Revenue of ₹ 246.57 Cr
• Gross Margins stable at ~ 55% in Q1FY22
• PAT increased by 31.1% to ₹ 71.53 Cr in Q1FY22 against ₹ 54.55 Cr in Q1FY21
• Basic EPS grew by 30% to ₹ 9.37 in Q1FY22 against ₹ 7.21 in Q1FY21 (Not Annualized)
• With depreciation of INR against USD, exchange gain in Q1FY22 is at ₹ 3.58 Cr as against ₹ 1.75 Cr in Q1FY21
• Geographical breakup of sales: LATAM & ROW - 91%, US - 9%
• Cash and Cash Surplus at ₹ 522 Cr for Q1FY22 - increase of ₹ 52 Cr over March 2021 balance.
• Cash flow from Operations (CFO) stood at ₹ 75 Cr in Q1FY22
• Receivables stable at around 95 days in Q1FY22
• Inventory stood at ₹ 193 Cr for Q1FY22 as against ₹ 179 Cr in Q4FY21.
• Emerging Markets Highlights:
• Foraying into Indian market with selected niche injectable products.
• Caplin Steriles extending its US products into other emerging market with first orders received from Mexico and
Saudi Arabia.
• Company’s CRO wing Amaris Clinical received confirmation of virtual US FDA audit.
• Prior to entering organic business in key target markets of Mexico and Brazil, Company has started supplying
speciality injectable products on emergency procurement basis to these markets.
• Current breakup of sales: Private Market sales to Distributors – 60%; Sales to Pharmacies/Retail – 20%; Institutional
Sales – 20%. Higher institutional sales are on account of emergency tenders for COVID related products.
• Monthly sales through company’s e-commerce platform ‘QuetenX’, part of 10X Healthcare portal, increase 39% YoY.
Currently catering to around 1,000+ unique customers across Guatemala, Nicaragua, Honduras and Ecuador.
Caplin Point Laboratories Limited

• US Business Highlights:• Launched 4 products from recently approved ANDAs in the last few months. Launch pending for 4 more ANDAs,
which is targeted before Dec 2021.
• Market share for already launched products is in the range of 7-12%.
• Company targets to file 8 ANDAs within next three quarters which will have equal mix of Injectable and Ophthalmicproducts.
• First orders received from Mexico and Saudi Arabia for Caplin Steriles, approvals for these products fast-tracked dueto products being commercialized in US.
• First 3 product filings in Canada (ANDS) targeted for Q3, these are approved ANDAs in US. On track to file 2 productsin Australia by Q3FY22.
• Company targets US front end presence in 2023, by which time 30+ ANDAs are likely to be approved/under review.
• CAPEX Update:• Oncology Facility – Process equipment ordering completed. Design drawing and detail engineering completed. First
batches targeted within next 9 months.
• API Facility – Design Drawing and Detail Engineering completed. Process equipment orders to commence shortly.
• Capacity Expansion at CP-1 (ROW facility) – Order placed for additional Lyophilizer in view of increased demand inniche Lyophilized products in current markets.
• Expansion plans under evaluation for Softgel section.
• Capacity expansion in US Plant - Phase 2 update:
• 2 Vial filling lines from Syntegon (Bosch) ordered, expecting delivery within 12 months.
• Pre-Filled Syringe line from Steriline ordered, expecting delivery within 10-12 months.
• Lyophilizer from Tofflon ordered, expecting delivery within 9-12 months.
• Expecting Phase 2 expansion to be completed within 15 months.
93
Caplin Point Laboratories Limited

94
Cupid Limited –Leading Manufacturer of Male and Female Condoms
▪ Leading manufacturer & supplier of Male and Female condoms with ~80% exports
▪ India’s only female condom manufacturer
▪ Listed on the BSE stock exchange in 1995 and NSE stock exchange in 2016
▪ Founded in collaboration with world leader Green mate Corporation, a leading
manufacturer of quality male condoms
▪ It is the first company in the world to obtain Pre-qualification status from
WHO/UNFPA (United Nations Population Fund) for supply of both Male & Female
condoms
▪ Modern manufacturing facility has a capacity of 485 million pieces for Male
Condoms, 25 million pieces of the Female Condoms & 210 million sachets of
Lubricant jelly per annum
▪ Fully equipped factory and an active quality control and quality assurance program;
includes testing of raw material up to final packaging of the product
▪ Has an active R&D center in addition to its manufacturing facility, to develop and
improve its product lines.
▪ Works with healthcare professionals, governments and organizations to support in
promoting good sexual health and the importance of consistent condom use to
prevent HIV and other STDs
▪ Exports to over 75 countries including Africa countries such as South Africa, Haiti,
Ghana, etc.
40
100
160
Aug-20 Nov-20 Feb-21 May-21 Aug-21
Relative Price Performance
Sensex BSE Healthcare Cupid
Shareholding Pattern (%)
Promoters 45.06
Public 54.94
Stock Profile
Incorporated 1993
BSE/NSE 530843/CUPID
Issued Shares (Mn) 13.34
Share Price* (₹) 233.95
Market Cap* (₹ Mn) 3,120
52-week Range (₹) 295.00/190.30
*Share price & Market cap (BSE) as on 17th August’21
* SHP (BSE) as on 30th June21

95
Cupid Limited
Revenue Distribution (Q1FY22)
Key Highlights
▪ Confirmed order book stands at approx. ₹ 85 crores as on 1st July 2021
▪ 3.5 Cr worth of IVD sales were recorded during the quarter.
▪ The Company negotiated increase in unit sales price from the major
custome₹
▪ More orders for Male and Female Condoms are expected from the
South Africa.
▪ In addition, demand from UNFPA, NGOs and customers from the
Private sectors is expected to be increased during rest of the year.
▪ Construction/Installation for the new IVD facility is expected to be
completed during the quarter.
Income Statement Highlights
Balance Sheet Highlights
(₹ mn.) FY20 FY21 Q4FY21 Q1FY22
Net Revenue 1,613 1,437 396 324
YoY Growth (%) 88.7% (10.9%) (4.1%) 15.8%
EBITDA 557 412 90 85
EBITDA margin 34.6% 28.7% 22.8% 26.4%
PAT 398 290 (347) 59.1
PAT margin 24.7% 20.2% - 18.3%
YoY Growth (%) 162.0% (27.3%) - (0.2%)
Diluted EPS (₹) 29.87 21.73 (26.03) 4.43
(₹ mn.) FY19 FY20 FY21
Networth 759 1,035 1,309
Total Borrowing 23 313 -
Cash and Cash Eq. 88 368 193
Total Assets 929 1,648 1,524
80%
20%
Sales breakup by Geography
Exports Domestic
46%
32%
10%
12%
Sales breakup by Product
Male Condoms Female Condoms Others IVD

96
Cupid Limited
Concall Highlights
▪ By the end of August, government of South Africa should be declaring the results from the last tender, and Cupid is
expecting an order between 60 to 80 Cr each year for the next 3 years out of which two-third Female would be and one-
third Male.
▪ Brazilian tender has been postponed to early next year. They had to reorganize their funding for the procurement of
Female Condoms.
▪ All the construction works related to the IVD project at Nashik has been completed. The company is in the process of
installing the equipment there. The company expects a margins between 20% to 25% on IVD.
▪ Also, Cupid is in the process of applying for the licenses with the drug controller of India. The management expect all
these formalities to be over by September end and hopefully the commercial business would start from October
onwards.
▪ The management is hoping that towards the end of FY22, they should hear from USFDA about the approval for the
Cupid Female Condoms.
▪ Capacity utilization for Male Condom during this quarter was 73% and for Female Condoms it was 92%. The plant was
down due to lockdown during May and June.
▪ In terms of the latex price, there has been an increased of between 20% to 30% from the previous quarter to this quarter.

97
Dishman Carbogen Amcis Limited –Fully Integrated CRAMS Player
▪ Established in 1983, Dishman Carbogen Amcis Limited is a fully integrated
CRAMS (Contract Research & Manufacturing) company with strong
capabilities right from process research & development to late stage clinical
and commercial manufacturing.
▪ The Company has global presence with development and manufacturing
sites at Switzerland, UK, France, Netherlands, India and China.
▪ Dishman provides end-to-end integrated high-value niche CRAMS offering
right from process research and development to late stage clinical and
commercial manufacturing and supply of API to innovator pharmaceutical
companies.
▪ Comprehensive product offerings – APIs, High Potent APIs, Intermediates,
Phase Transfer Catalysts, Vitamin D Analogues, Cholesterol, Lanolin-related
products, Antiseptic and Disinfectant formulations
▪ The Company has shifted its attention to sustainable therapeutic areas and
more niche molecules in oncology, ophthalmology, cardio-vascular, CNS and
drugs in the orphan category segment.
▪ Acquired Carbogen Amcis AG in 2006.
0
50
100
150
200
Aug-20 Nov-20 Feb-21 May-21 Aug-21
Relative Price Performance
Sensex BSE Healthcare Dishman
Shareholding Pattern (%)
Promoters 59.32
Public 40.68
Stock Profile
Incorporated 1983
BSE/NSE 540701/DCAL
Issued Shares (Mn) 156.78
Share Price* (₹) 191.95
Market Cap* (₹ Mn) 30,095
52-week Range (₹) 235.00/102.55
*Share price & Market cap (BSE) as on 17th August’21
Top Institutional Holders (%)
L&T Flexicap Fund 2.90
Government Pension Fund Global 2.33
Aditya Birla Sun Life Equity Fund 1.88
HBM Healthcare Investment Ltd. 1.62
* SHP (BSE) as on 30th June’21

98
Dishman Carbogen Amcis
Revenue Distribution (Q1FY22)
Key Highlights (Q4FY21)
▪ Net Debt excluding lease liabilities was USD 101 mn as on June 30,
2021 (USD 101 mn as on March 31,2021).
▪ CRAMS India revenue increased by 119.5% due to re-commencing
production for CRAMS customers from Bavla site.
▪ CRAMS UK revenue increased by 28.1% due to higher supply of
intermediates and starting materials to custome₹
▪ CRAMS India delivered a significant growth in revenues, which are at
higher margins.
▪ Capital expenditure for Q1 FY22 was approximately USD 12.18 mn,
which majorly includes capex at Swiss and French sites.
Income Statement Highlights
Balance Sheet Highlights
(₹ mn.) FY20 FY21 Q4FY21 Q1FY22
Net Revenue 20,436 19,120 5,293 5,507
YoY Growth (%) (0.7%) (6.4%) (3.4%) 16.1%
EBITDA 4,976 2,744 884 1,006
EBITDA margin 24.3% 14.3% 16.7% 18.3%
PAT 1,585 (1,651) (1,350) 160
PAT margin 878% - - 2.9%
YoY Growth (%) (14.3%) - - -
Diluted EPS (₹) 10.10 (10.53) (8.61) 1.02
(₹ mn.) FY19 FY20 FY21
Networth 53,791 57,151 56,988
Total Borrowing 8,825 9,295 10,464
Cash and Cash Eq. 763 1,219 2,435
Total Assets 73,285 81,998 83,246
8.4%
76.6%
2.4%
4.2%
8.4%
CRAMS breakup
CRAMS - India
CRAMS - Switzerland
CRAMS - France
CRAMS - China
CRAMS - UK
70.0%
30.0%
Sales breakup
CRAMS Marketable Molecules

99
Dishman Carbogen Amcis
Concall Highlights
▪ The company did a revenue of ₹550 crores, which is the highest ever that we have done in the first quarter of any
financial year.
▪ Calcifediol trials, and which means the analog trials, are now moving ahead for both USA and Asia in a number of
indications.
▪ First real new project in infection control for years has just been kicked off with a highly respected University in
Europe, where Dishman is looking at using one of their compounds to generate a super disinfectant.
▪ One of the two lead R&D projects in Holland for Vitamin D is going into commercial piloting within the next four
to six weeks.
▪ In Riom, which is the French facility in Europe, Dishman is moving into commercial scale manufacture of parenteral
sterile liquid drug. That project is on target both from a capital and from a time schedule perspective.
▪ The CRAMS contribution to the revenue was 70% while that of marketable molecules was 30%.
▪ Revenue in marketable molecules was driven by the increase in sales of both cholesterol as well as vitamin D
analogues that are manufactured out of Carbogen Amcis BV..
▪ The capital expenditure for the quarter was approximately $12 million, which majorly includes the CAPEX at our
Swiss and French site.

100
Healthcare Global Limited –India’s Largest Cancer Care Provider
Stock Profile
Incorporated 1998
BSE/NSE 539787/HCG
Issued Shares (Mn) 125.3
Share Price* (₹) 229.2
Market Cap* (₹ Mn) 28,178
52-week Range (₹) 265.0-107.0
Shareholding Pattern (%)
Promoters 68.41
Public 31.59
▪ Leading oncology player and specialty healthcare provider with a focus on
Oncology and Fertility
▪ Founded in 1998, as Curie Center of Oncology in Bengaluru, India. Subsequently
named Healthcare Global in 2005
▪ Listed on BSE and NSE Stock exchange on March 2016
▪ Operates 22 comprehensive cancer centers (excluding center in Kenya), 4
multispecialty hospitals, 3 diagnostic centers and 1 day care chemotherapy center
operated under “HCG” brand.
▪ 7 fertility centres operate under the Milann brand
▪ NABH, ISO 9001, NABL and CAP accredited
▪ The network consists of 2,036 beds, 28 linear accelerators, 300 oncologists and ~65
operation theaters
▪ Services Highlights
✓ Asia’s first bloodless Bone Marrow Transplant
✓ India’s first Computer Assisted Tumor Navigation Surgery (CATS)
✓ India’s first to bring in precision genomics-based radiation therapy with
Cvergenx
✓ First in India to introduce biological reconstruction to treat bone cancer
▪ Segments currently operating
✓ HGC: Oncology and cancer care
✓ Milann: Fertility center
✓ Triesta: Clinical Reference Laboratory
Top Institutional Holders (%)
IFC 3.48
Sundaram Mutual Fund 2.88
Wellington Trust Company 1.64
*SHP (BSE) as on 30th Jun’21
*Share price & Market cap (BSE) as on 17th August’21
80
110
140
170
200
Sep-20 Nov-20 Feb-21 May-21 Aug-21
Relative Price Performance
HCG BSE Healthcare Sensex

101
Healthcare Global Limited
Revenue Distribution (Q1FY22)
Key Highlights
▪ HCG oncology revenue increased by 66% in Q1FY22 due to good
momentum witnessed across existing locations
▪ Milann revenue increased 99% yoy at ₹ 121 mn in Q1FY22
▪ Existing centers EBITDA margin at 21.2% in Q1FY22 as compared to 15.8%
in Q1FY21
▪ Karnataka revenue increased by 59.5% to ₹ 1,111 mn in Q1FY22 due to
incoming international patients
▪ Gujarat revenue increased by 88.9% to ₹ 869 mn in Q1FY22, grew across
oncology and multi-specialty businesses , 22% topline contribution due to
Covid
▪ South Mumbai and Nagpur witnessed strong revenue growth of 231.5%
yoy and 129.9% yoy due to which Maharashtra revenues increased by
77.5% yoy to ₹ 547 mn
▪ East India revenues increased by 34.7% yoy to ₹ 252 mn in Q1FY22
▪ Andhra Pradesh revenues increased 51.0% yoy to ₹ 242 mn led by 71.0%
growth in Vizag center revenues in Q1FY22
Income Statement Highlights
Balance Sheet Highlights
(₹ mn.) FY19 FY20 FY21
Networth 5,222 4,198 7,140
Total Borrowing 5,669 6,233 4,132
Cash and Cash Eq. 205 318 300
Total Assets 16,536 22,532 20,356
96%
4%By Segment
HCG Center Milan Fertility Center
36%
28%
18%
8%8%
2%By State
Karnataka Gujarat Maharashtra
East India A.P. Other
(₹ mn.) FY20 FY21 Q4FY21 Q1FY22
Net Revenue 10,956 10,134 2,981 3,231
YoY Growth (%) 12.0% (7.5%) 10.2% 67.0%
EBITDA 1,792 1,435 438 547
EBITDA margin 16.2% 13.9% 14.5% 16.9%
PAT (1,067) (1,947) (1,034) (96)
PAT margin (9.7%) (19.2%) (34.7%) (3.0)%
YoY Growth (%) - - - -
Diluted EPS (₹) (12.05) (15.99) (8.49) (0.76)

Healthcare Global Limited
Concall Highlights
Quarter Highlights
▪ Highest ever quarterly revenue reported in the Q1FY22 at ₹ 3,231 mn due to recovery in hospital segment
▪ Highest ever quarterly EBITDA reported in the Q1FY22 at ₹ 547 mn
▪ HCG new centres posted revenue growth of 124% YoY and 30% QoQ
▪ New oncology centre in Jaipur delivered 18.8% QoQ revenue growth
▪ Vaccination contributed ~3% of revenues for the quarter
▪ New center losses reduced to ₹ 19 mn in Q1FY22 as compared to loss of ₹61 mn in Q1FY21
▪ Revenue from new centres at ₹ 693 mn up by 124% YoY
▪ Revenue from existing centres grew 54.5% YoY
▪ HCG centres: Occupancy rate – 55.8%, ALOS – 2.52 days, ARPOB – 37,644
Financial Highlights
▪ Q1FY22 EBITDA margin improved by 590 bps to 15.9% due to effective cost control on personnel and selling, general and
administrative expenses
▪ Q1FY22: Capex at ₹ 51 mn due to focus on sweating existing assets and turning around new hospitals
▪ Q1FY22 Net Debt decreased due to recent fund raise and stood at ₹ 2,937 mn
Outlook
▪ The management guided for a price increase of 2% in every financial year in the first quarter
▪ No new centres planned for FY22
▪ Growth will be driven by better execution of the go-to-market strategy for its new centers and expanding reach through
better targeting and brand awareness creation
▪ Expect efficiency improvement in mature centers and utilization ramp up for new centers

103
Stock Profile
Incorporated 1989
BSE/NSE507789
/JAGSNPHARM
Issued Shares (Mn) 26.2
Share Price* (₹) 168
Market Cap* (₹ Mn) 4,401
52-week Range (₹) 203-34
Shareholding Pattern (%)
Promoters 70.34
Public 29.66
Jagsonpal Pharmaceuticals Limited–
A Leading Pharmaceutical Company
* SHP (BSE) as on 30th June’21
*Share price & Market cap (BSE) as on 17th August’21
Key Highlights
▪ With a strong focus on manufacturing, R&D, distribution and marketing,
Jagsonpal Pharmaceuticals has become one of the fastest growing Indian
pharma companies. Founded in 1964, the Company specialises in
developing and manufacturing bulk drugs and pharmaceutical formulations.
▪ The Company has a robust portfolio of drugs focusing on Women Health,
Pain and Analgesics and General Medicine.
▪ Jagsonpal’s operations are spread across continents in over 15 countries that
include USA, Brazil, Argentina, Switzerland, Germany, Russia, Ukraine, Sri
Lanka, Cameroon, Thailand, Korea, Egypt and Vietnam.
Pharma Division
Ggynaecology/ Physician Maintane, CycloReg, Uterone, Divacon, LycoRed, Parvon Spas/forte, JP Tone, Equirex, Equilibrium, Realcef.
Physician/ENT/Dentist: Cladoxim, Actv 24, Mordica.
Naari Division
Dealing with various specific disease conditions related to women's health related to:• Endometriosis: EndoReg • Uterine Fibroids: Yuliprist, Fibristone • PCOS: Cystelia, • IVF /Luteal Phase defect• Vaginal Health: Verena Gel, Ubelac
Business DivisionsRelative Price Performance
0
200
400
600
800
Au
g-2
0
Sep
-20
Oct
-20
No
v-2
0
Dec-
20
Jan
-21
Feb
-21
Mar-
21
Ap
r-21
May-2
1
Jun
-21
Jul-
21
Sensex JSP

104
Jagsonpal Pharmaceuticals
Product Milestones
1988- INDOCAP SR
Jagsonpal was the first to introduce
the sustained-release form of an anti-
arthritis drug.
1989- STERILE UNIPACK
Jagsonpal developed unique pilfer-
proof sterile unipack of syringe,
needle and ampoule in a temper
proof pack.
1999- LYCORDE SOFTGELS
Jagsonpal entered exclusive tie-up
with an international company to
introduce Lycopene.
2005- Lycorde Syrup
Jagsonpal forayed into another ‘first’
a syrup form of Lycopene in a sugar
free form targeted at diabetics
segment in India.
Income Statement Highlights
((₹ mn.)FY19 FY20 FY21
Networth1,044.7 1,110.3 1,219.3
Total Borrowing37.9 64.0 67.9
Cash and Cash Eq.385.0 398.1 489.4
Total Assets1,357.8 1486.9 1642.0
Balance Sheet Highlights
((₹ mn.) FY20 FY21 Q4FY21 Q1FY22
Net Revenue 1,586 1,879 428 608
YoY Growth (%) -4.9% 18.5% 45.1% 87.5%
EBITDA 111 235 78 101
EBITDA margin 7.0% 12.5% 18.2% 16.6%
PAT 79 171 51 68
PAT margin 5.0% 9.1% 11.9% 11.2%
YoY Growth (%) 9.1% 116.7% 226.9% 171.7%
Diluted EPS (₹) 3.00 6.51 1.95 2.61
Products Developed
Product Year
Dextropropoxyphene 1983
Tolnaftate 1986
Indocap SR 1984
Sterile Unipacks 1987
Thiopental sodium 1992
Upcoming Products
APIs under development
Norgestrel
Tibolone
Desogestrel
Gestodene
Trenbolone
Altrenogest
Boldenone/esters
Danazol
Mesterolone
Spironolactone
Quinestrol

105
Management discussion highlights
▪ Company posted QoQ 88% growth in sales , 600 bps increase in EBITDA margins and 172% increase
in PAT on on product rationalization, focus on high margin products, cost control, and improvement
in operational matrix with better supply chain management .
▪ The growth in sales was a result of brand building and demand growth post easing of lockdown
restrictions.
▪ Two Dydrogesterone formulations under the brand name Divatrone and Pro-Retro were launched this
quarter, completing their product basket for the Progestin therapy.
▪ Management continuously working to strengthen their sales network by improving network of
empaneled doctors, connecting with them digitally, organizing regional, state and specialty focused
webinars, onboarding experienced sales professionals, and training our workforce to transform to a
digital culture.
Jagsonpal Pharmaceuticals

106
Marksans Pharma Limited –Global Pharmaceutical Company
Stock Profile
Incorporated 2001
BSE/NSE 524404/MARKSANS
Issued Shares (Mn) 409.3
Share Price* (₹) 72.6
Market Cap* (₹ Mn) 29,735
52-week Range (₹) 97.50-43.50
Shareholding Pattern (%)
Promoters 48.25
Public 51.75
*SHP (BSE) as on 30th June ‘21
▪ Marksans Pharma Limited is promoted by Mr. Mark Saldanha
▪ It was incorporated as a wholly owned subsidiary of Glenmark Pharmaceuticals
Limited in 2001
▪ In 2003, it spun-off into a separate entity called Glenmark Laboratories Limited
with the name later changed to Marksans Pharma Limited
▪ Company is engaged in the research, manufacture and marketing of generic
pharma solutions
▪ Product basket includes: -
✓ Tablets (plain, enteric coated and film coated)
✓ Soft/Hard Gelatin Capsules
✓ Liquids/Powder
▪ Key therapeutic segment addressed by them are Pain Management,
Cardiovascular system (CVS), Central nervous system (CNS), Anti-diabetic, Anti-
allergy, Gastrointestinal, Anti-biotic, Cough, cold and allergy medicines
▪ Company’s business is classified under 4 heads:
✓ North America/ US generics
✓ Europe/UK generics (Relonchem & Bell in the UK)
✓ Australia and New Zealand (Nova in Australia
✓ Rest of the world generics (CIS, Middle Eastern, African and South-East
Asian countries, among others)
*Share price & Market cap (BSE) as on 17th August’21
90
140
190
Sep-20 Nov-20 Feb-21 May-21 Aug-21
Relative Price Performance
Sensex BSE Healthcare Marksans

107
Marksans Pharma Limited
Income Statement Highlights
Balance Sheet Highlights
(₹ mn.) FY19 FY20 FY21
Networth 5,527 6,491 9053
Total Borrowing 999 188 187
Cash and Cash Eq. 335 937 2,122
Total Assets 8,037 9,026 12,282
(₹ mn.) FY20 FY21 Q4FY21 Q1FY22
Net Revenue 11,342 13,762 3,302 349.0
YoY Growth (%) 13.4% 21.3% -1.5% 5.4%
EBITDA 1,923 3,396 954 77.3
EBITDA margin 17.0% 24.7% 28.9% 22.2%
PAT 1,208 2,385 795 62.6
PAT margin 10.6% 17.2% 23.6% 17.6%
YoY Growth (%) 50.2% 97.5% 86.0% 26.8%
Diluted EPS (₹) 2.86 5.80 1.90 1.51
Facilities Detail
Location Capacity
Verna, Goa• 2.4 bn capsules per annum
• 6 bn tablets per annum
Farmingdale, United States • 6 bn tablets and hard capsules per annum
Southport, United Kingdom
• 2 bn bottles per annum
• 1 bn tubes per annum
• 1 bn sachets per annum
Key Highlights
• ~96% of company's total revenue came from regulated
markets of US, Europe, Australia and New Zealand
• Formulation business from Europe, UK was ₹ 1,592 mn.
in Q1FY22 registering a growth of 10.4%
• US & North America reported growth of 3.6% to ₹ 1,388
mn. in Q1FY22
• Australia & NZ revenue was at ₹ 382 mn. in Q1FY22,
registering growth of 11.8% YoY

Concall Highlights
Quarter Highlights
▪ OrbiMed, a Global Investment Firm with US$ 19 bn assets under management has invested in 49.32 mn convertible
warrants at ₹74.00 per warrant totalling to ₹3,650 mn.
▪ Orbimed has an option to convert the warrants into equity shares and will thereafter own 10.7% stake in the Company
▪ Marksans will utilise OrbiMed’s global resources and expertise in the healthcare sector to accelerate its endeavour of
becoming a fully integrated global pharma company
▪ Key Q1FY22 product launches include Metozolv for Gastrointestinal and Crestor for Cardiovascular in UK
Financial Highlights
▪ Q1FY22 revenue growth of 5.4% despite pandemic led disruptions
▪ Q1FY22 EBITDA margin expanded by 110 bps to 22.2% despite increased raw material and packing costs
▪ Q1FY22 PAT margin increased by 270 bps to 17.6% on account of increased operating efficiencies
▪ Net debt free and Cash and cash equivalent on books was ₹ 225 crores as on June 30, 2021
▪ Incurred capex of ₹ 99 mn in Q1FY22
Outlook
▪ In active dialogue to acquire a plant
▪ Ongoing backward integration of API on track and will offer a leverage in terms of improving future margins
▪ Company aims to touch ₹ 20 bn revenues in next few years
▪ Marksans has an order book of US$ 100 mn in the USA market
▪ Expects to achieve 15% growth in FY22 over FY21
▪ Target of filing 5 ANDAs and 3 new product launches in USA in FY22
Marksans Pharma Limited

109
Neuland Laboratories Limited –Leading End-to-End Chemistry Solutions Provider
Stock Profile
Incorporated 1984
BSE/NSE524558 /
NEULANDLAB
Issued Shares (Mn) 12.83
Share Price* (₹) 1,644
Market Cap* (₹ Mn) 21,101
52-week Range (₹) 2840.00-826.90
Shareholding Pattern (%)
Promoters 36.22
Public 63.78
▪ Leading manufacturer of Active Pharmaceutical Ingredients (APIs)
▪ Major end-to-end solutions provider for the pharmaceutical industry for chemistry
related services
▪ Founded by Promoter and Managing Director Dr. D. R. Rao. Listed entity since 1994
▪ Headquartered in Hyderabad, India and two overseas subsidiaries in USA and Japan
▪ 37+ years of experience, 75+ products excluding multiple products under
development. 898+ regulatory filings
▪ Strong product basket comprising of high value Active Pharmaceutical Ingredients
(APIs) and a focused Custom Manufacturing solutions (CMS) portfolio
▪ Top most product categories include cardiovascular, central nervous systems, anti-
incentives, anti-asthamatics, anti-ulcerants and anti-spasmodics
▪ Active Pharmaceutical Ingredients (APIs)
✓ 3 US FDA and EU GMP compliant manufacturing facilities
✓ 75 APIs across 10 diverse therapeutic areas
✓ Worldwide customer base in 80+ Countries
▪ Custom Manufacturing Solutions (CMS)
✓ Manufacturing API to customer specifications
✓ Designing and developing manufacturing processes
✓ Process optimization for competitiveness
✓ Expertise in manufacturing at varied scales, a deep understanding of
complex chemistry
Top Institutional Holders (%)
Malabar Group Funds 14.24
Mathews India Fund 2.55
*SHP (BSE) as on 30st June’21
80
180
280
Sep-20 Nov-20 Feb-21 May-21 Aug-21
Relative Price Performance
Sensex BSE Healthcare Neuland
*Share price & Market cap (BSE) as on 17th August’21

110
Neuland Laboratories Limited
Income Statement Highlights (Consolidated)
Balance Sheet Highlights (Consolidated)
(₹ mn.) FY19 FY20 FY21
Networth 6,956 7,055 7,820
Total Borrowing 2,098 2,455 1451
Cash and Cash Eq. 74 99 11
Total Assets 11,299 12,297 13,235
CMS Pipeline Details
Q1 FY22 Pre-Clinical P-1 P-2 P-3 Development Commercial Grand Total
API 15 3 7 3 12 6 46
Intermediate 7 4 2 0 8 11 32
Grand Total 22 7 9 3 20 17 78
47% 43% 49% 53%
20%18%
21%22%
31% 37% 23%22%
2% 2% 8% 3%
Q2FY21 Q3FY21 Q4FY21 Q1FY22
Others CMS NICHE PRIME
Quarter on Quarter Movement of Revenue(₹ mn.) FY20 FY21 Q4FY21 Q1FY22
Net Revenue 7,666 9,530 2,593 2,029
YoY Growth (%) 14.4% 24.3% 33.9% (1.5)%
EBITDA 1,053 1,625 400 277
EBITDA margin 13.7% 17.1% 15.4% 13.6%
PAT 158.8 802.9 172 86
PAT margin 2.08% 8.40% 6.63% 4.3%
YoY Growth (%) -1.4% 405.6% NA (42.6)%
Diluted EPS (₹) 12.38 62.58 13.4 6.7

111
Neuland Laboratories Limited –
Concall Highlights
Quarter Highlights
▪ Prime APIs witnessed growth led by Labetalol, Levofloxacin & Enalapril
▪ In the Specialty segment, Ezetimibe and Entacapone performed well even as there was a decrease in revenues
▪ CMS had a stable quarter, with 1 commercial and several development projects contributing to revenue
▪ Working on scaling up several complex CMS projects with high potential
▪ Calibrated manufacturing operations in line with long term priorities
Financial Highlights
▪ Total Income decreased by 1.5% to ₹ 2,029 mn in Q1FY22 due to unusual business complexity combined with slight
customer inventory destocking
▪ EBITDA margin decreased by 310 bps to 13.6% in Q1FY22 due to increase in raw material prices and certain upfront
costs incurred on account of certain projects
▪ Cash equivalents as on the date of the balance sheet stood at ₹ 245 mn
▪ Gearing ratio continues to be stable, and it is low at 0.22x on a year to year basis
▪ Capex investments of around ₹ 298 mn for Q1 FY22
Outlook▪ Confidence in the business, both from a medium and long term perspective is still very strong
▪ Many CMS projects are one or two steps away from commercialization, which will bring in continuous commercial
revenue
▪ Management expects overall performance of the current financial year to be still on track
▪ Looking at significant ramp in terms of capacity utilization of unit III in the medium term, which will drive future growth

112
Sequent Scientific Limited –India’s Only Integrated Animal Healthcare Company
Stock Profile
Incorporated 1985
BSE/NSE 512529/SEQUENT
Issued Shares (Mn) 248.4
Share Price* (₹) 243.6
Market Cap* (₹ Mn) 60,503.2
52-week Range (₹) 336.00-119.00
Shareholding Pattern (%)
Promoters 53.86
Public 46.14
Top Institutional Holders (%)
Infinity Holdings 5.91
UTI Ascent India Fund 3.35
*SHP (BSE) as on 30th June’21
▪ India’s only globally integrated animal health Company
▪ Expanded capabilities and capacities through a mix of organic and inorganic
initiatives
▪ 8 state-of-the-art manufacturing facilities based in India, Turkey, Spain and
Brazil, with approvals from global regulatory bodies, including USFDA, EUGMP,
WHO, TGA among others
▪ Portfolio of 35+ APIs across various segments, of which 30 are commercialized
▪ Operates in 2 major domains ‐‐ Animal Healthcare (API contributes ~30% and
formulation ~70%)
▪ SeQuent Research (Subsidiary) caters API, pharma, personal care and
nutraceutical companies and provide analytical/bio‐analytical services for
marquee clientele, including HUL, GSK consumer and ITC
▪ Highlights:
✓ API: 6+ product commercialization in the US
✓ 8+ API Pipeline
✓ Formulation: 15+ US and EU filings over 3 years
✓ 35+ FDF Pipeline
*Share price & Market cap (BSE) as on 17th August’21
80
160
240
Sep-20 Nov-20 Feb-21 May-21 Aug-21
Relative Price Performance
Sequent Sensex BSE HC

113
Sequent Scientific Limited
Animal Health Segment (Q1FY22)
Key Highlights
• Overall business growth of 8.9% CC in Q1FY22, with formulations
outpacing API
• Formulations grows 15.3% in Q1FY22 led by India, LATAM markets
• API decreased by 4.3% in Q1FY22 impacted due to customer led supply
chain rationalization and also delay in new API validation
• Europe sales muted due to lower sales in Spain
• Turkey growth subdued on account of operational challenges, expected
to pick up in Q3FY22
Income Statement Highlights
Balance Sheet Highlights
(₹ mn.) FY18 FY19 FY20 FY21
Networth 6,846 7,469 7,875 7,277
Total Borrowing 2,578 2,667 2,972 1966
Cash and Cash Eq. 395 678 681 537
Total Assets 13,428 13,879 15,183 1,393
46%
22%
13%
9%
10%
By Region (Formulation)
Europe LATAM Emerging Markets Turkey India
72%
28%
By Segment
Formulations APIs
(₹ mn.) FY20 FY21 Q4FY21 Q1FY22
Net Revenue 11,792 13,616 3,618 3,205
YoY Growth (%) 13.5% 15.5% 20.4% 8.6%
EBITDA 1,758 2,163 442 358
EBITDA margin 14.9% 15.9% 12.2% 11.2%
PAT 699 954 206 9
PAT margin 5.93% 7.0% 5.7% 0.3%
YoY Growth (%) 43.7% 36.4% 22.4% (94%)
Diluted EPS (₹) 2.85 3.85 0.84 0.04

114
Sequent Scientific Limited
Concall Highlights
Quarter Highlights
▪ Overall business growth of 8.9% CC in Q1FY22, with formulations outpacing API
▪ India business continues to grow strongly led by strong outperformance in cattle business, recovery in poultry segment
▪ Launched companion animal business in India with 4 products and 8 headquarters
▪ LATAM recorded strong growth driven by 3 recent launches
▪ Tulathromycin, first in-house developed injectable performed ahead of expectations in Europe
▪ 20% depreciation in Turkish Lira eroded above market business performance
▪ API: Regulated markets contributed ~72% of business compared to 66% in Q1FY21
▪ R&D pilot plant and additional clean room commissioned leading to capacity increase of~20%
Financial Highlights
▪ EBITDA impact of ₹ 58.5 mn by new initiatives, compensation to COVID affected employees and one-off costs and non-
cash ESOP impact of ₹ 156 million
▪ Slight increase in working capital by ₹ 330 million due to build up of strategic stocks of key products
▪ Marginal increase in Net Debt on account of inventory investment, however, Net Debt to EBITDA remains low at 0.82x.
Outlook
▪ API demand expected to be normalized in H2FY22 on account of which business growth should be at mid-teens levels
▪ Strong order book in Turkey expected to fuel growth from Q3FY22 onwards
▪ Expect to complete minority stake buyout of Brazil in Q2FY22
▪ Launch of companion animal segment in India, Brazil & Turkey to further drive growth
▪ Full year FY22 profitability to be in line with FY21
▪ Continued investment in geographic expansion in South East Asia, select European countries and USA

Metals & Mining115

116
Stock Profile
Incorporated 1945
BSE/NSE 502015/ASSOSTNB
Issued Shares (Mn) 82.85
Share Price* (₹) 13.90
Market Cap* (₹ Mn) 1,252.0
52-week Range (₹) 36.50-11.01
Shareholding Pattern (%)
Promoters 72.51
Public 27.49
ASI Industries Limited –India’s Largest Stone Mining Company
▪ Associated Stone Industries (ASI) is the world’s largest stone mining company
and the only listed player in the India
▪ Established in 1945, during the time of the British Raj
▪ Mainly engaged in mining and processing of Kota and other natural stones
▪ Kota Stone is a fine-grained variety of limestone, which is found only in Kotah
district, Rajasthan
▪ Holds the largest quarries in the world spread across 10 sq kms at
Ramganjmandi, situated in Rajasthan
▪ Produces over 12 million square meters of Kota stone every year
▪ Apart from Mining, Company is also engaged in generation Of wind power and
other trading activities
▪ Installed 3.625 MW capacity wind power plant comprising of 1.125 MW capacity
at Gadag District of Karnataka and 2.50 MW capacity at Satara District of
Maharashtra supplying to electricity boards
▪ In 2014 Associated Stone Industries Kotah Ltd's subsidiary company ASI Global
Limited (ASIGL) has acquired Al Rawasi Rocks and Aggregates L.L.C, Fujairah
U.A.E for a consideration of AED 21.71 million (USD 5.915 Million)
▪ Installed and operationalized a Sand Washing Plant in January, 2018 at foreign
subsidiary in Dubai which focuses on limestone and other rocks and minerals
▪ The end user of the industry is the real estate, construction and Infrastructure
0
100
200
300
Sep-20 Dec-20 Apr-21 Aug-21
Relative Price Performance
Sensex ASI Industries
* SHP (BSE) as on 30th June’21
*Share price & Market cap (BSE) as on 17th August’21

117
Key Highlights
▪ Total Revenue was ₹ 643.2 mn for Q1 FY22 as compared to ₹403.9 mn in Q1
FY21, an increase of 59.3%
▪ Core business (Kota stone) continues to do well and has reported 33% YoY
growth
▪ EBITDA stood at ₹163.7 mn for Q1 FY22 as compared to ₹101.6 mn during
Q1 FY21, an increase of 61.1%
▪ EBITDA Margin at 25.5% for Q1 FY22 as against 25.2% in Q1 FY21, an
increase of 30 basis points (bps)
▪ Net profit stood at ₹16.2 mn for Q1 FY22 as compared to ₹34.0 mn in Q1
FY21, a decrease of 52.3%
Income Statement Highlights
ASI Industries Limited
(₹ mn.) FY19 FY20 FY21
Networth 2,558 3,306 3,495
Total Borrowing 2,043 2,818 2,857
Cash and Cash Eq. 119 231 166
Total Assets 5,394 7,032 7,345
Balance Sheet Highlights
(₹ mn.) FY20 FY21 Q4FY21 Q1FY22
Net Revenue 2,505 2,306 702 643
YoY Growth (%) -8% 8% 11% 59%
EBITDA 556 409 62 164
EBITDA margin 22.2% 18% 9% 26%
PAT 314 119 7 16
PAT margin 12.5% 5% 1% 3%
YoY Growth (%) 39.8% -62% -91% -52%
Diluted EPS (₹) 3.49 1.32 0.07 0.18

▪ MMP Industries Limited (MMPIL) was established in 1983 near the central
Indian city of Nagpur
▪ Significant investment in R&D to develop various grades of Aluminium powder
and related products.
▪ Exports across the globe to countries in Europe, Middle-East, Africa and the
Asia Pacific in addition to domestic market.
▪ Pioneer in AAC Block segment in construction industry with an extensive range
of aluminium powders
▪ MMPIL has diversified into the field of aluminium conductor & Aerial Bunch
Cables and set-up a plant with an installed capacity of 7200 MTPA in the first
phase
MMP Industries Limited –
Leading Manufacturer of Aluminium Powders, Foils & Conductors/Cables
118
0.0
50.0
100.0
150.0
200.0
250.0
Sep-20 Dec-20 Apr-21 Aug-21
Relative Price Performance
Sensex MMP
*Share price & Market cap (BSE) as on 17th August ’21
Shareholding Pattern (%)
Promoters 73.5
Public 26.49
Stock Profile
Incorporated 1983
NSE MMP
Issued Shares (Mn) 25.4
Share Price* (₹) 151.50
Market Cap* (₹ Mn) 3,848.1
52-week Range (₹) 196.00-68.00
Leading manufacturer of
aluminium powders,
aluminium foils and
aluminium conductors /
cables for various
industries like Explosives,
Concrete Blocks,
Pesticides, Paint and
Power Transmission
Large Customer base in
diversified industries with
strong customer retention
and sizeable market share
Association with Global
Industry leader “Toyo
Aluminium K.K. Japan”
would help in moving up
the value chain alongside
technological support
Top Institutional Holders (%)
Massachusetts Institute Of
Technology6.7
*SHP (NSE) as on 30th June’ 21

119
MMP Industries Limited
Quarterly Segmental Performance
Income Statement Highlights
Balance Sheet Highlights
Operational & Manufacturing Units
• 3 manufacturing facilities located near Nagpur, Maharashtra
• Unit I – Maregaon, Dist. Bhandara (aluminium powders and
aluminium conductors / cables)
• Unit II – Hingna, Nagpur (aluminium powders)
• Unit III – Umred, Dist. Nagpur (aluminium powders and foils)
• Company owns 70 acres land bank out of which currently 40 acres is
utilized, and 30 acres is for future expansion
• Plant is ISO 9001:2015, ISO 14001:2015 and ISO 45001 : 2018 (IMS)
Certified
(₹ mn.) FY20 FY21 Q4FY21 Q1FY22
Net Revenue 2,448 2,318 773 863
EBITDA 306 270 87 83
EBITDA margin 12% 12% 11% 10%
PAT 186 174 69 57
PAT margin 8% 8% 9% 7%
Diluted EPS (₹) 7.31 6.87 2.73 2.25
(₹ mn.) FY19 FY20 FY21
Networth 1,787 1,908 2,090
Total Borrowing 206 172 304
Cash and Cash Eq. 494 44 4
Total Assets 2,276 2,340 2,717
*New Business

120
Modison Metals Limited–Leading Manufacturer of Electrical Contacts
▪ Modison Metals Ltd (MML) was established in 1975 as a silver refining company
and in 1978 commenced silver and silver alloy wire, plates, strips and solid/ bimetals
contact manufacturing
▪ The only player with capability in Low Voltage (LV), Medium Voltage (MV) and High
Voltage (HV) switchgear contacts under one roof
▪ MML’s plant laboratory is NABL accredited
▪ MML is ISO 9001: 2015, ISO 14001: 2015 and OHSAS 18001: 2007 compliant
▪ MML is CARE A rated
▪ Modison group has two manufacturing plants: Modison Metals Ltd at Vapi, and
Modison Copper Pvt Ltd at Silvassa
▪ It services diversified sectors including power, electrical T&D, infrastructure,
pharma, glass, defence, railways and bullion
▪ Its technological innovations include own copper chrome alloy for HV contacts
▪ It has been selected amongst the Top 3 in CNBC TV18 award
▪ It services blue chip customers in India and abroad including L&T, Siemens,
Toshiba, ABB, Schneider, Hitachi, Legrand, Alstom, GE, Bombardier, BHEL,
Panasonic, Honeywell, Philips, Mitsubishi in the T&D segment
▪ It services leading customers like ThermoFisher Scientific, Tata Chemicals, Grauer &
Weil India, in the consumer segment
▪ It has a wide range of B2C products including silver bullion and silver cutlery
Shareholding Pattern (%)
Promoters 52.69
Public 47.31
Stock Profile
Incorporated 1975
BSE/NSE 506261/ MODISNME
Issued Shares (Mn) 32.4
Share Price* (₹) 74.9
Market Cap* (₹ Mn) 2,426.7
52-week Range (₹) 97.1-33.0
* SHP (BSE) as on 30th June 2021
*Share price & Market cap (BSE) as on 17th August’21
80
130
180
230
Sep-20 Nov-20 Feb-21 May-21 Aug-21
Relative Price Performance
Modison Sensex

121
Modison Metals Limited
Key Highlights
• Revenue increased by 103% from ₹ 346 mn in Q1FY21 to ₹ 702 mn in
Q1FY22 despite overall macro economic uncertainty
• EBITDA increased by 171% to ₹ 46 mn in Q1FY22 on yearly basis
• Pandemic and sustained curfew impacted manufacturing operations and
demand fluctuations of certain customers resulting in a lower base and
unfavourable product mix
• Modison focused on streamlining operations to ensure minimal
disruptions
• Modison is cautiously confident of the future strong fundamentals of its
products and underlying customer demand
Income Statement Highlights
Balance Sheet Highlights
(₹ mn.) FY20 FY21 Q4FY21 Q1FY22
Net Revenue 2,222 2921.1 1,055 702
YoY Growth (%) 0.5% 31.4% 81.8% 103%
EBITDA 269.3 379 151 46
EBITDA margin 12.3% 13.0% 14.3% 7%
PAT 151.1 224.3 97 17
PAT margin 6.9% 7.6% 9.2% 2%
YoY Growth (%) (9.0%) 48.4% 55.4% NA
Diluted EPS (₹) 4.66 6.91 2.98 0.51
(₹ mn.) FY19 FY20 FY21
Networth 1,373 1,465 1,642
Total Borrowing 208.6 254.5 115.3
Cash and Cash Eq. 0.9 11.6 1.9
Total Assets 1,801.4 1,907.5 2,025.5
T&D industry customers Consumer industry customers

122
Stock Profile
Incorporated 1954
BSE/NSE 504918
Issued Shares (Mn) 9.0
Share Price* (₹) 2,047.45
Market Cap* (₹ Mn) 1,8427
52-week Range (₹) 2,139.00-540.00
Shareholding Pattern (%)
Promoters 73.22
Public 26.78
Sandur Manganese & Iron Ores Limited –India’s 2nd largest Manganese Ore miner
▪ Incorporated in 1954, The Sandur Manganese & Iron Ores Limited is
one of the most respected private sector merchant miners in the
country.
▪ The company has mining assets of 0.28 MTPA of Manganese Ore and
1.60 MTPA of Iron Ore.
▪ Sandur is the 2nd largest Manganese Ore miner in India, only next to
PSU – MOIL.
▪ In addition, the company has ferroalloys operations with an installed
capacity of 48,000 TPA, which has recently expanded from 32,000 TPA.
▪ The company is presently undergoing a substantial, long-term CAPEX
to forward integrate into Steel operations.
▪ Phase 1 of this CAPEX was successfully completed on 18th January
2021, which involved the setup of 0.4 MTPA Coke Oven Plant and 30
MW Waste Heat Recovery Boilers (integrating into existing Power
Generation capacity of 32 MW).
▪ Going forward, the company would be soon announcing Phase 2 of
this CAPEX plan in its journey to becoming an integrated Steel player
with 1 MTPA capacity.
* SHP (BSE) as on 30th June’21
*Share price & Market cap (BSE) as on 17th August’21
050
100150200250300350
Sep-20 Dec-20 Apr-21 Aug-21
Relative Price Performance
Sensex Sandur

123
Key Highlights
▪ Q1FY21 performance has been good on all fronts. Superior
realizations for Iron Ore coupled with reduction in production
cost drove the performance of the Mining segment; however, it
is equally pertinent to note the operational turnaround of
Ferroalloys and the addition of Coke proving to be a growth
engine for the Company
▪ The outlook for the company remains strong with improving
realization for Iron & Manganese Ores, the company will also soon
announce Phase 2 of its long-term CAPEX plan toward the journey
of becoming a fully integrated steel player with 1 MTPA capacity.
Income Statement Highlights
Sandur Manganese & Iron Ores Limited –
Q1FY22 Operational Highlights
(₹ mn.) FY19 FY20 FY21
Networth 6,659 8,397 9,931
Total Borrowing 0 3,997 3,070
Cash and Cash Eq. 227 342 667
Total Assets 8,268 14,620 17,239
Balance Sheet Highlights
(₹ mn.) FY20 FY21 Q1FY22
Revenue from
Operations 5,916 7,466 4,751
Total Income 5,973 7,644 4,831
Operating Expenses 3,963 4,750 2,209
EBITDA (excl. OI) 1,953 2,716 2,542
EBITDA % 33.0% 36.4% 53.5%
Finance Cost 67 131 103
Depreciation &
Amortization 195 268 122
PBT 1,748 2,495 2,398
PAT 1,473 1,539 1,488

Others
124
Garment & Textiles
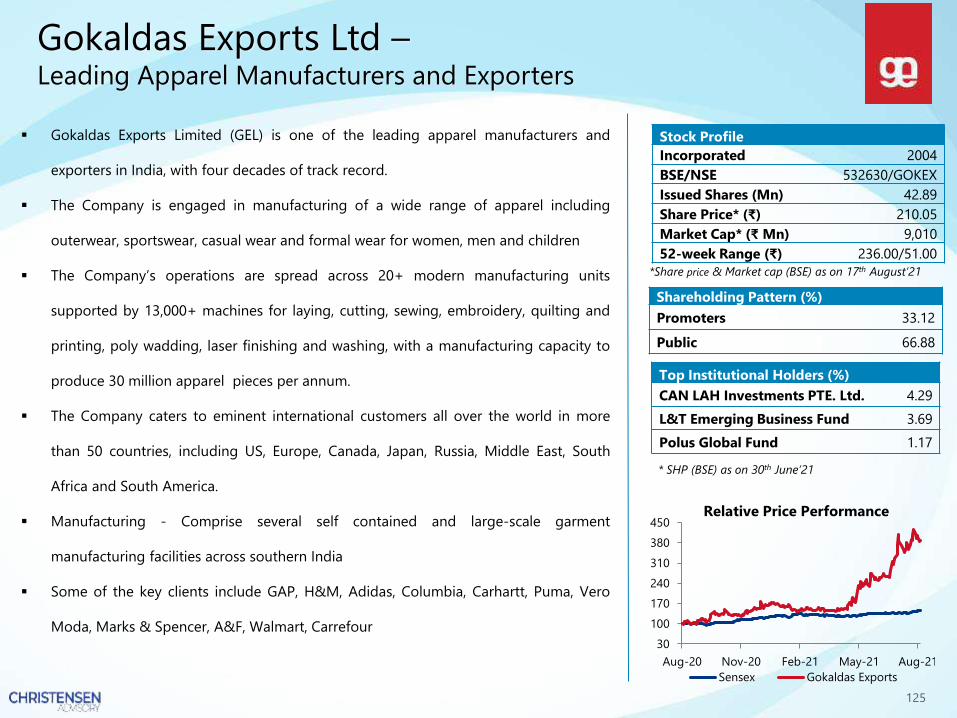
125
Shareholding Pattern (%)
Promoters 33.12
Public 66.88
Gokaldas Exports Ltd –Leading Apparel Manufacturers and Exporters
▪ Gokaldas Exports Limited (GEL) is one of the leading apparel manufacturers and
exporters in India, with four decades of track record.
▪ The Company is engaged in manufacturing of a wide range of apparel including
outerwear, sportswear, casual wear and formal wear for women, men and children
▪ The Company’s operations are spread across 20+ modern manufacturing units
supported by 13,000+ machines for laying, cutting, sewing, embroidery, quilting and
printing, poly wadding, laser finishing and washing, with a manufacturing capacity to
produce 30 million apparel pieces per annum.
▪ The Company caters to eminent international customers all over the world in more
than 50 countries, including US, Europe, Canada, Japan, Russia, Middle East, South
Africa and South America.
▪ Manufacturing - Comprise several self contained and large-scale garment
manufacturing facilities across southern India
▪ Some of the key clients include GAP, H&M, Adidas, Columbia, Carhartt, Puma, Vero
Moda, Marks & Spencer, A&F, Walmart, Carrefour
Top Institutional Holders (%)
CAN LAH Investments PTE. Ltd. 4.29
L&T Emerging Business Fund 3.69
Polus Global Fund 1.17
30
100
170
240
310
380
450
Aug-20 Nov-20 Feb-21 May-21 Aug-21
Relative Price Performance
Sensex Gokaldas Exports
Stock Profile
Incorporated 2004
BSE/NSE 532630/GOKEX
Issued Shares (Mn) 42.89
Share Price* (₹) 210.05
Market Cap* (₹ Mn) 9,010
52-week Range (₹) 236.00/51.00
* SHP (BSE) as on 30th June’21
*Share price & Market cap (BSE) as on 17th August’21

126
Gokaldas Exports Ltd
Key Highlights
▪ US and EU retail demand continued to be robust resulting in a huge pressure
on the company to deliver the backlog created by lockdown. Retail sales in
these markets have almost reached pre covid levels.
▪ The company also recognized the pending export incentives of about ₹ 4 Cr
of the previous quarter since RoSCTL rates were notified in July 2021.
▪ The company is in a better position to meet its short-term obligations
keeping its current ratio at 1.87 although, it has marginally decreased from 2
35 compared to the previous quarter.
▪ The company has reduced the net debt by ₹ 32 Cr during the quarter
keeping it at ₹ 134 Cr compared to ₹ 166 Cr as of 31 Mar 21.
▪ The net debt to equity is 0.53 in Q1FY22 compared to 0.72 in Q4FY21.
▪ The working capital days in Q 1 FY 22 have increased due to higher raw
material inventory holding for Q 2 production and goods produced could not
be dispatched due to lockdown.
Income Statement Highlights
Balance Sheet Highlights
(₹ mn.) FY20 FY21 Q4FY21 Q1FY22
Total Revenue 13,709 12,107 3,699 2,410
YoY Growth (%) 16.2% (11.7%) 3.3% 3.0%
EBITDA 1,021 1,137 380 199
EBITDA margin 7.4% 9.3% 10.2% 8.2%
PAT 304 265 160 (26)
PAT margin 2.2% 2.2% 4.3% -
YoY Growth (%) 18.8% 154.8% 168.7% 40.1%
Diluted EPS (₹) 6.67 5.83 3.55 (0.59)
(₹ mn.) FY19 FY20 FY21
Networth 2,404 2,266 2,901
Total Borrowing 3,807 3,910 3,652
Cash and Cash Eq. 112 123 153
Total Assets 8,093 9,247 9,899
Net Debt/Equity ROCE Net Working Capital
2.02
1.48
0.940.72
0.53
FY18 FY19 FY20 FY21 Q1FY22
1.6%
12.4%
14.4% 13.4%
7.1%
FY18 FY19 FY20 FY21 Q1FY22
10899
7785 91
FY18 FY19 FY20 FY21 Q1FY22

Gokaldas Exports Ltd
▪ Post easing of restrictions from July 5, 2021, the company has stepped up production to peak levels and are working
towards clearing the order backlog.
▪ Largest market for Gokaldas continues to be the US where monthly apparels store sales continued to be more than pre-
COVID level for four months in a row.
▪ Online sales of clothing and accessories is also continuing its momentum and growing strongly in 2021 with sales
registering 50% growth over pre-COVID 2019 level.
▪ China has been losing share continuously over the year and this has accelerated in recent times. India with its large
population offers a route to diversification for large buyers to derisk supply chain disruptions.
▪ Government of India recently announced continuance of RoSCTL up to FY2024. This provides policy clarity to export us
over the next three years helping the growth of the sector.
▪ PLI scheme supporting MMF based exports could also provide additional support to growth.
▪ The company has started pre-commercial runs in the new Tumkur Unit and planned to ramp it up to full capacity by end
September and early October. This will add about 4.25% to the existing capacity.
▪ Gokaldas is completing the formality for new units in Bhopal where it intend to start construction work shortly. This will
contribute to an increment of 6.5% capacity.
Concall Highlights

128
IRIS Clothings Limited –Fast Growing Readymade Garment Company For Kids
▪ Iris Clothings Limited is a readymade garment company engaged in designing,
manufacturing, branding and selling garments for kids under its brand name DOREME
in India.
▪ Iris has its presence in 26+ states with 104+ distributors
▪ The Company aims to cater to the kids segment through products that are both stylish
and comfortable.
▪ Iris delivers a broad range of affordable and good quality apparels for infants, toddlers
and children in their pre-teens, serving both their indoor and outdoor requirements.
▪ It has been in operations for over 17 years and continues to add new product lines.
▪ The Company has been enriching its collection of brands and expanding its product
offerings by going beyond kids wear and crafting products for men and women under
the brand Oxcgen.
▪ Pieces manufactured per annum has increased 15x from 0.6 million in 2004 to more
than 9 million in 2019 as the Company kept employing the best-in-class technologies
across its value chain
▪ Milestones
✓ 2004: Commenced business with in-house manufacturing processes
✓ 2005: Launched kids garments under the brand name – DOREME
✓ 2016: Acquired a land at Panchla, Howrah, West Bengal which was a major step
towards increasing manufacturing capabilities
✓ 2018: Crossed the ₹ 50 Cr. turnover milestone and got listed at NSE
Stock Profile
Incorporated 2004
NSE IRISDOREME
Issued Shares (Mn) 16.31
Share Price* (₹) 178.1
Market Cap* (₹ Mn) 2905.5
52-week Range (₹) 197.5 – 62.4
Shareholding Pattern (%)
Promoters 67.59
Public 32.41
*SHP (NSE) as on June 30, 2021
*Share price & Market cap (NSE) as on 17th August, ‘21
0
20
40
60
80
100
120
140
160
Aug-20 Nov-20 Feb-21 Apr-21 Jul-21
Relative Price Performance
Iris Clothings Nifty 50

129
Key Highlights
▪ Revenues took a hit due to the second-wave induced lockdowns as
operations ceased in Iris’ largest markets in India
▪ Sale volumes are picking up momentum, therefore the impact is
expected to not persist in the coming quarters
▪ Capex target for the year stands at ₹ 3 crore, with ₹ 1.2 crore already
employed
▪ Iris plans to capitalize on both online and offline demand for kids’
garments
▪ Expects the ecommerce portal to go live by the end of this financial
year
▪ Plans to enter the kids’ undergarments space by December 2021
Income Statement Highlights
Balance Sheet Highlights
(₹ mn.) FY20 FY21
Networth 322 388
Total Borrowings 246 203
Cash and Cash Eq. 0.3 0.6
Total Assets 816 759
IRIS Clothings Limited
(₹ mn.) FY20 FY21 Q4FY21 Q1FY22
Net Revenue 609 882 297 196
YoY Growth (%) (2)% 45% 63% 243%
EBITDA 138 171 53 44
EBITDA margin 23% 19% 18% 23%
PAT 39 65 21 18
PAT margin 7% 7% 7% 9%
YoY Growth (%) (22)% 66% 188% 241%
Diluted EPS (₹) 2.42 4.00 1.28 1.10
EBITDA (₹ Mn)
9
53
44
Q1FY21 Q4FY21 Q1FY22
57
297
196
Q1FY21 Q4FY21 Q1FY22
Total Income (₹ Mn)
-13
21 18
Q1FY21 Q4FY21 Q1FY22
PAT (₹ Mn)

Welspun India Limited –Global Home Textiles Leader
Welspun India Ltd (WIL), part of $2.7 Bn Welspun Group, is a global leader in the
Home Textiles landscape. With a strong global distribution network and world-class
vertically-integrated manufacturing facilities located in India, Welspun is strategic
partners with top global retaile₹
Diversified Brand & License Portfolio
Stock Profile
Incorporated 1985
BSE/NSE 514162/WELSPUNIND
Issued Shares (Mn) 1,005
Share Price* (₹) 124.9
Market Cap*(₹ Mn) 1,25,490
52-week Range (₹) 145.45-45.75
Shareholding Pattern (%)
Promoters 70
Public 30
* SHP (BSE) as on 30th June’21
*Share price & Market cap (BSE) as on 17th August’21
Advanced Textile
Spunlace MT 10,000 99%
Needle Punch MT 3,000 50%
Wet Wipes Mn Packs 75 21%
Home Textile
Particulars UOMAnnual
CapacityUtilization
(%)
Bath Linen MT 85,400 100%
Bed Linen Mn mtrs 90 90%
Rugs & Carpets Mn sq mtrs 10.8 105%
FlooringSoft Flooring Mn Sq mtr 7.5 18%
Hard Flooring Mn Sq mtr 5.4 74%
Production Capacity
050
100150200250300
1-S
ep
-20
1-O
ct-2
0
1-N
ov-2
0
1-D
ec-
20
1-J
an
-21
1-F
eb
-21
1-M
ar-
21
1-A
pr-
21
1-M
ay-2
1
1-J
un
-21
1-J
ul-
21
1-A
ug
-21
Relative Price Performance
Welspun India Sensex
17
-Au
g-2
1

Income Statement Highlights
Balance Sheet Highlights
Welspun India Limited
(₹ mn.) FY20 FY21 Q4FY21 Q1FY22
Total Revenue 67,411 73,401 21,357 22,145
YoY Growth (%) 3.29% 8.89% 32.1% 84.26%
EBITDA 12,146 13,520 3,203 4,598
% margin 18.02% 18.42% 15.0% 20.6%
PAT 5,244 5,508 1,344 2,175
% margin 7.78% 7.5% 6.29% 14.1%
YoY Growth (%) 141.80% 6.37% 51.99% 343%
Diluted EPS (₹) 5.05 5.37 1.30 2.17
(₹ mn.) FY19 FY20 FY21
Networth 27,793 29,721 36,447
Total Borrowing 48,920 52,534 49,346
Cash and Cash Eq. 1,544 2,051 2,994
Total Assets 77,423 83,103 86,778
Revenue Segmentation
Revenue (Rs-mn) B2B Branded
Q1FY22
Sales Contribution (%)
15,928
84%
2,996
16%
Q1FY21
Sales Contribution (%)
10,863
89%
1,298
11%
Growth YoY (%) 47% 131%
Revenue (Rs-mn) Textiles
Business
Emerging
Businesses
Q1FY22
Sales Contribution (%)
17,168
92%
1,757
8%
Q1FY21
Sales Contribution %)
11,357
93%
800
7%
Growth YoY (%) 51% 85%
Home Textile
Flooring
FY2196%
4%
83%
11%6%
Textiles Business
(Q1FY22)
HT - B2B
HT – Branded
HT - E-Comm
36%
57%
7%
Emerging Businesses
(Q1FY22)
Advanced Textile
Flooring – B2B
Flooring – Branded

132
Concall Highlights
▪ Welspun India achieved the highest quarterly revenues growing at 83% Y-o-Y and 2.5% Q-o-Q. Export sales grew by 53% Y-o-Y.
This had resulted from very high bed linen, bath linen, rugs and carpet sales demand for home textiles that was witnessed
▪ The Government of India’s recently announced an extension of RoSCTL till March 31, 2024, which would make a level playing field
for Indian textile manufacturers and exporters It would help to capitalize on the recent shift in global retail sourcing strategies
▪ The innovation product sales were 553 crores registering a growth of 64% Y-o-Y and contributing 29% to the sales. While, e-
commerce business also witnessed similar trends and heightened demand growing 45% Y-o-Y contributing 5% to the sales. The
e-commerce channel is on track to meet its $100 million target by FY23
▪ The domestic retail business recorded revenue of ₹ 48 crores in Q1 growing 222% Y-o-Y. With an aim to be “Har Ghar Welspun”,
the nationwide footprint rose to 4288 outlets and 80 towns with brand Welspun in Q1. The domestic home textile e-commerce
business, which includes brand Spaces and Welspun doubled on Y-o-Y basis
▪ Advanced textile business revenue during the quarter stood at ₹ 62.5 crores registering growth of 7.2% Y-o-Y basis
▪ The flooring business stood at ₹121 crores in Q1FY22 growing by 379% Y-o-Y contributing 5.4% to the top line. Confident in the
order size by the large clients from Middle East and the US, the flooring business sees high customer satisfaction and trust in its
products. It would make the Q2 backed with repeated orders After Capex spending on the flooring business, it holds a potential
to soon achieve revenue between 2200 to 2500 crores at peak
▪ Domestic flooring business has added about 15-16 channel partners in Q1FY22, it is around north of 400 active point of sales
▪ The emerging businesses portfolio is a pillar of growth and would play a key role in driving future profitability for Welspun India
Welspun India Limited

Others
133
Others
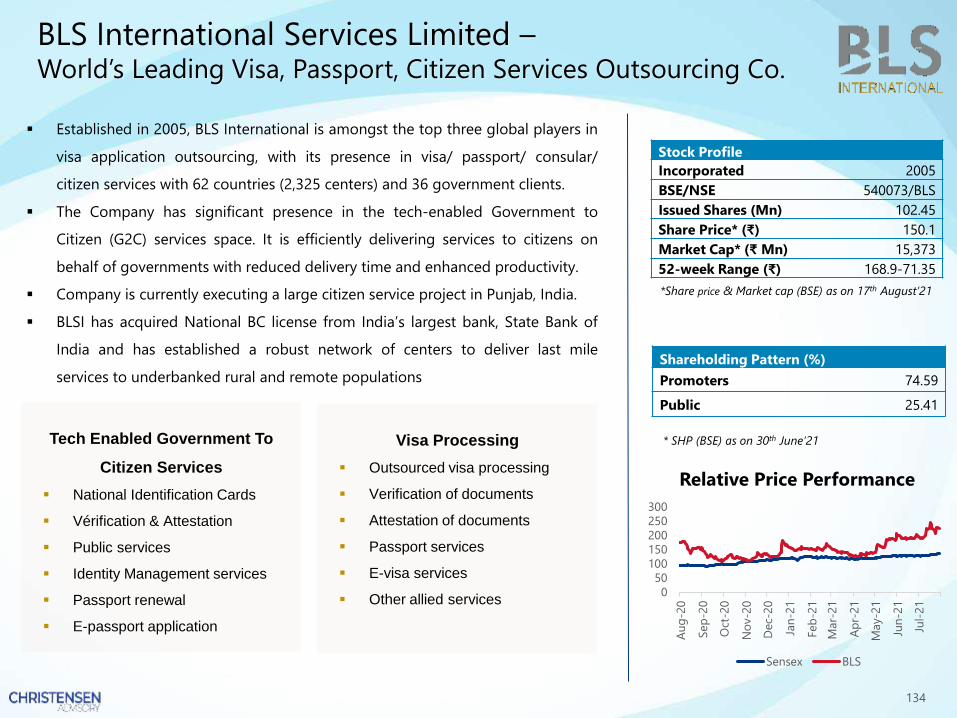
134
Stock Profile
Incorporated 2005
BSE/NSE 540073/BLS
Issued Shares (Mn) 102.45
Share Price* (₹) 150.1
Market Cap* (₹ Mn) 15,373
52-week Range (₹) 168.9-71.35
Shareholding Pattern (%)
Promoters 74.59
Public 25.41
BLS International Services Limited –World’s Leading Visa, Passport, Citizen Services Outsourcing Co.
▪ Established in 2005, BLS International is amongst the top three global players in
visa application outsourcing, with its presence in visa/ passport/ consular/
citizen services with 62 countries (2,325 centers) and 36 government clients.
▪ The Company has significant presence in the tech-enabled Government to
Citizen (G2C) services space. It is efficiently delivering services to citizens on
behalf of governments with reduced delivery time and enhanced productivity.
▪ Company is currently executing a large citizen service project in Punjab, India.
▪ BLSI has acquired National BC license from India’s largest bank, State Bank of
India and has established a robust network of centers to deliver last mile
services to underbanked rural and remote populations
* SHP (BSE) as on 30th June’21
*Share price & Market cap (BSE) as on 17th August’21
Tech Enabled Government To
Citizen Services
▪ National Identification Cards
▪ Vérification & Attestation
▪ Public services
▪ Identity Management services
▪ Passport renewal
▪ E-passport application
Visa Processing
▪ Outsourced visa processing
▪ Verification of documents
▪ Attestation of documents
▪ Passport services
▪ E-visa services
▪ Other allied services0
50
100
150
200
250
300
Au
g-2
0
Sep
-20
Oct
-20
No
v-2
0
Dec-
20
Jan
-21
Feb
-21
Mar-
21
Ap
r-21
May-2
1
Jun
-21
Jul-
21
Relative Price Performance
Sensex BLS

135
Key Highlights
▪ There have been three accomplishments during Q1’22, which include:
1. The company partnered with Knowledge Catalyst
(Singapore-based company) to provide Digital Health Certificates for
passengers travelling to and from Singapore.
2. In the domestic business, the company partnered with e-commerce giants
like Flipkart to provide last mile delivery services in semi-urban and rural
areas of India.
3. Rajasthan project :
➢ Awarded the contract for e-Mitra Kiosks in Rajasthan in 5 districts
including Jaipur, Alwar, Ajmer, Jodhpur and Nagaur.
➢ Launched the online portal for e-Mitra Kiosk operators wherein a mix of
G2C & B2C services are available
▪ With asset light business model and prudent capital allocations, BLS
International in a debt free, high ROCE generating company. It has ₹ 304 cr
net cash with zero borrowings, as on 30th June 2021
Income Statement Highlights
BLS International Services Limited
(₹ mn.) FY19 FY20 FY21
Networth 3,720 4,285 4,595
Total Borrowing 375 09 -
Cash and Cash Eq. 173 239 277
Total Assets 4,754 4,692 4993
Balance Sheet Highlights
(₹ mn.) FY20 FY21 Q4FY21 Q1FY22
Net Revenue 7,861 4,784 1,512 1,785
YoY Growth (%) -2.2% -39.1% -4.4% 242%
EBITDA 834 397 71 188
EBITDA margin 10.6% 8.3% 7.0% 10.5%
PAT 523 503 23 20
PAT margin 6.6% 10.1% 15.0% 11.1%
YoY Growth (%) -50.3% -4.0% 178.0% 2637.5%
Diluted EPS (₹) 5.11 4.9 2.29 1.98
9070
50
119133
173
116
239
45
277
Cash from Operations (cr) Cash & Bank (cr)
FY 17 FY 18 FY 19 FY 20 FY 21
Cash Flow Highlights

136
Concall Highlights
▪ BLS International enables its clients to serve their clients by providing innovative technology, proficient personnel, and
stringent data security. Its core offering clients is ‘state of the art technology’ that has helped them to process ~47mn
applications in last 15 years BLS is a ‘tech enabled services company’
▪ Despite challenging scenario, the company posted a good set of numbers supported mainly by growth in Consular, Citizen
and banking correspondent services which has already started operating at pre-covid level. The short fall of revenue from
the visa business was compensated to the major extent by higher revenues from other segments of the business.
▪ Due to re-alignment of expenses, the probable revenue coming in from visa services in the coming quarters will add to the
margins as the break even of the company has gone down.
▪ In Q1 FY-22, in the state of Uttar Pradesh, BLS rolled out 10,000 citizen service centers which should provide 360 G2C
services covering all state departments on behalf of Uttar Pradesh Government.
▪ They were also awarded a contract for e-Mitra kiosks for Rajasthan for 5 districts, including Jaipur, Alwar, Ajmer, Jodhpur,
and Nagaur in which they have already launched an online portal for the operators wherein a mix of G2C and B2C services
are available.
▪ The company has partnered with Knowledge Catalyst (Singapore based company ) to provide digital health certificates to
the passengers travelling in and out of Singapore.
▪ The company continues to remain strong with zero debt and cash and bank balance to the tune of ₹ 304 crores effective
this quarter, however a complete roadmap of cash/ capital budget is yet to be outlined by the company.
▪ The management is cognizant of the fact that piling cash in books are not adding value to the shareholders and are in
constant lookout for suitable candidate for acquisition, adjacent to their line of business.
BLS International Services Limited

137
Shareholding Pattern (%)
Promoters 64.78
Public 35.22
Butterfly Gandhimathi Appliances Ltd –Leading Manufacturer of Kitchen and Electrical Appliances
▪ Established in 1986 by late Shri V. Murugesa Chettiar, the Company is one of the
leading manufacturer of Kitchen and Electrical Appliances in the country.
▪ The Company sells its products branded as “Butterfly” across the country through
distributors, direct dealers, modern trade, online channels, gas dealer channel etc.
▪ The Company has over 500 exclusive distributors across India and is now present in all
29 states.
▪ The Company is a market leader in India for SS LPG Stoves & Table Top Wet Grinders
and major supplier of Mixer Grinders & Pressure Cooke₹
▪ Strong R&D focus which has led to several pioneering initiatives and continues to
drive in-house development of new products.
▪ Butterfly Gandhimathi is headquartered in Tamil Nadu and has a pan India presence.
▪ First in India to receive “GREEN LABEL‟ Certification for high thermal efficient LPG
Stoves and the first in India to be awarded “BEE Label with 2-star rating” for
manufacture of LPG stoves0
100
200
300
400
500
600
Aug-20 Nov-20 Feb-21 May-21 Aug-21
Relative Price Performance
Sensex
BSE Consumer Durables
Butterfly Gandhimathi
Stock Profile
Incorporated 1986
BSE/NSE 517421/BUTTERFLY
Issued Shares (Mn) 17.88
Share Price* (₹) 764.20
Market Cap* (₹ Mn) 13,664
52-week Range (₹) 923.85/137.85
* SHP (BSE) as on 30th June’21
*Share price & Market cap (BSE) as on 17th August’21
Top Institutional Holders (%)
IDFC Sterling Value Fund 3.47
DSP Small Cap Fund 3.04
Sundaram Small Cap Fund 2.11

138
Butterfly Gandhimathi Appliances Ltd
Key Highlights
▪ Total Income was impacted due to Covid 2nd wave which led to 5 weeks plant
shutdown.
▪ Revenue grew by 88% led by growth across all Channels and all product
categories.
▪ Gross Margin continuously healthy above 40% in spite of surging raw
material prices.
▪ The short-term borrowing has been utilized to build inventory for upcoming
season.
▪ Debtor Days currently stands at 45 days in Q1FY22 vs 30 days in FY21.
▪ Net working capital days has been increased from 36 days in FY21 to 80 days
in Q1 FY22, due to lockdown.
Income Statement Highlights
Balance Sheet Highlights
(₹ mn.) FY20 FY21 Q4FY21 Q1FY22
Total Revenue 6,787 8,696 2,062 1,444
YoY Growth (%) 4.1% 28.0% 86.4% 88.0%
EBITDA 422 813 142 82
EBITDA margin 6.2% 9.3% 6.9% 5.7%
PAT 40 362 89 10
PAT margin 0.6% 4.2% 4.3% 0.7%
YoY Growth (%) (58.4%) 808.7% - 111.0%
Diluted EPS (₹) 2.23 20.22 4.95 0.53
(₹ mn.) FY19 FY20 FY21
Networth 1,894 1,927 2,240
Total Borrowing 1,437 1,592 116
Cash and Cash Eq. 98 45 374
Total Assets 4,638 4,921 4,888
Branded Sales breakup
Particulars (₹ crore) Q1FY21 Q1FY22 YoY Growth
Kitchen Appliances 113.1 64.4 76%
Cooker/Cookware 25.7 8.0 221%
Others 5.6 4.4 27%
Total 144.4 76.8 88%

139
Butterfly Gandhimathi Appliances Ltd
Concall Highlights
▪ Revenue was impacted as manufacturing facility was closed for about five weeks during the quarter.
▪ The working capital days have slightly gone up as compared to previous year due to lesser revenue, and also higher
inventory build up to take care of upcoming season.
▪ Q1 is generally lower in ad spends, ad spends goes higher in Q2 and Q3. Since it's variable, it generally picks up during
the season and in Q4 it comes back to a lower level.
▪ The company has one of the lowest manufacturing costs. More than 80% of the sold products are manufactured in
house and since the company has huge volume, the manufacturing cost is low.
▪ The company has done about close to 10 crores of investment already and will be doing another 15 to 20 crores. With 30
crores of investment, the company can go up to 1400 crores of revenue.
▪ Channel financing and bill discounting is about 18.4 crores.
▪ In Pressure crooker, the company has done significantly well in Q1 compared to last Q1. Pressure cooker is expected to
do significantly well for this year because compared to competitors, the business is very small. Pressure cooker margins
are slightly higher than non-stick cookware.
▪ In 2-3 years’ time, the company can cross 100 crores of revenue only by export.

Dodla Dairy Limited –South India’s One Of The Largest Integrated Dairy Player
▪ Dodla Dairy (DDL) is an integrated dairy company based in south India
primarily deriving revenue from sale of milk & dairy based value-added
products (VAPs)
▪ Among private dairy players with a significant presence in south India, it is
the 3rd highest in terms of milk procurement per day
▪ Its operations in India are primarily across the five states of Andhra Pradesh,
Telangana, Karnataka, Tamil Nadu and Maharashtra.
▪ Commenced overseas operations in Fiscal 2015 through the acquisition of
the operations of Hillside Dairy and Agriculture Limited through our
Subsidiary Lakeside Dairy Limited in Africa.
▪ Research and Development activities are focused towards increased
productivity of cattle leading to production of quality and safe milk and milk
products, through Associate Company Global VetMed Concepts (GVC).
▪ Diversified into an ingredient input providing company by supplying upfront
cattle feed under the “Orga” brand, manufactured by Subsidiary Orgafeed
Private Limited, directly to farmers through same procurement network cost
for which is adjusted against the value of the raw milk supplied by farmers
*SHP (BSE) as on 30th June’ 21
50.0
100.0
150.0
Jun-21 Jul-21
Relative Price Performance
Sensex Dodla
*Share price & Market cap (BSE) as on 17th August ’21
Shareholding Pattern (%)
Promoters 62.54
Public 37.46
Stock Profile
Incorporated 1995
BSE/NSE DODLA/543306
Issued Shares (Mn) 59.49
Share Price* (₹) 596.15
Market Cap* (₹ Mn) 35,465
52-week Range (₹) 645.20 – 528.00
Top Institutional Holders (%)
SBI Consumption Opportunities Fund 6.83
International Finance Corporation 4.85
Ashoka India Opportunities Fund 1.68
Aditya Birla Sun Life Multi-cap Fund 1.06
Dsp Small Cap Fund 1.02

141
Dodla Dairy Limited
Revenue Distribution (Q1FY22)
Income Statement Highlights
Balance Sheet Highlights
72%
28%
By Verticals
MILK
VAP Excl Fat & Fat
based products
(₹ mn.) FY20 FY21 Q4FY21 Q1FY22
Net Revenue 21,456 19,504 5,333 5,147
YoY Growth (%) 79% -9% 0% 13%
EBITDA 1,409 2,425 360 509
EBITDA margin 6.6% 12.5% 6.8% 9.9%
PAT 499 1,260 96 361
PAT margin 2.3% 6.5% 1.8% 7.0%
YoY Growth (%) -21% 153% 120% 12%
Diluted EPS (₹) 8.96 22.33 1.67 6.12
(₹ mn.) FY19 FY20 FY21
Networth 4,068 4,335 6,580
Total Borrowing 1,578 1,501 869
Cash and Cash Eq. 397 802 2,849
Total Assets 7,519 7,926 9,722
Key Highlights
▪ Amongst private dairy players with a significant presence in the southern
region of India, third highest in terms of milk procurement per day
▪ Carry out collection operations through 7300 villages and are consistently
improving their direct procurement model at 90% presently
▪ Hold a set up of 14 plants with an aggregate capacity of 20 lakh litres,
approximately as of date.
▪ They have 42 sales offices and moved to 12 states as of Q1 FY22. Strong
network of 1510+ milk & milk product distributors, 3100+ distributor
agents, 455 Dodla retail parlors.
▪ Backward integrated into Cattle feed business through its subsidiary
Orgafeed, leveraging existing supply chains.
▪ Global VetMed Concepts(Subsidiary) focused on breeding, nutrition and
farm management, with the aim of leading farmers supplying raw milk
towards increased productivity of raw milk.
▪ As of Q1FY22 company processes and sells milk (full cream, standardised,
toned and double toned) and produces dairy based Value Added Products
(VAP) such as curd, ultra-high temperature processed milk, ghee, butter,
flavoured milk and ice cream among others

142
Dodla Dairy Limited
Concall Highlights
Quarterly Updates:
▪ Average milk procurement was 12.3 lakh liters per day compared to 10 lakh litres per day in Q1FY21.
▪ Average milk sales during Q1FY22 were at 8.3 LLPD compared to 7.7 LLPD in Q1FY21
▪ Curd sales (including buttermilk and lassi) during Q1FY22 was at 294.3 MTPD compared to 243.2 MTPD in Q1FY21
▪ Overall Margins are stabilizing after the muted Q4FY21 due to Covid-19 second wave impacting out of home
consumption of our products
▪ PAT Margins are reverting to our initial levels, and we will continue to maintain them going ahead
▪ Orgafeed – operated at 70% capacity in April . In FY22 will reach 100% capacity and will expand to a new location to
meet future demands.
▪ Added Pondicherry and are expanding operations in Maharashtra (procurement of ~29,000 liters of milk/day as of date)
Future Growth Drivers:
▪ Management confident of ramping up overall Milk Procurement to 14 lakh liters/day by the end of FY22
▪ Focus on the distribution network, with a model of own distribution parlours, distribution model and direct retail agents.
▪ Focus to grow in the B2C segment with the Distributor & Agent Model. Even the HoReCa model is expected to witness a
5% to 6% growth mainly from curd

143
Elecon Engineering Company Limited –Specialized Manufacturer of Industrial Equipments
Top Institutional Holders (%)
HDFC Trustee Company Ltd 2.09
▪ Specialized in manufacturing Industrial equipments with vast experience of 5 decades
▪ One of the Asia’s largest manufacturer of industrial gears and material handling
equipment
▪ Incorporated in 1960 by Ishwarbhai B Patel; managed by Prayasvin B. Patel, Chairman
and Managing Director;
▪ 2012, restructured business by transferring Material Handling Equipment (MHE)
business to its subsidiary Elecon EPC & acquired PTE Business from Prayas and
EMTICI
▪ Elecon EPC (Elecon holds 60% stake), provides engineering, procurement,
construction (EPC) and project management to Governments & Private sector clients
in diversified industries (Sugar, Power, Cement, Rubber, Marine & others) in India and
across globe
▪ 2010, acquired Benzlers and Radicon, manufacturers of screw jacks, shaft mounted
gearboxes and industrial reducers, paved way for globalizing its offerings
▪ Business Segment
✓ Gear Business – Designs & manufactures comprehensive range of industrial
gears under one roof; operates under 2 segments, catalogue (standard) and
engineered (customized) products
✓ Material Handling Equipment (MHE) business – provide end-to-end solutions
to the core sectors like power, steel, mining, cement, fertilizers and ports; over
100 turnkey projects executed till now
40
140
240
340
440
540
640
740
Aug-20 Nov-20 Feb-21 May-21 Aug-21
Relative Price Performance
Sensex BSE Capital Goods Elecon
Shareholding Pattern (%)
Promoters 59.20
Public 40.80
Stock Profile
Incorporated 1960
BSE/NSE 505700/ELECON
Issued Shares (Mn) 112.20
Share Price* (₹) 176.70
Market Cap* (₹ Mn) 19,826
52-week Range (₹) 183.60/21.50
* Share price & Market cap (BSE) as on 17th August’21
* SHP (BSE) as on 30th June’21

144
Elecon Engineering Company Limited
Key Highlights
▪ The operating revenues increased by 117.1% year-on-year to ₹ 292.5
crores from ₹ 134.8 crores in the corresponding quarter of the previous
year
▪ EBITDA increased to ₹ 589 crores translating to an EBITDA margin of
20.1%
▪ The consolidated PAT stood at ₹ 273 crores as compared to Loss of ₹ 206
crores for Q1 FY21
Segment Wise Performance (Q1 FY22)
90%
10%
Revenue Split
Gear Business
MHE
Income Statement Highlights
Balance Sheet Highlights
(₹ mn.) FY20 FY21 Q4FY21 Q1FY22
Net Revenue 10,885 10,447 3,501 2,925
YoY Growth (%) (4.0%) 30.4% 117.1%
EBITDA 1,482 1,913 745 589
EBITDA margin 13.6% 18.3% 21.3% 20.1%
PAT 897 576 316 273
PAT margin 8.2% 5.5% 9.0% 9.3%
YoY Growth (%) (35.8%) (55.0%) 232.2%
Diluted EPS (₹) 7.99 5.14 2.82 2.43
(₹ mn.) FY19 FY20 FY21
Networth 7,400 8,542 9,192
Total Borrowing 4,512 4,016 2,476
Cash and Cash Eq. 81 773 961
Total Assets 19,471 21,350 19,927
-0.3
50.2
MHE Gears
PBIT (Rs Crores)

145
Elecon Engineering Company Limited
Concall Highlights
▪ There is a huge gearbox which has gone into the first aircraft carrier that India has produced on their own, in Cochin
Shipyard and the sea trials are going on and also the main propulsion drive of this INS Vikrant has been supplied by
Elecon and it has been doing extremely well.
▪ The gearbox that Elecon has supplied for INS Vikrant is the type where very few countries in the world can produce such
kind of gearboxes and of which there are hardly five or six companies in the world who can produce these kinds of
gearboxes.
▪ In Material handling, the project orders related to NTPC jobs, which were ones causing a lot of anxiety are right now
almost 98-99% through. There is final tweaking that is happening at site, and the management is reasonably confident
that by 30th of September, or October, Elecon will be signing the documents with NTPC, and exit those two projects.
▪ The losses from material handling would almost come down to zero in FY22.
▪ The receivables are showing an improvement on a continuous basis and there are internal targets that have been laid out
for receivables.
▪ US is the most promising market because it is extremely large. Right now, Elecon doesn't even have 0.1% of the market
and is exploring the area and territory and has started getting breakthrough from reasonably good customers not only
in the US, but also from South America.

146
GMM Pfaudler Limited –Industrial Equipment Supplier to Pharmaceutical & Chemical Industries
▪ Established in 1962 as Gujarat Machinery Manufacturers (GMM); listed on BSE
▪ Has 3 Business Segments –
✓ Glass Lined Equipment: The GL business accounted for 67% of the Company’s
total revenue. GMM Pfaudler Limited is the market leader in this segment.
✓ Heavy Engineering: Accounts for 16% of Company’s total revenue. This
business line has been a focus area for the Company. The Company managed
to grow the business by creating a significant competitive advantage by
leveraging its brand, strong engineering capabilities, multiple code
accreditations and proven track record of manufacturing complex equipment.
✓ Proprietary Products: Accounts to 16% of the Company’s total revenue. This
business line includes the following products: Mixing Systems (MS), Engineered
Systems (ES) and Filtration & Drying Equipment (F&D).
▪ Formation/Acquisition
✓ In 1987, Pfaudler (U.S), global leader in GL equipment subscribed 40% equity to
form Joint Venture; in 1999 Pfaudler increased 51% stake in GMM and
company changed the name to ‘GMM Pfaudler Ltd.’
✓ In 2008, acquired Mavag AG (Switzerland), supplies engineered equipment
✓ A private equity Deutsche Beteilligungs AG acquired Pfaudler Inc in 2014
✓ Acquired Industrial Mixing Solutions Division (IMSD) of Sudarshan Chemical
Industries Ltd. In 2019
✓ The company acquired a majority stake in the global business of its parent
Pfaudler Group for $27.4 million
0
100
200Relative Price Performance
Sensex BSE Capital Goods GMM
Stock Profile
Incorporated 1962
BSE/NSE505255/GMMPFA
UDLR
Issued Shares(Mn) 14.62
Share Price* (₹) 4,236.50
Market Cap* (₹ Mn) 61,927
52-wk Range(₹) 6,360.00/3,316.00
Shareholding Pattern (%)
Promoters 55.0
Public 45.0
*Share price & Market cap (BSE) as on 17th August’21
Top Institutional Holders (%)
ICICI Prudential Multicap Fund 1.98
Nippon India Small Cap Fund 1.78
Malabar Select Fund 1.18
* SHP (BSE) as on 30th June’21

147
GMM Pfaudler Limited
Key Highlights
▪ Turnaround in Germany and China and strong order intake across
geographies.
▪ Project Apollo’s phase 2 completed and Interseal production to
begin in India.
▪ Backlog across geographies remains strong and focus shifts to
execution.
▪ China’s order intake remains strong; focus remains on execution and
improvement in site utilization
▪ Solid performance of Pfaudler US business with high order intake
▪ Significant improvement in HE order intake driven by large project
orders from L&T
▪ Rated by ICRA – a subsidiary of Moody’s – [ICRA] AA-/Stable/[ICRA]
A1+
53.0%
30.0%
16.0%
Revenue Breakup – Q1FY22
Technologies
Services
Systems
Income Statement Highlights (Standalone)
(₹ mn.) FY20 FY21 Q4FY21 Q1FY22
Net Revenue 5,164 6,408 1,900 1,714
YoY Growth (%) 23% 24% 68% 31%
EBITDA 994 1,536 523 437
EBITDA margin 19% 24% 28% 26%
PAT 621 951 315 258
PAT margin 12.0% 15% 17% 15%
YoY Growth (%) 53% 53% 214% 58%
Diluted EPS (₹) 42.50 65.06 21.54 17.68
Balance Sheet Highlights (Standalone)
(₹ mn.) FY19 FY20 FY21
Networth 2,177 2,711 3,574
Total Borrowing - 112 900
Cash and Cash Eq. 289 290 318
Total Assets 3,451 4,310 6,677
66.0%
23.0%
11.0%
Order Intake – Q1FY22
Technologies
Services
Systems

148
GMM Pfaudler Limited
Concall Highlights
▪ Order intake across all verticals remained very strong, especially driven by heavy engineering where GMM made
significant inroads into the oil and gas and petrochemicals segments as well.
▪ The order intake in India has improved significantly up by about 120%. So, the order intake during this quarter was close
to ₹290 crores. The current backlog compared to previous year same time has increased by 60%. GMM has about ₹500
crores of backlog currently on their books in India.
▪ Received an order for 8 million Swiss Francs, the largest single order Mavag's history. The current backlog at Mavag is
close to about 38 million Swiss Franc.
▪ GMM is working with the local geographies and local offices to extend the operational excellence - the cross selling and
the low-cost sourcing models, so as to increase market share and profitability.
▪ Both Karamsad and Hyderabad is operating at full capacity. The Vatva facility is operational, the company has two base
operational and expects two more base to come online shortly. GMM has ordered two new furnaces one for Hyderabad
and one for Gujarat.
▪ Won large order from L&T close to more than ₹100 crores worth of heavy engineering business for the oil and gas and
the petrochemical segment.
▪ Rated by ICRA, a subsidiary of Moody's as AA minor stable A1+.
▪ Germany and Interseal are stronger with improved profitability and robust orderbooks.
▪ Normag, Italy, UK, Benelux are also on track. GMM is also seeing a strong recovery in the US.
▪ The company is in the process of adding some capacity in Brazil to cater to the growing US market. China also has
turned around and has made a good start this quarter and has turn profitable.

Top Institutional Holders (%)
Quant Mutual Fund - Quant Small Cap Fund 2.1
149
Jash Engineering Limited –Leading Manufacturer of Equipment's for Water & Wastewater Treatment
▪ Headquartered at Indore, India, Jash is an ISO-9001:2015 / ISO-14001:2015 / BS OHSAS
18001:2007 certified company dedicated to offering varied products for use in Water
and Wastewater Pumping Stations and Treatment Plants, Storm Water Pumping
Stations, Water Transmission Lines, Power, Steel, Cement, Paper & Pulp,
Petrochemicals, Chemical, Fertilizers and other process plants.
▪ Jash has five well integrated state-of-art manufacturing facilities, four in India and one
in USA.
▪ The Company manufactures equipments which include Water control gates,
Mechanized screening systems, Screening conveying and washing systems, Knife gate
valves, Water hammer control valves, Energy dissipating valves, Archimedes screw
pumps, Micro hydro turbines, Clarifiers, Clariflocculators, Flash Mixers, Degritters,
Aerators, Thickeners, Gravity Decanters, Trickling Filters, Digester Mixers, DAF Units and
solid handling valves.
▪ Jash exports to over 45+ countries globally and markets its products under Jash, Jash-
Schuette, Jash-Rehart , Mahr, Rodney Hunt, E&M Jash, Shivpad and Sureseal brands.
These brands are approved by major municipal corporations, sewerage boards,
consultants and large EPC companies in India and abroad (US, Europe, Middle East,
South East Asia and Africa).
▪ Acquired Rodney Hunt in USA in 2016 for a consideration of US$ 4 mn and Mahr
Maschinenbau GmbH, Austria in 2014 for a consideration of EUR 2 mn. 0
100
200
300
400
Sep-20 Dec-20 Apr-21 Aug-21
Relative Price Performance
Nifty Jash
Stock Profile
Incorporated 1973
NSE JASH
Issued Shares (Mn) 11.8
Share Price* (₹) 482.00
Market Cap* (₹ Mn) 5,687.6
52-week Range (₹) 628.0-155.2
Shareholding Pattern (%)
Promoters 53.16
Public 46.85
* SHP (NSE) as on 30th June’21
*Share price & Market cap (BSE) as on 17th August’21

150
Key Highlights
• Infrastructural and production facility enhancement in Unit 1 Unit 2 and
SEZ Unit 3 Phase 1 will be completed by Sept end as scheduled Phase 2
expansion at SEZ Unit 3 comprising construction of assembly and paint
plant should be over by November 2021 as scheduled
• Production facility enhancement in Rodney Hunt plant at Orange is
planned at an estimated cost of ₹ 2 crores and this will be completed by
March 2022. This will allow US facility to manufacture Make in America SS
Fabricated gates in a shorter time frame as well as smoothen production
bottlenecks This shall significantly improve the capabilities and enable
Rodney Hunt meet increasing demands for Made in America projects
expected to come in year 2022 23
• New waste water treatment projects in India are at an advanced stage of
tendering award in most of the big cities like Mumbai Pune Bangalore
Chennai Surat and other cities As the number of projects are more and
their sizes are big, this shall result into strong domestic demand from 2022
23 onwards. The company is well placed to cater to this demand without
affecting its export business after the current expansion activities are
completed
• The company has strong order pipeline in South east Asia, Europe and
North America. This will ensure that the company shall end the year with
encouraging order book to accommodate growth in year 2022 23
• The effect of covid on infrastructure projects in India is reducing and
project companies are expected to be back to normal level of operations
by Sept 2021. This should enable the company to meet the business
forecast from the Indian market in the current year
62.8%
37.2%
Order Book Breakup (As on 1st Aug ,21)
Export
Domestic
Income Statement Highlights
(₹ mn.) FY20 FY21 Q4FY21 Q1FY22
Net Revenue 2,857 3,023 1,285 471
EBITDA 459 545 303 2
EBITDA margin 16.1% 18.0% 23.6% 0.4%
PAT 201 305 237 -37
PAT margin 7.0% 10.1% 18.4% -7.9%
Diluted EPS (₹) 18.43 25.78 20.0 -3.1
Balance Sheet Highlights
(₹ mn.) FY19 FY20 FY21
Networth 1,127 1,255 1,563
Total Borrowing 565 730 670
Cash and Cash Eq. 112 177 222
Total Assets 2,680 2,923 3,164
Jash Engineering Limited

151
Concall Highlights
▪ Q1FY22 Revenue at ₹471 million, up by 41% YoY and EBITDA at ₹2 million, up by 129% YoY
▪ The company has reported losses due to poor offtake of finished materials on account of second wave of
Covid from March to July in India which had slowed down project's execution in many states resulting
into deferment of delivery in first quarter. Also, the losses were due to Increase in payroll cost, freight cost
and change in treatment of commission expenses in case of Rodney Hunt
▪ Order book position as on 1st August 2021 is close to ₹2,940 million outside India and in ₹1,740 million
within India
▪ Order pipeline is quite strong, have negotiated orders as on 1st August close to ₹433 million and order
under negotiation are close to ₹627 million
▪ Rodney Hunt has order of ₹ 1,300 million and have a very strong pipeline
▪ Infrastructure and production facility enhancement in Unit 1 & 2 and, SEZ Unit 3 is going as per schedule
▪ India’s new wastewater treatment projects are expected to drive domestic business growth
Jash Engineering Limited

152
NURECA Limited –Leading Healthcare and Wellness Company
Stock Profile
Incorporated 2017
BSE/NSE 543264/NURECA
Issued Shares (Mn) 10.0
Share Price* (₹) 1,645.29
Market Cap* (₹ Mn) 16,452
52-week Range (₹) 2,000.70 – 559.25
Shareholding Pattern (%)
Promoters 70.0
DII 6.7
FII 11.2
Others 12.1
*SHP (BSE) as on 30th June ‘21
*Share price & Market cap (BSE) as on 17th August ‘21
50
100
150
200
250
300
350
Feb-21 Apr-21 May-21 Jun-21 Aug-21
Relative Price Performance
NIFTY NIFTY Pharma
NIFTY IT NURECA
Nureca Limited, is a leading healthcare and wellness company with a product range
of over 150 SKUs across different categories. Nureca’s flagship brand is “Dr Trust”.
Company’s products comply to USFDA, European CE, ROHS and ISO standards, as
well as the company has more than 100 design patents.
Nureca is a digital first B2C company and sells though all major ecommerce
channels and their own website drtrust.in. Dr Trust is a pioneer in health and
wellness with patented technologies and innovative solutions, helping users monitor
chronic ailments. Company is committed to creating products that support
diagnosis, treatment and prevention of illness through monitoring and analysis of
health data.
CHRONIC DISEASES
ORTHOCARE
LIFESTYLE & FITNESS
MOTHER & BABY NUTRITION
Business Focus Areas
Established Brands

153
Income Statement Highlights
Balance Sheet Highlights
(₹ mn.) FY19 FY20 FY21
Networth 80 149 1,631
Total Borrowing 3 94 36
Cash and Cash Eq. 1 1 1,267
Total Assets 235 339 1,864
(₹ mn.) FY20 FY21 Q4FY21 Q1FY22
Net Revenue 994 2,135 318 1,195
YoY Growth (%) 60.6% 114.7% -3.4% 295.4%
EBITDA 97 615 43.7 471
EBITDA margin 9.7% 28.8% 13.7% 39.4%
PAT 64 464 39 362
PAT margin 6.4% 21.4% 11.7% 29.8%
YoY Growth (%) 2.7% 625.2% 63.3% 283.2%
Diluted EPS (₹) 9.1 62.0 4.6 36.2
NURECA Limited
SKUs launched
till FY22
Product launched
In Q1
Pipeline for
The year
Product basket
In FY22
Product Range
Product Pipeline
202
713
4,639
8,0218,865
FY19 FY20 FY21 FY22 (as of
Jun-21)
CUSTOMER BASE (CUMULATIVE)*
*Gross Market Volume

154
Rane Group Limited –Leading Global Auto Component Company
Shareholding Pattern (%)
Promoters 46.37
Public 53.63
Top Institutional Holders (%)
SUNDARAM MUTUAL FUND 6%
ADITYA BIRLA SUN LIFE 4%
▪ One of the oldest auto component groups in India, founded in 1929
▪ Headquartered in Chennai with manufacturing base across 24 locations in India and US
▪ Preferred OE manufacturer for auto components like steering and suspension systems,
friction materials, valve train components, occupant safety systems, aluminium die-
casting components and Aerospace-grade wiring harnesses
▪ Partnered for manufacturing with leading companies including TRW Automotives USA,
NSK and Nisshinbo in Japan
▪ Covers industry segments including passenger vehicles(PV), commercial vehicles(CV),
farm tractors(FT), two-wheelers(2W), three-wheelers(3W), railways and stationary
engines(RE)
RANE HOLDING
Subsidiaries
Rane Madras (56%)
Rane Engine Valve
(51%)
Rane Brake Lining
(46%)
Rane Holding
America (100%)
Joint ventures
Rane TRW Steering
System (50%)
Rane NSK Steering
(49%)
JMA Rane
Marketing (49%)
Associates
SasMos (45%)
Rane Auto Parts
Kar Mobile Division
Corporate Structure
Rane Holdings
Stock Profile
Incorporated 1929
BSE/NSE505800/
RANEHOLDIN
Issued Shares (Mn) 14.28
Share Price* (₹) 670.25
Market Cap* (₹ Mn) 9,571.17
52-week Range (₹) 782.45-392.05
0
50
100
150
200
Sep-20 Dec-20 Apr-21 Aug-21
Relative Price Performance
Sensex BSE Auto RHL
* SHP (BSE) as on 30th June’21
*Share price & Market cap (BSE) as on 17th August’21

155
Rane Group Limited
FLAGSHIP COMPANIES
RANE MADRAS
▪ Operates two divisions- Steering & Linkage products and Diecasting products
▪ STEERING AND LINKAGE PRODUCTS
✓ Commercial production from 1960
✓ Market leader in India for manual steering gear system and suspension
system
✓ 4 manufacturing facilities with global accreditations
✓ Segment presence- PV, CV,FT
▪ DIECASTING PRODUCTS
✓ Started in 2006 to design and develop aluminium casting components and
sub-assemblies
✓ 2 manufacturing locations with ISO/TS compliance
RANE ENGINE VALVES
▪ Setup in 1959
▪ Manufactures valves and valve train components for various engine applications
▪ Market leader in its segment in India and has significant presence overseas
including the key markets of Europe, North America and far east.
▪ Business associations with leading companies including Volkswagen , Deutz and
Yamaha
▪ Manufacturing base in 4 locations and a state of the art research and development
centre for future growth opportunities
Rane Madras
Rane Engine Valves
Stock Profile
BSE/NSE 532988/RANEENGINE
Issued Shares(Mn) 7
Share Price* (₹) 301.05
Market Cap*(₹ Mn) 2,107.35
52-week Range(₹) 386.00-183.00
Stock Profile
BSE/NSE 532661/RML
Issued Shares(Mn) 12
Share Price* (₹) 380.10
Market Cap* (₹ Mn) 4561.2
52-week Range(₹) 496.00-193.00
0
200
400
Sep-20 Dec-20 Apr-21 Aug-21
Relative Price Performance
Sensex BSE Auto RML
0
100
200
Sep-20 Dec-20 Apr-21 Aug-21
Relative Price Performance
Sensex BSE Auto REVL
*Share price & Market cap (BSE) as on 17th August’21
*Share price & Market cap (BSE) as on 17th August’21

156
Rane Group Limited
Rane Brake LiningRANE BRAKE LINING
▪ Established in 1964 for manufacturing of brake linings, disc pads and clutch facings
▪ Technical collaboration with Nisshinbo Brakes Inc. , Japan
▪ 4 manufacturing units based out of India
▪ Market Leader in CV, PV and 2W space
▪ Leading supplier to Indian Railways for brake blocks
▪ Significant institutional business with state transport undertakings
▪ Exports to over 15 countries including Europe
RANE TRW STEERING
▪ Started in 1987
▪ Operates two divisions- Steering gears and Occupant safety
▪ Joint venture with TRW Automotive JV LLC, USA
▪ 5 manufacturing locations
▪ STEERING GEAR DIVISION
✓ Complete range of hydraulic power steering solutions
✓ Dominant share in CV and PV steering category
▪ OCCUPANT SAFETY DIVISION
✓ Manufactures Seat belt systems and Airbags
RANE NSK STEERINGS
▪ Started in 1997
▪ 49:51 joint venture with NSK Limited, Japan
▪ 3 manufacturing locations
▪ Product range includes Electric power steering columns, solid
steering columns, energy absorbing columns amongst others
RANE AUTO PARTS
▪ Started in 2014 with the objective of developing new range
of products exclusively for after markets
▪ Division follows the group ethos in terms of reliability, trust,
and quality
Stock Profile
BSE/NSE 532987/RBL
Issued Shares(Mn) 8
Share Price* (₹) 949.00
Market Cap*(₹ Mn) 7,592.0
52-week Range(₹) 1,200.90-522.90
0
100
200
300
Sep-20 Dec-20 Apr-21 Aug-21
Relative Price Performance
Sensex BSE Auto RBL
*Share price & Market cap (BSE) as on 17th August’21

157
Key Highlights
▪ Leading global auto ancillary conglomerate with dominating presence in key segments it operates in
▪ Diversified into multiple product lines and geographies and has ten companies in its portfolio
▪ Market share ranging from 30-70% depending on the product / vehicle segment and technology leadership by way of JVs with global
industry pioneers like TRW and NSK
▪ Strong fundamentals with robust aftermarket distribution network and long standing relationship with domestic and global auto OEMs
Market Grid
PRODUCT CATEGORY RML REVL RBL RHAI RTSS RNSS JMA SASM RAP KAR
Steering and Suspension System ✓ ✓ ✓
Valve Train components ✓ ✓
Frictional Material ✓
Occupant Safety ✓
Die Casting ✓ ✓ ✓
Wiring Harness ✓
After Sales ✓ ✓ ✓
Product Grid
MARKET SEGMENT RML REVL RBL RHAI RTSS RNSS JMA SASM RAP KAR
Passenger Vehicle(PV) ✓ ✓ ✓ ✓ ✓
Commercial Vehicle (HCV/HCV) ✓ ✓ ✓ ✓ ✓
2 Wheelers/ 3 Wheelers (2W/3W) ✓ ✓
Die-casting Components ✓ ✓ ✓
Tractors ✓ ✓ ✓
Trains ✓
Others/After sales ✓ ✓ ✓ ✓ ✓
Rane Group Limited

158
Rane Group Limited Group Financial Performance
Income Statement Highlights
Balance Sheet Highlights
Key Highlights
• Sales to Indian OE customers was impacted by coronavirus second wave’s
resultant lockdown and shutdown of OEMs production.
• Demand from International customers remained robust.
• Sales to Indian Aftermarket customers was affected due to lockdown in
various parts of the country.
• Drop in EBITDA due to lower volumes and increase in employee cost.
• PBT includes exceptional income of USD 3.8Mn on account of US Federal
Stimulus benefits received by our step-down subsidiary company in USA
By Vehicle Segment (%) – Q1FY22
RHL RML RBL REVL
(₹ mn.) FY19 FY20 FY21
Networth 8,657 8,222 7,645
Total Borrowing 4,108 5,352 5,359
Cash and Cash Eq. 356 593 611
Total Assets 22,249 21,668 22,816
(₹ mn.) FY20 FY21 Q4FY21 Q1FY22
Net Revenue 21,840 20,570 6,755 5,319
YoY Growth (%) -15.0% -6% 34% 174%
EBITDA 1,709 1,863 521 234
EBITDA margin 7.8% 7% 7% 4%
PAT 1,059 -604 -203 207
PAT margin -0.5% -3% -4% 4%
YoY Growth (%) -109.2% -476.4% -418.3% 125%
Diluted EPS (₹) -1.99 -39.5 -19.71 12.72

159
Rane Group Limited
Concall Highlights
▪ The export demand was good, and this was despite some impact due to semiconductor chip shortage and otherwise the
export could have been even slightly better.
▪ Rane Madras: Rane Madras. The hydraulic business continued traction and the company achieved the highest
production of cylinders. The light metal castings business in India continues to win new business and we have recently
won a new business worth about ₹ 43 crores. The US subsidiary has improved the operational performance and the Rane
Madras Board has decided to stay invested in this business for strategic reasons.
▪ REVL: The management continues to prioritize on cost reduction and achieve breakeven at lower volumes and continues
to focus on enhancing the non-auto customer.
▪ RBL: Due to be lockdown the proportion of aftermarket segment to the sales dropped significantly. This impacted the
product mix and resulted in a drop in profitability. RBL is continuing to enhance its presence in the export market and
has recently expanded to Saudi Arabia and also introduced some new products in Sri Lanka and Bangladesh.
▪ TRW: Continue to enjoy dominant share with the domestic customer for the steering gear products. On the occupant
safety side, the exports accounted for almost 67% of the revenue for this quarter. The company also won about ₹ 78
crores of new export business from their partner ZF.
▪ NSK: Secured some new business with Maruti Suzuki for an upcoming UV program

160
Stock Profile
Incorporated 2006
NSE SIRCA
Issued Shares (Mn) 27.4
Share Price* (₹) 331.65
Market Cap*(₹ Mn) 9,087
52-week Range (₹) 384.00 – 220.10
Shareholding Pattern (%)
Promoters 68
Public 32
Sirca Paints India Limited –Leading Luxury Wood Coatings Brand
▪ Sirca Paints India Limited (SPIL) is among the country’s leading brands of wood
coating products. The company is engaged in the manufacturing, sales, and
exports of wood coatings and other decorative paints under the brands ‘Sirca’,
‘Unico’, and others.
▪ With its newly commissioned manufacturing facility, SPIL is progressing on its
journey to become a leading brand in the Indian wood coatings & paints market.
The company is recognized for its hallmark of superior quality wood finishes.
* SHP (BSE) as on 30th June’21
*Share price & Market cap (NSE) as on 17th August’21
Brand Portfolio
• Italian wood, metal and glass coatings
• Wall paints range & wall putty
• Ultra luxury special effects range (recently added)
• Adhesives (recently added)
Product Portfolio
50
100
150
200
Sep-20 Nov-20 Feb-21 May-21 Aug-21
Relative Price Performance
NIFTY Sirca

161
Income Statement Highlights
(₹ mn.) FY19 FY20 FY21
Networth 1678.4 184.65 2015.7
Total Borrowing - - -
Cash and Cash Eq. 820 500 790
Total Assets 1907.9 2098.2 2547.3
Balance Sheet Highlights
(₹ mn.) FY20 FY21 Q1FY21 Q1FY22
Total Revenue 1350.5 1431.8 116.9 321.2
YoY Growth (%) 6.0% 174.8%
EBITDA 317.8 218.1 -2.5 28.7
EBITDA margin -31.4 -2.2% 8.9%
PAT 251.5 165.8 -6.9 22.1
PAT margin 17.90% 10.5% -5.9% 6.88%
YoY Growth (%) -34.1 417.2
Diluted EPS (₹) 9.18 6.06 -0.25 0.81
Revenue Segmentation
Sirca Paints India Limited
Retail
OEM
FY21 70%
30%
Manufacturing Facilities
• 8,000 Tonnes – NC, Melamine and Economical PU products
• 4,000 Tonnes – PU Thinner and above-mentioned products
• At optimum-utilization, ~225 Cr Revenue can be generated from this facility
• 48 Lakh Liters – Wall Paints
*all annual capacities
CAPEX
• Commissioned wood coatings manufacturing facility in November 2019, with
an outlay of ~33.2 Cr
• Unfortunately, COVID-19 disruptions started in March 2020 and there was a
fire-incident at plant in June 2020, leading to virtually no capacity utilization in
FY21
• Post that, the facility is again available for commercial production since May-21
Investment Rationale
• Leading luxury wood coatings brand with a superior recall
• Manufacturing facility commissioned, adding new levers of growth
• Growing distribution to become a pan-India brand
• Debt-free balance sheet
• Strong, exclusive partnerships with global brands – San Marco, DuranteVivan
• Established OEM clientele offering cross-selling opportunities for future
product additions

162
Quarter Highlights
▪ Q1FY22 began on a high note, but by mid-April, the industry had begun to feel the effects of the second
wave of Coronavirus. This trend lasted until the end of May, while demand started to pick up in June as
lockdowns relaxed. As a result, the Company recorded sales of 32.12 crores in the quarter, a 32% decrease
Q-o-Q (albeit on a higher base) and a 175% percent growth Y-o-Y on a subdued Q1FY21 base.
▪ On the profitability front, Gross Profit Margin & EBITDA Margin remained under pressure due to a)
increase in Raw Material prices. To add to this, the Company provided special discounts to help demand
recovery, resulting in lower Gross Profit margins. In the current month, the Company has undertaken
another price hike to offset some increase on the input side.
▪ The demand momentum was impacted with the 2nd wave of COVID-19 hitting all key markets. As a
result, dealer shops, depots, and branch offices remained shut partially in April and the majority of May.
However, June witnessed a recovery in demand.
▪ In this challenging external environment, the Company is working extensively on managing its working
capital cycle.
▪ Production at the manufacturing facility has picked up since June, and has been ramped-up further in
July. As a result, the Company is starting to see significant incremental sales from manufactured products.
▪ Going forward, Unico products are expected to deliver meaningfully to Sirca’s topline in FY22. As markets
open up fully, the Company would be looking at aggressive Sales & Marketing activities for these
products.
Sirca Paints India Limited

163
Stock Profile
Incorporated 1986
BSE/NSE 532856/TIMETECHNO
Issued Shares (Mn) 226.1
Share Price* (₹) 77.35
Market Cap*(₹ Mn) 17,489
52-week Range (₹) 94.50-35.25
Shareholding Pattern (%)
Promoters 51.33
Public 48.67
Time Technoplast Limited –Leading Manufacturer of Technology Based Polymer & Composite Products
▪ Time Technoplast Limited (Time Tech) is a multinational company and one of
the leading manufacturer of technology based polymer and composite products
▪ Strong presence in Asia & MENA regions with presence in 10 different
countries outside India
▪ Has 14+ recognized brands and works with >900 institutional customers
globally
▪ Well established inhouse R&D team of around 30 people having experience of
more than 15 years for upgrading existing and developing futuristic products by
using latest processing technology
0
100
200
300
Sep-20 Dec-20 Apr-21 Aug-21
Relative Price Performance
Sensex TIMETECHNO
* SHP (BSE) as on 30th June’21
*Share price & Market cap (BSE) as on 17th August’21
Product Portfolio:
New Development: DEF (Urea) Tanks, CNG Cascade, CNG Type IV Composite Cylinder
for Vehicles ( On Board Application), Composite Air Tanks and Tech Pack : Smart can
Top Institutional Holders (%)
NT Asian Discovery Fund 14.3
HDFC Trustee 9.0
Kapitalforeningen Investin Pro - Dalton 3.5

164
Key Highlights
▪ Total Debt reduced by ₹ 216 Mn in Q1FY22 from year ended FY21.
▪ Net cash from Operating Activities in Q1FY22 is ₹ 392 Mn
▪ Value added products grew by 52% in Q1FY22 as compared to Q1FY21, while
established products grew by 61%. The company’s focus remains to increase
the share of value-added products in its revenue and improve margins.
▪ Total capex in Q1FY22: ₹ 295 Mn
▪ Capacity utilization: Overall 70% (India: 63%; Overseas: 77%)
▪ During the month of May 2021, for the first time in India, the Company has
finally received approval from PESO and Bureau Veritas under ISO: 11439-
2013 as applicable for manufacturing of Fully Wrapped Carbon Fibre
Reinforced Type-IV Composite Cylinder for On Board (vehicle) applications
Income Statement Highlights
Time Technoplast Limited
Revenue Distribution (Q1FY22)
80.0%
20.0%
By Segment
Established Products Value Added Products
(₹ mn.) FY19 FY20 FY21
Networth 16,692 18,151 19,029
Total Borrowing 7,414 7,624 6,773
Cash and Cash Eq. 666 825 870
Total Assets 31,998 33,643 33,045
Balance Sheet Highlights
(₹ mn.) FY20 FY21 Q4FY21 Q1FY22
Net Revenue 35,803 30,087 9,534 7,547
EBITDA 5,012 3,909 1,313 1,009
EBITDA margin 14% 13% 14% 13%
PAT 1,691 1,034 522 285
PAT margin 5% 3% 6% 4%
Diluted EPS (₹) 7.48 4.57 2.31 1.26
Particulars (Q1FY22) India Overseas
Volume Growth (57% YoY) 66% 46%
Revenue Growth (59% YoY) 67% 47%
Revenue Contribution 62% 38%
EBITDA Margin 13% 13%
PAT Margin 3% 5%
Cash Profit Margin (5.5%) 9% 10%

165
Concall Highlights
▪ Composite Cylinders for Type IV CNG cascade:
▪ The company is seeing a good response to its Type-IV composite cylinders for CNG cascade and has also started
receiving orders for Type-IV cylinders for on-board application
▪ Several tenders (worth ₹ 150 crore) are in the discussion stages and the company expects them to be finalised in
coming months
▪ Total order book for CNG application (Cascades) is at ~₹85 crore
▪ Composite Cylinders for LPG:
▪ The company currently exports to 48 countries and has approval to export to 55 countries
▪ Time Techno has received trial order for ~30,000 cylinders from government owned OMCs
▪ Pipes
▪ The current order book is at ~₹ 210 crore
▪ Time Techno sees demand in this business aided by government projects such as Smart cities, Jal Jeevan Mission and
Swacch Bharat mission
▪ Current capacity utilisation in Q1FY22 is at ~70%. The Company expects the same to improve by ~10-15% from upcoming
quarters
▪ Time Techno has incurred a capex of ~ ₹ 30 crore in Q1FY22. The full year capex will be ~₹ 120 crore
▪ The management has guided a normalised EBITDA margin of ~14-14.5% for FY22
▪ The management has reiterated an RoCE of >19% in the next three years
Time Technoplast Limited

166
Thank You
www.christensenadvisory.com
BEIJING | HONG KONG | MUMBAI | NEW YORK | PHOENIX | SHANGHAI
© Christensen Advisory, India. All Rights Reserved.
Christensen Advisory and Christensen Logo are trademarks of Christensen Advisory Group. The content of this document are confidential. This work may not be used, sold, transferred, adapted, abridge, copies or reproduced
in whole or in part in any manner of form or in any media without prior written consent. All product names and company names and logos mentioned herein are the trademarks or registered of their respective owners