Click and read Annual Report 2015 01.01.2017 pdf
109
Expansion - the efforts of steelworkers and a fiery heart ANNUAL REPORT 2015
Transcript of Click and read Annual Report 2015 01.01.2017 pdf

Expansion - the efforts of steelworkers anda fiery heart
ANNUAL REPORT 2015

1
business report
ANNUALREPORT OFTHE SIJ GROUPAND SIJ D.D.
2015

2 3
business report business report
Introduction 4
Operating highlights 6
Foreword by the President of the Board of Directors 8
Report of the President of the Supervisory Board 10
About SIJ d.d. 12
Presentation of the SIJ Group 15
Significant business events and achievements 19
Events after the reporting period 21
Business report 22
Vision, mission and values 24
Corporate governance system of the Group 25
Strategic guidelines and business strategy 32
External business environment 35
Analysis of operations 37
Financial position 42
Operations by division 47
Risk management 56
Supply of raw materials 62
Energy supply 63
Research and development 64
Investments 65
Sustainable development 66
Companies of the SIJ Group 73
TABLE OF CONTENTS
Presentation of the investment in Perutnina Ptuj 84
Special purpose financial statements of SIJ Group, Perutnina Ptuj Group and Holding PMP Group 89
Independent Auditor's Report 90
Statement of Management's Responsibility 93
Special purpose financial statements 94
Notes to the financial statements 98
Financial Report SIJ Group 134
Independent Auditor's Report 136
Statement of Management's Responsibility 138
Consolidate Financial Statements 139
Notes to the Consolidated Financial Statements 143
Financial Report SIJ d.d. 179
Independent Auditor's Report 180
Statement of Management's Responsibility 182
Financial Statements 183
Notes to the Financial Statements 187
Technical terms and concepts 211

54
introduction introduction
INTRODUCTIONSteel can only be made by strong-willed
people, with a clear vision and full of
enthusiasm. The expansion of operations
is the result of their handy work, hearts
and minds.
< back to content

7
< back to content
6
introduction introductionOPERATING HIGHLIGHTS
SIJ Group: Key operating figures
Revenue in the USA (in million EUR) and proportion of exports (in %)
EBITDA (in million EUR) and EBITDA margin (in %)
Quantitative data 2013 2014 2015*
Cast steel production t 468,761 466,835 442,127
Financial data
Revenues1 in € thousand 658,653 707,858 664,817
Exports % 86.3 86.2 87.3
Operating profit in € thousand 2,163 39,543 23,341
EBITDA2 in € thousand 40,786 77,832 63,509
EBITDA margin % 6.2 11.0 9.6
Profit or loss for the period in € thousand -4,923 24,904 10,793
Capex in € thousand 52,357 47,633 56,886
Statement of financial position as at 31 December
Total assets in € thousand 775,779 789,261 863,695
Equity in € thousand 323,585 348,135 348,718
Net financial debt3 in € thousand 231,185 217,772 227,334
NFD/EBITDA 5.7 2.8 3.6
Employees
No. of employees as at 31 December 3,162 3,134 3,126
* Investments in Perutnina Ptuj and Holding PMP are excluded and presented in the section "Presentation of the investment in Perutnina Ptuj"
1 Revenues = net sales2 EBITDA = operating profit + amortisation/depreciation3 Net financial debt (NFD) = financial liabilities – cash – current financial receivables
Despite a significant deterioration in market conditions, we successfully maintained ourleading position in individual segments ofthe steel market in 2015. By focusing onnew markets, both geographically andin terms of product complexity, we havemaintained a high level of revenues andincreased the proportion of exports.
With an EBITDA margin of 9.6%, we are one of the most successful steel groups in the world. Excluding the negative effect of one-off events (see the section ‘Analysis of operations’ for more information), EBITDA would have been EUR 7.7 million higher, while the EBITDA margin would have reached last year’s level.
Once again in 2015, investments in themodernisation of existing equipment andthe purchase of new production equipmentexceeded the costs of amortisation anddepreciation (an increase in investments ofEUR 20 million or 41% relative to 2014 was recorded). The SIJ Group is aware that it can only meet the demands of its customers by constantly improving quality and focusing on technologically advanced production, and thus mitigate the adverse effects of economictrends and maintain its market position.
70
60
50
40
30
20
10
0
v mio EUR v 000 EUR
88%
87%
86%
85%
84%
83%
82%
81%
80%
2015
62.0
87.3%
2013
39.2
86.3%
2014
86.2%
48.7
Revenue in the USA Proportion of exports
100
80
60
40
20
0
v mio EUR v 000 EUR
12%
10%
8%
6%
4%
2%
0%
2015
9.6%
10.7%
2013 2014
11.0%
EBITDA
EBITDA margin
EBITDA excluding on-off evenets
EBITDA margin excluding one-off events
63.5 71.240.8
6.2%
77.8
80
70
60
50
40
30
20
10
0
v mio EUR v 000 EUR
2014
38.3 49.4
2015
40.2 69.5
2013
38.6 47.3
Amor�sa�on and deprecia�on Investments
Net financial debt (in million EUR) and NFD/EBITDA
250
200
150
100
50
0
v mio EUR v 000 EUR
6.0
5.0
4.0
3.0
2.0
1.0
0.0
2015*2013
5.7
2014
NFD NFD/EBITDA
227.3
3.6
231.2
2.8
217.8
Extensive investments in equipment facilitate increased capacities, the shortening of the steel casting process, lower specific consumption and the production of the most technologically advanced steel products. Investments are the main reason for the increase in net financial debt (NFD). The value of the NFD/EBITDAindicator is also higher as a result.
* Investments in Perutnina Ptuj and Holding PMP are excluded and presented in the section "Presentation of the investment in Perutnina Ptuj"
Amortisation/depreciation and investments (in million EUR)

9
< back to content
8
introduction introductionFOREwORD By THE PRESIDENT OF THE BOARD OF DIRECTORS
Dear Shareholders, Business Partners and Employees of the SIJ Group,
The year 2015 was full of challenges for the SIJ Group. Develop-ments on raw materials markets and specific, negative one-off events had a significant impact on operating results, which were down slightly relative to 2014. However, taking into account macroeconomic conditions, we can say that operations in 2015 were successful. We maintained our leading position in individ-ual niches of the steel market and maintained a high level of profitability, with an EBITDA margin of 9.6%. Such results make us one of the most successful global steel groups. We recorded negative one-off events in 2015 that affected op-erations. The entire information system was replaced at the Group’s largest steel company (Acroni), while technical malfunc-tions in the Steel Division led to three major stoppages of specific production processes. These events led to a sharp reduction in the volume of production, and had a negative effect on EBITDA in the amount of EUR 7.7 million according to internal estimates. Macroeconomic conditions deteriorated significantly during the second half of the year. Crude oil prices fell, leading to a drop in the prices of other raw materials. The prices of nickel (as a refer-ence raw material for setting the prices of steel products) plum-meted by more than 30% (relative to May 2015) and reached a ten-year low in December. This, of course, was not encouraging news for the steel industry as a whole. Investment activities are contracting, price pressures are rising and unutilised production capacities are increasing in a number of regions.
At the same time, the operations of the SIJ Group are more than stable, production is at full capacity and we are expanding our operations. In the circumstances described above, our achieved operating results are a testament to the global competitiveness of the SIJ Group and the flexibility of our business model, which allows us to adapt rapidly to market conditions. Those results also clearly confirm the appropriateness of our development strategy until 2020, which places greater emphasis on niche pro-duction programmes with high added value. In addition to the manufacture of finished steel products, we will increase produc-tion capacities in the aforementioned segments, and thus move up the value-added chain.
Confidence in the Group’s strategy and business model is also clearly demonstrated by the continuing successful diversification of financing sources with our entry on the capital market. We issued commercial paper twice in 2015 (in March and Decem-ber), and issued five-year corporate bonds in July in the amount of EUR 51 million. While the aforementioned commercial paper was intended for the financing of working capital, the funds col-lected through the bond issue were earmarked for the diversifi-cation of existing sources (loans) and the financing of strategic investments by the Steel Division. The European Bank for Recon-
The flexibility of our business model allows usto adapt rapidly to market conditions.
Achieved results confirm the appropriateness of the SIJ Group’s established development strategy, which focuses on niche production programmes.
struction and Development was a significant investor in the bond issue (accounting for 17% thereof), the first such action by the aforementioned international banking institution in Slovenia and thus special recognition for the SIJ Group.
We continued to implement the new planned investment cycle for the period until 2020, with EUR 57 million earmarked for in-vestments in 2015. The investment in a new VOD device at Metal Ravne thus began to bring positive effects already in the final quarter of 2015. That investment allows us to increase the pro-duction capacities of the steel mill and to produce certain types of steel that the company did not produce in the past. At Acroni, we continued to establish a line for the heat processing of special steels. That process is expected to be completed in the middle of 2016. We also signed an agreement for a new investment in the purchase of an AOD device that is expected to be operational in the first quarter of 2017. Both of the aforementioned invest-ments at Acroni represent entirely new development opportu-nities, and will facilitate a significant increase in the production capacities of the company’s most profitable programmes.
We began to implement the strategy to enter the finished steel product segment with the acquisition of the company Sistemska tehnika. The purchase and sales agreement was signed in Sep-tember 2015, and the transfer of ownership completed in Janu-ary 2016. Individual SIJ Group companies located in Ravne na Koroškem (Noži Ravne and Serpa, in addition to Sistemska tehni-ka) will be effectively linked to form a new joint company. We will thus achieve greater synergies and create a sound manufactur-ing division that we see as one of the leading global producers of steel industry equipment in the future.
We acquired a 45.82% participating interest in Perutnina Ptuj and a 56.19% participating interest in Holding PMP at the end of 2015, and published two takeover bids for the remaining shares of Perutnina Ptuj in December. The process of excluding both companies from the investments of SIJ d.d. is in progress. For that reason, they are not included in the programme structure and consolidated financial statements of the Group, but are pre-sented in the separate section "Presentation of the investment in Perutnina Ptuj".
We enhanced the vertical integration of the Group last year through the introduction of new service-sales centres on key markets (such as Germany and the US) and on certain perspec-tive markets where growth in operations is expected in the fu-ture (e.g. China). The export competitiveness of the Group re-mains exceptionally high, as the proportion of total revenues accounted for by exports continues to rise and stands at 87.3% (an increase of 1.1 percentage points relative to 2014). The trend of rising sales continues on the US market, where sales grew by 27% in 2015 relative to 2014 to reach EUR 62 million.
The SIJ Group is aware of the importance of relations with cus-tomers and business partners, and will thus dedicate even more attention in the future to high-quality and timely supply and to the entire range of services, including development opportuni-ties and after-sales activities. The Group’s strategic objective is the adaptation of business processes that will be customer-oriented, from the development of a new product or type of steel to logistics and supply. The first steps in that direction have already been taken. In September, we organised the first sales conference for the entire Group, which was attended by repre-sentatives of our business partners from more than 20 countries. The aforementioned area was the central topic of the Group’s traditional strategic conference in December.
The steel industry is one of the core elements of the so-called circular economy in Slovenia, as it is closely tied to specific local environments in which it represents a pillar of regional develop-ment. Therefore, the responsibility to reduce our environmen-tal footprint is fully integrated into all of our business process-es and decisions. The project to exploit waste heat for district heating purposes in Ravne na Koroškem was recognised as an environmentally friendly service, and serves as confirmation of the appropriateness of our policies. It drives us to expand the aforementioned project in 2016, and increase the exploitation of waste heat and transfer best practices to other areas.
The Group’s strategy until 2020 is characterised by the adjective ‘sustainable’, not only on paper, but in our actions. Those actions include the continuation of the policy to enhance the motivation and raise the competences of all employees (e.g. the implemen-tation of numerous internal academies and preparations for the establishment of the SIJ Education and Training Centre), support for sports clubs at the local level and top-flights sports at the na-tional level, and donations to vulnerable social groups that need assistance the most. That is why we not only donated funds for the purchase of necessary equipment, but also entered into a long-term cooperation agreement with the Soča University Re-habilitation Institute of the Republic of Slovenia in 2015.
The SIJ Group’s strengths are clear. We demonstrated our effec-tiveness in 2014 and received confirmation of the appropriate-ness of our policies in 2015. The results confirm that we per-formed our work well, and thanks should be given to each and every employee of the SIJ Group.
President of the Board of DirectorsAnton Chernykh

11
< back to content
10
introduction introductionREPORT OF THE PRESIDENTOF THE SUPERVISORy BOARD
Dear Shareholders,
A successful but exceptionally demanding financial year lies behind SIJ d.d. and the SIJ Group. External circumstances, in particular extreme fluctuations on the raw materials mar-kets witnessed throughout 2015 but especially during the second half of the year, required active adaptation and ef-fective measures by the company’s governance bodies. This will ensure the Group’s long-term stability and successful operations, even if the aforementioned trends continue. Previous measures, including previously implemented stra-tegic investments and the active adaptation of the produc-tion programme, are indications of the successful work of the Board of Directors and the appropriateness of the estab-lished long-term development strategy.
The members of the Supervisory Board had at their disposal last year all of the necessary materials, information and data, which were compiled by the Board of Directors in accordance with best practices of international corporations.
The Supervisory Board assesses that the Board of Directors upgraded the company’s corporate governance policy estab-lished in 2014, which envisages the achievement of signifi-cantly greater synergies and the effective transfer of informa-tion and knowledge between various levels of management and between individual manufacturing companies. Despite operating results that were down slightly relative to 2014, the Group has fully maintained its extremely high levels of competitiveness and profitability. This is also evident from the fact that the EBITDA margin (as one of the key performance indicators of the Group) remains high at 9.6%, despite lower revenues and considerable price pressures, meaning that the SIJ Group remains one of the most successful international steel groups.
Work of the Supervisory Board in 2015
The Supervisory Board functioned in the same composition in 2015, as shareholders reappointed Andrey Zubitskiy, Janko Jenko, Tomaž Stare, Evgeny Zverev, Denis Mancevič, Sergey Cherkaev and Sergey Frolov to new four-year terms of office at the General Assembly held on 8 April 2015. The members
of the Supervisory Board re-appointed Andrey Zubitskiy to the position of President and Janko Jenko to the position of Vice-President of the Supervisory Board at the latter’s constitutive session of 2 June 2015. The Supervisory Board effectively and comprehensively monitored and supervised the work of the Board of Directors in 2015, while continuously representing the interests of shareholders in accordance with the ownership structure and taking into account the knowledge and past ex-periences gained from the mutual cooperation of its members.
The Supervisory Board adopted decisions at four sessions dur-ing the year, one of those being a correspondence session held in November 2015. Members of the Supervisory Board regularly attended sessions, where they exchanged positions and posed questions based on the high-quality materials and clarifications that were received in a timely manner from the Board of Directors and specialist services. The Board of Direc-tors regularly briefed the Supervisory Board on significant busi-ness events at the company and in the SIJ Group, while the members of the Supervisory Board also received appropriate explanations in response to their questions and proposals. The Supervisory Board therefore assesses that cooperation with the Board of Directors was exemplary in 2015. Through state-of-the-art communication links, the Board of Directors ensured that the members of the Supervisory Board were able to ac-tively participate in convened sessions at all times, even if they were physically removed from the place of the meeting. Due to the international composition of the Supervisory Board, mate-rials and correspondences were continuously translated.
The Supervisory Board monitored and verified the operations of SIJ d.d. and the SIJ Group in 2015, and adopted decisions in accordance with the powers set out in the Companies Act (ZGD-1), the Financial Operations of Companies Act, the com-pany’s statute and other valid regulations.
Significant business events addressed by the Supervisory Board in 2015
The regular monitoring of operations and the supervision of the work of the Board of Directors of SIJ d.d. and the SIJ Group in 2015 included the discussion of the business plan and interim operating results, the adoption of reports on op-erations and investments at SIJ Group subsidiaries, the dis-cussion and adoption of the audited annual report, together with the drafting of a proposal on the use of distributable profit for the company’s General Assembly and the proposal on the appointment of an auditor, and the discussion of other business events and plans important for the operations of the company and the SIJ Group.
The company’s corporate governance policywas further upgraded in 2015 and achieves significantly greater synergies betweenvarious levels of management and between individual manufacturing companies.
In terms of content, the work of the Supervisory Board also in-cluded the issue of consents for the company’s capital-related ac-tivities, as SIJ d.d. was active on the financial market in 2015 with the issue of bonds and commercial paper. The company also re-ceived public exposure with its investment in Perutnina Ptuj d.d. in the form of a EUR 40 million recapitalisation and its purchase of shares of Holding PMP d.d., which members unanimously ap-proved based on the Board of Director’s plans to expand the op-erations of the Group to new areas, including the food industry.
In parallel with acquisition activities following the recapitalisa-tion of Perutnina Ptuj, SIJ d.d.’s Board of Directors also drew up a proposal at the end of 2015 for the demerger of the aforementioned investment through the establishment of a new company for the continued management of the invest-ment, the primary aim being the mitigation of the risk of the SIJ Group being defined as a ‘financial holding’. The members of the Supervisory Board therefore adopted resolutions at a correspondence session, appointing Deloitte Revizija from Lju-bljana as demerger and incorporation auditor. At its session in December 2015, the Supervisory Board reviewed and ap-proved the demerger plan, and adopted a report on the re-view of the demerger, in which the members of the Supervi-sory Board issued a positive position.
Based on the materials and reports provided by the Board of Directors, the Supervisory Board adopted resolutions at its sessions in 2015 that contributed significantly to the effective supervision of the work of the Board of Directors and the pur-suit of the company’s interests.
Verification and approval of the 2015 annual report
Letno poročilo družbe SIJ in Skupine SIJ za leto 2015 je bilo The annual report of SIJ d.d. and the SIJ Group for 2015 was submitted to the members of the Supervisory Board, together with the auditor’s report, in accordance with the law. The Su-pervisory Board discussed the annual report and proposal on the use of distributable profit at its session of 18 April 2016.
Based on the proposal of the Supervisory Board, the audit firm Deloitte Revizija was appointed certified auditor for 2015 at SIJ d.d.’s annual General Assembly held on 14 August 2015.
The audit was performed on the basis of an agreement with the company, and in accordance with the law and best busi-ness practices. The Supervisory Board was briefed on the audi-tor’s report and found as follows:
• the annual report drawn up by the Board of Directorsand verified by the auditor was compiled in a clear and transparent manner, and in accordance with the provisions of the ZGD-1 and valid accounting standards;
• the annual report includes all legally prescribed formalelements and the essential data required to make adecision on the adoption of the annual report and the proposal on the use of distributable profit; and
• the annual report also includes a report on the audit of the financial statements. According to the auditor’s report, the financial statements present a true and fair picture of the assets, liabilities, financial position and operating results, as well as a fair picture of the development of the operations of the controlling company SIJ d.d. and the SIJ Group.
The Supervisory Board therefore adopted the annual report of SIJ d.d. and the SIJ Group for 2015, as submitted by the Board of Directors, at its session held on 18 April 2016. The annual report was thus formally adopted in accordance with Article 282 of the ZGD-1. The Supervisory Board also approved the proposal on the use of distributable profit. The distributable profit of SIJ d.d. totalled EUR 34,389,621.87 as at 31 December 2015 and com-prises retained earnings in the amount of EUR 15,625,266.05 and net profit for the financial year in the amount of EUR 18,764,355.82. The company’s Board of Directors and Supervi-sory Board proposed to the General Assembly that distributable profit from 2015 in the amount of EUR 5,810,642.63 be used to pay dividends. The gross dividend per share amounts to EUR 6.01 (treasury shares are not party to dividends). Shareholders entered in the shareholders register at Klirinški depotni družbi d.d., Ljubljana on the day of the General Assembly are entitled to dividends. Dividends are paid within five business days fol-lowing the receipt of a request for payment from an individual shareholder. The rest of distributable profit in the amount of EUR 28,578,979.24 remains undistributed. The Supervisory Board, therefore, proposes that the General Assembly confer official approval on the Board of Directors and Supervisory Board for their work during the 2015 financial year.
Conclusion
The Supervisory Board finds that SIJ d.d.’s Board of Directors continued to implement decisive and comprehensive meas-ures in 2015 aimed at the optimisation and rationalisation of key business processes, and ensured the high level of compet-itiveness and profitability of the Group. The Supervisory Board therefore assesses that the work of the Board of Directors, as it relates to the management of the company, was effective and successful in 2015.
Ljubljana, 18 April 2016
President of the Supervisory BoardAndrey Zubitskiy

13
< back to content
12
introduction introductionABOUT SIJ D.D.
BASIC INFORmATION ABOUT SIJ D.D.
Company name SIJ – Slovenska industrija jekla, d.d.
Abbreviated name SIJ d.d.
Registered office Gerbičeva ulica 98, 1000 Ljubljana, Slovenia
Entry no. SRG 1/03550/00
Date of entry 22 February 1995
Registered share capital EUR 145,266,065.76
No. of shares 994,616 ordinary no-par-value shares
Ownership DILON d. o. o., Gerbičeva ulica 98, Ljubljana, Slovenia – 72.2240%
Republic of Slovenia, Gregorčičeva ulica 20, Ljubljana,Slovenia – 25.0001%
other shareholders – 0.0010%
treasury shares – 2.7749%
Registration no. 5046432000
VAT ID number SI51018535
Principal activity 70.100 Activities of head offices
SIJ d.d. is the controlling company and founder or direct or indirect owner of subsidiaries of the SIJ Group, which func-tions according to the principles of a contractual concern. The Board of Directors of SIJ d.d. and its executive management team thus represent the management of the entire SIJ Group, which strategically manages, guides and supervises the op-erations of all Group companies, both in Slovenia and abroad. SIJ d.d. performs its function as manager of investments in SIJ Group companies directly, with a controlling agreement in place as the legal basis for that function. The aforementioned function also represents the basis for the provision of central-ised services for Group companies, through which key busi-ness functions are managed and strategic decisions are made at the level of an individual company or the entire Group. For more details see the section ‘Corporate governance system of the Group’.
In accordance with the principle of the common manage-ment of business functions, we once again provided consul-tancy services in 2015 with regard to the performance of the individual business functions presented in the chart below. Certain functions are performed independently at SIJ d.d., while others are performed in conjunction with subsidiaries.
The most important tasks that are performed within individ-ual functions are as follows: the establishment of common bases for the drafting and implementation of all business plans, the purchase of strategic raw materials, other materi-als and services, marketing, management and the coordina-tion of pricing policies, key account management, standard information technology, the planning and implementation of a standard financial policy, human resource management, the provision of legal services, legal support and acquisitions, and corporate communication.
The Board of Directors of SIJ d.d. and itsexecutive management team strategicallymanage, guide and supervise the operationsof all Group companies, both in Sloveniaand abroad.
Centralised performance of business functions
General andLegal Affairs
Legal Affairs
Mergers andAcquisitions
CorporateCommunication
Public Relations
InternalCommunication
Sales andMarketing
Key Accounts
MarketResearch
StrategicPurchasing
StrategicRaw Materials
Non-StrategicSynergistic
Effects
StrategicDevelopment
ProgrammeStructureDefinition
(product mix)
Investmentsin Further
Development
Economics
Financial Sup-port for GroupDevelopment
CommonAccountingPolicies and
Methodologies
Planning,Reporting andControl System
IT
Developmentof Group
IT Support
SW and HWMaintenance
HR
Key Employees
Education,Training andCompetencyDevelopment
Technology
TechnologicalDevelopment
Energy
OPERATING RESULTS OF SIJ D.D.
Key data on the company’s operations
Key data 2013 2014 2015
Revenues in € thousand 8,807 9,836 12,892
Operating profit in € thousand 286 459 21,269
EBIT margin % 3.3 4.7 165.0
EBITDA in € thousand 496 781 21,643
EBITDA margin % 5.6 7.9 167.9
Profit or loss before taxation in € thousand 1,765 1,348 20,467
Profit or loss for the period in € thousand 1,751 1,211 19,752
Investments in € thousand 3,474 3,306 586
Capex in € thousand 2,373 4,561 604
Statement of financial position as at 31 December
Total assets in € thousand 218,629 240,828 350,813
Equity in € thousand 180,441 181,228 191,403
Non-current and current liabilities in € thousand 38,188 59,600 159,410
Net financial debt as at 31 December
Current financial receivables in € thousand 20,389 25,990 25,760
Cash and cash equivalents in € thousand 380 17,517 9,217
Non-current financial liabilities in € thousand 5,499 43,098 122,700
Current financial liabilities in € thousand 28,208 12,240 32,907
Net financial debt in € thousand 12,937 11,831 120,630
NFD/EBITDA 26.1 15.1 5.6
Employees
Average number of employees 43 49 63

15
< back to content
14
introduction introduction
Financial indicators 2013 2014 2015
Return on sales (ROS) % 19.9 12.3 153.2
Return on assets (ROA) % 0.8 0.5 6.7
Return on equity (ROE) % 1.0 0.7 10.6
Net profit per employee in € thousand 41 25 314
Added value per employee in € thousand 166 155 484
The company’s main revenue source is revenues from the provision of services for SIJ Group companies for individual business functions. These include services in the following ar-eas: financing, the acquisition and management of financial assets, accounting, planning and the analytical monitoring
of operations, strategic development, human resources, and legal and IT services. The majority of costs are accounted for by labour costs, which are rising in line with growth in the number of employees.
Labour costs (in million EUR) and average number ofemployees
There was an average of 14 more employees in 2015 than the previous year. We enhanced the staff of all centralised functions in accordance with the growth and development strategy.
Educational structure of employees
All new employees except one have a Level VII or Level VIII education, confirmation of our awareness that the company’s success depends to a great extent on key employees and their competences. The company promotes the development of employees through additional education and training, and provides them an environment that facilitates continuous professional growth and improvement.
10
9
8
7
6
5
4
3
2
1
0
v mio EUR v 000 EUR
70
60
50
40
30
20
10
0
2015
63
2013
43
2014
49
Labour costs Average number of employees
8.86.6 6.8
Primary school111
Secondaryvocational school
11
2
Technical and generalsecondary school
788
Higher education– level I
Higher education– level II
Master’s degreeand doctorate
31 December 2013
31 December 2014
31 December 2015
5
510
13
2533
44
66
PRESENTATION OFTHE SIJ GROUP
PROGRAmmE STRUCTURE OF THE SIJ GROUP
The SIJ Group is a vertically integrated group that comprises five divisions. The Steel Division generated more than 67%* of total revenues and more than 68%* of total EBITDA.
The diversification of operations and the programme struc-ture brings positive effects to the entire Group. Synergies are transferred to the entire chain via integrated divisions, from the collection and sale of scrap steel to the manufacture and distribution of steel, and the processing of steel into finished products.
Steel Division
Acroni (SI)
Metal Ravne (SI)
KOPO International(US)
SIJ Asia (DE)
SIJ Steel (Shangai) co.(CN)
Ravne Knives UK(GB)
Ravne Knives UK(North) (GB)
Ravne Knives USA(US)
ManufacturingDivision
Noži Ravne (SI)
Elektrode (SI)
SUZ (SI)
Serpa (SI)
Scrap CollectionDivision
Odpad Pivka (SI)
Dankor (HR)
Metal-Eko Sistem(RS)
TOPMetal (BA)
Headquartersand Other Services
SIJ d.d. (SI)
ZIP center (SI)
Železarna Jesenice(SI)
Ravne Steel Center(SI)
Ravne SteelDeutschland (DE)
Sidertoce (IT)
Niro Wenden (DE)
Griffon&Romano(IT)
Distribution and Processing Division
Distribution Manufacturing ServicesSteelScrap
The Steel Division accounts for more than67%* of the SIJ Group’s revenues.
The sales network was expanded in 2015with the acquisition of two companies in the United Kingdom, the establishment of a company responsible for sales of industrial knives in the USA and the establishment of a company in China to promote sales of steeland other products.
* In the calculation of shares intercomany transactions are not excluded.

17
< back to content
16
introduction introduction
SCRAP DIVISION
Companies collect, process and sort scrap metal, and prepare it for transport and basic processing by the Steel Division. Technological pro-
cesses are broken down by type of metal and individual technological process.
DISTRIBUTION AND PROCESSING DIVISION
The Distribution and Processing Division functions on key markets, as an extension of the sales and distribution of the SIJ Group’s products. It establish-
es and maintains direct contact with end-customers via maintenance and other services. As a form of customer support, service centres provide storage and cutting
services, as well as the heat and mechanical processing of steel.
HEADQUARTERS AND OTHER SERVICES
As controlling company, SIJ d.d. provides management and consultancy services for SIJ Group companies. Other companies provide various concessionary services
and social assistance services linked to the employment of disabled persons.
STEEL DIVISION The Steel Division is the driver behind the growth and development of the SIJ Group, and employed 2,130 people as at 31 December 2015. As the division responsible for the core activity, i.e. the casting of steel for further processing in the flat and bar programmes, the Steel Division is actively involved in the development of new types of steel tai-lored to the customer’s needs.
The Group plays a leading role in the EU in terms of sales of stainless quarto plates, with a market share of around one third. It covers one tenth of the EU market in terms of sales of tool, special and structural bar steel. The Group also enjoys a notable share of the manufacture of special steel plates.
mANUFACTURING DIVISION
The Manufacturing Division brings together companies that exploit the synergies of the production processes of the Steel Division to manufacture finished and semi-finished products such as industrial knives, welding materials, and drawn, polished and peeled steel bars. The production programme is supplemented by the manu-facture of spare parts and the provision of maintenance services.
ORGANISATIONAL STRUCTURE
Acroni (SI)
Metal Ravne (SI)
Noži Ravne (SI)
KOPO International (US)
Železarna Jesenice (US)
Serpa (SI), 89.72%
Ravne Steel Center (SI), 22.7%
Ravne Knives UK (GB)
Ravne Knives UK (North) (GB)
Ravne Knives USA (US)Elektrode (SI)
SUZ (SI)
ZIP center (SI)
Odpad Pivka (SI), 74.9%
Ravne Steel Center (SI), 77.3%
Griffon&Romano (IT)
Niro Wenden (DE), 85%
SIJ Asia (DE)
Dankor (HR), 51%
Metal-Eko Sistem (RS), 70%
Ravne Steel Deutschland (DE)
TOPMetal (BA), 51%
Sidertoce (IT)
Perutnina Ptuj (SI), 45.8%
Holding PMP (SI), 56.2%
Inoxpoint (IT)
SIJ Steel (Shangai) Co. (CN)
New investments
Companies without an indication of the proportion of ownership are 100% owned by SIJ d.d. or its subsidiaries.

19
< back to content
18
introduction introduction
OwNERSHIP STRUCTURE
Ownership structure as at 31 December 2015
We expanded the sales network in 2015 with the acquisition of two companies (Ravne Knives UK and Ravne Knives UK (North)) and the establishment of a company tasked with the sale of industrial knives (Ravne Knives USA). We established SIJ Steel (Shanghai) Co. with the aim of promoting the sale of steel and other products of the SIJ Group on the Chinese market.
Through the recapitalisation of Perutnina Ptuj d.d. SIJ d. d. ac-quired a 45.8% participating interest in the aforementioned company. With the purchase of 56.2% of the shares of Holding PMP, it increased its participating interest by an additional 5.53 percentage points and now holds a participating interest in Pe-rutnina Ptuj in excess of 50%. In accordance with the law, SIJ d.d. published takeover bids for the acquisition of the remain-ing shares of both companies, which expire in February 2016.
The company’s other shareholders are Unior d. d., Zreče, which holds ten shares, and the issuer of shares, which holds 27,600 shares.
The issuer purchased 11,468 shares from D.P.R. d. d., which is in liquidation, and 8,205 shares from Stanovanjsko podjetje d. o. o. in 2015.
In accordance with point 9 of the provision of the fifth par-agraph of Article 70 of the ZGD-1, the company hereby de-clares that, based on the resolutions of SIJ d.d.’s 25th General Assembly of 9 June 2014, the Board of Directors of SIJ d.d. is authorised to purchase 2.78% or a total of 27,610 treasury shares at a maximum purchase price of EUR 190.73 and a minimum purchase price of EUR 100.00. The aforementioned authorisation is valid for 36 months from the adoption of the relevant resolution. Pursuant to Article 251 of the ZGD-1, companies in which SIJ d.d. holds a majority stake and the third parties set out in the same article are also authorised to purchase treasury shares.
Board of Directors and Supervisory Board of SIJ d.d.
25.00 %Republic of Slovenia
2.78%Other shareholders
72.22%Dilon d. o. o.
SIGNIFICANT BUSINESSEVENTS AND ACHIEVEmENTS
January The central information system was replaced at Acroni, includ-ing the re-engineering of business processes and improve-ments in the transparency of operations. A new information system was also introduced to a lesser extent at Metal Ravne.
March
On the Slovenian market, we issued 9-month commercial pa-per in the amount of EUR 20 million and bearing an interest rate of 2.20%. The interest of investors exceeded the target and final scope of the issue by 60%.
April
Due to the expiration of the term of office of members of the Supervisory Board, the following persons were reappointed to the Supervisory Board at the 27th General Assembly of SIJ d.d. held on 8 April 2015: Andrey Zubitskiy, Janko Jenko, Tomaž Stare, Evgeny Zverev, Denis Mancevič, Sergey Cherkaev and Sergey Frolov. Their new four-year term of office began on 11 April 2015.
May
We continued previous activities aimed at human resource development, including the implementation of an internal sales academy and management academy, and the introduc-tion of a programme for the development of young employ-ees who demonstrate potential. The aforementioned activi-ties represent an extension of the comprehensive analysis of competences, which was carried out in autumn 2014 and serves as the basis for the establishment of the SIJ Education and Training Centre. The launch of the latter is planned for the first half of 2016 in Ravne na Koroškem.
June
We strengthened the Distribution and Processing Division significantly during the first six months of the year, and thus the entire vertical integration of the SIJ Group. SIJ Asia (estab-lished in 2014) began functioning with the aim of distributing steel products on the markets of Southeast Asia, as did three new subsidiaries: Ravne Knives USA, Ravne Knives UK and Ravne Knives UK (North). The purpose of the aforementioned companies is to expand distribution channels of the industrial knives programme to the US and UK markets.
The Group presented itself at Metec, the largest specialised metallurgical trade fair in the world, which is organised every four years in Düsseldorf, Germany. During the trade fair, we
announced comprehensive development projects in the Steel Division: the start of production of clad plates and the manu-facture of tubes.
July
We successfully completed a new issue of bonds on the Slo-venian market in the amount of EUR 51 million. The funds col-lected through the aforementioned issue were earmarked for the diversification of existing (secured) sources of financing with long-term, unsecured sources, and for the implementa-tion of the new strategic investment cycle in the Steel Division until 2020.
On 15 July 2015, we signed an agreement with the interna-tional company Primetals Technologies for the supply of an AOD device to Acroni with a total value of EUR 30 million. Af-ter 2017, the aforementioned investment will contribute sig-nificantly to increased capacities for the production of stainless quarto plates and to lower specific consumption in production.
On 29 July 2015, we published notification of our intent to enter the food industry through participation in the recapi-talisation of Perutnina Ptuj, with an investment in the amount of EUR 40 million. Following confirmation of the aforemen-tioned recapitalisation by Perutnina Ptuj’s competent deci-sion making bodies (supervisory board and general assem-bly), the aforementioned amount was paid up on 30 October. The company also published its plans for the management of the aforementioned investment, with the Board of Directors proposing the demerger of the investment with the establish-ment of a new company (in accordance with Article 623 of the ZGD-1). Ownership ties in the newly established company will remain entirely unchanged, as they are at SIJ d.d., with the Slovenian government holding a 25% stake that is man-aged by Slovenski državni holding.
August
SIJ d.d.’s 28th General Assembly was held on 14 August 2015, when shareholders approved the proposal of the Board of Directors and Supervisory Board on the use of distributable profit for 2014 in the amount of EUR 25,188,177.35 as fol-lows: EUR 5,810,642.63 was earmarked for the payment of dividends, while the remainder in the amount of EUR 19,377,534.72 is to remain undistributed. At the General As-sembly, the shareholders conferred official approval on the Board of Directors and Supervisory Board for their work dur-ing the 2014 financial year, and appointed the audit firm De-loitte Revizija from Ljubljana as auditor for the 2015 financial year based on the proposal of the Supervisory Board.

2120
introduction introduction
< back to content
On 14 August 2015, the company Noži Ravne issued a final binding offer for the purchase of 100% participating interests in the companies Sistemska tehnika and Sistemska tehnika Armas, and for the purchase of the claims against those companies held by the Bank Assets Management Company (BAMC). The sale and purchase agreement with the BAMC was signed in September.
September
The new VOD device began operating, while the refurbish-ment of the ladle furnace at Metal Ravne was completed, which will result in additional capacities for the secondary processing of melt. The total value of the investment was EUR 17.5 million.
On 9 and 10 September 2015, we organised the first sales conference of the SIJ Group aimed at strengthening the SIJ brand, presenting the Group’s key development projects and expanding sales channels. The conference was attended by representatives of all key business partners from more than 20 countries.
November
Metal Ravne’s project to exploit waste heat for district heating purposes in Ravne na Koroškem received an award for envi-ronmentally friendly service at the traditional Environmental Conference. The project has a great deal of potential for fur-ther development and the expansion of its application. It is the first project of its kind in Slovenia that successfully sought out and linked the users of waste heat, while developing the nec-essary technical and organisational solutions, which represent the biggest challenge in such projects.
December
The company issued 12-month commercial paper on the Slo-venian market in the amount of EUR 17.6 million and bearing an interest rate of 2.20%. It also repaid the first commercial paper issued in March 2015.
The new VOD device began operating inSeptember 2015, while the refurbishmentof the ladle furnace at Metal Ravne wascompleted. The total value of the investment was EUR 17.5 million.
Metal Ravne’s project to exploit waste heat for district heating purposes in Ravne na Koroškem received an award for environmentally friendly service.
EVENTS AFTER THEACCOUNTING PERIOD
January 2016
At the beginning of 2016, the subsidiary Noži Ravne received the requisite consent from the Slovenian Competition Protec-tion Agency for the final acquisition of the company Sistem-ska tehnika d. o. o., which changed its name to Ravne Systems d. o. o. on 18 January 2016. Intensive activities were also carried out to merge the former Sistemska tehnika d. o. o., Noži Ravne d. o. o. and Serpa d. o. o. The latter two continue to operate as independent legal entities, while the Group is planning their final merger into Ravne Systems d. o. o. in the coming months.
February 2016
On 2 February 2016, the takeover bid for the purchase of the shares of Holding PMP, naložbena dejavnost, d. d., Vinarski trg 1, 2250 Ptuj expired. The aforementioned bid was originally published by the company on 4 December 2015. During the validity of the takeover bid, from 5 December 2015 until 2 Feb-ruary 2016 (inclusive), the bid was accepted by 28 parties who together held 33,673 shares of the target company, designat-ed PMPG, which amounts to 43.81% of all shares of the target company. Together with the 43,197 shares of Holding PMP held by SIJ d.d. on the day the takeover bid was published, the latter became the owner of all 76,870 shares, representing a 100% participating interest in Holding PMP, with the transfer carried out on 11 February 2016.
March 2016
On 2 March 2016, the purchase of shares of Perutnina Ptuj reja perutnine, proizvodnja krmil, perutninskega mesa in izdelkov, trgovina in storitve d. d., Potrčeva cesta 10, 2250 Ptuj was completed. SIJ d.d. published a takeover bid for the afore-mentioned shares on 24 December 2015. During the validity of the takeover bid, from 28 December 2015 until 25 February 2016 (inclusive), the bid was accepted by 2,348 parties who together held 2,846,733 shares of the target company, des-ignated PPTG, which amounts to 26.09% of shares. Together with the 5,000,000 shares of Perutnina Ptuj held by SIJ d.d. on the day the takeover bid was published and the 603,184 shares of the target company held by Holding PMP on the day the takeover bid was published, i.e. a total of 5,603,184 shares of Perutnina Ptuj that were held directly or indirectly by the acquiring company on the day the takeover bid was published, SIJ d.d. acquired 8,449,917 shares through the acquisition, representing 77.43% of all issued shares of Perutnina Ptuj.
A 10% increase in revenues is planned in 2016 with the merger of the companies Sistemska tehnika, Noži Ravne and Serpa.
SIJ d.d. became the owner of 77.43% of the shares of Perutnina Ptuj in March 2016.

22 23
business report business report
BUSINESS REPORTA feeling for the needs of customers.
we are aware that a stable future lies in the
development of sales channels and the
strengthening of services and sales centres.
Stanko Berlizg2014 Employee of the YearMechanical MetallurgyDesigner, Metal Ravne
< back to content

24 25
business report business report
< back to content
CORPORATEGOVERNANCE SySTEmOF THE GROUP
Vision: To become the leading European producer of
highly profitable steel products in niche segments, from steel material
and alloys to finished steel products for industrial use.
We realise our mission by creating attractive,
essential and useful steel products that shape the future needs
of our customers.
The SIJ Group is guided by values of business excellence, such as:
ethics, expertise, fairness, and credibility.
We encourage all stakeholders with whom we work to act efficiently and strive
for sustainable development.
Statement of compliance with the corporate gov-ernance code
In the scope of its corporate governance statement pursu-ant to the provisions of the fifth paragraph of Article 70 of the ZGD-1, SIJ d.d. hereby provides explanations regarding its compliance with or deviations from corporate governance codes that apply to the company.
The corporate governance statement relates to the period from 1 January 2015 until the publication of the audited an-nual report, as the company did not take a position in previous periods regarding compliance with the content of corporate governance codes.
The provisions of the Corporate Governance Code, which was formulated and adopted by the Ljubljana Stock Exchange, the Slovenian Directors’ Association and the Managers’ Asso-ciation of Slovenia and in force since 8 December 2009, may apply mutatis mutandis to SIJ d.d. The aforementioned code is published on the website of the Ljubljana Stock Exchange (www.ljse.si) and applies primarily to public limited compa-nies, whose shares are listed and traded on the regulated market. SIJ d.d.’s shares, designated SIJR, are not traded on the regulated securities market. As the issuer of securities for trading on the regulated market, the company has issued two series of bonds, designated SIJ4 and SIJ5. The aforementioned bonds are traded on the Ljubljana Stock Exchange. Thus, in accordance with the provisions of Section 3 of the Financial Instruments Market Act (ZTFI), SIJ d.d. is considered a joint stock company. However, given its specific position vis-à-vis shareholders, the company is not obliged to take a position regarding the code in question. As an export-oriented Group with a focus on international investors, SIJ d.d. will monitor the provisions of the code in future financial years and make an effort to voluntarily apply the content of the code, if deemed necessary for the Group’s corporate governance system (the company already informs the general public and investors in a transparent manner with regard to business events in the local and/or foreign language. Those notifications exceed legal requirements and are published on the SEOnet website and on the company’s website).
Given the Slovenian government’s ownership stake in SIJ d.d., the recommendations set out in the Corporate Governance Code for Companies with Capital Assets of the State (SDH Code) and the Recommendations and Expectations of Slo-venian Sovereign Holding (Expectations of SDH), which were drawn up by Slovenski državni holding (SDH) in 2014 and are
published on its website (www.sdh.si), also apply to the com-pany.
With regard to the aforementioned codes and expectations, SIJ d.d. hereby declares that it operates in accordance with the applicable legislation and actively strives for responsible gov-ernance and transparent communications with all stakehold-ers. SIJ d.d. follows the content of the codes and expectations in those provisions that derive, in terms of content and pur-pose, from the provisions of valid legislation or overlap with them, as the recommendations of both codes are connected to a great extent in terms of content and application in those parts that are governed by the law.
In connection with the Expectations of SDH, the company hereby states the reasons for deviations from recommenda-tions regarding business planning and periodic reporting on the operations of the company/Group to SDH. In that regard, SIJ d.d. considers business plans a trade secret. Those plans are discussed by the Supervisory Board, and the general public is informed about the main strategic policies and objectives in a transparent and systematic manner, by ensuring that all shareholders and investors are notified equally through public announcements. The company also deviates from the recom-mendations in terms of periodic reporting on the operations of the company/Group to SDH. Interim results are also careful-ly treated as a trade secret, and are first published in accord-ance with valid legislation before they are available to SDH.
The company does not address other material recommen-dations from the aforementioned acts, as they do not apply given its position as described above.
During the period to which this statement relates, SIJ d.d. had not yet finished drawing up its own code of best business practices, which it intends to draft for all SIJ Group companies according to criteria that have been standardised to the great-est extent possible with the aim of achieving high standards of business integrity and corporate governance.
Notes to points 3, 4, 5, 6 and 8 of the provision of the fifth paragraph of Article 70 of the ZGD-1 are provided in other sec-tions of the annual report.
Board of Directors and Supervisory Board of SIJ d.d.

26 27
business report business report
< back to content
INTERNAL CONTROLS AND RISK mANAGEmENT IN FINANCIALREPORTING
Internal controls are procedures that ensure the achievement of our established objectives, the effectiveness and success of financial reporting, and compliance with laws, regulations and rules. In the broadest sense, the term internal controls includes all activities implemented with the aim of controlling risks within the Group.
Successful internal controls provide management reasonable assurance regarding the achievement of the Group’s objectives and play an important role in detecting and preventing fraud, and in protecting the Group assets, both physical and intangible assets, such as its reputation and intellectual property (trade-marks, etc.).
The SIJ Group therefore carries out numerous internal account-ing controls that are aimed at risk management, primarily with regard to the following:
• the accuracy and reliability of accounting data that are based on credible bookkeeping documents and evidence regarding the existence of business events that clearly show all data required for the correct recording of those events;
• the accuracy of accounting data that are appropriately checked before they are published, which is ensured through controls carried out at several levels: the comparison of data from analytical bookkeeping records with data from book-keeping documents, with data regarding business partners and with the actual physical state of assets, and the reconcilia-tion of analytical bookkeeping records andthe general ledger;
• compliance with legislation and other regulations; and• true and fair financial reporting that is ensured through
standard accounting policies, and predefined procedures and deadlines for entries.
Internal control guidelines and procedures have been defined at all levels, such that risks associated with financial reporting are managed through the following:
• a standard reporting system with extensive disclosures and explanations;
• the timely compilation and structural design of financial statements and analyses that serve as the basis for business decisions; and
• regular annual external audits of operations.
We believe that the current system of internal controls within the SIJ Group ensures the effective and successful achievement of
business objectives, operations that are compliant with legal pro-visions, and fair and transparent reporting in all material aspects.
Corporate governance
SIJ d.d. has a two-tier corporate governance system. The com-pany is managed by its Board of Directors, while the work of the latter is supervised by the Supervisory Board. Corporate governance is based on legal provisions, the company’s statute and internal acts, as well as local and international best business practices.
The company’s governing bodies are:
• the General Assembly,• Supervisory Board, and• the Board of Directors.
General Assembly
SIJ d.d.’s shareholders exercise their rights in matters regarding the company through the General Assembly. The convening and meeting of the General Assembly are governed by the compa-ny’s statute in accordance with the ZGD-1.
Two meetings of the General Assembly were held in 2015 at the company’s registered office (Gerbičeva ulica 98, Ljubljana). The convening of the General Assembly with explanations of pro-posed resolutions and the content of adopted resolutions are accessible by shareholders and the general public on the SEOn-et website (http://seonet.ljse.si) and on the company’s website (http://www.sij.si).
The 27th meeting of SIJ d.d.’s General Assembly was held on 8 April 2015, when decisions were made regarding the appoint-ment of members of the Supervisory Board and amendments to the company’s statute. The term of office of all the following members of the Supervisory Board expired on 11 April 2015: Andrey Zubitskiy, Janko Jenko, Tomaž Stare, Evgeny Zverev, Denis Mancevič, Sergey Cherkaev and Sergey Frolov. All members of the Supervisory Board were reappointed by shareholders for another four-year term of office. SIJ d.d. updated its corporate identity on its documents and website. Thus, the General As-sembly also approved proposed amendments to the company’s statute regarding its registered trademark, as well as other provisions relating to the harmonisation of the statute with an-nouncements by the company, valid legislation and with other changes as required.
SIJ d.d.’s 28th General Assembly was held on 14 August 2015, when shareholders were briefed on the annual report of SIJ d.d. and the SIJ Group for the 2014 financial year, the opinion of the auditor and the report of the Supervisory Board on the results
of the review of the annual report. The General Assembly ap-proved the proposal of the Board of Directors and Supervisory Board on the use of a portion of distributable profit for 2014 totalling EUR 25,188,177.35 for the payment of dividends in the amount of EUR 5,810,642.63. Excluding treasury shares, the gross dividend per share amounted to EUR 6.01. Dividends were paid after the meeting of the General Assembly. The General Assembly adopted a resolution whereby the rest of distribut-able profit in the amount of EUR 19,377,534.72 remains undis-tributed. The General Assembly conferred official approval on the Board of Directors and Supervisory Board for their work in 2014. Based on the proposal by the Supervisory Board, the Gen-eral Assembly appointed the audit firm Deloitte Revizija from Ljubljana to audit the financial statements of SIJ Group for the 2015 financial year.
Supervisory Board and presentation of its members
In accordance with the company’s statute, SIJ d.d.’s Supervisory Board comprises seven members who are appointed by the General Assembly. Proposals for the adoption of resolutions on the election of members of the Supervisory Board, which are decided on by the General Assembly, must be made exclusively by the Supervisory Board in the published agenda of the Gener-al Assembly, except for those items that are proposed by share-holders in accordance with the second paragraph of Article 296 of the ZGD-1. The Supervisory Board monitors operations in ac-cordance with the powers set out in the ZGD-1, the Financial Operations of Companies Act, the company’s statute and other valid regulations.
The term of office of all members of the Supervisory Board ex-pired on 11 April 2015. All members were therefore reappoint-ed to a new four-year term of office by shareholders at the 27 meeting of the General Assembly held on 8 April 2015. SIJ d.d.’s Supervisory Board thus functioned in the same composition in 2015. At the Supervisory Board’s constitutive session of 2 June 2015, Andrey Zubitskiy and Janko Jenko were re-appointed to the positions of President and Vice-President of the Supervisory Board respectively.
Andrey Zubitskiy, born in 1975, is a member of SIJ d.d.’s Su-pervisory Board, which he has presided over since 2007. As a representative of the Zubitskiy family, he represents the capital interests of the majority owner. He is an economist by profes-sion, and serves as the President of the Board of Directors of Dilon Coöperatief U.A. from the Netherlands, as a member of the supervisory boards of OAO Polema, OAO Koks and OAO Tu-lachermet and as the Vice-President of the Board of Directors of OOO Industrial Metallurgical Holding Management Company (all of the latter companies are from the Russian Federation).
Janko Jenko, born in 1964, was first elected to serve as a mem-ber of SIJ d.d.’s Supervisory Board at the 24th meeting of the General Assembly held on 30 August 2013. During his current term of office, Mr Jenko serves as Vice-President of the Super-visory Board, as he did in his previous term of office. He is a formally educated mechanical engineer with a wealth of inter-national experience in economics. He has established, managed and supervised large companies in Slovenia, Croatia, the Czech Republic and the USA. He thus has a great deal of experience regarding the operations of companies, industry, information technology and telecommunications. Mr Jenko is commercially active in several companies in the fields of telecommunications and information technology.
Tomaž Stare, born in 1965, was first elected to serve as a mem-ber of the Supervisory Board at the 24th meeting of the General Assembly held on 30 August 2013. He holds a master’s degree in business, with majors in accounting and auditing. He has a wealth of experience in the field of energy and the production of electricity, and also possesses the knowledge required to serve as a member of the supervisory boards of state-owned companies. He is employed at Savske elektrarne Ljubljana.
Evgeny Zverev, born in 1981, was first elected to serve as a member of SIJ d.d.’s Supervisory Board at the 24th meeting of the General Assembly held on 30 August 2013. He is a lawyer by profession. Mr Zverev graduated from the Kemerovo State University in Russia. He began his career in 2006 at Industrial Metallurgical Holding Management Company in Moscow, where he worked until 2007. At that time, he was employed by SIJ d.d., where he serves as the Director of Legal Affairs, Mergers and Acquisitions. He has also been the Director of Dilon d. o. o., SIJ d.d.’s largest shareholder, since 30 November 2012.
Sergey Cherkaev, born in 1981, is from the Russian Federation. He has served on SIJ d.d.’s Supervisory Board since 2011 and is an expert in the field of finance. He manages the area of eco-nomics and financial departments at Industrial Metallurgical Holding Management Company in Russia. He is a member of the Supervisory Board of OAO Tulachermet, and Vice-President of Financial Affairs and a member of the Board of Directors of OOO Industrial Metallurgical Holding Management Company (the two aforementioned companies are from the Russian Fed-eration).
Sergey Frolov, born in 1980, has been a member of the Super-visory Board since 2011. He completed his postgraduate studies at the state university for management. He is a member of the Supervisory Board of OAO Koks and Vice-President of Strategy and Communications. He is also a member of the Board of Di-rectors of OOO Industrial Metallurgical Holding Management Company (the two aforementioned companies are from the Russian Federation).

28 29
business report business report
< back to content
Dr. Denis Mancevič, born in 1981, was first elected to serve as a member of the Supervisory Board at the 26th meet-ing of the General Assembly held on 29 August 2014. Holds university degrees in Russian, the sociology of culture and political science. He completed his doctoral studies in the field of social sciences and humanities. Dr Mancevič is the author of ten scientific, professional and journalistic articles on Russian studies and on international energy and econom-ic relations. He began his career in 2010 in the commercial sector, and continued in the position of economic adviser to the Slovenian Embassy in Moscow. He has served as the Director of Corporate Communications within the SIJ Group since May 2014.
Presentation of the management of SIJ d.d. and the SIJ Group
SIJ d.d. is the controlling company and founder or direct or in-direct owner of subsidiaries of the SIJ Group, which functions according to the principles of a contractual concern. The Board of Directors of SIJ d.d. and its executive management team thus comprise the management of the entire SIJ Group, which stra-tegically manages, guides and supervises the operations of all Group companies, both in Slovenia and abroad.
The majority of Group companies operate in Slovenia. SIJ d.d., as the controlling company, and six direct subsidiary limited li-ability companies in Slovenia (Acroni, Metal Ravne, Noži Ravne,
Elektrode, SUZ and Zip center) have entered into an enterprise agreement, under which the operations of those subsidiaries are subject to the management of the controlling company. Žična Celje, which was deleted from the companies register on 1 July 2013, and Železarna Jesenice, which remains indi-rectly subject to common management, also entered a similar agreement in 2007. The participating interest in the latter was transferred within the Group to Acroni in 2015 in the form of a non-cash contribution. Subsidiaries also have registered offices in Italy, Germany, Croatia, Bosnia and Herzegovina, Serbia, China and the USA. As a rule, companies are 100% owned or under the controlling influence of SIJ d.d. For the most part they are organised as limited liability companies, except in Italy where they are organised as public limited companies. SIJ d.d. took a new step in the expansion of its corporate governance activities in the summer of 2015 with the recapitalisation of Perutnina Ptuj in the amount of EUR 40 million and the purchase of shares of Holding PMP. The aforementioned investments will be de-merged into a newly established company. The corporate gov-ernance of the two companies will be segregated and redefined taking into account relations between the governance bodies of the newly established company.
SIJ d.d.’s Board of Directors manages and strategically governs the entire Group through resolutions, instructions and other acts that it issues in accordance with its powers, and through which it actively and strategically governs and guides all key business pro-cesses of the SIJ Group as the management body of the company and SIJ Group or owner of subsidiaries. The executive manage-ment team is responsible for ensuring that established objectives are achieved in individual strategic areas across the entire Group, and that established mechanisms of consolidated areas of opera-tions are implemented consistently.
Board of Directors and presentation of its mem-bers
In accordance with the statute of SIJ d.d., the Board of Directors comprises a president and one to three members. The President and members of the company’s Board of Directors are appoint-ed by the Supervisory Board for a term of office of no more than six years with the possibility of reappointment. The duration of a term of office is set out in each resolution on appointment. The President of the Board of Directors represents the company individually and without limitation, while members of the Board of Directors represent the company together with the President. In accordance with resolutions on appointment adopted by the Supervisory Board, the Board of Directors currently comprises two members:
• Anton Chernykh, President of the Board of Directors and Chief Executive Officer, and
• Igor Malevanov, Vice-President of the Board of Directors and Finance Director.
Both members of the Board of Directors were appointed to a five-year term of office by the Supervisory Board on 17 January 2014. In accordance with the provisions of the company’s statute and resolutions on appointment, the President of the Board of Directors represents the company independently, while the Vice-President represents the company together with the President.
Anton Chernykh, born in 1978, graduated from the Faculty of Law in Moscow and the Faculty of Economics in Tula. He lat-er completed his MBA at the IEDC – Bled School of Manage-ment. He began his career at Sberbank RF in the Russian region of Tula. He was Head of the Finance Department at the state-owned company for road construction, TulAvtodor from 1998. He joined the Russian Koks Group in 2004, first as Head of the Property Management Department at Tulachermet, and was then appointed Deputy Director-General at KMA Ruda in 2006. Since joining the SIJ Group in 2007, he has held various man-agement positions (Procurator at Acroni and Director of Project Management at Metal Ravne).
Igor Malevanov, born in 1976, graduated from the Faculty of Economics at Belarus University. During his postgraduate stud-ies, from 1997 to 2000, he worked at various Russian companies,
where he specialised in insurance and finance. In 2001, he joined the Russian Koks Group as Finance Director of Koks subsidiaries. In 2004, he became Head of Finance at IMH Holding, which man-ages Koks companies, Tulachermet and numerous other steel plants, coke plants and mines in Russia. In 2007, he joined the SIJ Group as the Executive Director of Finance, Economics and IT.
The President of the Board of Directors represents the SIJ Group in international associations, such as Eurofer, the World Steel Association and the International Stainless Steel Forum (ISSF), of which SIJ d.d. is a member on behalf of the Group. The mem-bers of the Board of Directors do not perform any independent activities outside the SIJ Group that could be deemed material given the Group’s position.
Executive management of the SIJ Group
Executive management comprises the following persons:
• Marjana Drolc Kaluža, Purchasing Director, • Dušica Radjenovič, MA, Sales Director, • Slavko Kanalec, Director of Technology, • Mitja Kolbe, Director of Operational Development
and Strategy, • Dr Denis Mancevič, Director of Corporate
Communications, and • Evgeny Zverev, Director of Legal Affairs, Mergers
and Acquisitions.

30 31
business report business report
< back to content
Business model of the SIJ Group
Our business model was developed with the aim of ensur-ing the sustainable development of the SIJ Group, through the implementation of the adopted strategy and the exploita-tion of the competitive advantages of its available resources: knowledge, the programme structure and assets.
Our long-term objective is to become the most successful and flexible European producer of steel and steel products in niche segments. We pursue that objective by improving production efficiency and profitability, and by increasing added value.
Our activities are aimed at increasing cost efficiency and im-proving the consumption of available resources. Operations according to an alloy price pass-through model facilitate the optimisation of operations, in terms of financial stability and profitability. The effectiveness and sustainability of the busi-ness model was confirmed again in 2015 when the prices of nickel and other alloys plummeted, driving the prices of raw materials lower.
The Group is constantly updating and expanding its produc-tion mix to include the most advanced products. We are aware that the most advanced products, tailored to the needs of our customers, could contribute significantly to increasing added value for customers and the Group. The flexibility of opera-tions is ensured through technological upgrades and invest-ments in new capacities. We are enhancing common manage-ment and governance, and centralising the performance of the most important business functions.
Operations according to an alloy price pass-through model facilitate the optimisation of operations, in terms of financial stability and profitability.
The flexibility of operations is ensured through continuous technological upgrades and invest-ments in new capacities.
Geographicaldiversificationof operations
Operationalcost-efficiency
Centralizedmanagement
and governance
Verticalintegrationof divisions
Leading Europeanmanufacturer
of quarto platesand tool steels
Effectivebusinesssystem
Developmentand ownershipof operations
Safe andhealthy
environment
Humancapital
Customerorientation
Innovative by nature
we are implementing the
Group’s strategy by increasing
add value and expanding
the range of new products.
Jožica Cankar2014 Employee of the YearTechnician, Elektrode
32 33
business report business report
< back to content
STRATEGIC GUIDELINESAND BUSINESS STRATEGy
STRATEGy OF THE SIJ GROUP
Strategic operating guidelines of the SIJ Group
The development strategy of the SIJ Group until 2020 envis-ages significant shifts in the production mix towards more ad-vanced products with higher added value, the consolidation of the Group and the centralisation of key business processes. The latter will facilitate the achievement of numerous syner-gistic effects in the Group’s operations and the optimisation of production and other functions. It will also have a significant impact on the profitability of operations. The upgrading of the existing vertical integration of the Group will be carried out in parallel, primarily through the development and expansion of our own service and sales network on key markets. Together with the production of increasingly more advanced types of steel and increased possibilities for the mechanical and heat processing of materials, this will facilitate the entry into new market segments with higher added value, including the seg-ment of finished steel products and comprehensive solutions.
Key strategic objectives
The Group’s key strategic objectives until 2020 are as follows:
• the optimisation of the production mix in favour of more advanced products with higher added value;
• entry to new markets, the maintaining of market sharesin key segments in Europe (e.g. stainless quarto plates and tool steel) and increased market shares in new niche segments (e.g. special quarto plates and steel with special requirements);
• upgrades to the research and development of new typesof steel and production technologies, and the setting of market trends in premium segments (the developmentof own steel brands);
• the expansion of the sales portfolio to include finished steel products with high added value;
• the consolidation of the Group and the centralisation of core business processes; and
• the long-term reduction of net financial debt and theoptimisation of the NFD/EBITDA ratio (to below 3.0).
Activities for achieving strategic objectives
Optimisation of the production mix and an increase in pro-duction capacities for the manufacture of high-tech steels with higher added value
The SIJ Group is considered a boutique provider of special steels on selected niche markets. The change to the produc-tion mix will be supported by investments in the following:
• VAR and VIM production technologies for new products (nickel alloys, welded plates, etc.); and
• an increase in capacities for energy efficiency and theenvironmentally friendly production of products with high added value – use of AOD and UHP technologies.
Entry to new markets, increase in market shares in per-spective niche segments, and maintaining leading market shares in key segments
• Entry to new markets (e.g. rapidly emerging markets)with a selected product portfolio will be supported primarily by entering into new partnerships and the opening of representative offices. An increase in market shares in new niche segments (e.g. special quarto plates and steel with special requirements) will be facilitated by direct cooperation with key end-customers and the acquisition of the associated certificates, by entering into new partnerships and through vertical integration.
• We will maintain our share of key market segments in Europe (e.g. stainless quarto plates and tool steel) through joint investments with selected customers, though in-vestments in the improved efficiency of production and through vertical integration, which will ensure the improved and more competitive supply of end-customers.
Research and development – new products, new technolo-gies and synergies will support our entry to new markets
Group companies (in particular Acroni, Metal Ravne and Noži Ravne) are known for being exceptionally innovative, as evi-denced by annual awards for the best innovations in the Slo-venian commercial sector.
• The SIJ Group continuously promotes development cooperation with research institutions, direct end-users and between Group companies themselves, through projects in the scope of the Innovative Metal Materials Competence Centre.
• Together with top experts, we develop new types of steel and innovative production processes by using assets and applying knowledge from within the Group to gain various advantages over the global competition.
• By modifying and improving materials, the Group strivesto set market trends in premium segments and to sell products under its own brands.
Direct cooperation with end-customers and expansion of the sales portfolio
• The Group will dedicate more attention to the development of direct contacts with customers, who will
account for an increasing proportion of end-users. • We will continue the development of our own service and
sales network and expand the portfolio to include finished steel products and comprehensive solutions with high added value that are based on our own brands of steel.
• In combination with even more flexible (leaner) manufac-turing by key production companies in the Group, we will fa-cilitate increased adaptability and support market activities.
• Activities are also aimed at making a quality step forward in the functioning of research and development depart-ments, including the search for potential synergies within the Group and the expansion of the activities of the afore-mentioned departments to project design and technical engineering.
Consolidation of the Group, centralisation of core business processes and the intensive development of competences at all levels
• Implementation of measures that will facilitate even more effective corporate governance and the centralised management of specific key business processes.
• We will improve the horizontal and vertical flow of information within the Group.
• We will upgrade activities that will facilitate more detailed insight into key aspects of employee motivation and satisfaction, with the aim of strengthening and developing the human resource policy.
• We are aware that successful, creative and highly competent employees are the key to every business success. We will therefore continue to develop employees’ key competences through education and training.
Long-term reduction of net financial debt and the increased profitability of operations
• The Group made significant changes to its loan portfolioin 2015 in favour of long-term, unsecured sources of financ-ing. We will continue to be active on the capital market.
• We are planning to continue optimising the NFD/EBITDA ratio (with a target value below 3.0), which will be supported in part by an increase in the profitabilityof operations.
• We have been striving since 2014 for the continuous optimisation of business processes, in terms of costs and production, by implementing pilot projects.
Strategic projects
The SIJ Group began to implement numerous strategic pro-jects in 2015 to support the achievement of key strategic ob-jectives until 2020.
• Expansion of representative offices and the service and sales network for the improved supply of customers on key markets and as support for entry to rapidly emerging markets. The following new representative offices were established in 2015: Ravne Knives (USA and the United Kingdom) and SIJ Steel (Shanghai) Co (in Asia).
• Expansion of the SIJ Group’s portfolio of finished products: a study was conducted in 2015 on the introduction of the production of longitudinally welded pipes and the purchase of the company Sistemska tehnika, which is well-known as a supplier of finished products (e.g. rolls and roll sleeves) from steel and aluminium. Metal Ravne completed an investment in a VOD device in 2015, which will have a positive impact on the optimisation of the Group’s production mix.
• Implementation of a common platform for CRM(customer relationship management). The project was launched in September 2015 and is expected to be completed by December 2016.
• Establishment of an overall architecture of brands and the branding of selected products of the Group: started in October 2015 with completion planned for June 2016.
• Development of a concept for a common approach for the SIJ Group at international trade fairs: participation at the Metec Düsseldorf, Metal Expo Moscow, Euromold Düsseldorf and Stainless Steel Maastricht trades fairs in 2015, and at an increasing number of trade fairs in future years.
Assessment of the achievement of strategic ob-jectives in 2015
Operating results in 2015 are a clear indication of the positive effects of the Group’s established strategy, which will be fur-ther upgraded. We once again maintained an above-average level of profitability in the steel industry in 2015 (e.g. EBITDA margin and EBITDA/tonne of sales), which confirms the appro-priateness of our strategy and its effective implementation, despite the significant negative effect of one-off events and
We began to implement numerous strategic projects in 2015 to support the achievement of key strategic objectives until 2020.
We expanded the service and sales network and the number of representative offices, expanded the range of finished products and implement-ed investments that have a positive impact on the optimisation of the Group’s production mix.

34 35
business report business report
< back to content
low raw material prices during the year. We assess that we made a major step forward in 2015 towards the achievement of all key strategic objectives.
Certain investments were completed in 2015 (e.g. the VOD device at Metal Ravne), which had an important impact on opportunities for the optimisation of the Group’s production mix. Major investments are still in progress (e.g. a line for the heat processing of special steels at Acroni) and are being im-plemented according to plan. Agreements have been signed for new investments that will result in additional opportunities to optimise the production mix (e.g. an AOD device at Acroni).
New representative offices were established on major mar-kets for finished products (in the USA and United Kingdom) and on rapidly emerging markets (in Asia) to support the Group’s activities on key markets and the entry to new mar-kets. By signing an agreement on the purchase participating interests in and the claims of Sistemska tehnika and Sistemska tehnika Armas, the Group is achieving its strategic objective to expand the sales portfolio to include finished steel products with high added value. The inclusion of Sistemska tehnika in the SIJ Group expands the product portfolio, brings numerous synergistic effects on both sides (e.g. the optimisation of pro-duction functions and cross-sales) and ensures the necessary capacities for mechanical and heat processing for all of the most advanced products.
The first joint sales conference of the SIJ Group was organised in 2015 and attended by more than 120 participants, with the aim of supporting the establishment of long-term relations with end-customers and the continued consolidation of the Group. The Innovative Metal Materials Competence Centre was established to bring together the development depart-ments of SIJ Group companies (Acroni, Metal Ravne, Elektrode and SIJ) and external institutions (the Faculty of Natural Sci-ences and Institute of Metals and Technologies) in selected research-applied projects. New development achievements were presented, such as clad plates and the production of high-carbon steel (X120Mn12) with a high manganese con-tent using a continuous casting process, for which the devel-opment team received first prize for medium-sized and large enterprises at the tenth Slovenian Innovation Forum and a gold medal for innovation, presented by the Chamber of Com-merce and Industry of Slovenia.
We were successful again in 2015 in securing sources of fi-nancing on the capital market, in March through the issue of short-term commercial paper in the amount of EUR 20 million, in July with the issue of five-year bonds in the total amount of EUR 51.2 million and in December with the issue of short-
term commercial paper in the amount of EUR 17.6 million. The Group is thus successfully pursuing its strategic objective to diversify sources of financing.
Strategic objectives for 2016
In 2016, we will continue down our established path to the achievement of key strategic objectives until 2020:
• to maintain our leading share of the stainless quarto plates segment of the EU market (Acroni) and to maintain our position as the third largest manufacturer of tool steels on the EU market (Metal Ravne);
• to maintain the competitive advantage of short delivery deadlines for production by order, and to maintain profitability through the optimisation of the production programme and the continued rationalisation of costs;
• to start-up a line for the heat processing of special steelsat Acroni;
• to launch an active marketing programme for clad platesat Acroni;
• to successfully integrate the companies Noži Ravne, Serpa and Sistemska tehnika into the single company Ravne Systems, which offers a wider range of finished steel products, components and solutions; and
• to increase the number of joint marketing and sales activities within the Group, with the support of keyproduct brands and common tools (CRM).
Our strategic objectives in 2016 will again be to maintain our leading share of the stainless quarto plates segment on the EU market and to maintain our position as the third largest manufacturer of tool steels on the EU market.
EXTERNAL BUSINESSENVIRONmENT
mACROECONOmIC ENVIRONmENT
The business environment was characterised by numerous geopolitical events in 2015, such as crisis in Greece, tensions between Russia and Ukraine and the crisis in the Middle East. The drop in crude oil prices had the most notable impact on operations, as did the instability of nickel prices in connection with the steel industry.
Global economic growth was lower than forecast in 2015, at 2.4%. Growth was down 0.2 percentage points relative to 2014. Lower growth was driven primarily by slowing growth in emerging countries, led by China, Russia, Brazil and South Africa. Average growth in emerging countries was 4.3%, down 0.6 percentage points on 2014.
Economic growth in developed countries was higher than in 2014. The USA recorded growth of 2.5%, an increase of 0.1 percentage points relative to 2014. Euro area economic growth was up 0.6 percentage points on the previous year to stand at 1.5%.
The weak euro relative to the US dollar had a positive effect on exports to the USA by European companies. Lower crude oil prices, and thus lower energy prices, spurred private con-sumption, but had a negative impact on investments and thus the use of steel in the petroleum industry.
STEEL INDUSTRy
The steel industry is the largest industrial sector in the world, immediately after oil and natural gas. The steel industry’s an-nual global turnover is estimated at USD 900 billion, while the aforementioned industry employees more than eight million people across the world.
Figures from the World Steel Association indicate that global steel consumption is continuously rising. Average global steel con-sumption per capita is 200 kg. Analyses indicate that global steel consumption will continue to rise in the future, but not enough to balance the significant surplus in steel production capacities, a problem the global steel industry has faced for some time.
The utilisation of global steel production capacities, which is lined to slowing economic growth, fell to 69.7% in 2015. Steel
production was down 3.7% relative to 2014. Low utilisation of steel production capacities in China was reflected in increased exports to external markets. This resulted in pressures on the prices of steel producers from developed countries.
Despite a surplus of steel production capacities and slower growth in demand for steel, investments continue in new steel projects, primarily towards specialisation, differentiation and technological innovations in the production and use of steel.
A significant surplus in production capacities at the global level and low utilisation of production capacities are not the only challenges faced by the global steel industry in 2015. Shocks on the raw materials markets and raw material prices also represented challenges. The aforementioned prices reached historical lows in 2015 and resulted in a drop in the base prices of steel products, which further hampered the operations of steel companies.
The price of nickel, as one of the key references for setting the prices of steel products, fluctuated at a historically low level. The prices of other strategic raw materials used in steel production, such as scrap steel, iron ore and other iron alloys, fluctuated similarly.
The combination of low economic growth and low global raw material prices also had a negative impact on steel produc-tion. In global terms, 2.8% less steel was produced than in 2014. Global steel production totalled 1,622.8 million tonnes in 2015. The largest drop was recorded in the USA, where steel production was down 10.5%. China, the world’s largest steel producer, recorded a decline of 2.3% in 2015. Within the EU, the SIJ Group’s main market, steel production was down 1.8%, primarily due to a drop in production in France (-7.2%), Italy (-7.1%) and the United Kingdom (-10.4%).
As a niche producer of steel products with higher added value for a known customer, the aforementioned market conditions were felt to some extent by the SIJ Group, in the form of price pressures. We were nevertheless able to maintain maximum utilisation of our production capacities and the high level of profitability of operations on account of our focus on the most advanced users, who are less sensitive to market fluctuations, and the adaptation and optimisation of the production-sales mix.
The drop in crude oil prices and the instabilityof nickel prices had a significant impact onoperations.
The utilisation of global steel productioncapacities, which is linked to slowingeconomic growth, fell to 69.7% in 2015.

36 37
business report business report
< back to content
Growth in industrial sectors in the EU (in %)
Key data on operations
% of total
consumption 2015 Q1 2016 Q2 2016 Q3 2016 Q4 2016 2016 2017
Construction 35 1.8 0.2 3.0 3.4 2.3 2.3 2.5
Mechanical engineering 14 -0.4 1.2 0.8 1.5 1.7 1.3 2.6
Automotive industry 18 7.8 3.9 4.2 2.4 2.4 3.2 2.9
Household appliances 3 3.7 1.7 3.0 2.7 2.4 2.4 2.2
Other vehicles 2 5.4 1.0 1.6 1.1 -3.7 -0.1 2.5
Tubes 13 -5.6 -1.1 2.6 4.6 3.0 2.1 2.9
Metal goods 14 1.8 1.4 2.2 1.9 1.4 1.7 2.4
Other 2 1.4 1.1 2.2 1.5 1.3 1.5 1.8
TOTAL 100 2.0 1.3 2.7 2.6 2.0 2.2 2.6
The main drivers of demand for steel in the EU in 2015 were the automotive and construction industries, while the manu-facture of machinery and equipment was at nearly the same level recorded in 2014. The effect of decreasing investments
in the petroleum industry was felt most by the tube manufac-turing sector, which was the only steel-consuming sector to record negative growth relative to 2014.
FORECASTS AND EXPECTATIONS
A 0.7% increase in global steel demand is expected in 2016. Growth of 1.8% is forecast for developed countries, while 3.8% growth is forecast for emerging countries. Negative growth of 3.5% is forecast for China. Forecast growth in global demand in 2016, excluding China, is 2.9%.
Within the EU, moderate growth is forecast for all steel-consuming sectors. Growth in steel consumption of 2.2% is expected based on positive forecasts in steel-consuming in-dustries. Given our product range, we expect that renewed moderate growth in the manufacture of machinery and tubes will have a positive impact on demand for steel in 2016.
The drop in prices of key raw materials and the excess supply of steelmakers further increased pressure on selling prices.
We maintained the high level of profitability of operations, despite the demanding market conditions. At 9.6%, the EBITDA margin of the SIJ Group has been maintained at a high level.
Sources: World Steel Association, Euofer, Specialty Steels, World Bank
* Investments in Perutnina Ptuj and Holding PMP are excluded.
ANALySIS OFOPERATIONS
Quantitative data 2011 2012 2013 2014 2015*
Cast steel production t 488,440 494,123 468,761 466,835 442,127
Financial data
Revenues in € thousand 764,978 732,550 658,653 707,858 664,817
Exports % 85.3 85.4 86.3 86.2 87.3
Operating profit in € thousand 32,165 6,694 2,163 39,543 23,341
EBIT margin % 4.2 0.9 0.3 5.6 3.5
EBITDA in € thousand 64,194 41,320 40,786 77,832 63,509
EBITDA margin % 8.4 5.6 6.2 11 9.6
Profit or loss before taxation in € thousand 21,531 -2,100 -9,723 26,686 8,973
Profit or loss for the period in € thousand 17,128 739 -4,923 24,904 10,793
Cash flow from operating activities in € thousand 79,852 61,952 51,319 82,798 61,305
Investments in € thousand 56,570 57,072 47,282 49,374 69,498
Capex in € thousand 49,132 67,129 52,357 47,633 56,886
Employees
Average number of employees 3,321 3,247 3,120 3,064 3,043
We were able to maintain maximum utilisation of our production capacities and the high level of profitability of operations due to our focuson the most advanced users and the activeadaptation and optimisation of theproduction-sales mix.
The most important market segments for the SIJ Group are stainless quarto plates and the tool steel bar programme, which are not subject to the effect of imports from third coun-tries and price pressures to the same extent as steel for mass consumption. The production of stainless quarto plates was up 2.7% relative to 2014 in the EU, while imports from thirds countries were down 6.5% during the same period. The tool steel bar segment of the EU market recorded growth of 1.1%, in the context of a simultaneous 13.5% increase in imports from third countries.

38 39
business report business report
< back to content
SALES
In the context of uncertain global market conditions and ex-cess supply in mass-consumer products segments, the SIJ Group continued to implement its strategy for the period until 2020, which focuses on the production of the most ad-vanced types of steel and the expansion of the sales network to markets outside of Europe.
The proportion of exports was up 1 percentage point rela-tive to 2014, primarily on account of increased sales in the USA (where revenues were up 27%) and on certain European markets (France, Russia and Turkey).
Significant investments in the past facilitated a change in the product structure. The strategy to manufacture products with higher added value – stainless steel (Acroni) and special steels (Metal Ravne) – has proven to be correct, as the Group is less sensitive to market fluctuations. Niche markets ensure more stable demand, higher selling prices and higher added value.
Proportion of revenues by market (in %)
Proportion of sales by type of steel at Acroni Proportion of sales by type of steel at Metal Ravne
Cast steel production and output of finished products (in thousands of tonnes) in the SIJ Group
600
500
400
300
200
100
0
v mio EUR
2014
364
467
2015
325
442
2011
377
488
2013
469
356
2012
494
391
Output of finished steel products Cast steel production
We are planning an increase in the output of finished products by 19% in 2016.
Sales in the USA were up by 27% in 2015.
Focusing on the production of products with higher added value makes the SIJ Group less sensitive to market fluctuations.
Based on investments to increase capacities and in the pro-duction of technologically advanced types of steel, an incre-ase in the output of finished products of 19% or 63 thousand tonnes is planned for 2016.
12.7%Slovenia
87.3%Exports
27.6%
23.6%
21.7%
9.3%
5.1%
Rest of Europe
Germany
Italy
USA
Rest of the world
45%37%31%29%
10%
14%
16%
17%
9%
29% 30% 27% 28%
17%28%
33%
2015
2014
2013
2012
2011 27%
9%
31%
33%
Stainless steel
Special steel
Structural steel
Electrical steel
2015
2014
2013
2012
2011
21%
49%
46%
42%
44%
43%
27%26%28%29%30%
25%28%
32%
30%
Basic alloysteel
Standard toolsteel
Special steel
mANUFACTURING
The manufacture of cast steel was down 5% in 2015 relative to the previous year at the SIJ Group level. The reasons for the drop in production lie primarily in market conditions (reduced scope of production of structural and electrical steels – Acro-ni), the introduction of a new information system (Acroni), machinery breakdowns (Acroni and Metal Ravne) and pro-duction stoppages due to investments and the introduction of new production equipment. The continuing optimisation of the production programme (from programmes with low added value to programmes with high added value) also had a negative effect on production quantities.
In addition to market conditions, one-off events, such as major production stoppages due to technical malfunctions and the introduction of new machinery in the manufacturing process, also affected results.

40 41
business report business report
< back to content
Labour costs and revenues per average number of employ-ees for the SIJ Group (in EUR)
EBITDA bridge chart for the SIJ Group from 2014 to 2015 (in million EUR)
Operating results of the SIJ Group
Performance indicators 2011 2012 2013 2014 2015
Revenues in € thousand 764,978 732,550 658,653 707,858 664,817
EBITDA in € thousand 64,194 41,320 40,786 77,832 63,509
EBITDA margin % 8.4 5.6 6.2 11.0 9.6
EBITDA per employee € 19,330 12,726 13,072 25,402 20,871
Profit or loss for the period in € thousand 17,128 739 -4,923 24,904 10,793
Cash flow from operating activities in € thousand 79,852 61,952 51,319 82,798 61,305
Despite a reduction in the number of employees, labour costs are rising primarily due to annual wage adjustments, promo-tions and the improving educational structure of employees.
A 6.5% increase in the number of employees or 205 new hires are planned for 2016 (excluding employees at merged com-panies). The reasons for the aforementioned increase lie pri-marily in new investments and the strengthening of strategic functions at individual companies.
The EBITDA margin fell below 10%, but remains 2.6 percent-age points above the sector average. EBITDA per employee ex-ceeded EUR 20,000 for the second consecutive year, while the level of cash flow from operating activities indicates the high liquidity of the Group. Net profit is further reduced by amorti-sation and depreciation costs, which were up EUR 1.9 million on the previous year to stand at EUR 40.1 million.
OPERATING RESULTS
Operating results in 2015 were down slightly on the results recorded the previous year due to the previously mentioned reasons. We were nevertheless able to increase to the propor-tion of exports by 1.1 percentage points to 87.3% on account of the strategic focus on new markets. 235.000
230.000
225.000
220.000
215.000
210.000
205.000
200.000
Revenues Labour Costs
32.000
31.500
31.000
30.500
30.000
29.500
29.000
28.500
28.000
27.500
27.000
20152011 2012 2013 2014
Labour costs per averagenumber of employees
Revenues per average number ofemployees
The proportion of exports continues to rise and reached 87.3% in 2015.
The EBITDA margin remains 2.6 percentage points above the industry peer’s average.
The amount of cash flow indicates the high liquidity of the SIJ Group.
The positive price effect and the effect of the sales structure more than offset the negative effect of lower sales volumes on EBITDA. Also contributing to the lower EBITDA were higher fixed costs (primarily labour costs), as well as one-off events,
the introduction of a new information system, a reduction in the value of inventories due to falling prices of raw materials, machinery breakdowns and the testing and installation of new equipment.
v EUR
Sales mix
10.0
EBITDAwith
effect ofthe SteelDivision
72.0
EBITDAin 2014
77.8
Nega ve effect
Effect ofthe Distri-bu on andProcessing
Division
-3.0
Posi ve effect
Effect offixed costs
-8.1
Othereffects of
opera ons
1.6
Effect ofvariable
costs
-0.7
80
70
60
50
40
30
20
10
0
Effect ofthe ScrapDivision
-0.5
Headquar-ters andOther
Servicesand othereffects of
consolida on
-3.9
EBITDAin 2015
63.5
Effect ofthe Manu-facturingDivision
-1.0
Priceeffect
6.9
Volumeeffect
-15.6
Effect of the Steel Division
Structure of operating expenses of the SIJ Group (in %)
100%
90%
80%
70%
60%
50%
40%
30%
20%
10%
0%
v mio EUR
2014
80.0
2015
78.2
2011
82.1
2013
79.9
2012
81.5
0.9 1.00.8 0.90.9
5.7 6.24.3 5.84.8
13.4 14.612.8 13.412.8
Costs of goods, materials and services
Other costsLabour costs
Amor�sa�on and deprecia�on
OPERATING EXPENSES
The structure of operating expenses, the majority of which are accounted for by the costs of goods, materials and ser-vices, has not changed significantly over the years. The costs of materials accounts for 74% of total costs of goods, materi-als and services, while the remaining 26% is accounted for by the historical costs of goods sold, and the costs of energy and services. Scrap steel accounts for 59% of the total costs of materials for both steel companies, while nickel and other key raw materials account for 14%.

42 43
business report business report
< back to content
SIJ Group: Coverage of assets by liabilities as at 31 December 2015 (in million EUR)
SIJ Group: Working capital from operations as at the last day of the year (in million EUR)
SIJ Group: Data from the statement of financial position wORKING CAPITAL
A great deal of attention is given to the management of work-ing capital, as it brings favourable financial effects. Working capital was down EUR 23.4 million or 18% on the last day of 2015 relative to 2014. Working capital as a proportion of revenues was down 2.3 percentage points in 2015 relative to 2014.
The SIJ Group’s working capital is monitored regularly, and measures are implemented to reduce the balance thereof. The Group was very successful in terms of trade receivables, as we succeeded in reducing receivables by EUR 23 million (primarily at Acroni and Metal Ravne), while trade payables were up by EUR 11.1 million. The balance of inventories rose to EUR 10.7 million in 2015, an increase of 6.7% relative to 2014, primarily as the result of the replacement of the infor-mation systems at Acroni and Metal Ravne.
Days working capital outstanding were reduced by nine days in 2015 relative to the previous year, primarily on account of an improvement in days receivables outstanding (of eight days), while problems in the implementation of the new in-formation led to an increase of 13 days in days in inventory and days trade payables outstanding. The consequences of the introduction of the new information system, such as the increase in the value of inventories at the end of the year, are deemed a one-off event. We therefore expect the balance of inventories to drop back to the pre-2015 level in the future.
in € thousandStatement of financial position as at 31 December 2011 2012 2013 2014 2015 *
Total assets 761,932 763,574 775,779 789,261 863,695
Equity 331,297 328,004 323,585 348,135 348,718
Non-current and current liabilities 430,635 435,570 452,194 441,125 514,977
Net financial debt as at 31 December
Current financial receivables 9,800 6,318 16,847 58 3,188
Cash and cash equivalents 24,845 26,922 24,910 38,993 44,587
Non-current financial liabilities 106,190 142,161 159,003 183,382 221,198
Current financial liabilities 139,033 112,102 113,939 73,441 98,231
Net financial debt 210,585 221,024 231,185 217,772 227,334
NFD/EBITDA 3.3 5.4 5.7 2.8 3.6
* Investments in Perutnina Ptuj and Holding PMP are excluded.
Non-current assets totalled EUR 478 million, an increase of nearly 8% relative to 2014.
The most significant item within non-current assets is prop-erty, plant and equipment, which totalled EUR 424 million, an increase of 7% due to investments.
The structure of the statement of financial position remains sta-ble and appropriate, as all non-current assets and 58% of working capital are covered by non-current liabilities. Short-term sourc-es are used to finance seasonal fluctuations in working capital.
Non-current assets increased by 8%.
Days working capital outstanding fell by nine days relative to 2014 in 2015.
Currentliabili�es (net)
Non-currentliabili�es
Non-currentassets
Workingcapital
Equity
Other assets and liabili�es
523
349
237
51107
7
250
180
110
40
(30)
(100)
(170)
v mio EUR
2014
-155.3
2015
-166.4
2011
-146.8
2013
-151.7
2012
-152.2
160.6 171.3161.5 155.8155.2
124.9 101.9138.2 123.0131.7
Trade receivables Working capitalInventories Trade payables
SIJ Group: Days working capital from operations outstanding as at the last day of the year
Days in inventory
Days trade payablesoutstanding
Days trade receivablesoutstanding
Days working capitaloutstanding
84
66
74
93 89
88
66
67
100
98
68
71
100
97
64
68
113
110
56
59
20152014201320122011
FINANCIAL POSITION
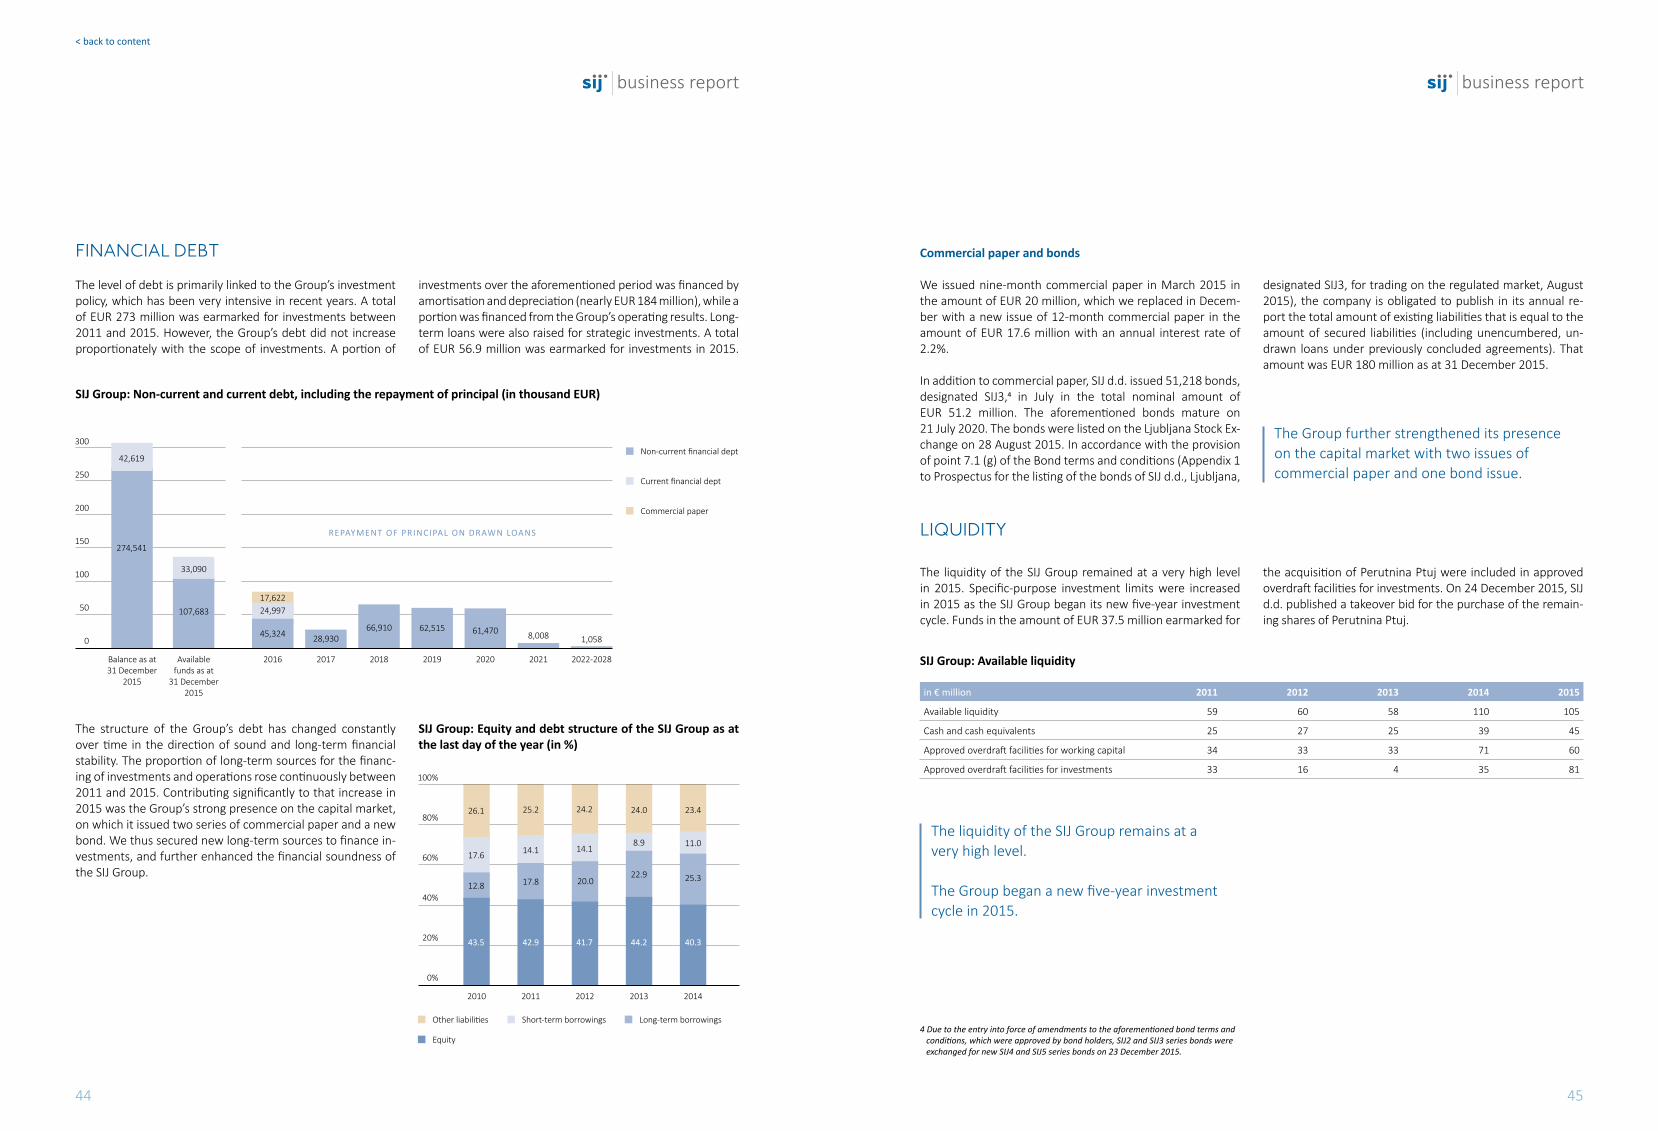
44 45
business report business report
< back to content
FINANCIAL DEBT
The level of debt is primarily linked to the Group’s investment policy, which has been very intensive in recent years. A total of EUR 273 million was earmarked for investments between 2011 and 2015. However, the Group’s debt did not increase proportionately with the scope of investments. A portion of
investments over the aforementioned period was financed by amortisation and depreciation (nearly EUR 184 million), while a portion was financed from the Group’s operating results. Long-term loans were also raised for strategic investments. A total of EUR 56.9 million was earmarked for investments in 2015.
Commercial paper and bonds
We issued nine-month commercial paper in March 2015 in the amount of EUR 20 million, which we replaced in Decem-ber with a new issue of 12-month commercial paper in the amount of EUR 17.6 million with an annual interest rate of 2.2%.
In addition to commercial paper, SIJ d.d. issued 51,218 bonds,designated SIJ3,4 in July in the total nominal amount of EUR 51.2 million. The aforementioned bonds mature on21 July 2020. The bonds were listed on the Ljubljana Stock Ex-change on 28 August 2015. In accordance with the provision of point 7.1 (g) of the Bond terms and conditions (Appendix 1 to Prospectus for the listing of the bonds of SIJ d.d., Ljubljana,
designated SIJ3, for trading on the regulated market, August 2015), the company is obligated to publish in its annual re-port the total amount of existing liabilities that is equal to the amount of secured liabilities (including unencumbered, un-drawn loans under previously concluded agreements). That amount was EUR 180 million as at 31 December 2015.
The structure of the Group’s debt has changed constantly over time in the direction of sound and long-term financial stability. The proportion of long-term sources for the financ-ing of investments and operations rose continuously between 2011 and 2015. Contributing significantly to that increase in 2015 was the Group’s strong presence on the capital market, on which it issued two series of commercial paper and a new bond. We thus secured new long-term sources to finance in-vestments, and further enhanced the financial soundness of the SIJ Group.
SIJ Group: Non-current and current debt, including the repayment of principal (in thousand EUR)
SIJ Group: Available liquidity
SIJ Group: Equity and debt structure of the SIJ Group as at the last day of the year (in %)
The Group further strengthened its presence on the capital market with two issues of commercial paper and one bond issue.
The liquidity of the SIJ Group remains at avery high level.
The Group began a new five-year investment cycle in 2015.
LIQUIDITy
The liquidity of the SIJ Group remained at a very high level in 2015. Specific-purpose investment limits were increased in 2015 as the SIJ Group began its new five-year investment cycle. Funds in the amount of EUR 37.5 million earmarked for
the acquisition of Perutnina Ptuj were included in approved overdraft facilities for investments. On 24 December 2015, SIJ d.d. published a takeover bid for the purchase of the remain-ing shares of Perutnina Ptuj.
in € million 2011 2012 2013 2014 2015
Available liquidity 59 60 58 110 105
Cash and cash equivalents 25 27 25 39 45
Approved overdraft facilities for working capital 34 33 33 71 60
Approved overdraft facilities for investments 33 16 4 35 81
4 Due to the entry into force of amendments to the aforementioned bond terms and conditions, which were approved by bond holders, SIJ2 and SIJ3 series bonds were exchanged for new SIJ4 and SIJ5 series bonds on 23 December 2015.
Current financial dept
Non-current financial dept300
250
200
150
100
50
0
2017 2018
66,910
2019 2020
61,470
2021
8,008
2022-2028
1,058
2016
45,324
17,62224,997
Availablefunds as at
31 December2015
107,683
33,090
Balance as at31 December
2015
42,619
274,541
REPAYMENT OF PRINCIPAL ON DRAWN LOANS
28,93062,515
Commercial paper
100%
80%
60%
40%
20%
0%
2014
40.3
2013
44.2
20122011
42.9 41.7
Other liabilities Short-term borrowings Long-term borrowings
Equity
2010
43.5
11.0
25.3
8.914.1 14.1
22.917.8 20.0
17.6
12.8
23.424.025.2 24.226.1

46 47
business report business report
< back to content
NET FINANCIAL DEBT
The SIJ Group and its management team use net financial debt, EBITDA and the NFD/EBITDA ratio as key indicators to assess the success of operations and the soundness of the Group’s financial position.
Excluding the investment in Perutnina Ptuj, net financial debt rose by just EUR 9.6 million or 4% relative to 2014 in the con-text of new investments in the amount of EUR 56.9 million. Similar to previous years, investment activity (new invest-ments in equipment) was the main driver of the SIJ Group’s net financial debt in 2015.
Investment activity was again the main driverof the SIJ Group’s net financial debt in 2015.
SIJ Group: Net financial debt (in million EUR)
SIJ Group: Coverage of investment by amortisation and depreciation (in million EUR)
A total of EUR 257 million was earmarked for the upgrading of production capacities in the period 2010 to 2014. This served as the basis for the start of the restructuring of the produc-tion and sales programmes. The Group began a new five-year investment cycle in 2015 that will facilitate the upgrading of the existing production and sales programmes, with the aim of increasing the production capacities of programmes with high added value, reducing energy consumption and short-ening delivery deadlines. The most significant investments in 2015 are presented in the section ‘Operations by division’.
OPERATIONS ByDIVISION
Negative effect
Cash and cashequivalents
Net financial dept
Capex
56.9
Positive effect300
250
200
150
100
50
0
NFD beforeinvestments
170.4
NFD of theSIJ Group
227.3
PerutninaPtuj
acquisitions
44.3
NFD as at31 December
2015
319.4
9.6(+4.0%)
47.8
271.7
NFD as at31 December
2014
256.8
39.1
217.8
Dividends
5.8
TOTAL DEBT
TOTAL DEBT
Change inworkingcapital
and otheradjustments
10.4
EBITDA
63.5
Coverage of investmentsby amortisation/depreciation
Coverage of investments by other sources
40
30
20
10
0
−10
−20
−30
−40
−50
−38.3
9.3
−40.2
16.7
−38.6
13.7
−32.0
17.1
−34.6
32.5
2014 201520132011 2012
SIJ Group: Key data on operations by division in 2015
SIJ Group: Proportion of revenues and EBITDA accounted for by individual divisions in 2015 (in %)
in € thousand Steel Division
Distribution andProcessing Division Scrap Division
ManufacturingDivision
Headquarters and Other Services*
Revenues 541,641 132,274 66,902 46,845 15,508
EBITDA 59,459 326 1,304 3,771 21,998
EBITDA margin 11.0% 0.2% 1.9% 8.1% 141.8%
Net financial debt 164,459 46,108 18,004 –6.444 114,412
NFD/EBITDA 2.8 141.5 13.8 –1.7 5.2
* EBITDA for Headquarters and Other Services includes EUR 20 million in dividends received from subsidiaries, which is eliminated during consolidation.
The vertical interaction of the Group facilitates the achieve-ment of synergistic effects in the purchase of strategic ma-terials, while the functioning and expansion of the sales net-work ensure the coverage of key markets with the Group’s products. In organisational terms, the Group places a great deal of emphasis on the rationalisation of operations and cost optimisation in all divisions.
In 2015, the Steel Division faced a continuing drop in purchase prices of strategic materials, in particular nickel, which had a significant impact on selling prices in the stainless programme. The trend of lower prices was also present in the purchase prices of alloys, ferrochrome, vanadium and molybdenum.
The structural proportions accounted for by individual divi-sion in 2015 were similar to 2014. The only major changes oc-
curred in the operating results of the Headquarters and Other Services Division.
The Steel Division still accounts for the highest proportion of revenues and EBITDA. Taking into account the highly unstable market conditions, the revenues generated by the aforemen-tioned division were down by EUR 37.8 million, resulting in lower EBITDA by nearly one tenth.
In 2015, the Steel Division faced a continuing drop in purchase prices of strategic materials,in particular nickel, which had a significantimpact on selling prices in the stainlessprogramme.
1.9%
67.5%
16.5%
8.3%
5.8%
Steel Division Distribution and Processing Division Scarp Division Manufacturing Division Headquarters and Other Services
25.3%
68.5%
0.4%
1.5%4.3%
Revenues EBITDA

48 49
business report business report
< back to content
STEEL DIVISION
Since 2008, the business strategy of the Steel Division has placed a great deal of emphasis on leading programmes with higher added value. The scope of production and sales of less profitable programmes is thus being reduced. Negative devia-tions in terms of volume were mitigated through an adapted programme structure, which is dominated by the most ad-vanced and more profitable steel programmes.
The Steel Division was especially successful in terms of mar-keting and the structure of sales, where a positive effect was achieved in the amount of EUR 16.9 million. A positive devia-tion in the amount of EUR 10 million was the result of the more advanced structure of steel products, while a positive effect of EUR 6.9 million derives from higher selling prices. Another negative deviation in the amount of EUR 15.6 mil-lion was the result of lower sales volumes. The negative effect of fixed costs amounted to EUR 8.1 million, primarily due to higher costs of labour and services linked to production. The deviation in variable costs resulted in a negative effect of EUR 0.7 million. The total negative effect on EBITDA of the Steel Division was EUR 5.9 million.
The effect of one-off events in the Steel Division reduced the Group’s EBITDA by EUR 5.6 million, primarily on account of machinery breakdowns, disruptions to the production pro-cess due to the start-up of new generators and problems dur-ing the implementation of a new information system.
Organisational chart of the Steel Division
Key operating figures
Major investments in 2015
Steel Division 2013 2014 2015
Revenues in € million 517.0 579.4 541.6
EBITDA in € million 34.5 65.3 59.5
EBITDA margin % 6.7 11.3 11.0
Profit or loss for the period in € million –4.5 21.1 15.3
Net financial debt in € million 193.5 171.3 164.5
NFD/EBITDA 5.6 2.6 2.8
Capex in € million 43.8 35.4 49.5
Average number of employees 2,121 2,074 2,050
Steel Division
Flatprogramme
Long (bar)programme
Acroni
Metal Ravne
One of the most demanding investments cycles in the Steel Division to date was in progress in 2015. We invested in technological upgrades and the more efficient production of steel at both steel companies, and in the environment and the information system.
The Steel Division was especially successful in terms of marketing and the structure of the sales programme, where a positive effect was achieved in the amount of EUR 16.9 million.
One of the most demanding investments cycles in the Steel Division to date was in progress in 2015. We invested in tech-nological upgrades and the more efficient production of steel at both steel companies, and in the environment and infor-
mation system. Investments in the Steel Division totalled EUR 49.5 million. Certain major investments are shown in the ta-ble below.
Company Investment Effect on operations Value inmillion EUR
Glossaryof technical terms
Acroni
Argon oxygen decarburization device Significant reduction in stainless steelproduction time, increased capacitiesand reduced energy consumption
0.9 (in 2015)(return on theentire investmentof EUR 32 millionwill be realisedover several years)
AOD device
Continuous line for the heatprocessing of plates
Increased capacities for the heatprocessing of plates
8.6
Installation of a pickling line in the linefor the acid-free cleaning of coils
A state-of-the-art techology supported by an ecological method for handling waste metarials; lower costs
4.9 SSAP
Metal Ravne
Ladle furnace and vacuum devicein the steel mill
Production of new types of steeland the elimination of bottlenecksin the steel mill
4.3 VOD
Upgrading of the electric arc furnacewith a quality control system (sampletaking and measurement of melttemperature)
Increased productivity and reducedspecific consumption of electricity,capture of waste heat for the heatingof sanitary water and work areas;lower costs
1.4 UHP
Information system Increased functioning speed andimproved responsiveness
0.8 ERP
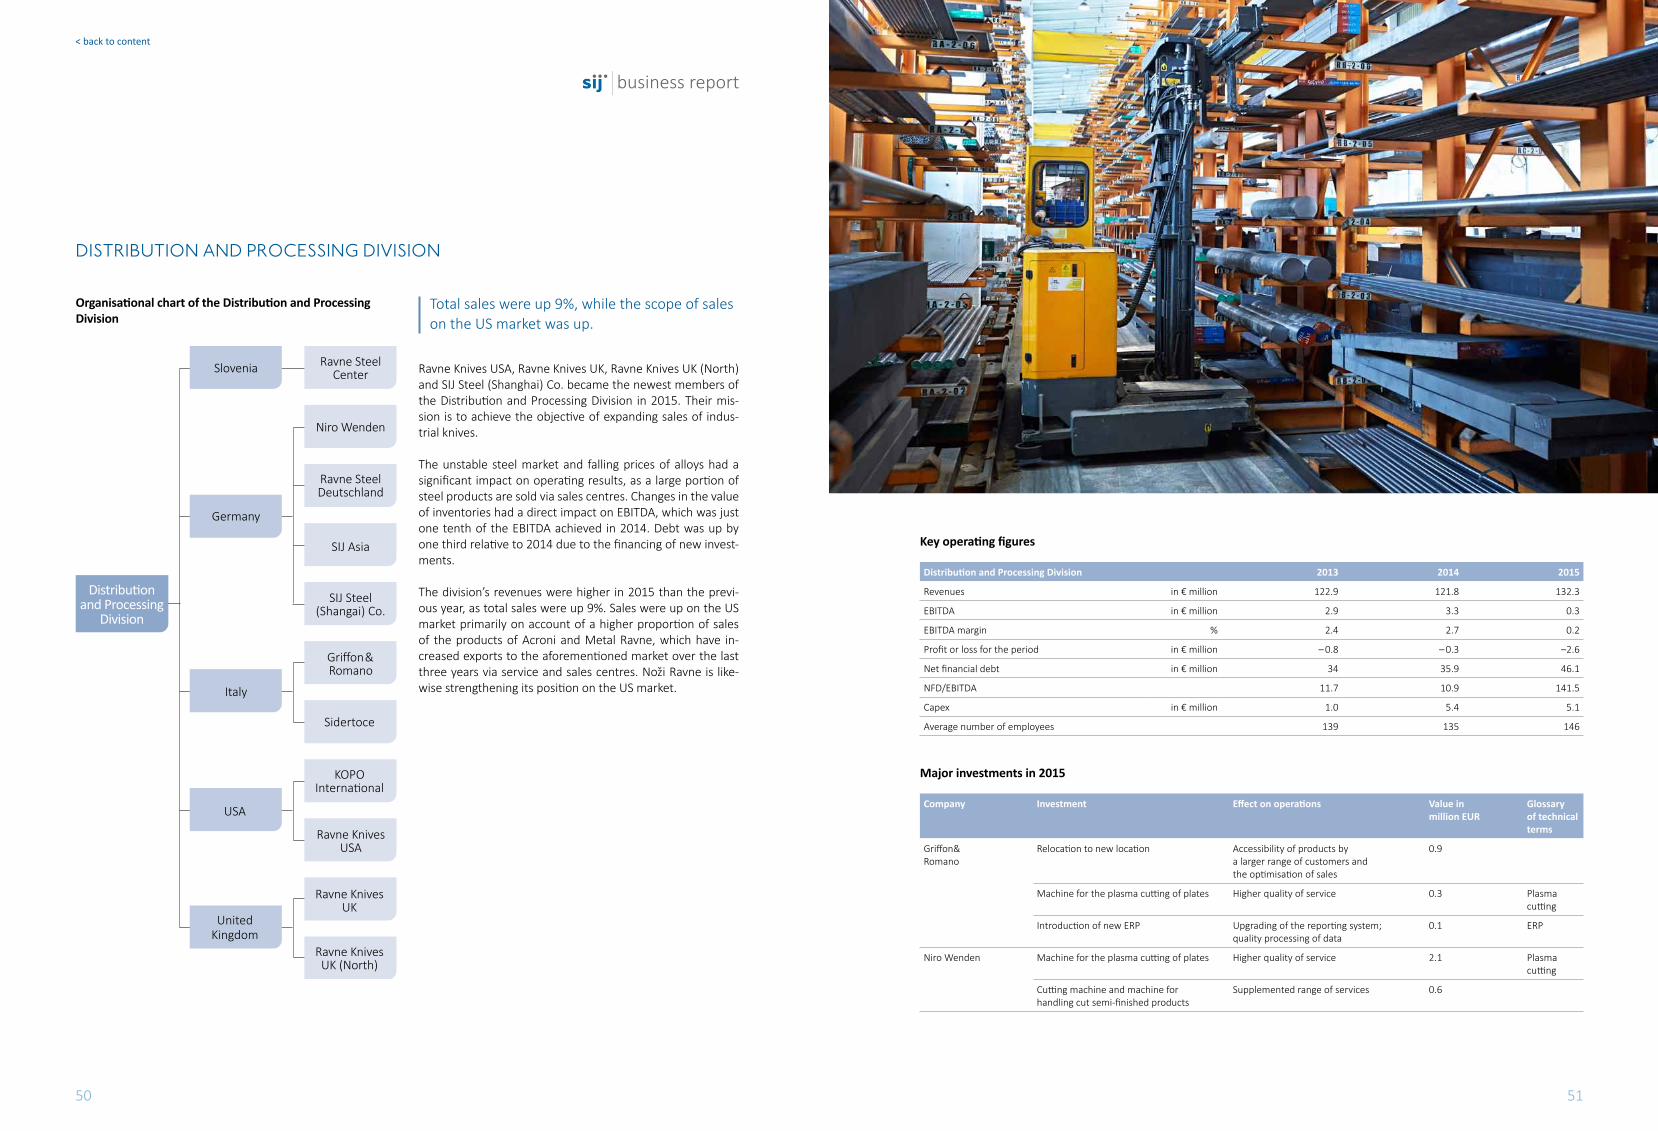
50 51
business report business report
< back to content
DISTRIBUTION AND PROCESSING DIVISION
Organisational chart of the Distribution and Processing Division
Ravne Knives USA, Ravne Knives UK, Ravne Knives UK (North) and SIJ Steel (Shanghai) Co. became the newest members of the Distribution and Processing Division in 2015. Their mis-sion is to achieve the objective of expanding sales of indus-trial knives.
The unstable steel market and falling prices of alloys had a significant impact on operating results, as a large portion of steel products are sold via sales centres. Changes in the value of inventories had a direct impact on EBITDA, which was just one tenth of the EBITDA achieved in 2014. Debt was up by one third relative to 2014 due to the financing of new invest-ments.
The division’s revenues were higher in 2015 than the previ-ous year, as total sales were up 9%. Sales were up on the US market primarily on account of a higher proportion of sales of the products of Acroni and Metal Ravne, which have in-creased exports to the aforementioned market over the last three years via service and sales centres. Noži Ravne is like-wise strengthening its position on the US market.
Key operating figures
Distribution and Processing Division 2013 2014 2015
Revenues in € million 122.9 121.8 132.3
EBITDA in € million 2.9 3.3 0.3
EBITDA margin % 2.4 2.7 0.2
Profit or loss for the period in € million – 0.8 – 0.3 –2.6
Net financial debt in € million 34 35.9 46.1
NFD/EBITDA 11.7 10.9 141.5
Capex in € million 1.0 5.4 5.1
Average number of employees 139 135 146
Total sales were up 9%, while the scope of sales on the US market was up.
Major investments in 2015
Company Investment Effect on operations Value inmillion EUR
Glossaryof technical terms
Griffon&Romano
Relocation to new location Accessibility of products bya larger range of customers andthe optimisation of sales
0.9
Machine for the plasma cutting of plates Higher quality of service 0.3 Plasmacutting
Introduction of new ERP Upgrading of the reporting system;quality processing of data
0.1 ERP
Niro Wenden
Machine for the plasma cutting of plates Higher quality of service 2.1 Plasmacutting
Cutting machine and machine forhandling cut semi-finished products
Supplemented range of services 0.6
UnitedKingdom
Distributionand Processing
Division
Italy
SIJ Asia
SIJ Steel(Shangai) Co.
Ravne SteelDeutschland
Niro Wenden
Ravne SteelCenter
Germany
Slovenia
Griffon&Romano
Sidertoce
KOPOInternational
Ravne KnivesUSA
Ravne KnivesUK
Ravne KnivesUK (North)
USA

52 53
business report business report
< back to content
SCRAP DIVISION
mANUFACTURING DIVISION
Organisational chart of the Scrap Division
Organisational chart of the Manufacturing Division
A drop in the purchase prices of scrap steel had the most sig-nificant impact on the division’s operations. In addition to the negative effect on both revenues and costs, purchasing was also more difficult due to lower market prices. The supply of scrap steel changed, in terms of volume and structure, in line with changes in market prices. There were fewer orders for ordinary scrap steel due to changing conditions in the Steel Division, in part due to changes in the programme structure. The fall in revenues and increase in costs of materials resulted in negative results.
Debt was up by 1.5 million euros relative to 2014, primarily with the aim of maintaining operational capacities and the level of working capital.
Good results were achieved in sales of industrial knives and bar steel, the latter primarily comprising products from car-bon steel. Sales of industrial knives were up 5% relative to 2014, in part due to an increase in the volume of sales on the US market and partly on account of the stronger US dollar. The trend of falling demand for welding materials continued at the global and European levels. Diminished orders for weld-ing materials, in particular welding electrodes, was reflected in a slight decline in the revenues of the company Elektrode. The difference in sales relative to 2014 was offset by other companies that operated in more stable market conditions.
There were no major investments in this division. Funds were earmarked for the maintenance of machinery and the transporta-tion fleet. Investments totalled EUR 297 thousand in 2015.
Key operating figures
Scrap Division 2013 2014 2015
Revenues in € million 84.4 84.4 66.9
EBITDA in € million 1.6 1.8 1.3
EBITDA margin % 1.9 2.2 1.9
Profit or loss for the period in € million 0.0 0.3 -0.2
Net financial debt in € million 15.8 16.4 18
NFD/EBITDA 9.8 8.9 13.8
Capex in € million 2.0 0.8 0.3
Average number of employees 88 90 89
A drop in the purchase prices of scrap steel, as the result of a global drop in prices on raw materials markets, had the most significant impact on the division’s operations.
We responded to price pressures with an aggressive sales policy, intensive advertising and frequent participation at trade fairs.
ScarpDivision
SerbiaMetal-Eko
Sistem
Dankor
Odpad PivkaSlovenia
Croatia
TOPMetalBosnia and
Herzegovina
ManufacturingDivision
Drawn wire SUZ
Elektrode
Noži RavneIndustrialknives
Weldingmaterials
SerpaMaintenanceand manufacture
of spare parts
Sales of industrial knives were up 5%, while good results were also achieved in sales of bar steel.

54 55
business report business report
< back to content
Major investments in 2015
Company Investment Effect on operations Value inmillion EUR
Glossaryof technical terms
Noži Ravne Cutting and grinding machine Replacement of worn equipment, new products and narrower tolerances
0.9 CNC
Renovation of business premises(insulation of commercial building)
Lower operating costs and improvedworking conditions
0.1
Elektrode Device for vacuum packagingof electrodes
Sales of new products andcompetitiveness on the market
0.1
Replacement of worn equipment used in the manufacture of electrodes
Quality and flow of themanufacturing process
0.2
Serpa New sheers for the plasma cuttingof plates
Possibility of cutting larger formatsand thicknesses of plates
0.2
SUZ Overhead crane and renovationof crane tracks
Repair of cracks and other damageto crane tracks and safety of operations
0.2
Key operating figures
Manufacturing Division 2013 2014 2015
Revenues in € million 47.7 47.8 46.8
EBITDA in € million 2.6 4.8 3.8
EBITDA margin % 5.4 10.1 8.1
Profit or loss for the period in € million 0.9 2.8 2.0
Net financial debt in € million – 2.1 – 5.4 – 6.4
NFD/EBITDA – 0.8 – 1.1 – 1.7
Capex in € million 2.2 1.6 2.5
Average number of employees 624 616 599
HEADQUARTERS AND OTHERSERVICES DIVISION
Organisational chart of the Headquarters and OtherServices Division
The only market-oriented company in this division is Zip center, a disabled workers company that is bound to meet certain legal conditions to maintain its status as such.
Key operating figures
Service companies 2013 2014 2015
Revenues in € million 11.5 12.4 15.5
EBITDA in € million 1.2 1.9 22.0
EBITDA margin % 10.7 14.9 141.8
Profit or loss for the period in € million 1.5 1.3 20.1
Net financial debt in € million 6.7 6.8 114.4
NFD/EBITDA 5.4 3.7 5.2
Capex in € million 2.4 5.0 0.7
Average number of employees 147 149 159
Headquartersand Other
Services DivisionReal estate
managementŽelezarnaJesenice
SIJ d.d.Management
and governanceservices
Carpentry, prin-ting, cleaning and
social services
ZIP center
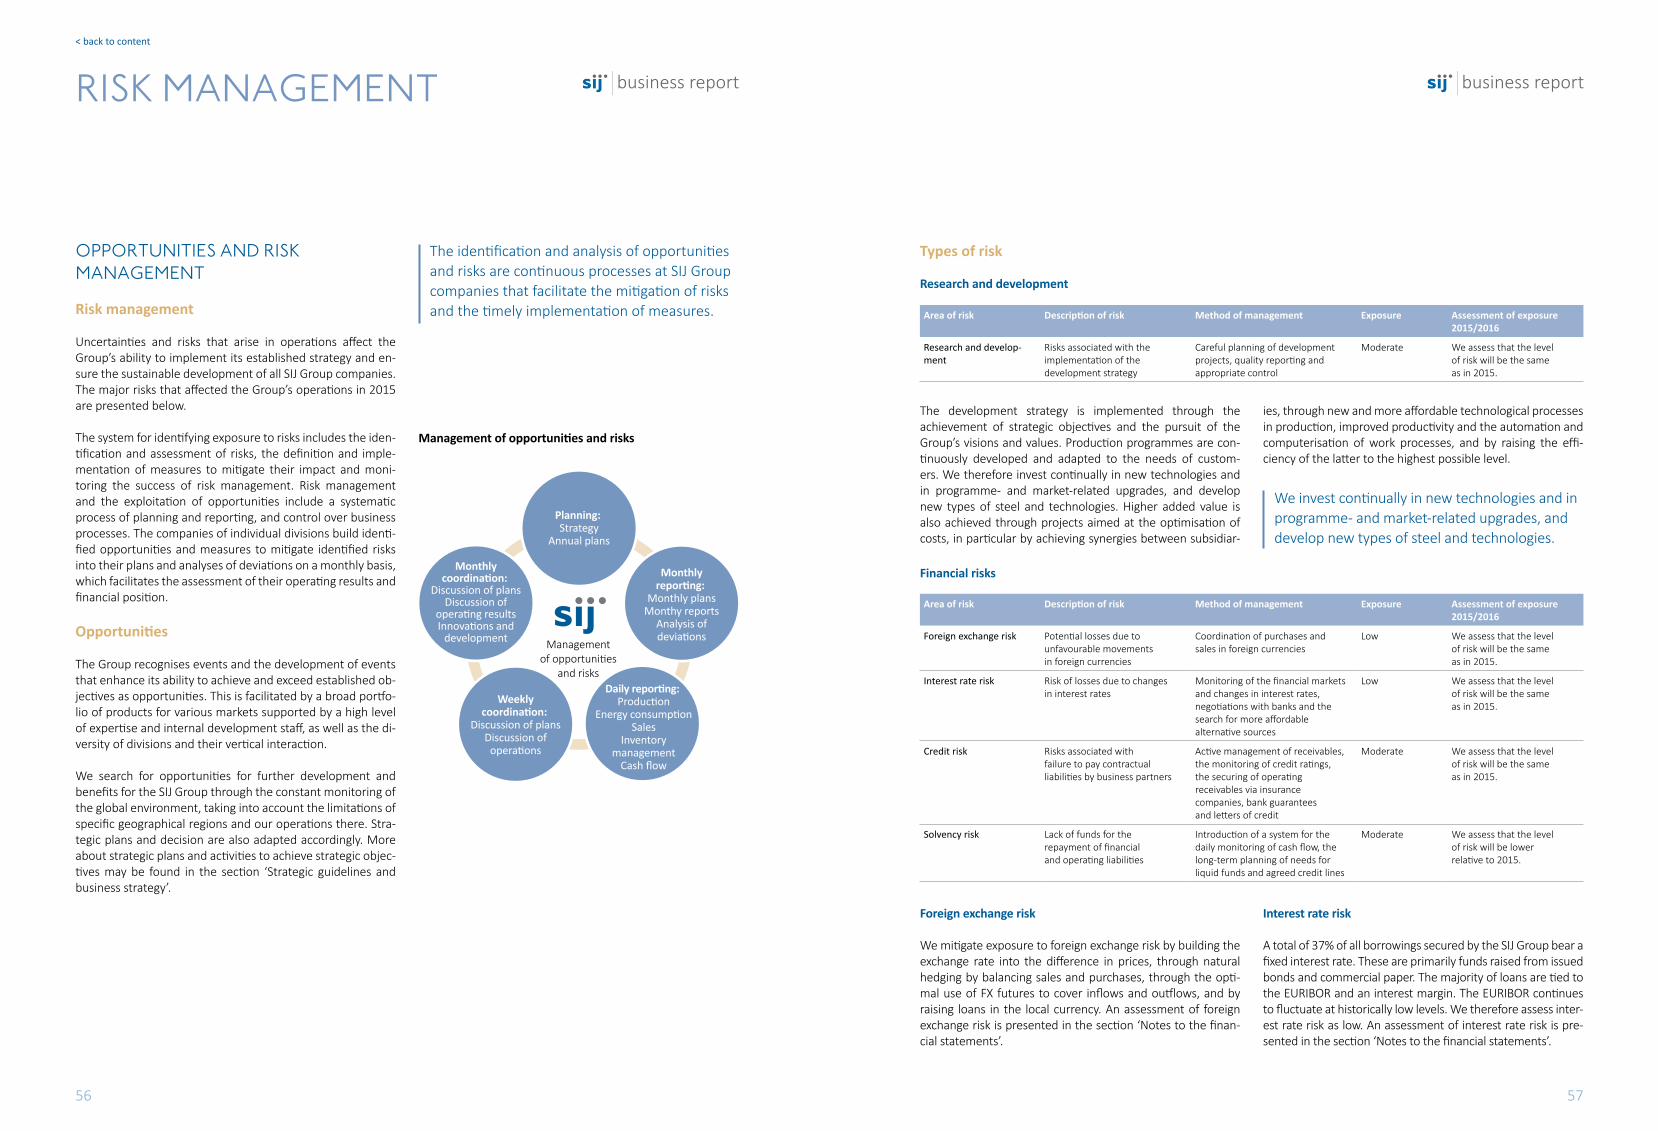
56 57
business report business report
< back to content
RISK mANAGEmENT
OPPORTUNITIES AND RISKmANAGEmENT
Risk management
Uncertainties and risks that arise in operations affect the Group’s ability to implement its established strategy and en-sure the sustainable development of all SIJ Group companies. The major risks that affected the Group’s operations in 2015 are presented below.
The system for identifying exposure to risks includes the iden-tification and assessment of risks, the definition and imple-mentation of measures to mitigate their impact and moni-toring the success of risk management. Risk management and the exploitation of opportunities include a systematic process of planning and reporting, and control over business processes. The companies of individual divisions build identi-fied opportunities and measures to mitigate identified risks into their plans and analyses of deviations on a monthly basis, which facilitates the assessment of their operating results and financial position.
Opportunities
The Group recognises events and the development of events that enhance its ability to achieve and exceed established ob-jectives as opportunities. This is facilitated by a broad portfo-lio of products for various markets supported by a high level of expertise and internal development staff, as well as the di-versity of divisions and their vertical interaction.
We search for opportunities for further development and benefits for the SIJ Group through the constant monitoring of the global environment, taking into account the limitations of specific geographical regions and our operations there. Stra-tegic plans and decision are also adapted accordingly. More about strategic plans and activities to achieve strategic objec-tives may be found in the section ‘Strategic guidelines and business strategy’.
Types of risk
Research and development
Financial risks
Management of opportunities and risks
The identification and analysis of opportunities and risks are continuous processes at SIJ Group companies that facilitate the mitigation of risks and the timely implementation of measures.
We invest continually in new technologies and in programme- and market-related upgrades, and develop new types of steel and technologies.
Planning: Strategy
Annual plans
Monthlycoordination:
Discussion of plansDiscussion of
operating resultsInnovations and
development
Monthlyreporting:
Monthly plansMonthy reports
Analysis ofdeviations
Daily reporting: Production
Energy consumptionSales
Inventorymanagement
Cash flow
Weeklycoordination:
Discussion of plansDiscussion of
operations
Managementof opportunities
and risks
Area of risk Description of risk Method of management Exposure Assessment of exposure 2015/2016
Research and develop-ment
Risks associated with theimplementation of thedevelopment strategy
Careful planning of development projects, quality reporting andappropriate control
Moderate We assess that the levelof risk will be the sameas in 2015.
Area of risk Description of risk Method of management Exposure Assessment of exposure 2015/2016
Foreign exchange risk Potential losses due tounfavourable movementsin foreign currencies
Coordination of purchases andsales in foreign currencies
Low We assess that the levelof risk will be the sameas in 2015.
Interest rate risk Risk of losses due to changesin interest rates
Monitoring of the financial markets and changes in interest rates,negotiations with banks and the search for more affordablealternative sources
Low We assess that the levelof risk will be the sameas in 2015.
Credit risk Risks associated withfailure to pay contractualliabilities by business partners
Active management of receivables, the monitoring of credit ratings,the securing of operatingreceivables via insurancecompanies, bank guaranteesand letters of credit
Moderate We assess that the levelof risk will be the sameas in 2015.
Solvency risk Lack of funds for therepayment of financialand operating liabilities
Introduction of a system for thedaily monitoring of cash flow, the long-term planning of needs for liquid funds and agreed credit lines
Moderate We assess that the levelof risk will be lower relative to 2015.
The development strategy is implemented through the achievement of strategic objectives and the pursuit of the Group’s visions and values. Production programmes are con-tinuously developed and adapted to the needs of custom-ers. We therefore invest continually in new technologies and in programme- and market-related upgrades, and develop new types of steel and technologies. Higher added value is also achieved through projects aimed at the optimisation of costs, in particular by achieving synergies between subsidiar-
ies, through new and more affordable technological processes in production, improved productivity and the automation and computerisation of work processes, and by raising the effi-ciency of the latter to the highest possible level.
Foreign exchange risk
We mitigate exposure to foreign exchange risk by building the exchange rate into the difference in prices, through natural hedging by balancing sales and purchases, through the opti-mal use of FX futures to cover inflows and outflows, and by raising loans in the local currency. An assessment of foreign exchange risk is presented in the section ‘Notes to the finan-cial statements’.
Interest rate risk
A total of 37% of all borrowings secured by the SIJ Group bear a fixed interest rate. These are primarily funds raised from issued bonds and commercial paper. The majority of loans are tied to the EURIBOR and an interest margin. The EURIBOR continues to fluctuate at historically low levels. We therefore assess inter-est rate risk as low. An assessment of interest rate risk is pre-sented in the section ‘Notes to the financial statements’.

58 59
business report business report
< back to content
Credit risk
Exposure to credit risk is managed taking into account custom-ers’ credit ratings, as issued by external credit assessment in-stitutions, through collateral instruments to secure payments and by securing receivables via insurance companies. Expo-sure to credit risk is mitigated through the daily monitoring of outstanding receivables, while the sales, finance and legal departments of all Group companies participate in collection activities. An assessment of credit risk is presented in the sec-tion ‘Notes to the financial statements’.
Solvency risk
Solvency risk is managed through the daily monitoring of cash flow, which is planned for several months in advance. We monitor and coordinate inflows and outflows on a daily basis, while we also use other instruments to hedge against risks as-sociated with short-term liquidity and long-term solvency: the diversification of sources, security deposits, short-term loans,
bridging loans, revolving loans and approved overdraft limits on accounts.
SIJ d.d.’s Finance Department coordinates activities with do-mestic and foreign banks to secure short-term and long-term sources of financing. We were very active on the domestic capital market in 2015, with the issue of commercial paper and bonds. An assessment of solvency risk is presented in the section ‘Notes to the financial statements’.
Supply chain risks
The time lag between the purchase of raw materials and the sale of products has a significant impact on price risk in the supply chain. The aforementioned risk is mitigated through the weekly coordination of production and purchasing plans, the daily monitoring of prices and the timely purchase of raw materials for fixed agreed sales projects. Sharp fluctuations in the prices of key raw materials (such as nickel in 2015) can lead to the risk of excessive or insufficient inventories, and the risk that changes to prices will not be passed through in full to the customer. Also of significance in terms of supply chain risks is the risk of the inadequate quality of purchased raw materi-als and other ancillary materials, which is explained in detail in risks associated with quality.
Sales risks
The Group is exposed to different sales risks of varying inten-sity due to its operations in different geopolitical and macroe-conomic conditions, and legal and competitive environments. Average growth of the steel market was down in 2015. Even rapidly emerging economies such as China and Brazil recorded lower growth. Past investments in technological upgrades of production processes have facilitated a shift in the production-sales structure towards products with higher added value and the satisfaction of the most demanding needs of customers in various market niches, and thus a sufficient number of or-ders despite the adverse market conditions. Lower growth in steel consumption has increased pressure to reduce selling prices (in part due to lower raw material prices), which we succeeded in avoiding by focusing on niche products for the most demanding users who are less sensitive to market fluc-tuations. For more details see the section ‘External business environment’.
Sales risks are also mitigated through continuous presence on specific markets, the expansion of the sales network, new agents and marketing activities to search for and attract new customers, and through the systematic monitoring of market developments and the activities of the competition. In order to maintain customer satisfaction, we systematically monitor the level of satisfaction of direct and indirect consumers, and ensure optimal inventory levels.
Investment risks
Investment risks are linked to the successful implementation of investments in the development of new products, the intro-duction of new technologies and the achievement of planned investment objectives. These risks are managed through a number of activities: preliminary market analyses, precise technical specifications agreed with contractors and/or sup-pliers, and through the precise planning and monitoring of the implementation of investments. In addition to the quality of works, we also monitor compliance with deadlines and the use of investment funds during project implementation. Due to the large number of strategic investments implemented, we continuously improve the quality of preparations for and implementation of investment projects. We also ensure the compliance of contractual documentation from the legal point of view, and verify the justification of potential changes and their impact on costs and associated schedules.
Risks associated with quality
Risks associated with the inadequate quality of products are managed through the technical control of input raw materials and other materials, and through output controls of products. Products are certified by the relevant organisations that cover such forms of quality control. We also carry out technical con-trols in interim phases of production. Assessments are used to regularly and systematically verify the functioning of the quality system in all work processes, while we also implement necessary improvements aimed at the constant upgrading of the quality system. By managing the aforementioned risks, we ensure the timely and high-quality supply of products and maintain long-term cooperation with customers.
We issued five-year bonds in the amount of EUR 51.2 million in July 2015, and thus secured long-term sources to finance investments in the Steel Division, and further enhanced the financial soundness of the SIJ Group.
Supply chain risks are mitigated through the weekly coordination of production and purchas-ing plans, the daily monitoring of prices and the timely purchase of raw materials.
Commercial risks
Area of risk Description of risk Method of management Exposure Assessment of exposure 2015/2016
Supply chain risks Purchase of high-qualityand affordable raw materials,and risks associated with untimely supply and changesin purchase prices
Careful supply chain planning, negotiations and the search for suitable suppliers, and long-term framework agreements with suppliers
Moderate We assess that thelevel of risk will bethe same as in 2015.
Sales risks Drop in the number oforders and loss of customers due to the adverse economic situation and the deteriorating purchasing power of business entities
Response to changing operating conditions, the search for new markets, adjustment of salesand marketing activities, and innovative market approaches
Moderate We assess that thelevel of risk will bethe same as in 2015.
Investment risks Risks associated with inappropriate decisionsregarding investments in production and other capacities
Careful planning of implementation, the systematic selection of contractors and continuous control over implementation
Moderate We assess that thelevel of risk will bethe same as in 2015.
Risks associated with quality assurance
Inadequate quality of input materials for the production process, inappropriate implementation of the development and production process, and inadequatequality of finished products
Upgrading of certified systemsand the tracking of changesrelating to the quality system,careful implementation of control activities in all development and production processes, additional protection with regard to the appropriate quality of products through product liability insurance
Moderate We assess that thelevel of risk will belower relative to 2015.

60 61
business report business report
< back to content
Other risks
Area of risk Description of risk Method of management Exposure Assessment of exposure 2015/2016
Environmental risks Risks associated with extraordinary events thathave a harmful effect onthe environment andthe risk of pollution as theresult of the Group’s activities
Preventive drills and internal procedures for extraordinaryevents and cooperation with external environmentalprotection institutions
Moderate We assess that thelevel of risk will bethe same as in 2015.
IT risks Risks associated withdisruptions due to IT faults
Regular maintenance, updatingand upgrading of the information system, and regular training ofIT staff
Moderate We assess that thelevel of risk will belower relative to 2015.
Risks associated with theintroduction of a newinformation system
Monitoring of the maintenance of the information system and methodological approach in the introduction of new solutions
Moderate We assess that thelevel of risk will belower relative to 2015.
Human resource risks Risks associated with the availability of managementand other professionallytrained staff
Systematic work with key staff, remuneration system, continuous education and training, testing of personal potential and drafting of development plans for key staff,motivation and the development of new education and training programmes for deficit professions
Moderate We assess that thelevel of risk will belower relative to 2015.
Legal risks Risks associated with changes to and theinterpretation of legislation
Monitoring of legislationand the drafting of measures
Moderate We assess that thelevel of risk will belower relative to 2015.
Risks associated with theconclusion of commercialagreements
Review of all agreementsconcluded with suppliersand customers
Moderate We assess that thelevel of risk will belower relative to 2015.
Risks associated withacquisitions of companies and the restructuring of operations
Active management of theportfolio of investments
Moderate We assess that thelevel of risk will belower relative to 2015.
Environmental risks
Our aim is to establish an environmental management system that covers the operations of the entire Group and that will be used to consistently implement the environmental protection policy in all divisions. Steel Division companies have already obtained the ISO 14001 system certificate.
Special attention is given to risks associated with energy con-sumption. Acroni is already operating in accordance with the EN16001 in the aforementioned area. Environmental risks are mitigated by taking into account impacts on the environment during the planning of investments, and through the transition to new, cleaner technologies and the introduction of closed circuits.
Environmental risks are mitigated by takinginto account impacts on the environmentduring the planning of investments, and through the transition to new, cleaner technologies and the introduction of closed circuits.
Risks associated with information technology and the secu-rity of internal operational processes.
The most frequent risks in the area of information technol-ogy are disruptions to the functioning of hardware, the local network, communication links and systems software, and risks associated with the introduction of a new business informa-tion system. These risks are managed through the following activities and established corrective systems:
• maintenance agreements with suppliers that ensure the functioning of the system, even in the event of the failure of vital elements;
• a security system that is designed to ensure the redundancyof the most important parts of the information system and communication channels;
• access to the worldwide web via two providers; and• the implementation of changes to information systems
according to prescribed and predefined processes.
Measures to manage risks associated with information tech-nology are an integral part of the daily monitoring of the func-tioning of information systems, and are implemented continu-ously. All of the aforementioned measures mitigate identified risks. We therefore assess those risks as moderate.
Human resource risks
Human resource risks are managed by planning needs for em-ployees with the appropriate skills and by promoting the contin-uous improvement of employees in various ways (e.g. by acquir-ing new knowledge and competences), through the sharing of knowledge among employees and team work, and by encourag-ing self-initiative, creativity and innovation. Key factors in ensur-ing employee satisfaction are the creation of good relationships between employees and an exemplary organisational structure. See the section ‘Sustainable development’ for more information.
Legal risks and risks associated with acquisitions
The Legal Department is responsible for ensuring the legal cer-tainty and legality of operations. The aforementioned depart-ment is involved in the planning of projects, the conclusion of agreements with suppliers and customers, the handling of recla-mations, the regulation of employment relations, the rights and obligations of employees, the establishment of and changes to the status of companies, the drafting of internal acts and compa-ny-level collective agreements, investment and financial projects, the handling of loss events, and representation of the interests of companies before government bodies and other holders of public authorisations. The Legal Department monitors legislative changes and case law, and participates in the harmonisation of processes, agreements, internal acts and other documents with new legislation. We therefore assess legal risks as moderate.

62 63
business report business report
< back to content
SUPPLy OF RAwmATERIALS
ENERGy SUPPLy
The centralised purchasing function follows a programme aimed at the exploitation of synergistic effects and the har-monisation of purchasing activities at all SIJ Group companies. The purchasing policy is based on the creation and develop-ment of long-term strategic relationships with key suppliers. Supplier management goes beyond the price aspect. Supplier selection criteria include other factors, such as the accuracy of deliveries, quality, responsiveness and, last but not least, com-pliance with safety, environmental and ethical criteria.
The key raw materials for metalworking companies are scrap steel, alloy scrap and ferroalloys, while raw materials for man-ufacturing companies include steel products and welding ma-terials.
Falling prices of key raw materials for the production of stain-less and tool steels were characteristic of 2015, and were the result of the cooling Chinese economy and excess supply. Due to sales based on a surcharge for alloys, falling raw material
prices were passed through to selling prices. One of the key activities of the purchasing function was thus coordination with the sales function. We only made deliveries for known orders and minimised raw material inventories.
The range of required raw materials is expanding in line with the expansion of the range of products, through which the Group is implementing its strategy. Together with the spe-cialist services of Group companies, we defined, tested and introduced new materials and suppliers in the regular produc-tion process in 2015. We continued with a project aimed at introducing alternatives for improved cost effectiveness, both in terms of materials and suppliers.
The main sources of energy used by the SIJ Group are electric-ity and natural gas.
Energy costs accounted for 8.5% of total operating expenses in 2015, a decrease of 0.2 percentage points on 2014. The largest consumers of energy within the Group were the two steel companies (Acroni and Metal Ravne) and manufactur-ing companies (Noži Ravne, Elektrode, SUZ and Serpa), which together consumed nearly 490 thousand MWh of electricity and more than 70 million m3 of natural gas in 2015. Consump-tion totalled 500 thousand MWh of electricity and nearly 71 million m3 of natural gas in 2014. In addition to numerous mi-nor measures for efficient energy consumption, we also im-plemented a project at the Metal Ravne site in 2015 aimed at the exploitation of waste heat for district heating purposes in Ravne na Koroškem (for more information see the section ‘Sustainable development’). The purchase of electricity and natural gas is centralised for the majority of SIJ Group companies. Natural gas prices con-tributed most to lower energy costs, as we reached an agree-ment with our supplier in 2014 on the setting of prices taking into account the exchange price. We carried out a careful and extensive process in 2015 for the selection of an electricity supplier, as the agreement with the existing supplier expired at the end of the year. We opted for the purchase of both natural gas and electricity based on the exchange prices of the aforementioned energy sources. Such a strategy for setting the purchase prices of energy products mitigates the risks as-sociated with standard purchases at a fixed price for a specific year. Thus the prices for both electricity and natural gas will be set in 2016 based on the exchange prices of a specific energy product. We are planning the introduction of centralised energy man-agement in 2016, as well as the performance of energy audits at the SIJ Group’s manufacturing companies. The introduction of centralised energy management with a single information system for that purpose will provide the Group a centralised and standardised method for the continuous monitoring of energy consumption and energy efficiency by specific techno-logical process at all manufacturing companies. Energy audits will provide a comprehensive set of potential organisational and investment-related measures that will further improve the energy situation at individual companies. We will continue to implement projects aimed at efficient energy consumption and the exploitation of waste heat, and will monitor changes in the exchange prices of both energy sources.
The range of required raw materials is expanding in line with the expansion of the range of products, through which the Groupis implementing its strategy.
Changes in prices of key raw materials for the manufacture of stainless and tool steels in 2015 (in EUR)
Energy costs accounted for 8.5% of totaloperating expenses in 2015, a decreaseof 0.2 percentage points on 2014.
The largest consumers of energy within the Group were the two steel companies andmanufacturing companies, which togetherconsumed nearly 490 thousand MWhof electricity and more than 70 million m3of natural gas in 2015.
Energy costs (in thousand EUR)
January February March April May June July August September October November December
Ni_LME - Nickel
FeMo - Molybdenum
FeV - Vanadium14,771
8,692 13.5213.26
23.4622.95
70,000
60,000
50,000
40,000
30,000
20,000
10,000
0
2015
55,312
2013
64,945
2014
58,440

64 65
business report business report
RESEARCH AND DEVELOPmENT INVESTmENTSThree research and development departments function with-in the SIJ Group:
• the Jesenice Development Centre, which includes thesegregated development activity of Acroni and which hasits own research team,
• the Metallurgic Research and Development Centreorganised at Metal Ravne, which likewise has its ownregistered research team, and
• the Development Department at Elektrode.
The aforementioned development centres employ 28 work-ers, while more than 70 technicians from the manufacturing function are indirectly included in the research and develop-ment process.
In addition to optimisation and the development of new prod-ucts, work also focuses on the elimination of technological barriers and a rapid response to the needs of the market and customers. Based on the development of new products and the optimisation of technological channels, we sold 23,900 tonnes of products and generated more than EUR 48 million in revenues in 2015.
In 2015, we began the introduction of new cutting-edge tech-nologies, such as the rolling of titanium alloy profiles, the rolling of ingots using a metallurgic dust process and the continuous casting of steels with a carbon content in excess of 1%. With
the start-up of the new VOD device at the Metal Ravne steel mill, we accelerated the development of the manufacture of stainless austenitic and duplex steels used in the energy sector.
We also invested a great deal of effort in the strengthening of cooperation between development departments within the SIJ Group, which we formalised in 2015 with the establish-ment of the Innovative Metal Materials Competence Centre, where the companies Acroni, Metal Ravne and Elektrode, and the Institute of Metals and Technologies and Faculty of Natural Sciences are gathered to form a consortium that was founded by SIJ d.d. The aim is to link the work of development depart-ments more closely with the Institute of Metals and Technolo-gies and the aforementioned faculty on specific projects. The following projects are currently in progress:
• catalysts for 3D printing,• the development of material for state-of-the-art tools,• the development of maraging steel and nickel alloys used
to improve the usefulness of existing products, and• super rollers that are more environmentally friendly,
as they do not require chrome-plating.
Based on the development of new products and the optimisation of technological channels, we sold 23,900 tonnes of products and generated more than EUR 48 million in revenues in 2015.
The Company earmarked EUR 57 million for investments in manufacturing companies in 2015. The most significant invest-ments were completed at Metal Ravne, where the refurbished ladle furnace and vacuum device (VOD) began operating in the steel mill in the middle of the year. This eliminated bottlenecks in production, while facilitating the manufacture of new types of steel. Following a regular semi-annual inspection, the elec-tric arc furnace was also refurbished. Additional burners were installed, as was a handling device to measure the tempera-ture and take samples of melt. The furnace cooling system was also upgraded, which facilitates the capture of waste heat that is now used to heat sanitary water and premises. In addition to the improved productivity of the electric arc furnace, we also achieved a significant reduction in the specific consumption of electricity, which was reduced by 70 kWh/t.
At the beginning of the year, we upgraded the continuous line for the heat processing of plates at Acroni. The afore-mentioned investment resulted in additional capacities in the manufacture of heat treated alloy plates. The project to implement a new information system was also completed during the same period, with the system achieving full func-tionality after a few months. The construction of a new line for the heat treating of plates was in full swing at Acroni in 2015. The project is expected to be completed in the mid-dle of 2016. The line will begin operating in the cold rolling hall and will replace the line for the pickling of stainless steel coils, which first required removal. The existing line for the
pickling of stainless steel coils was transformed into a line for non-acidic cleaning. We thus gained the necessary space for the new line, while resolving an environmental problem. The pickling line represented a burden on the environment due to the associated regeneration device.
The refurbished ladle furnace and vacuum device (VOD) began operating in the steel millin the middle of 2015. This eliminated bottlenecks in production, while facilitatingthe manufacture of new types of steel.
< back to content

66 67
business report business report
< back to content
A total of 320 SIJ Group employees had the status of disa-bled person at the end of 2015, seven more than the previous year. In 2015, a total of 25 persons received the status of disa-bled person for the first time. The proportion of disabled em-ployees was thus up 0.2 percentage points on 2014 to stand at 10.2% of the total number of employees.
Measurement of the organisational climate, commitment and satisfaction
The SIJ Group measured the organisational climate, satisfac-tion and commitment for the second time in 2015. The re-sponse rate for the entire SIJ Group was 74.6%, meaning that 2,160 persons completed the questionnaire sent to a total of 2,896 employees. The results of the measurement help us draw up various organisational measures and action plans that lead to improvements in the organisational climate.
Education and training
In accordance with the achievement of established objectives, we earmarked EUR 503.8 thousand for the education, training and development of employees in 2015, an increase of 17.5% relative to 2014. A total of EUR 349 thousand was earmarked for education and training, while EUR 72.8 thousand was ear-marked for work-study programmes. The SIJ Group earmarked EUR 75.9 thousand for 53 scholarship recipients in 2015. The Group gives scholarships primarily to high school and univer-sity students studying in the fields of metallurgy, mechanical engineering, mechatronics and electrical engineering.
We are aware that the leader of an organisation is the primary driver of change, and that their management style affects em-ployee development. We have therefore begun to develop the talents and competences of our management staff. We have created an SIJ management team programme that includes members of the core management teams of SIJ Group compa-nies, the heads of individual sectors and departments of Group companies and the heads of our companies’ production plants.
The SIJ Group generates a large portion of its revenues through sales and exports to foreign markets. We thus also organised the first sales academy for the Group’s managers with the aim of contributing to the development of their sales competences. Employee development is also linked to career planning and the promotion of successful individuals within the Group. We began the SIJ Group Young Prospects
Employee structure
The SIJ Group had a total of 3,126 employees at the end of 2015, meaning the number of employees was down by eight or 0.3% relative to the previous year. The introduction of more state-of-the-art technologies, minor improvements and the implementation of projects aimed at optimising work pro-cesses facilitate the increased flexibility of production and an optimal number of employees.
The average age of employees is 43.3 years. The average age was down 1.5 years relative to the previous year, an indica-tion of a shift towards a younger generation of employees. At 34.4%, those over the age of 50 accounted for the highest proportion of the overall employee population, which was similar to the previous year’s age structure. There was a sig-
nificant change in the category of those aged 40 to 49 years, where the number of employees is on the decline.
The SIJ Group hired 231 new employees in 2015, while the employment of 260 employees was terminated, 68 due to the expiration of fixed-term employment contracts, 25 due to redundancy and 44 due to retirement, while 61 persons resigned from their positions voluntarily. Employment was terminated in the remaining cases for various reasons. Em-ployee turnover at the SIJ Group was 1.83%, a decrease of 0.7 percentage points relative to the previous year.
SUSTAINABLEDEVELOPmENT
Social and environmental responsibility is integrated into all levels of the SIJ Group’s operations. We consistently com-ply will all environmental regulations in the manufacture of existing products and in the development of new products. Through development, we ensure the introduction of envi-ronmentally friendly technologies and efficient energy con-sumption. Sustainability is a strategic commitment, both for the Group and for the environment in which we operate. We are aware that a responsible and sustainable social approach also affects the SIJ Group’s reputation.
Our policy comprises more than a commitment; it is also the path by which we continuously set new objectives and mile-stones, and by which we closely monitor our achievements. The imprints of our operations are visible in the motivation and education of employees, the prevention of accidents, in the treatment of waste water and in efficient energy consumption. We are aware that further investments are required, despite all previously implemented measures, in particular in the reduction of emissions, if we wish to further improve our imprint.
RESPONSIBILITy TO EmPLOyEES
The knowledge, development, motivation, commitment, crea-tivity and innovativeness of our employees are crucial to achiev-ing positive results. Our key strategic objectives therefore include the intensive development of employees at all levels with the aim of ensuring that they perform their work in a quality manner and that they respond quickly to business and work challenges.
We provide equal opportunities to employees, regardless of gender and other circumstances, and build a partnership with the social environment in which we operate. We carefully se-lect new employees and comply with the legal regulations in all countries in which we operate.
Key data regarding employees for the period 2013 to 2015
2013 2014 2015
Number of employees as at 31 December 3,162 3,134 3,126
Average age (in years) 43.0 44.8 43.3
Proportion of employees on permanent contracts (%) 95.1 94.6 94.2
Proportion of female employees (%) 15.6 17.6 17.3
No. of disabled persons 312 313 320
Proportion of employees with at least secondary education (%) 25.4 24.8 24.9
Sick leave (%) 4.8 6.0 6.7
No. of injuries 202 166 153
The average employee age is declining.
The educational structure of employeesis improving.
The educational structure also changed in 2015 due to invest-ments in the modernisation of the production process, on account of employees with higher qualifications. This trend points to a reduction in the number of employees with pri-mary school and secondary school education. At 24.9%, the proportion of employees with technical and general second-
ary school education was at the level of the previous year. The proportion of employees with level I and II higher education has risen, while the proportion of employees who have com-pleted their master’s and doctorate degrees was the same as the previous year at 1.5%.
Educational structure of employees
31 December 2013 31 December 2014 31 December 2015
Master's degree and doctorate 40 46 46
Higher education – level II 195 210 236
Higher education – level I 308 317 336
Technical and general secondary school 804 778 778
Upper secondary vocational school 891 881 857
Secondary vocational school 368 365 366
Primary school 556 537 507
Total 3,162 3,134 3,126
31 December 2013 2014 2015
No. of employees 3,162 3,134 3,126
No. of disabled persons 312 313 320
Proportion of disabled persons (%) 9.9 10.0 10.2

68 69
business report business report
< back to content
Workplace accidents
The number of workplace accidents has fallen in recent years. The Group recorded a total of 153 workplace accidents in 2015 or 13 fewer than the previous year.
Safety and health
Occupational safety and health are priority areas within the Group. The total number of workplace accidents in the SIJ Group was down by 6% relative to 2014. The F2 frequency fac-tor (number of accidents per 106 of hours worked) rose rela-tive to the previous year, from 32.48 to 33.68 due to a decrease in the total number of employees. We nevertheless believe that the project to reduce the number of workplace accidents has been outlined correctly, and that we will achieve our estab-lished objective of a frequency factor of less than 1 by 2019.
ENVIRONmENTAL PROTECTION
The SIJ Group dedicates a great deal of attention to protect-ing the environment, as evidenced by its investments in the amount of EUR 13.16 million in the aforementioned area be-tween 2008 and 2015, with EUR 5.43 million of that amount invested in 2015. The manufacturing companies of the SIJ Group have acquired the requisite environmental permits, while the largest companies in the Group (Acroni and Metal Ravne) operate in accordance with the ISO 14001:2004 envi-ronmental standard. The disabled workers company Zip center also operates according to the aforementioned standard. The Group emitted 161,222 tonnes of CO2 into the atmosphere in 2015, which is 7,592 tonnes or 4.5% less than in 2014.
In terms of protecting water sources, the majority of cooling systems are closed-loop systems. The exception is the cooling water loop in the rolling mill at Metal Ravne, where we are planning to invest in a closed looped by 2019.
With regard to emissions into the atmosphere, Acroni and Metal Ravne are faced with the challenge of capturing dif-fused emissions of dust from steel mills, where we are con-stantly searching for and implementing appropriate solutions for capturing such emissions to the greatest extent possible. Increased emissions have thus not been identified at the aforementioned locations.
Waste management
The issue of waste management is addressed in an exem-plary manner within the SIJ Group, as the majority of what was once waste is now treated as by-products and sold as raw materials for other processes. If that is not possible, waste is forwarded for environmentally friendly processing.
Energy efficiency
In accordance with efforts aimed at efficient energy con-sumption, we implemented a project at Metal Ravne in 2015 with the objective of exploiting waste heat from the electric arc furnace. Waste heat will be used for the partial coverage of district heating needs in Ravne na Koroškem. The project received the grand prize for environmentally friendly service at the 2015 Environmental Conference.
There are a great many more potential sources for the exploi-tation of waste heat at both steel mill locations, in Ravne na Koroškem and Jesenice. We will therefore strive in the future to increase the proportion of exploited waste heat at Metal Ravne and satisfy the heating needs of Ravne na Koroškem in full. We will also study the possibility of exploiting waste heat at the site in Jesenice. Our vision is to contribute as much
programme in 2015. We are aware that young, talented indi-viduals have a great deal of potential for the development of their competences, are highly motivated and achieve a high level of success in their work. At the second strategic confer-ence held in Portorož in December 2015, the President of the Board of Directors awarded the title of young prospect to 33 perspective individuals from within the Group. The aim of the project is to give young ambitious individuals the opportu-nity to acquire the knowledge they need to unlock their own strengths and contribute to the development of the company while discovering their own potentials.
As a contemporary organisation, the SIJ Group has also intro-duced e-education and e-training programmes that make it easier to organise and implement education and training pro-grammes, as well as an assessment and overview of results. The most frequently viewed content in the scope of e-education and e-training programmes in the past year was occupational safety.
Remuneration and motivation
The SIJ Group is aware that an appropriate remuneration sys-tem leads to positive business results, increased productivity and employee satisfaction. This is the only way to retain the key personnel who contribute most to organisational devel-opment and the company’s success. The SIJ Group has im-plemented a remuneration system at various levels that com-prises the following elements:
• variable remuneration as recognition for work performed wellon the basis of measurable objectives throughout the year;
• performance-based remuneration paid to all employees at the end of the year, depending on the fulfilment of criteria relating to the operating results achieved by an individual
company during the past year; • promotion of the best employees; • recognition and awards for ‘Employee of the SIJ Group’;• loyalty bonuses and recognition for the most dedicated
employees; • free or subsidised use of sport facilities and cultural activities; • the possibility of using holiday facilities at various locations;• inclusion in supplementary pension insurance; and• organisation of various gatherings in cooperation with
trade unions.
Nine companies are included in the supplementary pension insurance scheme. Premiums totalling EUR 1.1 million were paid up in 2015, while the average number of employees in-cluded in the scheme was 2,104.
The guiding principle of ‘a healthy mind, healthy body’ is tak-en very seriously by the Group’s employees. The SIJ Group thus sponsored many employees who participated in the tra-ditional Ljubljana Marathon, some with their families. Gather-ings for employees are organised together with trade unions to mark Labour Day or in the form of the Group’s traditional employee event that includes families, with rich cultural and sporting programmes, which takes place every year at the end of July to commemorate metallurgy day.
Social dialogue
Social dialogue between trade unions, employees and em-ployers within the SIJ Group is fluid and successful. Three SIJ Group companies harmonised and adopted new company-level collective agreements in 2015. We organise meetings with employees several times a year, where they are present-ed the most important information regarding operations and briefed on developments within the SIJ Group.
Sick leave
Sick leave accounted for 6.7% of the total number of working hours in the SIJ Group in 2015, and increase of 0.7 percent-age points relative to the previous year, primarily as the result of long-term sick leave due to workplace accidents and long-term illnesses.
Paid and unpaid sick leave accounted for 50.4% and 49.6% of the total number of working hours respectively, while those proportions were 44.1% and 55.9% respectively in 2014.
Three SIJ Group companies harmonised and adopted new company-level collective agreements in 2015.
31 December 2013 2014 2015
No. of accidents 202 166 153
Number of workplace accidents in the period 2013 to 2015
The total number of workplace accidents in the SIJ Group was down by 6% relative to 2014.
The Group emitted 161,222 tonnes of CO2 into the atmosphere in 2015, which is 7,592 tonnes or 4.5% less than in 2014.

70 71
business report business report
< back to content
as possible to the reduction of greenhouse gas emissions through the exploitation of waste heat at both of the afore-mentioned locations, while providing the local community with a reliable and competitive supply of heat. We will thus demonstrate that even industrial and energy intensive eco-nomic environments can develop successfully in synch with the local community and effectively contribute to environ-mental protection. Our aim is to see both locations become places known for sustainable development, not only in eco-nomic terms but also environmentally speaking. This will set an example for the further development of other industrial intensive environments.
Through the cogeneration of heat and power (CHP), Acroni produced 3 GWh of electricity and 4.1 GWh of thermal en-ergy in 2015.
SOCIAL RESPONSIBILITy
Socially responsible conduct serves as the basis for the long-term sustainable development strategy of the SIJ Group. We are aware of the responsibility we bear as an economic entity that operates in Slovenia and abroad with more than 3,100 employees, and that has a highly extensive network of busi-ness partners and other stakeholders with whom we cooper-ate. In addition to the interests of the closer circle of stake-holders, such as shareholders and employees, our business decisions take into account the interest of the broader circle of stakeholders, primarily customers, suppliers and the local environments in which we operate. Our operations are based on ethical conduct, sustainable development and commit-ment to a healthy environment.
We demonstrate our social responsibility by supporting nu-merous projects and clubs, and through the operations of our own disabled workers company, Zip center (Ravne na Koroškem), which is fully integrated into the corporate govern-ance of the SIJ Group. The aforementioned company employs
fifty disabled persons and provides carpentry and printing ser-vices, and manufactures children’s developmental toys.
In April 2015, we donated EUR 50,000 to the Soča Univer-sity Rehabilitation Institute of the Republic of Slovenia (URI – Soča) for the purchase of a robotic device for the upper ex-tremities, which will help speed up the rehabilitation of one quarter of the children at the URI – Soča. We also signed a long-term cooperation agreement with the aforementioned reputable organisation.
SPONSORSHIP
We are aware of our special responsibilities to the local com-munities in which our manufacturing companies operate and in which the majority of our employees live. We therefore continuously update our system of sponsorships and dona-tions aimed at supporting various local humanitarian, cultural and sport organisations, clubs and events. We earmarked EUR 367,000 for donations and sponsorships in 2015.
We actively support grassroots sport programmes at the local level, which also include SIJ Group employees or their fami-lies, and which play an important role in sports activities for children and adolescents. These include numerous sports clubs in the municipalities of Ravne na Koroškem and Jesen-ice, and in many neighbouring municipalities.
The SIJ Group remains dedicated to top-flight sports in Slo-venia, where it sponsors the Slovenian Olympic Committee (SOC), supports the HDD SIJ Acroni Jesenice senior hockey club and sponsors the Slovenian National Biathlon Team.
We also actively supported numerous projects in 2015 aimed at raising awareness about metallurgy and the steel industry, and about development opportunities in the wider industry. We thus linked the steel industry, grassroots sports and the public sports infrastructure through a project to build out-door sports courses from our own steel. Two such courses were donated to the municipalities of Ravne na Koroškem and Prevalje. In November, we signed a framework agree-ment with the SOC on the continued promotion of such infra-structure in other Slovenian municipalities.
Our vision is to contribute as much as possible to the reduction of greenhouse gas emissions through the exploitation of waste heat in Ravne na Koroškem and Jesenice, while providing the local community with a reliable and competitive supply of heat.
We demonstrate our social responsibility by supporting numerous projects and clubs.
We signed a long-term cooperation agreement with the Soča University Rehabilitation Institute of the Republic of Slovenia for assistance in the purchase of devices to speed up the rehabilitation of children.
Enriched by diversity.
New Group companies facilitate
greater synergies and the
expansion of a complementary
range of products.
Dušan Kačič2013 Employee of the YearPolisher, Noži Ravne

72 73
business report business report
< back to content
COmPANIES OFTHE SIJ GROUP
Company Noži Ravne
Address Koroška cesta 14, Ravne na Koroškem, Slovenia
Director Peter Čas
Ownership 100% owned by SIJ d.d.
2013 2014 2015 Index 14/13 Index 15/14
Revenues in € thousand 368,700 419,287 380,470 114 91
Equity in € thousand 155,554 166,875 173,356 107 104
Average number of employees 1,160 1,127 1,077 97 96
2013 2014 2015 Index 14/13 Index 15/14
Revenues in € thousand 149,947 164,776 161,742 110 98
Equity in € thousand 82,912 92,144 93,472 111 101
Average number of employees 961 947 973 99 103
2013 2014 2015 Index 14/13 Index 15/14
Revenues in € thousand 18,115 18,333 19,212 101 105
Equity in € thousand 12,794 14,537 8,739 114 60
Average number of employees 195 193 194 99 101
Company Acroni
Address Cesta Borisa Kidriča 44, Jesenice, Slovenia
Director Blaž Jasnič
Ownership 100% owned by SIJ d.d.
Company Metal Ravne
Address Koroška cesta 14, Ravne na Koroškem, Slovenia
Director Andrej Gradišnik
Ownership 100% owned by SIJ d.d.

74 75
business report business report
< back to content
Company Odpad Pivka
Address Velika Pristava 23, Pivka, Slovenia
Director Andrej Dolenc
Ownership 74.9% owned by SIJ d.d.
Company Dankor Osijek
Address Vukovarska 436, Osijek, Croatia
Director Danko Ordanić
Ownership 51% owned by Odpad Pivka
Company Metal Eko-sistem
Address Kupusara BB, Jagodina, Serbia
Director Saša Milojević
Ownership 70% owned by Odpad Pivka
2013 2014 2015 Index 14/13 Index 15/14
Revenues in € thousand 78,325 71,612 56,372 91 79
Equity in € thousand 6,570 6,820 6,983 104 102
Average number of employees 28 24 25 86 105
2013 2014 2015 Index 14/13 Index 15/14
Revenues in € thousand 6,573 5,794 2,794 88 48
Equity in € thousand 642 585 292 91 50
Average number of employees 18 17 16 94 92
2013 2014 2015 Index 14/13 Index 15/14
Revenues in € thousand 12,822 18,073 12,601 141 70
Equity in € thousand 2,040 2,034 1,935 100 95
Average number of employees 35 39 38 111 98
2013 2014 2015 Index 14/13 Index 15/14
Revenues in € thousand 15,798 15,105 14,372 96 95
Equity in € thousand 5,317 5,740 5,494 108 96
Average number of employees 168 160 159 95 99
2013 2014 2015 Index 14/13 Index 15/14
Revenues in € thousand 7,196 8,048 7,539 112 94
Equity in € thousand 841 1,169 1,413 139 121
Average number of employees 116 115 111 99 96
2013 2014 2015 Index 14/13 Index 15/14
Revenues in € thousand 6,897 6,606 6,119 96 93
Equity in € thousand 4,264 4,537 2,198 106 48
Average number of employees 145 148 135 102 91
Company Elektrode
Address Cesta železarjev 8, Jesenice, Slovenia
Director Jakob Borštnar
Ownership 100% owned by SIJ d.d.
Company SUZ
Address Cesta Borisa Kidriča 44, Jesenice, Slovenia
Director Andrej Pogačnik
Ownership 100% owned by SIJ d.d.
Company Serpa
Address Koroška cesta 14, Ravne na Koroškem, Slovenia
Director Andrej Gradišnik
Ownership 89.72% owned by Metal Ravne

76 77
business report business report
< back to content
Company Griffon&Romano
Address Via Tacito 8/10, Corsico, Italy
Director Gregor Adler
Ownership 100% owned by SIJ d.d.
Company Sidertoce
Address Gravellona Toce, Italy
Director Robert Vuga
Ownership 100% owned by Ravne Steel Center
Company Niro Wenden
Address Glück-Auf-Weg 2, Wenden, Germany
Director Manfred Salg
Ownership 85% owned by SIJ d.d.
2013 2014 2015 Index 14/13 Index 15/14
Revenues in € thousand 12,572 12,187 12,547 97 103
Equity in € thousand 2,187 2,507 2,956 115 118
Average number of employees 23 23 24 100 105
2013 2014 2015 Index 14/13 Index 15/14
Revenues in € thousand 19,905 21,358 19,252 107 90
Equity in € thousand 3,726 3,314 1,224 89 37
Average number of employees 48 46 56 96 122
2013 2014 2015 Index 14/13 Index 15/14
Revenues in € thousand 32,240 18,854 15,275 58 81
Equity in € thousand 585 1,051 847 180 81
Average number of employees 42 36 31 86 86
Company TOPMetal
Address Karađorđeva 69, Laktaši, Bosnia and Herzegovina
Director Ranko Filipić
Ownership 51% owned by Odpad Pivka
Company Ravne Steel Center
Address Litostrojska cesta 60, Ljubljana, Slovenia
Director Boštjan Taljat
Ownership 77.3% owned by SIJ d.d. 22.7% owned by Metal Ravne
Company Ravne Steel Deutschland
Address Landsberg am Lech, Germany
Director Igor Rabin
Ownership 100% owned by Ravne Steel Center
2013 2014 2015 Index 14/13 Index 15/14
Revenues in € thousand 1,277 3,064 4,264 240 139
Equity in € thousand 1,059 947 872 89 92
Average number of employees 7 10 10 143 101
2013 2014 2015 Index 14/13 Index 15/14
Revenues in € thousand 20,589 22,109 22,065 107 100
Equity in € thousand 12,180 13,394 14,647 110 109
Average number of employees 24 27 26 113 98
2013 2014 2015 Index 14/13 Index 15/14
Revenues in € thousand 0 1,074 2,348 - 219
Equity in € thousand 50 99 – 107 197 -
Average number of employees 0 0 2 - 458

78 79
business report business report
< back to content
Company Zip center
Address Koroška cesta 14, Ravne na Koroškem, Slovenia
Director Alenka Stres
Ownership 100% owned by SIJ d.d.
Company Ravne Knives USA
Address 2711 Centerville Road, Suite 400, Wilmington Country of New Castle, Delaware 19808 USA
Director Viljem Pečnik, Peter Čas and Philippe C. M. Manteau
Ownership 100% owned by Noži Ravne
ravne knives
2013 2014 2015 Index 14/13 Index 15/14
Revenues in € thousand 0 0 37 - -
Equity in € thousand 0 0 –96 - -
Average number of employees 0 0 1 - -
Company SIJ Asia
Address Berger Str. 2, 40213 Düsseldorf, Germany
Director Jens Pollak
Ownership 100% owned by SIJ d.d.
asia
2013 2014 2015 Index 14/13 Index 15/14
Revenues in € thousand 0 0 865 - -
Equity in € thousand 0 0 189 - -
Average number of employees 0 0 2 - -
2013 2014 2015 Index 14/13 Index 15/14
Revenues in € thousand 2,765 2,674 2,731 97 102
Equity in € thousand 102 268 389 261 145
Average number of employees 101 98 95 97 97
Company Ravne Knives UK (North)
Address 12 Conqueror Court, Sittingbourne, Kent,ME10 5BN UK
Director Peter Čas
Ownership 100% owned by Noži Ravne
Company Ravne Knives UK
Address 12 Conqueror Court, Sittingbourne, Kent,ME10 5BN UK
Director Peter Čas
Ownership 100% owned by Noži Ravne
ravne knives
ravne knives
Company KOPO International
Address New Jersey, USA
Director Steven Cucich
Ownership 100% owned by Metal Ravne
2013 2014 2015 Index 14/13 Index 15/14
Revenues in € thousand 38,393 47,734 60,772 124 127
Equity in € thousand 1,182 1,660 1,763 140 106
Average number of employees 2 3 3 150 100
2013 2014 2015 Index 14/13 Index 15/14
Revenues in € thousand 0 0 717 - -
Equity in € thousand 0 0 – 102 - -
Average number of employees 0 0 1 - -
2013 2014 2015 Index 14/13 Index 15/14
Revenues in € thousand 0 0 53 - -
Equity in € thousand 0 0 6 - -
Average number of employees 0 0 0 - -
80 81
business report business report
< back to content
Company Skupina Perutnina Ptuj
Address Potrčeva cesta 10, Ptuj
President of the Board of Directors
Roman Glaser
Ownership 45.8% owned by SIJ d.d.
2013 2014 2015 Index 14/13 Index 15/14
Revenues in € thousand 267,659 256,938 247,119 96 96
Equity in € thousand 53,016 58,151 95,326 110 164
Average number of employees 3,637 3,459 3,423 95 99
Company Holding PMP
Address Vinarski trg 1, Ptuj
President of the Board of Directors
Bojan Pahor
Ownership 56.2% owned by SIJ d.d.
2013 2014 2015 Index 14/13 Index 15/14
Revenues in € thousand 2 1 2 84 107
Equity in € thousand 10 10 7 101 66
Average number of employees 3 3 3 100 100
Holding PmP
Company Železarna Jesenice
Address Cesta železarjev 8, Jesenice, Slovenia
Director Bojan Falež
Ownership 100% owned by SIJ d.d.
Company SIJ d.d.
Address Gerbičeva ulica 98, Ljubljana
President of the Board of Directors
Anton Chernykh
Ownership 73% owned by Dilon25% owned by the Republic of Slovenia
2013 2014 2015 Index 14/13 Index 15/14
Revenues in € thousand 3 1 1 38 100
Equity in € thousand 9,383 9,417 9,547 100 101
Average number of employees 1 1 1 100 100
2013 2014 2015 Index 14/13 Index 15/14
Revenues in € thousand 8,807 9,836 12,892 112 131
Equity in € thousand 180,441 181,228 191,403 100 106
Average number of employees 43 49 63 113 129

838382
Presentation of the investment in PP
Presentation of the investment in PP
PRESENTATION OFTHE INVESTmENT INPERUTNINA PTUJ
We think strategically.
we therefore opt for stable
investments in new areas.
Vinko MlakarHead of Raw Materialand Feed Control,Perutnina Ptuj
< back to content< back to content< back to content

< back to content
85
< back to content
8584
< back to content
Presentation of the investment in PP
Presentation of the investment in PPPRESENTATION OF
THE INVESTmENT INPERUTNINA PTUJ
Following July’s publication of its intent to participate in the recapitalisation of Perutnina Ptuj, SIJ d.d. acquired a 45.82% participating interest in Perutnina Ptuj and a 56.19% partici-pating interest in Holding PMP prior to the end of 2015, and published takeover bids for the remaining shares of Perutnina Ptuj in December, successfully completed at the end of Feb-ruary 2016. At the time the amount of recapitalisation was
paid up, the Board of Directors of SIJ d.d. announced the com-pany’s intent regarding the future governance of the afore-mentioned companies through the demerger (spin-off) of the investments from the SIJ Group, which will facilitate more ef-fective and transparent corporate governance of both sectors (e.g. the steel and food industries).
PP Group: Organisational and programme structures as at 31 December 2015
OPERATIONS OF THE PERUTNINA PTUJ GROUPPP Group: Key data on operations
2013 2014 2015
Revenues in € million 267.7 256.9 247.1
Exports % 12.9 14.1 15.7
EBITDA in € million 22.6 26.3 22.8
EBITDA margin % 8.4 10.2 9.2
Profit or loss for the period in € million -34.5 5.8 0.1
Net financial debt in € million 111.0 102.9 44.4
NFD/EBITDA 4.9 3.9 1.9
Capex in € million 10.5 5.8 8.7
Average number of employees 3,637 3,459 3,423
Despite considerable price pressures on the market, the PP Group was able to maintain a high level of revenues in 2015, in part due to higher sales on foreign markets as the result of the expansion of its sales network. Total revenues were 2.5%
lower than planned. However, the PP Group has increased its focus on exports. Sales on foreign markets were up by EUR 2.5 million, which is reflected accordingly in the increased proportion of revenues accounted for by exports.
The PP Group operates directly in seven countries: Slovenia, Croatia, Bosnia and Herzegovina, Serbia, Austria, Macedonia and Romania. In three of the countries listed above (Slovenia, Serbia and Bosnia and Herzegovina), the group is currently the leading producer of healthy, safe and high-quality poultry-based foods. On the markets of the aforementioned coun-
tries, the group carries out continuous and locally integrated breeding and the processing of poultry meat in systems based on quality, safety and traceability. Other important export markets include Switzerland, Austria, Romania, Macedonia and Germany, while the group has begun exporting products to Scandinavia and Arab countries.
PP Group: Revenue (in million EUR) and proportion of exports (in %)
Slaughterhouses
Processing
Agriculture
PP - Agro (SI)
Feed Production
Perutnina Ptuj (SI)
Živa proizvodnjaŽiva proizvodnjaLivestock Production
Perutnina Ptuj S (BA)
Perutnina Ptuj S (BA)
PP MI ZALOG (SI)
Perutnina Ptuj S (BA)
PP BRO ŽIVA, 60% (RS)
Slovenia
Rest of the world
Support Activities
Raw Materials
Perutnina Ptuj - PIPO(HR)
Perutnina Ptuj - PIPO(HR)
Perutnina Ptuj (SI)
Perutnina Ptuj - PIPO(HR)
Perutnina Ptuj (SI)
Perutnina Ptuj (SI)
Perutnina Austria (AT)
TOP-Veterina (RS)
Gradbeni remont (SI)
PP Nepremičnine (SI)
Other Activities
Ptujska klet (SI)
PP Gostinstvo (SI)
EKO Energija (SI)Perutnina Ptuj BH (BA)
Perutnina Ptuj - PIPO(HR)
Perutnina Ptuj- TOPIKO (RS)
Perutnina Ptuj- TOPIKO (RS)
Perutnina PtujDOOEL Skopje (MK)
Veterinarskaambulanta PP, 45% (SI)
S. C. PerutninaRomania (RO)
Perutnina Ptuj- TOPIKO (RS)
Perutnina Ptuj- TOPIKO (RS)
Livestock Production Meat Industry Sales Network Support Activitiesand Other Activities
The main reason for the slightly lower EBITDA lies in lower rev-enues, which were down relative to 2014 primarily on the mar-kets of Croatia, Bosnia and Herzegovina and Serbia. The group’s EBITDA margin remained at a high level (9.2%), despite the lower revenues, on account of increased operational efficiency.
The PP Group recorded extraordinary finance expenses in 2015 in the amount of EUR 1.6 million on account of a new strategic partner. The aforementioned expenses are not di-rectly linked to the group’s operations and are thus not ex-pected in the future. Without the aforementioned finance expenses, net operating results would have been down by just EUR 4.1 million relative to the net operating results recorded the previous year.
Companies at which several activities are performed in various production centres are presented in boxes with dotted lines.
300
250
200
150
100
50
0
18%
16%
14%
12%
10%
8%
6%
4%
2%
0%
20152013 2014
Revenues Proportion of exports
267.7
12.9%14.1%
256.9 247.1
15.7%
Sales on foreign markets were up by EUR 2.5 million, which is reflected accordingly in the increased proportion of revenues accountedfor by exports.
PRESENTATION OF THE PERUTNINA PTUJ GROUP (PP GROUP)
In addition to financial consolidation (with the signing of a framework agreement on financial restructuring), the PP Group also underwent ownership and organisational changes in 2015: on 30 October 2015, SIJ d.d. paid up EUR 40 million in new capital and thus became the 45.82% owner of Perutnina Ptuj. Directly following the aforementioned recapitalisation, the company published a takeover bid for the purchase of all shares of Holding PMP, followed by the same for the shares of Perutnina Ptuj. For the PP Group, the latter also meant an
opportunity to significantly reduce its financial debt, which was reflected in improved net financial debt and financial lev-erage indicators. At 1.9, the latter represents a sound basis for the continued growth and development of the entire Group.
In addition to the controlling company, the PP Group com-prises 18 other companies: The group’s principal activities are the breeding of chickens and turkeys, and the preparation of natural, healthy and high-quality foods from poultry meat.

< back to content
87
< back to content
8786
< back to content
Presentation of the investment in PP
Presentation of the investment in PP
PP Group: EBITDA (in million EUR) and EBITDA margin (in %)
PP Group: Net financial debt (in million EUR) and NFD/EBITDA
SIJ Group (together with the PP Group and Holding PMP for 2015): Revenue (in million EUR) and proportion of exports (in %)
PP Group: Equity and debt structure as at the last day of the year (in %)
The financial position of the PP Group stabilised in 2015 with the previously mentioned recapitalisation and the restructur-ing of its financial liabilities. The structure of the statement of financial position changed significantly in 2015, with an increase in equity and a reduction in short-term borrowings. The structure of other liabilities was the same as the previous year.
Net financial debt was reduced from EUR 102.9 million to EUR 44.4 million, primarily as the result of debt repayments deriv-ing from the recapitalisation in the amount of EUR 40 million. For this reason, financial leverage was down sharply, from 3.9 to 1.9, which is reflected in a stable financial basis for the PP Group’s continuing development and operations.
30
25
20
15
10
5
0
12%
10%
8%
6%
4%
2%
0%
2015
9.2%
2013 2014
EBITDA EBITDA margin
22.822.6
8.4%
10.2%
26.3
100%
80%
60%
40%
20%
0%
Other liabilities Short-term borrowings Long-term borrowings
Equity
2014
41.3
7.2
24.8
26.7
2013
26.3
38.9
8.2
26.6
2012
23.4
36.1
13.3
27.2
120
100
80
60
40
20
0
6
5
4
3
2
1
0
20152013 2014
NFD NFD/ EBITDA
44.4
1.9
3.9
102.9111.0
4.9
Total revenues were up by 29% in 2015, while the total pro-portion of revenues accounted for by exports fell to 81.1% (the proportion of exports at the PP Group was just 15.7% in 2015).
Capex was up by EUR 18.2 million in the joint financial state-ments for 2015.
SIJ Group (together with the PP Group and Holding PMP for 2015): Key data on operations
2013 2014 2015 *
Revenues in € thousand 658,653 707,858 913,148
Proportion of exports % 86.3 86.2 81.1
EBITDA in € thousand 40,786 77,832 85,063
EBITDA margin % 6.2 11.0 9.3
Profit or loss for the period in € thousand -4,923 24,904 10,997
Net financial debt in € thousand 231,185 217,772 321,788
NFD/EBITDA 5.7 2.8 3.8
Capex in € thousand 52,357 47,633 65,853**
Number of employees as at 31 December 3,162 3,134 6,643
* SIJ Group + PP Group + Holding PMP** Capex for 2015 in the amount of EUR 65.9 million does not include the investments in Perutnina Ptuj and Holding PMP in the amount of EUR 44.3 million.
* SIJ Group + PP Group + Holding PMP
1000
900
800
700
600
500
400
300
200
100
0
100%
90%
80%
70%
60%
50%
40%
30%
20%
10%
0%
2015*2013
86.3%
2014
86.2%
Revenues Proportion of exports
913,1
81.1%
658,7 707,9
The financial position of the PP Groupstabilised in 2015 with the previously mentioned recapitalisation and the restructuring of its financial liabilities.The structure of the statement of financial position changed significantly in 2015,with an increase in equity and a reductionin short-term borrowings.
Financial leverage was down sharply,from 3.9 to 1.9, which is reflected in a stable financial basis for the PP Group’s continuing development and operations.
The SIJ Group published its intent to participate in the recapi-talisation of Perutnina Ptuj at the end of July 2015, and paid up the agreed capital at the end of October 2015. The table below illustrates the major indicators for specific purposes, in which full-year results are taken into account for 2015. For a
more relevant comparison by year and an objective assess-ment of the effects of the merger, the presentation of results for 2015 assumes that the PP Group and Holding PMP were merged with the SIJ Group at the beginning of the aforemen-tioned year.
mAJOR INDICATORS FOR SPECIFIC PURPOSES OF THE SIJ GROUP, PERUTNINA PTUJ GROUP AND HOLDING PmP

< back to content
89
< back to content
8988
< back to content
Presentation of the investment in PP
Presentation of the investment in PP
Joint EBITDA was up 9% in 2015 relative to the EBITDA of the SIJ Group in 2014. The EBITDA of both groups was down slightly in 2015 on the previous year. The joint EBITDA margin neverthe-less remains high, at 9.3%.
The SIJ Group’s effective practices of centralised corporate gov-ernance will also be transferred to the PP Group in the future, from which we expect several positive synergistic effects at the operational and financial levels of the largest meat-processing group in Slovenia: the PP Group. These effects primarily include cost optimisation, the rationalisation of strategic and indirect purchasing, and more effective planning and controlling within business processes.
Joint net financial debt in 2015 was higher than the net finan-cial debt recorded by the SIJ Group in 2014 and 2015, mainly on account of the financing of the investment in Perutnina Ptuj. The NFD/EBITDA ratio was higher as a result, but significantly lower than the value of the aforementioned ratio recorded by the SIJ Group in 2013.
SIJ Group (together with the PP Group and Holding PMP for 2015): EBITDA (in million EUR) and EBITDA margin (in %)
SIJ Group (together with the PP Group and Holding PMP for 2015): Net financial debt (in million EUR) and NFD/EBITDA
90
80
70
60
50
40
30
20
10
0
12%
10%
8%
6%
4%
2%
0%
2015*2013
6.2%
2014
11.0%
EBITDA EBITDA margin
85,1
9.3%
40,8 77,8
* SIJ Group + PP Group + Holding PMP
* SIJ Group + PP Group + Holding PMP
SPECIAL PURPOSE FINANCIAL STATEmENTS OF SIJ GROUP, PERUTNINA PTUJ GROUP AND HOLDING PmP GROUP
350
300
250
200
150
100
50
0
6.8
5.8
4.8
3.8
2.8
1.8
0.8
2015*2013
5.7
2014
Net financial debt NFD/EBITDA
3.8
321.8231.2 217.8
2.8
The SIJ Group’s effective practices of centralised corporate governance will also be transferred to the PP Group in the future, from which we expect several positive synergistic effects at the operational and financial levels of the largest meat-processing group in Slovenia: the PP Group. These effects primarily include cost optimisation, the rationalisation of strategic and indirect purchasing, and more effective planning and controlling within business processes.

91
special purposefinancial statements
9190
special purposefinancial statements
< back to content< back to content< back to content

< back to content
93
< back to content
special purposefinancial statements
9392
special purposefinancial statements
< back to content
SPECIAL PURPOSEFINANCIAL STATEmENTS
Below is the special purpose financial statement, which takes into account SIJ's joint control over the Perutnina Ptuj Group and Holding PMP Group (hereinafter Group) in the financial year 2015.
The statement of financial position at 31 December 2014 represents the SIJ Group’s statement on 31 December 2014. The statement of comprehensive income for 2014 represents the SIJ Group's statement. The special purpose statement of comprehensive income for 2015 represents the consolidated statement of the SIJ Group, Perutnina Ptuj Group and Hold-ing PMP Group with the eliminated investments, equity and intercompany transactions.
The special purpose statements take into account the fact that SIJ d.d. gained the controlling influence over Perutnina Ptuj d. d. and Holding PMP d. o. o. on 1 January 2015. The rec-ognition includes the difference between the investment and net assets based on the carrying amount. The special purpose statements take into account the 51.35% share in Perutnina Ptuj d. d. and the 56.19% share in Holding PMP.
STATEmENT OF mANAGEmENT'S RESPONSIBILITy
The Board of Directors is responsible for drawing up special purpose financial statements for SIJ Group, Perutnina Ptuj Group and Holding PMP Group according to the International Financial Reporting Standards (IFRS) adopted by the Europe-an Union, so that they give a true and fair view of the Group's operation.
The Board of Directors legitimately expects the Group to have enough resources in the foreseeable future to enable it to continue its operations. The financial statements are there-fore based on the premise that the Group will continue its operations without a set time limit.
The responsibility of the Board of Directors in drawing up the financial statements includes the following:
• Properly selected and consistently applied accounting policies;• Reasonable and rational assessments and estimates;• Assurance that the combined financial statements have
been compiled in accordance with the IFRS adopted by the European Union. Any significant deviations are disclosed and explained in the report.
The Board of Directors is responsible for keeping correspond-ing records, which give a clear and accurate picture of the Group’s financial position at any given time, and for making sure that the financial statements of the Group are in ac-cordance with the IFRS, adopted by the European Union. The Board of Directors is also responsible for protecting the Group’s assets, as well as discovering and preventing abuses and other irregularities.
The Board Of Directors declares that the financial statements have been compiled in accordance with the IFRS adopted by the European Union, without reservations about their appli-cation.
The Board of Directors approved the financial statements,accounting policies and notes on 4 March 2016.
President of the Board of DirectorsAnton Chernykh
Member of the Board of DirectorsIgor Malevanov

< back to content
95
< back to content
special purposefinancial statements
9594
special purposefinancial statements
< back to content
SPECIAL PURPOSEFINANCIAL STATEmENTS
STATEmENT OF COmPREHENSIVE INCOmE
The notes to the financial statements are an integral part of the combined financial statements and should be read in conjunction with them.
in € thousand Note 2015 2014
Revenue 1 913,148 707,858
Cost of sales 2 (746,051) (584,971)
Gross profit 167,097 122,887
Distribution costs 2 (68,722) (40,155)
General and administrative expenses 2 (74,279) (50,168)
Other operating income 3 14,694 8,942
Other operating expenses 4 (4,571) (1,963)
Operating profit 34,219 39,543
Finance income 5 1,586 1,636
Finance expenses 6 (26,267) (15,093)
Net finance costs (24,681) (13,457)
Share of profit in associates 12 25 600
Profit before taxation 9,563 26,686
Income tax expense 7 (1,645) (988)
Deferred income tax 7 3,079 (794)
Profit for the year 10,997 24,904
Items that will not be reclassified subsequently to profit or loss
Income tax related to components of comprehensive income 1 (20)
Net actuarial losses on pension programs (532) 0
Items that may be reclassified subsequently to profit or loss
Change in fair value reserves for available-for-sale financial assets (62) 120
Exchange rate difference on translating foreign operations 425 68
Comprehensive income 10,829 25,072
Profit (loss), attributable to: 10,997 24,904
Owners of the parent company 11,325 24,858
Non-controlling interest (328) 46
Basic and diluted earnings per share (in EUR) 8 11.66 25.19
Comprehensive income, attributable to: 10,829 25,072
Owners of the parent company 11,275 25,089
Non-controlling interest (446) (17)
STATEmENT OF FINANCIAL POSITION
in € thousand Note 31 Dec. 2015 31 Dec. 2014
ASSETS
Non-current assets 619,418 445,283
Intangible assets 9 31,065 24,806
Property, plant and equipment 10 555,678 398,082
Investment property 11 4,238 207
Investments in associates 12 1,573 1,548
Available-for-sale financial assets 13 1,161 906
Financial receivables 458 103
Operating receivables 14 2,107 1,892
Other assets 15 2,932 2,043
Deferred tax assets 16 20,206 15,696
Current assets 438,500 343,978
Assets held for disposal 17 4,142 4,146
Inventories 18 208,872 160,634
Financial receivables 19 3,417 58
Operating receivables 20 144,560 138,430
Income tax assets 985 585
Cash and cash equivalents 21 73,971 38,993
Other assets 22 2,553 1,132
Total assets 1,057,918 789,261
EQUITY AND LIABILITIES
Equity 23 400,932 348,135
Equity attributed to owners of the parent company 347,758 343,549
Share capital 145,266 145,266
Capital surplus 11,461 11,461
Revenue reserves 129 (859)
Fair value reserves (189) 171
Translation differences 343 33
Retained earnings 190,748 187,477
Non-controlling interest 53,174 4,586
Non-current liabilities 305,330 197,327
Employee benefits 24 14,911 10,438
Other provisions 25 1,479 1,677
Deferred revenues 26 4,959 866
Financial liabilities 27 283,118 183,382
Operating liabilities 28 828 914
Deferred tax liabilities 16 35 50
Current liabilities 351,656 243,799
Financial liabilities 29 116,058 73,441
Operating liabilities 30 230,824 166,906
Income tax liabilities 807 598
Other liabilities 31 3,967 2,854
Total equity and liabilities 1,057,918 789,261
The notes to the financial statements are an integral part of the combined financial statements and should be read in conjunction with them.

< back to content
97
< back to content
special purposefinancial statements
9796
special purposefinancial statements
< back to content
The notes to the financial statements are an integral part of the combined financial statements and should be read in conjunction with them.
CASH FLOw STATEmENT
in € thousand Note 2015 2014
Cash flow from operating activites
Profit before taxation 9,563 26,686
Adjusted for:
Depreciation and amortisation 9, 10 50,844 38,289
Share of profit in associates 12 (25) (600)
Interest income 5 (529) (1,319)
Interest expenses 6 16,910 12,092
Exchange rate differences, net 4 (13)
Loss in investment sales 1 1
Impairment of assets 19 1,473 583
Creation of allowances and provisions 2,451 481
Other adjustments 3,658 631
Operating cash flows before changes in working capital 84,350 76,831
Changes in working capital
Change in operating receivables 36,065 (5,903)
Change in inventories (13,233) (7,541)
Change in operating payables (18,081) 20,316
Change in taxes other than income tax 982 614
Payments for disposal of provisions 2,630 (924)
Receipts from goverment grant 402 481
Income tax paid (1,384) (555)
Other receipts (payments) 1 (521)
Changes in working capital 7,382 5,967
Net cash generated from operating activities 91,732 82,798
Cash flow from investing activites
Payments for investments in subsidiaries (29,922) (82)
Payments for property, plant and equipment (50,969) (54,043)
Receipts from property, plant and equipment 751 302
Payments for intangible assets (4,798) (3,628)
(Payments) receipts from other assets (3,735) 1,190
Payments for loans issued 14, 21 (3,493) (8,431)
Receipts from loans issued 14, 21 155 23,772
Interests received 431 1,983
Dividends received 13 87 56
Net cash used in investing activities (91,493) (38,881)
Cash flow from financing activites
Receipts from borrowings 29, 31 565,215 313,472
Payments for borrowings 29, 31 (505,384) (327,205)
Payments for finance lease 29, 31 (3,182) (3,665)
Interest paid (16,338) (12,424)
Dividends paid (5,811) -
Net cash generated (used) in financing activities 34,500 (29,822)
Cash and cash equivalents as at 1 Jan. 38,993 24,910
Translation differences 239 (12)
Increase 34,739 14,095
Cash and cash equivalents as at 31 Dec. 73,971 38,993
STATEmENT OF CHANGES IN EQUITy
Statement of Changes in Equity in 2015
Statement of Changes in Equity in 2014
in € thousand
Equity attributed to the owners of the parent companyNon-
controlling interest Total
Share capital
Capital surplus
Revenue reserves
Fair value reserves
Translation differences
Retainedearnings Total
Balance as at 31 Dec. 2014 145,266 11,461 (859) 171 33 187,477 343,549 4,586 348,135
Acquisition of company 0 0 0 0 0 2,499 2,499 49,289 51,788
Purchase of treasury shares 0 0 (3,752) 0 0 0 (3,752) 0 (3,752)
Dividends paid 0 0 0 0 0 (5,810) (5,810) (257) (6,067)
Creation of legal reserves 0 0
988 0 0 (988) 0 0 0
Decrease in non-control-ling interest 0 0 0 0 0 (3) (3)
2
(1)
Total transactionswith owners 0 0
(2,764) 0 0 (4,302) (7,066) 49,034 41,968
Profit (loss) for the year 0 0 0 0 0 11,325 11,325 (328) 10,997
Other changes incomprehensive income 0 0 0 (360) 310 0 (50) (118) (168)
Total changes incomprehensive income 0 0 0 (360) 310 11,325 11,275
(446)
10,829
Creation of reservesfor treasury shares 0 0 3,752 0 0 (3,752) 0 0 0
Total changes in equity 0 0 3,752 0 0 (3,752) 0 0 0
Balance as at 31 Dec. 2015 145,266 11,461 129 (189) 343 190,748 347,758 53,174 400,932
in € thousand
Equity attributed to the owners of the parent companyNon-
controlling interest Total
Share capital
Capital surplus
Revenue reserves
Fair value reserves
Translation differences
Retainedearnings Total
Balance as at 31 Dec. 2013 145,266 11,461 (859) 71 (98) 162,968 318,809 4,776 323,585
Covering loss 0 0 0 0 0 0 0 2 2
Purchase of treasury shares 0 0 (2) 0 0 0 (2) 0 (2)
Transaction with owners 0 0 0 0 0 (522) (522) 0 (522)
Decrease in non-control-ling interest 0 0 0 0 0 175 175
(175) 0
Total transactionswith owners 0 0
(2) 0 0 (347) (349)
(173)
(522)
Profit for the year 0 0 0 0 0 24,858 24,858 46 24,904
Other changes incomprehensive income 0 0 0 100 131 0 231 (63) 168
Total changes incomprehensive income 0 0 0 100 131 24,858 25,089 (17) 25,072
Creation of reservesfor treasury shares 0 0 2 0 0 (2) 0 0 0
Total changes in equity 0 0 2 0 0 (2) 0 0 0
Balance as at 31 Dec. 2014 145,266 11,461 (859) 171 33 187,477 343,549 4,586 348,135
The notes to the financial statements are an integral part of the combined financial statements and should be read in conjunction with them.

< back to content
99
< back to content
special purposefinancial statements
9998
special purposefinancial statements
< back to content
in € thousand Activity
% ofvoting rights
Value ofassets as at
31. Dec. 2015
Value ofequity as at
31. Dec. 2015Profit (Loss)
for 2015
PERUTNINA PTUJ d. d., Potrčeva cesta 10, 2550 Ptuj,Slovenia
Processing and preserving of poultry meat 51.35
182,518
91,506
145
HOLDING PMP d. d., Vinarski trg 1, 2250 Ptuj, Slovenia Financial service activities 56.19 8,941 8,399 (18)
Perutnina Ptuj - subsidiaries
Perutnina Ptuj-Topiko d. o. o., Petefi Brigade 2, Bačka Topola, Serbia
Processing and preserving of poultry meat 100
21,198
3,103
1,439
PP MI ZALOG d. o. o., Hladilniška pot 37, Ljubljana,Slovenia
Processing and preserving of poultry meat 100
18,959
11,972
58
PP NEPREMIČNINE d. o. o., Potrčeva 10, Ptuj, Slovenia Real estate activities 100 8,938 8,910 6
Perutnina Ptuj – Pipo Čakovec d. o. o., Rudolfa Steinerja 7, Čakovec, Croatia
Processing and preserving of poultry meat 99.66
29,090
17,104
17
PERUTNINA PTUJ-BH d. o. o., Potkrajska bb, Breza, Bosnia and Herzegovina
Processing and preserving of poultry meat 55
19,820
7,276
555
PTUJSKA KLET d. o. o. , Vinarski trg 1, Ptuj, Slovenia Growing of grapes 100 6,155 2,717 5
PP Romania, Str. 13 decembrie, Brasov, Romania Trade 100 1,207 (175) (194)
PP S d. o. o., Povelić b.b., Srbac,Bosnia and Herzegovina
Processing and preserving of poultry meat 100
15,089
1,701
283
PP Gostinstvo d. o. o. , Dravska ulica 9, Ptuj, Slovenia Restarurants and inns 100 735 (277) (232)
GRADBENI REMONT d. o. o., Žnidaričevo nabrežje 10, Ptuj, Slovenia Construction 100
1,017
464
42
PP BRO ŽIVA d. o. o., Bačka Topola,Serbia
Processing and preserving of poultry meat 60
921
180
19
PERUTNINA PTUJ DOOEL, Skopje, Macedonia Trade 100 2,589 274 197
VETERINARSKA AMBULANTA PP d. o. o. , Potrčeva 6, Ptuj, Slovenia Veterinary activities 61.94
993
275
1
Perutnina Ptuj d. o. o., Cara Dušana b.b., Trn Laktaši, Bosnia and Herzegovina
Processing and preserving of poultry meat 100
11
(370)
(23)
PERUTNINA AUSTRIA GmbH, Seiersberg, Austria Trade 100 1,321 383 176
PP - AGRO d. o. o., Tržaška cesta 41A, Maribor,Slovenia
Agriculture, farming and fruit growing 100
11,713
6,430
162
Perutnina Ptuj – Pipo Čakovec - subsidiaries
Eko - energija d. o. o., Rudolfa Teinerja 7, Čakovec, Croatia Electricity production 100 92 64 58
Perutnina Ptuj-Topiko - subsidiaries
TOP-VETERINA d. o. o., Dušana Popivode b.b., Bačka Topola, Serbia Veterinary activities 100 191 59 6
HOLDING PMP - subsidiaries
PP ENERGIJA, d. o. o., Potrčeva cesta 10, 2250 Ptuj, Slovenia Electricity production 76 7,907 1,789 130
ACRONI - subsidiaries
ŽELEZARNA JESENICE, d. o. o., Cesta železarjev 8, Jesenice, Slovenia
Trading with own real estate 100
10,086
9,547
232
METAL RAVNE - subsidiaries
KOPO International Inc., New Jersey, USA Trade 100 22,364 1,763 (86)
SERPA d. o. o., Koroška cesta 14, Ravne na Koroškem,Slovenia
Metallurgic machines production 89.73
4,767
2,198
176
ODPAD - subsidiaries
DANKOR, d. o. o., Europske avenije 22, Osijek,Croatia
Recovery of secondary raw materials from scrap 51 1,660 293 (232)
METAL-EKO SISTEM DOO JAGODINA, Put Kneza Mihaila 107, Jagodina, Serbia
Recovery of secondary raw materials from scrap 70
4,415
1,930
(91)
''TOPMETAL'' d. o. o. Laktaši,Bosnia and Herzegovina
Recovery of secondary raw materials from scrap 51
1,562
811
(75)
Ravne Steel Center - subsidiaries
SIDERTOCE S. p. A., Via XX. Settembre 198, C. P. 34, Gravellona Toce, Italia Trade 100
13,401
2,956
429
NOŽI RAVNE – odvisne družbe
Ravne Knives (UK) Limited, 12 Conqueror Court,Sittingbourne, Kent, ME10 5BN, United Kingdom Trade 100
310
(102)
(125)
Ravne Knives UK (North) Limited , 12 Conqueror Court,Sittingbourne, Kent, ME10 5BN, United Kingdom Trade 100
9
6
(1)
Continuation of the table on page 13 >>
NOTES TO THE FINANCIAL STATEmENTS
REPORTING ENTITy
SIJ – Slovenska industrija jekla, d.d. (hereinafter: SIJ or the Company) is a Company with its registered office in Slovenia. Its registered address is Gerbičeva ulica 98, 1000 Ljubljana. Given below are the special purpose financial statements of SIJ Group, Perutnina Ptuj Group and Holding PMP Gorup for the year ending as at 31 December 2015.
BASIS OF PREPARATION
The special purpose financial statements for 2015 have been prepared in accordance with the IFRS as adopted by the Euro-pean Union. The standards have been applied directly in the disclosures and valuation of items; the exception is the valu-
ation of items for which the standards allow several methods of valuation.
The financial statements in the report are expressed in € thou-sands. Due to the rounding off of value amounts, there may be insignificant deviations from the sums given in the tables.
In the selection of accounting principles and their application, as well as in the preparation of these financial statements, the Board of Directors considered the following three re-quirements: the financial statements are comprehensible if users can understand them without difficulty; the informa-tion is adequate, if it helps users make economic decisions; and the information is fundamental if its exclusion or false presentation could influence users’ economic decisions.
COmPOSITION OF THE GROUP OF RELATED PARTIES
The financial statements of the SIJ Group include the financial statements of the parent company and the financial statements of the companies of the Group.
The group of companies in which the parent company holds financial investments includes the following:
in € thousand
Activity
% ofvoting rights
Value ofassets as at
31. Dec. 2015
Value ofequity as at
31. Dec. 2015Profit (Loss)
for 2015
Parent company of the Group
SIJ – Slovenska industrija jekla, d.d., Gerbičeva ulica 98,Ljubljana, Slovenia Activities of head offices 350,813 191,403 19,752
SIJ - subsidiaries
ACRONI, d. o. o., Cesta Borisa Kidriča 44, Jesenice, Slovenia Steel production 100 430,666 173,356 4,793
METAL RAVNE d. o. o., Koroška cesta 14, Ravne na Koroškem, Slovenia Steel production 100
227,660
93,472
10,534
NOŽI RAVNE d. o. o., Koroška cesta 14, Ravne na Koroškem, Slovenia
Industrial knivesproduction 100
21,880
8,739
1,718
ELEKTRODE JESENICE d. o. o., Cesta železarjev 8, Jesenice, Slovenia
Welding materialsproduction 100
10,167
5,494
(210)
SUZ, d. o. o., Cesta Borisa Kidriča 44, Jesenice, Slovenia Drawn wires production 100 3,809 1,413 270
ZIP CENTER d. o. o., Koroška cesta 14, Ravne na Koroškem, Slovenia
Education and trainingof the disabled 100
1,733
389
131
ODPAD d. o. o. Pivka, Velika Pristava 23, Pivka, SloveniaRecovery of secondary raw materials from scrap 74.90
26,641
6,983
162
NIRO Wenden GmbH, Glück-Auf-Weg 2, Wenden,Germany
Steel cutting, engineering and trade 85
14,691
1,224
(2,108)
RAVNE STEEL CENTER d. o. o., Litostrojska cesta 60, Ljubljana, Slovenia Trade 77.28
26,858
14,647
1,252
GRIFFON & ROMANO S. P. A., Via Dossetti 11,Loc. Casinello de Dosso, Italia
Heat processing and special steel trade 100
23,652
847
(1,769)
SIJ Asia Gmbh, Berger Str. 2, 40213 Düsseldorf, Germany Trade 100 288 189 89
Continuation of the table on page 11 >>

< back to content
101
< back to content
special purposefinancial statements
101100
special purposefinancial statements
< back to content
of the assets acquired and liabilities assumed, all measured as at the acquisition date. When the excess is negative, the effect is recognized immediately in profit or loss.
Acquisition costs, other than those associated with the issue of equity or debt securities, incurred in connection with a business combination, are listed as incurred expenses.
The Group accounts for the acquisition of non-controlling in-terests that do not involve a change in control of a company as transactions with owners, and therefore no goodwill is rec-ognized.
Adjustments to non-controlling interests are based on a pro-portionate amount of the assets of the subsidiary. Any sur-plus, or the difference between the costs of additional invest-ments and the carrying amount of assets, are recognized in equity.
Foreign Currency Conversion
Transactions in foreign currencies are translated into the functional currency at the exchange rate on the date of the transaction. Cash assets and liabilities denominated in for-eign currency at the end of the period are translated into the functional currency at the then valid exchange rate. Positive or negative exchange rate differences are the differences be-tween the amortised cost in functional currency at the begin-ning of the period, adjusted by the amount of the effective interest rate and the payments during the period, and the amortised cost in foreign currency, calculated at the exchange rate at the end of the period. Non-cash assets and liabilities, denominated in foreign currency and measured at fair value, are translated to the functional currency at the exchange rate on the date when the fair value is set. Exchange rate differ-ences are recognized in profit or loss.
Income statements and cash flow statements of individual companies of the Group abroad, where the company’s func-tional currency is not the euro, are translated to the control-ling company’s reporting currency at the average exchange rate, whereas the statements of financial position are trans-lated to the reporting currency at the exchange rate on the reporting date.
Foreign exchange differences are recognized in comprehen-sive income and presented under translation differences in equity. In the case of non-wholly-owned subsidiaries abroad, the relevant proportion of the foreign exchange differences is allocated to non-controlling interests. When a foreign op-eration is disposed of in such a way that control or signifi-
cant influence is lost, the relevant cumulative amount in the translation reserve is reclassified to profit or loss or as gain or loss on disposal. When the Group disposes of only part of its interest in a subsidiary that includes a foreign operation while retaining control, the relevant proportion of the cumulative amount is reattributed to non-controlling interests.
Revenues
Sales revenues are recognized at fair value of received repay-ments or receivables, decreased by repayments, discounts, rebates for further sales and quantity discounts. Revenues are recognized when the buyer assumes all significant risks and benefits connected to the asset’s ownership, and it is certain that compensation and related costs will be repaid or there is a possibility of returning products, and when the Group ceases to make decisions about sold products.
Financial income comprises interest income and positive ex-change rate differences resulting from financing and invest-ing. Interest income is recognized upon its occurrence, using the effective interest rate method.
Expenses
Expenses are recognized if a decrease in economic benefits during the reporting period is associated with a decrease in assets or an increase in debts, and if this decrease can be reli-ably measured. Operating expenses are recognized when the costs are no longer held in inventories, finished and unfin-ished products, or when goods are sold. The costs that cannot be held in inventories of finished and unfinished products are recognized as operating expenses when they appear.
Financial expenses include borrowing costs (if not capital-ised), exchange rate losses resulting from financing and invest-ing, changes in the fair value of financial assets at fair value through profit or loss and losses from the value impairment of financial assets. Borrowing costs are recognized in the in-come statement using the effective interest rate method.
Taxation
Taxes comprise current income tax liabilities and deferred tax. Current income tax is recognized in the income statement, except to the extent that refers to business combinations or items shown directly in the comprehensive income.
Current income tax liabilities are based on the taxable profit for the financial year. Taxable profit differs from net profit, re-ported in the income statement, because it excludes items of
in € thousand Activity
% ofvoting rights
Value of assets as at 31. Dec.
2015
Value of equity as at 31. Dec.
2015Profit (Loss)
for 2015
Ravne Knives USA Inc., 2711 Centerville Road, Suite 400, Wilmington, Country of New Castle, Delaware 19808, USA Trade 100
90
(96)
(95)
SIJ Asia - subsidiaries
SIJ Steel (Shanghai) Co., Ltd., Rm.320, 2449 Gonghexin Road, Zhabei District, Shanghai 200072, China Trade 100
12
12 0
Continuation of the table
In March 2015 Noži Ravne acquired the companies Ravne Knives (UK) Limited, Ravne Knives UK (North) Limited and Ravne Knives USA INC. Up to the date of the drawing up of the financial statements these companies had had no significant influence on the Group.
In September 2015 SIJ Asia Gmbh established a new subsidi-ary, SIJ Steel (Shanghai) Co., China. The company did not be-gin to operate in 2015.
The financial statements of the companies included in the fi-nancial statements are audited, except for the financial state-ments of those companies which are not obliged to be audit-ed according to local legislation or had not begun to operate by the reporting date. These are Ravne Steel Deutschland Gmbh, SIJ Asia Gmbh, Steel (Shanghai) Co., Ravne Knives (UK) Limited, Ravne Knives UK (North) Limited, Ravne Knives USA, PP NEPREMIČNINE d. o. o., PTUJSKA KLET d. o. o., PP Romania Str, PP Gostinstvo d. o. o., GRADBENI REMONT d. o. o., PP BRO ŽIVA d. o. o., VETERINARSKA AMBULANTA PP d. o. o., Perutnina Ptuj d. o. o., PERUTNINA AUSTRIA GmbH, Eko – en-ergija d. o. o., TOP-VETERINA d. o. o., HOLDING PMP d. d. and PP ENERGIJA d. o. o
SIGNIFICANT ACCOUNTING POLICIES
Subsidiaries
Subsidiaries are entities controlled by the Group. Control ex-ists where the Group has the power to govern the financial and operating policies of a company so as to obtain benefits from its activities. The financial statements of the subsidiaries are included in the Group’s consolidated financial statements from the date on which control commences until the date that control ceases. The accounting policies of the subsidiar-ies are aligned with the Group’s accounting policies.
On loss of control, the Group de-recognizes the assets and liabilities of the subsidiary, any non-controlling interests, and any other components of the equity related to the subsidiary.
Any surplus or deficit arising on loss of control is recognized in profit or loss. If the Group retains any interest in the previous subsidiary, such interest is measured at fair value from the date on which control is lost. Subsequently, this interest is ac-counted for in equity as an investment in an associate (using the equity method) or as an available-for-sale financial asset, depending on the level of influence retained.
Intra-group balances and any gains and losses arising from intra-group transactions are eliminated in preparing the con-solidated financial statements. Unrealized gains arising from transactions with associates (accounted for using the equity method) are eliminated to the extent of the Group’s interest in the entity. Unrealized losses are eliminated using the same method, provided there is no evidence of impairment.
Investments in associates
Investments in associates are accounted on the basis of the equity method. Associates are those companies where the Group has a significant influence on their operations, but which it does not control.
Upon initial recognition, investment in associates are meas-ured at cost, but are subsequently accounted for using the equity method. The Group’s consolidated financial state-ments include the Group’s share of the profit and loss of equity-accounted associates, after adjustments to align the accounting policies, from the date on which significant in-fluence commences until the date that significant influence ceases. When the Group’s share of losses of an associate ex-ceeds its interest in such an entity, the carrying amount of the Group’s interest is reduced to zero and recognition of further losses is discontinued.
Transactions with Non-Controlling Interests
The Group measures goodwill at the fair value of the consid-eration transferred, plus the recognised amount of any non-controlling interest in the acquisition, plus the fair value of any pre-existing equity in the acquisition (if the business combi-nation is achieved in stages), less the net recognized amount

< back to content
103
< back to content
special purposefinancial statements
103102
special purposefinancial statements
< back to content
Land and unfinished construction is not depreciated. Depre-ciation is accounted when an asset becomes available for use.
The estimated useful lives of individual property, plant and equipment types for the current and past years:
Depreciation methods, useful life and other group asset val-ues are reviewed at the end of every financial year and ad-justed if necessary.
The replacement costs of items of property, plant and equip-ment and further costs related to intangible assets are rec-ognized in the carrying amount of each asset, if it is probable that the future economic benefits embodied within this asset will flow to the Group, and the cost of the asset can be meas-ured reliably. All other costs (for example, maintenance costs) are recognized in the income statement as expenses as soon as they are incurred.
Investment Property
At its initial recognition, investment property is measured at cost, less accumulated depreciation and accumulated im-pairment losses. The cost model is used for any subsequent measuring of investment property.
Depreciation rates and the depreciation calculation are treat-ed the same as in the case of property, plant and equipment.
Financial Instruments
Financial instruments include the following items:
• non-derivative financial assets,• non-derivative financial liabilities.
Financial instruments are carried at fair value. Fair value is the amount for which an asset can be exchanged or the liability can be settled between two well-informed and willing parties in an arm’s length business transaction.
For determining the fair value of financial instruments the fol-lowing hierarchy levels of determining fair value are considered:
• the first level includes quoted prices (unadjusted) on active markets for the same assets or liabilities;
• the second level, in addition to the quoted prices at the first level, includes the input data which are directly (i.e. as prices) or indirectly (i.e. as derivatives from prices) observable as assets or liabilities;
• the third level includes input data for assets or liabilities which are not based on the observable market data.
Quoted prices are used as a basis for determining the fair value of financial instruments. If a financial instrument is not quoted on the organized market or the market is deemed non-active, input data at the second or third level are used to assess the fair value of the financial instrument.
Non-Derivative Financial Assets
Non-derivative financial assets include cash and cash equiva-lents, loans and receivables, and investments. Liabilities, bor-rowings and deposits are initially recognized when they are incurred. Other assets are initially recognized on the trade date on which the Group becomes a contracting party in a contract on the instrument. The recognition of a financial as-set is eliminated when the contractual rights of the cash flows from the asset expire, or when the rights of the contractual cash flows are transferred from a financial asset on the ba-sis of a business transaction in which all risks and benefits of ownership of the financial asset are transferred.
Financial assets at fair value through profit or loss
A financial asset is classified at fair value through profit or loss if it is meant for trading or is determined as such after the ini-tial recognition. Financial assets are determined at fair value through profit or loss under the condition that such assets are manageable, and that the sale or purchase of these as-sets can be decided on the basis of fair value. After the initial recognition the pertained costs of the business transaction are recognized in profit or loss upon their occurrence. Finan-cial assets at fair value through profit or loss are measured at fair value, whereas the amount of change in the fair value is recognized in the income statement.
Available-for-sale financial assets
Available-for-sale financial assets are those non-derivative fi-nancial assets designated as available for sale, or those not included in the category of loans and receivables or financial assets at fair value through profit or loss.
Useful life
Real estate 10-60 years
Production equipment 1-25 years
Computer equipment 2-10 years
Motor vehicles 2-10 years
Other equipment 1-10 years
income or expenses that are taxable or deductible in other years, as well as items that are never taxable or deductible. The Group's current income tax liability is calculated using the tax rates applicable on the reporting date.
Deferred tax is shown in total by applying the method of obli-gations after the statement of financial position for temporary differences arising from the tax values of assets and liabili-ties and their carrying amounts in the consolidated financial statements. Deferred tax is calculated by using the tax rates (and laws) applicable on the date of the statement of financial position, which are expected to be used when the deferred tax asset is realized or the deferred tax liability is recovered.
A deferred tax asset is recognized to the extent that it is prob-able that future taxable profit will be available against which the deferred tax asset can be utilized.
A deferred tax liability is recognized for all taxable temporary differences, unless it comes from initial goodwill recognition, or the initial recognition of an asset or liability in a business transaction which is not a business combination and which does not affect the accounting or taxable profits (tax loss) during the transaction.
Net Earnings per Share
The Group recognizes basic and diluted earnings per share for ordinary shares. Basic earnings per share are calculated by dividing profit or loss allocated to ordinary shareholders by the weighted average number of ordinary shares in the financial year, net of the average number of treasury shares. Diluted earnings per share are calculated by adjusting profit or loss allocated to ordinary shareholders and the weighted average number of ordinary shares in the financial year, net of the average number of treasury shares, for the effect of all potential ordinary shares representing convertible bonds and share options for employees.
Intangible Assets
Intangible assets with a definite useful life are recognized at cost, less any accumulated amortisation and accumulated impairment losses. The purchase value includes costs that can be directly attributed to the acquisition of each individual item. Borrowing costs directly attributable to the purchase or production of a qualifying asset are recognized as part of the cost of such asset. The cost model is used for any subsequent measuring of intangible assets.
Intangible assets with indefinite useful life are not amortised, they are impaired.
Amortisation is calculated on a straight-line basis over the estimated useful life of each individual part (component) of the intangible asset. Amortisation is accounted when an asset becomes available for use.
The estimated useful life of individual intangible assets for the current and past year is 2–10 years.Amortisation methods, useful lives, and other group asset values are reviewed at the end of every financial year and ad-justed if necessary.
Further costs related to intangible asset are recognized in the carrying amount of each asset, if it is probable that the future economic benefits embodied within the asset will flow to the Group and the cost of the asset can be measured reliably. All other costs are recognized in the income statement as ex-penses as soon as they are incurred.
Goodwill arising on consolidation represents the excess of the purchase value over the fair value of the group’s interest of acquired identifiable assets, liabilities and contingent liabil-ities of a subsidiary on the date of acquisition. Negative good-will is immediately recognized in the consolidated income statement at the date of acquisition. Goodwill is recognized as an asset and is tested at least once a year for impairment. Each impairment is immediately recognized in the consolidat-ed income statement and is not subsequently reversed. On the disposal of the subsidiary the relevant goodwill amount is included in the determination of profit or loss.
Property, plant and equipment
At their initial recognition, tangible assets (property, plant and equipment) are carried at cost, less any accumulated depre-ciation and accumulated impairment losses, except for land and other assets that do not depreciate; these are shown at their cost, reduced by all relative impairments. The purchase value includes costs that can be directly attributed to the ac-quisition of each individual item of property, plant or equip-ment. Parts of property, plant and equipment with different useful lives are accounted as separate items of property, plant and equipment. Borrowing costs directly attributable to the purchase, production or construction of a qualifying asset are recognized as part of the cost of each such asset. The cost model is used for any subsequent measuring of property, plant and equipment.
Depreciation is calculated on a straight-line basis over the es-timated useful life of each individual part (component) of the tangible asset and the residual value. Leased assets are de-preciated over the estimated period of lease and useful life.

< back to content
105
< back to content
special purposefinancial statements
105104
special purposefinancial statements
< back to content
Impairment of loans and receivables
The Group considers the evidence of impairment of receiva-bles individually or collectively. All significant receivables are measured separately for specific impairment. If it is assessed that the carrying amount of the receivables exceeds the fair value, i.e. the collectible amount, receivables are impaired.
Receivables that are not individually significant are collective-ly assessed for impairment by grouping together those re-ceivables with similar risk characteristics. The Group creates these groups on the basis of the maturity of receivables. In the evaluation of total impairment the Group uses historical trends of the probability of default, the timing of recoveries, and the amount of incurred loss adjusted for management judgment as to whether the actual losses due to current eco-nomic and credit conditions could be higher or lower than the losses based on historical trends.
The Group evaluates the evidence of impairment for each sig-nificant loan individually.
An impairment loss related to a financial asset measured at amortised cost is calculated as the difference between its car-rying amount and the estimated future cash flows, discount-ed at an original effective interest rate. The loss is recognized in the profit or loss.
Available-for-sale financial assets
Impairment losses of available-for-sale financial assets are recognized so that the potential accumulated loss, previously recognized in the comprehensive income of the period and included in the fair value reserve, is transferred into profit or loss. Any subsequent increase in the fair value of an impaired available-for-sale equity security is recognized in the compre-hensive income for the period or in the fair value reserve.
Non-Financial Assets
At each reporting date, the Group reviews the carrying value of its important non-financial assets to determine whether there is an indication of impairments. If any such indication exists, the asset’s recoverable value is estimated.
The recoverable value of assets or cash-generating units is their value in use or fair value, less cost to sell, whichever is greater. In assessing value in use, estimated future cash flows are discounted to their present value, using a pre-tax discount rate that reflects current market assessments of the time val-ue of cash and the risks specific to the asset. In order to test
the impairment, assets which cannot be tested individually are joined into the smallest possible group of assets which create cash flows from further use and which are largely in-dependent of the inflow of other assets or groups of assets (cash-generating units).
The impairment of an asset or cash-generating unit is rec-ognized if their carrying amount exceeds their recoverable value. The impairment is given in the income statement.
The Group evaluates the impairment losses of previous peri-ods at the end of the reporting period and thus determines whether the loss was reduced or even eliminated. An impair-ment loss is reversed if there has been a change in the esti-mates used to determine the asset’s recoverable value. An impairment loss is reversed only to such an extent that the asset’s carrying amount does not exceed the carrying amount that would have been determined after deducting the depre-ciation write-off, if no impairment loss had been recognized for the asset in previous years.
At least once a year, on the date of the drawing up of the consolidated financial statements, the Group evaluates the evidence on the impairment of inventories. The impairment of inventories is assessed for each individual type of inven-tory. Individual types of inventories are allocated to groups of inventories with similar characteristics on the basis of the time component of changes in inventories. The estimate of impairment for each individual group includes an expert as-sessment of the possibility of further use or sale.
Determination of Fair Value
Following the accounting policies of the Group, in many cases the determination of fair value of non-financial assets and fi-nancial assets is necessary, either to measure an individual asset (measurement method or business combination) or for additional fair value disclosure.
Fair value is the amount for which an asset can be exchanged or the liability can be settled between two well-informed and willing parties in an arm’s length business transaction.
Methods for the determination of fair value of individual groups of assets for measurements or reporting are given below.
Intangible Assets
The fair value of intangible assets is based on the method of discounted cash flows which are expected to arise from the use and possible disposal of the assets.
Loans and receivables
Loans and receivables are non-derivative financial assets with fixed or determinable payments that are not listed on the ac-tive market. Depending on their maturity they are classified as current financial assets (maturities up to 12 months after the date of the statement of financial position) or non-cur-rent financial assets (maturities exceeding 12 months after the date of the statement of financial position). Loand and receivables are initially recognized at fair value increased by costs directly attributable to the business transaction. Sub-sequent to their initial recognition, receivables and loans are measured at amortised cost using the effective interest rate method less accumulated impairment loss.
Cash and cash equivalents
Cash and cash equivalents comprise cash in hand, bank de-posits up to three months, and other current and readily real-izable investments with an original maturity of three months or less. They are recognized at cost.
Non-Derivative Financial Liabilities
Non-derivative financial liabilities include operating, financial and other liabilities. Non-derivative financial liabilities are initially recognized on the trade date on which the Group be-comes a contracting party in relation to the instrument. The Group de-recognizes an non-derivative financial liability when the contractual obligations are fulfilled, annulled or expired.
Non-derivative financial liabilities are initially disclosed at fair value, increased by costs directly attributable to the business transaction. Subsequent to their initial recognition these li-abilities are measured at amortised cost using the effective interest rate method. Depending on their maturity they are classified as current liabilities (maturities up to 12 months after the date of the statement of financial position) or non-current liabilities (maturities exceeding 12 months after the date of the statement of financial position).
Inventories
Inventories are measured at cost or net realizable value, whichever is the lower. The cost value consists of the purchase price, import duties and direct purchase costs. The purchase price is reduced by any discounts given. Direct purchase costs are transport costs, costs of loading reloading and unloading, costs of monitoring goods, and other costs attributable to directly-purchased merchandise, materials or services. Pur-chase discounts are those that are stated on the invoice, or which are given later and refer to individual purchases. The
value of finished and unfinished products refers to all produc-tion costs, which include the costs of manufacturing materi-als, labour costs, depreciation, services and other production costs.
The inventories of materials and merchandise are valued at actual prices, while the inventories of finished and unfinished products are valued using the standard cost method with de-viations to actual production prices. The use of inventories is stated at weighted average prices.
The net realizable value is estimated on the basis of the sell-ing price in the ordinary course of business, less the estimated costs of completion and estimated distribution costs. Write-offs of damaged, expired and useless inventories are regularly performed during the year on individual items.
Assets Held for Disposal (Disposal Groups)
Assets or disposal groups which include assets and liabilities for which it can be expected that their value will be recovered through sale are classified as assets held for disposal. Assets or disposal groups are re-measured directly before their clas-sification as assets held for disposal. Accordingly, non-current assets or disposal groups are recognized at their carrying amount or fair value less cost of sale, whichever is the lower. Impairment losses on the reclassification of assets as assets held for disposal, and subsequent losses and gains on re-measurement, are recognized in profit or loss. Gains are not recognized in the amount exceeding possible accumulated impairment losses.
Once classified as held for disposal, intangible assets and property, plant and equipment are no longer amortised or depreciated. When investments are classified as assets held for disposal, they are no longer equity accounted.
Impairment of Assets
Financial Assets
A financial asset is impaired if objective evidences indicates that one or more events occurred resulting in a decrease in the estimated future cash flows from this asset which can be reliably estimated.
Objective evidence of the impairment of financial assets can include: default or delinquency by a debtor; restructuring of the amount owed to the Group, if the Group agrees; indica-tions that the debtor will declare bankruptcy; and the disap-pearance of the active market for such an instrument.

< back to content
107
< back to content
special purposefinancial statements
107106
special purposefinancial statements
< back to content
Employee Benefits
In accordance with legal regulations, the Collective Agree-ment and internal regulations, the Group is obliged to make payments arising from loyalty bonuses and severance pay upon retirement, for which non-current provisions are formed. There are no other retirements benefits.
The provisions are formed in the amount of estimated future payments for loyalty bonuses and severance pay, discounted at the end of the financial year. The calculation is made for each individual employee and includes the costs of severance pay upon retirement and the costs of all expected loyalty bonuses up to retirement. The calculation is prepared by an actuary, selected at group level, on the basis of a projected unit. The provisions are reviewed periodically or when the assumptions used to determine the amount of provision change significantly.
Deferred Revenues
Deferred revenues are expected to cover estimated expenses during a period exceeding one year.
On the basis of the status of a sheltered company, companies in the Group create deferred revenues in the amount of cal-culated but not paid contributions from salary and compulso-ry contributions (assigned contributions). They are intended to cover the expenses in accordance with the Vocational Re-habilitation and Employment of Disabled Persons Acts. The expended deferred revenues are eliminated and credited to operating income for the current year.
Cash Flow Statement
The cash flow statement shows changes in the balance of cash and cash equivalents for the financial year concerned. The cash flow statement is compiled according to the indirect method.
Segment Reporting
An operating segment is a component of the Group that en-gages in business activities from which it earns revenues and incures expenses which relate to transactions with any of the Group’s other segments. Segments are different in terms of risks and returns. The Group’s segment reporting is based on the Group’s internal reporting system applied by the manage-ment in the decision-making process.
The segments are presented in detail in the business report.
The Group uses the following segments in the preparation and presentation of the financial statements:
• Steel Division,• Distribution & Processing Division, • Scrap Division,• Manufacturing Division,• Headquarter and other services and• Processing and preserving of poultry meat.
Property, Plant and Equipment
The fair value of property, plant and equipment is their mar-ket value. The market value of property is equal to the esti-mated value at which the property could be sold on the date of valuation and after proper marketing. The market value of equipment is based on the approach of using the quoted market price for similar items.
Investment Property
The fair value of investment property is assessed by consid-ering the aggregate value of estimated cash flows expected from renting out the property. A yield reflecting specific risks is included in the property valuation, based on discounted net annual cash flows.
Available-for-Sale Financial Assets and Financial Assets at Fair Value through Profit or Loss
The fair value of available-for-sale financial assets and finan-cial assets at fair value through profit or loss is determined according to preliminarily-defined hierarchy levels of de-termining the fair value of financial instruments. If the fair value cannot be reliably measured, because the wide range of estimates of reasonable fair values is important, and the probability of different estimates is hard to assess, the Group measures the financial asset at cost.
Loans and Receivables
The fair value of loans and receivables is calculated as the present value of future cash flows discounted at the market interest rate at the end of the period. The assessment consid-ers the credit risk connected to these financial assets. Inventories
The fair value of inventories is determined on the basis of ex-pected trade value in the ordinary course of business, less the estimated distribution costs.
Non-Derivative Financial Liabilities
The fair value for reporting is calculated on the present value of future repayment and the principal value discounted at the market interest rate at the end of the period.
Equity
Share Capital
The share capital of the parent company takes the form of share capital, the amount of which is defined in the Compa-ny’s article of association. It is registered with the Court and paid by the owners.
Capital Surplus
Capital surplus consists of the amounts from payments ex-ceeding the lowest issue price per share that exceeds the carrying amount upon the disposal of previously-acquired own shares; the amounts on the basis of simplified decrease of share capital; and the amounts on the basis of reversal of general revaluation adjustment.
Legal and Other Reserves
Legal and other reserves are amounts of retained earnings from previous years, which are mostly used to compensate for potential future losses. On their occurrence they are rec-ognized by the body responsible for the preparation of the Annual Report, or by the decision of the said body.
Treasury Shares
If the company or its subsidiaries acquire an ownership inter-est, the paid amount including the transaction costs less tax, is deducted from the total equity as treasury shares until such shares are withdrawn, reissued or sold.
Dividends
Until approved at the General Assembly of shareholders, the planned dividends are treated as retained earnings.
Provisions
Provisions are recognized if the Group, due to a past event, had a legal or indirect obligation which can be reliably meas-ured, and if there is a probability that settling the obligation will require an outflow of resources, enabling economic ben-efits.

< back to content
109
< back to content
special purposefinancial statements
109108
special purposefinancial statements
< back to content
Review of Costs by Type in 2014
in € thousand
Cost of sales Distribution costs
General andadministrative
expenses Total
Costs of goods, materials and services 485,992 32,907 16,764 535,663
Labour costs 56,802 6,803 26,304 89,909
Depreciation and amortisation costs 34,071 387 3,831 38,289
Other costs 2,758 58 3,269 6,085
Changes in the value of inventories 5,348 0 0 5,348
Operating expenses 584,971 40,155 50,168 675,294
3. Other Operating Income
in € thousand 2015 2014
Capitalized own products 3,767 3,992
Revenues from received subsidies 4,789 1,769
Received compensations 2,410 1,758
Write-off of liabilities 107 736
Reversal of provisions 226 116
Profit from sale of property, plant and equipment 95 19
Other income 3,300 552
Other operating income 14,694 8,942
4. Other Operating Expenses
5. Finance Income
in € thousand 2015 2014
Allowances for receivables 1,616 847
Impairment of inventories 1,473 583
Expenses for donations and sponsorships 388 292
Other expenses 1,094 241
Other operating expenses 4,571 1,963
in € thousand 2015 2014
Interest income 529 1,319
Exchange rate differences 367 197
Other income 690 120
Finance income 1,586 1,636
in € thousand 2015 2014
In Slovenia 172,841 97,550
In other countries: 740,307 610,308
- Germany 157,426 164,860
- Italy 147,753 169,340
- the USA 61,969 48,718
- Austria 35,846 23,746
- Other countries 337,312 203,644
Revenue 913,148 707,858
in € thousand 2015 2014
Costs of goods, materials and services 690,760 535,664
Labour costs: 143,145 89,909
- wages and salaries 107,243 67,820
- social security costs 17,976 12,334
- other labour costs 17,926 9,754
Depreciation and amortisation costs 50,844 38,289
Other costs 7,952 6,084
Changes in the value of inventories (3,649) 5,348
Operating expenses 889,052 675,294
in € thousand
Cost of sales Distribution costs
General andadministrative
expenses Total
Costs of goods, materials and services 616,170 50,386 24,207 690,763
Labour costs 86,267 16,198 40,680 143,145
Depreciation and amortisation costs 43,776 1,894 5,173 50,843
Other costs 3,489 244 4,217 7,950
Changes in the value of inventories (3,649) 0 0 (3,649)
Operating expenses 746,053 68,722 74,277 889,052
NOTES TO INDIVIDUAL ITEmS IN THE FINANCIAL STATEmENTS
1. Revenue
2. Operating Expenses
Review of Costs by Type in 2015

< back to content
111
< back to content
special purposefinancial statements
111110
special purposefinancial statements
< back to content
9. Intangible Assets
Movement of Intangible Assets in 2015
in € thousand Non-current property rights Goodwill
Assets underconstruction Total
Cost as at 31 Dec. 2014 6.909 15.061 6.130 28.100
Acquisition of company 3.479 190 0 3.669
New additions 0 0 4.968 4.968
Transfer from assets under construction 10.784 0 (10.784) 0
Translation differences 2 0 0 2
Disposals (17) 0 0 (17)
Transfer to proprerty, plant and equipment (1.061) 0 0 (1.061)
Reversal 0 (190) 0 (190)
Cost as at 31 Dec. 2015 20.096 15.061 314 35.471
Accumulated amortisation as at 31 Dec. 2014 (3.294) - - (3.294)
Amortisation (1.927) - - (1.927)
Translation differences (2) - - (2)
Disposals 15 - - 15
Transfer to proprerty, plant and equipment 802 - - 802
Accumulated amortisation as at 31 Dec. 2015 (4.406) - - (4.406)
Present value as at 31 Dec. 2014 3.615 15.061 6.130 24.806
Present value as at 31 Dec. 2015 15.690 15.061 314 31.065
Intangible assets comprise computer software and licences. Major new additions in 2015 refer to the purchase of soft-ware and licences in connection with the modernisation of the information system, activated in 2015.
The useful life of intangible assets is final, except for goodwill, which has an indefinite useful life.
On 31 December 2015 the goodwill was tested for potential impairment and the company determined no signs of impair-ment. Based on the test performed, the Board of Directors assesses that on 31 December 2015 the recoverable value of investments in interests of the companies in which goodwill arose was higher than their purchase value at the time of the business combination. Therefore impairment of goodwill which arose from business combinations is not necessary. The recoverable value of investments which corresponds to the value of investments in use was assessed by the method of present value of the estimated cash flows. All assumptions used for calculating cash flow are based on past experience
of the companies’ operations and reasonable expectations of future operations.
The Group recognizes goodwill which arose in 2015 immedi-ately in income statements.
On 31 December 2015 the Group’s unsettled liabilities to sup-pliers for purchase of intangible assets amounted to €357 thousand. Its contractual liabilities for the purchase of intan-gible assets amounted to €611 thousand. The present value of intangible assets under finance lease is €31 thousand. The Group capitalized €19 thousand of borrowing costs, for which the interest rates were between 2.50 and 4.02 percent. In-tangible assets, whose present value on 31 December 2015 amounts to €68 thousand, are pledged as security for liabilities.
The Group reviewed the value of intangible assets, and estab-lished that the present amount does not exceed the recover-able amount.
6. Finance expenses
7. Taxes
in € thousand 2015 2014
Interest expenses 16,910 12,092
Exchange rate differences 363 146
Other expenses 8,994 2,855
Finance expenses 26,267 15,093
in € thousand 2015 2014
Income tax expenses (1,645) (988)
Deferred income tax 3,079 (794)
Taxes 1,434 (1,782)
8. Net Earnings per Share
in € thousand 2015 2014
Profit, attributable to owners of the parent company 11,325 24,858
Weighted number of issued ordinary shares 970,979 986,693
Basic and diluted earnings per share (in €) 11.66 25.19
Net earnings per share are calculated by dividing the net profit or loss of the financial year, allocated to the owners of the parent company, by the weighted average number of shares, traded during the year, net of the number of treasury shares.

< back to content
113
< back to content
special purposefinancial statements
113112
special purposefinancial statements
< back to content
10. Property, Plant and Equipment
Movement of Property, Plant and Equipment in 2015
in € thousandLand Buildings Equipment Other
Assets under construction Total
Cost as at 31 Dec. 2014 25,490 274,189 807,039 23,873 27,598 1,158,189
Acquisition of company 26,116 82,575 25,685 463 3,340 138,179
New additions 0 0 0 0 73,186 73,186
Transfer from assets under construction 903 10,447 54,571 4,341 (70,261) 0
Disposals (126) (4,683) (13,763) (2,050) (3) (20,625)
Translation differences (5) (46) (57) 7 (4) (105)
Redistribution 2,072 (1,110) (13,675) 12,713 0 0
Other changes (2,559) (1,890) (587) (184) 0 (5,220)
Transfer from intangible assets 0 0 1,018 43 0 1,061
Cost as at 31 Dec. 2015 51,891 359,482 860,231 39,206 33,856 1,344,666
Accumulated depreciation as at 31 Dec. 2014 - (180,899) (560,548) (18,660) - (760,107)
Depreciation - (8,346) (37,785) (2,836) - (48,967)
Disposals - 4,658 13,404 1,899 - 19,961
Translation differences - 19 32 (7) - 44
Redistribution - (1,076) 11,067 (9,991) - 0
Other changes - 395 28 460 - 883
Transfer from intangible assets - 0 (762) (40) - (802)
Accumulated depreciation as at 31 Dec. 2015 - (185,249) (574,564) (29,175) - (788,988)
Present value as at 31 Dec. 2014 25,490 93,290 246,491 5,213 27,598 398,082
Present value as at 31 Dec. 2015 51,891 174,233 285,667 10,031 33,856 555,678
Major new additions and finished investments in property, plant and equipment include:
• line heat treatment of special heavy plates,• no-acid cleaning of hot-rolled strips,• vacuum ladle furnace,• modernization of primary production of Live production• restoration of farm Dobrovnik• current upgrades (repairs),• renovation of buildings.
Disposals of property, plant and equipment mostly refer to the sale or write-off of equipment connected with the reno-vation of basic production capacities, and write-offs of unus-able or out-dated equipment.
Redistribution refers to transfers between groups of assets and has no effect on income statements.
Property, plant and equipment, whose present value on 31 December 2015 amounts to €332,905 thousand, are pledged as security for liabilities. On 31 December 2015 the Group’s unsettled liabilities to suppliers for purchase of property, plant and equipment amounted to €21,055 thousand. Its contractual liabilities for the purchase of property, plant and equipment amounted to €43,798 thousand. The present value of property, plant and equipment under finance lease is €6,919 thousand. The Group capitalized €860 thousand in borrowing costs, for which the interest rates were between 2.33 and 5.06 percent.
The Group reviewed the value of property, plant and equip-ment, and established that the present amount does not ex-ceed the recoverable amount.
Movement of Intangible Assets in 2014
in € thousand Non-currentproperty rights Goodwill
Assets underconstruction Total
Cost as at 31 Dec. 2013 6,335 15,061 3,098 24,494
New additions 0 0 4,055 4,055
Transfer from assets under construction 1,026 0 (1,026) 0
Disposals (459) 0 0 (459)
Translation differences 2 0 0 2
Transfer from proprerty, plant and equipment 5 0 3 8
Cost as at 31 Dec. 2014 6,909 15,061 6,130 28,100
Accumulated amortisation as at 31 Dec. 2013 (3,053) - - (3,053)
Amortisation (696) - - (696)
Disposals 459 - - 459
Translation differences (1) - - (1)
Transfer from proprerty, plant and equipment (3) - - (3)
Accumulated amortisation as at 31 Dec. 2014 (3,294) - - (3,294)
Present value as at 31 Dec. 2013 3,282 15,061 3,098 21,441
Present value as at 31 Dec. 2014 3,615 15,061 6,130 24,806

< back to content
115
< back to content
special purposefinancial statements
115114
special purposefinancial statements
< back to content
The invesmten property whose present value on 31 December 2015 amounts to €1,493 thousand, are pledged as security for liabilities. The disclosed value of the investment property does not exceed its realizable value.
The disclosed value of operating receivables does not exceed their realizable value.
The investment in associates is valued on the basis of equity method. In 2015 the Group attributed a corresponding share of 2015 profit which amounted to €25 thousand.
The company's principal activity is development of new ma-terials and raw materials. The company does not need to be audited.
Available-for-sale financial assets, carried at cost, refer to shares and interests in companies that are not traded on the regulated market and whose fair value cannot be measured reliably.
Available-for-sale financial assets, carried at fair value, refer to shares and interests in companies that are traded on the
regulated market and whose fair value can be measured reli-ably. These assets decreased due to revaluation at fair value in the amount of €2 thousand charged to the comprehensive income.
Received dividends in 2015 amounted to €87 thousand.
12.Investments in Associates
in € thousand 31 Dec. 2015 31 Dec. 2014
Razvojni center Jesenice, Cesta Franceta Prešerna 61, Jesenice, Slovenia 1,573 1,548
Investments in associates 1,573 1,548
in € thousand Activity % of voting rightsValue of assets as at
31 Dec. 2015Value of equity as at
31 Dec. 2015 Revenues 2015 Net profit 2015
Razvojni center Jesenice Development 24.95 10,383 6,078 2,170 100
13. Available-for-Sale Financial Assets
in € thousand 31 Dec. 2015 31 Dec. 2014
Available-for-sale financial assets at cost 547 290
Available-for-sale financial assets at fair value 614 616
Available-for-sale financial assets 1,161 906
14. Non-Current Operating Receivables
in € thousand 31 Dec. 2015 31 Dec. 2014
Operating receivables 5,091 5,057
Allowances for operating receivables (2,984) (3,165)
Non-current operating receivables 2,107 1,892
Movement of Property, Plant and Equipment in 2014
In 2015 the Group generated €265 thousand of income anda €77 thousand of expenses from investment properties.
in € thousand Land Buildings Equipment OtherAssets under construction Total
Cost as at 31 Dec. 2013 25,320 268,705 806,604 24,147 11,478 1,136,254
New additions 0 0 0 0 41,493 41,493
Transfer from assets under construction 242 2,462 20,791 1,875 (25,371) 0
Disposals (9) 0 (18,647) (918) 0 (19,574)
Translation differences (63) (2) (67) 3 0 (129)
Redistribution 0 2,871 (1,642) (1,229) 0 0
Other changes 0 153 0 0 0 153
Transfer to intangible assets 0 0 0 (5) (3) (8)
Cost as at 31 Dec. 2014 25,490 274,189 807,039 23,873 27,597 1,158,188
Accumulated depreciation as at 31 Dec. 2013 - (175,250) (547,537) (18,960) - (741,747)
Depreciation - (4,802) (31,228) (1,563) - (37,593)
Write-offs and disposals - 0 18,557 738 - 19,295
Translation differences - 1 14 (3) - 12
Redistribution - (771) (354) 1,125 - 0
Other changes - (76) 0 0 - (76)
Transfer to intangible assets - 0 0 3 - 3
Accumulated depreciation as at 31 Dec. 2014 - (180,898) (560,548) (18,660) - (760,106)
Present value as at 31 Dec. 2013 25,320 93,455 259,067 5,187 11,478 394,507
Present value as at 31 Dec. 2014 25,490 93,291 246,491 5,213 27,597 398,082
11. Investment Property
Movement of Investment Property in 2015 and 2014
in € thousand 2015 2014
Cost as at 1 Jan. 834 834
Acquisition of company 3,927 0
Disposals (318) 0
Transfer from property, plant and equipment 622 0
Cost as at 31 Dec. 5,065 834
Accumulated depreciation as at 1 Jan. (627) (612)
Depreciation (62) (15)
Transfer from property, plant and equipment (138) 0
Accumulated depreciation as at 31 Dec. (827) (627)
Present value as at 1 Jan. 207 222
Present value as at 31 Dec. 4,238 207

< back to content
117
< back to content
special purposefinancial statements
117116
special purposefinancial statements
< back to content
Movement of Deferred Tax Assets and Liabilities in 2014
in € thousand 31 Dec. 2013Translationdifferences
Changes in the income statement
Changes in compre-hensive income 31 Dec. 2014
Inventories (77) 0 77 0 0
Property, plant and equipment (302) 0 155 0 (147)
Other 327 0 (230) 0 97
Deferred tax liabilities (52) 0 2 0 (50)
Other provisions 27 0 29 0 56
Unused tax losses 7,695 0 (554) 0 7,141
Inventories 252 11 (281) 0 (18)
Operating receivables 940 0 29 0 969
Employee benefits 1,322 0 (27) 0 1,295
Property, plant and equipment 769 0 (653) 0 116
Available-for-sale financial assets (15) 0 0 (20) (35)
Unused tax reliefs 5,501 9 662 - 6,172
Deferred tax assets 16,491 20 (795) (20) 15,696
Deferred tax assets (liabilities), net 16,439 20 (793) (20) 15,646
17. Assets Held for Disposal
in € thousand 31 Dec. 2015 31 Dec. 2014
Assets held for sale 4,142 4,146
Assets held for disposal 4,142 4,146
Under assets held for sale, the Group has lands and buildings (outbuildings and apartments) in Jesenice and Celje. Sales ac-tivities are constantly under way. In 2015, the Group generated €1 thousand in profit from the sale of assets. The assets are not pledged as security for liabilities.
The present value of assets classified as held for sale does not exceed their realizable value.
Inventories, whose present value on 31 December 2015 amounts to €13,638 thousand, are pledged as security for li-abilities. On 31 December 2015 the Group checked the value of the inventories and found that the net realizable value
of finished products is lower that their production value, so made an impairment of the inventories in the amount of €1,473 thousand in 2015.
18. Inventories
in € thousand 31 Dec. 2015 31 Dec. 2014
Raw material 80,065 63,225
Work in progress 68,244 40,582
Finished products 43,871 41,534
Trade goods 16,692 15,293
Inventories 208,872 160,634
in € thousand 31 Dec. 2015 31 Dec. 2014
Other assets 2,932 2,043
Other non-current assets 2,932 2,043
15. Other Non-Current Assets
16. Deferred Tax Assets and Liabilities
in € thousand 31 Dec. 2015 31 Dec. 2014
Deferred tax assets 20,206 15,696
Deferred tax liabilities (35) (50)
Deferred tax assets (liabilities), net 20,171 15,646
Other assets include non-current accrued cost of arrangement fees, emission coupons and cautions. The increase mostly refers to non-current accrued costs of arrangement fees.
On 31 December 2015 the value of unused tax losses for which deferred tax assets are recognized amounted to €48,194 thou-sand. The value of unused tax losses for which deferred tax
assets are not recoginized amounted to €58,324 thousand, while unrecognized deferred tax assets amounted to €9,915 thousand.
Movement of Deferred Tax Assets and Liabilities in 2015
in € thousand
31 Dec. 2014Acquisition of
companyTranslation differences
Changes inthe incomestatement
Changes in comprehensive
income 31 Dec. 2015
Property, plant and equipment (148) (1,209) 0 101 1,175 (81)
Other 97 0 0 (52) 0 45
Deferred tax liabilities (51) (1,209) 0 49 1,175 (36)
Other provisions 56 0 0 (1) 0 55
Unused tax losses 7,141 813 0 1,204 0 9,158
Inventories (18) 0 8 129 0 119
Operating receivables 969 128 0 (136) 0 961
Employee benefits 1,295 322 0 154 0 1,771
Property, plant and equipment 116 - 0 514 0 630
Available-for-sale financial assets (35) 182 0 (182) 0 (35)
Unused tax reliefs 6,173 - 27 1,348 0 7,548
Deferred tax assets 15,697 1,445 35 3,030 0 20,207
Deferred tax assets (liabilities), net 15,646 236 35 3,079 1,175 20,171

< back to content
119
< back to content
special purposefinancial statements
119118
special purposefinancial statements
< back to content
in € thousand 31 Dec. 2015 31 Dec. 2014
Cash in national currency 61,432 34,917
Cash in foreign currency 12,465 3,883
Restricted cash 74 193
Cash and cash equivalents 73,971 38,993
21. Cash and Cash Equivalents
Cash in national and foreign currency includes cash in hand and balances on bank accounts, amounting to €49,441 thousand on 31 December 2015. Deposits in the amount of €24,456 thousand are in the national currency and have a maturity of up to three months. The interest rate for depos-its is fixed.
Restricted cash represents assets on custody account intend-ed for payments of liabilities for the acquisition of a subsidi-ary.
The share capital of the parent company is recognized in the amount of €145,266 thousand and is distributed between 994,616 shares. The face value of each share is €146.05. The number of shares did not change in 2015.
in € thousand 31 Dec. 2015 31 Dec. 2014
Deferred expenses 2,121 1,037
Accrued revenues 432 95
Other current assets 2,553 1,132
22. Other Current Assets
Current deferred expenses refer to advance payments of costs, which in 2016 will debit against profit or loss.
23. Equity
in € thousand 31 Dec. 2015 31 Dec. 2014
Equity attributed to the owners of the parent company 347,758 343,549
Share capital 145,266 145,266
Capital surplus 11,461 11,461
Revenue reserves 129 (859)
Fair value reserves (189) 171
Translation differences 343 33
Retained earnings 190,748 187,477
Non-controlling interest 53,174 4,586
Equity 400,932 348,135
Loans issued include a loan issued to the parent company in the amount of €3,000 thousand. The interest rate for loans issued is mainly fixed.
The majority of the Group’s trade receivables are insured against commercial risks with our insurance company. Trade receiva-bles, whose present value on 31 December 2015 amounts to €49,405 thousand, are pledged as security for liabilities.
The disclosed value of operating receivables does not exceed their realizable value.
19. Current Financial Receivables
in € thousand 31 Dec. 2015 31 Dec. 2014
Loans issued 3,180 47
Interest receivables 237 10
Other 0 1
Current financial receivables 3,417 58
in € thousand 2015 2014
Balance as at 1 Jan. 4,788 4,850
Allowance changes with influence on profit or loss 83 (17)
Allowance changes without influence on profit or loss (2) (61)
Translation differences 15 16
Balance as at 31 Dec. 4,884 4,788
Movement of Allowances for Inventories
in € thousand 2015 2014
Balance as at 1 Jan. 47 15,969
Acquisition of company 27 0
Loans issued 3,224 8,431
Receipt from loans issued (84) (23,772)
Write-off of loans issued (13) (581)
Translation differences (1) 0
Other (20) 0
Balance as at 31 Dec. 3,180 47
in € thousand 31 Dec. 2015 31 Dec. 2014
Trade receivables 135,434 129,060
Allowances for trade receivables (7,712) (4,135)
VAT receivables 6,129 5,173
Issued advance payments and cautions 5,320 5,770
Other operating receivables 5,389 2,562
Current operating receivables 144,560 138,430
Movement of Current Loans Issued
20. Current Operating Receivables

< back to content
121
< back to content
special purposefinancial statements
121120
special purposefinancial statements
< back to content
in € thousand 31 Dec. 2015 31 Dec. 2014
Provisions for severance pay 12,097 8,319
Provisions for loyalty bonuses 2,637 1,995
Provisions for post-employment benefits 177 124
Employee benefits 14,911 10,438
24. Employee Benefits
Distributable Profit
The Group is not a legal entity nor does it hold decision-making rights. Retained earnings and net profit for the financial year of subsidiaries, included in the financial statements, are divided at the level of the respective subsidiaries.
The actuarial calculation was made on the basis of the actuar-ial model and assumptions, derived from life tables, growth in wages in the Republic of Slovenia, and the yield curve, which represents the relationship between market yields on govern-ment bonds in the Eurozone and the time remaining to matu-rity. The observed discounted rate is between 0 and 7 percent, depending on maturity.
Employee benefits are calculated by an authorized actuary. The change in employee benefits had a direct effect on the income statement, except for actuarial losses which decreases the revaluation reserves in equity.
The Group did not carry out an actuarial calculation in 2014.
in € thousand 31 Dec. 2015 31 Dec. 2014
Provisions for environmental rehabilitation 200 200
Provisions for law suits 708 902
Provisions for complaints 571 575
Other provisions 1,479 1,677
Movement of Employee Benefits in 2015
Movement of Other Provisions in 2015
25. Other Provisions
in € thousand31 Dec. 2014
Acquisition of company Formation Reversal Utilization 31 Dec. 2015
Provisions for severance pay 8,319 1,614 2,431 (267) 0 12,097
Provisions for loyalty bonuses 1,995 638 168 (164) 0 2,637
Provisions for post-employment benefits 124 0 84 (18) (13) 177
Employee benefits 10,438 2,252 2,683 (449) (13) 14,911
in € thousand31 Dec. 2014
Acquisition of company Formation
Reversal and utilization 31 Dec. 2015
Provisions for environmental rehabilitation 200 0 0 0 200
Provisions for law suits 902 41 40 (275) 708
Other provisions 575 0 0 (4) 571
Other provisions 1,677 41 40 (279) 1,479
Shareholder Number of shares as at
31 Dec. 2015Number of shares as at
31 Dec. 2014
DILON, d. o. o., Gerbičeva ulica 98, Ljubljana, Slovenia 718,351 718,351
Republic of Slovenia, Gregorčičeva ulica 20, Ljubljana, Slovenia 248,655 248,655
D. P. R., d. d., Koroška cesta 14, Ravne na Koroškem, Slovenia 0 11,468
Stanovanjsko podjetje, d. o. o., Ob Suhi 19, Ravne na Koroškem, Slovenia 0 8,205
SIJ d.d., Gerbičeva ulica 98, Ljubljana, Slovenia 27,600 7,927
UNIOR, d. d., Kovaška cesta 10, Zreče, Slovenia 10 10
Total 994,616 994,616
Ownership Structure of the Parent Company
The ownership structure changed in 2015. The parent company completed the purchase of 11,468 of its own shares from D. P. R., d. d., and 8,205 of it's own shares from Stanovanjsko podjetje, d. o. o., thus increasing the treasury shares by 2.77 percent.
Capital Surplus
Capital surplus in the amount of €11,461 thousand was created during the simplified decrease in the parent company’s capital.
Revenue Reserves
in € thousand 31 Dec. 2015 31 Dec. 2014
Legal reserves 2,384 1,396
Treasury shares (6,009) (2,257)
Reserves for treasury shares 3,754 2
Revenue reserves 129 (859)
The parent company acquired treasury shares in the amount of €2,255 thousand on the basis of the Act Regulating the In-currence and Settlement of Liabilities of Slovenske železarne as regards the Restructuring Programme (Official Gazette of the RS, nr. 111/2001) and in line with the Privatization of Slov-enske železarne Act (Official Gazette of the RS, nr. 13/1998). Treasury shares were acquired by exchanging interests in subsidiaries for shares of the parent company owned by au-thorized companies. The shares were acquired ex lege and
not in line with the Companies Act, which is why the parent company did not establish a treasury shares fund. Shares are recognized at cost.
In 2015 the parent company acquired 19,673 treasury shares on the basis of decisions taken at the 25th General Assem-bly of 9 June 2014, and established reserves in the amount of €3,752 thousand for treasury shares. Shares are recognized at cost.
in € thousand 31 Dec. 2015 31 Dec. 2014
Fair value reserves due to available-for-sale financial assets 373 206
Deferred tax liabilities (35) (35)
Net actuarial losses on pension programs (528) 0
Fair value reserves (189) 171
Fair Value Reserves

< back to content
123
< back to content
special purposefinancial statements
123122
special purposefinancial statements
< back to content
Movement of Non-Current Borrowings
in € thousand 2015 2014
Balance as at 1 Jan. 138,072 155,403
Acquisition of company 21,447 0
Borrowings 171,765 32,883
Repayments for borrowings (34,638) (25,176)
Reclassification to current borrowings (188,818) (25,038)
Reclassification from current borrowings 76,396 0
Exchange rate differences (1) 2
Translation differences 1 (2)
Balance as at 31 Dec. 184,224 138,072
Liabilities for bonds issued
Liabilities for bonds issued refer to the bonds issued with the ticker symbol SIJ4. The bonds were issued by the parent com-pany with a total nominal value of €42,897 thousand. The entire bond issue contains 42,897 denominations of €1 thou-sand. The bond maturity date is 24 November 2019. The in-terest rate for the bonds is fixed, i.e. 4.50 percent per annum. Interest is accrued annually in arrears. The nominal value of the principal falls due, in full and in a single amount, on the maturity of the bond. The bonds have been traded on the Ljubljana Stock Exchange.
Liabilities for bonds issued refer to the bonds issued with the ticker symbol SIJ5. The bonds were issued by the parent company with a total nominal value of €51,218 thousand. The entire bond issue contains 51,218 denominations of €1 thousand. The bond maturity date is 21 July 2020. The inter-est rate for the bonds is fixed, i.e. 4.00 percent per annum. Interest is accrued annually in arrears. The nominal value of the principal falls due, in full and in a single amount, on the maturity of the bond. The bonds have been traded on the Ljubljana Stock Exchange.
The lowest sum of future leases due for payment amounts to €2,301 thousand in the next financial year, €3,857 thousand in 1 to 5 years, and €542 thousand after 5 years.
The net present value of future leases due for payment amounts to €2,107 thousand in the next financial year, €3,651 thousand in 1 and 5 years, and €504 thousand after 5 years.
Movement of Non-Current Liabilities Arising from Finance Lease
in € thousand 2015 2014
Balance as at 1 Jan. 2,413 3,601
Acquisition of company 1,887 0
Liabilities arising from finance lease 2,569 692
Repayments of liabilities arising from finance lease (114) 0
Reclassification to current liabilities arising from finance lease (2,600) (1,880)
Balance as at 31 Dec. 4,155 2,413
Movement of Other Provisions in 2014
in € thousand 31 Dec. 2013 Formation Reversal and utilization 31 Dec. 2014
Provisions for environmental rehabilitation 500 0 (300) 200
Provisions for law suits 1,043 0 (141) 902
Other provisions 320 257 (2) 575
Other provisions 1,863 257 (443) 1,677
in € thousand 31 Dec. 2015 31 Dec. 2014
Assigned contributions 867 866
Other deferred revenues 4,092 0
Non-current deferred revenues 4,959 866
26. Non-Current Deferred Revenues
Movement of Non-Current Deferred Revenues in 2015
Movement of Non-Current Deferred Revenues in 2014
in € thousand 31 Dec. 2013 Formation Reversal and utilization 31 Dec. 2014
Assigned contributions 776 1,377 (1,287) 866
Other deferred revenues 2 57 (59) 0
Non-current deferred revenues 778 1,434 (1,346) 866
in € thousand 31 Dec. 2015 31 Dec. 2014
Borrowings 184,224 138,072
Liabilities for bonds issued 94,115 42,897
Liabilities arising from finance lease 4,155 2,413
Interest liabilities 624 0
Non-current financial liabilities 283,118 183,382
27. Non-Current Financial Liabilities
in € thousand31 Dec. 2014
Acquisition of company Formation
Reversal and utilization 31 Dec. 2015
Assigned contributions 866 0 1,366 (1,365) 867
Other deferred revenues 0 3,651 3,863 (3,422) 4,092
Non-current deferred revenues 866 3,651 5,229 (4,787) 4,959
Borrowings include loans from domestic and foreign banks. Borrowings in the amount of €155,214 thousand are secured by properties, receivables, investments in subsidiaries and in-ventories. Other borrowings are not secured.
The interest rate for the majority of borrowings and liabilities arising from finance lease is flexible and based on EURIBOR.

< back to content
125
< back to content
special purposefinancial statements
125124
special purposefinancial statements
< back to content
The lowest sum of future leases, due for payment in the next financial year, amounts to €2,301 thousand on 31 December 2015, and the net present value of leases amount to €2,107 thousand on the same date.
Movement of Current Liabilities Arising from Finance Lease
in € thousand 2015 2014
Balance as at 1 Jan. 1,737 3,522
Acquisition of company 830 0
Liabilities arising from finance lease 10 0
Payments of liabilities arising from finance lease (3,070) (3,665)
Reclassification from non-current liabilities arising from finance lease 2,600 1,880
Balance as at 31 Dec. 2,107 1,737
in € thousand 31 Dec. 2015 31 Dec. 2014
Liabilities to suppliers 214,291 155,323
Liabilities to employees 5,043 3,946
Received advance payments 1,485 1,515
Tax liabilities 7,726 4,395
Other liabilities 2,279 1,727
Current operating liabilities 230,824 166,906
30. Current Operating Liabilities
in € thousand 31 Dec. 2015 31 Dec. 2014
Accrued customer fees 485 1,121
Accrued expenses for unused annual leave 1,270 933
Accrued expenses for law suits 133 68
Other liabilities 1,923 673
Deferred revenue 156 59
Other current liabilities 3,967 2,854
31. Other Current Liabilities
in € thousand 31 Dec. 2015 31 Dec. 2014
Emission coupons 663 762
Other liabilities 165 152
Non-current operating liabilities 828 914
in € thousand 31 Dec. 2015 31 Dec. 2014
Borrowings 93,688 70,412
Liabilities for commercial papers issued 17,662 0
Interest liabilities 2,601 1,292
Liabilities arising from finance lease 2,107 1,737
Current financial liabilities 116,058 73,441
28. Non-Current Operating Liabilities
29. Current Financial Liabilities
Borrowings include loans from domestic and foreign banks. Borrowings in the amount of €43,194 thousand are secured by properties, receivables and inventories. Other borrowings
are not secured. The interest rate for the majority of borrow-ings and liabilities arising from finance lease is flexible and based on EURIBOR
Liabilities for Commercial Papers Issued
Liabilities for commercial papers amounting to €17,662 thou-sand refer to 12-month commercial papers with the ticker symbol SIK02, issued by the parent company on 18 Decem-ber 2015. The total nominal value of the commercial papers is €17,662 thousand, and covers 17,662 denominations of €1 thousand. The interest rate for a commercial paper is 2.20 per-cent per annum. Commercial papers are a discounted security.
Interest is charged in advance and deducted on payment of a commercial paper in the form of a discount from the nominal value of the commercial paper. Liabilities from commercial pa-pers are payable on 16 December 2016. Commercial papers trading takes place at the Ljubljana Stock Exchange.
Movement of Current Borrowings
in € thousand 2015 2014
Balance as at 1 Jan. 70,412 109,089
Acquisition of company 85,260 0
Borrowings 303,045 237,678
Payments for borrowings (478,103) (302,030)
Reclassification from non-current borrowings 188,818 25,038
Reclassification to non-current borrowings (76,396) 0
Exchange rate differences 6 11
Translation differences 646 626
Balance as at 31 Dec. 93,688 70,412

< back to content
127
< back to content
special purposefinancial statements
127126
special purposefinancial statements
< back to content
Segment Reporting for 2014
in € thousandSteel
Division
Distribution & Processing
DivisionScrap
DivisionManufacturing
Division
Headquarter and other
Services
Transaction between
segments Total
Consolidated financial
statements
Revenues onthe segments
584,063
123,317
98,542
48,092
12,928 0
866,942
-
Eliminations (4,675) (1,472) (14,160) (318) (520) (137,939) (159,084) -
Revenues 579,388 121,845 84,382 47,774 12,408 (137,939) 707,858 707,858
Costs on thesegments
557,129
121,666
97,266
46,128
12,405 0
834,594
-
Eliminations (4,675) (1,472) (14,160) (318) (520) (138,155) (159,300) -
Expenses 552,454 120,194 83,106 45,810 11,885 (138,155) 675,294 675,294
Other operating income (expenses)
(5,031) 130 11
(1,134)
(901)
(57)
(6,982)
(6,979)
Profit (loss) from operation
31,965 1,521 1,265 3,098 1,424 270 39,543 39,543
Net finance income (expenses) (10,334) (1,546) (947) (42) 4 (592) (13,457) (13,457)
Share of profitin associates 600 0 0 0 0 0 600 600
Taxes (1,089) (236) (22) (289) (146) 0 (1,782) (1,782)
Profit (loss) forthe year 21,142 (261) 296 2,767 1,282 (319) 24,907 24,907
Assets on segments 628,872 93,776 29,608 39,445 238,738 (241,178) 789,261 789,261
Liabilities onsegmetns
368,607
75,035
21,454
13,462
55,801
(93,233)
441,126
441,126
33. Contingent Assets and Liabilities
Contingent assets amounted to €37,040 thousand on 31 De-cember 2015 and refer to loans issued and investments al-ready impaired, and received guarantees for the elimination of errors in the warranty period. The Group expects no inflows from received guarantees.
Contingent liabilities amounted to €57,201 thousand on 31 December 2015. They include issued guarentees in the amount of €52,384 thousand guarantees for good work per-formance. The Group expects no outflows from the issued se-curities and guarantees.
32. Segment Reporting
Segment Reporting for 2015
in € thousandSteel
Division
Distribution & Processing
DivisionScrap
DivisionManufacturing
Division
Headquarter and other
Services
Transaction between
segments Total
Combined financial
statements
Revenues onthe segments 542,212 133,929 76,030 47,242 15,624 - 1,063,739
-
Eliminations (571) (1,655) (9,128) (397) (116) (138,354) (150,591) -
Revenues 541,641 132,274 66,902 46,845 15,508 (138,354) 913,148 913,148
Costs on thesegments 524,547 135,715
75,358
46,024
15,912 -
1,039,644
-
Eliminations (571) (1,655) (9,128) (397) (116) (138,354) (150,592) -
Expenses 523,976 134,060 66,230 45,627 15,796 (138,354) 889,052 889,052
Other operating income (expenses) 6,944 (14) 34 829 21,766 (23,700) 10,123
10,123
Profit (loss) from operation 24,609 (1,799) 706 2,047 21,478 (23,700) 34,219 34,219
Net finance income (expenses) (11,280) (1,542) (965) 28 (641) 7 (24,681) (24,681)
Share of profitin associates
25 0 0 0 0 - 25 25
Taxes 1,905 735 22 (120) (722) - 1,434 1,434
Profit (loss) forthe year 15,259 (2,606) (237) 1,955 20,115 (23,693) 10,998 10,998
Assets on segments 659,235 98,287 29,025 40,432 356,691 (364,607) 1,057,918 1,057,918
Liabilities onsegmetns 391,122 80,268 21,175 22,588 155,419 (155,594) 656,986
656,986

< back to content
129
< back to content
special purposefinancial statements
129128
special purposefinancial statements
< back to content
Transactions with the Parent Company
in € thousand 2015 2014
Revenues 20 1,030
in € thousand 31 Dec. 2015 31 Dec. 2014
Receivables 3,022 2
FINANCIAL INSTRUmENTS AND RISKS
Credit Risk
The largest exposure on the reporting date arises from trade receivables, other operating receivables, financial receivables and deposits.
Age Structure of Financial Assets
in € thousand
31 Dec. 2015 Not - overdue
Overdue
TotalUp to 3 monthsFrom 3 months
to 1 yearFrom 1 year
to 3 years Over 3 years
Trade receivables 106,183 15,768 2,908 2,544 319 127,722
Financial receivables and deposits 3,897 0 0 0 0 3,897
Total 110,080 15,768 2,908 2,544 319 131,619
in € thousand
31 Dec. 2014 Not - overdue
Overdue
TotalUp to 3 monthsFrom 3 months
to 1 yearFrom 1 year
to 3 years Over 3 years
Trade receivables 108,482 13,544 1,365 1,359 175 124,925
Financial receivables and deposits 16,320 7 0 0 0 16,327
Total 124,801 13,551 1,365 1,359 175 141,251
Movement of Allowances for Financial Assets
in € thousandAllowance on31 Dec. 2014
Acquisitionof company
Formationof allowancefor the year
Repayment of assets subjectto allowance
Other changes without influence
on profit or lossAllowance on31 Dec. 2015
Trade receivables 4,135 2,446 1,973 (200) (642) 7,712
Financial receivables and deposits
1 509 13 0 (49) 474
Total 4,136 2,955 1,986 (200) (691) 8,186
34. Business Combinations
On 5 March 2015 Noži Ravne acquired a 100 percent share of Ravne Knives (UK) Limited, Ravne Knives UK (North) Lim-ited and Ravne Knives USA INC. In 2015 the Group considered temporary fair values of acquired assets as fair for the initial accounting of the business combination of purchasing the companies.
According to the first paragraph of the IFRS, 3.45, at the initial recognition of business combinations the Group used the
carrying amount of assets, liabilities and potential liabilities of the acquired company as the fair value. The initial recognition will be repeated within twelve months after the acquisition and the recognition will be adjusted accordingly.
The statement of financial position of Ravne Knives (UK) Lim-ited, Ravne Knives UK (North) Limited and Ravne Knives USA INC on the day the Group acquired the controlling interest is given below.
RELATED PARTIES
The related parties are the parent company (including its parent companies and the companies in their groups), subsidiaries, as-sociates, other related parties and the management of companies.
Related Party Transactions Excluded from the Consolidated Financial Statements
in € thousand Fair value Temporary fair value
Assets
Cash and cash equivalents 62 62
Inventories 18 18
Operating receivables 348 348
Equity and liabilities
Operating liabilities 411 411
Net assets 17 17
Acquired net assets 17 -
Acquisition price 207 -
Carrying amount of acquired net assets 17 -
Goodwill 190 -
in € thousand 2015 2014
Revenues/expenses 237,164 159,083
in € thousand 31 Dec. 2015 31 Dec. 2014
Operating receivables/liabilities 90,211 55,101
Financial receivables/liabilities 107,284 49,003
Investments in subsidiaries 225,248 171,214

< back to content
131
< back to content
special purposefinancial statements
131130
special purposefinancial statements
< back to content
Equity Management
The Group monitors the status of overdue receivables on a daily basis, and prepares 3-month plans twice a month with the aim of achieving optimum debt. Larger investments are financed by non-current assets.
Based on the test of the fair value of financial instruments the Group assesses that there are no significant deviations from their carrying amount.
Fair Value Measurements
To determine fair value, the Group, where possible, takes into account the market value of financial instruments. The Group begins measuring the financial assets in the valuation model when it is estimated that the market is inactive. In accord-ance with the IFRS and accounting policies, the Group divides financial instruments into three levels.
Level 1 includes financial instruments whose fair value is fully determined on the basis of prices quoted in an active market.
Level 2 includes financial instruments whose fair value is de-termined on the basis of valuation models which take into ac-count variables that are derived on the basis of publicly avail-able market data (such as market interest rates).
Level 3 includes financial instruments whose fair value is de-termined on the basis of valuation models which take into account subjective variables, which are not publicly available on the market.
in € thousand 2015 Debt increase by 10% Debt decrease by 10%
Level of debt on equity 99.56 109.52 89.61
Equity 400,932 400,932 400,932
Financial liabilities 399,176 439,094 359,258
Carrying Amounts and Fair Values of Financial Instruments
in € thousand
Type of financial instrument
31 Dec. 2015 31 Dec. 2014
Carrying amount Fair value Carrying amount Fair value
Available-for-sale financial assets 1,161 1,161 906 906
Financial receivables 3,875 3,875 161 161
Operating receivables 146,667 146,667 142,364 142,364
Cash and cash equivalents 73,971 73,971 38,993 38,993
Financial liabilitites (399,176) (399,176) (256,823) (256,823)
Operating liabilities (231,652) (231,652) (167,819) (167,819)
Total (405,154) (405,154) (242,218) (242,218)
in € thousand 31 Dec. 2015 31 Dec. 2014
Financial assets at fair value of the first level 614 616
Financial assets at fair value of the third level 48,794 451
Financial liabilities at fair value of the third level 399,176 256,823
in € thousandAllowance on31 Dec. 2013
Formationof allowancefor the year
Repayment of assets subject to
allowance
Other changes without influence
on profit or lossAllowance on31 Dec. 2014
Trade receivables 4,726 1,104 (268) (1,428) 4,134
Financial receivables and deposits 1 0 0 0 1
Total 4,727 1,104 (268) (1,428) 4,135
Liquidity Risk
The Group is managing liquidity risk by the appropriate planning of cash flow and current credit lines from banks agreed in advance, which ensures that the Group is capable of settling any overdue liabilities at any time.
Exposure to banks is assessed as moderate. The Group fully complies with the conditions stated in loan contracts in the section defining the disclosure of data, payment of interest and repaying the principal value.
Foreign Exchange Risk
Foreign exchange risks arise from transactions in currencies other than the local currency of the company. The group has a minimum exposion to risk, as in most of the Group companies operate in their functional currencies. Group estimate risk as low.
Interest Rate Risk
A change in interest rate by 100 or 200 basis points on the reporting date would result in an increase (decrease) of profit or loss by the amounts stated below. The analysis assumes that all other variables, in particular exchange rates, remain unchanged. The analysis for 2014 was prepared in the same manner:
in € thousand 31 Dec. 2015 Up to 3 months
From 3 months to 1 year
From 1 year to 5 years Over 5 years Total
Liabilities to suppliers 207,785 6,278 228 0 214,291
Borrowings 42,809 80,641 296,441 10,681 430,572
Other operating and financial liabilities 7,899 84 9,309 0 17,292
Total 258,493 87,003 305,978 10,681 662,155
in € thousand 31 Dec. 2014 Up to 3 months
From 3 months to 1 year
From 1 year to 5 years Over 5 years Total
Liabilities to suppliers 150,937 4,386 0 0 155,323
Borrowings 30,756 46,821 189,897 21,484 288,958
Other operating and financial liabilities 1,718 145 914 0 2,777
Total 183,411 51,352 190,811 21,484 447,058
in € thousand 2015 2014
Change in profit/loss if increased by 200 bp (4,550) (3,705)
Change in profit/loss if increased by 100 bp (2,275) (1,852)
Change in profit/loss if decreased by 100 bp 2,275 1,852
Change in profit/loss if decreased by 200 bp 4,550 3,704

< back to content
133
< back to content
special purposefinancial statements
133132
special purposefinancial statements
< back to content
EVENTS AFTER THE REPORTING DATE
At the beginning of 2016 the subsidiary Noži Ravne received appropriate approval from the Slovenian Competition Protec-tion Agency to complete the takeover procedure of Sistemska tehnika d. o. o. The company changed its name to Ravne Sys-tems d. o. o. on 18 January 2016. At the same time intensive activities were carried out for a merger of the (former) Sis-temska tehnika d. o. o., Noži Ravne d. o. o. and Serpa d. o. o.The companies currently operate as an independent legal en-tity. A definitive merger in Ravne Systems d. o. o. is planed by the Group in the coming months.
A takeover bid to buy shares of Holding PMP, naložbena dejavnost, d. d., Vinarski trg 1, 2250 Ptuj, published by the parent company on 4 December 2015, ended on 2 February 2016. During the duration of the takeover bid from (and in-cluding) 5 December 2015 up to (and including) 2 February 2016, the offer was accepted by 28 acceptors, who jointly held 33,673 shares in the target company with the ticker symbol PMPG, constituting 43.81 percent of all shares in the target company. Together with the 43,197 shares in Holding PMP d. d., held by the parent company on the date of pub-lication of the takeover bid, the parent company acquired all 76,870 issued shares or 100 percent of Holding PMP d. d. on 11 February 2016, by rebooking the shares.
On 2 March 2016 a takeover procedure to buy shares in PE-RUTNINA PTUJ reja perutnine, proizvodnja krmil, perutnin-skega mesa in izdelkov, trgovina in storitve d. d., Potrčeva ce-sta 10, 2250 Ptuj, ended successfully; the offer was published on 24 December 2015. During the duration of the takeover bid from (and including) 28 December 2015 up to (and includ-ing) 25 February 2016, the offer was accepted by 2,348 ac-ceptors, who jointly held 2,846,733 shares in the target com-pany with the symbol PPTG, constituting 26.09 percent of all shares of the target company. Together with 5,000,000 shares in Perutnina Ptuj d. d., held by the parent company on the date of publication of the takeover bid, and 603,184 shares in the target company, held by Holding PMP d. d. on the date of publication of the takeover bid, amounting to 5,603,184 shares in Perutnina Ptuj d. d., held directly or indirectly by the acquirer on the date of publication of the takeover bid, the parent company now holds 8,449,917 shares, constitut-ing 77.43 percent of all issued shares in PERUTNINA PTUJ d. d.

135134
financial reportGroup
financial reportGroup
FINANCIAL REPORT SIJ GROUP
Responsible and diligent.
we achieve our objectives
through prudent investment
and financial policies.
Zdenka Noč2014 Employee of the YearHead of Financial Operations,Acroni
< back to content

137136
financial reportGroup
financial reportGroup
< back to content

< back to content
139138
financial reportGroup
financial reportGroupCONSOLIDATED FINANCIAL
STATEmENTS
CONSOLIDATED STATEmENT OF COmPREHENSIVE INCOmE
The notes to the financial statements are an integral part of the consolidated financial statements and should be read in conjunction with them.
STATEmENT OFmANAGEmENT'SRESPONSIBILITy
The Board of Directors is responsible for drawing up consoli-dated financial statements for each individual financial year, according to the International Financial Reporting Standards (IFRS) adopted by the European Union and the Companies Act, so that they give a true and fair view of the SIJ Group’s operations.
The Board of Directors legitimately expects the Group to have enough resources in the foreseeable future to enable it to continue its operations. The consolidated financial state-ments are therefore based on the premise that the Group will continue its operations without a set time limit.
The responsibility of the Board of Directors in drawing up the consolidated financial statements includes the following: • Properly selected and consistently applied accounting policies;• Reasonable and rational assessments and estimates;• Assurance that the consolidated financial statements have
been compiled in accordance with the IFRS adopted by the European Union. Any significant deviations are disclosed and explained in the report.
The Board of Directors is responsible for keeping correspond-ing records, which give a clear and accurate picture of the Group’s financial position at any given time, and for making sure that the consolidated financial statements of the Group are in accordance with the IFRS, adopted by the European Union. The Board of Directors is also responsible for protect-ing the Group’s assets, as well as discovering and preventing abuses and other irregularities.
The tax authorities can inspect the operations of the individ-ual company in the Group at any time within 5 years after the end of the year in which the tax assessment should be made. This can result in the occurrence of additional tax liabilities, default interests and fines based on corporate income tax or other taxes and duties. No circumstance which could result in possible liability in this way is known to the Board Of Direc-tors.
The Board Of Directors declares that the consolidated finan-cial statements have been compiled in accordance with the IFRS adopted by the European Union, without reservations about their application.
The Board of Directors approved the consolidated financial statements, accounting policies and notes on 4 March 2016.
President of the Board of DirectorsAnton Chernykh
Member of the Board of DirectorsIgor Malevanov
in € thousand Note 2015 2014
Revenue 1 664,817 707,858
Cost of sales 2 (551,438) (584,971)
Gross profit 113,379 122,887
Distribution costs 2 (39,542) (40,155)
General and administrative expenses 2 (56,355) (50,168)
Other operating income 3 8,173 8,942
Other operating expenses 4 (2,314) (1,963)
Operating profit 23,341 39,543
Finance income 5 672 1,636
Finance expenses 6 (15,065) (15,093)
Net finance costs (14,393) (13,457)
Share of profit in associates 12 25 600
Profit before taxation 8,973 26,686
Income tax expense 7 (1,431) (988)
Deferred income tax 7 3,251 (794)
Profit for the year 10,793 24,904
Items that will not be reclassified subsequently to profit or loss
Income tax related to components of comprehensive income 1 (20)
Net actuarial losses on pension programs (550) 0
Items that may be reclassified subsequently to profit or loss
Change in fair value reserves for available-for-sale financial assets (3) 120
Exchange rate difference on translating foreign operations 161 68
Comprehensive income 10,402 25,072
Profit (loss), attributed to: 10,793 24,904
Owners of the parent company 11,283 24,858
Non-controlling interest (490) 46
Basic and diluted earnings per share (in EUR) 8 11.62 25.19
Comprehensive income, attributed to: 10,402 25,072
Owners of the parent company 10,932 25,089
Non-controlling interest (530) (17)

< back to content
141140
financial reportGroup
financial reportGroupCONSOLIDATED STATEmENT OF CHANGES IN EQUITy
Consolidated Statement of Changes in Equity in 2015
Consolidated Statement of Changes in Equity in 2014
in € thousand
Equity attributed to the owners of the parent company Non-controlling
interest TotalShare
capitalCapital surplus
Revenue reserves
Fair value reserves
Translation differences
Retainedearnings Total
Balance as at 31 Dec. 2014 145,266 11,461 (859) 171 33 187,477 343,549 4,586 348,135
Covering loss 0 0 0 0 0 0 0 1 1
Purchase of treasury shares 0 0 (3,752) 0 0 0 (3,752) 0 (3,752)
Dividends paid 0 0 0 0 0 (5,810) (5,810) (257) (6,067)
Creation of legal reserves 0 0 988 0 0 (988) 0 0 0
Decrease in non-controlling interest 0 0 0 0 0 (3) (3) 2 (1)
Total transactionswith owners 0 0 (2,764) 0 0 (6,801) (9,565) (254) (9,819)
Profit (loss) for the year 0 0 0 0 0 11,283 11,283 (490) 10,793
Other changes incomprehensive income 0 0 0 (540) 188 0 (352) (40) (392)
Total changes incomprehensive income 0 0 0
(540)
188 11,283 10,931
(530)
10,401
Creation of reserves for treasury shares 0 0
3,752 0 0 (3,752) 0 0 0
Total changes in equity 0 0 3,752 0 0 (3,752) 0 0 0
Balance as at 31 Dec. 2015 145,266 11,461 129 (369) 221 188,207 344,915 3,802 348,717
in € thousand
Equity attributed to the owners of the parent company Non-controlling
interest TotalShare
capitalCapital surplus
Revenue reserves
Fair value reserves
Translation differences
Retainedearnings Total
Balance as at 31 Dec. 2013 145,266 11,461 (859) 71 (98) 162,968 318,809 4,776 323,585
Covering loss 0 0 0 0 0 0 0 2 2
Purchase of treasury shares 0 0
(2) 0 0 0 (2) 0
(2)
Transactions with owners 0 0 0 0 0 (522) (522) 0
(522)
Decrease in non-controlling interest 0 0 0 0 0 175 175
(175) 0
Total transactionswith owners 0 0 (2) 0 0 (347) (349)
(173)
(522)
Profit for the year 0 0 0 0 0 24,858 24,858 46 24,904
Other changes incomprehensive income 0 0 0
100
131 0 231
(63)
168
Total changes incomprehensive income 0 0 0
100
131 24,858 25,089
(17)
25,072
Creation of reservesfor treasury shares 0 0
2 0 0 (2) 0 0 0
Total changes in equity 0 0 2 0 0 (2) 0 0 0
Balance as at 31 Dec. 2014 145,266 11,461 (859) 171 33 187,477 343,549 4,586 348,135
CONSOLIDATED STATEmENT OF FINANCIAL POSITION
in € thousand Note 31 Dec. 2015 31 Dec. 2014
ASSETS
Non-current assets 523,188 445,283
Intangible assets 9 28,075 24,806
Property, plant and equipment 10 424,054 398,082
Investment property 192 207
Investments in associates 11 1,573 1,548
Available-for-sale financial assets 12 45,219 906
Financial receivables 103 103
Operating receivables 13 2,072 1,892
Other assets 14 2,932 2,043
Deferred tax assets 15 18,967 15,696
Current assets 340,507 343,978
Assets held for disposal 16 4,142 4,146
Inventories 17 171,342 160,634
Financial receivables 18 3,188 58
Operating receivables 19 114,281 138,430
Income tax assets 691 585
Cash and cash equivalents 20 44,587 38,993
Other assets 21 2,277 1,132
Total assets 863,695 789,261
EQUITY AND LIABILITIES
Equity 22 348,717 348,135
Equity attributed to the owners of the parent company 344,915 343,549
Share capital 145,266 145,266
Capital surplus 11,461 11,461
Revenue reserves 129 (859)
Fair value reserves (369) 171
Translation differences 221 33
Retained earnings 188,207 187,477
Non-controlling interest 3,802 4,586
Non-current liabilities 236,683 197,327
Employee benefits 23 12,260 10,438
Other provisions 24 1,445 1,677
Deferred revenues 25 927 866
Financial liabilities 26 221,198 183,382
Operating liabilities 27 818 914
Deferred tax liabilities 15 35 50
Current liabilities 278,295 243,799
Financial liabilities 28 98,231 73,441
Operating liabilities 29 177,722 166,906
Income tax liabilities 767 598
Other liabilities 30 1,575 2,854
Total equity and liabilities 863,695 789,261 The notes to the financial statements are an integral part of the consolidated financial statements and should be read in conjunction with them.
The notes to the financial statements are an integral part of the consolidated financial statements and should be read in conjunction with them.

< back to content
143142
financial reportGroup
financial reportGroupNOTES TO THE
CONSOLIDATED FINANCIAL STATEmENTS
CONSOLIDATED CASH FLOw STATEmENT
in € thousand Note 2015 2014
Cash flow from operating activities
Profit before taxation 8,973 26,686
Adjusted for:
Depreciation and amortisation 9, 10 40,168 38,289
Share of profit in associates 11 (25) (600)
Interest income 5 (232) (1,319)
Interest expenses 6 11,355 12,092
Exchange rate differences, net 4 (13)
Loss in investment sales 1 1
Impairment of assets 4 533 583
Creation of allowances and provisions 995 481
Other adjustments 1,884 631
Operating cash flow before changes in working capital 63,656 76,831
Changes in working capital
Change in operating receivables 28,734 (5,903)
Change in inventories (12,390) (7,541)
Change in operating payables (17,207) 20,316
Change in taxes other than income tax 307 614
Payments for disposal of provisions (831) (924)
Receipts from government grant 402 481
Income tax paid (1,367) (555)
Other receipts (payments) 1 (521)
Changes in working capital (2,351) 5,967
Net cash generated from operating activities 61,305 82,798
Cash flow from investing activities
Payments for investments in subsidiaries (146) (82)
Payments for available-for-sale financial assets (44,320) 0
Payments for property, plant and equipment (42,746) (54,043)
Receipts from property, plant and equipment 314 302
Payments for intangible assets (4,575) (3,628)
(Payments) receipts from other assets (3,744) 1,190
Payments for loans issued 18 (3,224) (8,431)
Receipts from loans issued 18 99 23,772
Interests received 194 1,983
Dividends received 12 87 56
Net cash used in investing activities (98,061) (38,881)
Cash flow from financing activities
Receipts from borrowings 26, 28 553,394 313,472
Payments for borrowings 26, 28 (492,127) (327,205)
Payments for finance lease 26, 28 (2,270) (3,665)
Interests paid (10,802) (12,424)
Dividends paid 22 (5,811) 0
Net cash generated (used) in financing activities 42,384 (29,822)
Cash and cash equivalents as at 1 Jan. 38,993 24,910
Translation differences (34) (12)
Increase 5,628 14,095
Cash and cash equivalents as at 31 Dec. 44,587 38,993
The notes to the financial statements are an integral part of the consolidated financial statements and should be read in conjunction with them.
REPORTING ENTITy
SIJ – Slovenska industrija jekla, d.d. (hereinafter: SIJ or the Company) is a Company with its registered office in Slovenia. Its registered address is Gerbičeva ulica 98, 1000 Ljubljana. Given below are the consolidated financial statements for the year ending as at 31 December 2015.
The consolidated financial statements for a selected group of subsidiaries are compiled by SIJ – Slovenska industrija jekla, d.d. Consolidated financial statements for a wider group of subsidiaries are compiled by DILON Cooperatief U. A. The consolidated annual report for DILON Cooperatief Group is available at the registered office of DILON Cooperatief U. A.,Luna Arena, Herikerbergweg 238, 1101 CM AmsterdamZuidoost, Amsterdam, the Netherlands.
BASIS OF PREPARATION
The consolidated financial statements for 2015 have been pre-pared in accordance with the IFRS as adopted by the European Union. The standards have been applied directly in the disclo-sures and valuation of items; the exception is the valuation of items for which the standards allow several methods of valuation.
The consolidated financial statements in the report are ex-pressed in € thousands. Due to the rounding off of value amounts, there may be insignificant deviations from the sums given in the tables.
In the selection of accounting principles and their application, as well as in the preparation of these consolidated financial statements, the Board of Directors considered the following three requirements: the consolidated financial statements are comprehensible if users can understand them without difficul-ty; the information is adequate, if it helps users make economic decisions; and the information is fundamental if its exclusion or false presentation could influence users’ economic decisions.
The consolidated financial statements have been prepared in compliance with the IFRS, adopted by the International Ac-counting Standards Board (hereinafter: IASB), and with the in-terpretations issued by the International Financial Reporting Interpretations Committee (hereinafter: IFRIC), as adopted by the European Union, namely:
a) Currently applicable standards and interpretations
The following amendments to the existing standards issued by the IASB and adopted by the EU currently apply:
• Amendments to various standards “Improvements to IFRSs (cycle 2011–2013)” resulting from the annual improvement project of IFRS (IFRS 3, IFRS 13 and IAS 40) primarily with a view to removing inconsistencies andclarifying wording adopted by the EU on 18 December 2014 (amendments are to be applied for annual periods beginning on or after 1 January 2015),
• IFRIC 21 “Levies” adopted by the EU on 13 June 2014 (effective for annual periods beginning on or after17 June 2014).
The adoption of these amendments to the existing standards had no effect on the accounting policies of the Group.
b) Standards and interpretations issued by IASB and adop-ted by the European Union, but not yet effective
On the date of approval of the consolidated the financial statements following standards, amendments and interpreta-tions adopted by the European Union were issued, but not yet effective:
• Amendments to IFRS 11 “Joint Arrangements” – Accountingfor Acquisitions of Interests in Joint Operations – adopted by the EU on 24 November 2015 (effective for annualperiods beginning on or after 1 January 2016),
• Amendments to IAS 1 “Presentation of Financial State-ments” – Disclosure Initiative – adopted by the EU on18 December 2015 (effective for annual periods beginning on or after 1 January 2016),
• Amendments to IAS 16 “Property, Plant and Equipment” and IAS 38 “Intangible Assets” – Clarification of Acceptable Methods of Depreciation and Amortisation – adopted by the EU on 2 December 2015 (effective for annual periods beginning on or after 1 January 2016),
• Amendments to IAS 16 “Property, Plant and Equipment” and IAS 41 “Agriculture” – Agriculture: Bearer Plants – adopted by the EU on 23 November 2015 (effective for annual periods beginning on or after 1 January 2016),
• Amendments to IAS 19 “Employee Benefits” – Defined Benefit Plans: Employee Contributions – adopted by the EU on 17 December 2014 (effective for annual periods beginning on or after 1 February 2015),
• Amendments to IAS 27 “Separate Financial Statements” – Equity Method in Separate Financial Statements – adopted by the EU on 18 December 2015 (effective for annual peri-ods beginning on or after 1 January 2016),
• Amendments to various standards “Improvements to IFRSs (cycle 2010–2012)” resulting from the annual improve-ment project of IFRS (IFRS 2, IFRS 3, IFRS 8, IFRS 13, IAS 16, IAS 24 and IAS 38) primarily with a view to removing

< back to content
145144
financial reportGroup
financial reportGroup
inconsistencies and clarifying wording – adopted by the EU on 17 December 2014 (amendments are to be applied for annual periods beginning on or after 1 February 2015),
• Amendments to various standards “Improvements to IFRSs (cycle 2012–2014)” resulting from the annual improvement project of IFRS (IFRS 5, IFRS 7, IAS 19 and IAS 34) primarilywith a view to removing inconsistencies and clarifying wording – adopted by the EU on 15 December 2015 (amendments are to be applied for annual periods begin-ning on or after 1 January 2016).
The Group decided not to apply these standards, amendments and interpretations before their entry into force. The Group assesses that the adoption of these standards, amendments and interpretations will not have any significant effect on the consolidated financial statements at their first application.
c) Standards and interpretations issued by IASB, but not yet adopted by the EU
Currently there is no significant difference between the IFRS adopted by the EU and the regulations adopted by the IASB, with the exception of the following standards, amendments to the existing standards and interpretations, which had not yet been approved for use on 4 March 2016:
• IFRS 9 “Financial Instruments” (effective for annual periods beginning on or after 1 January 2018),
• IFRS 14 “Regulatory Deferral Accounts” (effective for annual periods beginning on or after 1 January 2016) – the European Commission has decided not to launch the endorsement process of this interim standard and to wait for the final standard,
• IFRS 15 “Revenue from Contracts with Customers” and further amendments (effective for annual periods begin-ning on or after 1 January 2018),
• IFRS 16 “Leases” (effective for annual periods beginning on or after 1 January 2019),
• Amendments to IFRS 10 “Consolidated Financial State-ments”, IFRS 12 “Disclosure of Interests in Other Entities” and IAS 28 “Investments in Associates and Joint Ventures” – Investment Entities: Applying the Consolidation Excep-tion (effective for annual periods beginning on or after1 January 2016),
• Amendments to IFRS 10 “Consolidated Financial State-ments” and IAS 28 “Investments in Associates and Joint Ventures” – Sale or Contribution of Assets between an Investor and its Associate or Joint Venture and further amendments (effective date was deferred indefinitely until a research project on the equity method has been concluded),
• Amendments to IAS 12 “Income Taxes” – Recognition of Deferred Tax Assets for Unrealised Losses (effective forannual periods beginning on or after 1 January 2017).
The Group assesses that the adoption of these standards, amendments to the existing standards and interpretations will not have any significant effect on the consolidated financial statements at their first application. At the same time the ac-counting of hedging instruments in connection with the port-folio of financial assets and liabilities, the principles of which the EU has not yet adopted, is still unregulated. The Group assesses that the use of accounting of hedging instruments in connection with financial assets and liabilities, in accordance with the requirements of IAS 39: "Financial Instruments: Re-cognition and Measurement”, would not have a significant influence on the consolidated financial statements, if it was used on the date of the statement of financial position.
BASIS OF mEASUREmENT
The consolidated financial statements have been prepared based on historical cost, except for the following assets and liabilities, measured at their fair value:
• financial assets at fair value through profit or loss, • available-for-sale financial assets.
FUNCTIONAL AND PRESENTATION CURRENCy
The consolidated financial statements in this report are pre-sented in € thousands; the euro is also the functional currency of the Group’s controlling company, which compiles the con-solidated financial statements.
APPLICATION OF ESTImATES AND JUDGmENTS
The preparation of the consolidated financial statements re-quires the Board of Directors to make estimates, judgments and assumptions which influence the disclosed amounts of assets and liabilities, the disclosed contingent assets and li-abilities on the day of the preparation of the consolidated financial statements, and the disclosed amounts of income and expenses during the reporting period.
Estimates and assumptions are included in at least the follo-wing judgments:
in € thousand
Activity% of voting
rights
Value ofassets as at
31 Dec. 2015
Value ofequity as at
31 Dec. 2015Net profit
2015
Parent company of the Group
SIJ – Slovenska industrija jekla, d.d.,Gerbičeva ulica 98, Ljubljana, Slovenia Activities of head offices 350,813 191,403 19,752
SIJ – subsidiaries
ACRONI, d. o. o., Cesta Borisa Kidriča 44, Jesenice, Slovenia Steel production 100 430,666 173,356 4,793
METAL RAVNE d. o. o., Koroška cesta 14,Ravne na Koroškem, Slovenia Steel production 100 227,660 93,472 10,534
NOŽI RAVNE d. o. o., Koroška cesta 14,Ravne na Koroškem, Slovenia
Industrial knivesproduction 100 21,880 8,739 1,718
ELEKTRODE JESENICE d. o. o., Cesta železarjev 8,Jesenice, Slovenia
Welding materialsproduction 100 10,167 5,494 (210)
SUZ, d. o. o., Cesta Borisa Kidriča 44, Jesenice, Slovenia Drawn wires production 100 3,809 1,413 270
ZIP CENTER d. o. o., Koroška cesta 14,Ravne na Koroškem, Slovenia
Education and trainingof the disabled 100 1,733 389 131
ODPAD d. o. o. Pivka, Velika Pristava 23, Pivka, SloveniaRecovery of secondary raw materials from scrap 74.90 26,641 6,983 162
NIRO Wenden GmbH, Glück-Auf-Weg 2, Wenden, GermanySteel cutting, engineering and trade 85 14,691 1,224 (2,108)
RAVNE STEEL CENTER d. o. o., Litostrojska cesta 60,Ljubljana, Slovenia Trade 77.28 26,858 14,647 1,252
GRIFFON & ROMANO S.P.A., Via Dossetti 11,Loc. Casinello de Dosso, Italy
Heat processing and special steel trade 100 23,652 847 (1,769)
SIJ Asia Gmbh, Berger Str. 2, 40213 Düsseldorf, Germany Trade 100 288 189 89
ACRONI – subsidiaries
ŽELEZARNA JESENICE, d. o. o., Cesta železarjev 8,Jesenice, Slovenia
Trading with ownreal estate 100 10,086 9,547 232
COmPOSITION OF THE GROUP OF RELATED PARTIES
The consolidated financial statements of the SIJ Group include the financial statements of the parent company and the financial statements of the companies of the SIJ Group.
The group of companies in which the parent company holds financial investments includes the following:
• estimate of the useful life of assets subject to depreciation,• impairment test of assets,• estimate of the fair value of available-for-sale financial
assets,• estimate of the fair value of financial assets measured at
fair value through profit or loss,• estimate of the net realizable value of inventories, • estimate of the collectible amount of receivables,• estimate of the created provisions,• estimate of the possibility for realization of deferred
tax assets.
Since estimates are subject to subjective judgments and a level of uncertainty, the subsequent actual results can differ from those estimated. Estimates are reviewed on an ongoing basis. Amendments to the accounting estimates are recog-nized during the period in which the estimates were revised if the amendment only applies to this period, or during the period of the amendment and future periods if the amend-ment applies to future periods.
Continuation of the table on page 18 >>

< back to content
147146
financial reportGroup
financial reportGroup
in € thousand
Activity% of voting
rights
Value ofassets as at
31 Dec. 2015
Value ofequity as at
31 Dec. 2015Net profit
2015
METAL RAVNE – subsidiaries
KOPO International Inc., New Jersey, USA Trade 100 22,364 1,763 (86)
SERPA d. o. o., Koroška cesta 14, Ravne na Koroškem,Slovenia
Metallurgic machines production 89.73 4,767 2,198 176
ODPAD – subsidiaries
DANKOR, d. o. o., Europske avenije 22, Osijek, CroatiaRecovery of secondary raw materials from scrap 51 1,660 293 (232)
METAL-EKO SISTEM DOO JAGODINA, Put Kneza Mihaila 107, Jagodina, Serbia
Recovery of secondary raw materials from scrap 70 4,415 1,930 (91)
Topmetal d. o. o., Laktaši, Bosnia and HerzegovinaRecovery of secondary raw materials from scrap 51 1,562 811 (75)
Ravne Steel Center – subsidiaries
SIDERTOCE S. p. A., Via XX. Settembre 198, C. P. 34,Gravellona Toce, Italy Trade 100 13,401 2,956 429
Ravne Steel Deutschland Gmbh, Celsiusstrasse 17, Germany Trade 100 417 (107) (205)
NOŽI RAVNE – subsidiaries
Ravne Knives (UK) Limited, 12 Conqueror Court,Sittingbourne, Kent, ME10 5BN, Great Britain Trade 100 310 (102) (125)
Ravne Knives UK (North) Limited , 12 Conqueror Court,Sittingbourne, Kent, ME10 5BN, Great Britain Trade 100 9 6 (1)
Ravne Knives USA Inc., 2711 Centerville Road, Suite 400, Wilmington, Country of New Castle, Delaware 19808, USA Trade 100 90 (96) (95)
SIJ Asia – subsidiaries
SIJ Steel (Shanghai) Co., Ltd., Rm.320, 2449 Gonghexin Road, Zhabei District, Shanghai 200072, China Trade 100 12 12 0
Continuation of the table
SIGNIFICANT ACCOUNTING POLICIES
Subsidiaries
Subsidiaries are entities controlled by the Group. Controlexists where the Group has the power to govern the financial and operating policies of a company so as to obtain bene-fits from its activities. The financial statements of the sub-sidiaries are included in the Group’s consolidated financial statements from the date on which control commences until the date that control ceases. The accounting policies of the sub-sidiaries are aligned with the Group’s accounting policies.
On loss of control, the Group de-recognizes the assets and liabilities of the subsidiary, any non-controlling interests, and any other components of the equity related to the subsidiary. Any surplus or deficit arising on loss of control is recognized in profit or loss. If the Group retains any interest in the previous subsidiary, such interest is measured at fair value from the date on which control is lost. Subsequently, this interest is ac-counted for in equity as an investment in an associate (using
the equity method) or as an available-for-sale financial asset, depending on the level of influence retained.
Intra-group balances and any gains and losses arising from intra-group transactions are eliminated in preparing the con-solidated financial statements. Unrealized gains arising from transactions with associates (accounted for using the equity method) are eliminated to the extent of the Group’s interest in the entity. Unrealized losses are eliminated using the same method, provided there is no evidence of impairment.
Investments in associates
Investments in associates are accounted on the basis of the equity method. Associates are those companies where the Group has a significant influence on their operations, but which it does not control.
Upon initial recognition, investment in associates are mea-sured at cost, but are subsequently accounted for using the equity method. The Group’s consolidated financial state-ments include the Group’s share of the profit and loss of equity-accounted associates, after adjustments to align the accounting policies, from the date on which significant in-fluence commences until the date that significant influence ceases. When the Group’s share of losses of an associate ex-ceeds its interest in such an entity, the carrying amount of the Group’s interest is reduced to zero and recognition of further losses is discontinued.
Transactions with Non-Controlling Interests
The Group measures goodwill at the fair value of the consid-eration transferred, plus the recognised amount of any non-controlling interest in the acquisition, plus the fair value of any pre-existing equity in the acquisition (if the business combi-nation is achieved in stages), less the net recognized amount of the assets acquired and liabilities assumed, all measured as at the acquisition date. When the excess is negative, the effect is recognized immediately in profit or loss.
Acquisition costs, other than those associated with the issue of equity or debt securities, incurred in connection with a business combination, are listed as incurred expenses.
The Group accounts for the acquisition of non-controlling inter-ests that do not involve a change in control of a company as tran-sactions with owners, and therefore no goodwill is recognized.
Adjustments to non-controlling interests are based on a pro-portionate amount of the assets of the subsidiary. Any sur-
plus, or the difference between the costs of additional invest-ments and the carrying amount of assets, are recognized in equity.
Foreign Currency Conversion
Transactions in foreign currencies are translated into the functional currency at the exchange rate on the date of the transaction. Cash assets and liabilities denominated in for-eign currency at the end of the period are translated into the functional currency at the then valid exchange rate. Positive or negative exchange rate differences are the differences be-tween the amortised cost in functional currency at the begin-ning of the period, adjusted by the amount of the effective interest rate and the payments during the period, and the amortised cost in foreign currency, calculated at the exchange rate at the end of the period. Non-cash assets and liabilities, denominated in foreign currency and measured at fair value, are translated to the functional currency at the exchange rate on the date when the fair value is set. Exchange rate diffe-rences are recognized in profit or loss.
Income statements and cash flow statements of individual companies of the Group abroad, where the company’s func-tional currency is not the euro, are translated to the control-ling company’s reporting currency at the average exchange rate, whereas the statements of financial position are trans-lated to the reporting currency at the exchange rate on the reporting date.
Foreign exchange differences are recognized in comprehen-sive income and presented under translation differences in equity. In the case of non-wholly-owned subsidiaries abroad, the relevant proportion of the foreign exchange differences is allocated to non-controlling interests. When a foreign op-eration is disposed of in such a way that control or signifi-cant influence is lost, the relevant cumulative amount in the translation reserve is reclassified to profit or loss or as gain or loss on disposal. When the Group disposes of only part of its interest in a subsidiary that includes a foreign operation while retaining control, the relevant proportion of the cumulative amount is reattributed to non-controlling interests.
Revenues
Sales revenues are recognized at fair value of received repay-ments or receivables, decreased by repayments, discounts, rebates for further sales and quantity discounts. Revenues are recognized when the buyer assumes all significant risks and benefits connected to the asset’s ownership, and it is cer-tain that compensation and related costs will be repaid
In March 2015 Noži Ravne acquired the companies Ravne Knives (UK) Limited, Ravne Knives UK (North) Limited and Ravne Knives USA INC. Up to the date of the drawing up of the financial statements these companies had had no significant influence on the Group.
In September 2015 SIJ Asia Gmbh established a new sub-sidiary, SIJ Steel (Shanghai) Co., China. The company did not begin to operate in 2015.
The financial statements of the companies included in the consolidated financial statements are audited, except for the financial statements of those companies which are not obliged to be audited according to local legislation or had not begun to operate by the reporting date. These are Ravne Steel Deutschland Gmbh, SIJ Asia Gmbh, Steel (Shanghai) Co., Ravne Knives (UK) Limited, Ravne Knives UK (North) Limited and Ravne Knives USA.

< back to content
149148
financial reportGroup
financial reportGroup
or there is a possibility of returning products, and when the Group ceases to make decisions about sold products.
Financial income comprises interest income and positive ex-change rate differences resulting from financing and invest-ing. Interest income is recognized upon its occurrence, using the effective interest rate method.
Expenses
Expenses are recognized if a decrease in economic benefits during the reporting period is associated with a decrease in assets or an increase in debts, and if this decrease can be re-liably measured. Operating expenses are recognized when the costs are no longer held in inventories, finished and un-finished products, or when goods are sold. The costs that can-not be held in inventories of finished and unfinished products are recognized as operating expenses when they appear.
Financial expenses include borrowing costs (if not capitalised), exchange rate losses resulting from financing and invest-ing, changes in the fair value of financial assets at fair value through profit or loss and losses from the value impairment of financial assets. Borrowing costs are recognized in the income statement using the effective interest rate method.
Taxation
Taxes comprise current income tax liabilities and deferred tax. Current income tax is recognized in the income statement, except to the extent that refers to business combinations or items shown directly in the comprehensive income.
Current income tax liabilities are based on the taxable profit for the financial year. Taxable profit differs from net profit, re-ported in the income statement, because it excludes items of income or expenses that are taxable or deductible in other years, as well as items that are never taxable or deductible. The Group's current income tax liability is calculated using the tax rates applicable on the reporting date.
Deferred tax is shown in total by applying the method of obli-gations after the statement of financial position for temporary differences arising from the tax values of assets and liabili-ties and their carrying amounts in the consolidated financial statements. Deferred tax is calculated by using the tax rates (and laws) applicable on the date of the statement of financial position, which are expected to be used when the deferred tax asset is realized or the deferred tax liability is recovered.
A deferred tax asset is recognized to the extent that it is pro-bable that future taxable profit will be available against which the deferred tax asset can be utilized.
A deferred tax liability is recognized for all taxable temporary differences, unless it comes from initial goodwill recognition, or the initial recognition of an asset or liability in a business transaction which is not a business combination and which does not affect the accounting or taxable profits (tax loss) during the transaction.
Net Earnings per Share
The Group recognizes basic and diluted earnings per share for ordinary shares. Basic earnings per share are calculated by dividing profit or loss allocated to ordinary shareholders by the weighted average number of ordinary shares in the financial year, net of the average number of treasury shares. Diluted earnings per share are calculated by adjusting profit or loss allocated to ordinary shareholders and the weighted average number of ordinary shares in the financial year, net of the average number of treasury shares, for the effect of all potential ordinary shares representing convertible bonds and share options for employees.
Intangible Assets
Intangible assets with a definite useful life are recognized at cost, less any accumulated amortisation and accumulated impairment losses. The purchase value includes costs that can be directly attributed to the acquisition of each individual item. Borrowing costs directly attributable to the purchase or production of a qualifying asset are recognized as part of the cost of such asset. The cost model is used for any subsequent measuring of intangible assets.
Intangible assets with indefinite useful life are not amortised, they are impaired.
Amortisation is calculated on a straight-line basis over the estimated useful life of each individual part (component) of the intangible asset. Amortisation is accounted when an asset becomes available for use.
The estimated useful life of individual intangible assets for the current and past year is 2–10 years.
Amortisation methods, useful lives, and other group asset values are reviewed at the end of every financial year and ad-justed if necessary.
Further costs related to intangible asset are recognized in the carrying amount of each asset, if it is probable that the future economic benefits embodied within the asset will flow to the Group and the cost of the asset can be measured reliably. All other costs are recognized in the income statement as ex-penses as soon as they are incurred.
Goodwill arising on consolidation represents the excess of the purchase value over the fair value of the group’s interest of acquired identifiable assets, liabilities and contingent liabil-ities of a subsidiary on the date of acquisition. Negative good-will is immediately recognized in the consolidated income statement at the date of acquisition. Goodwill is recognized as an asset and is tested at least once a year for impairment. Each impairment is immediately recognized in the consolida-ted income statement and is not subsequently reversed. On the disposal of the subsidiary the relevant goodwill amount is included in the determination of profit or loss.
Property, plant and equipment
At their initial recognition, tangible assets (property, plant and equipment) are carried at cost, less any accumulated depreci-ation and accumulated impairment losses, except for land and other assets that do not depreciate; these are shown at their cost, reduced by all relative impairments. The purchase value includes costs that can be directly attributed to the acquisition of each individual item of property, plant or equipment. Parts of property, plant and equipment with different useful lives are accounted as separate items of prop-erty, plant and equipment. Borrowing costs directly attribut-able to the purchase, produ-ction or construction of a quali-fying asset are recognized as part of the cost of each such asset. The cost model is used for any subsequent measuring of property, plant and equipment.
Depreciation is calculated on a straight-line basis over the es-timated useful life of each individual part (component) of the tangible asset and the residual value. Leased assets are de-preciated over the estimated period of lease and useful life. Land and unfinished construction is not depreciated. Depre-ciation is accounted when an asset becomes available for use.
The estimated useful lives of individual property, plant and equipment types for the current and past years:
Depreciation methods, useful life and other group asset val-ues are reviewed at the end of every financial year and ad-justed if necessary.
The replacement costs of items of property, plant and equip-ment and further costs related to intangible assets are reco-gnized in the carrying amount of each asset, if it is probable that the future economic benefits embodied within this asset will flow to the Group, and the cost of the asset can be mea-sured reliably. All other costs (for example, maintenance costs) are recognized in the income statement as expenses as soon as they are incurred.
Investment Property
At its initial recognition, investment property is measured at cost, less accumulated depreciation and accumulated im-pairment losses. The cost model is used for any subsequent measuring of investment property.
Depreciation rates and the depreciation calculation are treat-ed the same as in the case of property, plant and equipment.
Financial Instruments
Financial instruments include the following items:
• non-derivative financial assets,• non-derivative financial liabilities.
Financial instruments are carried at fair value. Fair value is the amount for which an asset can be exchanged or the liability can be settled between two well-informed and willing parties in an arm’s length business transaction.
For determining the fair value of financial instruments the fo-llowing hierarchy levels of determining fair value are consid-ered:
• the first level includes quoted prices (unadjusted) on active markets for the same assets or liabilities;
• the second level, in addition to the quoted prices at the first level, includes the input data which are directly(i.e. as prices) or indirectly (i.e. as derivatives from prices)observable as assets or liabilities;
• the third level includes input data for assets or liabilities which are not based on the observable market data.
Quoted prices are used as a basis for determining the fair value of financial instruments. If a financial instrument is not quoted on the organized market or the market is deemed non-active, input data at the second or third level are used to assess the fair value of the financial instrument.
Useful life
Real estate 10-60 years
Production equipment 1-25 years
Computer equipment 2-10 years
Motor vehicles 2-10 years
Other equipment 1-10 years

< back to content
151150
financial reportGroup
financial reportGroup
Non-Derivative Financial Assets
Non-derivative financial assets include cash and cash equiva-lents, loans and receivables, and investments. Liabilities, bo-rrowings and deposits are initially recognized when they are incurred. Other assets are initially recognized on the trade date on which the Group becomes a contracting party in a contract on the instrument. The recognition of a financial assetis eliminated when the contractual rights of the cash flows from the asset expire, or when the rights of the contractual cash flows are transferred from a financial asset on the basis of a business transaction in which all risks and benefits of owner-ship of the financial asset are transferred.
Financial assets at fair value through profit or loss
A financial asset is classified at fair value through profit or loss if it is meant for trading or is determined as such after the ini-tial recognition. Financial assets are determined at fair value through profit or loss under the condition that such assets are manageable, and that the sale or purchase of these assetscan be decided on the basis of fair value. After the initial reco-gnition the pertained costs of the business transaction are recognized in profit or loss upon their occurrence. Financial assets at fair value through profit or loss are measured at fair value, whereas the amount of change in the fair value is reco-gnized in the income statement.
Available-for-sale financial assets
Available-for-sale financial assets are those non-derivative fi-nancial assets designated as available for sale, or those not included in the category of loans and receivables or financial assets at fair value through profit or loss.
Loans and receivables
Loans and receivables are non-derivative financial assets with fixed or determinable payments that are not listed on the ac-tive market. Depending on their maturity they are classified as current financial assets (maturities up to 12 months after the date of the statement of financial position) or non-cu-rrent financial assets (maturities exceeding 12 months after the date of the statement of financial position). Loand and receivables are initially recognized at fair value increased by costs directly attributable to the business transaction. Sub-sequent to their initial recognition, receivables and loans are measured at amortised cost using the effective interest rate method less accumulated impairment loss.
Cash and cash equivalents
Cash and cash equivalents comprise cash in hand, bank de-posits up to three months, and other current and readily rea-lizable investments with an original maturity of three months or less. They are recognized at cost.
Non-Derivative Financial Liabilities
Non-derivative financial liabilities include operating, financial and other liabilities. Non-derivative financial liabilities are initially recognized on the trade date on which the Group be-comes a contracting party in relation to the instrument. The Group de-recognizes an non-derivative financial liability when the contractual obligations are fulfilled, annulled or expired.
Non-derivative financial liabilities are initially disclosed at fair value, increased by costs directly attributable to the business transaction. Subsequent to their initial recognition these lia-bilities are measured at amortised cost using the effective interest rate method. Depending on their maturity they are classified as current liabilities (maturities up to 12 months after the date of the statement of financial position) or non-current liabilities (maturities exceeding 12 months after the date of the statement of financial position).
Inventories
Inventories are measured at cost or net realizable value, which-ever is the lower. The cost value consists of the purchase price, import duties and direct purchase costs. The purchase price is reduced by any discounts given. Direct purchase costs are transport costs, costs of loading reloading and unloading, costs of monitoring goods, and other costs attributable to directly-purchased merchandise, materials or services. Purchase dis-counts are those that are stated on the invoice, or which are given later and refer to individual purchases. The value of fi-nished and unfinished products refers to all production costs, which include the costs of manufacturing materials, labour costs, depreciation, services and other production costs.
The inventories of materials and merchandise are valued at actual prices, while the inventories of finished and unfinished products are valued using the standard cost method with de-viations to actual production prices. The use of inventories is stated at weighted average prices.
The net realizable value is estimated on the basis of the sell-ing price in the ordinary course of business, less the estimated costs of completion and estimated distribution costs. Write-offs of damaged, expired and useless inventories are regularly performed during the year on individual items.
Assets Held for Disposal (Disposal Groups)
Assets or disposal groups which include assets and liabilities for which it can be expected that their value will be recovered through sale are classified as assets held for disposal. Assets or disposal groups are re-measured directly before their classi-fication as assets held for disposal. Accordingly, non-current assets or disposal groups are recognized at their carrying amount or fair value less cost of sale, whichever is the lower. Impairment losses on the reclassification of assets as assets held for disposal, and subsequent losses and gains on re-measurement, are recognized in profit or loss. Gains are not recognized in the amount exceeding possible accumulated impairment losses.
Once classified as held for disposal, intangible assets and property, plant and equipment are no longer amortised or depreciated. When investments are classified as assets held for disposal, they are no longer equity accounted. Impairment of Assets
Financial Assets
A financial asset is impaired if objective evidences indicates that one or more events occurred resulting in a decrease in the estimated future cash flows from this asset which can be reliably estimated.
Objective evidence of the impairment of financial assets can include: default or delinquency by a debtor; restructuring of the amount owed to the Group, if the Group agrees; indica-tions that the debtor will declare bankruptcy; and the disa-ppearance of the active market for such an instrument.
Impairment of loans and receivables
The Group considers the evidence of impairment of receiva-bles individually or collectively. All significant receivables are measured separately for specific impairment. If it is assessed that the carrying amount of the receivables exceeds the fair value, i.e. the collectible amount, receivables are impaired.
Receivables that are not individually significant are collectively assessed for impairment by grouping together those receiva-bles with similar risk characteristics. The Group creates these groups on the basis of the maturity of receivables. In the eva-luation of total impairment the Group uses historical trends of the probability of default, the timing of recoveries, and the amount of incurred loss adjusted for management judgment as to whether the actual losses due to current economic and
credit conditions could be higher or lower than the losses based on historical trends.
The Group evaluates the evidence of impairment for each si-gnificant loan individually.
An impairment loss related to a financial asset measured at amortised cost is calculated as the difference between its ca-rrying amount and the estimated future cash flows, discoun-ted at an original effective interest rate. The loss is recognized in the profit or loss.
Available-for-sale financial assets
Impairment losses of available-for-sale financial assets are recognized so that the potential accumulated loss, previously recognized in the comprehensive income of the period and included in the fair value reserve, is transferred into profit or loss. Any subsequent increase in the fair value of an impaired available-for-sale equity security is recognized in the compre-hensive income for the period or in the fair value reserve.
Non-Financial Assets
At each reporting date, the Group reviews the carrying value of its important non-financial assets to determine whether there is an indication of impairments. If any such indication exists, the asset’s recoverable value is estimated.
The recoverable value of assets or cash-generating units is their value in use or fair value, less cost to sell, whichever is greater. In assessing value in use, estimated future cash flows are discounted to their present value, using a pre-tax discount rate that reflects current market assessments of the time val-ue of cash and the risks specific to the asset. In order to test the impairment, assets which cannot be tested individually are joined into the smallest possible group of assets which create cash flows from further use and which are largely in-dependent of the inflow of other assets or groups of assets (cash-generating units).
The impairment of an asset or cash-generating unit is reco-gnized if their carrying amount exceeds their recoverable value. The impairment is given in the income statement.
The Group evaluates the impairment losses of previous peri-ods at the end of the reporting period and thus determines whether the loss was reduced or even eliminated. An impair-ment loss is reversed if there has been a change in the esti-mates used to determine the asset’s recoverable value. An impairment loss is reversed only to such an extent that the

< back to content
153152
financial reportGroup
financial reportGroup
asset’s carrying amount does not exceed the carrying amount that would have been determined after deducting the depre-ciation write-off, if no impairment loss had been recognized for the asset in previous years.
At least once a year, on the date of the drawing up of the consolidated financial statements, the Group evaluates the evidence on the impairment of inventories. The impairment of inventories is assessed for each individual type of inven-tory. Individual types of inventories are allocated to groups of inventories with similar characteristics on the basis of the time component of changes in inventories. The estimate of impairment for each individual group includes an expertassessment of the possibility of further use or sale.
Determination of Fair Value
Following the accounting policies of the Group, in many cases the determination of fair value of non-financial assets and fi-nancial assets is necessary, either to measure an individual asset (measurement method or business combination) or for additional fair value disclosure.
Fair value is the amount for which an asset can be exchanged or the liability can be settled between two well-informed and willing parties in an arm’s length business transaction.
Methods for the determination of fair value of individual groups of assets for measurements or reporting are given below.
Intangible Assets
The fair value of intangible assets is based on the method of discounted cash flows which are expected to arise from the use and possible disposal of the assets.
Property, Plant and Equipment
The fair value of property, plant and equipment is their mar-ket value. The market value of property is equal to the esti-mated value at which the property could be sold on the date of valuation and after proper marketing. The market value of equipment is based on the approach of using the quoted market price for similar items.
Investment Property
The fair value of investment property is assessed by consi-dering the aggregate value of estimated cash flows expected from renting out the property. A yield reflecting specific risks
is included in the property valuation, based on discounted net annual cash flows.
Available-for-Sale Financial Assets and Financial Assets at Fair Value through Profit or Loss
The fair value of available-for-sale financial assets and finan-cial assets at fair value through profit or loss is determined according to preliminarily-defined hierarchy levels of de-termining the fair value of financial instruments. If the fair value cannot be reliably measured, because the wide range of estimates of reasonable fair values is important, and the probability of different estimates is hard to assess, the Group measures the financial asset at cost.
Loans and Receivables
The fair value of loans and receivables is calculated as the present value of future cash flows discounted at the market interest rate at the end of the period. The assessment consi-ders the credit risk connected to these financial assets.
Inventories
The fair value of inventories is determined on the basis of ex-pected trade value in the ordinary course of business, less the estimated distribution costs.
Non-Derivative Financial Liabilities
The fair value for reporting is calculated on the present value of future repayment and the principal value discounted at the market interest rate at the end of the period.
Equity
Share Capital
The share capital of the parent company takes the form of share capital, the amount of which is defined in the Compa-ny’s article of association. It is registered with the Court and paid by the owners.
Capital Surplus
Capital surplus consists of the amounts from payments ex-ceeding the lowest issue price per share that exceeds the carrying amount upon the disposal of previously-acquired own shares; the amounts on the basis of simplified decrease of share capital; and the amounts on the basis of reversal of general revaluation adjustment.
Legal and Other Reserves
Legal and other reserves are amounts of retained earnings from previous years, which are mostly used to compensate for potential future losses. On their occurrence they are reco-gnized by the body responsible for the preparation of the An-nual Report, or by the decision of the said body.
Treasury Shares
If the parent company or its subsidiaries acquire an ownership interest, the paid amount including the transaction costs less tax, is deducted from the total equity as treasury shares until such shares are withdrawn, reissued or sold.
Dividends
Until approved at the General Assembly of shareholders, the planned dividends are treated as retained earnings.
Provisions
Provisions are recognized if the Group, due to a past event, had a legal or indirect obligation which can be reliably mea-sured, and if there is a probability that settling the obligation will require an outflow of resources, enabling economic be-nefits.
Employee Benefits
In accordance with legal regulations, the Collective Agreement and internal regulations, the Group is obliged to make pay-ments arising from loyalty bonuses and severance pay upon retirement, for which non-current provisions are formed. There are no other retirements benefits.
The provisions are formed in the amount of estimated future payments for loyalty bonuses and severance pay, discounted at the end of the financial year. The calculation is made for each individual employee and includes the costs of severance pay upon retirement and the costs of all expected loyalty bonuses up to retirement. The calculation is prepared by an actuary, selected at group level, on the basis of a projected unit. The provisions are reviewed periodically or when the assumptions used to determine the amount of provision change significantly.
Deferred Revenues
Deferred revenues are expected to cover estimated expenses during a period exceeding one year.
On the basis of the status of a sheltered company, companies in the Group create deferred revenues in the amount of cal-culated but not paid contributions from salary and compulso-ry contributions (assigned contributions). They are intended to cover the expenses in accordance with the Vocational Re-habilitation and Employment of Disabled Persons Acts. The expended deferred revenues are eliminated and credited to operating income for the current year.
Cash Flow Statement
The cash flow statement shows changes in the balance of cash and cash equivalents for the financial year concerned. The cash flow statement is compiled according to the indirect method.
Segment Reporting
An operating segment is a component of the Group that en-gages in business activities from which it earns revenues and incures expenses which relate to transactions with any of the Group’s other segments. Segments are different in terms of risks and returns. The Group’s segment reporting is based on the Group’s internal reporting system applied by the manage-ment in the decision-making process.
The segments are presented in detail in the business report.
The Group uses the following segments in the preparation and presentation of the consolidated financial statements:
• Steel Division,• Distribution & Processing Division, • Scrap Division,• Manufacturing Division and• Headquarter and other services.

< back to content
155154
financial reportGroup
financial reportGroup
in € thousand 2015 2014
In Slovenia 84,378 97,550
In other countries: 580,439 610,308
- Germany 156,737 164,860
- Italy 144,329 169,340
- the USA 61,969 48,718
- Austria 18,486 23,746
- Other countries 198,917 203,644
Revenue 664,817 707,858
in € thousand 2015 2014
Costs of goods, materials and services 509,196 535,663
Labour costs: 95,352 89,909
- wages and salaries 71,325 67,820
- social security costs 12,557 12,334
- other labour costs 11,470 9,754
Depreciation and amortisation costs 40,168 38,289
Other costs 6,694 6,084
Changes in the value of inventories (4,075) 5,348
Operating expenses 647,335 675,293
in € thousand
Cost of salesDistribution
costs
General andadministrative
expenses Total
Costs of goods, materials and services 459,227 32,591 17,378 509,196
Labour costs 56,248 6,377 32,727 95,352
Depreciation and amortisation costs 36,627 503 3,038 40,168
Other costs 3,411 71 3,212 6,694
Changes in the value of inventories (4,075) 0 0 (4,075)
Operating expenses 551,438 39,542 56,355 647,335
NOTES TO INDIVIDUAL ITEmS IN THE CONSOLIDATED FINANCIALSTATEmENTS
1. Revenue
2. Operating Expenses
Review of Costs by Type in 2015
Review of Costs by Type in 2014
The auditing costs for the audit of the annual report in 2015 amounted to €251 thousand (2014: €256 thousand).
Average Number of Employees by Level of Education
in € thousand
Cost of salesDistribution
costs
General andadministrative
expenses Total
Costs of goods, materials and services 485,992 32,907 16,764 535,663
Labour costs 56,802 6,803 26,304 89,909
Depreciation and amortisation costs 34,071 387 3,831 38,289
Other costs 2,758 58 3,269 6,085
Changes in the value of inventories 5,348 0 0 5,348
Operating expenses 584,971 40,155 50,168 675,294
2015 2014
Primary school 503 516
2 year vocational school 360 365
3 year vocational school 818 874
4 year vocational school 768 772
1st cycle (Bologna system) - Bachelor's degree 328 267
2nd cycle (Bologna system) - Master's degree 227 231
3rd cycle (Bologna system) - Doctoral degree 39 39
Total 3,043 3,064
3. Other Operating Income
in € thousand 2015 2014
Capitalized own products 3,266 3,992
Revenues from received subsidies 1,708 1,769
Received compensations 2,179 1,758
Write-off of liabilities 107 736
Reversal of provisions 226 116
Profit from sale of property, plant and equipment 36 19
Other income 651 552
Other operating income 8,173 8,942

< back to content
157156
financial reportGroup
financial reportGroup
4. Other Operating Expenses
5. Finance Income
6. Finance expenses
7. Taxes
8. Net Earnings per Share
9. Intangible Assets
Movement of Intangible Assets in 2015
in € thousand 2015 2014
Allowances for receivables 698 847
Impairment of inventories 533 583
Expenses for donations and sponsorships 368 292
Other expenses 715 241
Other operating expenses 2,314 1,963
in € thousand 2015 2014
Interest income 232 1,319
Exchange rate differences 353 197
Other income 87 120
Finance income 672 1,636
in € thousand 2015 2014
Interest expenses 11,355 12,092
Exchange rate differences 113 146
Other expenses 3,597 2,855
Finance expenses 15,065 15,093
in € thousand 2015 2014
Income tax expenses (1,431) (988)
Deferred income tax 3,251 (794)
Taxes 1,820 (1,782)
in € thousand 2015 2014
Profit, attributed to the owners of the parent company 11,283 24,858
Weighted number of issued ordinary shares 970,979 986,693
Basic and diluted earnings per share (in €) 11.62 25.19
in € thousand 2015 2014
Profit before taxation 8,979 26,686
Tax at applicable tax rate 5,029 4,304
Tax effects from:
- non-taxable income (461) (21)
- tax non-deductible expenses 703 474
- tax relief (6,314) (2,666)
- tax losses for which no deferred tax assets were recognized (777) (309)
Taxes (1,820) 1,782
Effective tax rate - 6.68%
The tax relief of the Group comprises tax relief realized from the charging of corporate tax, and unused tax relief for which deferred tax assets were recorded. The Group can realize un-
used tax relief in the following years in accordance with the legislation of the state where the Group has tax losses.
Net earnings per share are calculated by dividing the net profit or loss of the financial year, allocated to the owners of the con-
trolling company, by the weighted average number of shares, traded during the year, net of the number of treasury shares.
Intangible assets comprise computer software and licences. Major new additions in 2015 refer to the purchase of soft-ware and licences in connection with the modernisation of the information system, activated in 2015.
The useful life of intangible assets is final, except for goodwill, which has an indefinite useful life.
On 31 December 2015 the goodwill was tested for potential impairment and the company determined no signs of impair-
ment. Based on the test performed, the Board of Directors assesses that on 31 December 2015 the recoverable value of investments in interests of the companies in which goodwill arose was higher than their purchase value at the time of the business combination. Therefore impairment of goodwill which arose from business combinations is not necessary. The recoverable value of investments which corresponds to the value of investments in use was assessed by the method of present value of the estimated cash flows. All assumptions used for calculating cash flow are based on past experience
in € thousand Non-currentproperty rights Goodwill
Assets underconstruction Total
Cost as at 31 Dec. 2014 6,909 15,061 6,130 28,100
Acquisition of company 0 190 0 190
New additions 0 0 4,751 4,751
Transfer from assets under construction 10,567 0 (10,567) 0
Translation differences 2 0 0 2
Transfer to property, plant and equipment (1,061) 0 0 (1,061)
Reversal 0 (190) 0 (190)
Cost as at 31 Dec. 2015 16,417 15,061 314 31,792
Accumulated amortisation as at 31 Dec. 2014 (3,294) - - (3,294)
Amortisation (1,223) - - (1,223)
Translation differences (2) - - (2)
Transfer to property, plant and equipment 802 - - 802
Accumulated amortisation as at 31 Dec. 2015 (3,717) - - (3,717)
Present value as at 31 Dec. 2014 3,615 15,061 6,130 24,806
Present value as at 31 Dec. 2015 12,700 15,061 314 28,075

< back to content
159158
financial reportGroup
financial reportGroup
of the companies’ operations and reasonable expectations of future operations.
The Group recognizes goodwill which arose in 2015 imme-diately in income statements.
On 31 December 2015 the Group’s unsettled liabilities to suppliers for purchase of intangible assets amounted to €357 thousand. Its contractual liabilities for the purchase of intan-
gible assets amounted to €611 thousand. The Group capita-lized €19 thousand of borrowing costs, for which the interest rates were between 2.33 and 5.06 percent. Intangible assets, whose present value on 31 December 2015 amounts to €68 thousand, are pledged as security for liabilities.
The Group reviewed the value of intangible assets, and estab-lished that the present amount does not exceed the recove-rable amount.
Movement of Intangible Assets in 2014
10. Property, Plant and Equipment
Movement of Property, Plant and Equipment in 2015
in € thousand Non-currentproperty rights Goodwill
Assets underconstruction Total
Cost as at 31 Dec. 2013 6,335 15,061 3,098 24,494
New additions 0 0 4,055 4,055
Transfer from assets under construction 1,026 0 (1,026) 0
Disposals (459) 0 0 (459)
Translation differences 2 0 0 2
Transfer from property, plant and equipment 5 0 3 8
Cost as at 31 Dec. 2014 6,909 15,061 6,130 28,100
Accumulated amortisation as at 31 Dec. 2013 (3,053) - - (3,053)
Amortisation (696) - - (696)
Disposals 459 - - 459
Translation differences (1) - - (1)
Transfer from property, plant and equipment (3) - - (3)
Accumulated amortisation as at 31 Dec. 2014 (3,294) - - (3,294)
Present value as at 31 Dec. 2013 3,282 15,061 3,098 21,441
Present value as at 31 Dec. 2014 3,615 15,061 6,130 24,806
in € thousandLand Buildings Equipment Other
Assets under construction Total
Cost as at 31 Dec. 2014 25,490 274,189 807,039 23,873 27,598 1,158,189
New additions 0 0 0 0 64,939 64,939
Transfer from assets under construction 900 9,478 49,581 3,874 (63,832) 0
Disposals (1) (4,535) (10,864) (1,932) 0 (17,332)
Translation differences (3) 1 (4) 7 0 1
Redistribution 2,072 (1,110) (13,675) 12,713 0 0
Transfer from intangible assets 0 0 1,018 43 0 1,061
Cost as at 31 Dec. 2015 28,458 278,023 833,095 38,578 28,705 1,206,859
Accumulated depreciationas at 31 Dec. 2014 - (180,899) (560,548) (18,660) - (760,107)
Depreciation - (4,852) (31,827) (2,265) - (38,944)
Disposals - 4,517 10,696 1,841 - 17,054
Translation differences - 0 1 (7) - (6)
Redistribution - (1,076) 11,067 (9,991) - 0
Transfer from intangible assets - 0 (762) (40) - (802)
Accumulated depreciationas at 31 Dec. 2015 - (182,310) (571,373) (29,122) - (782,805)
Present value as at 31 Dec. 2014 25,490 93,290 246,491 5,213 27,598 398,082
Present value as at 31 Dec. 2015 28,458 95,713 261,722 9,456 28,705 424,054
Major new additions and finished investments in property, plant and equipment include:
• line heat treatment of special heavy plates,• no-acid cleaning of hot-rolled strips,• vacuum ladle furnace,• current upgrades (repairs),• renovation of buildings.
Disposals of property, plant and equipment mostly refer to the sale or write-off of equipment connected with the reno-vation of basic production capacities, and write-offs of un-usable or out-dated equipment.
Redistribution refers to transfers between groups of assets and has no effect on income statements.
Property, plant and equipment, whose present value on 31 December 2015 amounts to €234,973 thousand, are pledged as security for liabilities. On 31 December 2015 the Group’s unsettled liabilities to suppliers for purchase of pro-perty, plant and equipment amounted to €19,589 thousand. Its contractual liabilities for the purchase of property, plant and equipment amounted to €43,798 thousand. The present value of property, plant and equipment under finance lease is €5,171 thousand. The Group capitalized €860 thousand in borrowing costs, for which the interest rates were between 2.33 and 5.06 percent.
The Group reviewed the value of property, plant and equip-ment, and established that the present amount does not ex-ceed the recoverable amount.

< back to content
161160
financial reportGroup
financial reportGroup
Movement of Property, Plant and Equipment in 2014
11. Investments in Associates
in € thousandLand Buildings Equipment Other
Assets under construction Total
Cost as at 31 Dec. 2013 25,320 268,705 806,604 24,147 11,478 1,136,254
New additions 0 0 0 0 41,493 41,493
Transfer from assets under construction 242 2,462 20,791 1,875 (25,371) 0
Disposals (9) 0 (18,647) (918) 0 (19,574)
Translation differences (63) (2) (67) 3 0 (129)
Redistribution 0 2,871 (1,642) (1,229) 0 0
Other changes 0 153 0 0 0 153
Transfer to intangible assets 0 0 0 (5) (3) (8)
Cost as at 31 Dec. 2014 25,490 274,189 807,039 23,873 27,597 1,158,188
Accumulated depreciationas at 31 Dec. 2013 - (175,250) (547,537) (18,960) - (741,747)
Depreciation - (4,802) (31,228) (1,563) - (37,593)
Disposals - 0 18,557 738 - 19,295
Translation differences - 1 14 (3) - 12
Redistribution - (771) (354) 1,125 - 0
Other changes - (76) 0 0 - (76)
Transfer to intangible assets - 0 0 3 - 3
Accumulated depreciationas at 31 Dec. 2014 - (180,898) (560,548) (18,660) - (760,106)
Present value as at 31 Dec. 2013 25,320 93,455 259,067 5,187 11,478 394,507
Present value as at 31 Dec. 2014 25,490 93,291 246,491 5,213 27,597 398,082
in € thousand 31 Dec. 2015 31 Dec. 2014
Razvojni center Jesenice, Cesta Franceta Prešerna 61, Jesenice, Slovenia 1,573 1,548
Investments in associates 1,573 1,548
in € thousand Activity % of voting rights
Value of assetsas at 31 Dec. 2015
Value of equityas at 31 Dec. 2015 Revenues 2015 Net profit 2015
Razvojni center Jesenice Development 24.95 10,383 6,078 2,170 100
The investment in associates is valued on the basis of equity method. In 2015 the Group attributed a corresponding share of 2015 profit which amounted to €25 thousand.
The company's principal activity is development of new materials and raw materials. The company does not need to be audited.
12. Available-for-Sale Financial Assets
13. Non-Current Operating Receivables
in € thousand 31 Dec. 2015 31 Dec. 2014
Available-for-sale financial assets at cost 44,606 290
Available-for-sale financial assets at fair value 614 616
Available-for-sale financial assets 45,220 906
in € thousand 31 Dec. 2015 31 Dec. 2014
Operating receivables 5,056 5,057
Allowances for operating receivables (2,984) (3,165)
Non-current operating receivables 2,072 1,892
in € thousand 31 Dec. 2015 31 Dec. 2014
Deferred tax assets 18,967 15,696
Deferred tax liabilities (35) (50)
Deferred tax assets (liabilities), net 18,932 15,646
in € thousand 31 Dec. 2015 31 Dec. 2014
Other assets 2,932 2,043
Other non-current assets 2,932 2,043
Available-for-sale financial assets, carried at cost, refer to sha-res anad interests in companies that are not traded on the regulated market and whose fair value cannot be measured reliably. In 2015 the Group acquired 5,000,000 shares with the ticker symbol PPTG of the company Perutnina Ptuj in the amount of €40,000 thousand, and 43,197 shares with the ti-cker symbol PMPG of the company Holding PMP in the amount of €4,320 thousand. According to its strategic plan, the Group will demerge these investments in 2016 into a separate new company of which the ownership will remain unchanged.
Available-for-sale financial assets, carried at fair value, refer to shares and interests in companies that are traded on the regulated market and whose fair value can be measured re-liably. These assets decreased due to revaluation at fair value in the amount of €2 thousand charged to the comprehensive income.
Received dividends in 2015 amounted to €87 thousand.
The disclosed value of operating receivables does not exceed their realizable value.
14. Other Non-Current Assets
Other assets include non-current accrued cost of arrangement fees, emission coupons and cautions. The increase mostly refers to non-current accrued costs of arrangement fees.
15. Deferred Tax Assets and Liabilities

< back to content
163162
financial reportGroup
financial reportGroup
Movement of Deferred Tax Assets and Liabilities in 2015
Movement of Deferred Tax Assets and Liabilities in 2014
On 31 December 2015 the value of unused tax losses for which deferred tax assets are recognized amounted to €43,610 thousand. The value of unused tax losses for which
deferred tax assets are not recoginized amounted to €58,324 thousand, while unrecognized deferred tax assets amounted to €9,915 thousand.
Loans issued include a loan issued to the controlling company in the amount of €3,000 thousand. The interest rate for loans issued is mainly fixed.
in € thousand
31 Dec. 2014Translationdifferences
Changes inthe incomestatement
Changes incomprehensive
income 31 Dec. 2015
Property, plant and equipment (148) 0 67 0 (81)
Other 97 0 (52) 0 45
Deferred tax liabilities (51) 0 15 0 (36)
Other provisions 56 0 (1) 0 55
Unused tax losses 7,141 0 1,238 0 8,379
Inventories (18) 8 129 0 119
Operating receivables 969 0 (139) 0 830
Employee benefits 1,295 0 147 0 1,442
Property, plant and equipment 116 0 514 0 630
Available-for-sale financial assets (35) 0 0 0 (35)
Unused tax relief 6,173 27 1,348 0 7,548
Deferred tax assets 15,697 35 3,236 0 18,968
Deferred tax assets (liabilities), net 15,646 35 3,251 0 18,932
in € thousand
31 Dec. 2013Translationdifferences
Changes inthe incomestatement
Changes incomprehensive
income 31 Dec. 2014
Inventories (77) 0 77 0 0
Property, plant and equipment (302) 0 155 0 (147)
Other 327 0 (230) 0 97
Deferred tax liabilities (52) 0 2 0 (50)
Other provisions 27 0 29 0 56
Unused tax losses 7,695 0 (554) 0 7,141
Inventories 252 11 (281) 0 (18)
Operating receivables 940 0 29 0 969
Employee benefits 1,322 0 (27) 0 1,295
Property, plant and equipment 769 0 (653) 0 116
Available-for-sale financial assets (15) 0 0 (20) (35)
Unused tax reliefs 5,501 9 662 0 6,172
Deferred tax assets 16,491 20 (795) (20) 15,696
Deferred tax assets (liabilities), net 16,439 20 (793) (20) 15,646
16. Assets Held for Disposal
in € thousand 31 Dec. 2015 31 Dec. 2014
Assets held for sale 4,142 4,146
Assets held for disposal 4,142 4,146
Under assets held for sale, the Group has lands and buildings (outbuildings and apartments) in Jesenice and Celje. Sales ac-tivities are constantly under way. In 2015, the Group gener-ated €1 thousand in profit from the sale of assets. The assets are not pledged as security for liabilities.
The present value of assets classified as held for sale does not exceed their realizable value.
Inventories, whose present value on 31 December 2015 amounts to €13,638 thousand, are pledged as security for lia-bilities. On 31 December 2015 the Group checked the value of the inventories and found that the net realizable value
of finished products is lower that their production value, so made an impairment of the inventories in the amount of €533 thousand in 2015.
17. Inventories
18. Current Financial Receivables
in € thousand 31 Dec. 2015 31 Dec. 2014
Raw material 68,883 63,225
Work in progress 51,687 40,582
Finished products 36,655 41,534
Trade goods 14,117 15,293
Inventories 171,342 160,634
in € thousand 31 Dec. 2015 31 Dec. 2014
Loans issued 3,151 47
Interest receivables 37 10
Other 0 1
Current financial receivables 3,188 58
in € thousand 2015 2014
Balance as at 1 Jan. 4,788 4,850
Allowance changes with influence on profit or loss (12) (17)
Allowance changes without influence on profit or loss (2) (61)
Translation differences 15 16
Balance as at 31 Dec. 4,789 4,788
Movement of Allowances for Inventories

< back to content
165164
financial reportGroup
financial reportGroup
in € thousand 2015 2014
Balance as at 1 Jan. 47 15,969
Loans issued 3,224 8,431
Receipts from loans issues (99) (23,772)
Write-offs of loans issued 0 (581)
Translation differences (1) 0
Other (20) 0
Balance as at 31 Dec. 3,151 47
in € thousand 31 Dec. 2015 31 Dec. 2014
Equity attributed to the owners of the parent company 344,915 343,549
Share capital 145,266 145,266
Capital surplus 11,461 11,461
Revenue reserves 129 (859)
Fair value reserves (369) 171
Translation differences 221 33
Retained earnings 188,207 187,477
Non-controlling interest 3,802 4,586
Equity 348,717 348,135
ShareholderNumber of shares
31 Dec. 2015Number of shares
31 Dec. 2014
DILON, d. o. o., Gerbičeva ulica 98, Ljubljana, Slovenia 718,351 718,351
Republika Slovenija, Gregorčičeva ulica 20, Ljubljana, Slovenia 248,655 248,655
D. P. R., d. d., Koroška cesta 14, Ravne na Koroškem, Slovenia 0 11,468
Stanovanjsko podjetje, d. o. o., Ob Suhi 19, Ravne na Koroškem, Slovenia 0 8,205
SIJ d.d., Gerbičeva ulica 98, Ljubljana, Slovenia 27,600 7,927
UNIOR, d. d., Kovaška cesta 10, Zreče, Slovenia 10 10
Total 994,616 994,616
in € thousand 31 Dec. 2015 31 Dec. 2014
Trade receivables 106,763 129,060
Allowances for trade receivables (4,853) (4,135)
VAT receivables 5,963 5,173
Issued advance payments and cautions 4,812 5,770
Other operating receivables 1,596 2,562
Current operating receivables 114,281 138,430
in € thousand 31 Dec. 2015 31 Dec. 2014
Cash in national currency 36,391 34,917
Cash in foreign currency 8,122 3,883
Restricted cash 74 193
Cash and cash equivalents 44,587 38,993
in € thousand 31 Dec. 2015 31 Dec. 2014
Deferred expenses 1,915 1,037
Accrued revenues 361 95
Other current assets 2,276 1,132
Movement of Current Loans Issued
19. Current Operating Receivables
20. Cash and Cash Equivalents
21. Other Current Assets
The majority of the Group’s trade receivables are insured against commercial risks with our insurance company. Trade receivables, whose present value on 31 December 2015amounts to €43,672 thousand, are pledged as security for liabilities.
The disclosed value of operating receivables does not exceed their realizable value.
Current deferred expenses refer to advance payments of costs, which in 2016 will debit against profit or loss.
22. Equity
The share capital of the parent company is recognized in the amount of €145,266 thousand and is distributed between 994,616 shares. The face value of each share is €146.05. The number of shares did not change in 2015.
Ownership Structure of the Parent Company
The ownership structure changed in 2015. The parent company completed the purchase of 11,468 of its own shares fromD. P. R., d. d., and 8,205 of it's own shares from Stanovanjsko podjetje, d. o. o., thus increasing the treasury shares by 2.77 percent.
Capital Surplus
Capital surplus in the amount of €11,461 thousand was created during the simplified decrease in the parent company’s capital.
Cash in national and foreign currency includes cash in hand and balances on bank accounts, amounting to €44,283 thou-sand on 31 December 2015. Deposits in the amount of €230 thousand are in the national currency and have a maturity of up to three months. The interest rate for deposits is fixed.
Restricted cash represents assets on custody account inten-ded for payments of liabilities for the acquisition of a subsi-diary.

< back to content
167166
financial reportGroup
financial reportGroup
in € thousand 31 Dec. 2015 31 Dec. 2014
Legal reserves 2,384 1,396
Treasury shares (6,009) (2,257)
Reserves for treasury shares 3,754 2
Revenue reserves 129 (859)
in € thousand 31 Dec. 2015 31 Dec. 2014
Fair value reserves due to available-for-sale financial assets 203 206
Deferred tax liabilities (35) (35)
Net actuarial losses on pension programs (537) 0
Fair value reserves (369) 171
in € thousand 31 Dec. 2015 31 Dec. 2014
Provisions for severance pay 10,125 8,319
Provisions for loyalty bonuses 1,958 1,995
Provisions for post-employment benefits 177 124
Employee benefits 12,260 10,438
in € thousand 31 Dec. 2015 31 Dec. 2014
Provisions for environmental rehabilitation 200 200
Provisions for law suits 674 902
Provisions for complaints 571 575
Other provisions 1,445 1,677
in € thousand 31 Dec. 2015 31 Dec. 2014
Assigned contributions 867 866
Other deferred revenues 60 0
Non-current deferred revenues 927 866
Revenue Reserves Movement of Employee Benefits in 2015
Movement of Other Provisions in 2015
Movement of Other Provisions in 2014
Fair Value Reserves
23. Employee Benefits
24. Other Provisions
25. Non-Current Deferred Revenues
The parent company acquired treasury shares in the amount of €2,255 thousand on the basis of the Act Regula-ting the In-currence and Settlement of Liabilities of Slovenske železarne as regards the Restructuring Programme (Official Gazette of the RS, nr. 111/2001) and in line with the Privatization of Slov-enske železarne Act (Official Gazette of the RS, nr. 13/1998). Treasury shares were acquired by exchanging interests in subsidiaries for shares of the parent company owned by au-thorized companies. The shares were acquired ex lege and
not in line with the Companies Act, which is why the parent company did not establish a treasury shares fund. Shares are recognized at cost.
In 2015 the parent company acquired 19,673 treasury shares on the basis of decisions taken at the 25th General Assembly of 9 June 2014, and established reserves in the amount of €3,752 thousand for treasury shares. Shares are recognized at cost.
The actuarial calculation was made on the basis of the actua-rial model and assumptions, derived from life tables, growth in wages in the Republic of Slovenia, and the yield curve, which represents the relationship between market yields on government bonds in the Eurozone and the time remaining to maturity. The observed discounted rate is between 0 and 2.3 percent, depending on maturity.
Employee benefits are calculated by an authorized actuary. The change in employee benefits had a direct effect on the income statement, except for actuarial losses which decreases the revaluation reserves in equity.
The Group did not carry out an actuarial calculation in 2014.
Distributable Profit
The Group is not a legal entity nor does it hold decision-making rights. Retained earnings and net profit for the financial year of subsidiaries, included in the consolidated financial statements, are divided at the level of the respective subsidiaries.
in € thousand 31 Dec. 2014 Formation Reversal Utilization 31 Dec. 2015
Provisions for severance pay 8,319 1,984 (178) 0 10,125
Provisions for loyalty bonuses 1,995 32 (69) 0 1,958
Provisions for post-employment benefits 124 84 (18) (13) 177
Employee benefits 10,438 2,100 (265) (13) 12,260
in € thousand 31 Dec. 2014 Formation Reversal and utilization 31 Dec. 2015
Provisions for environmental rehabilitation 200 0 0 200
Provisions for law suits 902 25 (253) 674
Other provisions 575 0 (4) 571
Other provisions 1,677 25 (257) 1,445
in € thousand 31 Dec. 2013 Formation Reversal and utilization 31 Dec. 2014
Provisions for environmental rehabilitation 500 0 (300) 200
Provisions for law suits 1,043 0 (141) 902
Other provisions 320 257 (2) 575
Other provisions 1,863 257 (443) 1,677
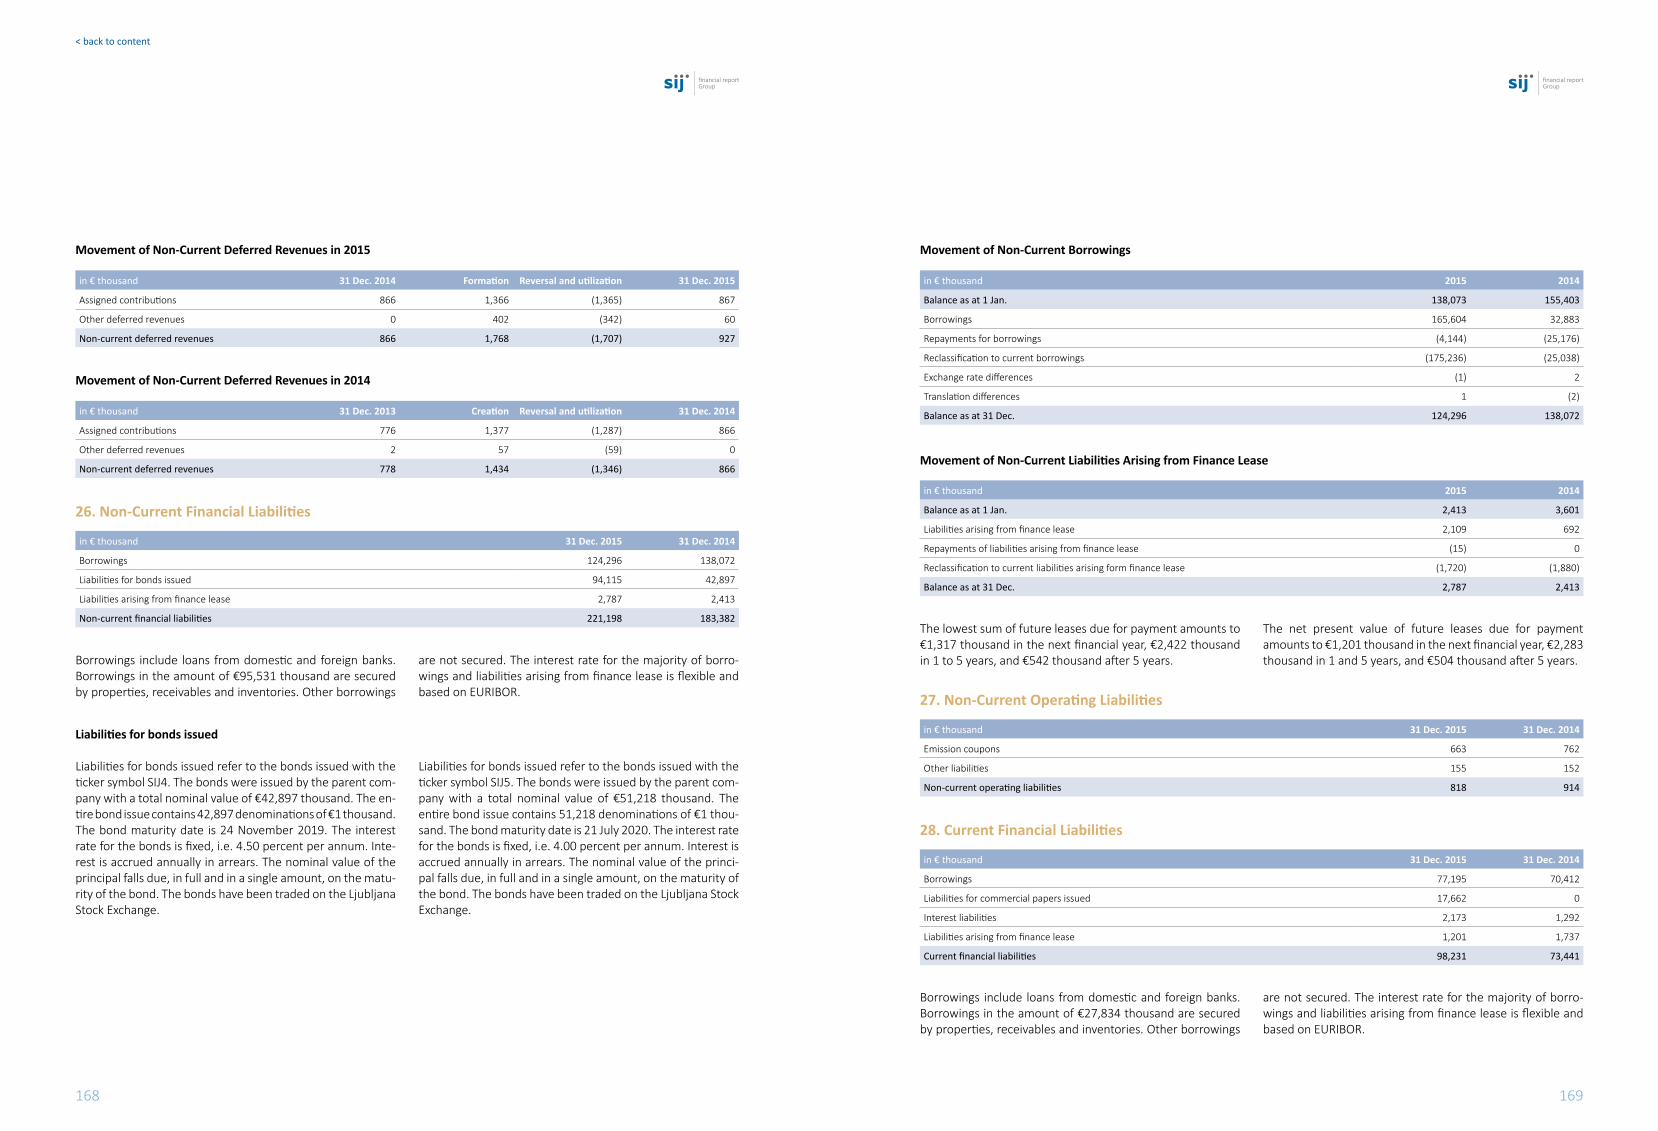
< back to content
169168
financial reportGroup
financial reportGroup
Movement of Non-Current Deferred Revenues in 2015 Movement of Non-Current Borrowings
Movement of Non-Current Liabilities Arising from Finance Lease
Movement of Non-Current Deferred Revenues in 2014
in € thousand 31 Dec. 2014 Formation Reversal and utilization 31 Dec. 2015
Assigned contributions 866 1,366 (1,365) 867
Other deferred revenues 0 402 (342) 60
Non-current deferred revenues 866 1,768 (1,707) 927
in € thousand 31 Dec. 2013 Creation Reversal and utilization 31 Dec. 2014
Assigned contributions 776 1,377 (1,287) 866
Other deferred revenues 2 57 (59) 0
Non-current deferred revenues 778 1,434 (1,346) 866
in € thousand 31 Dec. 2015 31 Dec. 2014
Borrowings 124,296 138,072
Liabilities for bonds issued 94,115 42,897
Liabilities arising from finance lease 2,787 2,413
Non-current financial liabilities 221,198 183,382
in € thousand 31 Dec. 2015 31 Dec. 2014
Emission coupons 663 762
Other liabilities 155 152
Non-current operating liabilities 818 914
in € thousand 31 Dec. 2015 31 Dec. 2014
Borrowings 77,195 70,412
Liabilities for commercial papers issued 17,662 0
Interest liabilities 2,173 1,292
Liabilities arising from finance lease 1,201 1,737
Current financial liabilities 98,231 73,441
in € thousand 2015 2014
Balance as at 1 Jan. 138,073 155,403
Borrowings 165,604 32,883
Repayments for borrowings (4,144) (25,176)
Reclassification to current borrowings (175,236) (25,038)
Exchange rate differences (1) 2
Translation differences 1 (2)
Balance as at 31 Dec. 124,296 138,072
in € thousand 2015 2014
Balance as at 1 Jan. 2,413 3,601
Liabilities arising from finance lease 2,109 692
Repayments of liabilities arising from finance lease (15) 0
Reclassification to current liabilities arising form finance lease (1,720) (1,880)
Balance as at 31 Dec. 2,787 2,413
26. Non-Current Financial Liabilities
27. Non-Current Operating Liabilities
28. Current Financial Liabilities
Borrowings include loans from domestic and foreign banks. Borrowings in the amount of €95,531 thousand are secured by properties, receivables and inventories. Other borrowings
are not secured. The interest rate for the majority of borro-wings and liabilities arising from finance lease is flexible and based on EURIBOR.
Liabilities for bonds issued
Liabilities for bonds issued refer to the bonds issued with the ticker symbol SIJ4. The bonds were issued by the parent com-pany with a total nominal value of €42,897 thousand. The en-tire bond issue contains 42,897 denominations of €1 thousand. The bond maturity date is 24 November 2019. The interest rate for the bonds is fixed, i.e. 4.50 percent per annum. Inte-rest is accrued annually in arrears. The nominal value of the principal falls due, in full and in a single amount, on the matu-rity of the bond. The bonds have been traded on the Ljubljana Stock Exchange.
Liabilities for bonds issued refer to the bonds issued with the ticker symbol SIJ5. The bonds were issued by the parent com-pany with a total nominal value of €51,218 thousand. The entire bond issue contains 51,218 denominations of €1 thou-sand. The bond maturity date is 21 July 2020. The interest rate for the bonds is fixed, i.e. 4.00 percent per annum. Interest isaccrued annually in arrears. The nominal value of the princi-pal falls due, in full and in a single amount, on the maturity of the bond. The bonds have been traded on the Ljubljana Stock Exchange.
The lowest sum of future leases due for payment amounts to €1,317 thousand in the next financial year, €2,422 thousand in 1 to 5 years, and €542 thousand after 5 years.
The net present value of future leases due for payment amounts to €1,201 thousand in the next financial year, €2,283 thousand in 1 and 5 years, and €504 thousand after 5 years.
Borrowings include loans from domestic and foreign banks. Borrowings in the amount of €27,834 thousand are secured by properties, receivables and inventories. Other borrowings
are not secured. The interest rate for the majority of borro-wings and liabilities arising from finance lease is flexible and based on EURIBOR.

< back to content
171170
financial reportGroup
financial reportGroup
Movement of Current Borrowings
31. Segment Reporting
Segment Reporting for 2015
Movement of Current Liabilities Arising from Finance Lease
in € thousand 2015 2014
Balance as at 1 Jan. 70,412 109,089
Borrowings 298,908 237,678
Payments for borrowings (468,013) (302,030)
Reclassification from non-current borrowings 175,236 25,038
Exchange rate differences 6 11
Translation differences 646 626
Balance as at 31 Dec. 77,195 70,412
in € thousand 31 Dec. 2015 31 Dec. 2014
Liabilities to suppliers 166,434 155,323
Liabilities to employees 3,877 3,946
Received advance payments 1,309 1,515
Tax liabilities 4,702 4,395
Other liabilities 1,400 1,727
Current operating liabilities 177,722 166,906
in € thousand 31 Dec. 2015 31 Dec. 2014
Accrued customer fees 277 1,121
Accrued expenses for unused annual leave 564 933
Accrued expenses for lawsuits 133 68
Other liabilities 445 673
Deferred revenue 156 59
Other current liabilities 1,575 2,854
in € thousand 2015 2014
Balance as at 1 Jan. 1,737 3,522
Repayments of liabilities arising from finance lease (2,256) (3,665)
Reclassification from non-current liabilities arising from finance lease 1,720 1,880
Balance as at 31 Dec. 1,201 1,737
The lowest sum of future leases, due for payment in the next financial year, amounts to €1,317 thousand on 31 December 2015, and the net present value of leases amount to €1,201 thousand on the same date.
29. Current Operating Liabilities
30. Other Current Liabilities
in € thousand Steel
Division
Distribution & Processing
DivisionScrap
DivisionManufacturing
Division
Headquarter and other
Services
Transactions between
segments Total
Consolidated financial
statements
Revenues on the segments
542,212 133,929 76,030 47,242 15,625 0 815,038 -
Eliminations (571) (1,655) (9,128) (397) (116) (138,354) (150,221) -
Revenues 541,641 132,274 6,902 46,845 15,508 (138,354) 664,817 664,817
Cost on the segments 524,547 135,715 75,358 46,024 15,912 0 797,556 -
Eliminations (571) (1,655) (9,128) (397) (116) (138,354) (150,221) -
Expenses 523,976 134,060 66,230 45,627 15,796 (138,354) 647,335 647,335
Other operating income (expenses)
6,944 (14) 34 829 21,766 (23,700) 5,859 5,859
Profit (loss) from operation
24,609 (1,799) 706 2,047 21,478 (23,700) 23,341 23,341
Net finance income (expenses)
(11,280) (1,542)
(965) 28 (642) 8 (14,393) (14,393)
Share of profit in associates 25 0 0 0 0 0 25 25
Taxes 1,905 735 22 (120) (722) 0 1,820 1,820
Profit (loss) forthe period
15,259 (2,606) (237) 1,955 20,114 (23,692) 10,793 10,793
Assets on segments 659,235 98,287 29,025 40,432 356,691 (319,975) 863,695 863,695
Liabilities onsegments
391,122 80,268 21,175 22,588 155,419 (155,594) 514,978 514,978
Liabilities for Commercial Papers Issued
Liabilities for commercial papers amounting to €17,662 thou-sand refer to 12-month commercial papers with the ticker symbol SIK02, issued by the parent company on 18 Decem-ber 2015. The total nominal value of the commercial papers is €17,662 thousand, and covers 17,662 denominations of €1 thousand. The interest rate for a commercial paper is 2.20 per-
cent per annum. Commercial papers are a discounted securi-ty. Interest is charged in advance and deducted on payment of a commercial paper in the form of a discount from the nomi-nal value of the commercial paper. Liabilities from commercial papers are payable on 16 December 2016. Commercial papers trading takes place at the Ljubljana Stock Exchange.

< back to content
173172
financial reportGroup
financial reportGroup
Segment Reporting for 2014
in € thousand
Steel
Division
Distribution & Processing
DivisionScrap
DivisionManufacturing
Division
Headquarter and other
Services
Transactions between
segments Total
Consolidated financial
statements
Revenues on the segments
584,063 123,317 98,542 48,092 12,928 0 866,942 -
Eliminations (4,675) (1,472) (14,160) (318) (520) (137,939) (159,084) -
Revenues 579,388 121,845 84,382 47,774 12,408 (137,939) 707,858 707,858
Cost on the segments 557,129 121,666 97,266 46,128 12,405 0 834,594 -
Eliminations (4,675) (1,472) (14,160) (318) (520) (138,155) (159,300) -
Expenses 552,454 120,194 83,106 45,810 11,885 (138,155) 675,294 675,294
Other operating income (expenses)
(5,031) 130
11 (1,134) (901) (57) (6,982) (6,979)
Profit (loss) from operation
31,965 1,521 1,265 3,098 1,424 270 39,543 39,543
Net finance income (expenses)
(10,334)
(1,546)
(947) (42) 4 (592) (13,457) (13,457)
Share of profit in associates 600 0 0 0 0 0 600 600
Taxes (1,089) (236) (22) (289) (146) 0 (1,782) (1,782)
Profit (loss) for the period
21,142 (261)
296 2,767 1,282 (319) 24,907 24,904
Assets on segments 628,872 93,776 29,608 39,445 238,738 (241,178) 789,261 789,261
Liabilities onsegments
368,607 75,035 21,454 13,462 55,801 (93,233) 441,126 441,126
32. Contingent Assets and Liabilities
Contingent assets amounted to €1,736 thousand on31 December 2015 and refer to received guarantees for the elimination of errors in the warranty period. The Groupexpects no inflows from received guarantees.
Contingent liabilities amounted to €48,119 thousand on 31 December 2015. They include issued guarentees in the amount of €45,841 thousand, and guarantees for good work performance in the amount of €2,277 thousand. The Group expects no outflows from the issued securities and guarantees.
33. Business Combinations
On 5 March 2015 Noži Ravne acquired a 100 percent share of Ravne Knives (UK) Limited, Ravne Knives UK (North) Limited and Ravne Knives USA INC. In 2015 the Group considered temporary fair values of acquired assets as fair for the initial accou-nting of the business combination of purchasing the companies.
According to the first paragraph of the IFRS, 3.45, at the initial recognition of business combinations the Group used the car-
rying amount of assets, liabilities and potential liabilities of the acquired company as the fair value. The initial recognition will be repeated within twelve months after the acquisition and the recognition will be adjusted accordingly.
The statement of financial position of Ravne Knives (UK) Lim-ited, Ravne Knives UK (North) Limited and Ravne Knives USA INC on the day the Group acquired the controlling interest is given below.
in € thousand Fair value Temporary fair value
Assets
Cash and cash equivalents 62 62
Inventories 18 18
Operating receivables 348 348
Equity and liabilities
Operating liabilities 411 411
Net assets 17 17
Acquired net assets 17 -
Acquisition price 207 -
Carrying amount of acquired net assets 17 -
Goodwill 190 -
in € thousand 2015 2014
Revenues/expenses 150,220 159,083
in € thousand 31 Dec. 2015 31 Dec. 2014
Operating receivables/liabilities 61,831 55,101
Financial receivables/liabilities 101,741 49,003
Investments in subsidiaries 173,096 171,214
RELATED PARTIES
The related parties are the parent company (including its parent companies and the companies in their groups), subsidiaries,associates, other related parties and the management of companies. Related Party Transactions Excluded from the Consolidated Financial Statements

< back to content
175174
financial reportGroup
financial reportGroup
Transactions with the Parent Company
Movement of Allowances for Financial Assets
Liquidity Risk
The Group is managing liquidity risk by the appropriate planning of cash flow and current credit lines from banks agreed in advance, which ensures that the Group is capable of settling any overdue liabilities at any time.
Exposure to banks is assessed as moderate. The Group fully complies with the conditions stated in loan contracts in the section defining the disclosure of data, payment of interest and repaying the principal value.
Transactions with Management
This is the total amount of receipts on the basis of the busi-ness management contract, received in the financial year, for the performance of functions or tasks in the company by
members of the Board of Directors, other workers employed on contracts for which the tariff part of the collective agree-ment does not apply, and members of the Supervisory Board.
The receipts include gross salaries, paid reimbursements related to work in accordance with the regulations (daily allowance, mileage, overnight accommodation etc.), and bonuses.
The Group did not grant any loans, issue any guarantees nor make any advance payments to the management of the Group or the members of the Supervisory Board in 2015.
The management of the Group is represented by the management of the parent company and the management of subsidiaries.
FINANCIAL INSTRUmENTS AND RISKS
Credit Risk
The largest exposure on the reporting date arises from trade receivables, other operating receivables, financial receivables and deposits.
Age Structure of Financial Assets
in € thousand 2015 2014
Revenues 20 1,030
in € thousand 31 Dec. 2015 31 Dec. 2014
Receivables 3,022 2
in € thousand 2015
Management and employees with service contracts 15,424
Members of the Supervisory Board 198
in € thousand
31 Dec. 2015 Not-overdue
Overdue
TotalUp to 3 months3 months to
1 year1 year to
3 years Over 3 years
Trade receivables 88,125 10,067 2,204 1,195 319 101,910
Financial receivables and deposits 3,503 0 0 0 0 3,503
Total 91,628 10,067 2,204 1,195 319 105,413
in € thousand
31 Dec. 2014 Not-overdue
Overdue
TotalUp to 3 months3 months to
1 year1 year to
3 years Over 3 years
Trade receivables 108,482 13,544 1,365 1,359 175 124,925
Financial receivables and deposits 16,320 7 0 0 0 16,327
Total 124,801 13,551 1,365 1,359 175 141,251
in € thousand
Allowance as at
31 Dec. 2014
Creation ofallowance
for year
Repayment of assets subject to
allowance
Other changes without influence
on profit or lossAllowance as at
31 Dec. 2015
Trade receivables 4,135 957 (89) (149) 4,854
Financial receivables and deposits 1 0 0 0 1
Total 4,136 957 (89) (149) 4,855
in € thousand
Allowance as at
31 Dec. 2013
Creation ofallowance
for year
Repayment of assets subject to
allowance
Other changes without influence
on profit or lossAllowance as at
31 Dec. 2014
Trade receivables 4,726 1,104 (268) (1,428) 4,134
Financial receivables and deposits 1 0 0 0 1
Total 4,727 1,104 (268) (1,428) 4,135
in € thousand 31 Dec. 2015 Up to 3 months
3 months to1 year
1 year to5 years Over 5 years Total
Liabilities to suppliers 159,928 6,278 228 0 166,434
Borrowings 38,053 66,326 228,981 9,751 343,111
Other operating and financial liabilities 1,545 84 590 0 2,219
Total 199,526 72,688 229,799 9,751 511,764
in € thousand 31 Dec. 2014 Up to 3 months
3 months to1 year
From 1 year to 5 years Over 5 years Total
Liabilities to suppliers 150,937 4,386 0 0 155,323
Borrowings 30,756 46,821 189,897 21,484 288,958
Other operating and financial liabilities 1,718 145 914 0 2,777
Total 183,411 51,352 190,811 21,484 447,058

< back to content
177176
financial reportGroup
financial reportGroup
Foreign Exchange Risk
The consolidated financial statements of the Group are based on the following exchange rates.
Carrying Amounts and Fair Values of Financial Instruments
Interest Rate Risk
A change in interest rate by 100 or 200 basis points on the reporting date would result in an increase (decrease) of profit or loss by the amounts stated below. The analysis assumes that all other variables, in particular exchange rates, remain unchanged. The analysis for 2014 was prepared in the same manner:
Based on the test of the fair value of financial instruments the Group assesses that there are no significant deviations from their carrying amount.
Fair Value Measurements
To determine fair value, the Group, where possible, takes into account the market value of financial instruments. The Group begins measuring the financial assets in the valuation model when it is estimated that the market is inactive. In accorda-nce with the IFRS and accounting policies, the Group divides financial instruments into three levels.
Level 1 includes financial instruments whose fair value is fully determined on the basis of prices quoted in an active market.
Level 2 includes financial instruments whose fair value is de-termined on the basis of valuation models which take intoaccount variables that are derived on the basis of publicly available market data (such as market interest rates).
Level 3 includes financial instruments whose fair value is de-termined on the basis of valuation models which take into account subjective variables, which are not publicly available on the market.
Equity Management
The Group monitors the status of overdue receivables on a daily basis, and prepares 3-month plans twice a month with the aim of achieving optimum debt. Larger investments are financed by non-current assets.
Net exposure (assets – liabilities) in foreign currencies, expressed in EUR is presented in below table.
Exchange rate as at 31 Dec. 2015
EUR/USD 1.09
EUR/GBP 0.76
EUR/CHF 1.11
EUR/HRK 7.66
EUR/RSD 121.59
in € thousand Exposure
USD (17,685)
GBP 12
CHF 88
HRK (2)
JPY (10)
EUR (79)
in € thousand 2015 2014
Change in profit/loss if increased by 200 bp (3,249) (3,705)
Change in profit/loss if increased by 100 bp (1,625) (1,852)
Change in profit/loss if decreased by 100 bp 1,625 1,852
Change in profit/loss if decreased by 200 bp 3,249 3,704
in € thousand 31 Dec. 2015 31 Dec. 2014
Financial assets at fair value at the first level 614 616
Financial assets at fair value at the third level 47,897 451
Financial liabilities at fair value at the third level (319,429) (256,823)
in € thousand 2015 Debt increase by 10% Debt decrease by 10%
Level of debt on equity 91.60 100.76 82.44
Equity 348,717 348,717 348,717
Financial liabilities 319,429 351,372 287,486
in € thousand
Type of financial instrument
31 Dec. 2015 31 Dec. 2014
Carrying amount Fair value Carrying amount Fair value
Available-for-sale financial assets 45,220 45,220 906 906
Financial receivables 3,291 3,291 161 161
Operating receivables 116,353 116,353 142,364 142,364
Cash and cash equivalents 44,587 44,587 38,993 38,993
Financial liabilities (319,429) (319,429) (256,823) (256,823)
Operating liabilities (178,540) (178,540) (167,819) (167,819)
Total (288,518) (288,518) (242,218) (242,218)

< back to content
179178
financial reportGroup
financial reportGroup
FINANCIAL REPORTSIJ D.D.
EVENTS AFTER THE REPORTING DATE
At the beginning of 2016 the subsidiary Noži Ravne received appropriate approval from the Slovenian Competition Protec-tion Agency to complete the takeover procedure of Sistemska tehnika d. o. o. The company changed its name to RavneSystems d. o. o. on 18 January 2016. At the same time inten-sive activities were carried out for a merger of the (former) Sistemska tehnika d. o. o., Noži Ravne d. o. o. and Serpa d. o. o.The companies currently operate as an independent legalentity. A definitive merger in Ravne Systems d. o. o. is planed by the Group in the coming months.
A takeover bid to buy shares of HOLDING PMP, naložbena dejavnost, d. d., Vinarski trg 1, 2250 Ptuj, published by the parent company on 4 December 2015, ended on 2 February 2016. During the duration of the takeover bid from (and in-cluding) 5 December 2015 up to (and including) 2 February 2016, the offer was accepted by 28 acceptors, who jointly held 33,673 shares in the target company with the ticker symbol PMPG, constituting 43.81 percent of all shares in the target company. Together with the 43,197 shares in HoldingPMP d. d., held by the parent company on the date of publication of the takeover bid, the parent company ac-quired all 76,870 issued shares or 100 percent of Holding PMP d. d. on 11 February 2016, by rebooking the shares.
On 2 March 2016 a takeover procedure to buy shares in PE-RUTNINA PTUJ reja perutnine, proizvodnja krmil, perutnin-skega mesa in izdelkov, trgovina in storitve d. d., Potrčeva ces-ta 10, 2250 Ptuj, ended successfully; the offer was published on 24 December 2015. During the duration of the takeover bid from (and including) 28 December 2015 up to (and includ-ing) 25 February 2016, the offer was accepted by 2,348 ac-ceptors, who jointly held 2,846,733 shares in the target com-pany with the symbol PPTG, constituting 26.09 percent of all shares of the target company. Together with 5,000,000 shares in Perutnina Ptuj d. d., held by the parent company on the date of publication of the takeover bid, and 603,184 shares in the target company, held by Holding PMP d.d. on the date of publication of the takeover bid, amounting to 5,603,184 shares in Perutnina Ptuj d. d., held directly or indirectly by the acquirer on the date of publication of the takeover bid, the parent company now holds 8,449,917 shares, constitut-ing 77.43 percent of all issued shares in PERUTNINA PTUJ d. d.

181180 181
financial reportCompany
financial reportCompany
< back to content< back to content

< back to content
183182 183
financial reportCompany
financial reportCompany
< back to content
FINANCIAL STATEmENTS
STATEmENT OF COmPREHENSIVE INCOmE
in € thousand Note 2015 2014
Revenue 1 12,892 9,836
Gross profit 12,892 9,836
General and administrative expenses 2 (12,558) (9,653)
Other operating income 3 22,698 481
Other operating expenses 4 (1,763) (206)
Profit from operation 21,269 458
Finance income 5 3,779 3,319
Finance expenses 6 (4,581) (2,429)
Net finance (costs) income (802) 890
Profit before taxation 20,467 1,348
Income tax expense 7 (715) (138)
Profit for the year 19,752 1,210
Items that will not be reclassified subsequently to profit or loss
Income tax related to components of comprehensive income 1 (20)
Net actuarial losses on pension programs (12) 0
Items that may be reclassified subsequently to profit or loss
Change in fair value reserves for available-for-sale financial assets (3) 120
Comprehensive income 19,737 1,310
Profit for the year 19,752 1,210
Basic and diluted earnings per share (in EUR) 8 20.34 1.23
The notes to the financial statements are an integral part of the financial statements and should be read in conjunction with them.
STATEmENT OFmANAGEmENT'SRESPONSIBILITy
The Board of Directors is responsible for drawing up financial statements for each individual year according to the Interna-tional Financial Reporting Standards (IFRS) adopted by the European Union and the Company's Act, so that they give a true and fair view of the Company's operations.
The Board of Directors legitimately expects the company to have enough resources in the foreseeable future to enable it to continue its operations. The financial statements are there-fore based on the premise that the Company will continue its operations without a set time limit.
The responsibility of the Board of Directors in drawing up the financial statements includes the following:
• Properly selected and consistently applied accounting policies;• Reasonable and rational assessments and estimates;• Assurance that the financial statements have been com-
piled in accordance with the IFRS adopted by the Europe-an Union. Any significant deviations are disclosed and ex-plained in the report.
The Board of Directors is responsible for keeping correspond-ing records which give a clear and accurate picture of the Company’s financial position at any given time, and for mak-ing sure that the financial statements of the Company are in accordance with the IFRS, adopted by the European Un-ion. The Board of Directors is also responsible for protecting the Company’s assets, as well as discovering and preventing abuses and other irregularities.
Anytime within 5 years after the end of the year in which the tax assessment should be made, the tax authorities can in-spect the operations of the Company. This can result in occur-rence of additional tax liabilities, default interests and fines based on corporate income tax or other taxes and duties. No circumstance which could result in possible liability in this way is known to the Board Of Directors.
The Board of Directors declares that the consolidated finan-cial statements have been compiled in accordance with the IFRS, without reservations about their application.
The Board of Directors approved the financial statements, accounting policies and notes on 4 March 2016.
President of the Board of DirectorsAnton Chernykh
Member of the Board of DirectorsIgor Malevanov

< back to content
185184 185
financial reportCompany
financial reportCompany
< back to content
STATEmENT OF CHANGES IN EQUITy
Statement of Changes in Equity in 2015
Statement of Changes in Equity in 2014
in € thousand Sharecapital
Capitalsurplus
Revenuereserves
Fair valuereserves
Retainedearnings Total
Balance as at 31 Dec. 2013 145,266 11,461 (859) 71 24,501 180,441
Purchase of treasury shares 0 0 (2) 0 0 (2)
Transactions with owners 0 0 0 0 (521) (521)
Total transactions with owners 0 0 (2) 0 (521) (523)
Profit for the year 0 0 0 0 1,210 1,210
Other changes in comprehensive income
0 0 0 100 0 100
Total changes in comprehensive income 0 0 0 100 1,210 1,310
Creation of reserves fortreasury shares
0 0 2 0 (2) 0
Total changes in equity 0 0 2 0 (2) 0
Balance as at 31 Dec. 2014 145,266 11,461 (859) 171 25,188 181,227
in € thousand Sharecapital
Capitalsurplus
Revenuereserves
Fair valuereserves
Retainedearnings Total
Balance as at 31 Dec. 2014 145,266 11,461 (859) 171 25,188 181,227
Purchase of treasury shares 0 0 (3,752) 0 0 (3,752)
Dividends paid 0 0 0 0 (5,810) (5,810)
Creation of legal reserves 0 0 988 0 (988) 0
Total transactions with owners 0 0 (2,764) 0 (6,798) (9,562)
Profit for the year 0 0 0 0 19,752 19,752
Other changes in comprehensive income 0 0 0 (14) 0 (14)
Total changes in comprehensive income 0 0 0 (14) 19,752 19,738
Creation of reserves fortreasury shares
0 0 3,752 0 (3,752) 0
Total changes in equity 0 0 3,752 0 (3,752) 0
Balance as at 31 Dec. 2015 145,266 11,461 129 157 41,894 191,403
The notes to the financial statements are an integral part of the financial statements and should be read in conjunction with them.
STATEmENT OF FINANCIAL POSITION
The notes to the financial statements are an integral part of the financial statements and should be read in conjunction with them.
in € thousand Note 31 Dec. 2015 31 Dec. 2014
ASSETS
Non-current assets 282,284 177,941
Intangible Assets 9 812 633
Property, plant and equipment 10 5,627 5,764
Investment property 0 1
Investments in subsidiaries 11 163,672 163,507
Available-for-sale financial assets 12 45,198 885
Financial receivables 13 65,302 5,992
Operating receivables 29 29
Other assets 14 616 102
Deferred tax assets 15 1,028 1,028
Current assets 68,529 62,887
Assets held for disposal 35 35
Financial receivables 16 25,761 25,990
Operating receivables 17 32,451 19,266
Cash and cash equivalents 18 9,217 17,517
Other assets 19 1,065 79
Total assets 350,813 240,828
EQUITY AND LIABILITIES
Equity 20 191,403 181,227
Share capital 145,266 145,266
Capital surplus 11,461 11,461
Revenue reserves 129 (859)
Fair value reserves 157 171
Retained earnings 34,390 25,188
Non-current liabilities 123,092 43,563
Employee benefits 21 391 462
Financial liabilities 22 122,700 43,098
Operating liabilities 1 3
Current liabilities 36,318 16,038
Financial liabilities 23 32,907 12,240
Operating liabilities 24 2,689 3,535
Income tax liabilities 586 126
Other liabilities 136 137
Total equity and liabilities 350,813 240,828

< back to content
187186 187
financial reportCompany
financial reportCompany
< back to content
CASH FLOw STATEmENT
in € thousand Note 2015 2014
Cash flow from operating activities
Profit before taxation 20,467 1,348
Adjusted for:
Depreciation and amortisation 9, 10 374 322
Interest income 5 (2,426) (1,818)
Interest expenses 6 3,915 1,623
Loss in investment sales 1 29
Impairment of assets 1,460 0
Creation of allowances and provisions (96) 0
Dividends (22,582) 0
Other adjustments (1,050) (848)
Operating cash flow before changes in working capital 63 656
Changes in working capital
Change in operating receivables (5,676) 199
Change in operating payables (1,419) (540)
Change in taxes other than income tax (227) 739
Income tax paid (255) (5)
Other direct payments 0 (522)
Changes in working capital (7,577) (129)
Net cash (used) generated from operating activities (7,514) 527
Cash flow from investing activities
Payments for investments in subsidiaries (75) (2,275)
Payments for available-for-sale financial assets (44,320) 0
Payments for property, plant and equipment (143) (1,050)
Receipts from property, plant and equipment 9 49
Payments for intangible assets (282) (345)
Payments for other assets (3,748) 0
Payments for loans issued 13, 16 (181,967) (37,130)
Receipts from loans issued 13, 16 120,622 32,575
Interests received 2,307 2,478
Dividends received 12 14,086 56
Net cash used in investing activities (93,511) (5,642)
Cash flow from financing activities
Receipts from borrowings 22, 23 135,980 83,802
Payments for borrowings 22, 23 (36,495) (62,025)
Receipts for finance lease 480 469
Payments for finance lease (547) (583)
Receipts from financial services 1,834 2,102
Interests paid (2,717) (1,513)
Dividends paid 20 (5,810) 0
Net cash generated in financing activities 92,725 22,252
Cash and cash equivalents as at 1.1 17,517 380
(Decrease) increase (8,300) 17,137
Cash and cash equivalents as at 31.12 9,217 17,517
The notes to the financial statements are an integral part of the financial statements and should be read in conjunction with them.
NOTES TO THE FINANCIAL STATEmENTS
REPORTING ENTITy
SIJ – Slovenska industrija jekla, d.d. (hereinafter: SIJ or the Company) is a Company with its registered office in Slovenia. Its registered address is at Gerbičeva ulica 98, 1000 Ljubljana. Given below are the financial statements for the year ending as at 31 December 2015.
The consolidated financial statements for a selected group of subsidiaries are compiled by SIJ – Slovenska industrija jekla, d.d. The consolidated annual report for SIJ – Slovenian Steel Group is available at the headquarters of the Company, Gerbičeva ulica 98, 1000 Ljubljana. Consolidated financial statements for a wider group of subsidiaries are compiled by DILON Cooperatief U. A. The consolidated annual report for the DILON Cooperatief Group is available at the registered office of DILON Cooperatief U. A., Luna Arena, Herikerberg-weg 238, 1101 CM Amsterdam Zuidoost, Amsterdam, the Netherlands.
BASIS OF PREPARATION
The financial statements for 2015 have been prepared in ac-cordance with the IFRS as adopted by the European Union. The standards have been applied directly in the disclosures and valuation of items, the exception is the valuation of items for which the standards allow several methods of valuation.
The financial statements in the report are expressed in thou-sands of euros. Due to the rounding off of value amounts, there may be insignificant deviations from the sums given in the tables.
In the selection of accounting principles and their application, as well as in the preparation of these financial statements, the Board of Directors considered the following three re-quirements: the financial statements are comprehensible, if users can understand them without difficulty; the informa-tion is adequate, if it helps users make economic decisions; and the information is fundamental, if its exclusion or false presentation could influence users’ economic decisions.
The financial statements have been prepared in compliance with the IFRS, adopted by the International Accounting Standards Board (hereinafter: IASB), and with the interpre-tations issued by the International Financial Reporting Inter-pretations Committee (hereinafter: IFRIC), as adopted by the European Union (EU), namely:
a) Currently applicable standards and interpretations
The following amendments to the existing standards issued by the IASB and adopted by the EU currently apply:
• Amendments to various standards “Improvements to IFRSs (cycle 2011-2013)” resulting from the annual improvement project of IFRS (IFRS 3, IFRS 13 and IAS 40) primarily with a view to removing inconsistencies and clarifying wording, adopted by the EU on 18 December 2014 (amendments are to be applied for annual periods beginning on or after 1 January 2015),
• IFRIC 21 “Levies” adopted by the EU on 13 June 2014 (effective for annual periods beginning on or after17 June 2014).
The adoption of these amendments to the existing standards had no effect on the accounting policies of the company.
b) Standards and interpretations issued by IASB and adopt-ed by the European Union, but not yet effective
On the date of the adoption of financial statements the follo-wing standards, amendments and interpretations, issued by IASB and adopted by the EU, were issued, but not yet effec-tive:
• Amendments to IFRS 11 “Joint Arrangements” – Account-ing for Acquisitions of Interests in Joint Operations – adopted by the EU on 24 November 2015 (effective for annual periods beginning on or after 1 January 2016),
• Amendments to IAS 1 “Presentation of Financial State-ments” – Disclosure Initiative – adopted by the EU on18 December 2015 (effective for annual periods beginning on or after 1 January 2016),
• Amendments to IAS 16 “Property, Plant and Equipment” and IAS 38 “Intangible Assets” – Clarification of Acceptable Methods of Depreciation and Amortisation – adopted by the EU on 2 December 2015 (effective for annual periods beginning on or after 1 January 2016),
• Amendments to IAS 16 “Property, Plant and Equipment” and IAS 41 “Agriculture” – Agriculture: Bearer Plants – adopted by the EU on 23 November 2015 (effective for annual periods beginning on or after 1 January 2016),
• Amendments to IAS 19 “Employee Benefits” – Defined Benefit Plans: Employee Contributions – adopted by the EU on 17 December 2014 (effective for annual periods beginning on or after 1 February 2015),
• Amendments to IAS 27 “Separate Financial Statements” – Equity Method in Separate Financial Statements – adopted
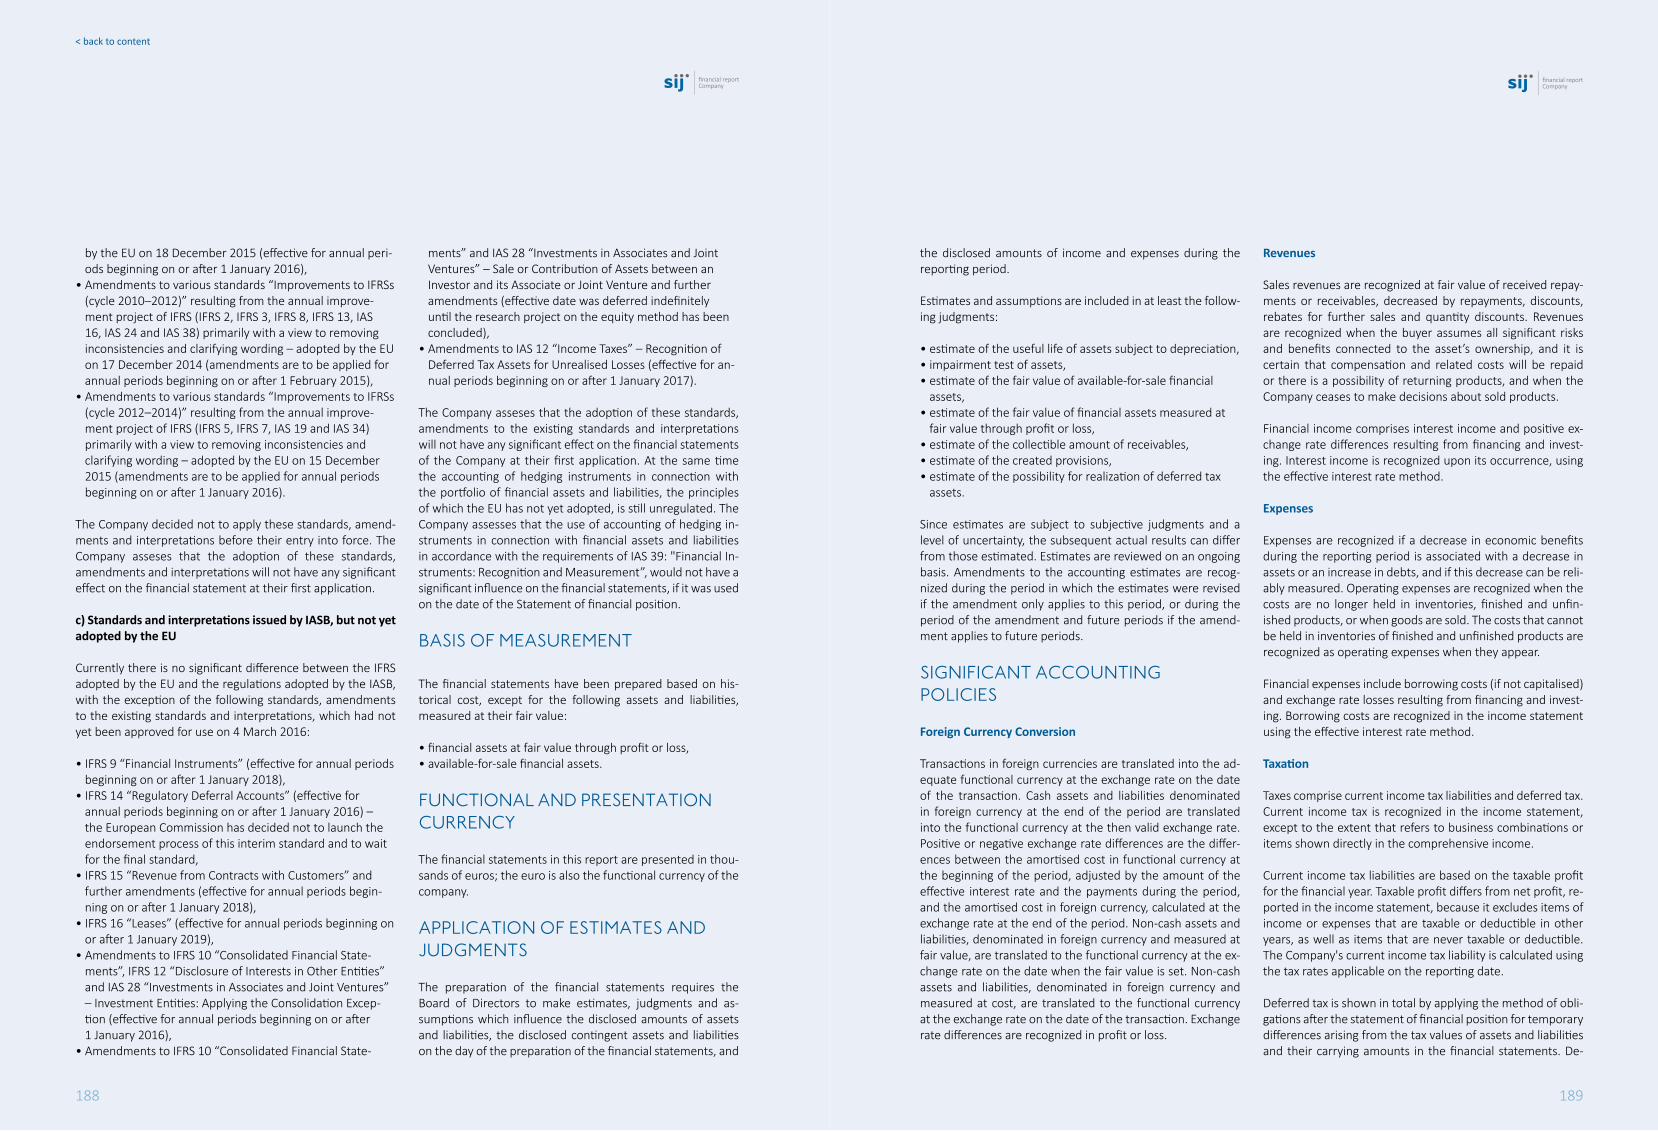
< back to content
189188 189
financial reportCompany
financial reportCompany
< back to content
the disclosed amounts of income and expenses during the reporting period.
Estimates and assumptions are included in at least the follow-ing judgments:
• estimate of the useful life of assets subject to depreciation,• impairment test of assets, • estimate of the fair value of available-for-sale financial
assets,• estimate of the fair value of financial assets measured at
fair value through profit or loss,• estimate of the collectible amount of receivables,• estimate of the created provisions,• estimate of the possibility for realization of deferred tax
assets.
Since estimates are subject to subjective judgments and a level of uncertainty, the subsequent actual results can differ from those estimated. Estimates are reviewed on an ongoing basis. Amendments to the accounting estimates are recog-nized during the period in which the estimates were revised if the amendment only applies to this period, or during the period of the amendment and future periods if the amend-ment applies to future periods.
SIGNIFICANT ACCOUNTINGPOLICIES
Foreign Currency Conversion
Transactions in foreign currencies are translated into the ad-equate functional currency at the exchange rate on the date of the transaction. Cash assets and liabilities denominated in foreign currency at the end of the period are translated into the functional currency at the then valid exchange rate. Positive or negative exchange rate differences are the differ-ences between the amortised cost in functional currency at the beginning of the period, adjusted by the amount of the effective interest rate and the payments during the period, and the amortised cost in foreign currency, calculated at the exchange rate at the end of the period. Non-cash assets and liabilities, denominated in foreign currency and measured at fair value, are translated to the functional currency at the ex-change rate on the date when the fair value is set. Non-cash assets and liabilities, denominated in foreign currency and measured at cost, are translated to the functional currency at the exchange rate on the date of the transaction. Exchange rate differences are recognized in profit or loss.
Revenues
Sales revenues are recognized at fair value of received repay-ments or receivables, decreased by repayments, discounts, rebates for further sales and quantity discounts. Revenues are recognized when the buyer assumes all significant risks and benefits connected to the asset’s ownership, and it is certain that compensation and related costs will be repaid or there is a possibility of returning products, and when the Company ceases to make decisions about sold products.
Financial income comprises interest income and positive ex-change rate differences resulting from financing and invest-ing. Interest income is recognized upon its occurrence, using the effective interest rate method.
Expenses
Expenses are recognized if a decrease in economic benefits during the reporting period is associated with a decrease in assets or an increase in debts, and if this decrease can be reli-ably measured. Operating expenses are recognized when the costs are no longer held in inventories, finished and unfin-ished products, or when goods are sold. The costs that cannot be held in inventories of finished and unfinished products are recognized as operating expenses when they appear.
Financial expenses include borrowing costs (if not capitalised) and exchange rate losses resulting from financing and invest-ing. Borrowing costs are recognized in the income statement using the effective interest rate method.
Taxation
Taxes comprise current income tax liabilities and deferred tax. Current income tax is recognized in the income statement, except to the extent that refers to business combinations or items shown directly in the comprehensive income.
Current income tax liabilities are based on the taxable profit for the financial year. Taxable profit differs from net profit, re-ported in the income statement, because it excludes items of income or expenses that are taxable or deductible in other years, as well as items that are never taxable or deductible. The Company's current income tax liability is calculated using the tax rates applicable on the reporting date.
Deferred tax is shown in total by applying the method of obli-gations after the statement of financial position for temporary differences arising from the tax values of assets and liabilities and their carrying amounts in the financial statements. De-
by the EU on 18 December 2015 (effective for annual peri-ods beginning on or after 1 January 2016),
• Amendments to various standards “Improvements to IFRSs (cycle 2010–2012)” resulting from the annual improve-ment project of IFRS (IFRS 2, IFRS 3, IFRS 8, IFRS 13, IAS 16, IAS 24 and IAS 38) primarily with a view to removing inconsistencies and clarifying wording – adopted by the EU on 17 December 2014 (amendments are to be applied for annual periods beginning on or after 1 February 2015),
• Amendments to various standards “Improvements to IFRSs (cycle 2012–2014)” resulting from the annual improve-ment project of IFRS (IFRS 5, IFRS 7, IAS 19 and IAS 34) primarily with a view to removing inconsistencies and clarifying wording – adopted by the EU on 15 December 2015 (amendments are to be applied for annual periods beginning on or after 1 January 2016).
The Company decided not to apply these standards, amend-ments and interpretations before their entry into force. The Company asseses that the adoption of these standards, amendments and interpretations will not have any significant effect on the financial statement at their first application.
c) Standards and interpretations issued by IASB, but not yet adopted by the EU
Currently there is no significant difference between the IFRS adopted by the EU and the regulations adopted by the IASB, with the exception of the following standards, amendments to the existing standards and interpretations, which had not yet been approved for use on 4 March 2016:
• IFRS 9 “Financial Instruments” (effective for annual periods beginning on or after 1 January 2018),
• IFRS 14 “Regulatory Deferral Accounts” (effective for annual periods beginning on or after 1 January 2016) – the European Commission has decided not to launch the endorsement process of this interim standard and to wait for the final standard,
• IFRS 15 “Revenue from Contracts with Customers” and further amendments (effective for annual periods begin-ning on or after 1 January 2018),
• IFRS 16 “Leases” (effective for annual periods beginning on or after 1 January 2019),
• Amendments to IFRS 10 “Consolidated Financial State-ments”, IFRS 12 “Disclosure of Interests in Other Entities” and IAS 28 “Investments in Associates and Joint Ventures” – Investment Entities: Applying the Consolidation Excep-tion (effective for annual periods beginning on or after1 January 2016),
• Amendments to IFRS 10 “Consolidated Financial State-
ments” and IAS 28 “Investments in Associates and Joint Ventures” – Sale or Contribution of Assets between an Investor and its Associate or Joint Venture and further amendments (effective date was deferred indefinitely until the research project on the equity method has been concluded),
• Amendments to IAS 12 “Income Taxes” – Recognition of Deferred Tax Assets for Unrealised Losses (effective for an-nual periods beginning on or after 1 January 2017).
The Company asseses that the adoption of these standards, amendments to the existing standards and interpretations will not have any significant effect on the financial statements of the Company at their first application. At the same time the accounting of hedging instruments in connection with the portfolio of financial assets and liabilities, the principles of which the EU has not yet adopted, is still unregulated. The Company assesses that the use of accounting of hedging in-struments in connection with financial assets and liabilities in accordance with the requirements of IAS 39: "Financial In-struments: Recognition and Measurement”, would not have a significant influence on the financial statements, if it was used on the date of the Statement of financial position.
BASIS OF mEASUREmENT
The financial statements have been prepared based on his-torical cost, except for the following assets and liabilities, measured at their fair value:
• financial assets at fair value through profit or loss, • available-for-sale financial assets.
FUNCTIONAL AND PRESENTATION CURRENCy
The financial statements in this report are presented in thou-sands of euros; the euro is also the functional currency of the company.
APPLICATION OF ESTImATES AND JUDGmENTS
The preparation of the financial statements requires the Board of Directors to make estimates, judgments and as-sumptions which influence the disclosed amounts of assets and liabilities, the disclosed contingent assets and liabilities on the day of the preparation of the financial statements, and

< back to content
191190 191
financial reportCompany
financial reportCompany
< back to content
ferred tax is calculated by using the tax rates (and laws) ap-plicable on the date of the statement of financial position, which are expected to be used when the deferred tax asset is realized or the deferred tax liability is recovered.
A deferred tax asset is recognized to the extent that it is prob-able that future taxable profit will be available against which the deferred tax asset can be utilized.
Net Earnings per Share
The Company recognizes basic and diluted earnings per share for ordinary shares. Basic earnings per share are calculated by dividing profit or loss allocated to ordinary shareholders by the weighted average number of ordinary shares in the financial year, net of the average number of treasury shares. Diluted earnings per share are calculated by adjusting profit or loss allocated to ordinary shareholders and the weighted average number of ordinary shares in the financial year, net of the average number of treasury shares, for the effect of all potential ordinary shares representing convertible bonds and share options for employees.
Intangible Assets
Intangible assets with a definite useful life are recognized at cost, less any accumulated amortisation and accumulated impairment losses. The purchase value includes costs that can be directly attributed to the acquisition of each individual item. Borrowing costs directly attributable to the purchase or production of a qualifying asset are recognized as part of the cost of such asset. The cost model is used for any subsequent measuring of intangible assets.
Intangible assets with indefinite useful life are not amortised, they are impaired.
Amortisation is calculated on a straight-line basis over the estimated useful life of each individual part (component) of the intangible asset. Amortization is accounted when an asset becomes available for use.
The estimated useful life of individual intangible assets for the current and past year is 2–10 years.
Amortization methods, useful lives, and other group asset values are reviewed at the end of every financial year and ad-justed if necessary.
Further costs related to intangible assets are recognized in the carrying amount of each asset, if it is probable that the
future economic benefits embodied within the asset will flow to the Company and the cost of the asset can be measured reliably. All other costs are recognized in the income state-ment as expenses as soon as they are incurred.
Property, Plant and Equipment
At their initial recognition tangible assets (property, plant and equipment) are carried at cost, less any accumulated depre-ciation and accumulated impairment losses, except for land and other assets that do not depreciate; these are shown at their cost, reduced by all relative impairments. The purchase value includes costs that can be directly attributed to the ac-quisition of each individual item of property, plant or equip-ment. Parts of property, plant and equipment with different useful lives are accounted as separate items of property, plant and equipment. Borrowing costs directly attributable to the purchase, production or construction of a qualifying asset are recognized as part of the cost of each such asset. The cost model is used for any subsequent measuring of property, plant and equipment.
Depreciation is calculated on a straight-line basis over the es-timated useful life of each individual part (component) of the tangible asset and the residual value. Leased assets are de-preciated over the estimated period of lease and useful life. Land and unfinished construction is not depreciated. Depre-ciation is accounted when an asset becomes available for use.
The estimated useful lives of individual property, plant and equipment types for the current and past years:
Depreciation methods, useful life and other group asset val-ues are reviewed at the end of every financial year and ad-justed if necessary.
The replacement costs of items of property, plant and equip-ment and further costs related to intangible assets are rec-ognized in the carrying amount of each asset, if it is probable that the future economic benefits embodied within this asset will flow to the Company, and the cost of the asset can be measured reliably. All other costs (for example, maintenance costs) are recognized in the income statement as expenses as soon as they are incurred.
Useful life
Real estate 20-55 years
Computer equipment 2-3 years
Motor vehicles 3-8 years
Other equipment 1-10 years
Investment Property
At its initial recognition, investment property is measured at cost, less accumulated depreciation and accumulated im-pairment losses. The cost model is used for any subsequent measuring of investment property.
Depreciation rates and the depreciation calculation are treat-ed the same as in the case of property, plant and equipment.
Investments in Subsidiaries
Investments in subsidiaries are recognized at cost. The com-pany recognizes revenues from financial investments in the amount arising from the distribution of the accumulated profit after the date of the acquired financial investment.
Investments in Associates
Investments in associates are recognized at cost. Associates are those companies where the Company has a significant influence on their operations, but which it does not control.
Financial Instruments
Financial instruments include the following items:• non-derivative financial assets,• non-derivative financial liabilities.
Non-Derivative Financial Assets
Non-derivative financial assets include cash and cash equiva-lents, loans and receivables, and investments. Liabilities, bor-rowings and deposits are initially recognized when they are incurred. Other assets are initially recognized on the trade date on which the Company becomes a contracting party in a contract on the instrument. The recognition of a financial as-set is eliminated when the contractual rights of the cash flows from the asset expire, or when the rights of the contractual cash flows are transferred from a financial asset on the ba-sis of a business transaction in which all risks and benefits of ownership of the financial asset are transferred.
Financial Assets at Fair Value through Profit or Loss
A financial asset is classified at fair value through profit or loss if it is meant for trading or is determined as such after the ini-tial recognition. Financial assets are determined at fair value through profit or loss under the condition that such assets are manageable, and that the sale or purchase of these as-sets can be decided on the basis of fair value. After the initial
recognition the pertained costs of the business transaction are recognized in profit or loss upon their occurrence. Finan-cial assets at fair value through profit or loss are measured at fair value, whereas the amount of change in the fair value is recognized in the income statement.
Available-for-Sale Financial Assets
Available-for-sale financial assets are those non-derivative fi-nancial assets designated as available for sale, or those not included in the category of loans and receivables or financial assets at fair value through profit or loss.
Loans and Receivables
Loans and receivables are non-derivative financial assets with fixed or determinable payments that are not listed on the ac-tive market. Depending on their maturity they are classified as current financial assets (maturities up to 12 months after the date of the statement of financial position) or non-cur-rent financial assets (maturities exceeding 12 months after the date of the statement of financial position). Loans and receivables are initially recognized at fair value increased by costs directly attributable to the business transaction. Sub-sequent to their initial recognition, loans and receivables are measured at amortised cost using the effective interest rate method less accumulated impairment loss.
Cash and Cash Equivalents
Cash and cash equivalents comprise cash in hand, bank de-posits up to three months, and other current and readily real-izable investments with an original maturity of three months or less. They are recognized at cost.
Non-Derivative Financial Liabilities
Non-derivative financial liabilities include operating, financial and other liabilities. Non-derivative financial liabilities are initially recognized on the trade date on which the Company becomes a contracting party in relation to the instrument. The company de-recognizes a liability when the contractual obligations are fulfilled, annulled or expired.
Non-derivative financial liabilities are initially disclosed at fair value, increased by costs directly attributable to the business transaction. Subsequent to their initial recognition they are measured at amortised cost using the effective interest rate method. Depending on their maturity they are classified as current liabilities (maturities up to 12 months after the date of the statement of financial position) or non-current liabili-

< back to content
193192 193
financial reportCompany
financial reportCompany
< back to content
ties (maturities exceeding 12 months after the date of the statement of financial position).
Assets Held for Disposal (Disposal Groups)
Assets or disposal groups which include assets and liabilities for which it can be expected that their value will be recovered through sale are classified as assets held for disposal. Assets or disposal groups are re-measured directly before their clas-sification as assets held for disposal. Accordingly, non-current assets or a disposal group are recognized at their carrying amount or fair value less cost of sale, whichever is the lower. Impairment losses on the reclassification of assets as assets held for disposal, and subsequent losses and gains on re-measurement, are recognized in profit or loss. Gains are not recognized in the amount exceeding possible accumulated impairment losses.
Once classified as held for disposal, intangible assets and property, plant and equipment are no longer amortised or depreciated. When investments are classified as assets held for disposal, they are no longer equity accounted.
Impairment of Assets
Financial Assets
A financial asset is impaired if objective evidences indicates that one or more events occurred resulting in a decrease in the estimated future cash flows from this asset which can be reliably estimated.
Objective evidence of the impairment of financial assets can include: default or delinquency by a debtor; restructuring of the amount owed to the company, if the company agrees; indications that the debtor will declare bankruptcy; and the disappearance of the active market for such an instrument.
Impairment of Loans and Receivables
The company assesses evidence regarding the impairment of receivables separately or collectively. All significant receivables are measured separately for specific impairment. If it is as-sessed that the carrying amount of the receivables exceeds the fair value, i.e. the collectible amount, receivables are impaired.
Receivables that are not individually significant are collectively assessed for impairment by grouping together those receiva-bles with similar risk characteristics. The Company creates these groups on the basis of the maturity of receivables. In the evaluation of total impairment the Group uses historical
trends of the probability of default, the timing of recoveries, and the amount of incurred loss adjusted for management judgment as to whether the actual losses due to current eco-nomic and credit conditions could be higher or lower than the losses based on historical trends.
The company assesses the evidence of impairment for each important loan individually.
An impairment loss related to a financial asset measured at amortised cost is calculated as the difference between its car-rying amount and the estimated future cash flows, discount-ed at an original effective interest rate. The loss is recognized in the profit or loss.
Impairment of Available-For-Sale Financial Assets
Impairment losses of available-for-sale financial assets are re-cognized so that the potential accumulated loss, previously recognized in the comprehensive income of the period and included in the fair value reserve, is transferred into profit or loss. Any subsequent increase in the fair value of an impaired available-for-sale equity security is recognized in the compre-hensive income for the period or in the fair value reserve.
Non-Financial Assets
At each reporting date, the Company review the carrying va-lue of its important non-financial assets to determine whe-ther there is an indication of impairments. If any such indica-tion exists, the asset’s recoverable value is estimated.
The recoverable value of assets or cash-generating units is their value in use or fair value, less cost to sell, whichever is greater. In assessing value in use, estimated future cash flows are discounted to their present value, using a pre-tax discount rate that reflects current market assessments of the time va-lue of cash and the risks specific to the asset. In order to test the impairment, assets which cannot be tested individually are joined into the smallest possible group of assets, which create cash flows from further use and which are largely in-dependent of the inflow of other assets or groups of assets (cash-generating units).
The impairment of assets or cash-generating units is recog-nized if their carrying amount exceeds their recoverable va-lue. The impairment is given in the income statement.
The Company evaluates the impairment losses of previous periods at the end of the reporting period and thus deter-mines whether the loss was reduced or even eliminated. An
impairment loss is reversed if there has been a change in the estimates used to determine the asset’s recoverable value. An impairment loss is reversed only to such an extent that the asset’s carrying amount does not exceed the carrying amount that would have been determined after deducting the depre-ciation write-off, if no impairment loss had been recognized for the asset in previous years.
Determination of Fair Value
Following the accounting policies of the Company, in many cases the determination of fair value of non-financial assets and financial assets is necessary, either to measure an indi-vidual asset (measurement method or business combination) or for additional fair value disclosure.
Fair value is the amount for which an asset can be exchanged or the liability can be settled between two well-informed and willing parties in an arm’s length business transaction.
Methods for the determination of fair value of individual groups of assets for measurements or reporting are given below.
Intangible Assets
The fair value of intangible assets is based on the method of discounted cash flows which are expected to arise from the use and possible disposal of the assets.
Property, Plant and Equipment
The fair value of property, plant and equipment is their mar-ket value. The market value of property is equal to the esti-mated value at which the property could be sold on the date of valuation and after proper marketing. The market value of equipment is based on the approach of using the quoted market price for similar items.
Investment Property
The fair value of investment property is assessed by consid-ering the aggregate value of estimated cash flows expected from renting out the property. A yield reflecting specific risks is included in the property valuation, based on discounted net annual cash flows.
Available-for-Sale Financial Assets and Financial Assets at Fair Value through Profit or Loss
The fair value of available-for-sale financial assets and finan-cial assets at fair value through profit or loss is determined
according to preliminarily defined hierarchy levels of deter-mining the fair value of financial instruments. If the fair value cannot be reliably measured, because the wide range of es-timates of reasonable fair values is important, and the prob-ability of different estimates is hard to assess, the Company measures the financial asset at cost.
Loans and Receivables
The fair value of loans and receivables is calculated as the present value of future cash flows discounted at the market interest rate at the end of the period. The assessment consid-ers the credit risk connected to these financial assets.
Non-Derivative Financial Liabilities
The fair value for reporting is calculated on the present value of future repayment and the principal value discounted at the market interest rate at the end of the period.
Equity
Share Capital
The equity of the company is its liability to its owners, which falls due if the company discontinues its operations, in which the equity volume is adjusted according to the currently at-tainable price of total assets. It is defined by the amounts in-vested by the owners, and the amounts that appeared during operation and belong to the owners. It is decreased by the loss from operations and payments to owners, and increased by the profit generated in the period.
Capital Surplus
Capital surplus consists of the amounts from payments ex-ceeding the lowest issue price per share that exceeds the carrying amount upon the disposal of previously-acquired own shares; the amounts on the basis of simplified decrease of share capital; and the amounts on the basis of reversal of general revaluation adjustment.
Legal and Other Reserves
Legal and other reserves are amounts of retained earnings from previous years, which are mostly used to compensate for potential future losses. On their occurrence they are reco-gnized by the body responsible for the preparation of the An-nual Report, or by the decision of the said body.

< back to content
195194 195
financial reportCompany
financial reportCompany
< back to content
Treasury Shares
If the company or its subsidiaries acquire an ownership inter-est, the paid amount including the transaction costs less tax is deducted from the total equity as treasury shares until such shares are withdrawn, regranted or sold.
Dividends
Until approved at the General Assembly of shareholders, the planned dividends are treated as retained earnings.
Provisions
Provisions are recognized if the Company, due to a past event, had a legal or indirect obligation which can be reliably meas-ured, and if there is a probability that settling the obligation will require an outflow of resources, enabling economic be-nefits.
Employee Benefits
In accordance with legal regulations, the Collective Agree-ment and internal regulations, the Company is obliged to make payments arising from loyalty bonuses and severance pay upon retirement, for which non-current provisions are formed. There are no other retirements benefits.
The provisions are formed in the amount of estimated future payments for loyalty bonuses and severance pay, discounted
at the end of the financial year. The calculation is made for each individual employee and includes the costs of severance pay upon retirement and the costs of all expected loyalty bonuses up to retirement. The calculation is prepared by an actuary, selected at group level, on the basis of a projected unit. The provisions are reviewed periodically or when the assumptions used to determine the amount of provision change significantly.
Deferred Revenues
Deferred revenues are expected to cover the estimated ex-penses during a period exceeding one year.
Cash Flow Statement
The cash flow statement shows changes in the balance of cash and cash equivalents for the financial year concerned. The cash flow statement is compiled according to the indirect method.
Segment Reporting
The Company's activity is ‘activities of head offices’. The Board of Directors does not monitor the Company's opera-tions by segment, as activities of head offices represents part of the headquarter and other services segment of the group. Segments are presented in the business and financial part of the Group. 2015 2014
Primary school 1.00 1.00
3 year vocational school 1.30 1.00
4 year vocational school 6.81 7.05
1st cycle (Bologna system) - Bachelor's degree 6.04 4.94
2nd cycle (Bologna system) - Master's degree 36.48 27.47
3rd cycle (Bologna system) - Doctoral degree 10.89 7.93
Total 62.52 49.39
2. Operating Expenses
in € thousand 2015 2014
Costs of goods, materials and services 3,116 2,397
Labour costs 8,835 6,820
- wages and salaries 7,682 5,665
- social security costs 840 520
- other labour costs 313 635
Depreciation and amortisation costs 374 322
Other costs 233 114
Operating expenses 12,558 9,653
in € thousand 2015 2014
In Slovenia 12,884 9,826
In other countries 8 10
Revenue 12,892 9,836
NOTES TO INDIVIDUAL ITEmS IN THE FINANCIAL STATEmENTS
1. Revenue
The auditing costs of the 2015 Annual Report amounted to €18 thousand (2014: €14 thousand).
Average Number of Employees by Level of Education
3. Other Operating Income
in € thousand 2015 2014
Dividends 22,582 56
Other income 116 425
Other operating income 22,698 481
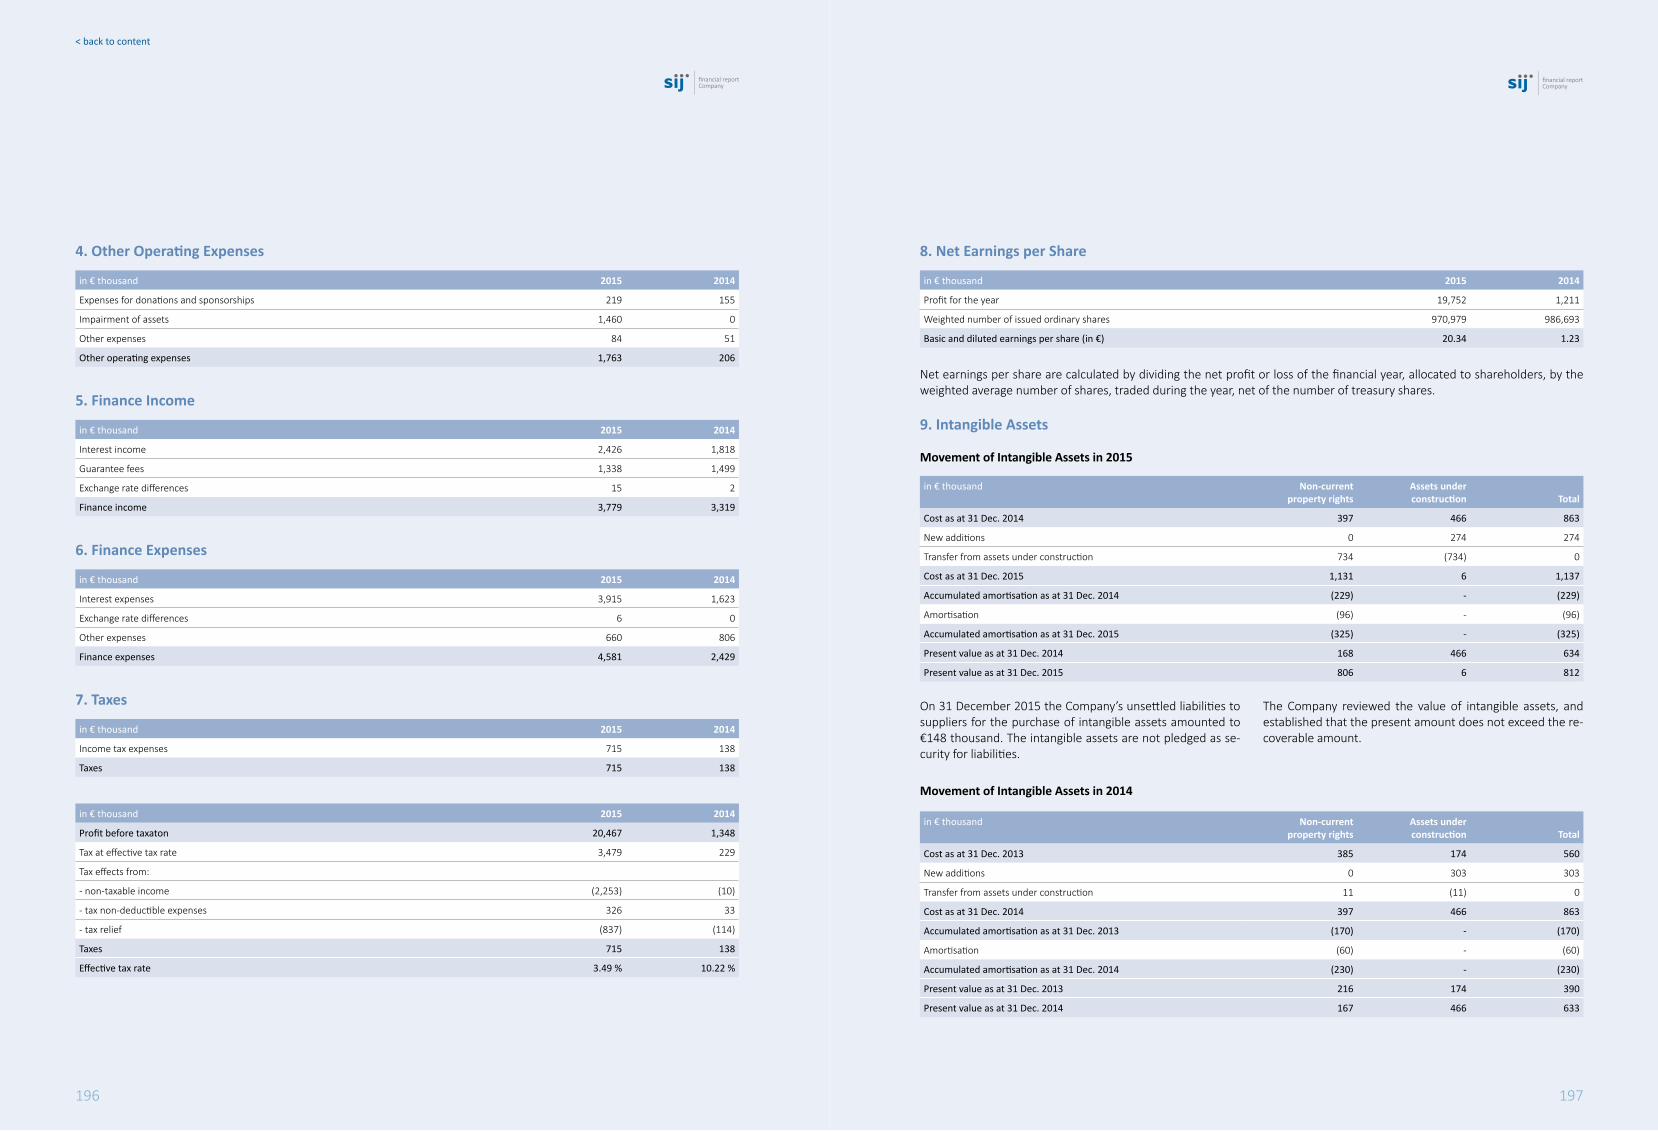
< back to content
197196 197
financial reportCompany
financial reportCompany
< back to content
Net earnings per share are calculated by dividing the net profit or loss of the financial year, allocated to shareholders, by the weighted average number of shares, traded during the year, net of the number of treasury shares.
9. Intangible Assets
Movement of Intangible Assets in 2015
in € thousand 2015 2014
Profit before taxaton 20,467 1,348
Tax at effective tax rate 3,479 229
Tax effects from:
- non-taxable income (2,253) (10)
- tax non-deductible expenses 326 33
- tax relief (837) (114)
Taxes 715 138
Effective tax rate 3.49 % 10.22 %
in € thousand 2015 2014
Income tax expenses 715 138
Taxes 715 138
in € thousand 2015 2014
Profit for the year 19,752 1,211
Weighted number of issued ordinary shares 970,979 986,693
Basic and diluted earnings per share (in €) 20.34 1.23
7. Taxes
8. Net Earnings per Share
Movement of Intangible Assets in 2014
in € thousand Non-currentproperty rights
Assets underconstruction Total
Cost as at 31 Dec. 2014 397 466 863
New additions 0 274 274
Transfer from assets under construction 734 (734) 0
Cost as at 31 Dec. 2015 1,131 6 1,137
Accumulated amortisation as at 31 Dec. 2014 (229) - (229)
Amortisation (96) - (96)
Accumulated amortisation as at 31 Dec. 2015 (325) - (325)
Present value as at 31 Dec. 2014 168 466 634
Present value as at 31 Dec. 2015 806 6 812
in € thousand
Non-currentproperty rights
Assets underconstruction Total
Cost as at 31 Dec. 2013 385 174 560
New additions 0 303 303
Transfer from assets under construction 11 (11) 0
Cost as at 31 Dec. 2014 397 466 863
Accumulated amortisation as at 31 Dec. 2013 (170) - (170)
Amortisation (60) - (60)
Accumulated amortisation as at 31 Dec. 2014 (230) - (230)
Present value as at 31 Dec. 2013 216 174 390
Present value as at 31 Dec. 2014 167 466 633
On 31 December 2015 the Company’s unsettled liabilities to suppliers for the purchase of intangible assets amounted to €148 thousand. The intangible assets are not pledged as se-curity for liabilities.
The Company reviewed the value of intangible assets, and established that the present amount does not exceed the re-coverable amount.
4. Other Operating Expenses
5. Finance Income
6. Finance Expenses
in € thousand 2015 2014
Expenses for donations and sponsorships 219 155
Impairment of assets 1,460 0
Other expenses 84 51
Other operating expenses 1,763 206
in € thousand 2015 2014
Interest income 2,426 1,818
Guarantee fees 1,338 1,499
Exchange rate differences 15 2
Finance income 3,779 3,319
in € thousand 2015 2014
Interest expenses 3,915 1,623
Exchange rate differences 6 0
Other expenses 660 806
Finance expenses 4,581 2,429

< back to content
199198 199
financial reportCompany
financial reportCompany
< back to content
Movement of Property, Plant and Equipment in 2014
in € thousandLand Buildings Equipment
Assets under construction Total
Cost as at 31 Dec. 2013 717 4,210 1,114 621 6,662
New additions 0 0 0 737 737
Transfer from assets under construction 0 910 363 (1,271) 0
Write-offs and disposals 0 0 (172) 0 (172)
Cost as at 31 Dec. 2014 717 5,120 1,305 87 7,229
Accumulated depreciation as at 31 Dec. 2013 - (561) (756) - (1,317)
Depreciation - (132) (131) - (263)
Write-offs and disposals - 0 115 - 115
Accumulated depreciation as at 31 Dec. 2014 - (693) (772) - (1,465)
Present value as at 31 Dec. 2013 717 3,649 358 621 5,345
Present value as at 31 Dec. 2014 717 4,427 533 87 5,764
11. Investments in Subsidiaries
in € thousand
Subsidiary 31 Dec. 2015 31 Dec. 2014
ACRONI, d. o. o., Cesta Borisa Kidriča 44, Jesenice, Slovenia 91,337 83,459
METAL RAVNE d. o. o., Koroška cesta 14, Ravne na Koroškem, Slovenia 31,714 31,714
GRIFFON & ROMANO S. P. A., Via Dossetti 11, Loc. Casinello de Dosso, Italy 15,940 15,850
ŽELEZARNA JESENICE, d. o. o., Cesta železarjev 8, Jesenice, Slovenia 0 7,878
RAVNE STEEL CENTER d. o. o., Litostrojska cesta 60, Ljubljana, Slovenia 6,815 6,815
NIRO Wenden GmbH, Glück-Auf-Weg 2, Wenden, Germany 5,738 5,738
NOŽI RAVNE d. o. o., Koroška cesta 14, Ravne na Koroškem, Slovenia 5,108 5,108
ODPAD d. o. o. Pivka, Velika Pristava 23, Pivka, Slovenia 4,981 4,981
ELEKTRODE JESENICE d. o. o., Cesta železarjev 8, Jesenice, Slovenia 1,256 1,256
SUZ, d. o. o., Cesta Borisa Kidriča 44, Jesenice, Slovenia 616 616
ZIP CENTER d. o. o., Koroška cesta 14, Ravne na Koroškem, Slovenia 67 67
SIJ Asia Gmbh, Berger Str. 2, 40213 Düsseldorf, Germany 100 25
Investments in subsidiaries 163,672 163,507
In June 2015 the Company increased the capital of SIJ Asia. The ownership remained unchanged. In June 2015 the Com-pany increased the capital of Acroni by transferring its share in Železarna Jesenice. The ownership remained unchanged.
In 2015 the Company also increased the capital of Griffon & Romano in the amount of €1,550 thousand. The share in
ownership remained the same. Due to an indication of im-pairment the investment was impaired in the amount of €1,460 thousand.
All subsidiaries are audited except SIJ Asia, which is not yet subject to audit.
in € thousand Subsidiary Activity
% of voting rights
Value ofequity as at
31 Dec. 2015Net profit
2015
ACRONI, d. o. o., Cesta Borisa Kidriča 44, Jesenice, Slovenia Steel production 100 173,356 4,793
METAL RAVNE d. o. o., Koroška cesta 14, Ravne na Koroškem, Slovenia
Steel production 100 93,472 10,534
NOŽI RAVNE d. o. o., Koroška cesta 14, Ravne na Koroškem, Slovenia
Industrial knivesproduction 100 8,739 1,718
ELEKTRODE JESENICE d. o. o., Cesta železarjev 8, Jesenice, Slovenia
Welding materialsproduction
100 5,494 (210)
SUZ, d. o. o., Cesta Borisa Kidriča 44, Jesenice, Slovenia Drawn wires production 100 1,413 270
ZIP CENTER d. o. o., Koroška cesta 14, Ravne na Koroškem, Slovenia
Education and trainingof the disabled 100 389 131
ODPAD d. o. o. Pivka, Velika Pristava 23, Pivka, SloveniaRecovery of secondary raw materials from scrap 74.90 6,983 162
NIRO Wenden GmbH, Glück-Auf-Weg 2, Wenden, GermanySteel cutting, engineering and trade 85 1,224 (2,108)
RAVNE STEEL CENTER d. o. o., Litostrojska cesta 60, Ljubljana, Slovenia Trade 77.28 14,647 1,252
GRIFFON & ROMANO S. P. A., Via Dossetti 11, Loc. Casinello de Dosso, Italy
Heat processing andspecial steel trade 100 847 (1,769)
SIJ Asia Gmbh, Berger Str. 2, 40213 Düsseldorf, Germany Trade 100 189 89
The increase in property, plant and equipment represents the purchase of computer equipment, office furniture and pur-chase of vehicles. Disposals include sales of vehicles, com-puter equipment and office furniture.
Property, plant and equipment are not pledged as security for liabilities. On 31 December 2015 the Company’s unsettled liabilities to suppliers for the purchase of property, plant and equipment amounted to €40 thousand. The present value of
property, plant and equipment under finance lease is €141 thousand. The Company capitalized €1 thousand of borrow-ing costs, for which the interest rates were between 4.25 and 5.06 percent.
The Company reviewed the value of property, plant and equipment, and established that the present amount does not exceed the recoverable amount.
10. Property, Plant and Equipment
Movement of Property, Plant and Equipment in 2015
in € thousandLand Buildings Equipment
Assets under construction Total
Cost as at 31 Dec. 2014 717 5,120 1,305 87 7,229
New additions 0 0 0 146 146
Transfer from assets under construction 0 5 227 (231) 0
Disposals 0 0 (93) 0 (93)
Cost as at 31 Dec. 2015 717 5,125 1,439 2 7,283
Accumulated depreciation as at 31 Dec. 2014 - (693) (772) - (1,465)
Depreciation - (140) (138) - (278)
Disposals - 0 87 - 87
Accumulated depreciation as at 31 Dec. 2015 - (833) (823) - (1,656)
Present value as at 31 Dec. 2014 717 4,427 533 87 5,764
Present value as at 31 Dec. 2015 717 4,292 616 2 5,627

< back to content
201200 201
financial reportCompany
financial reportCompany
< back to content
in € thousand
31 Dec. 2013Changes in the
income statement
Changes incomprehensive
income 31 Dec. 2014
Available-for-sale financial assets (15) 0 (20) (35)
Deferred tax liabilities (15) 0 (20) (35)
Unused tax losses 1,000 0 0 1,000
Employee benefits 63 0 0 63
Deferred tax assets 1,063 0 0 1,063
Deferred tax assets (liabilities), net 1,048 0 (20) 1,028
in € thousand 31 Dec. 2015 31 Dec. 2014
Deferred tax assets 1,063 1,063
Deferred tax liabilities (35) (35)
Deferred tax assets, net 1,028 1,028
in € thousand 31 Dec. 2015 31 Dec. 2014
Other assets 616 102
Other non-current assets 616 102
Movement of Non-Current Loans Issued
Movement of Non-Current Receivables Arising from Finance Lease
in € thousand 2015 2014
Balance as at 1 Jan. 142 415
Receivables arising from finance lease 0 231
Reclassification to current receivables arising from finance lease (88) (504)
Balance as at 31 Dec. 54 142
in € thousand 2015 2014
Balance as at 1 Jan. 5,850 8,934
Loans issued 145,710 2,100
Receipts from loans issues 0 (2,250)
Reclassification to current loans issued (86,311) (2,934)
Balance as at 31 Dec. 65,249 5,850
in € thousand 31 Dec. 2015 31 Dec. 2014
Loans issued 65,249 5,850
Receivables arising from finance lease 55 142
Non-current financial receivables 65,304 5,992
13. Non-Current Financial Receivables
14. Other Non-Current Assets
15. Deferred Tax Assets and Liabilities
The interest rate for loans issued is fixed. The disclosed value of loans issued does not exceed their realizable value. The loans issued fall due in 2020; they are not pledged as security for liabilities and are secured with bills.
The interest rate for receivables arising from finance lease is fixed. The carrying value of the receivables arising from fi-nance lease does not exceed their realizable value. The re-
ceivables arising from finance lease fall due in 2018 and they are not pledged as security for liabilities.
The total unused tax loss on 31 December 2015 amounted to €64,206 thousand. On 31 December 2015 the total non-created deferred tax assets from unused tax losses amounted to €9,915 thousand.
Movement of Deferred Tax Assets and Liabilities in 2014
16. Current Financial Receivables
in € thousand 31 Dec. 2015 31 Dec. 2014
Loans issued 24,937 24,541
Receivables arising from finance lease 89 480
Interest receivables 296 176
Other 439 793
Current financial receivables 25,761 25,990
12. Available-for-Sale Financial Assets
in € thousand 31 Dec. 2015 31 Dec. 2014
Available-for-sale financial assets at cost 44,584 269
Available-for-sale financial assets at fair value 614 616
Available-for-sale financial assets 45,198 885
Available-for-sale financial assets, carried at cost, refer to shares and interests in companies that are not traded on the regulated market and whose fair value cannot be measured reliably. In 2015 the Company acquired 5,000,000 shares with the ticker symbol PPTG of company Perutnina Ptuj in the amount of €40,000 thousand, and 43,197 shares with the ticker symbol PMPG of company Holding PMP in the amount of €4,320 thousand. According to its strategic plan, the Com-pany will demerge these investments in 2016 into a separate
new company of which the ownership will remain unchanged. Available-for-sale financial assets, carried at fair value, refer to shares and interests in companies that are traded on the regulated market and whose fair value can be measured reli-ably. These assets decreased due to revaluation at fair value in the amount of €2 thousand charged to the comprehensive income.
Received dividends in 2015 amounted to €86 thousand.
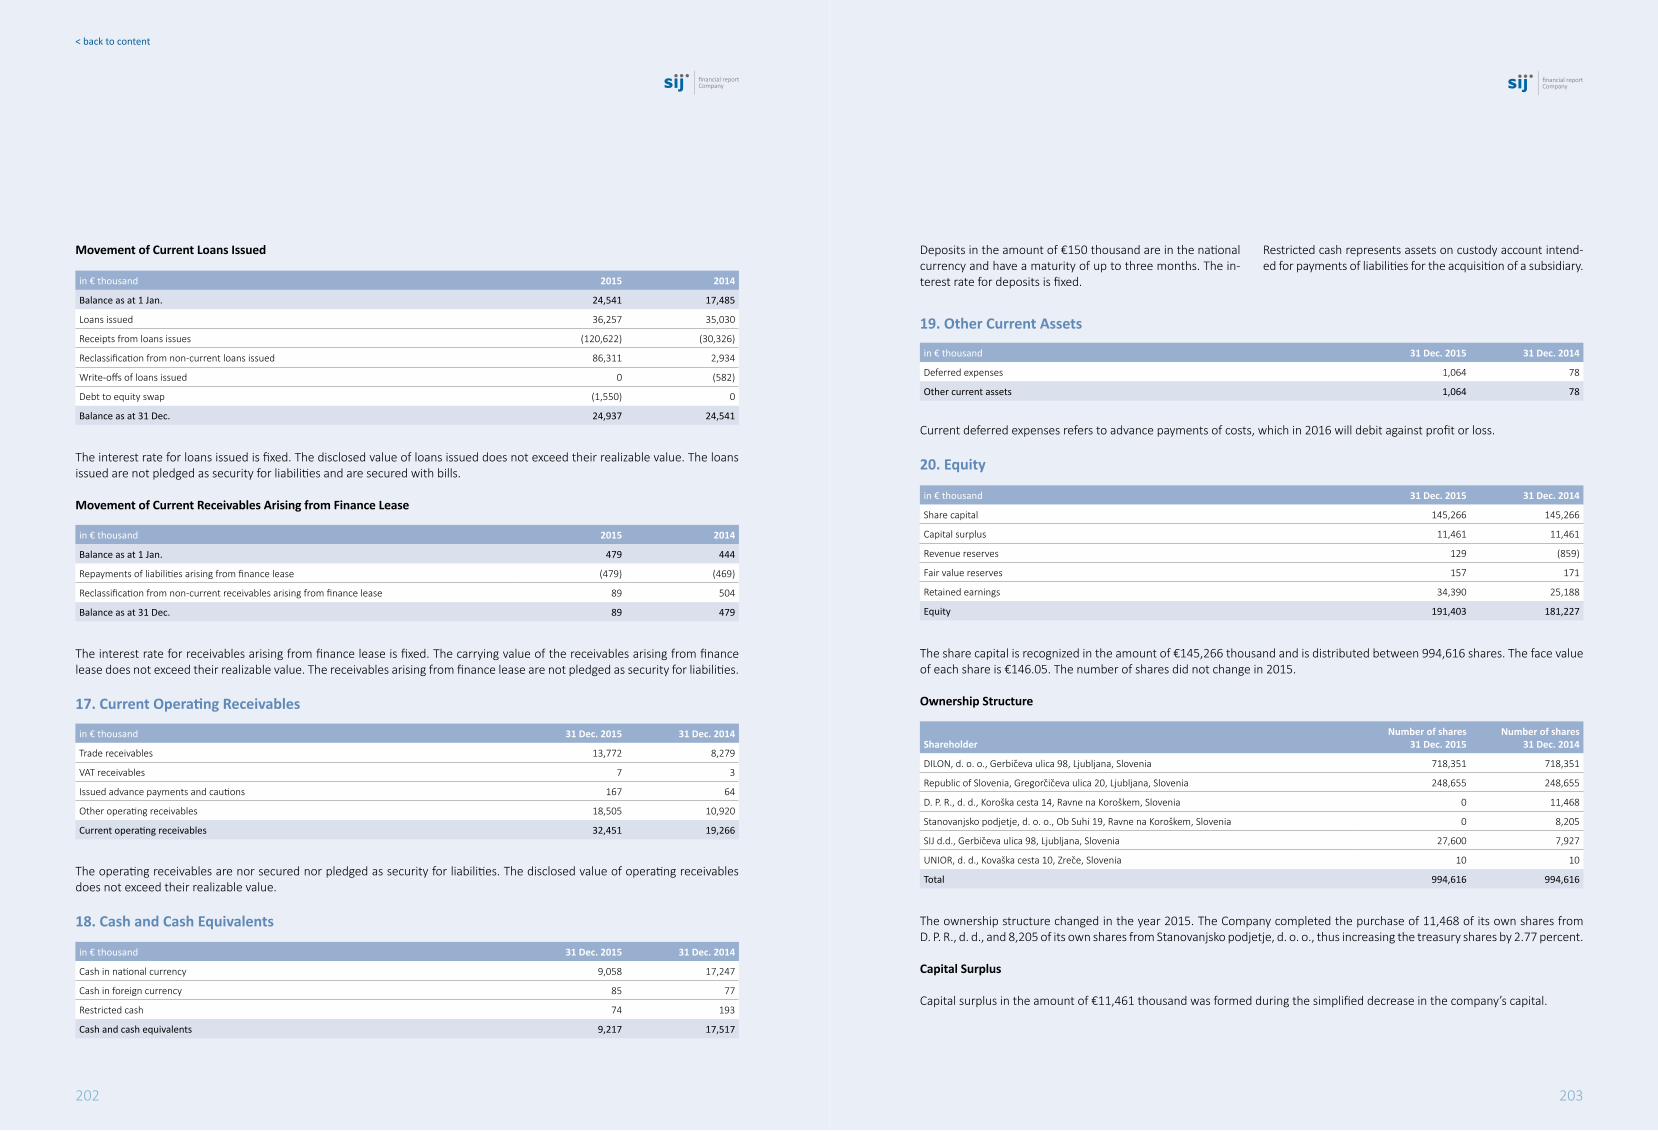
< back to content
203202 203
financial reportCompany
financial reportCompany
< back to content
in € thousand 2015 2014
Balance as at 1 Jan. 479 444
Repayments of liabilities arising from finance lease (479) (469)
Reclassification from non-current receivables arising from finance lease 89 504
Balance as at 31 Dec. 89 479
The interest rate for receivables arising from finance lease is fixed. The carrying value of the receivables arising from finance lease does not exceed their realizable value. The receivables arising from finance lease are not pledged as security for liabilities.
17. Current Operating Receivables
The operating receivables are nor secured nor pledged as security for liabilities. The disclosed value of operating receivables does not exceed their realizable value.
18. Cash and Cash Equivalents
Current deferred expenses refers to advance payments of costs, which in 2016 will debit against profit or loss.
20. Equity
in € thousand 31 Dec. 2015 31 Dec. 2014
Trade receivables 13,772 8,279
VAT receivables 7 3
Issued advance payments and cautions 167 64
Other operating receivables 18,505 10,920
Current operating receivables 32,451 19,266
in € thousand 31 Dec. 2015 31 Dec. 2014
Cash in national currency 9,058 17,247
Cash in foreign currency 85 77
Restricted cash 74 193
Cash and cash equivalents 9,217 17,517
Deposits in the amount of €150 thousand are in the national currency and have a maturity of up to three months. The in-terest rate for deposits is fixed.
Restricted cash represents assets on custody account intend-ed for payments of liabilities for the acquisition of a subsidiary.
in € thousand 31 Dec. 2015 31 Dec. 2014
Deferred expenses 1,064 78
Other current assets 1,064 78
19. Other Current Assets
in € thousand 31 Dec. 2015 31 Dec. 2014
Share capital 145,266 145,266
Capital surplus 11,461 11,461
Revenue reserves 129 (859)
Fair value reserves 157 171
Retained earnings 34,390 25,188
Equity 191,403 181,227
The share capital is recognized in the amount of €145,266 thousand and is distributed between 994,616 shares. The face value of each share is €146.05. The number of shares did not change in 2015.
Ownership Structure
The ownership structure changed in the year 2015. The Company completed the purchase of 11,468 of its own shares fromD. P. R., d. d., and 8,205 of its own shares from Stanovanjsko podjetje, d. o. o., thus increasing the treasury shares by 2.77 percent.
Capital Surplus
Capital surplus in the amount of €11,461 thousand was formed during the simplified decrease in the company’s capital.
ShareholderNumber of shares
31 Dec. 2015Number of shares
31 Dec. 2014
DILON, d. o. o., Gerbičeva ulica 98, Ljubljana, Slovenia 718,351 718,351
Republic of Slovenia, Gregorčičeva ulica 20, Ljubljana, Slovenia 248,655 248,655
D. P. R., d. d., Koroška cesta 14, Ravne na Koroškem, Slovenia 0 11,468
Stanovanjsko podjetje, d. o. o., Ob Suhi 19, Ravne na Koroškem, Slovenia 0 8,205
SIJ d.d., Gerbičeva ulica 98, Ljubljana, Slovenia 27,600 7,927
UNIOR, d. d., Kovaška cesta 10, Zreče, Slovenia 10 10
Total 994,616 994,616
Movement of Current Loans Issued
in € thousand 2015 2014
Balance as at 1 Jan. 24,541 17,485
Loans issued 36,257 35,030
Receipts from loans issues (120,622) (30,326)
Reclassification from non-current loans issued 86,311 2,934
Write-offs of loans issued 0 (582)
Debt to equity swap (1,550) 0
Balance as at 31 Dec. 24,937 24,541
The interest rate for loans issued is fixed. The disclosed value of loans issued does not exceed their realizable value. The loans issued are not pledged as security for liabilities and are secured with bills.
Movement of Current Receivables Arising from Finance Lease

< back to content
205204 205
financial reportCompany
financial reportCompany
< back to content
in € thousand 31 Dec. 2015 31 Dec. 2014
Fair value reserves due to available-for-sale financial assets 203 206
Deferred tax liabilities (35) (35)
Net actuarial losses on pension programs (11) 0
Fair value reserves 157 171
in € thousand 31 Dec. 2015 31 Dec. 2014
Retained earnings 15,625 23,978
Profit for the year 18,765 1,210
Distributable profit 34,390 25,188
Fair Value Reserves
Distributable Profit
Movement of Employee Benefits in 2015
21. Employee Benefits
in € thousand 31 Dec. 2015 31 Dec. 2014
Provisions for severance pay 368 445
Provisions for loyalty bonuses 23 17
Employee benefits 391 462
The actuarial calculation was made on the basis of the actuari-al model and assumptions derived from life tables, the growth in wages in the Republic of Slovenia, and the yield curve, which represents the relationship between market yields on government bonds in the Eurozone and the time remaining
to maturity. The discount rate considered in the calculations ranged between 0.0 and 2.3 percent, depending on maturity.
The Company did not carry out an actuarial calculation in 2014.
in € thousand 31 Dec. 2014 Creation Reversal 31 Dec. 2015
Provisions for severance pay 445 0 (77) 368
Provisions for loyalty bonuses 17 6 0 23
Employee benefits 462 6 (77) 391
22. Non-Current Financial Liabilities
in € thousand 31 Dec. 2015 31 Dec. 2014
Borrowings 28,500 0
Liabilities for bonds issued 94,115 42,897
Liabilities arising from finance lease 85 201
Non-current financial liabilities 122,700 43,098
Liabilities for Bonds Issued
Liabilities for bonds issued refer to the bonds issued with the ticker symbol SIJ4. The bonds were issued by the Company with a total nominal value of €42,897 thousand. The entire bond issue contains 42,897 denominations of €1 thousand; the bond maturity date is 24 November 2019. The interest rate on the bonds is fixed, i.e. 4.50 percent per annum. Inter-est is accrued annually in arrears. The nominal value of the principal falls due, in full and in a single amount, on the matu-rity of the bond. The bonds have been traded on the Ljubljana Stock Exchange.
Liabilities for bonds issued refer to the bonds issued with the ticker symbol SIJ5. The bonds were issued by the Company with a total nominal value of €51,218 thousand. The entire bond issue contains 51,218 denominations of €1 thousand; the bond maturity date is 21 July 2019. The interest rate on the bonds is fixed, i.e. 4.00 percent per annum. Interest is ac-crued annually in arrears. The nominal value of the principal falls due, in full and in a single amount, on the maturity of the bond. The bonds have been traded on the Ljubljana Stock Exchange.
The lowest sum of future leases due for payment in the next financial year amounted to €122 thousand on 31 December 2015, and the net present value of leases amount to €87 thousand on the same date.
The net present value of leases due for payment in the next financial year amounted to €116 thousand on 31 December 2015, and the net present value of leases amount to €85 thousand on the same date.
in € thousand 2015 2014
Balance as at 1 Jan. 201 499
Liabilities arising from finance lease 0 325
Reclassification to current liabilities arising from finance lease (116) (623)
Balance as at 31 Dec. 85 201
Movement of Non-Current Liabilities Arising from Finance Lease
The Company acquired treasury shares in the amount of €2,255 thousand on the basis of the Act Regulating the In-currence and Settlement of Liabilities of Slovenske železarne as regards the Restructuring Programme (Official Gazette of the RS, nr. 111/2001) and in line with the Privatization of Slo-venske železarne Act (Official Gazette of the RS, nr. 13/1998). The treasury shares were acquired by exchanging interests in subsidiaries for shares in the parent company, owned by au-thorized companies. The shares were acquired ex lege and
were not in line with the Companies Act, which is why the Company did not establish a treasury shares fund. Shares are recognized at cost.
In 2015 the Company acquired 19,673 treasury shares on the basis of decisions taken at the 25th General Assembly of 9 June 2014, and established reserves in the amount of €3,752 thousand for treasury shares. Shares are recognized at cost.
Revenue Reserves
in € thousand 31 Dec. 2015 31 Dec. 2014
Legal reserves 2,384 1,396
Treasury shares (6,009) (2,257)
Reserves for treasury shares 3,754 2
Revenue reserves 129 (859)

< back to content
207206 207
financial reportCompany
financial reportCompany
< back to content
in € thousand 2015 2014
Balance as at 1 Jan. 11,401 27,521
Borrowings 2,600 40,905
Repayments for borrowings (16,495) (58,275)
Reclassification from non-current borrowings 16,000 1,250
Balance as at 31 Dec. 13,506 11,401
in € thousand 2015 2014
Balance as at 1 Jan. 547 506
Repayments of liabilities arising from finance lease (547) (583)
Reclassification from non-current liabilities arising from finance lease 116 624
Balance as at 31 Dec. 116 547
Movement of Current Liabilities Arising from Finance Lease
Movement of Current Borrowings
The lowest sum of future leases due for payment in the next financial year amounts to €122 thousand on 31 December 2015, and the net present value of leases amounts to €116 thousand on the same date.
Liabilities for Commercial Papers Issued
Transactions with Subsidiaries
Liabilities for commercial papers amounting to €17,662 thou-sand refer to 12-month commercial papers with the ticker symbol SIK02, issued by the Company on 18 December 2015. The total nominal value of the commercial papers is €17,662 thousand, and covers 17,662 denominations of €1 thousand. The interest rate for a commercial paper is 2.20 percent per
annum. Commercial papers are a discounted security. Inter-est is charged in advance and deducted on payment of a commercial paper in the form of a discount from the nominal value of the commercial paper. Liabilities from commercial papers are payable on 16 December 2016. Commercial pa-pers trading takes place at the Ljubljana Stock Exchange.
Transactions with Management
This is the total amount of receipts on the basis of the busi-ness management contract, received in the financial year for the performance of functions or tasks in the company by
members of the Board of Directors, other workers employed on contracts for which the tariff part of the collective agree-ment does not apply, and members of the Supervisory Board.
25. Contingent Assets and Liabilities
Contingent liabilities for issued guarantees amounted to €158,098 thousand on 31 December 2015. The Company expects no outflows from the issued guarantees.
The Company has no contingent assets on 31 December 2015.
RELATED PARTIES
Related parties are the parent company (including its parent companies and companies in their groups), subsidiaries, associ-ates, other related parties and the management of companies.
Transactions with the Parent Company
24. Current Operating Liabilities
in € thousand 31 Dec. 2015 31 Dec. 2014
Liabilities to suppliers 1,408 1,400
Liabilities to employees 278 403
Received advance payments 5 5
Tax liabilities 922 1,149
Other liabilities 76 578
Current operating liabilities 2,689 3,535
in € thousand 2015 2014
Revenues 20 1,030
(in thousand EUR) 31 Dec. 2015 31 Dec. 2014
Receivables 3,022 2
in € thousand 2015 2014
Revenues 39,129 12,145
Expenses 1,015 1,786
in € thousand 31 Dec. 2015 31 Dec. 2014
Receivables 120,230 52,412
Liabilities 11,719 11,532
23. Current Financial Liabilities
in € thousand 31 Dec. 2015 31 Dec. 2014
Borrowings 13,506 11,401
Liabilities for commercial papers issued 17,662 0
Interest liabilities 1,487 292
Liabilities arising from finance lease 116 547
Other current financial liabilities 136 0
Current financial liabilities 32,907 12,240
Current borrowings include loans from companies in the Group. Borrowings are secured with bills. The interest rate for borro-wings and finance leases is fixed.

< back to content
209208 209
financial reportCompany
financial reportCompany
< back to content
FINANCIAL INSTRUmENTS AND RISKS
Credit Risk
On the reporting date the largest exposure arises from trade receivables, other operating receivables, financial receivables and deposits.
Age Structure of Financial Assets
Liquidity Risk
The Company is managing liquidity risk by the appropriate planning of cash flow and current credit lines from banks agreed in advance, which ensures that the Company is capable of settling any overdue liabilities at any time.
Based on the test of the fair value of financial instruments the Company assesses that there are no significant deviations from their carrying amount.
Exposure to banks is assessed as moderate. The Company fully complies with the conditions stated in the loan contracts in the section defining the disclosure of data, payment of interest and repaying the principal value.
Foreign Exchange Risk
The Company mostly operates in the domestic territory and the Eurozone and therefore estimates the exposure to foreign exchange risk to be minimal.
Interest Rate Risk
The interest rates for financial liabilities are fixed, therefore the Company estimates the exposure to interest rate risk to be minimal.
Equity Management
The Company monitors the status of overdue receivables on a daily basis, and prepares 3-month plans twice a month with the aim of achieving optimum debt. Larger investments are financed by non-current assets.
in € thousand
31 Dec. 2015 Not overdue
Overdue
TotalUp to 3 months 3 months to 1 year
Trade receivables 6,105 4,768 2,898 13,771
Financial receivables and deposits 91,208 5 0 91,213
Total 97,313 4,773 2,898 104,984
in € thousand
31 Dec. 2014 Not overdue
Overdue
TotalUp to 3 months 3 months to 1 year
Trade receivables 4,536 2,991 752 8,279
Financial receivables and deposits 48,608 78 0 48,686
Total 53,144 3,069 752 56,965
in € thousand
31 Dec. 2015 Up to 3 months 3 months to 1 year 1 year to 5 years Total
Liabilities to suppliers 1,292 117 0 1,400
Borrowings 5,346 29,652 129,646 164,644
Other operating and financial liabilities 0 75 1 76
Total 6,638 29,844 129,647 166,129
in € thousand
31 Dec. 2014 Up to 3 months 3 months to 1 year 1 year to 5 years Total
Liabilities to suppliers 1,395 5 0 1,400
Borrowings 6,719 5,680 43,098 55,497
Other operating and financial liabilities 579 0 3 582
Total 8,693 5,685 43,101 57,479
in € thousand 2015 Debt increase by 10% Debt decrease by 10%
Level of debt on equity 81.30 89.43 73.17
Equity 191,403 191,403 191,403
Financial liabilities 155,607 171,168 140,046
24. Carrying Amounts and Fair Values of Financial Instruments
in € thousand
Type of financial instrument
31 Dec. 2015 31 Dec. 2014
Carrying amount Fair value Carrying amount Fair value
Available-for-sale financial assets 45,198 45,198 885 885
Financial receivables 91,063 91,063 31,983 31,983
Operating receivables 32,480 32,480 19,295 19,295
Cash and cash equivalents 9,217 9,217 17,517 17,517
Financial liabilities (155,607) (155,607) (55,338) (55,338)
Operating liabilities (2,690) (2,690) (3,538) (3,538)
Total 19,661 19,661 10,804 10,804
The receipts include gross salaries, paid reimbursements re-lated to work in accordance with the regulations (daily allow-ance, mileage, overnight accommodation etc.), and bonuses.
The Company did not grant any loans, issue any guarantees or make any advance payments to the management of the Company or the members of the Supervisory Board in 2015.
in € thousand 2015
Management and employees with service contracts 6,582
Members of the Supervisory Board 66

< back to content
211210 211
financial reportCompany
< back to content
računovodsko poročilodružbe
in € thousand 31 Dec. 2015 31 Dec. 2014
Financial assets at fair value at the first level 614 616
Financial assets at fair value at the third level 135,647 32,251
Financial liabilities at fair value at the third level (155,607) (55,338)
EVENTS AFTER THE REPORTING DATE
A takeover bid to buy shares in Holding PMP, naložbena de-javnost, d. d., Vinarski trg 1, 2250 Ptuj, published by the Company on 4 December 2015, ended on 2 February 2016. During the duration of the takeover bid from (and including)5 December 2015 up to (and including) 2 February 2016, the offer was accepted by 28 acceptors, who jointly held 33,673 shares in the target company with the ticker symbol PMPG, constituting 43.81 percent of all shares in the target company. Together with the 43,197 shares of Holding PMP d. d. held by the Company on the date of publication of the takeover bid, the Company acquired all 76,870 issued shares or 100 percent of Holding PMP d. d. on 11 February 2016 by rebooking the shares.
On 2 March 2016 a takeover procedure to buy shares of PE-RUTNINA PTUJ reja perutnine, proizvodnja krmil, perutnin-
skega mesa in izdelkov, trgovina in storitve d. d., Potrčeva cesta 10, 2250 Ptuj, ended successfully; the offer was published on 24 December 2015. During the duration of the takeover bid from (and including) 28 December 2015 up to (and including) 25 February 2016, the offer was accepted by 2,348 accep-tors, who jointly held 2,846,733 shares in the target company with the ticker symbol PPTG, constituting 26.09 percent of all shares in the target company. Together with 5,000,000 shares in Perutnina Ptuj d. d., held by the Company on the date of publication of the takeover bid, and 603,184 shares in the tar-get company, held by Holding PMP d. d. on the date of publi-cation of the takeover bid, amounting to 5,603,184 shares in Perutnina Ptuj d. d. held directly or indirectly by the acquirer on the date of publication of the takeover bid, the Company now holds 8,449,917 shares, constituting 77.43 percent of all the issued shares in PERUTNINA PTUJ d. d.
Fair Value Measurements
To determine fair value, the Company, where possible, takes into account the market value of financial instruments. The Company begins measuring the financial assets in the valua-tion model when it is estimated that the market is inactive. In accordance with the IFRS and accounting policies, the Com-pany divides financial instruments into three levels:
Level 1 includes financial instruments whose fair value is fully determined on the basis of prices quoted in an active market.
Level 2 includes financial instruments whose fair value is de-termined on the basis of valuation models which take into ac-count variables that are derived on the basis of publicly avail-able market data (such as market interest rates).
Level 3 includes financial instruments whose fair value is de-termined on the basis of valuation models which take into account subjective variables, which are not publicly available on the market.
TECHNICAL TERmS AND CONCEPTS
AOD device argon oxygen decarburization
Black coils coils from non-alloy types of steel
Duplex steel stainless steel where a ferrite and austenitic structure is present at room temperature
CNC cutting and grinding machine
SLAB flat semi-finished steel product
INGOT block of cast steel for further processingin forging, rolling or drawing
Electric arc furnace furnace for smelting scrap steel where the energy source is an electric arc
ERP Enterprise Resource Planning; system used to support planning at all organisational levels
Ferroalloy iron-based metal additive
Steel industryequipment
devices used to produce and process steel
Alloy metal additive
Maraging steel steel where improved mechanical charac-teristics are achieved through precipitation hardening
Stainless austenitic steels
chromium- and nickel-based steel wherean austenitic structure is present at room temperature
Clad plates two- or multi-ply plates where individual plates are forged together
Ladle furnace furnace used to heat melt in a ladle
Ladle steel vessel lined with flame resistant material that is used to transfer and processes melts
Pass-through business model
direct pass-through of raw material costs to a product’s selling price
CHP cogeneration of heat and power
SSAP state-of-the-art technology supported by an ecological method for handling waste materials
UHP (ultra high power electric arc furnace)
electric arc furnace where installed power exceeds 1 MW per tonne of input
VAR device vacuum arc remelting
VIM device vacuum induction melting
VOD device vacuum oxygen decarburization
Ferrochrome alloy of iron and chromium with different carbon contents (from 0.1% to 6%) and other admixtures that is used in the production of steel as a chromium additive
Vanadium chemical element
Molybdenum chemical element
Nickel alloys cast iron and other metals with nickel that are useful due to their corrosion and/or flame resistant characteristics and low temperature coefficient
Plasma cutting process of cutting electrically conductive materials with a jet of hot plasma

< back to content
212
< back to content
SIJ - Slovenska industrija jekla, d.d.Gerbičeva 98, 1000 LjubljanaPhone: +386 1 / 242 98 00www.sij.si
Published by: SIJ - Slovenska industrija jekla, d.d.Creative concept: Taktik d.o.o.Graphic design: Media Vox d.o.o.Photos: Dobran Laznik, Tomo Jeseničnik, archives SIJ d.d.Production: ZIP center d.o.o.
April 2016