Clearing the Air report for approval - Pembina Institute Pembina Institute ii Clearing the Air on...
36
JENNIFER GRANT SIMON DYER • DAN WOYNILLOWICZ June 2009 SERIES SANDS Fever Oil CLEARING THE AIR SANDS Myths Oil
Transcript of Clearing the Air report for approval - Pembina Institute Pembina Institute ii Clearing the Air on...

JENNIFER GRANTSIMON DYER • DAN WOYNILLOWICZ
June 2009
SER I E SSANDSFeverOil
CLEARING THE AIR
SANDSMythsOil

Clearing the Air on Oil Sands Myths
Jennifer Grant
Simon Dyer • Dan Woynillowicz
June 2009
The Pembina Institute ii Clearing the Air on Oil Sands Myths
Grant, Jennifer, Simon Dyer and Dan Woynillowicz Clearing the Air on Oil Sands Myths Production management: Roland Lines Editor, Design/Layout: Roberta Franchuk Cover Photo: C. Campbell, The Pembina Institute
©2009 The Pembina Institute and The Pembina Foundation
The Pembina Foundation for Environmental Research and Education is a national registered charitable organization that enters into contractual agreements with environmental research and education experts, such as the Pembina Institute, to deliver on its work.
ISBN 1-897390-23-8
The Pembina Institute Box 7558 Drayton Valley, Alberta Canada T7A 1S7 Phone: 780-542-6272 Email: [email protected]
Additional copies of this publication may be downloaded from the Pembina Institute website: www.pembina.org.
About the Pembina Institute The Pembina Institute is a national non-profit think tank that advances sustainable energy solutions through research, education, consulting and advocacy. It promotes environmental, social and economic sustainability in the public interest by developing practical solutions for communities, individuals, governments and businesses. The Pembina Institute provides policy research leadership and education on climate change, energy issues, green economics, energy efficiency and conservation, renewable energy, and environmental governance. For more information about the Pembina Institute, visit www.pembina.org or contact [email protected]. Our engaging monthly newsletter offers insights into the Pembina Institute’s projects and activities, and highlights recent news and publications. Subscribe to Pembina eNews: http://www.pembina.org/enews/subscribe.

The Pembina Institute iii Clearing the Air on Oil Sands Myths
Contents: The Plain Facts on Oil Sands Climate Change 1. Alberta’s greenhouse gas regulation does not require real reductions in emissions from oil
sands operations..................................................................................................................2 2. Oil sands production is much more greenhouse gas–intensive than conventional oil
production. ...........................................................................................................................3 3. Oil sands are the fastest-growing source of greenhouse gas emissions in Canada..............5 4. Continued increases in greenhouse gas emissions show that Canada’s commitment to
address climate change falls far short of what's needed. .....................................................6 5. Large-scale carbon capture and storage for oil sands emissions is currently a distant and
uncertain prospect. ..............................................................................................................8 6. Companies are allowed to switch to burning dirtier fuels as a source of energy for oil sands
extraction — further increasing greenhouse gas emissions from the oil sands...................10 Water Impacts 7. Oil sands mining uses two to four barrels of water for every barrel of bitumen produced....11 8. Oil sands companies are not required to stop withdrawing water from the Athabasca River,
even if flows are so low that fisheries and habitat are at serious risk..................................13 9. Capping toxic tailings waste in end pit lakes with water is an unproven and risky concept. 14 10. For over 40 years, oil sands mining companies voluntarily managed tailings on their own, in
the absence of concrete government regulations. ..............................................................15 11. Tailings lakes seep toxic waste. It is uncertain exactly what is seeping, how much is
seeping and what ecosystem components are affected. ....................................................16 12. Tailings lakes house compounds known to be acutely toxic to aquatic organisms. ............17 13. Reclamation of tailings lakes has not yet been demonstrated. ...........................................19 Boreal Forest Impacts 14. Alberta’s oil sands underlie one-fifth of the province, and development is already planned
for more than 79,000 square kilometres. ............................................................................20 15. Cumulatively, the potential area affected by in situ development is about 40 times larger
than the mineable zone......................................................................................................21 16. The Athabasca Boreal Forest will not be restored to its native state following mine closure
........................................................................................................................................ 22 17. Oil sands mining reclamation standards are weak and lack transparency; only one square
kilometre of land has been certified as reclaimed to date. ..................................................23 18. The security bonds that are supposed to protect Canadians from costly environmental
liabilities may be inadequate. .............................................................................................24 Environmental Management 19. First Nations are not consulted prior to mineral lease sales. ..............................................26 20. Aquatic monitoring is conducted by an industry-funded group that has been criticized for
using an analytically weak, biased and inconsistent monitoring approach..........................27 21. There is no regional environmental management system to address the cumulative impacts
of oil sands development. ..................................................................................................28 22. Absolute limits are lacking for air emissions, land disturbance and water withdrawals. ......29 23. There is substantial room for the oil sands mining sector to improve its environmental
performance.......................................................................................................................32

The Pembina Institute 1 Clearing the Air on Oil Sands Myths
Clearing the Air on Oil Sands Myths The Spin, the Plain Facts and the Full Story on Oil Sands Impacts
There is simply no denying it: oil sands operations have major impacts on land, air and water. In an era when climate change is threatening to fundamentally change the planet, it is critical to understand the full environmental and social costs of these projects. Our ability to make good decisions depends on it.
Why do we need to clear the air on oil sands myths?
• Facts matter. Canadians and international observers alike need to have the full story about the environmental implications of oil sands development to arrive at an informed opinion.
• The issues are complex. We need to expose the full context of oil sands development to get a true understanding of its impacts on air, land and water.
• Downplaying the risks is irresponsible. Responsible development can occur only if the governments of Alberta and Canada and the oil sands industry first acknowledge the issues and then implement policies, regulations and approaches to address them.
Focusing on public relations instead of public policy is a strategy that backfires. Observers scrutinizing the oil sands see through the spin and shallow promises made by government
and industry, which further diminishes Canada’s reputation.
The information presented here draws on independent research, public information and the work of others to put the relevant facts in their proper context. It delivers the full story behind the most common oil sands “spin” promoted by the oil sands industry and the governments of Alberta and Canada through the selective release of information or the creative use of statistics.

Climate Change
The Pembina Institute 2 Clearing the Air on Oil Sands Myths
1. Alberta’s greenhouse gas regulation does not require real reductions in emissions from oil sands operations.
The Spin: “Alberta is a leader in how we manage greenhouse gases...”1
The Plain Facts: While the scientific consensus is that there must be deep reductions in greenhouse gas emissions, Alberta’s climate plan will lead to emissions in 2050 that are higher than 1990 levels.
The Full Story: The Alberta regulation, which came into effect in July 2007, sets targets to reduce the emissions intensity — the amount of emissions per unit of production — of Alberta facilities that emit more than 100,000 tonnes of greenhouse gases (GHGs) a year.2 However, firms are free to “meet” the targets by making low-cost payments into a fund, instead of securing actual emission reductions. It is not yet known how effectively investments made by the fund will cut GHG emissions. And even if firms had to meet the targets with actual emission reductions, oil sands emissions would continue to grow because of the fast pace of projected increases in production.
The Alberta Climate Change Plan sets a target to reduce the province’s GHG emissions in 2050 by 50 percent from what they would be under “business-as-usual,” or by 14 percent from the 2005 level.3 In the medium term, the provincial plan foresees Alberta’s emissions rising to about 20 percent above the 2005 level by 2020.
However, the provincial plan neglects to mention that the base year for international climate change obligations is 1990, not 2005. The plan’s targets for GHG emissions are thus 16 percent higher than the 1990 level in 2050, and about 60 percent higher than the 1990 level in 2020.4 The plan contains no targets for reducing GHG emissions in absolute terms and no requirements for large polluters, such as oil sands operations, to make absolute emissions reductions.
1 Government of Alberta, “Legislation Launches Climate Change Fund as Vehicle to Deliver Real Emission Reductions,” media release, April 30, 2008, http://alberta.ca/home/NewsFrame.cfm?ReleaseID=/acn/200804/23419A1030535-DBAD-651B-8FB5E6FBDB74469C.html. 2 Government of Alberta, “Setting a Course for Real Reductions,” in Alberta’s 2008 Climate Change Strategy (2008), 23, http://environment.gov.ab.ca/info/library/7894.pdf. 3 Ibid. 4 Environment Canada, National Inventory Report: Greenhouse Gas Sources and Sinks in Canada, 1990–2007, http://unfccc.int/national_reports/annex_i_ghg_inventories/national_inventories_submissions/items/4771.php. According to Environment Canada, Alberta’s total GHG emissions in 2005 were 34.5% higher than in 1990.

Climate Change
The Pembina Institute 3 Clearing the Air on Oil Sands Myths
2. Oil sands production is much more greenhouse gas–intensive than conventional oil production.
The Spin: “When the entire carbon footprint of oil is considered, crude from the oil sands stacks up very closely with other sources.”5
The Plain Facts: Whether you compare greenhouse gas emissions on a full life cycle basis or on production values, oil sands development consistently produces higher greenhouse gas emissions than conventional oil production.
The Full Story: It is true that extracting oil from the ground is only one part of the entire life cycle of a barrel of oil — the complete life cycle also considers refining the oil into gasoline or diesel fuel, transporting the fuel and ultimately using it in a vehicle. GHGs are emitted at all steps in this “well-to-wheels” life cycle, but more than 80 percent of total emissions are created when the gasoline or diesel fuel is combusted in a vehicle. The other 20 percent of emissions come from the activities needed to get gasoline or diesel fuel to the pump.6
Even using this full life cycle analysis, which uses the large contribution of vehicle combustion to minimize the importance of emissions from production, oil sands are still one of the most GHG intensive oil sources overall. (Figure 1).
5 Government of Alberta, Alberta’s Oil Sands: Resourceful. Responsible. (September 2008), 9, http://environment.gov.ab.ca/info/library/7925.pdf. 6 Timothy J. Skone and Kristin Gerdes, Development of Baseline Data and Analysis of Life Cycle Greenhouse Gas Emissions of Petroleum-Based Fuels (U.S. Department of Energy National Energy Technology Laboratory, 2008), ES-2, http://www.netl.doe.gov/energy-analyses/pubs/NETL%20LCA%20Petroleum-Based%20Fuels%20Nov%202008.pdf.

Climate Change
The Pembina Institute 4 Clearing the Air on Oil Sands Myths
Figure 1. Contribution of source to the 2005 baseline wells-to-wheels GHG emissions for diesel fuel (by GHG component)7
Although there is a high degree of variation, the production of synthetic crude oil from oil sands is approximately three times more GHG-intensive than Canadian conventional oil production8, as indicated in Table 1. Environment Canada has estimated that, per unit of output, GHG emissions from oil sands mining and upgrading are about five times greater than those from conventional light/medium crude oil production.9
Table 1. GHG emissions for crude oil production by source10
Source of Crude Oil GHG Emissions kg CO2e/bbl
Canadian Oil Sands Synthetic Crude Oil
– In situ
99 – 176
Canadian Oil Sands Synthetic Crude Oil
– Mining
62 – 164
Canadian Conventional Crude Oil 27 – 58
7 Kristin J. Gerdes and Timothy J. Skone, An Evaluation of the Extraction, Transport and Refining of Imported Crude Oils and the Impact on Life Cycle Greenhouse Gas Emissions (National Energy Technology Laboratory, 2009), 16, figure 3-3, http://www.netl.doe.gov/energy-analyses/pubs/PetrRefGHGEmiss_ImportSourceSpecific1.pdf. 8 Alex D. Charpentier, Joule A. Bergerson, and Heather L. MacLean, “Understanding the Canadian Oil Sands Industry’s Greenhouse Gas Emissions,” Environmental Research Letters 1 (2009). 9 Environment Canada, National Inventory Report: Greenhouse Gas Sources and Sinks in Canada, 1990–2006, http://www.ec.gc.ca/pdb/ghg/inventory_report/2006_report/som-sum_eng.cfm 10 Charpentier et al, “Understanding the Canadian Oil Sands Industry’s Greenhouse Gas Emissions.”
Climate Change
The Pembina Institute 5 Clearing the Air on Oil Sands Myths
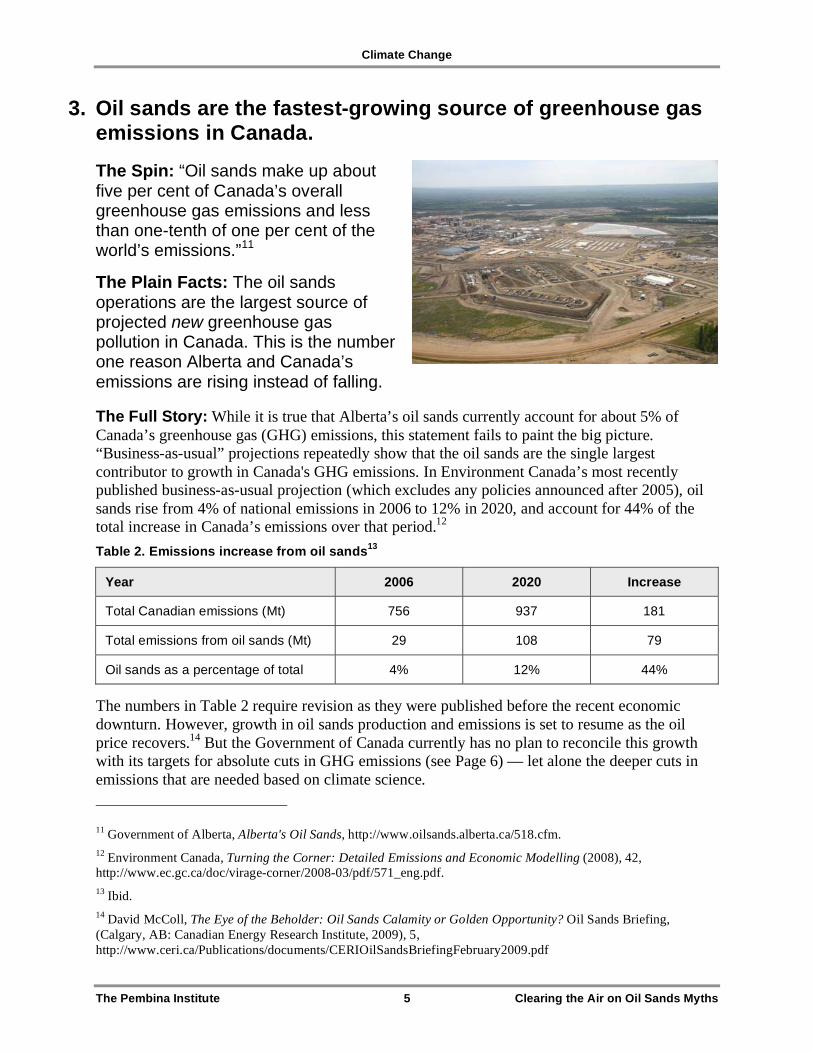
3. Oil sands are the fastest-growing source of greenhouse gas emissions in Canada.
The Spin: “Oil sands make up about five per cent of Canada’s overall greenhouse gas emissions and less than one-tenth of one per cent of the world’s emissions.”11
The Plain Facts: The oil sands operations are the largest source of projected new greenhouse gas pollution in Canada. This is the number one reason Alberta and Canada’s emissions are rising instead of falling.
The Full Story: While it is true that Alberta’s oil sands currently account for about 5% of Canada’s greenhouse gas (GHG) emissions, this statement fails to paint the big picture. “Business-as-usual” projections repeatedly show that the oil sands are the single largest contributor to growth in Canada's GHG emissions. In Environment Canada’s most recently published business-as-usual projection (which excludes any policies announced after 2005), oil sands rise from 4% of national emissions in 2006 to 12% in 2020, and account for 44% of the total increase in Canada’s emissions over that period.12 Table 2. Emissions increase from oil sands13
Year 2006 2020 Increase
Total Canadian emissions (Mt) 756 937 181
Total emissions from oil sands (Mt) 29 108 79
Oil sands as a percentage of total 4% 12% 44%
The numbers in Table 2 require revision as they were published before the recent economic downturn. However, growth in oil sands production and emissions is set to resume as the oil price recovers.14 But the Government of Canada currently has no plan to reconcile this growth with its targets for absolute cuts in GHG emissions (see Page 6) — let alone the deeper cuts in emissions that are needed based on climate science. 11 Government of Alberta, Alberta's Oil Sands, http://www.oilsands.alberta.ca/518.cfm. 12 Environment Canada, Turning the Corner: Detailed Emissions and Economic Modelling (2008), 42, http://www.ec.gc.ca/doc/virage-corner/2008-03/pdf/571_eng.pdf. 13 Ibid. 14 David McColl, The Eye of the Beholder: Oil Sands Calamity or Golden Opportunity? Oil Sands Briefing, (Calgary, AB: Canadian Energy Research Institute, 2009), 5, http://www.ceri.ca/Publications/documents/CERIOilSandsBriefingFebruary2009.pdf

Climate Change
The Pembina Institute 6 Clearing the Air on Oil Sands Myths
4. Continued increases in greenhouse gas emissions show that Canada’s commitment to address climate change falls far short of what's needed.
The Spin: “Climate change is a serious issue and this government is dealing with it in a serious way.”15
The Plain Facts: Canada’s greenhouse gas targets fall short of what the science requires, are not reflected in law and will not be met with currently proposed policies.
The Full Story: New greenhouse gas (GHG) data released in spring 2009 shows that Canada’s emissions are higher than ever — 26 percent above the 1990 level in 2007; the underlying trend remains strongly upwards. Successive Canadian governments have failed to treat the climate change crisis with the seriousness it deserves. Although Canada ratified the Kyoto Protocol in December 2002, the current federal government opted to reject Canada’s Kyoto target, arguing that emissions had risen too far above the target under the previous government.
Shortly after taking power in 2006, the government of Prime Minister Stephen Harper chose to cancel or not renew several existing spending programs for climate change, renewable energy and energy efficiency. After a year of delay, most of these programs were re-instated under new names and with slightly different policy goals. The government also announced new targets for Canada’s total GHG emissions. The medium-term target is to reduce emissions to 20 percent below the 2006 level by 2020. This target, which has no legal force, would leave Canada’s emissions still 3 percent above the Kyoto target in 2020.
The Harper government first proposed an emissions trading system for GHGs in April 2007 and published an updated proposal in March 2008. The system, known as “Turning the Corner,” was due to come into effect in January 2010; it covered heavy industry emitters (including electricity generators), which make up just under half of Canada’s total emissions. “Turning the Corner” would not set a hard cap on industrial emissions; instead, it proposed instead to set an “intensity” target (a target for emissions per unit of production) for each covered facility or firm.
“Turning the Corner” has been widely criticized for its reliance on intensity targets, its complex set of compliance options and exemptions, and the low level of the price that it would likely put on emissions. The plan would have allowed GHG emissions from the oil sands to increase from 29 Mt (2006) to 80 Mt (2017) before dropping to 49 Mt (2020) — thereby allowing absolute emissions from the oil sands to increase by 69 percent between 2006 and 2020. But actual 15 Hon. Jim Prentice, House of Commons Debates, 2nd Session, 40th Parliament (May 12, 2009), 3405, http://www2.parl.gc.ca/content/hoc/House/402/Debates/056/HAN056-E.PDF.

Climate Change
The Pembina Institute 7 Clearing the Air on Oil Sands Myths
emissions in 2020 would likely be higher still, because firms would be allowed to make unlimited use of GHG offsets. The government’s own analysis showed that even when combined with other federal programs, “Turning the Corner” would leave Canada’s total emissions well above the government’s target for 2020.16
In spring 2009, the government abandoned “Turning the Corner,” promising to unveil a new plan before the end of the year, and stating that GHG regulations for heavy industry will now take effect in 2012 or later, instead of 2010. This new delay, and the additional uncertainty about the government’s policies, take Canada even further off track from meeting the government’s GHG target for 2020, let alone a more ambitious target aligned with climate science.
16 Clare Demerse and Matthew Bramley, The March 2008 Federal Regulatory Framework for Industrial Greenhouse Gas Emissions, (Drayton Valley, AB: The Pembina Institute, 2008), http://climate.pembina.org/pub/1614.

Climate Change
The Pembina Institute 8 Clearing the Air on Oil Sands Myths
5. Large-scale carbon capture and storage for oil sands emissions is currently a distant and uncertain prospect.
The Spin: “[Carbon capture and storage] will collect carbon dioxide emissions from oil sands operations and coal-fired electrical plants, and seal them deep underground. Proving this technology on a commercial scale is key to reducing Canada's greenhouse gas emissions.”17
The Plain Facts: For carbon capture and storage (CCS) to be implemented on a large scale in the oil sands, federal and/or provincial governments would have to put a price on emissions about five times higher than they have proposed to date. Very large investments would need to be made, and significant technical challenges overcome. Current government policies are not close to making this happen.
The Full Story: CCS is an expensive technology, both because it is new, and because it carries major energy and infrastructure costs. Alberta’s CCS Task Force issued an interim report in October 200818 that showed a cost range of about $75 to $115/tonne of CO2 for oil sands hydrogen facilities and upgraders. This compares to the $15/tonne levy imposed by Alberta’s current greenhouse gas regulation, and the $15–20/tonne levy proposed in the federal “Turning the Corner” plan.19
The ecoENERGY Carbon Capture and Storage Task Force — established by the Alberta and federal governments — noted that applying CCS to the oil sands is particularly costly because oil
17 Office of the Prime Minister of Canada, “PM and Saskatchewan Premier Announce Major Carbon Capture and Storage Project,” media release, March 25, 2008, http://pm.gc.ca/eng/media.asp?id=2049. 18 Alberta Carbon Capture and Storage Development Council, Accelerating Carbon Capture and Storage in Alberta, 2008, 22. 19 “Turning the Corner” forecast that the price on emissions — including oil sands emissions — would rise to $65/tonne by 2018. However, we believe that the real price would likely be far lower, based on the unlimited access to offsets allowed in “Turning the Corner.”
Climate Change
The Pembina Institute 9 Clearing the Air on Oil Sands Myths
sands facilities are diverse, and their CO2 streams tend to be relatively small and diluted.20 Further, oil sands facilities are scattered over thousands of square kilometres and would require a vast new network of pipelines to collect and transport captured CO2 to disposal zones.
The Integrated CO2 Network, an industry consortium championing CCS,21 has noted that “Oil sands operations that install current CO2 capture technology in the best process locations can expect to reduce total direct CO2 emissions from all mining and upgrading operations from 10% to 30%...[while] up to 90% of CO2 emissions from coal-fired power generation can be captured.”22 While the applications of CCS to coal fired-power and the oil sands sector are often referenced as though they are comparable, it is clear that the oil sands sector faces significant financial and technical hurdles to address more than a relatively small proportion of its pollution.
According to Alberta’s CCS Task Force, “Costs are expected to rise in the early stages as attempts to demonstrate the technology suffer setbacks, and require re-design or further development work.”23 In April 2009, these high costs prompted eight oil sands companies to abandon their bids for a share of $2 billion in provincial government subsidization of CCS projects.24
20 ecoENERGY Carbon Capture and Storage Task Force, Canada’s Fossil Energy Future: The Way Forward on Carbon Capture and Storage, report to the Minister of Alberta Energy and the Minister of Natural Resources Canada (2008), 8–9, http://www.energy.gov.ab.ca/Org/pdfs/Fossil_energy_e.pdf. 21 See http://www.ico2n.com/participants.php. 22 Eric Beynon, letter to the editor, National Post, March 9, 2009. See http://www.nationalpost.com/story.html?id=1369479. 23 Alberta Carbon Capture and Storage Development Council, Accelerating Carbon Capture and Storage in Alberta, 2008, 23. 24 Kelly Cryderman, “Oilsands Opts out of Carbon Capture — Eight Producers Forgo Bids for Shares in $2B Funding,” Calgary Herald, April 2, 2009, http://www.edmontonjournal.com/Business/Oilsands+opts+carbon+capture/1455181/story.html

Climate Change
The Pembina Institute 10 Clearing the Air on Oil Sands Myths
6. Companies are allowed to switch to burning dirtier fuels as a source of energy for oil sands extraction — further increasing greenhouse gas emissions from the oil sands.
The Spin: “In situ oil sands facilities that want to use heavier fuels for steam generation will have to incorporate carbon capture and storage into their building plans.”25
The Plain Facts: With carbon capture and storage technology still in its infancy, facilities that switch from natural gas to dirtier fuels will not actually be capturing their increased emissions.
The Full Story: Despite the financial and technical challenges of implementing carbon capture and storage (CCS) for the oil sands region, the Government of Alberta is allowing the switch to dirty fuels on the “promise” of future use of CCS. In December 2008, Alberta released a draft policy26 that would allow oil sands companies operating in situ projects to switch from burning natural gas to much dirtier, more greenhouse gas-intensive fossil fuels such as raw bitumen or the waste from oil sands upgrading (petroleum coke and asphaltenes). The policy includes a requirement that in situ plants be designed to be capable of capturing carbon emissions in the future. But the government has not defined “capable,” making this requirement meaningless in practice. With no clear regulations or reduction requirements requiring CCS and in light of the aforementioned challenges, this policy in effect further increases the carbon footprint of oil sands operations.
25 Alberta Environment, Alberta's Oil Sands and Greenhouse Gases (GHG), http://www.environment.alberta.ca/2588.html. 26 Alberta Environment, Emission Standards for the Use of Non-gaseous Fossil Fuels for Steam Generation in In-Situ Bitumen or Heavy Oil Recovery Projects, 2008, http://environment.alberta.ca/3166.html.

Water Impacts
The Pembina Institute 11 Clearing the Air on Oil Sands Myths
7. Oil sands mining uses two to four barrels of water for every barrel of bitumen produced.
The Spin: Water use for Alberta’s oil sands development is low and “new technologies continue to reduce the footprint of oil sands development. … Up to 90% of the water used is recycled, depending on the maturity of the facility and type of extraction.”27
The Plain Facts: Approximately 12 barrels of water are required to produce each barrel of oil from bitumen. Up to 70% of this water is reused, but that still means two to four barrels of water are used to produce each barrel of oil from oil sands mining operations.
The Full Story: For oil sands mining, approximately 12 barrels of water are needed to produce each barrel of bitumen in surface mined oil sands operations. Approximately 70% of this water is recycled, leaving a net use of about four barrels of water per barrel of bitumen production.28
Other sources suggest that companies have reduced their water consumption to roughly two barrels of water per barrel of bitumen produced even after accounting for recycling.29 This water 27 Government of Alberta, Alberta’s Oil Sands: Opportunity. Balance. (March 2008), 3 and 5, http://www.environment.alberta.ca/documents/oil_sands_opportunity_balance.pdf. 28 R. J. Mikula ,V. A. Munoz, and O. Omotoso, “Water Use in Bitumen Production: Tailings Management in Surface Mined Oil Sands” presented at the World Heavy Oil Congress, Edmonton, 2008, 1, http://canmetenergy-canmetenergie.nrcan-rncan.gc.ca/fichier.php/codectec/En/2008-097D/2008-097_en.pdf. 29 Suncor reports 2.29 m3/m3 synthetic crude oil and Syncrude reports 2.26 m3/m3 synthetic crude oil. Suncor Energy Ltd., A Closer Look: An Update on Our Progress (2008), 4, www.suncor.com/doc.aspx?id=178. This is an update on Suncor’s 2007 Report on Sustainability: A Closer Look at Our Journey toward Sustainable Development (2008), 65, http://www.suncor.com/doc.aspx?id=114. Note that Suncor’s operations include in situ projects, which use less water per unit of bitumen produced than do mining operations, so Suncor’s average water use for mining operations may exceed 2.29 m3/m3 of synthetic crude oil. Syncrude Canada Ltd, 2007 Sustainability Report (2008), http://sustainability.syncrude.ca/sustainability2007/enviro/water/.
Shell’s recent 3-year average water consumption for bitumen production from the Athabasca is 2.15 m3/m3 bitumen output, and the average including upgrading (at Scotford, using water from the North Saskatchewan River) is 2.23 m3/m3 synthetic crude oil. Shell Canada Ltd., Water: Oil Sands, http://www.shell.com/static//ca-en/downloads/about_shell/what_we_do/oil_sands/aosp/oilsands_water.pdf.
Shell Canada Ltd., Application for the Approval of the Muskeg River Mine Expansion Project, (2005), Volume 1, Section 10.5, 10–22, indicates that it will require 4.09 m3 water per m3 of bitumen produced. See also Jeremy Moorhouse et al., Under-Mining the Environment: The Oil Sands Report Card (Drayton Valley, AB: The Pembina
Water Impacts
The Pembina Institute 12 Clearing the Air on Oil Sands Myths
is tied up in the pore spaces of the mineral sand, clay, and silt left over after the bitumen is extracted from the oil sands. Some of this wet material forms mature fine tailings, which presents large reclamation challenges given its liquid state and inability to solidify even after 40 years.
Companies that have been operating for some time have gradually reduced their average water requirements, but a new project is likely to require more water than an established operation, since it may not be able to recycle as much water in the early stages of development. Currently, oil sands mining operations are licensed to divert 445 million m3 of fresh water each year from the Athabasca River; roughly the annual water needs for a city of three million people.30
For in situ development, 0.6 to 0.9 barrels of water are needed to extract31 and upgrade32 one barrel of bitumen. This volume is in addition to the water that is recycled through the processes.
Institute and Toronto, ON: World Wildlife Fund Canada, 2008), Appendix 4 – Water, 32, http://www.oilsandswatch.org/pub/1571. The information in the application was confirmed by Shell, based on water use of 28.3 million m3/year and daily bitumen production of 120,000 bbl/day.
Where necessary, values have been converted. There are approximately 6.292 barrels in a cubic metre. Note that if water volumes are expressed in terms of bitumen production, the requirement for a comparable unit of synthetic crude oil is usually higher 30 Alberta Environment, Water Diversion by Oilsands Mining Projects in 2007. Data received September 2008. 31 Mary Griffiths et al, Troubled Waters, Troubling Trends. Technology Options to Reduce Water Use in Oil and Oil Sands Development in Alberta (Drayton Valley, AB: The Pembina Institute, 2006), 16. 32 Randy Provencal, Shell Canada Limited, personal communication, March 2006. In 2005 Shell diverted 6,254,580m3 water for the Scotford upgrader (75% of the licence limits), to produce 3,447,500 m3 of oil (56,575,000 barrels). See also, Scotford Upgrader Project Application (1998). Vol. 1, i. and 4-1 for initial project design figures.

Water Impacts
The Pembina Institute 13 Clearing the Air on Oil Sands Myths
8. Oil sands companies are not required to stop withdrawing water from the Athabasca River, even if flows are so low that fisheries and habitat are at serious risk.
The Spin: “All existing and approved oil sands projects together will withdraw less than 3% of the average annual flow of the Athabasca River.”33
The Plain Facts: Talking about average annual flows masks the highly seasonal nature of flows in the Athabasca River. Winter flows may be 10 times less than spring or summer flows, and the oil sands industry has much greater impacts during these low-flow periods.
The Full Story: Oil sands mining operations are cumulatively allocated 2.2% of the Athabasca River’s annual flow. Although this figure is true, it is misleading. Expressing allocations in terms of a percentage of annual flow is irrelevant when considering the impacts of water withdrawals on the aquatic ecosystem during the winter months and other low-flow periods.
At times of low water flows, oil sands operations are allowed to continue to withdraw water, even at the expense of fisheries and habitat. There is never a time when water withdrawals must be halted, even if fish and fish habitat is being damaged.
Flows in the Lower Athabasca River are highly variable. For example, during the open water season (April–November) flows average 859 m3/sec, whereas when the river is covered with ice (December–March) flows average 177 m3/sec.34 Furthermore, spring and summer flows are commonly 10 times greater than winter flows in any given year. Expressing allocations in terms of percentages of annual flows masks the seasonal concern that exists during the low flow winter months. Oil sands mining operations withdraw water from the Athabasca River 24 hours a day, 365 days a year. During winter months, the cumulative allocation total for oil sands operators makes up a significantly greater proportion of the Athabasca River’s flow at a time when conditions are already limiting for the aquatic ecosystem.
33 Government of Alberta, Alberta’s Oil Sands: Resourceful. Responsible., 5. 34 D.W. Schindler, W.F. Donahue, and J.P. Thompson, “Future Water Flows and Human Withdrawals in the Athabasca River,” Running out of Steam? Oil Sands Development and Water Use in the Athabasca River Watershed: Science and Market based Solutions, (Edmonton: University of Alberta Environmental Research and Studies Centre, 2007), 1, www.powi.ca/pdfs/running_out_of_steam.pdf.

Water Impacts
The Pembina Institute 14 Clearing the Air on Oil Sands Myths
9. Capping toxic tailings waste in end pit lakes with water is an unproven and risky concept.
The Spin: “…water quality in the pit lakes will be acceptable for release and will support a viable, maintenance-free aquatic ecosystem…”35
The Plain Facts: The concept of end pit lakes is risky, experimental and has never been demonstrated.
The Full Story: A proposed long-term solution to the tailings problem is for mining companies to dump toxic tailings waste into old mine pits and cap it with freshwater from the Athabasca River.36 Operators hope that the tailings layer and freshwater layer won’t mix.
Pit lakes are used in other mining sectors to control water drainage before discharging the water into the environment; in the oil sands, end pit lakes (EPLs) are uniquely being pitched as disposal sites for toxic tailings waste.
EPLs will be a permanent feature of the reclaimed landscape, but it is not yet known if they will support a sustainable aquatic ecosystem. Modelling and relevant background studies have been the basis of research, but a fully realized EPL has yet to be constructed.37
At least 27 EPLs are planned for the Athabasca Boreal region within the next 60 years.38 These were approved in the absence of a single demonstrated EPL by any oil sands operator.
35 Imperial Oil Resources Ventures Limited, Kearl Oil Sands Mine Development: Responses to OSEC Statement of Concern, submitted to Oil Sands Environmental Coalition, 2006, 20, www.ceaa-acee.gc.ca/050/documents/18857/18857E.pdf. 36 Synenco Energy Inc., Application for approval of the Northern Lights Mining and Extraction Project, Volume 3: Management Plans, 2006, 6–28. 37 Fay Westcott and Lindsay Watson, End Pit Lakes Technical Guidance Document, prepared for The Cumulative Environmental Management Association End Pit Lakes Subgroup Project 2005-61, 2007, 4. 38 Ibid., 1.

Water Impacts
The Pembina Institute 15 Clearing the Air on Oil Sands Myths
10. For over 40 years, oil sands mining companies voluntarily managed tailings on their own, in the absence of concrete government regulations.
The Spin: “Tailings ponds are, in fact, tightly regulated by Alberta Environment and the Alberta Energy Resources Conservation Board.”39
The Plain Facts: Since 1967, oil sands mining operators have been allowed to manage tailings on a voluntary basis with little government enforcement. A directive released in 2009 will require operators to reduce a portion of the volume of future tailings waste, but still fails to address the 720 billion litres of legacy tailings on the landscape today.
The Full Story: In February 2009, the Energy Resources Conservation Board (ERCB) finalized a new regulation for managing tailings waste: Directive 074: Tailings Performance Criteria and Requirements for Oil Sands Mining Schemes. Since 1967, oil sands mining operators were allowed to manage tailings on a voluntary basis with little government enforcement. The new directive will, for the first time, require operators to reduce a portion of the volume of future tailings waste. The anticipated increase in mining production will yield more ponds on the landscape, however, because the directive still allows the tailings volumes to increase, just at a slower pace. Unfortunately, the directive fails to address the 720 billion litres of legacy tailings on the landscape today. Industry’s failure to meet past targets for tailings reduction and reclamation has resulted in tailings lakes that are growing fast, up from 50 km2 before 2005 to more than 130 km2 in 2009. By 2040, tailings are expected to occupy 310 km2, or an area nearly three times the size of Vancouver.40
As noted elsewhere in this document, no successful reclamation of tailings lakes has ever been demonstrated.
39 Dave Collyer, “Big Oil Is Listening to Canadians,” Edmonton Journal, January 14, 2009, http://www.capp.ca/aboutUs/mediaCentre/CAPPintheNews/Pages/BigOilisListening.aspx . 40 Energy Resources Conservation Board, Data for Mineable Oil Sands Current and Projected Tailings and Footprint Area, email received October 2008.

Water Impacts
The Pembina Institute 16 Clearing the Air on Oil Sands Myths
11. Tailings lakes seep toxic waste. It is uncertain exactly what is seeping, how much is seeping and what ecosystem components are affected.
The Spin: “[Tailings ponds] are equipped with technology to monitor, intercept and return any seepage back into the pond. Tailings water is not released to the river.”41
The Plain Facts: Tailings lakes seep toxins such as naphthenic acids — toxic water-soluble carboxylic acids — into the groundwater below and around the containment dykes or tailings lakes, but no information is available on the rates or the composition of seepage.
The Full Story: The issue of tailings seepage is controversial, largely because of a lack of transparency about actual seepage rates. It was noted in the 1997 Decision report for the Application for Amendment of Approval No. 7632 for Proposed Steepbank Mine Development, that 1600 m3/day seeps from the Tar Island Pond into the Athabasca River.42 In 2004, the National Energy Board of Canada stated that “the principal environmental threats from tailings ponds are the migration of pollutants through the groundwater system and the risk of leaks to the surrounding soil and surface water.”43 A 2008 report estimated that 11 million litres of contaminated water are seeping from tailings ponds into the environment on a daily basis.44
41 Dave Collyer, “Big Oil Is Listening to Canadians.” 42 Alberta Energy and Utilities Board, Application by Suncor Inc. Oil Sands Group for Amendment of Approval No. 7632 for Proposed Steepbank Mine Development, Decision No. 97-1, Application No. 960439, Calgary, 1997. 43 National Energy Board, Canada’s Oil Sands: Opportunities and Challenges to 2015, an Energy Market Assessment, 68, http://www.neb.gc.ca/energy/EnergyReports/EMAOilSandsOpportunitiesChallenges2015_2006/EMAOilSandsOpportunities2015Canada2006_e.pdf. 44 Matt Price, 11 Million Litres a Day: The Tar Sands Leaking Legacy (Toronto: Environmental Defence, 2008), http://www.environmentaldefence.ca/reports/tarsands_dec_2008.html

Water Impacts
The Pembina Institute 17 Clearing the Air on Oil Sands Myths
12. Tailings lakes house compounds known to be acutely toxic to aquatic organisms.
The Spin: “The Athabasca River has always had traces of oil and related compounds in the water, because bitumen seeps into the river from oil sand exposed naturally in the riverbanks.”45
The Plain Facts: Toxic substances, including naturally occurring, soluble constituents of bitumen, become concentrated in tailings as a result of the bitumen extraction process. Tailings lakes may be leaking into the surrounding environment at a rate of 11 million litres a day.46
The Full Story: Some argue that tailings lakes house little to no toxic materials or that the toxins associated with oil sands mining are not a threat because they are naturally occurring compounds that predate any human development in the area. Tailings lakes not only house sand, fines (silts and clays) and water but a host of additional toxins that include naphthenic acids, phenolic compounds, ammonia-ammonium and trace metals, such as copper, zinc and iron. These trace metals can exist at concentrations that exceed the Canadian water quality guideline for freshwater aquatic life.47 Tailings have also been found to contain residual bitumen (e.g., Suncor’s tailings lake contained 9% residual bitumen)48 and diluent49 (e.g., naphtha).
Naphthenic acids are considered the most significant environmental contaminant resulting from oil sands development.50 Naphthenic acids are naturally occurring, soluble constituents of bitumen that become concentrated in tailings as a result of the bitumen extraction process. The presence of naphthenic acids in local water bodies and their potential effects on water quality and fish reproduction and tainting has brought significant attention to their persistence in the
45 Dave Collyer, “Big Oil Is Listening to Canadians.” 46 Matt Price, 11 Million Litres a Day. 47 P.G. Nix and R.W. Martin, “Detoxification and Reclamation of Suncor's Oil Sand Tailings Ponds,” Environmental Toxicology & Water Quality 7, no. 2 (1992). 48 P.M. Fedorak et al., “Methanogenic Potential of Tailings Samples from Oil Sands Extraction Plants,” Canadian Journal of Microbiology 48 (2002), 24. 49 Diluent is added to bitumen to dilute its thick, heavy and viscous state so it will flow through a pipeline. 50 V.V. Rogers et al., “Acute and Subchronic Mammalian Toxicity of Naphthenic Acids from Oil Sands Tailings,” Toxicological Sciences 66 (2002), 347–355.

Water Impacts
The Pembina Institute 18 Clearing the Air on Oil Sands Myths
environment and to their aquatic toxicity at the levels found in tailings lakes.51 Concentrations of naphthenic acids in rivers within the Athabasca Boreal region are generally below 1 mg/L, but they range between 60 mg/L and 120 mg/L in process-affected waters in active tailings containment.52
Naphthenic acids cause tailings to be acutely toxic to aquatic organisms53 and mammals.54 Mammalian toxicological results indicate that while acute toxicity in wild mammals is unlikely under worst-case exposure conditions, repeated exposure may have adverse health effects.55 In addition to being acutely toxic, the naphthenic acids associated with oil sands tailings do not easily break down in the natural environment.56
51 John V. Headley and Dena W. McMartin, “A Review of the Occurrence and Fate of Naphthenic Acids in Aquatic Environments,” Journal of Environmental Science and Health 39, no. 8 (2004), 1989–2010. 52 F.M. Holowenko and P. M. Fedorak, “Evaluation of a Gas Chromatography–Electron Impact Mass Spectrometry Method for Characterizing Naphthenic Acids,” Department of Biological Sciences, University of Alberta, Edmonton, Alberta, 2001. 53 M. MacKinnon and H. Boerger, “Description of Two Treatment Methods for Detoxifying Oil Sands Tailings Pond Water,” Water Pollution Research Journal of Canada 21 (1986). 54 United States Environmental Protection Agency Office of Toxic Substances, “Fate and Effects of Sediment-Bound Chemicals in Aquatic Systems,” Proceedings of the Sixth Pellston Workshop, Florissant, CO, August 12-17 1984. 55 Rogers et al., “Acute and Subchronic Mammalian Toxicity of Naphthenic Acids from Oil Sands Tailings,” 347. 56 Angela C. Scott, Michael D. Mackinnon, and Phillip M. Fedorak, “Naphthenic Acids in Athabasca Oil Sands Tailings Waters Are Less Biodegradable than Commercial Naphthenic Acids,” Environmental Science & Technology 39, no. 21 (2005): 8388-94.

Water Impacts
The Pembina Institute 19 Clearing the Air on Oil Sands Myths
13. Reclamation of tailings lakes has not yet been demonstrated.
The Spin: “First tailings pond completely reclaimed by 2010.”57
The Plain Facts: The first tailings pond is scheduled to be filled in by 2010, but this will only be accomplished by moving the toxic tailings somewhere else instead of eliminating them.
The Full Story: Reclamation of tailings material implies complete and permanent management and elimination of the toxic liquid waste in the holding lakes. In the 1990s, Suncor commenced work on closure and remediation of the Tar Island Pond, a large tailings containment area beside the Athabasca River, because one of the conditions on ERCB approval of Suncor’s Steepbank mine was to make the Tar Island Pond trafficable by 2010.58 Unfortunately, Suncor is not permanently eliminating the contents of the Tar Island Pond but rather “reclaiming” the Tar Island Pond by transferring fluid tailings to other ponds and infilling the pond with coarse sand.59 The claim that tailings waste from Tar Island Pond will be completely reclaimed in 2010 is untrue — the liquid tailings have simply been moved elsewhere.
57 Don Thompson, “Oil Sands: Challenges + Opportunities,” presented at the 4th Annual Insight Water & Land Management Conference (2008), 21, www.oilsands.cc/pdfs/Water%20&%20Land%20Mgmt%20Presentation-D.%20Thompson%20%20(Nov%2028%2008).pdf. 58 Alberta Energy and Utilities Board, Application by Suncor Inc. Oil Sands Group for Amendment of Approval No. 7632 for Proposed Steepbank Mine Development, Decision No. 97-1, Application No. 960439, Calgary, 1997. 59 Richard Houlihan, Haneef Mian, and ERCB Tailings Team, “Past, Present and Future Tailings: Regulatory Perspective,” presented at the International Oil Sands Tailings Conference, Edmonton (2008), 2.

Boreal Forest Impacts
The Pembina Institute 20 Clearing the Air on Oil Sands Myths
14. Alberta’s oil sands underlie one-fifth of the province, and development is already planned for more than 79,000 square kilometres.
The Spin: “To date there are 530 square kilometres (205 square miles) of land that has been disturbed by oil sands mining activity — which is less than the area of the City of Edmonton.”60
The Plain Facts: Oil sands underlie 21% of Alberta, and projected development will greatly exceed the current impacts. An area larger than the province of New Brunswick has already been leased to in situ oil sands companies for development.
The Full Story: Alberta’s oil sands underlie 140,800 km2 or 21 per cent of Alberta61 — an area the size of Florida. Most of the oil sands are found under boreal forest, and they underlie 37% of Alberta’s Boreal Forest Natural Region.62 The Government of Alberta is promoting the development of oil sands mining and in situ operations for this entire area before land use planning is even completed.
Presenting current mining impacts only (while ignoring impacts of projected in-situ and future mining development) is misleading. More than 79,000 km2 of land has already been leased to in situ oil sands companies for development.63
60 Government of Alberta, Alberta’s Oil Sands: Resourceful. Responsible., 5. 61 Energy Resources Conservation Board, Frequently Asked Questions on the Development of Alberta’s Resources — Oil Sands, (2009), http://www.ercb.ca/docs/public/EnerFAQs/PDF/EnerFAQs12-OilSands.pdf. 62 Natural Regions Committee, Natural Regions and Subregions of Alberta, Compiled by D.J. Downing and W.W. Pettapiece (Government of Alberta, Pub. No. T/852 2006), 44. Alberta’s Boreal Forest Natural Region (BFNR) covers 58 percent of the province and occupies more than 380,000 square kilometres. 63 Alberta Energy, personal communication, May 19, 2009. The total area leased for in situ development as of May 19, 2009 is 7,929,827 hectares.

Boreal Forest Impacts
The Pembina Institute 21 Clearing the Air on Oil Sands Myths
15. Cumulatively, the potential area affected by in situ development is about 40 times larger than the mineable zone. 64
The Spin: “In-situ processes have a significantly smaller footprint on the landscape.”65
The Plain Facts: Recent research reveals that the land area influenced by in situ technology is actually comparable to land disturbed by surface mining. In situ oil sands could have a dramatic impact on 21% of Alberta.
The Full Story: In situ drilling is used where the resource is too deep to mine on the surface. Approximately 80% of Alberta’s oil sands are accessible through in situ development. On an individual project level, in situ development is less destructive than mining. However it is significantly more damaging than the conventional oil operations to which it is often compared. Recent research reveals that the land area influenced by in situ technology is actually comparable to land disturbed by surface mining when fragmentation and upstream natural gas production are considered.66
In situ oil sands operators have already leased 79,000 km2 of Alberta’s landscape,67 and the potential area affected by in situ development is approximately 138,000 km2. This area represents almost 21% of Alberta, or a land area almost the size of Florida.68 The Terrestrial Ecosystem Management Framework — a report jointly produced by industry, government and non-governmental organization representatives of CEMA — notes that the landscape of the Regional Municipality of Wood Buffalo, which consists of the Athabasca Boreal Region, has already been substantially altered and will continue to change due to development in the future.69 64 Richard Schneider and Simon Dyer, Death by a Thousand Cuts: Impacts of in Situ Oil Sands Development on Alberta’s Boreal Forest (Edmonton, AB: Canadian Parks and Wilderness Society and the Pembina Institute, 2006), 2. 65 Government of Alberta, Alberta’s Oil Sands: Resourceful. Responsible., 2. 66 Sarah M. Jordaan, David W. Keith, and Brad Stelfox, “Quantifying Land Use of Oil Sands Production: A Life Cycle Perspective,” Environmental Research Letters 4 (2009), 15. 67 Alberta Energy, personal communication, May 19, 2009. The total area leased for in situ development is 7,929,827 hectares. 68 Schneider and Dyer, Death by a Thousand Cuts. 69 Sustainable Ecosystem Working Group of the Cumulative Environmental Management Association, Terrestrial Ecosystem Management Framework for the Regional Municipality of Wood Buffalo, (Calgary, AB: Cumulative Environmental Management Association, 2008), 12.

Boreal Forest Impacts
The Pembina Institute 22 Clearing the Air on Oil Sands Myths
16. The Athabasca Boreal Forest will not be restored to its native state following mine closure.
The Spin: “All oil sands developments are ultimately reclaimed and returned to a natural state.”70
The Plain Facts: In 40 years of oil sands operations no tailings lakes and no mines have yet been fully reclaimed. Even if reclamation is successful, Alberta regulations do not require restoration of the kind of habitat that used to be present.
The Full Story: Reclaiming land destroyed by surface mining is no simple task. In northeastern Alberta, about 40 to 50% of the landscape is wetland, predominantly bog and fen peatlands.71,72 Bogs in northeastern Alberta commonly contain lichens, which are a critical food source for woodland caribou.73 Surface mining leaves no remnants of wetlands to recover, and the reclamation of peatlands (fens or bogs) in the Athabasca Boreal region has never been demonstrated.74
In addition to the uncertainty of the success of peat wetland reclamation, there will also be a significant degree of wetland loss through its conversion to upland habitat75 after oil sands development. For example, development and reclamation of Suncor’s North Steepbank Mine is predicted to shift the area from substantial wetlands (48% before development) to a predominantly upland ecosystem (65%) at mine closure.76
No tailings lakes have ever been successfully reclaimed and there is no demonstrated effective long-term way to deal with liquid tailings.
70 Canadian Association of Petroleum Producers (CAPP), National Geographic's Article on Canada's Oil Sands: An Incomplete Perspective, 2009, http://www.capp.ca/aboutUs/mediaCentre/CAPPCommentary/Pages/NationalGeographic,March2009Issue.aspx 71 Alberta-Pacific Forest Industries, Harvest Net-Down Analysis for Forest Management Unit A15 and the Mineable Oil Sands Area (MOSA) (2005). 72 Megan Harris, Guideline for Wetland Establishment on Reclaimed Oil Sands Leases, (Fort McMurray, AB: Lorax Environmental for CEMA Wetlands and Aquatics Subgroup of the Reclamation Working Group, 2007), 1. 73 Ibid. 74 Ibid. 75 According to Canada–Alberta Environmentally Sustainable Agriculture’s Soil Inventory Project Procedures Manual: Data Dictionary, http://www1.agric.gov.ab.ca/$department/deptdocs.nsf/all/sag6175?opendocument, the term “upland” means “high land” or “an extensive region of high land.” 76 Suncor Energy Inc., Voyageur Project- North Steepbank Extension Project Application, Volume 1a (2005), 11-4.

Boreal Forest Impacts
The Pembina Institute 23 Clearing the Air on Oil Sands Myths
17. Oil sands mining reclamation standards are weak and lack transparency; only one square kilometre of land has been certified as reclaimed to date.
The Spin: “To date, more than 65 square kilometres (25 square miles) have been reclaimed.”77
The Plain Facts: Only 0.2% of land disturbed by mining has been reclaimed and certified by the Government of Alberta and returned to Albertans. Lack of publicly available data make it impossible to validate industry claims of successful reclamation.
The Full Story: Oil sands mining in the Athabasca region began in 1967. Available data reveals that the cumulative disturbance from 1967 to 2006 for oil sands mining development was over 529 km2.78 This disturbance is from the mining alone and does not include the disturbance caused by in situ development. Only 0.2% of land disturbed by mining has been reclaimed and certified by the Alberta government and returned to Albertans.
Oil sands mining operators report on their own reclamation efforts both in their annual “Conservation and Reclamation Reports” and in their Sustainability Reports. Syncrude Canada Ltd. reports that they have reclaimed 22% of the land disturbed by their mining operations.79 Suncor has reclaimed 9% (912 ha) of its disturbed land.80 Because these numbers are self-reported and no specific reclamation standards exist for oil sands, it is difficult to understand how companies define reclamation. There is limited data to accompany the company sustainability reports and company submissions to Government are not readily accessible to the public.
Currently there are no firm regulatory timelines for progressive reclamation to compel companies to reclaim more land more quickly.
77 CAPP, National Geographic's Article: An Incomplete Perspective. 78 Alberta Environment, Oil sands reclamation stats to 2007, email received July 3, 2008. 79 Syncrude Canada Ltd., 2007 Sustainability Report, http://sustainability.syncrude.ca/sustainability2007/enviro/reclamation/. 80 Suncor Energy Inc., A Closer Look at Our Journey toward Sustainability: 2007 Report on Sustainability (Calgary, AB, 2007), 39.

Boreal Forest Impacts
The Pembina Institute 24 Clearing the Air on Oil Sands Myths
18. The security bonds that are supposed to protect Canadians from costly environmental liabilities may be inadequate.
The Spin: “By law, industry must post financial security equivalent to the cost of reclamation…”81
The Plain Facts: Detailed reclamation plans and costs are not publicly available. As well, full reclamation of toxic tailings waste has never been demonstrated, so real costs for that process are also fundamentally impossible to determine. There is no way to know if security bonds are sufficient to protect Canadian taxpayers.
The Full Story: The Government of Alberta requires that all oil sands operators post a security deposit82 to act as a financial mechanism to fund any unforeseen events that may arise during the life cycle of an oil sands mine (construction, operation, reclamation and decommissioning). The deposits, held in the Environmental Protection and Security Fund, are considered a surety to prevent the public from bearing the reclamation costs if, for example, a company goes bankrupt.83
Total oil sands security in the fund is $645 million,84 on a current disturbance footprint of around 52,931 ha.85 This represents only $12,185 per hectare.
The estimate given by Syncrude about the reclamation certification costs of Gateway Hill is another example of true costs of reclamation. Syncrude did not provide a breakdown for the cost of Gateway Hill, which was the first site to receive a reclamation certificate. However, in 2006 the company spent a total of $30.5 million on reclamation activities on 267 ha, or about $114,000 per hectare.86
81 Government of Alberta, Alberta’s Oil Sands: Resourceful. Responsible., 4. 82 Security deposits are only required for oil sands mining operations and not in situ operations. The EUB Licensee Liability Rating and Orphan Fund governs in situ operations’ securities. 83 It is important to note that the security deposit only covers the costs of mining activities and does not consider the reclamation costs of the processing plants. 84 Alberta Environment, Environmental Protection Security Fund Annual Report: April 1, 2007–March 31, 2008. 85 Alberta Environment, Oil Sands Disturbance and Reclamation Data, personal communication with Alberta Environment staff. 2008. 86 Hanneke Brooymans, “Reclaimed Oilsands Site Receives Provincial Blessing - a ‘Nice Milestone’ Says Syncrude, Which Likely Spent $114,000 Per Hectare to Restore Land,” The Edmonton Journal, March 20, 2008.

Boreal Forest Impacts
The Pembina Institute 25 Clearing the Air on Oil Sands Myths
Because reclamation costs and plans are not publicly available, it is impossible to determine whether or not current security deposits are adequate. Long-term tailings reclamation has not yet been successfully demonstrated in the oil sands mineable region, so the cost for achieving reclamation in the oil sands region is unknown.
Costly environmental liabilities in Canada are not unheard of. One hundred years of steel and coke production left more than a million tonnes of contaminated soil and sediment in Sydney on the eastern coast of Cape Breton Island, Nova Scotia.87 This prompted the Government of Canada to “undertake a 10-year, $3.5 billion program to clean up contaminated sites for which the Government is responsible. And the Government of Canada will augment this with a $500 million program of similar duration to do its part in the remediation of certain other sites, notably the Sydney tar ponds,”88 as announced in 2004. For comparison, the Sydney tar ponds cover an area of 31 ha. Alberta’s mineable oil sands cover an area of 350,000 ha, which is 11,000 times larger.
87 EarthTech Canada, Clean-Up of Tar Ponds and Coke Ovens Sites in Sydney, Nova Scotia (2007), 1, www.remtech2008.com/remtech/2007/pdf/Paper33.pdf. 88 Privy Council Office, “Speech from the Throne,” http://www.pco-bcp.gc.ca/index.asp?lang=eng&page=information&sub=publications&doc=sft-ddt/2004_1-eng.htm.

Environmental Management
The Pembina Institute 26 Clearing the Air on Oil Sands Myths
19. First Nations are not consulted prior to mineral lease sales.
The Spin: “Oil sands developers must consult with First Nations in the area before development.”89
The Plain Facts: Oil sands tenures are granted without consultation. Three lawsuits launched by First Nations affected by oil sands development allege that First Nations were not consulted properly before oil sands tenures were granted.
The Full Story: Mineral rights are issued to companies before First Nations are consulted. Concern with what is considered by many to be a “broken” regulatory process has resulted in three lawsuits to date by First Nations against government. A summary of these lawsuits:
1. Beaver Lake Cree Nation v. Government of Alberta: On May 14, 2008, the Beaver Lake Cree Nation (“BLCN”) filed a Statement of Claim against the Province of Alberta and the Attorney General of Canada alleging that, in granting certain tar sands (and other) tenures, the Governments of Alberta and Canada infringed upon the treaty rights of the BLCN to hunt, trap and fish certain wildlife species in their traditional territory.
2. Chipewyan Prairie Dene First Nation v. Government of Alberta: On June 4, 2008, the Chipewyan Prairie Dene First Nation (“CPDFN”) filed a legal action in the Alberta Court of Queen’s Bench for a Judicial Review of the Government of Alberta’s grant of oil sands tenures to MEG Energy Corp. The CPDFN seeks a declaration that the Government of Alberta has an obligation to conduct proper baseline studies, a cumulative effects study and an environmental impact study with respect to the potential impacts of the tar sands tenure on the CPDFN’s treaty and aboriginal rights.
3. Athabasca Chipewyan First Nation v. Minister of Energy (Alberta), Canadian Coastal Resources Ltd., Standard Land Company Inc. and Shell Canada Inc.: On December 10, 2008, the Athabasca Chipewyan First Nation (“ACFN”) filed a legal action in the Alberta Court of Queen’s Bench for a Judicial Review of the Government of Alberta’s granting of certain tar sands tenures without consultation with the ACFN. The application seeks, amongst other things, a declaration that Alberta Energy has a duty to consult the ACFN prior to granting tar sands tenures within the ACFN’s traditional territory.
89 Government of Alberta, Alberta’s Oil Sands: Resourceful. Responsible., 14.

Environmental Management
The Pembina Institute 27 Clearing the Air on Oil Sands Myths
20. Aquatic monitoring is conducted by an industry-funded group that has been criticized for using an analytically weak, biased and inconsistent monitoring approach.
The Spin: “Stringent testing has consistently shown there has been no increase in concentrations of contaminants as oil sands development has progressed.”90
The Plain Facts: A 2004 scientific peer review of the regional aquatic monitoring program for the Athabasca region criticized the design of the monitoring program, citing “significant shortfalls” and recommending more independent and expert input.
The Full Story: The Regional Aquatic Monitoring Program (RAMP) is an industry-funded group that monitors the health of rivers and lakes in the oil sands region of Alberta. RAMP focuses on the Athabasca River, the Peace-Athabasca Delta, tributaries to the Athabasca, wetlands within the vicinity current and proposed oil sands developments and lakes in northeastern Alberta that are sensitive to acid deposition.91 Since 1997, RAMP has reported time and time again that local human activities have no major apparent effects on water quality in the Athabasca River and surrounding tributaries.
A 2004 scientific peer review of RAMP’s work criticized the design of the monitoring program, citing “significant shortfalls” and recommending more independent and expert input. 92 Other independent analyses have determined that RAMP’s approach is analytically weak, biased, conservative, subject to errors and inconsistent.93 Timoney noted a continual change in methods and means of presentation and data gaps: for example, in 2006 there was no sampling of sediment quality, benthic invertebrate community, and fish tissues for the Athabasca River main stem. For the Athabasca River Delta, RAMP conducted no sampling.94
90 Government of Alberta, Alberta’s Oil Sands: Resourceful. Responsible., 6. 91 Regional Aquatics Monitoring Program, RAMP (2006), www.ramp-alberta.org/index.php. 92 G.B. Ayles, M. Dubé, and D. Rosenberg, Oil Sands Regional Aquatic Monitoring Program (RAMP): Scientific Peer Review of the Five Year Report (1997-2001), prepared for the RAMP Steering Committee, 2004, iv. 93 Kevin P.Timoney, A Study of Water and Sediment Quality as Related to Public Health Issues, Fort Chipewyan, Alberta, for the Nunee Health Board Society Fort Chipewyan, Alberta, (Treeline Ecological Research, 2007). 94 Ibid., 71.

Environmental Management
The Pembina Institute 28 Clearing the Air on Oil Sands Myths
21. There is no regional environmental management system to address the cumulative impacts of oil sands development. The Spin: “The Alberta government is looking beyond oil sands development on a project-by-project basis to address the cumulative effects of development in the region.”95
The Plain Facts: Nine years ago the governments of Canada and Alberta set up a multi-stakeholder association to recommend rules for oil sands development, yet today there is still no land-use plan, no regulations to halt oil sands water withdrawals on the Athabasca River during low flows, and no common standards for reclamation.
The Full Story: The objectives of the Cumulative Environmental Management Association (CEMA) were to make recommendations to manage the Athabasca region’s cumulative environmental effects, thereby ensuring that “an effective and efficient stakeholder driven regional environmental management system is established” and that “regional environmental guidelines, objectives and thresholds are in place or established.”96 Since CEMA’s inception in 2000, large gaps remain in many critical areas of environmental management:
• no land use plan for protecting wildlife and regional ecosystems • no lower limit on flows of the Athabasca River (below which oil sands water withdrawals
would be prohibited) • no environmental management plan to maintain the integrity of watersheds (most
urgently the Muskeg River watershed) • no common standards for oil sands reclamation
A recently released review of CEMA concluded that the wide range of competing commercial interests present, particularly individual oil sands companies, have been difficult to overcome in CEMA’s quest for regional management versus licensing of individual projects. CEMA has failed to achieve a regional environmental management system, and resource developers and regulators have failed to apply cumulative effects–based environmental management practices. The report concludes that a regional management system has not been achieved.97 95 Government of Alberta, Alberta’s Oil Sands: Resourceful. Responsible., 13. 96 CEMA, Terms of Reference (2004), 4, http://www.cemaonline.ca/component/option,com_docman/task,doc_download/gid,1900/Itemid,90/. 97 Integrated Environments and Tumbleweed Consulting Ltd, Independent Strategic and Program Evaluation of the Cumulative Environmental Management Association, report to the Athabasca Tribal Council and the Government of Alberta (2008), 51, http://environment.gov.ab.ca/info/library/8029.pdf.

Environmental Management
The Pembina Institute 29 Clearing the Air on Oil Sands Myths
22. Absolute limits are lacking for air emissions, land disturbance and water withdrawals.
The Spin: “Stringent legislation and on-the-ground measures are in place to protect the air, land and water during oil sands development.”98
The Plain Facts: There is no requirement to halt oil sands water withdrawals during low-flow periods when the river is at risk, nor are there limits on land impacts or on air emissions in the Athabasca Boreal Region around Fort McMurray, where the majority of oil sands emission growth is occurring.
The Full Story: Since 2000, environmental and cumulative effects management in the oil sands has largely relied on the recommendations of the multi-stakeholder organization, the Cumulative Environmental Management Association (CEMA). There are few limits set for water, air, land or toxins such as naphthenic acids which are concentrated in tailings lakes.
By 2005, CEMA met its targets for environmental management deliverables and recommendations on only approximately 25% of its work plan. A significant responsibility in CEMA’s failure to complete its essential work on time rests with the Government of Alberta, which has been criticized for failing to adequately resource CEMA workgroups and provide regulatory backstops to missed CEMA deadlines.99 AIR — The rapid expansion of the oil sands is driving up the pollution emitted in Alberta.
Alberta already ranks #1 in Canada for industrial air releases of criteria air contaminants (CACs), which include sulphur dioxide, nitrogen oxides, and particulate matter.100 Companies in Alberta emitted more than 1.18 billion kilograms of air pollutants in 2006.101 The oil sands industry has 98 Government of Alberta, Alberta’s Oil Sands: Resourceful. Responsible., 4. 99 Steven A. Kennett, “Closing the Performance Gap: The Challenge for Cumulative Effects Management in Alberta’s Athabasca Oil Sands Region.” In CIRL Occasional Paper #18 (Calgary: Canadian Institute of Resources Law, 2007). 100 PollutionWatch, PollutionWatch Update: Highlights from the 2006 Data, 2009, http://www.pollutionwatch.org/highlights.jsp 101 PollutionWatch, [2006] Ranking Provinces by Air Releases of CAC, 2009, http://www.pollutionwatch.org/rank.do?change=pwsource&year=2006&pwSourceSelected=NPRI_CAC&pollutant_select=all&pollutant=612-00-0&casNumber=100-00-5&healthEffect=all&airleaseType=CAC&provincesByList=RELE_AIR_CAC&provincesByButton=Rank&facilitiesByList=RELE_ON&provincesListFac=all&companiesByList=RELE_ON

Environmental Management
The Pembina Institute 30 Clearing the Air on Oil Sands Myths
reduced the volume of pollutants it emits to produce a barrel of synthetic crude oil (referred to as emissions intensity). Despite these efforts, the emissions intensity of common pollutants remains higher for oil sands production than for conventional oil production because there are many more steps involved in producing synthetic crude oil from oil sands.102
Growth in the total emission of CACs from the oil sands is linked to growth in oil sands production. The Alberta Government has not capped air emissions in the Athabasca Boreal Region around Fort MacMurray where the majority of oil sands emission growth is occurring.
The Alberta Government announced a cap in 2007 on SO2 and NOx emissions for the heavy industry area east of Edmonton, the “Industrial Heartland”.103 The Industrial Heartland is the site of several upgraders and upgrader proposals. While emission caps are a beginning, there has been no implementation of these caps to date.
When environmental assessments are conducted to evaluate the impacts of increasing air emissions, the impacts from the proposed project are compared to an approved scenario. Computer-generated air dispersion models are used to predict the concentration of air pollutants for both the approved scenario and a planned scenario.
Modeling of 2004’s approved scenario, which included three operating mines and three mining operations at various stages of planning and construction, showed that maximum predicted ambient air concentrations of N0x and S02 already exceed provincial, national and international guidelines.104 New projects will worsen this situation.
The Government of Alberta has implemented an initial management framework developed by the Cumulative Environmental Management Association stakeholders for acidifying emissions in the Athabasca Boreal Region. However, the framework does not include even an interim limit on acidifying emissions.105
In addition to N0x and S02 concerns, hydrogen sulfide (H2S) emissions are surpassing Alberta guidelines.106 In the Athabasca oil sands region in 2007, normal hourly hydrogen sulfide emissions were exceeded 361 times, up 88% over the 2006 number of 192 exceedances.107 102 Dan Woynillowicz, Chris Severson-Baker, and Marlo Raynolds, Oil Sands Fever (Calgary: The Pembina Institute, 2005), 46. 103 Government of Alberta, Alberta’s Environmental Plan to Deal With Cumulative Effects of Development (2009), http://environment.alberta.ca/1934.html. 104 Woynillowicz et al, Oil Sands Fever, 50. Alberta’s Ambient Air Quality Guideline for nitrogen oxides (N0x) is based on the prevention of human health effects. The guideline for sulphur dioxide (S02) is based on the prevention of effects to vegetation. 105 NOx-SO2 Management Working Group (NSMWG) of the Cumulative Environmental Management Association. 2004. Recommendations for the Acid Deposition Management Framework for the Oil Sands Region of North-Eastern Alberta. http://www.cemaonline.ca/component/option,com_docman/task,doc_download/Item,5/gid,515/ 106 Alberta guidelines for normal quantities.of H2S in ambient air are 10 parts per billion (ppb) over a one hour average and 3 ppb over a 24 hour average. See http://wbea.org/content/view/24/63/#h2s. 107 Clean Air Strategic Alliance data reports, http://www.casadata.org/Reports/SelectCategory.asp, accessed September 16, 2008. Monitoring stations included: 1) Mildred Lake Station at the Syncrude Airstrip, 2) Lower Camp, Suncor, 3) Buffalo Viewpoint at the south end of Syncrude South mine and 4) Mannix Station, Suncor.

Environmental Management
The Pembina Institute 31 Clearing the Air on Oil Sands Myths
Normal daily hydrogen sulfide emissions were exceeded 74 times in the Athabasca oil sands region in 2007, up over 200% from the 2006 number of 36 exceedances.108 LAND — Alberta has not yet completed land use planning for the Lower Athabasca Region.
It took CEMA’s Sustainable Ecosystems Working Group (SEWG) eight years to recommend a management framework to protect terrestrial ecosystems and wildlife in the Regional Municipality of Wood Buffalo (RMWB). Submitted in June 2008, the completed framework requires 20–40% of the RMWB to be permanently protected from industrial development.109 In the time that the SEWG took to develop the framework, much of the land proposed to be protected has been leased for oil sands development. The government continues to issue oil sands leases today and has not implemented the SEWG framework. Other CEMA recommendations such as establishing limits on maximum levels of disturbance and halting lease sales in remaining lease areas until conservation planning is complete have also not been implemented. WATER — The framework in place to protect Athabasca River flows is voluntary and lacks enforcement.
There is currently a Phase 1 Water Management Framework for the Lower Athabasca River that is designed, in principle, to balance losses to the ecological integrity of the lower Athabasca River with perceived needs by the oil sands industry.
While the framework is considered progressive in that it attempts to limit cumulative diversions from the Athabasca River, there are outstanding issues with the apparent lack of enforcement measures. Although the Phase 1 Water Management Framework restricts water withdrawals during low flow events, the restrictions are based on historical median flows and the instantaneous (actual) low flow event. Of most importance is the “red zone,” in which river flows are at their lowest and industry withdrawals threaten the ecological sustainability of the river. Specifically, the Phase 1 Water Management Framework allows 5.2% of the weekly historical median flow to be withdrawn during red zone conditions. Furthermore, as there is currently no ecosystem base flow (a low flow below which point withdrawals are not permitted) in place, oil sands operators will always be allowed to withdraw 5.2% of historical median flow regardless of the extent of a low flow event.110 This framework may be even less protective if flows are affected by climate change.111
108 Ibid. 109 Sustainable Ecosystems Working Group of the Cumulative Environmental Management Association, Terrestrial Ecosystem Management Framework for the Regional Municipality of Wood Buffalo (June 2008), 3, http://www.cemaonline.ca/content/view/75/182/ 110Alberta Environment and Fisheries and Oceans Canada, Water Management Framework: Instream Flow Needs and Water Management System for the Lower Athabasca River 2007, http://environment.alberta.ca/documents/Athabasca_RWMF_Technical.pdf 111 Ibid.

Environmental Management
The Pembina Institute 32 Clearing the Air on Oil Sands Myths
23. There is substantial room for the oil sands mining sector to improve its environmental performance.
The Spin: “The oil sands industry is strongly committed to improving environmental performance.”112
The Plain Facts: A 2008 grading assessment of 10 major oil sands mines using 20 different environmental indicators showed an average score of 33%. Only 2 out of 10 oil sands projects reported any voluntary targets to reduce their impact on air, land and water.
The Full Story: In a 2008 report by the Pembina Institute and WWF Canada, oil sands mines were ranked on 20 different environmental indicators in five categories: environmental management, land impacts, air pollution, water use and management of greenhouse gases. The average score among all oil sands projects was 33%, demonstrating substantial room for improvement across the oil sands mining sector.113
The highest score in the survey was the Albian Sands Muskeg River Mine with 56%. The weakest operations were Syncrude and the proposed Synenco Northern Lights Mine, both with scores of 18%. Only 2 out of 10 projects reported any voluntary targets to reduce impact on air, land and water.
The report revealed a broad range of performance across many indicators. If all oil sands mining operations could match the environmental performance of the current industry leader, substantial ecological benefits would ensue.114
112 CAPP, National Geographic's Article: An Incomplete Perspective. 113 Jeremy Moorhouse, Katie Laufenberg, Rob Powell, and Simon Dyer, Under-Mining the Environment: the Oil Sands Report Card (Drayton Valley, AB: The Pembina Institute, 2008), viii, http://www.oilsandswatch.org/pub/1571. 114 Ibid.