Cleaner Production Assessment in Dairy Processing
102
Cleaner Production Assessment in Dairy Processing Prepared by COWI Consulting Engineers and Planners AS, Denmark for United Nations Environment Programme Division of Technology, Industry and Economics and
Transcript of Cleaner Production Assessment in Dairy Processing

Cleaner Production Assessmentin Dairy Processing
Prepared by
COWI Consulting Engineers and Planners AS, Denmark
for
United Nations Environment ProgrammeDivision of Technology, Industry and Economics
and

Contents
Page i
CONTENTS
PREFACE ii
ACKNOWLEDGEMENTS iii
EXECUTIVE SUMMARY iv
1 CLEANER PRODUCTION 1
1.1 What is Cleaner Production? 1
1.2 Why invest in Cleaner Production? 3
1.3 Cleaner Production can be practised now 3
1.4 Cleaner Production and sustainable development 4
1.5 Cleaner Production and quality and safety 4
1.6 Cleaner Production and environmental management systems 5
2 OVERVIEW OF DAIRY PROCESSING 7
2.1 Process overview 8
2.2 Environmental impacts 12
2.3 Environmental indicators 16
3 CLEANER PRODUCTION OPPORTUNITIES 23
3.1 General 23
3.2 Milk production 26
3.3 Butter production 35
3.4 Cheese production 40
3.5 Evaporated and dried milk production 47
3.6 Cleaning 52
3.7 Ancillary operations 57
4 CLEANER PRODUCTION CASE STUDY 63
4.1 Campina Melkunie Maasdam 63
5 CLEANER PRODUCTION ASSESSMENT 69
5.1 Planning and organisation 71
5.2 Pre-assessment 72
5.3 Assessment 74
5.4 Evaluation and feasibility study 77
5.5 Implementation and continuation 80
ANNEX 1 REFERENCES AND BIBLIOGRAPHY 85
ANNEX 2 GLOSSARY 89
ANNEX 3 FURTHER INFORMATION 91
ANNEX 4 ABOUT UNEP DTIE 95

Cleaner Production Assessment in Dairy Processing
Page ii
PREFACEThe purpose of the Industrial Sector Guides for Cleaner ProductionAssessment is to raise awareness of the environmental impacts associatedwith industrial and manufacturing processes, and to highlight theapproaches that industry and government can take to avoid or minimisethese impacts by adopting a Cleaner Production approach.
This guide is designed for two principal audiences:
• People responsible for environmental issues at dairy processing plants(environmental managers or technicians) who seek information onhow to improve production processes and products. In manycountries, managers are ultimately responsible for any environmentalharm caused by their organisation’s activities, irrespective of whetherit is caused intentionally or unintentionally.
• Environmental consultants, Cleaner Production practitioners,employees of industry bodies, government officers or privateconsultants that provide advice to the dairy processing industry onenvironmental issues.
The guide describes Cleaner Production opportunities for improvingresource efficiency and preventing the release of contaminants to the air,water and land. The Cleaner Production opportunities described in thisguide will help improve production as well as environmental performance.
Chapter 1 provides a brief introduction to the concept of Cleaner Productionand the benefits that it can provide.
Chapter 2 provides an overview of the dairy processing industry includingprocess descriptions, environmental impacts and key environmentalindicators for the industry. The processes discussed in most detail are milk,butter, cheese and dried milk production, as well as cleaning and ancillaryoperations.
Chapter 3 describes Cleaner Production opportunities for each of the unitoperations within the process and examples where these have beensuccessfully applied. Quantitative data are provided for the inputs andoutputs associated with each unit operation as an indication of the typicallevels of resource consumption and waste generation.
Chapter 4 provides a case study demonstrating the application of CleanerProduction at a dairy processing plant.
Chapter 5 describes the Cleaner Production assessment methodology indetail. This can be used as a reference guide for carrying out a CleanerProduction assessment within an organisation.
Annex 1 contains a reference and bibliography list.
Annex 2 contains a glossary and list of abbreviations.
Annex 3 contains a list of literature and contacts for obtaining furtherinformation about the environmental aspects of the industry.
Annex 4 contains background information about the UNEP Division ofTechnology, Industry and Economics (UNEP DTIE).
Monetary figures quoted in this guide are based on 1995–98 figures andare presented as US dollars for consistency. As prices vary from country tocountry and from year to year, these figures should be used with care.They are provided as indicators of capital expenditure and savings only.

Acknowledgements
Page iii
ACKNOWLEDGEMENTSThis guide has been published jointly by the UNEP Division of Technology,Industry and Economics (UNEP DTIE) and the Danish EnvironmentalProtection Agency, and funded by the Danish Ministry of Foreign Affairs.The following people are acknowledged for their involvement in the guide’sproduction:
Authors:
• Mr Michael E. D. Bosworth, COWI Consulting Engineers and PlannersAS, Denmark;
• Mr Bent Hummelmose, COWI Consulting Engineers and Planners AS,Denmark;
• Mr Kim Christiansen, Sophus Berendsen, Denmark.
Contributors:
• Mr Erwin Van den Eede, Danish Environmental Protection Agency(EPA);
• Ms Mariane Hounum, Danish EPA;
• Mr Søren Kristoffersen, Danish EPA;
• Mr John Kryger, DTI/International;
• Mr Sybren de Hoo, UNEP DTIE, now Rabo Bank, the Netherlands;
• Mr Hugh Carr-Harris, BADO, now Enviros-RIS, United Kingdom.
Reviewers and editors:
• Ms Marguerite Renouf, UNEP Working Group for Cleaner Productionin the Food Industry, on behalf of Uniquest Pty Ltd, Australia;
• Mr Bob Pagan, UNEP Working Group for Cleaner Production in theFood Industry, on behalf of Uniquest Pty Ltd, Australia;
• Mrs Viera Feckova, Director, National Cleaner Production Centre ofSlovak Republic.
UNEP staff involved:
• Mrs Jacqueline Aloisi de Larderel, Director, UNEP DTIE;
• Mr Fritz Balkau, Chief, Production and Consumption Unit, UNEP DTIE;
• Ms Kristina Elvebakken, UNEP DTIE;
• Ms Wei Zhao, Programme Officer, Production and Consumption Unit,UNEP DTIE.
Cleaner Production Assessment in Dairy Processing
Page iv
EXECUTIVE SUMMARYThis document is one in a series of Industrial Sector Guides published bythe United Nations Environment Programme UNEP Division of Technology,Industry and Economics (UNEP DTIE) and the Danish EnvironmentalProtection Agency. The documents in the series include:
• Cleaner Production Assessment in Dairy Processing;
• Cleaner Production Assessment in Meat Processing; and
• Cleaner Production Assessment in Fish Processing.
This document is a guide to the application of Cleaner Production in thedairy industry, with a focus on the processing of milk and milk products atdairy processing plants. Its purpose is to raise awareness of theenvironmental impacts of dairy processing, and to highlight approaches thatindustry and government can take to avoid or minimise these impacts byadopting a Cleaner Production approach.
The life cycle of milk and milk products commences with the production offresh cow’s milk on dairy farms. Milk is then processed to producepasteurised and homogenised market milk, butter, cheese, yogurt, custardand dairy desserts etc. It may also be preserved for a longer shelf life in theform of long-life (UHT), condensed, evaporated or powdered milk products.The various products are packaged into consumer portions and distributedto retail outlets. For fresh dairy products, refrigerated storage is requiredthroughout the life of the products to maintain eating appeal and preventmicrobiological spoilage. Following use by the consumer, packaging iseither discarded or recycled.
In this guide, the upstream process of fresh milk production on dairy farmsand the downstream processes of distribution and post-consumerpackaging management are not covered. Instead the guide focuses on theprocessing of key dairy products, namely market milk, butter, cheese andevaporated and powdered milk, at dairy processing plants.
The processing of milk to produce dairy products is a significant contributorto the overall environmental load produced over the life cycle of milkproduction and consumption. Therefore the application of CleanerProduction in this phase of the life cycle is important.
As in many food processing industries, the key environmental issuesassociated with dairy processing are the high consumption of water, thegeneration of high-strength effluent streams, the consumption of energyand the generation of by-products. For some sites, noise and odour mayalso be concerns.
The guide contains background information about the industry and itsenvironmental issues, including quantitative data on rates of resourceconsumption and waste generation, where available. It presentsopportunities for improving the environmental performance of dairyprocessing plants through the application of Cleaner Production. Casestudies of successful Cleaner Production opportunities are also presented.
Cleaner ProductionCleaner Production is defined as the continuous application of anintegrated, preventive, environmental strategy applied to processes,products and services to increase overall efficiency and reduce risks tohumans and the environment.

Executive Summary
Page v
Cleaner Production is an approach to environmental management that aimsto improve the environmental performance of products, processes andservices by focusing on the causes of environmental problems rather thanthe symptoms. In this way, it is different to the traditional ‘pollutioncontrol’ approach to environmental management. Where pollution control isan after-the-event, ‘react and treat’ approach, Cleaner Production reflects aproactive, ‘anticipate and prevent’ philosophy.
Cleaner Production is most commonly applied to production processes bybringing about the conservation of resources, the elimination of toxic rawmaterials, and the reduction of wastes and emissions. However it can alsobe applied throughout the life cycle of a product, from the initial designphase through to the consumption and disposal phase. Techniques forimplementing Cleaner Production include improved housekeeping practices,process optimisation, raw material substitution, new technology and newproduct design.
The other important feature of Cleaner Production is that by preventinginefficient use of resources and avoiding unnecessary generation of waste,an organisation can benefit from reduced operating costs, reduced wastetreatment and disposal costs and reduced liability. Investing in CleanerProduction, to prevent pollution and reduce resource consumption is morecost effective than continuing to rely on increasingly expensive ‘end-of-pipe’ solutions. There have been many examples demonstrating thefinancial benefits of the Cleaner Production approach as well as theenvironmental benefits.
Water consumptionIn the dairy processing industry, water is used principally for cleaningequipment and work areas to maintain hygienic conditions, and accountsfor a large proportion of total water use. Rates of water consumption canvary considerably depending on the scale of the plant, the age and type ofprocessing, whether batch or continuous processes are used and the easewith which equipment can be cleaned, as well as operator practices. Atypical range for water consumption in reasonably efficient plants is1.3–2.5 litres water/kg of milk intake.
In most parts of the world, the cost of water is increasing as supplies offresh water become scarcer and as the true environmental costs of itssupply are taken into consideration. Water is therefore an increasinglyvaluable commodity and its efficient use is becoming more important.
Strategies for reducing water consumption can involve technologicalsolutions or equipment upgrade. However substantial benefits can also begained from examining cleaning procedures and operator practices. Somekey strategies for reducing water consumption are listed below and the useof these techniques would represent best practice for the industry. Bydoing so, water consumption can be reduced to as little as 0.8–1.0 litreswater/kg of milk intake.
• using continuous rather than batch processes to reduce the frequencyof cleaning;
• using automated cleaning-in-place (CIP) systems for cleaning tocontrol and optimise water use;
• installing fixtures that restrict or control the flow of water for manualcleaning processes;
• using high pressure rather than high volume for cleaning surfaces;

Cleaner Production Assessment in Dairy Processing
Page vi
• reusing relatively clean wastewaters (such as those from final rinses)for other cleaning steps or in non-critical applications;
• recirculating water used in non-critical applications;• installing meters on high-use equipment to monitor consumption;• pre-soaking floors and equipment to loosen dirt before the final clean;• using compressed air instead of water where appropriate;• reporting and fix leaks promptly.
Effluent dischargeMost water consumed at dairy plants ultimately becomes effluent. Dairyplant effluent is generally treated to some extent on site and thendischarged to municipal sewerage systems, if available. For somemunicipalities, dairy effluent can represent a significant load on sewagetreatment plants. Effluent may also be used for land irrigation in rural areas.
Dairy processing effluent contains predominantly milk and milk productswhich have been lost from the process, as well as detergents and acidicand caustic cleaning agents. Milk loss can be as high as 3–4%, with themain source of loss being residues which remain on the internal surfaces ofvessels and pipes, accidental spills during tanker emptying and overflowingvessels.
The organic load discharged in the effluent stream varies depending oncleaning practices and whether batch or continuous processes are used,since batch processes require a greater frequency of cleaning. A typicalfigure for the COD load in dairy plant effluent is about 8 kg/m3 milk intake.
Strategies for reducing the organic load of dairy effluents focus onminimising the amount of product that is lost to the effluent stream. Somekey strategies are listed below and the use of these techniques wouldrepresent best practice.
• ensuring that vessels and pipes are drained completely and using pigsand plugs to remove product residues before cleaning;
• using level controls and automatic shut-off systems to avoid spillsfrom vessels and tanker emptying;
• collecting spills of solid materials (cheese curd and powders) forreprocessing or use as stock feed, instead of washing them down thedrain;
• fitting drains with screens and/or traps to prevent solid materialsentering the effluent system;
• installing in-line optical sensors and diverters to distinguish betweenproduct and water and minimise losses of both;
• installing and maintaining level controls and automatic shut-offsystems on tanks to avoid overfilling;
• using dry cleaning techniques where possible, by scraping vesselsbefore cleaning or pre-cleaning with air guns;
• using starch plugs or pigs to recover product from pipes beforeinternally cleaning tanks.
Energy consumptionApproximately 80% of a dairy plant’s energy needs is met by thecombustion of fossil fuels (coal, oil or gas) to generate steam and hot waterfor evaporative and heating processes. The remaining 20% or so is met byelectricity for running electric motors, refrigeration and lighting.

Executive Summary
Page vii
Energy consumption depends on the age and scale of a plant, the level ofautomation and the range of products being produced. Processes whichinvolve concentration and drying, for example the production of milkpowder, are very energy intensive, whereas market milk, which requiresonly some heat treatment and packaging, requires considerably less energy.A typical range for energy consumption in plants processing milk is0.5–1.2 MJ/kg of milk intake.
Energy is an area where substantial savings can be made almostimmediately with no capital investment, through simple housekeepingefforts. Energy savings of up to 25% are possible through switch-offprograms and the fine tuning of existing processes, and an additional 20%can be saved through the use of more energy-efficient equipment and heatrecovery systems. Some key strategies are listed below, and the use ofthese techniques would represent best practice for the industry. By doingso, energy consumption for the processing of milk can be reduced to aslow as 0.3 MJ/kg of milk intake.
• implementing switch-off programs and installing sensors to turn off orpower down lights and equipment when not in use;
• improving insulation on heating or cooling systems and pipeworketc.;
• favouring more energy-efficient equipment;• improving maintenance to optimise energy efficiency of equipment;• maintaining optimal combustion efficiencies on steam and hot water
boilers;• eliminating steam leaks;• capturing low-grade energy for use elsewhere in the operation.
Evaporation of milk to produce concentrated or dried milk products is anarea of high energy use but also an area were energy savings can be made.The use of multiple effect evaporation systems, combined with thermal ormechanical recompression, can provide significant savings if not alreadybeing used.
In addition to reducing a plant’s demand for energy, there are opportunitiesfor using more environmentally benign sources of energy. Opportunitiesinclude replacing fuel oil or coal with cleaner fuels, such as natural gas,purchasing electricity produced from renewable sources, or co-generationof electricity and heat on site. For some plants it may also be feasible torecover methane from the anaerobic digestion of high-strength effluentstreams to supplement fuel supplies.
By-product managementThe most significant by-product from the dairy processing industry is whey,generated from the cheese-making process. In the past, the management ofwhey was a problem for the industry due to the high costs of treatmentand disposal. Untreated whey has a very high concentration of organicmatter, which can lead to pollution of rivers and streams and also createsbad odours. A number of opportunities exist for the recovery or utilisationof the lactose and protein content of whey. However it has only been inrecent years that they have become technically and economically viable.
The utilisation of by-products is an important Cleaner Productionopportunity for the industry since it reduces environmental burdens and canpotentially generate additional revenue.

Cleaner Production Assessment in Dairy Processing
Page viii
Implementing a Cleaner Production assessmentThis guide contains information to assist the reader to undertake a CleanerProduction assessment at a dairy processing plant. A Cleaner Productionassessment is a systematic procedure for identifying areas of inefficientresource consumption and poor waste management, and for developingCleaner Production options.
The methodology described in this guide is based on that developed byUNEP and UNIDO, and consists of the following basic steps:
• planning and organising the Cleaner Production assessment;
• pre-assessment (gathering qualitative information about theorganisation and its activities);
• assessment (gathering quantitative information about resourceconsumption and waste generation and generating Cleaner Productionopportunities);
• evaluation and feasibility assessment of Cleaner Productionopportunities;
• implementation of viable Cleaner Production opportunities anddeveloping a plan for the continuation of Cleaner Production efforts.
It is hoped that by providing technical information on known CleanerProduction opportunities and a methodology for undertaking a CleanerProduction assessment, individuals and organisations within the dairyindustry will be able to take advantage of the benefits that CleanerProduction has to offer.

Chapter 1 Cleaner Production
Page 1
1 CLEANER PRODUCTION
1.1 What is Cleaner Production?1
Over the years, industrialised nations have progressively taken differentapproaches to dealing with environmental degradation and pollutionproblems, by:
• ignoring the problem;
• diluting or dispersing the pollution so that its effects are lessharmful or apparent;
• controlling pollution using ‘end-of-pipe’ treatment;
• preventing pollution and waste at the source through a ‘CleanerProduction’ approach.
The gradual progression from ‘ignore’ through to ‘prevent’ hasculminated in the realisation that it is possible to achieve economicsavings for industry as well as an improved environment for society.This, essentially, is the goal of Cleaner Production.
Cleaner Production is defined as the continuous application of anintegrated preventive environmental strategy applied to processes,products and services to increase overall efficiency and reduce risks tohumans and the environment.
• For production processes, Cleaner Production involves theconservation of raw materials and energy, the elimination of toxicraw materials, and the reduction in the quantities and toxicity ofwastes and emissions.
• For product development and design, Cleaner Production involvesthe reduction of negative impacts throughout the life cycle of theproduct: from raw material extraction to ultimate disposal.
• For service industries, Cleaner Production involves theincorporation of environmental considerations into the design anddelivery of services.
The key difference between pollution control and Cleaner Production isone of timing. Pollution control is an after-the-event, ‘react and treat’approach, whereas Cleaner Production reflects a proactive, ‘anticipateand prevent’ philosophy. Prevention is always better than cure.
This does not mean, however, that ‘end-of-pipe’ technologies will neverbe required. By using a Cleaner Production philosophy to tackle pollutionand waste problems, the dependence on ‘end-of-pipe’ solutions may bereduced or in some cases, eliminated altogether.
Cleaner Production can be and has already been applied to raw materialextraction, manufacturing, agriculture, fisheries, transportation, tourism,hospitals, energy generation and information systems.
It is important to stress that Cleaner Production is about attitudinal aswell as technological change. In many cases, the most significantCleaner Production benefits can be gained through lateral thinking,
1 This chapter has been adapted from a UNEP publication, GovernmentStrategies and Policies for Cleaner Production, 1994.
Definition of CleanerProduction
Difference betweenCleaner Production andpollution control
Changing attitudes

Cleaner Production Assessment in Dairy Processing
Page 2
without adopting technological solutions. A change in attitude on thepart of company directors, managers and employees is crucial to gainingthe most from Cleaner Production.
Applying know-how means improving efficiency, adopting bettermanagement techniques, improving housekeeping practices, and refiningcompany policies and procedures. Typically, the application of technicalknow-how results in the optimisation of existing processes.
Technological improvements can occur in a number of ways:
• changing manufacturing processes and technology;
• changing the nature of process inputs (ingredients, energysources, recycled water etc.);
• changing the final product or developing alternative products;
• on-site reuse of wastes and by-products.
Types of Cleaner Production options
Housekeeping Improvements to work practices and propermaintenance can produce significant benefits. Theseoptions are typically low cost.
Processoptimisation
Resource consumption can be reduced by optimisingexisting processes. These options are typically low tomedium cost.
Raw materialsubstitution
Environmental problems can be avoided by replacinghazardous materials with more environmentallybenign materials. These options may require changesto process equipment.
Newtechnology
Adopting new technologies can reduce resourceconsumption and minimise waste generation throughimproved operating efficiencies. These options areoften highly capital intensive, but payback periodscan be quite short.
New productdesign
Changing product design can result in benefitsthroughout the life cycle of the product, includingreduced use of hazardous substances, reduced wastedisposal, reduced energy consumption and moreefficient production processes. New product design isa long-term strategy and may require new productionequipment and marketing efforts, but paybacks canultimately be very rewarding.
Applying know-how
Improving technology

Chapter 1 Cleaner Production
Page 3
1.2 Why invest in Cleaner Production?Investing in Cleaner Production, to prevent pollution and reduce resourceconsumption is more cost effective than continuing to rely onincreasingly expensive ‘end-of-pipe’ solutions.
When Cleaner Production and pollution control options are carefullyevaluated and compared, the Cleaner Production options are often morecost effective overall. The initial investment for Cleaner Productionoptions and for installing pollution control technologies may be similar,but the ongoing costs of pollution control will generally be greater thanfor Cleaner Production. Furthermore, the Cleaner Production option willgenerate savings through reduced costs for raw materials, energy, wastetreatment and regulatory compliance.
The environmental benefits of Cleaner Production can be translated intomarket opportunities for ‘greener’ products. Companies that factorenvironmental considerations into the design stage of a product will bewell placed to benefit from the marketing advantages of any future eco-labelling schemes.
Some reasons to invest in Cleaner Production
• improvements to product and processes;
• savings on raw materials and energy, thus reducing productioncosts;
• increased competitiveness through the use of new and improvedtechnologies;
• reduced concerns over environmental legislation;
• reduced liability associated with the treatment, storage anddisposal of hazardous wastes;
• improved health, safety and morale of employees;
• improved company image;
• reduced costs of end-of-pipe solutions.
1.3 Cleaner Production can be practised nowIt is often claimed that Cleaner Production techniques do not yet exist orthat, if they do, they are already patented and can be obtained onlythrough expensive licences. Neither statement is true, and this beliefwrongly associates Cleaner Production with ‘clean technology’.
Firstly, Cleaner Production depends only partly on new or alternativetechnologies. It can also be achieved through improved managementtechniques, different work practices and many other ‘soft’ approaches.Cleaner Production is as much about attitudes, approaches andmanagement as it is about technology.
Secondly, Cleaner Production approaches are widely and readilyavailable, and methodologies exist for its application. While it is true thatCleaner Production technologies do not yet exist for all industrialprocesses and products, it is estimated that 70% of all current wastesand emissions from industrial processes can be prevented at source by
Cleaner Productionversus pollution control
Greener products
Cleaner Production alsocovers changingattitudes andmanagement
Cleaner Productiontechniques already exist

Cleaner Production Assessment in Dairy Processing
Page 4
the use of technically sound and economically profitable procedures(Baas et al., 1992).
1.4 Cleaner Production and sustainable developmentIn the past, companies have often introduced processes withoutconsidering their environmental impact. They have argued that a trade-off is required between economic growth and the environment, and thatsome level of pollution must be accepted if reasonable rates of economicgrowth are to be achieved. This argument is no longer valid, and theUnited Nations Conference on Environment and Development (UNCED),held in Rio de Janeiro in June 1992, established new goals for the worldcommunity that advocate environmentally sustainable development.
Cleaner Production can contribute to sustainable development, asendorsed by Agenda 21. Cleaner Production can reduce or eliminate theneed to trade off environmental protection against economic growth,occupational safety against productivity, and consumer safety againstcompetition in international markets. Setting goals across a range ofsustainability issues leads to ‘win–win’ situations that benefit everyone.Cleaner Production is such a ‘win–win’ strategy: it protects theenvironment, the consumer and the worker while also improvingindustrial efficiency, profitability and competitiveness.
Cleaner Production can be especially beneficial to developing countriesand those undergoing economic transition. It provides industries in thesecountries with an opportunity to ‘leapfrog’ those more establishedindustries elsewhere that are saddled with costly pollution control.
1.5 Cleaner Production and quality and safetyFood safety and food quality are very important aspects of the foodindustry. While food safety has always been an important concern forthe industry, it has received even greater attention over the past decadedue to larger scales of production, more automated productionprocesses and more stringent consumer expectations. A strongeremphasis is also being placed on quality due to the need for companiesto be more efficient in an increasingly competitive industry.
In relation to food safety, Hazard Analysis Critical Control Point (HACCP)has become a widely use tool for managing food safety throughout theworld. It is an approach based on preventing microbiological, chemicaland physical hazards in food production processes by anticipating andpreventing problems, rather than relying on inspection of the finishedproduct.
Similarly, quality systems such as Total Quality Management (TQM) arebased on a systematic and holistic approach to production processesand aim to improve product quality while lowering costs.
Cleaner Production should operate in partnership with quality and safetysystems and should never be allowed to compromise them. As well,quality, safety and Cleaner Production systems can work synergisticallyto identify areas for improvement in all three areas.
Economy andenvironment go hand inhand
Cleaner Production canprovide advantages forall countries

Chapter 1 Cleaner Production
Page 5
1.6 Cleaner Production and environmental managementsystems
Environmental issues are complex, numerous and continually evolving,and an ad hoc approach to solving environmental problems is no longerappropriate. Companies are therefore adopting a more systematicapproach to environmental management, sometimes through aformalised environmental management system (EMS).
An EMS provides a company with a decision-making structure andaction programme to bring Cleaner Production into the company’sstrategy, management and day-to-day operations.
As EMSs have evolved, a need has arisen to standardise theirapplication. An evolving series of generic standards has been initiated bythe International Organization for Standardization (ISO), to providecompany management with the structure for managing environmentalimpacts. The UNEP/ICC/FIDIC Environmental Management SystemTraining Resource Kit, mentioned above, is compatible with theISO 14001 standard.
UNEP DTIE, together with the International Chamber of Commerce (ICC)and the International Federation of Engineers (FIDIC), has published anEnvironmental Management System Training Resource Kit, whichfunctions as a training manual to help industry adopt EMSs.
ISO 14001
EMS training resources


Chapter 2 Overview of Dairy Processing
Page 7
2 OVERVIEW OF DAIRY PROCESSINGThe dairy industry is divided into two main production areas:
• the primary production of milk on farms—the keeping of cows(and other animals such as goats, sheep etc.) for the production ofmilk for human consumption;
• the processing of milk—with the objective of extending its saleablelife. This objective is typically achieved by (a) heat treatment toensure that milk is safe for human consumption and has anextended keeping quality, and (b) preparing a variety of dairyproducts in a semi-dehydrated or dehydrated form (butter, hardcheese and milk powders), which can be stored.
The focus of this document is on the processing of milk and theproduction of milk-derived products—butter, cheese and milk powder—at dairy processing plants. The upstream process of primary milkproduction on dairy farms is not covered, since this activity is morerelated to the agricultural sector. Similarly, downstream processes ofdistribution and retail are not covered.
Dairy processing occurs world-wide; however the structure of theindustry varies from country to country. In less developed countries,milk is generally sold directly to the public, but in major milk producingcountries most milk is sold on a wholesale basis. In Ireland andAustralia, for example, many of the large-scale processors are owned bythe farmers as co-operatives, while in the United States individualcontracts are agreed between farmers and processors.
Dairy processing industries in the major dairy producing countries haveundergone rationalisation, with a trend towards fewer but larger plantsoperated by fewer people. As a result, in the United States, Europe,Australia and New Zealand most dairy processing plants are quite large.
Plants producing market milk and products with short shelf life, such asyogurts, creams and soft cheeses, tend to be located on the fringe ofurban centres close to consumer markets. Plants manufacturing itemswith longer shelf life, such as butter, milk powders, cheese and wheypowders, tend to be located in rural areas closer to the milk supply.
The general tendency world-wide, is towards large processing plantsspecialising in a limited range of products. There are exceptions,however. In eastern Europe for example, due to the former supply-drivenconcept of the market, it is still very common for ‘city’ processing plantsto be large multi-product plants producing a wide range of products.
The general trend towards large processing plants has providedcompanies with the opportunity to acquire bigger, more automated andmore efficient equipment. This technological development has, however,tended to increase environmental loadings in some areas due to therequirement for long-distance distribution.
Basic dairy processes have changed little in the past decade. Specialisedprocesses such as ultrafiltration (UF), and modern drying processes,have increased the opportunity for the recovery of milk solids that wereformerly discharged. In addition, all processes have become much moreenergy efficient and the use of electronic control systems has allowedimproved processing effectiveness and cost savings.
Primary production anddairy processing
Focus of this guide
Industry structure andtrends

Cleaner Production Assessment in Dairy Processing
Page 8
2.1 Process overview
2.1.1 Milk production
The processes taking place at a typical milk plant include:
• receipt and filtration/clarification of the raw milk;
• separation of all or part of the milk fat (for standardisation ofmarket milk, production of cream and butter and other fat-basedproducts, and production of milk powders);
• pasteurisation;
• homogenisation (if required);
• deodorisation (if required);
• further product-specific processing;
• packaging and storage, including cold storage for perishableproducts;
• distribution of final products.
Figure 2–1 is a flow diagram outlining the basic steps in the productionof whole milk, semi-skimmed milk and skimmed milk, cream, butter andbuttermilk. In such plants, yogurts and other cultured products may alsobe produced from whole milk and skimmed milk.
2.1.2 Butter production
The butter-making process, whether by batch or continuous methods,consists of the following steps:
• preparation of the cream;
• destabilisation and breakdown of the fat and water emulsion;
• aggregation and concentration of the fat particles;
• formation of a stable emulsion;
• packaging and storage;
• distribution.
Figure 2–2 is a flow diagram outlining the basic processing system for abutter-making plant. The initial steps, (filtration/clarification, separationand pasteurisation of the milk) are the same as described in the previoussection. Milk destined for butter making must not be homogenised,because the cream must remain in a separate phase.
After separation, cream to be used for butter making is heat treated andcooled under conditions that facilitate good whipping and churning. Itmay then be ripened with a culture that increases the content ofdiacetyl, the compound responsible for the flavour of butter.Alternatively, culture inoculation may take place during churning. Butterwhich is flavour enhanced using this process is termed lactic, ripened orcultured butter. This process is very common in continental Europeancountries. Although the product is claimed to have a superior flavour,the storage life is limited. Butter made without the addition of a cultureis called sweet cream butter. Most butter made in the English-speakingworld is of this nature.

Chapter 2 Overview of Dairy Processing
Page 9
Figure 2–1 Flow diagram for processes occurring at a typical milk plant
Both cultured and sweet cream butter can be produced with or withoutthe addition of salt. The presence of salt affects both the flavour and thekeeping quality.
Butter is usually packaged in bulk quantities (25 kg) for long-termstorage and then re-packed into marketable portions (usually 250 g or500 g, and single-serve packs of 10–15 g). Butter may also be packedin internally lacquered cans, for special markets such as the tropics andthe Middle East.
Milk receipt, filtration and clarification
Storage
Pasteurisation
Deodorisation
Storage
Packaging and cold storage
Distribution
Separation andstandardisationWhole milk
Skimmedmilk
Cream
Homogenisation Homogenisation
CreamWhole milk Skimmedmilk
Butterchurning
Packagingand freezing
Buttermilk Butter
Butter
Whole milkSemi-skimmedmilkSkimmed milk
Cream Buttermilk Butter
Cream

Cleaner Production Assessment in Dairy Processing
Page 10
Figure 2–2 Flow diagram for a typical butter-making plant
2.1.3 Cheese production
Virtually all cheese is made by coagulating milk protein (casein) in amanner that traps milk solids and milk fat into a curd matrix. This curdmatrix is then consolidated to express the liquid fraction, cheese whey.Cheese whey contains those milk solids which are not held in the curdmass, in particular most of the milk sugar (lactose) and a number ofsoluble proteins.
Figure 2–3 outlines the basic processes in a cheese-making plant. Allcheese-making processes involve some or all of these steps.
Milk receipt, pre-treatmentand separation
Pasteurisation
Cooling
Ageing
Culture productsand inoculation
Chill storage
Bulk packaging
Churning and working
Freezing, storage
Consumer packaging
Thawing
Buttermilk
Cream
Bulk distribution
Retail distribution

Chapter 2 Overview of Dairy Processing
Page 11
Figure 2–3 Flow diagram for a typical cheese plant
2.1.4 Milk powder production
Milk used for making milk powder, whether it be whole or skim milk, isnot pasteurised before use. The milk is preheated in tubular heatexchangers before being dried. The preheating temperature depends onthe season (which affects the stability of the protein in the milk) and onthe characteristics desired for the final powder product.
The preheated milk is fed to an evaporator to increase the concentrationof total solids. The solids concentration that can be reached depends onthe efficiency of the equipment and the amount of heat that can beapplied without unduly degrading the milk protein.
The milk concentrate is then pumped to the atomiser of a dryingchamber. In the drying chamber the milk is dispersed as a fine fog-likemist into a rapidly moving hot air stream, which causes the individualmist droplets to instantly evaporate. Milk powder falls to the bottom ofthe chamber, from where it is removed. Finer milk powder particles are
Milk receipt,pre-treatment and
standardisation
Pasteurisation
Addition of starter culture
Coagulation
Extraction of whey
Cutting and cookingof curd
Salting
Ripening
Cheese whey
Cheese milk
Distribution
Wheytreatment
plant
Packaging

Cleaner Production Assessment in Dairy Processing
Page 12
carried out of the chamber along with the hot air stream and collected incyclone separators.
Milk powders are normally packed and distributed in bulk containers orin 25 kg paper packaging systems. Products sold to the consumermarket are normally packaged in cans under nitrogen. This packagingsystem improves the keeping quality, especially for products with highfat content.
Figure 2–4 outlines the basic processes for the production of milkpowder.
Figure 2–4 Flow diagram for a typical milk drying plant
2.2 Environmental impactsThis section briefly describes some of the environmental impactsassociated with the primary production of milk and the subsequentprocessing of dairy products. While it is recognised that the primaryproduction of milk has some significant environmental impacts, thisdocument is predominantly concerned with the processing of dairyproducts.
Standardised milk(whole or skimmed)
Preheating
Evaporation
Spray drying
Storage
Packaging
Distribution
Chapter 2 Overview of Dairy Processing
Page 13
2.2.1 Impacts of primary production
The main environmental issues associated with dairy farming are:
• the generation of solid manure and manure slurries, which maypollute surface water and groundwater;
• the use of chemical fertilisers and pesticides in the production ofpastures and fodder crops, which may pollute surface water andgroundwater;
• the contamination of milk with pesticides, antibiotics and otherchemical residues.
In most cases, solid manure is applied to pastures and cultivated land.The extent of application, however, may be restricted in some regions.Dairy effluent and slurries are generally held in some form of lagoon toallow sedimentation and biological degradation before they are irrigatedonto land. Sludge generated from biological treatment of the dairyeffluent can also be applied to pastures, as long as it is within theallowable concentrations for specified pollutants, as prescribed byregulations. Sludge can also be used in the production of methane-richbiogas, which can then be used to supplement energy supplies.
Manure waste represents a valuable source of nutrients. Howeverimproper storage and land application of manure and slurries can resultin serious pollution of surface waters and groundwater, potentiallycontaminating drinking water supplies.
The extensive use of chemical fertilisers containing high levels ofnitrogen has resulted in pollution of the groundwater and surface watersin many countries.
Nitrite in drinking water is known to be carcinogenic, and nitrite levels indrinking water that exceed 25–50 mg/L have been linked to cyanosis innewborn infants (‘blue babies’).
Compounds containing nitrogen and phosphorus, if discharged tosurface water, can lead to excessive algal growth (eutrophication). Thisresults in depleted dissolved oxygen levels in the water, thereby causingthe death of fish and other aquatic species. In sensitive areas, therefore,the rate and manner of application of chemical fertilisers are critical.
The use of pesticides has been recognised as an environmental concernfor many agricultural activities. Toxic pesticides, some of whichbiodegrade very slowly, can accumulate in body tissues and are harmfulto ecosystems and to human health. Pesticides can end up in agriculturalproducts, groundwater and surface waters, and in extreme cases canenter the human food chain through milk.
For the past few decades, the contamination of milk with antibiotics hasbeen an issue of concern. This is due to the overuse of antibiotics fortreatment of cattle diseases, particularly mastitis. It has been broughtunder control in most countries with developed dairy industries, throughstrict limitations on the use of antibiotics, regular testing of milk forantibiotic residues, rigorous enforcement of regulations, and education.
In some countries, considerable attention has also been paid to thescreening of milk supplies for traces of radioactivity, and most countriesnow apply acceptance limits for raw and imported milk products. Eventhe slightest levels of contamination in milk can be serious, becausepollutants are concentrated in the processing process.
Manure wastes
Chemical fertilisers
Pesticides
Milk contamination

Cleaner Production Assessment in Dairy Processing
Page 14
2.2.2 Impacts of dairy processing
As for many other food processing operations, the main environmentalimpacts associated with all dairy processing activities are the highconsumption of water, the discharge of effluent with high organic loadsand the consumption of energy. Noise, odour and solid wastes may alsobe concerns for some plants.
Dairy processing characteristically requires very large quantities of freshwater. Water is used primarily for cleaning process equipment and workareas to maintain hygiene standards.
The dominant environmental problem caused by dairy processing is thedischarge of large quantities of liquid effluent. Dairy processing effluentsgenerally exhibit the following properties:
• high organic load due to the presence of milk components;
• fluctuations in pH due to the presence of caustic and acidic cleaningagents and other chemicals;
• high levels of nitrogen and phosphorus;
• fluctuations in temperature.
If whey from the cheese-making process is not used as a by-product anddischarged along with other wastewaters, the organic load of theresulting effluent is further increased, exacerbating the environmentalproblems that can result.
In order to understand the environmental impact of dairy processingeffluent, it is useful to briefly consider the nature of milk. Milk is acomplex biological fluid that consists of water, milk fat, a number ofproteins (both in suspension and in solution), milk sugar (lactose) andmineral salts.
Dairy products contain all or some of the milk constituents and,depending on the nature and type of product and the method ofmanufacturing, may also contain sugar, salts (e.g. sodium chloride),flavours, emulsifiers and stabilisers.
For plants located near urban areas, effluent is often discharged tomunicipal sewage treatment systems. For some municipalities, theeffluent from local dairy processing plants can represent a significantload on sewage treatment plants. In extreme cases, the organic load ofwaste milk solids entering a sewage system may well exceed that of thetownship’s domestic waste, overloading the system.
In rural areas, dairy processing effluent may also be irrigated to land. Ifnot managed correctly, dissolved salts contained in the effluent canadversely affect soil structure and cause salinity. Contaminants in theeffluent can also leach into underlying groundwater and affect itsquality.
In some locations, effluent may be discharged directly into water bodies.However this is generally discouraged as it can have a very negativeimpact on water quality due to the high levels of organic matter andresultant depletion of oxygen levels.
Electricity is used for the operation of machinery, refrigeration,ventilation, lighting and the production of compressed air. Like waterconsumption, the use of energy for cooling and refrigeration is importantfor ensuring good keeping quality of dairy products and storage
Water consumption
Effluent discharge
Energy consumption

Chapter 2 Overview of Dairy Processing
Page 15
temperatures are often specified by regulation. Thermal energy, in theform of steam, is used for heating and cleaning.
As well as depleting fossil fuel resources, the consumption of energycauses air pollution and greenhouse gas emissions, which have beenlinked to global warming.
Dairy products such as milk, cream and yogurt are typically packed inplastic-lined paperboard cartons, plastic bottles and cups, plastic bags orreusable glass bottles. Other products, such as butter and cheese, arewrapped in foil, plastic film or small plastic containers. Milk powders arecommonly packaged in multi-layer kraft paper sacs or tinned steel cans,and some other products, such as condensed milks, are commonlypacked in cans.
Breakages and packaging mistakes cannot be totally avoided. Improperlypackaged dairy product can often be returned for reprocessing; howeverthe packaging material is generally discarded.
Emissions to air from dairy processing plants are caused by the highlevels of energy consumption necessary for production. Steam, which isused for heat treatment processes (pasteurisation, sterilisation, dryingetc.) is generally produced in on-site boilers, and electricity used forcooling and equipment operation is purchased from the grid. Airpollutants, including oxides of nitrogen and sulphur and suspendedparticulate matter, are formed from the combustion of fossil fuels, whichare used to produce both these energy sources.
In addition, discharges of milk powder from the exhausts of spray dryingequipment can be deposited on surrounding surfaces. When wet thesedeposits become acidic and can, in extreme cases, cause corrosion.
For operations that use refrigeration systems based onchlorofluorocarbons (CFCs), the fugitive loss of these gases to theatmosphere is an important environmental consideration, since CFCs arerecognised to be a cause of ozone depletion in the atmosphere. For suchoperations, the replacement of CFC-based systems with non- orreduced-CFC systems is thus an important issue.
Some processes, such as the production of dried casein, require the useof hammer mills to grind the product. The constant noise generated bythis equipment has been known to be a nuisance in surroundingresidential areas. The use of steam injection for heat treatment of milkand for the creation of reduced pressure in evaporation processes alsocauses high noise levels.
A substantial traffic load in the immediate vicinity of a dairy plant isgenerally unavoidable due to the regular delivery of milk (which may beon a 24-hour basis), deliveries of packaging and the regular shipment ofproducts.
Noise problems should be taken into consideration when determiningplant location.
Hazardous wastes consist of oily sludge from gearboxes of movingmachines, laboratory waste, cooling agents, oily paper filters, batteries,paint cans etc. At present, in western Europe some of these materialsare collected by waste companies. While some waste is incinerated,much is simply dumped.
Solid wastes
Emissions to air
Refrigerants
Noise
Hazardous wastes

Cleaner Production Assessment in Dairy Processing
Page 16
2.3 Environmental indicatorsEnvironmental indicators are important for assessing Cleaner Productionopportunities and for assessing the environmental performance of onedairy processing operation relative to another. They provide an indicationof resource consumption and waste generation per unit of production.
Figure 2–5 is a generic flowchart of the overall process includingresource inputs and waste outputs. The sections that follow provide adiscussion of the key inputs and outputs. Where available, quantitativedata are provided.
Figure 2–5 Inputs and outputs of a dairy
2.3.1 Water consumption
As with most food processing operations, water is used extensively forcleaning and sanitising plant and equipment to maintain food hygienestandards. Table 2–1 shows the areas of water consumption within adairy processing plant, and gives an indication of the extent to whicheach area contributes to overall water use.
Due to the higher costs of water and effluent disposal that have nowbeen imposed in some countries to reflect environmental costs,considerable reduction in water consumption has been achieved over the
Milk receiptand storage
Separation (andstandardisation
)
Butterproduction
Pasteurisation
Milkpowder
Cheeseproduction
Whole andskimmed milk
products
Cold storage
Raw milk andminoringredients
Water
Energy- electricity- fuel for steam production
Detergents andsanitisers
Refrigerants
Effluent from:- tanker washing- cleaning- milk spills- cheese whey
Air emissions:- combustion gases- milk powder dust- refrigerant gases- odour
Packaging and distributionSolid waste:- damaged products- out-of-date products
Packagingmaterials
Dairy products

Chapter 2 Overview of Dairy Processing
Page 17
past few decades in the dairy processing industry. Table 2–2 shows thereductions in water consumption per kilogram of product that have beenachieved over this period. These improvements are attributed todevelopments in process control and cleaning practices.
At modern dairy processing plants, a water consumption rate of 1.3–2.5litres water/kg of milk intake is typical, however 0.8–1.0 litres water/kgof milk intake is possible (Bylund, 1995). To achieve such lowconsumption requires not only advanced equipment, but also very goodhousekeeping and awareness among both employees and management.
Table 2–1 Areas of water consumption at dairy processing plants 1
Area of use Consumption (L/kg product) Percentage of total
Locker room 0.01–1.452%
Staff use 0.02–0.442%
Boiler 0.03–0.782%
Cold storage 0.03–0.782%
Receipt area 0.11–0.923%
Filling room 0.11–0.413%
Crate washer 0.18–0.754%
Cooling tower 0.20–1.85%
Cleaning 0.32–1.768%
Cheese room 0.06–20.8913%
Utilities 0.56–4.3916%
Incorporated into
products
1.52–9.4440%
TOTAL 2.21–9.44 100%
1 Danish EPA, 1991
Table 2–2 Trend towards reduced water consumption at dairyprocessing plants
Water consumption (L/kg milk)
19731 1990s2
Low consumption 2.21
Mediumconsumption
3.25 1.3–2.5
High consumption 9.44
1 Jones, 1974
2 Danish EPA, 1991
Cleaner Production Assessment in Dairy Processing
Page 18
2.3.2 Effluent discharge
Dairy processing effluent contains predominantly milk and milk productswhich have been lost from the process, as well as detergents and acidicand caustic cleaning agents. The constituents present in dairy effluentare milk fat, protein, lactose and lactic acid, as well as sodium,potassium, calcium and chloride. Milk loss to the effluent stream canamount to 0.5–2.5% of the incoming milk, but can be as high as3–4%.
A major contributing factor to a dairy plant’s effluent load is thecumulative effect of minor and, on occasions, major losses of milk.These losses can occur, for example, when pipework is uncoupledduring tank transfers or equipment is being rinsed. Table 2–3 provides alist of the sources of milk losses to the effluent stream.
The organic pollutant content of dairy effluent is commonly expressed asthe 5-day biochemical oxygen demand (BOD5) or as chemical oxygendemand (COD). One litre of whole milk is equivalent to approximately110,000 mg BOD5 or 210,000 mg COD.
Concentrations of COD in dairy processing effluents vary widely, from180 to 23,000 mg/L. Low values are associated with milk receiptoperations and high values reflect the presence of whey from theproduction of cheese. A typical COD concentration for effluent from adairy plant is about 4000 mg/L. This implies that 4% of the milk solidsreceived into the plant is lost to the effluent stream, given that the CODof whole milk is 210,000 mg/L and that effluent COD loads have beenestimated to be approximately 8.4 kg/m3 milk intake (Marshall andHarper, 1984).
A Danish survey (see text box below) found that effluent loads fromdairy processing plants depend, to some extent, on the type of productbeing produced. The scale of the operation and whether a plant usesbatch or continuous processes also have a major influence, particularlyfor cleaning. This is because small batch processes requires morefrequent cleaning. The tendency within the industry towards largerplants is thus favourable in terms of pollutant loading per unit ofproduction.
Water consumption survey for Danish dairy processing plants
A survey of 72 Danish dairy companies operating a total of 134processing plants was conducted in 1989 (Danish EPA, 1991). Theproduct mix of the companies surveyed was as follows: 44 dairiesproduced butter, 90 produced cheese, 29 were market milk plants and11 produced concentrates including milk powder. The plants surveyedwere all technologically advanced and most claimed that they hadreduced the pollutant load of their effluents by 30–50% compared withprevious years. The survey found that on average each tonne of milkprocessed resulted in the production of 1.3 m3 of effluent with thefollowing characteristics:
COD 2000 mg/LBOD5 1500 mg/LFat 150 mg/LTotal nitrogen 100 mg/LTotal phosphorus 30 mg/L

Chapter 2 Overview of Dairy Processing
Page 19
Table 2–3 Sources of milk losses to the effluent stream1
Process area Source of milk loss
Milk receipt and storage • Poor drainage of tankers• Spills and leaks from hoses and pipes• Spills from storage tanks• Foaming• Cleaning operations
Pasteurisation and ultraheat treatment
• Leaks• Recovery of downgraded product• Cleaning operations• Foaming• Deposits on surfaces of equipment
Homogenisation • Leaks• Cleaning operations
Separation and clarification • Foaming• Cleaning operations• Pipe leaks
Market milk production • Leaks and foaming• Product washing• Cleaning operations• Overfilling• Poor drainage• Sludge removal from separators/clarifiers• Damaged milk packages• Cleaning of filling machinery
Cheese making • Overfilling vats• Incomplete separation of whey from
curds• Use of salt in cheese making• Spills and leaks• Cleaning operations
Butter making • Vacreation and use of salt• Cleaning operations
Milk powder production • Spills during powder handling• Start-up and shut-down processes• Plant malfunction• Stack losses• Cleaning of evaporators and driers• Bagging losses
1 EPA Victoria 1997.
Due to the traditional payment system for raw milk (which is based onthe mass or volume delivered plus a separate price or premium for theweight of milk fat), the dairy processing industry has always tried tominimise loss of milk fat. In many countries the payment system nowrecognises the value of the non-fat milk components. Systems thatcontrol the loss of both fat and protein are now common in theindustrialised world, but less so in the developing world.

Cleaner Production Assessment in Dairy Processing
Page 20
The disposal of whey produced during cheese production has alwaysbeen a major problem in the dairy industry. Whey is the liquid remainingafter the recovery of the curds formed by the action of enzymes on milk.It comprises 80–90% of the total volume of milk used in the cheesemaking process and contains more than half the solids from the originalwhole milk, including 20% of the protein and most of the lactose. It hasa very high organic content, with a COD of approximately 60,000 mg/L(Morr, 1992). Only in the past two decades have technological advancesmade it economically possible to recover soluble proteins from cheesewhey and, to some extent, to recover value from the lactose.
Most dairies are aware that fat and protein losses increase the organicload of the effluent stream and, even in the developing world, the use ofgrease traps has been common for some decades. Many companies,however, do not take any action to reduce the organic pollution fromother milk components. It is becoming more common for dairycompanies to be forced by legal or economic pressures to reduce theamount and concentration of pollutants in their effluent streams.
Therefore, at most sites, wastewater treatment or at least pretreatmentis necessary to reduce the organic loading to a level that causes minimalenvironmental damage and does not constitute a health risk. Theminimum pretreatment is usually neutralisation of pH, solidssedimentation and fat removal.
2.3.3 Energy consumption
Energy is used at dairy processing plants for running electric motors onprocess equipment, for heating, evaporating and drying, for cooling andrefrigeration, and for the generation of compressed air.
Approximately 80% of a plant’s energy needs is met by the combustionof fossil fuel (gas, oil etc.) to generate steam and hot water forevaporative and heating processes. The remaining 20% or so is met byelectricity for running electric motors, refrigeration and lighting.
The energy consumed depends on the range of products beingproduced. Processes which involve the concentration and drying of milk,whey or buttermilk for example, are very energy intensive. Theproduction of market milk at the other extreme involves only some heattreatment and packaging, and therefore requires considerably lessenergy. Table 2–4 provides some indicative figures of specific energyconsumption of different dairy products.
Table 2–4 Specific energy consumption for various dairy products 1
Product Electricity consumption
(GJ/tonne product)
Fuel consumption
(GJ/tonne product)
Market milk 0.20 0.46
Cheese 0.76 4.34
Milk powder 1.43 20.60
Butter 0.71 3.53
1 Joyce and Burgi, 1993. (based on a survey of Australian dairy processors in 1981–82)

Chapter 2 Overview of Dairy Processing
Page 21
Energy consumption will also depend on the age and scale of a plant aswell as the level of automation. To demonstrate this, Table 2–5 providesexamples of energy consumption rates for a selection of Australianplants processing market milk.
Table 2–5 Energy consumption for a selection of milk plants 1
Type of plant Total energy consumption
(GJ/tonne milk processed)
Modern plant with high-efficiency regenerative
pasteuriser and modern boiler
0.34
Modern plant using hot water for processing 0.50
Old, steam-based plant 2.00
Range for most plants 0.5–1.2
1 Joyce and Burgi, 1993. (based on a survey of Australian dairy processors in 1981–82)
Plants producing powdered milk exhibit a wide range of energyefficiencies, depending on the type of evaporation and drying processesthat are used. Energy consumption depends on the number ofevaporation effects (the number of evaporation units that are used inseries) and the efficiency of the powder dryer. Table 2–6 providesexamples of how different evaporation and drying systems can affectthe energy efficiency of the process.
Substantial increases in electricity use have resulted from the trendtowards automated plant with associated pumping costs and largerevaporators as well as an increase in refrigeration requirements.
High consumption of electricity can also be due to the use of old motors,excessive lighting or possibly a lack of power factor correction.
Table 2–6 Energy consumption for evaporation and drying systems 1
Type of evaporation and drying system Total energy consumption
(GJ/tonne product)
5-effect evaporator and 2-stage drier 13–15
3-effect evaporator and 1-stage drier 22–28
2-effect evaporator and 1-stage drier 40–50
1 Joyce and Burgi, 1993. (based on a survey of Australian dairy processors in 1981–82)

Chapter 3 Cleaner Production Opportunities
Page 23
3 CLEANER PRODUCTION OPPORTUNITIESDairy processing typically consumes large quantities of water and energyand discharges significant loads of organic matter in the effluent stream.For this reason, Cleaner Production opportunities described in this guidefocus on reducing the consumption of resources (water and energy),increasing production yields and reducing the volume and organic load ofeffluent discharges.
At the larger production scales, dairy processing has become anextremely automated process and resource efficiency relies, to a largeextent, on the efficiency of plant and equipment, the control systemsthat are used to operate them and the technologies used to recoverresources. As a result many Cleaner Production opportunities lie in theselection, design and efficient operation of process equipment. Operatorpractices also have an impact on plant performance, for example in theareas of milk delivery, plant maintenance and cleaning operations.Therefore there are also opportunities in the areas of housekeeping,work procedures, maintenance regimes and resource handling.
Section 3.1 provides examples of general Cleaner Productionopportunities that apply across the entire process, whereas Sections 3.2to 3.7 present opportunities that relate specifically to individual unitoperations within the process. For each unit operation, a detailedprocess description is provided along with Cleaner Productionopportunities specific to that activity. Where available, quantitative dataapplicable to each unit operation is also provided.
3.1 GeneralMany food processors that undertake Cleaner Production projects findthat significant environmental improvement and cost savings can bederived from simple modification to housekeeping procedures andmaintenance programs. Table 3–1 is a checklist of some of these ways.They are generic ideas that apply to the dairy manufacturing process asa whole.
Table 3–1 Checklist of general housekeeping ideas1
• Keep work areas tidy and uncluttered to avoid accidents.
• Maintain good inventory control to avoid waste of raw ingredients.
• Ensure that employees are aware of the environmental aspects ofthe company’s operations and their personal responsibilities.
• Train staff in good cleaning practices.
• Schedule regular maintenance activities to avoid breakdowns.
• Optimise and standardise equipment settings for each shift.
• Identify and mark all valves and equipment settings to reduce therisk that they will be set incorrectly by inexperienced staff.
• Improve start-up and shut-down procedures.
• Segregate waste for reuse and recycling.
• Install drip pans or trays to collect drips and spills.
1 UNEP Cleaner Production Working Group for the Food Industry, 1999

Cleaner Production Assessment in Dairy Processing
Page 24
3.1.1 Water
Water is used extensively in dairy processing, so water saving measuresare very common Cleaner Production opportunities in this industry. Thefirst step is to analyse water use patterns carefully, by installing watermeters and regularly recording water consumption. Water consumptiondata should be collected during production hours, especially duringperiods of cleaning. Some data should also be collected outside normalworking hours to identify leaks and other areas of unnecessary wastage.
The next step is to undertake a survey of all process area and ancillaryoperations to identify wasteful practices. Examples might be hoses leftrunning when not in use, CIP cleaning processes using more water thannecessary, etc. Installing automatic shut-off equipment and restrictorscould prevent such wasteful practices. Automatic control of water use ispreferable to relying on operators to manually turn water off.
Once wasteful practices have been addressed, water use for essentialprocess functions can be investigated. It can be difficult to establish theminimum consumption rate necessary to maintain process operationsand food hygiene standards. The optimum rate can be determined onlyby investigating each process in detail and undertaking trials. Suchinvestigations should be carried out collaboratively by productionmanagers, food quality and safety representatives and operations staff.When an optimum usage rate been agreed upon, measures should betaken to set the supply at the specified rate and remove manual control.
Once water use for essential operations has been optimised, water reusecan be considered. Wastewaters that are only slightly contaminatedcould be used in other areas. For example, final rinse waters could beused as the initial rinses for subsequent cleaning activities, or evaporatorcondensate could be reused as cooling water or as boiler feed water.Wastewater reuse should not compromise product quality and hygiene,and reuse systems should be carefully installed so that reusedwastewater lines cannot be mistaken for fresh water lines, and eachcase should be approved by the food safety officer.
Table 3–2 Checklist of water saving ideas 1
• Use continuous rather than batch processes to reduce thefrequency of cleaning;
• Use automated cleaning-in-place (CIP) systems for cleaning tocontrol and optimise water use;
• Install fixtures that restrict or control the flow of water for manualcleaning processes;
• Use high pressure rather than high volume for cleaning surfaces;
• Reuse relatively clean wastewaters (such as those from finalrinses) for other cleaning steps or in non-critical applications;
• Recirculate water used in non-critical applications;
• Install meters on high-use equipment to monitor consumption;
• Pre-soak floors and equipment to loosen dirt before the final clean;
• Use compressed air instead of water where appropriate;
• Report and fix leaks promptly.
1 UNEP Cleaner Production Working Group for the Food Industry, 1999

Chapter 3 Cleaner Production Opportunities
Page 25
3.1.2 Effluent
Cleaner Production efforts in relation to effluent generation should focuson reducing the pollutant load of the effluent. The volume of effluentgenerated is also an important issue. However this aspect is linkedclosely to water consumption, therefore efforts to reduce waterconsumption will also result in reduced effluent generation.Opportunities for reducing water consumption are discussed inSection 3.1.1.
Opportunities for reducing the pollutant load of dairy plant effluent focuson avoiding the loss of raw materials and products to the effluentstream. This means avoiding spills, capturing materials before they enterdrains and limiting the extent to which water comes into contact withproduct residues. Improvements to cleaning practices are therefore anarea where the most gains can be made. Table 3-4 contains a checklistof common ideas for reducing effluent loads.
Table 3–3 Checklist of ideas for reducing pollutant loads in effluent 1
• Ensure that vessels and pipes are drained completely and usingpigs and plugs to remove product residues before cleaning;
• Use level controls and automatic shut-off systems to avoid spillsfrom vessels and tanker emptying;
• Collect spills of solid materials (cheese curd and powders) forreprocessing or use as stock feed;
• Fit drains with screens and/or traps to prevent solid materialsentering the effluent system;
• Install in-line optical sensors and diverters to distinguish betweenproduct and water and minimise losses of both;
• Install and maintain level controls and automatic shut-off systemson tanks to avoid overfilling;
• Use dry cleaning techniques where possible, by scraping vesselsbefore cleaning or pre-cleaning with air guns;
• Use starch plugs or pigs to recover product from pipes beforeinternally cleaning tanks.
1 UNEP Cleaner Production Working Group for the Food Industry, 1999
3.1.3 Energy
Energy is an area where substantial savings can be made almostimmediately with no capital investment, through simple housekeepingand plant optimisation efforts.
Substantial saving are possible through improved housekeeping and thefine tuning of existing processes and additional savings are possiblethrough the use of more energy-efficient equipment and heat recoverysystems.
In addition to reducing a plant’s demand for energy, there areopportunities for using more environmentally benign sources of energy.Opportunities include replacing fuel oil or coal with cleaner fuels, such asnatural gas, purchasing electricity produced from renewable sources, orco-generation of electricity and heat on site. For some plants it may also

Cleaner Production Assessment in Dairy Processing
Page 26
be feasible to recover methane from the anaerobic digestion of high-strength effluent streams to supplement fuel supplies.
Table 3–4 Checklist of energy saving ideas 1
• Implement switch-off programs and installing sensors to turn offor power down lights and equipment when not in use;
• Improve insulation on heating or cooling systems and pipework;
• Favour more energy-efficient equipment;
• Improve maintenance to optimise energy efficiency of equipment;
• Maintain optimal combustion efficiencies on steam and hot waterboilers;
• Eliminate steam leaks;
• Capture low-grade energy for use elsewhere in the operation.
1 UNEP Cleaner Production Working Group for the Food Industry, 1999
3.2 Milk production
3.2.1 Receipt and storage of milk
Raw milk is generally received at processing plants in milk tankers.Some smaller plants may also receive milk in 25–50 L aluminium or steelcans or, in some less developed countries, in plastic barrels. Dependingon the structure and traditions of the primary production sector, milkmay be collected directly from the farms or from central collectionfacilities. Farmers producing only small amounts of milk normally delivertheir milk to central collection facilities.
At the central collection facilities, operators measure the quantity of milkand the fat content. The milk is then filtered and/or clarified usingcentrifuges to remove dirt particles as well as udder and blood cells. Themilk is then cooled using a plate cooler and pumped to insulated orchilled storage vessels, where it is stored until required for production.
Empty tankers are cleaned in a wash bay ready for the next trip. Theyare first rinsed internally with cold water and then cleaned with the aidof detergents or a caustic solution. To avoid build-up of milk scale, it isthen necessary to rinse the inside of the tank with a nitric acid wash.Tankers may also be washed on the outside with a cold water spray.
Until required for processing, milk is stored in bulk milk vats or ininsulated vessels or vessels fitted with water jackets.
Process description

Chapter 3 Cleaner Production Opportunities
Page 27
Figure 3–1 is a flow diagram showing the inputs and outputs for thisprocess.
Figure 3–1 Inputs and outputs from milk receipt and storage
Water is consumed for rinsing the tanker and cleaning and sanitising thetransfer lines and storage vessels. The resulting effluent from rinsingand cleaning can contain milk spilt when tanker hoses are disconnected.This would contribute to the organic load of the effluent stream.
Table 3–5 provides indicative figures for the pollution loads generatedfrom the receipt of milk at a number of plants. Table 3–6 providesindicative figures for the pollution loads generated from the washing oftankers.
Solid waste is generated from milk clarification and consists mostly ofdirt, cells from the cows’ udders, blood corpuscles and bacteria. If thisis discharged into the effluent stream, high organic loads and associateddownstream problems can result.
Table 3–5 Indicative pollution loads from the milk receival area 1
Main product Wastewater
(m3/tonne milk)
COD
(kg/tonne milk)
Fat
(kg/tonne milk)
Butter plant 0.07–0.10 0.1–0.3 0.01–0.02
Market milk plant 0.03–0.09 0.1–0.4 0.01–0.04
Cheese plant 0.16–0.23 0.4–0.7 0.006–0.03
Havarti cheese plant 0.60–1.00 1.4–2.1 0.2–0.3
1 Danish EPA, 1991
Inputs and outputs
Environmental issues
Raw milk delivered by tanker
Tanker cleaning
Milk receipt, filtrationand clarification
Raw milk to storagevessels
ElectricityWastewaterMilk lossesUsed filtersClarification solids
Storage of raw milk
WaterDetergentsCausticAcid
Wastewater
RefrigerantWaterElectricity
Lost refrigerantMilk lossesWastewater

Cleaner Production Assessment in Dairy Processing
Page 28
Table 3–6 Indicative pollution loads from the washing of tankers 1
Main product Wastewater
(m3/tonne milk)
COD
(kg/tonne milk)
Fat
(kg/tonne milk)
Market milk plant 0.08–0.14 0.2–0.3 0.04–0.08
Havarti cheese plant 0.09–0.14 0.15–0.40 0.08–0.24
1 Danish EPA, 1991
Cleaner Production opportunities in this area focus on reducing theamount of milk that is lost to the effluent stream and reducing theamount of water used for cleaning. Ways of achieving this include:
• avoiding milk spillage when disconnecting pipes and hoses;
• ensuring that vessels and hoses are drained before disconnection;
• providing appropriate facilities to collect spills;
• identifying and marking all pipeline to avoid wrong connectionsthat would result in unwanted mixing of products;
• installing pipes with a slight gradient to make them self-draining;
• equipping tanks with level controls to prevent overflow;
• making certain that solid discharges from the centrifugal separatorare collected for proper disposal and not discharged to the sewer;
• using ‘clean-in-place’ (CIP) systems for internal cleaning of tankersand milk storage vessels, thus improving the effectiveness ofcleaning and sterilisation and reducing detergent consumption;
• improving cleaning regimes and training staff;
• installing trigger nozzles on hoses for cleaning;
• reusing final rinse waters for the initial rinses in CIP operations;
• collecting wastewaters from initial rinses and returning them tothe dairy farm for watering cattle.
Case study 3–1: Reduction of water consumption for cleaning
At an Estonian dairy processing plant, open-ended rubber hoses wereused to clean delivery trucks. Operators used their fingers at thedischarge end of the hose to produce a spray, resulting in ineffectiveuse of water. Furthermore, the hoses were not equipped with anyshut-off valve, and the water was often left running.
The operators found that they could reduce water consumption byinstalling high-pressure systems for cleaning the trucks, theproduction area and other equipment. Open-ended hoses were alsoequipped with trigger nozzles.
The cost of this equipment was US$6450 and the saving in watercharges was US$10,400 per year; a payback period of less than 8months. Water consumption has been reduced by 30,000 m3/year.
Cleaner Productionopportunities

Chapter 3 Cleaner Production Opportunities
Page 29
3.2.2 Separation and standardisation
Dairies that produce cream and/or butter separate fat from the raw milk.Separation takes place in a centrifuge which divides the milk into creamwith about 40% fat and skimmed milk with only about 0.5% fat. Theskimmed milk and cream are stored and pasteurised separately.
Most dairies standardise all milk, to ensure that their products have aconsistent composition. In some cases, products may need to meetcertain product specifications in relation to fat content. Thesespecifications vary from one country to the next. However in general,whole milk must contain around 3.5–4.2% fat, semi-skimmed milkaround 1.3–1.5% and skimmed milk around 0.5% (Varnam andSutherland, 1994). Standardisation is achieved by the controlledremixing of cream with skimmed milk, and is common both in cheeseplants and in the production of milk powders.
Figure 3–2 is a flow diagram showing the inputs and outputs for thisprocess.
Figure 3–2 Inputs and outputs for the separation and standardisationof whole milk
As in other aspects of dairy processing, water is consumed for rinsingand cleaning of process equipment, resulting in the generation ofwastewaters containing milk solids and cleaning agents. Table 3–7provides indicative figures for the pollution loads generated from the milkseparation process at a number of plants.
The centrifugal separators generate a sludge material, which consists ofudder and blood cells and bacteria contained in the raw milk. Forstandard separators the sludge is removed manually during the cleaningphase, while in the case of self-cleaning centrifuges it is dischargedautomatically. If the sludge is discharged to the sewer along with theeffluent stream, it greatly increases the organic load of the effluent.
Process description
Inputs and outputs
Environmental issues
CIP ofseparatorequipment
Centrifugalseparation
Whole milk (3.5% fat)
Skimmed milk (0.5% fat)Cream (40% fat)Standardised milk
Milk
Milk sludge
WaterDetergentsCausticAcid
Wastewater
Standardisation
Cream
Electricity

Cleaner Production Assessment in Dairy Processing
Page 30
Table 3–7 Indicative pollution loads generated from milk separation 1
Main product Wastewater
(m3/tonne milk)
COD
(kg/tonne milk)
Fat
(kg/tonne milk)
Butter plant 0.20–0.30 0.3–1.9 0.05–0.40
Market milk plant 0.30–0.34 0.1–0.4 0.01–0.04
Cheese plant 0.06–0.30 0.2–0.6 0.008–0.03
Havarti cheese plant 0.60–1.00 1.4–2.1 0.2–0.3
1 Danish EPA, 1991
Cleaner Production opportunities specific to this area are related toreducing the generation of separator sludge and optimising its collectionand disposal. Ways of achieving this include:
• reducing the frequency with which centrifugal separators arecleaned, by improving milk filtration at the receiving stage or byclarification of the raw milk;
• collecting the sludge and disposing of it along with other wastesolids.
Also of importance is the optimisation of cleaning processes, to makethem water and energy efficient. Ways of achieving this are discussedfurther in section 3.6.
3.2.3 Pasteurisation and homogenisation
In large plants, milk is pasteurised in continuous flow pasteurisers,whereas some smaller dairies may use batch-type pasteurisers. In batchpasteurisation processes, milk is typically heated to 62.8–65.6°C for30 minutes, whereas in continuous pasteurisation processes it is heatedto 71.7–78.1°C for at least 15 seconds. The time–temperaturerelationship is usually prescribed by law, as are certain safeguards toensure that all milk attains the minimum treatment. For both batch andcontinuous processes, the milk is cooled to below 10°C immediatelyafter heating.
For some products milk is homogenised using a pressure pump, whichbreaks up the butterfat globules to a size that keeps them in suspension.In continuous pasteurisation processes homogenisation is usuallyundertaken in conjunction with pasteurisation, since its efficiency isimproved if the milk is warm.
Cleaner Productionopportunities
Process description

Chapter 3 Cleaner Production Opportunities
Page 31
Figure 3–3 is a flow diagram showing the inputs and outputs for thisprocess.
Figure 3–3 Inputs and outputs for the pasteurisation andhomogenisation of whole milk
The main environmental issue associated with pasteurisation andhomogenisation is the high levels of energy consumed for the heatingand cooling of milk.
In addition, water is consumed for rinsing and cleaning of processequipment, resulting in the generation of wastewaters containing milksolids and cleaning agents. In batch pasteurisation, small batchesnecessitate frequent cleaning, therefore losses of milk and the organicloads in wastewater streams are increased.
Cleaner Production opportunities in this area focus on improving energyefficiency. Ways of achieving this include:
• replacing batch pasteurisers with a continuous processincorporating plate heat exchanger (PHE) pasteurisers, wherefeasible. PHE pasteurisers are more energy efficient than batchpasteurisers because the heat from the pasteurised milk can beused to preheat the incoming cold milk (regenerative counter-current flow);
• installing new manufacturing equipment, which will result in lesswaste of milk products than the equipment currently used in manydairies;
• avoiding stops in continuous processes. The more constant theproduction, the less milk will be lost, since most waste comesfrom cleaning of batch process equipment. In the event ofupgrades to process equipment, high-volume pasteurising unitsshould be considered;
• reducing the frequency of cleaning of the pasteuriser. Particularlyfor small dairies, optimising the size of balance tanks before andafter the pasteuriser will allow continuous operation of thepasteuriser and reduce cleaning frequency;
• planning production schedules so that product change-overscoincide with cleaning regimes;
• collecting and recovering the milky wastewater generated at start-up of pasteurisation and supplying it to farmers as animal feed.
Inputs and outputs
Environmental issues
Cleaner Productionopportunities
Homogenisation
Pasteurisation
Milk
Pasteurised andhomogenised milk
SteamElectricityChilled coolingwater
Condensate return
Electricity

Cleaner Production Assessment in Dairy Processing
Page 32
Also of importance is optimisation of cleaning processes, to make themwater and energy efficient. Ways of achieving this are discussed furtherin section 3.6.
To make possible the reprocessing of excess milk returned from themarket, dairy plants may wish to consider developing policies whichallow for the reprocessing of milk without affecting the quality of thefreshly pasteurised product.
The introduction of poorer quality milk into the pasteurisation processcan result in milk scale and coagulation problems due to higher acidity.This may cause higher milk losses in the pasteuriser due to the need formore frequent cleaning in order to remove milk scale. These issuesshould be weighed against the benefits of reprocessing returned milk.
The controlled return and reprocessing of milk from the market mayrequire training of sales representatives. Alternatively, penalties could beapplied for inappropriate ordering, or bonuses paid for extended periodsof no market returns.
3.2.4 Deodorisation
Many dairies remove unwanted taints and odours from milk indeodorisation units. In these systems, the odorous substances aredrawn-off by injecting steam into the system under vacuum. Insituations where the taints and odours are only mild, a vacuum alonemay be used.
Figure 3–4 is a flow diagram showing the inputs and outputs for thisprocess.
Figure 3–4 Inputs and outputs for the deodorisation of milk
An environmental issue specific to the deodorisation process is the largevolume of water used to operate water seals on the vacuum pump.
Water used for the vacuum pump can be recirculated to reduce oreliminate the necessity to discharge it.
Process description
Inputs and outputs
Environmental issues
Cleaner Productionopportunities
WaterDetergentsCausticAcid
Deodorisation
Milk
Odour-free milk
Water foroperation ofvacuum pump
Odorous emissionsWastewater fromvacuum pump
CIP of deodorisationequipment
Wastewater

Chapter 3 Cleaner Production Opportunities
Page 33
3.2.5 Storage and packaging
Due to the large range of products produced at many dairies (e.g.different fat contents or heat treatment regimes), the bulk storage ofthese products can involve very extensive storage systems, withassociated vessels, piping and valves.
Milk is packaged or bottled in a number of types of containers, includingglass bottles, paper cartons, plastic bottles and plastic pouches. In mostcases, filling of containers is highly automated. After filling, thepackaged milk products are usually stored and transported in wire orplastic crates.
Finished products are held in refrigerated storage until dispatched toretail outlets. The storage temperature depends on the product, but formilk and fresh dairy products, the optimum temperature is usually <4°C.Refrigerated storage chambers are usually cooled using forced draftevaporators chilled by a primary refrigerant. A secondary refrigerantsuch as ice water, brine or glycol recirculated in a closed circuit coolingsystem is also sometimes used. Door openings are usually sealed withrubber swing doors and/or air curtains when open.
Figure 3–5 is a flow diagram showing the inputs and outputs for thisprocess.
Figure 3–5 Inputs and outputs for storage and packagingof milk products
The main environmental issues associated with the storage andpackaging operations are the loss of milk products from spills andpackaging mistakes, generation of wastewater from cleaning processesand energy consumed for refrigerated storage. However the choice ofpackaging materials is becoming an increasingly important issue.
Milk products can be lost to the wastewater stream during start-up andshut-down, from residues remaining in storage vessels and from theinitial cold water rinses of packaging and storage equipment. Milkproducts may also be lost due to breakage of packaging material.Generally, incorrectly filled packages are emptied and the milk isreturned to the milk receival area.
Process description
Inputs and outputs
Environmental issues
Reject and damagedpackaging materialsPackaging
Refrigerated storage
Milk
Final milk products
ElectricityRefrigerant
CIP of storage andpackaging equipment
Packagingmaterials
WaterDetergentsCausticAcid
Wastewater
Cleaner Production Assessment in Dairy Processing
Page 34
Considerable work has been undertaken to determine the most suitableform of packaging in terms of overall environmental impacts. Althoughglass bottles can be cleaned and recycled (thereby creating minimal solidwaste), cleaning them consumes water and energy. Glass recyclingsystems require large capital investments and involve high running costssince the bottles must be collected, then transported and cleaned. Glassbottles can also be inconvenient for consumers because they are heavierand more fragile than cartons.
Cartons, on the other hand, create solid waste that must be transportedand disposed of. Solid waste can be disposed of in a landfill, incinerated,or composted. All of these disposal alternatives have environmentalimpacts, including the generation of leachate from landfills and airpollution from incineration.
Cleaner Production opportunities in this area focus on improving theenergy efficiency of refrigeration systems and optimising CIP processesto reduce both water use and the organic load discharged into theeffluent stream. Ways of achieving this include:
• clearing milk residues from the pipes using compressed air beforethe first rinse;
• collecting the more highly concentrated milk wastewater at start-up and shut-down for use as animal feed;
• optimising the accuracy of filling operations. This will not onlyresult in improved efficiency, but will also reduced potential forwaste and spillage. Minor variations in filling performance canhave significant cumulative effects particularly for small unit fillquantities;
• improving procedures for recovering milk from wrongly filledcontainers;
• emptying and collecting product from wrongly filled containers foruse as animal feed;
• reducing energy consumption through improved insulation, closingof doors to cold areas, good maintenance of room coolers andregular defrosting;
• using direct ammonia-based cooling systems instead of CFC-basedsystems.
Case study 3–2: Minimising loss of milk in packaging
At a plant producing market milk, the filling of containers was usuallyundertaken in batches. The product remaining in the bottom of thesupply vessel at the end of the batch was discharged to sewer.However, due to increasing effluent discharge costs, the dairy decidedto return the residual milk to the production process.
This simple modification prevented 11,500 L/year of product beingdischarged to sewer. The value of this material was US$4850/year(US$0.42/litre) and annual effluent charges fell by US$1150. Overallthe dairy saved US$6000/year with no capital expenditure.
Cleaner Productionopportunities
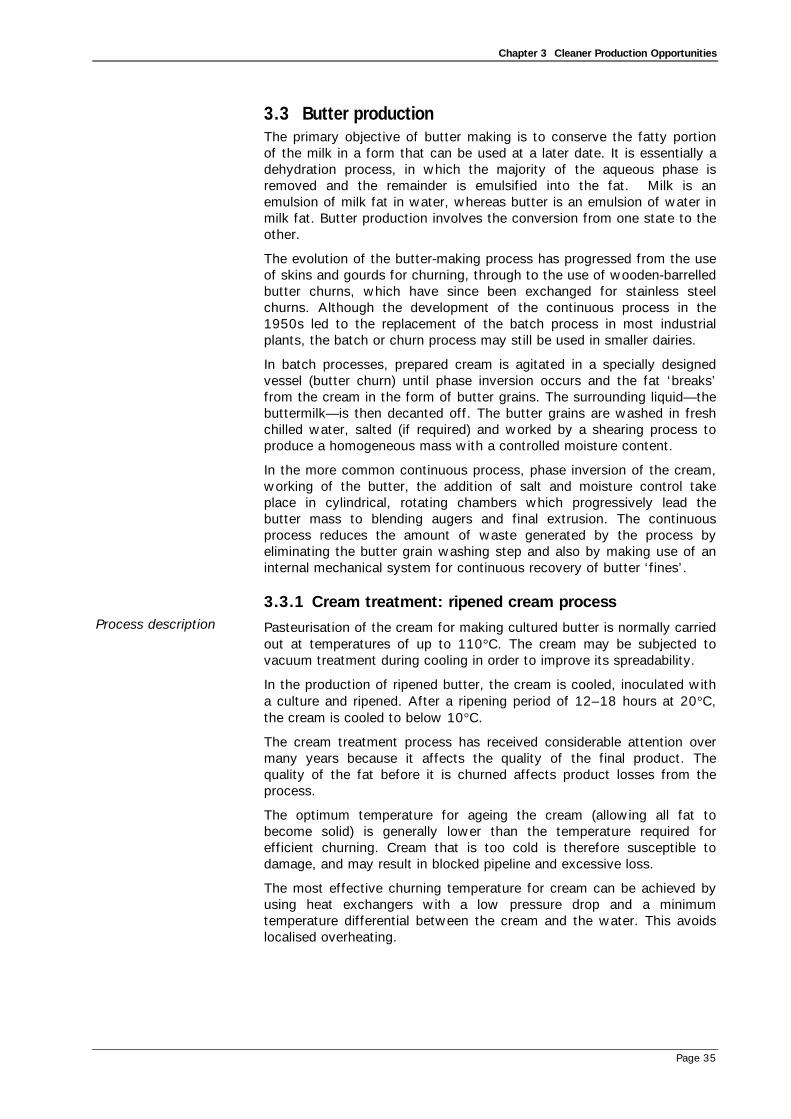
Chapter 3 Cleaner Production Opportunities
Page 35
3.3 Butter productionThe primary objective of butter making is to conserve the fatty portionof the milk in a form that can be used at a later date. It is essentially adehydration process, in which the majority of the aqueous phase isremoved and the remainder is emulsified into the fat. Milk is anemulsion of milk fat in water, whereas butter is an emulsion of water inmilk fat. Butter production involves the conversion from one state to theother.
The evolution of the butter-making process has progressed from the useof skins and gourds for churning, through to the use of wooden-barrelledbutter churns, which have since been exchanged for stainless steelchurns. Although the development of the continuous process in the1950s led to the replacement of the batch process in most industrialplants, the batch or churn process may still be used in smaller dairies.
In batch processes, prepared cream is agitated in a specially designedvessel (butter churn) until phase inversion occurs and the fat ‘breaks’from the cream in the form of butter grains. The surrounding liquid—thebuttermilk—is then decanted off. The butter grains are washed in freshchilled water, salted (if required) and worked by a shearing process toproduce a homogeneous mass with a controlled moisture content.
In the more common continuous process, phase inversion of the cream,working of the butter, the addition of salt and moisture control takeplace in cylindrical, rotating chambers which progressively lead thebutter mass to blending augers and final extrusion. The continuousprocess reduces the amount of waste generated by the process byeliminating the butter grain washing step and also by making use of aninternal mechanical system for continuous recovery of butter ‘fines’.
3.3.1 Cream treatment: ripened cream process
Pasteurisation of the cream for making cultured butter is normally carriedout at temperatures of up to 110°C. The cream may be subjected tovacuum treatment during cooling in order to improve its spreadability.
In the production of ripened butter, the cream is cooled, inoculated witha culture and ripened. After a ripening period of 12–18 hours at 20°C,the cream is cooled to below 10°C.
The cream treatment process has received considerable attention overmany years because it affects the quality of the final product. Thequality of the fat before it is churned affects product losses from theprocess.
The optimum temperature for ageing the cream (allowing all fat tobecome solid) is generally lower than the temperature required forefficient churning. Cream that is too cold is therefore susceptible todamage, and may result in blocked pipeline and excessive loss.
The most effective churning temperature for cream can be achieved byusing heat exchangers with a low pressure drop and a minimumtemperature differential between the cream and the water. This avoidslocalised overheating.
Process description

Cleaner Production Assessment in Dairy Processing
Page 36
Figure 3–6 is a flow diagram showing the inputs and outputs for thisprocess.
Figure 3–6 Inputs and outputs for the ripened cream process
The main environmental issue associated with this process is the highorganic load in wastewaters generated from rinsing and cleaning thepasteuriser. This can be further exacerbated by the requirement forfrequent cleaning, which results in a greater loss of milk solids.
Cleaner Production opportunities in this area focus on reducing wateruse and loss of product. Ways of achieving this include:
• minimising the number of times the pasteuriser is cleaned.Particularly in small butter dairies, optimising the size of balancetanks before and after the pasteuriser will allow it to operatecontinuously, resulting in less need for cleaning;
• installing modern pasteurising equipment. This will reduce wasteof cream in many dairies, because improvements in plate designnow give a more gentle and constant heat treatment. Thisdecreases the build-up of overheated solids on heating surfaces. Inthe event of upgrades to process equipment, high-volumepasteurising units should be considered;
• collecting the more highly concentrated milk wastewater generatedwhen starting up the pasteuriser, for use as animal feed.
3.3.2 Butter churning
The cream enters the butter maker and the fat globules are disruptedunder controlled conditions to destabilise the emulsion and agglomeratethe milk fat. This is achieved in the first churning cylinder, which isfitted with a beater driven by a variable-speed motor. The beater speedis adjusted to give the desired butter grain size with minimum fat loss inthe buttermilk.
To maintain steady butter-making conditions, it is essential that thecream feed rate be constant. This can be achieved by using a balancetank between the ageing silo and the pump.
The mixture of butter grains and buttermilk falls from the first cylinderinto the back section of a second cylinder, where the grains areconsolidated. This second cylinder is a larger, perforated, slowly rotatingdrum which causes the grains to travel along an inclined rotating screen
Inputs and outputs
Cleaner Productionopportunities
Environmental issues
Process description
Cream pasteurisation andcooling
ElectricitySteamRefrigerantStarterculture
Wastewater
Cream from milk separationstep
Sweet/ripened cream tochurning
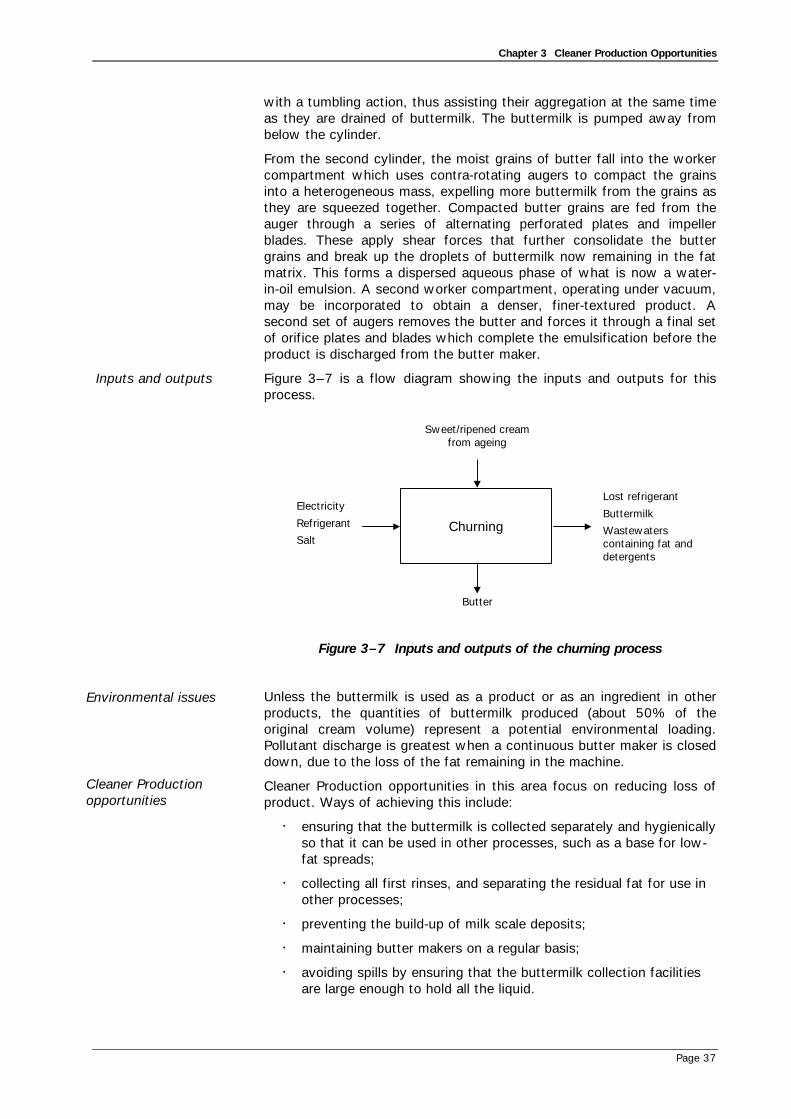
Chapter 3 Cleaner Production Opportunities
Page 37
with a tumbling action, thus assisting their aggregation at the same timeas they are drained of buttermilk. The buttermilk is pumped away frombelow the cylinder.
From the second cylinder, the moist grains of butter fall into the workercompartment which uses contra-rotating augers to compact the grainsinto a heterogeneous mass, expelling more buttermilk from the grains asthey are squeezed together. Compacted butter grains are fed from theauger through a series of alternating perforated plates and impellerblades. These apply shear forces that further consolidate the buttergrains and break up the droplets of buttermilk now remaining in the fatmatrix. This forms a dispersed aqueous phase of what is now a water-in-oil emulsion. A second worker compartment, operating under vacuum,may be incorporated to obtain a denser, finer-textured product. Asecond set of augers removes the butter and forces it through a final setof orifice plates and blades which complete the emulsification before theproduct is discharged from the butter maker.
Figure 3–7 is a flow diagram showing the inputs and outputs for thisprocess.
Figure 3–7 Inputs and outputs of the churning process
Unless the buttermilk is used as a product or as an ingredient in otherproducts, the quantities of buttermilk produced (about 50% of theoriginal cream volume) represent a potential environmental loading.Pollutant discharge is greatest when a continuous butter maker is closeddown, due to the loss of the fat remaining in the machine.
Cleaner Production opportunities in this area focus on reducing loss ofproduct. Ways of achieving this include:
• ensuring that the buttermilk is collected separately and hygienicallyso that it can be used in other processes, such as a base for low-fat spreads;
• collecting all first rinses, and separating the residual fat for use inother processes;
• preventing the build-up of milk scale deposits;
• maintaining butter makers on a regular basis;
• avoiding spills by ensuring that the buttermilk collection facilitiesare large enough to hold all the liquid.
Inputs and outputs
Environmental issues
Cleaner Productionopportunities
Churning
Electricity
Refrigerant
Salt
Lost refrigerant
Buttermilk
Wastewaterscontaining fat anddetergents
Sweet/ripened creamfrom ageing
Butter

Cleaner Production Assessment in Dairy Processing
Page 38
3.3.3 Butter packaging
Butter may be discharged from the butter maker directly into the feedhopper of a bulk butter packer. However, it is more commonlydischarged to a butter silo fitted with a pump, thus avoiding anydiscontinuities in production. From the silo, butter is pumped to thepacking machines through pressure compensators, which control theshear forces.
Butter can be packed initially into 25 kg cases, and subsequentlyrepacked into consumer portions. Alternatively, consumer portions canbe packed directly from the continuous butter maker. Most consumerportions are packed in a film wrap (either vegetable parchment or aparchment-lined aluminium foil) or in plastic tubs, which are becomingincreasingly popular.
Repackaging of bulk butter into consumer portions requires that thefrozen butter first be allowed to reach an optimum temperature of6–8°C, under controlled humidity conditions to avoid excessivecondensation. Heat for this process can be provided by carrying out thefirst stage of thawing in a packed butter store, or low-grade heat fromrecovery processes.
After temperature adjustment and before repackaging, the butter is re-blended to break down the matrix of fat crystals and to re-introduceplasticity. At this stage, there is the opportunity to adjust salt andmoisture content to the maximum permitted by local regulation. Forrepackaging in large quantities, continuous butter blenders are availablewhich incorporate all functions of chopping and blending and prod for in-line addition of salt, water and culture. Their construction is similar tothat of a continuous buttermaker.
Figure 3–8 is a flow diagram showing the inputs and outputs for thisprocess.
Figure 3–8 Inputs and outputs of the butter packaging process
The main environmental issue associated with this process are the highorganic loads in the wastewaters generated from rinsing and cleaningthe equipment. The greatest potential for environmental loading occurswhen machines, such as a continuous butter blender or packingmachines, are closed down, because of the residual fat they contain.
In addition, product loss may occur when packaged products containingproduct residues are discarded.
Process description
Inputs and outputs
Environmental issues
Packaging
Electricity
(compressed air)
Packagingmaterials
Damaged packaging
Wastewaters
Butter from churning
Packaged butter

Chapter 3 Cleaner Production Opportunities
Page 39
Cleaner Production opportunities in this area focus on reducing wateruse and loss of product. Ways of achieving this include:
• collecting first rinses while still warm and separating the milk fatresidues for use in other processes;
• reducing the disposal of packaging material by having personnelconstantly optimising operation of the packaging machines.
3.3.4 Butter storage
Bulk-packed butter is a relatively stable commodity at low temperatures.Commercial freezing stores operate at temperatures down to –30°C, atwhich temperature the butter should remain in satisfactory condition formore than one year. If storage periods of more than one year arenecessary, or if low-temperature refrigerated storage cannot beguaranteed throughout the entire storage life of the butter, the buttercan dehydrate below the optimum moisture content.
Factors affecting the ability of butter to withstand long-term storageinclude:
• the cleanliness and hygiene of butter-making operations at allstages;
• the prevention of post-pasteurisation contamination during theaddition of salt, moisture etc., and in particular the absence ofmicro-organisms that grow at low temperatures in the water usedfor these purposes;
• the degree to which salt (if added) is dispersed to the aqueousphase;
• the overall quality of the butter in terms of its homogeneity,texture and moisture distribution;
• the type of butter.
In order to standardise its consistency and appearance, butter forimmediate consumption is placed in cold storage at 5°C for 24–48hours. This ensures that fat crystallisation is complete and individualpacks are firm enough to withstand subsequent transportation to themarket.
For long-term storage, butter freezing facilities must operate at below–15°C, and temperatures down to –30°C are not uncommon. Sufficientspace should be allowed between cases and pallets to allow aircirculation, which encourages even chilling.
Refrigeration is usually, but not always, provided by direct expansionammonia evaporators. Chambers are normally equipped with fork-lifttruck access doors protected with automatic door or curtain openers.
Cleaner Productionopportunities
Process description

Cleaner Production Assessment in Dairy Processing
Page 40
Figure 3–9 is a flow diagram showing the inputs and outputs for thisprocess.
Figure 3–9 Inputs and outputs of butter storage
The main environmental issue associated with the storage of butter isthe energy consumed for refrigeration and the potential loss ofrefrigerant to the atmosphere.
Cleaner Production opportunities in this area focus on improving theenergy efficiency of refrigerated storage. Ways of achieving thisinclude:
• installing insulation;
• keeping doors closed in cold areas;
• undertaking regular defrosting of cold rooms and regularmaintenance of refrigeration systems;
• avoiding refrigerants that contain CFCs. Refrigeration systemsbased on ammonia cooling are preferred.
3.4 Cheese productionCheese making is an art that is more than 5000 years old. Thepredominantly rural character of everyday life in the past contributed tothe evolution of thousands of different types of cheese and each village,or even family, may have had its own variety, some soft and short lived,some harder and more durable.
Modern cheese technology was founded in the nineteenth century whenJoseph Harding perceived a need to adopt strict hygiene and controlover methods of making cheddar cheese. This represented a stepforward in the scientific approach to cheese making.
Cheeses can be categorised according to the following attributes:
• fat content (high-fat, semi-fat and low-fat cheeses);
• consistency (soft cheeses have a moisture content of 45–50%and semi-hard cheese below 40%);
• method of preparation and production (soft cheeses retain whey inthe curd matrix and have coagulation temperatures of 20–40°C;semi-hard cheeses receive more draining and the curd is heated to42–48°C; hard ‘cooked-curd’ cheeses are well drained and heatedto 52–55°C).
Environmental issues
Inputs and outputs
Cleaner Productionopportunities
Butter storageRefrigerant Lost refrigerant
Butter frompackaging area
Distribution

Chapter 3 Cleaner Production Opportunities
Page 41
Some other types of cheese include:
• fresh cheese that can be consumed just after manufacturing andsalting (e.g. quark);
• acid-curd cheeses that are coagulated at a higher temperature (e.g.ricotta);
• lactic-curd cheeses which are kneaded or spun (e.g. mozzarella);
• soft cheeses that ripen for only a short time;
• cheeses that develop different tastes due to enzyme action ofsurface bacteria;
• blue cheeses of many flavours and types;
• semi-hard, mild-tasting, pressed cheeses with holes (e.g. gouda,havarti and tilsit);
• very hard, dry cheeses which are used for grating (e.g. parmesan).
The process description that follows is for the production of cheddarcheese. Cheddar cheese has been used as an example because it is themost widely manufactured and consumed cheese in the world and itsindustrial manufacturing has been largely automated.
The manufacture of cheddar cheese demonstrates most of the principlesof the industrial processing of cheese and provides a good example fordiscussing the pertinent environmental issues of cheese making.
3.4.1 Cheddar cheese production
Whole or standardised milk is usually pasteurised at 70°C for 15seconds and then cooled to the inoculation temperature of 30°C beforebeing poured into a cheese vat fitted with internal agitators. If milk isreceived on one day and held overnight before being used for cheeseproduction, it will be cooled to 4°C after pasteurisation, and warmed upto inoculation temperature for cheese making.
The starter culture is prepared the day before by the laboratory and maybe a single-strain or mixed-strain culture, depending on the flavourrequired and on the cheese makers’ experience. It is important that themother cultures from which the daily starter is produced be kept underextremely hygienic conditions in order to avoid contamination—especially from bacteriophages. These are viruses that kill bacteria andcan stop cheese-making operations without warning. Each is specific toa bacterial strain, and for this reason the type of starter used is ‘rotated’frequently.
Generally, starter is added at the rate of 1–1.5% of the volume ofcheese milk. The quantity, however, is determined on a case-by-casebasis, depending on starter activity and the subsequent rate of aciddevelopment in the cheese milk.
When the acidity has reached the required level, usually after 45–60minutes, rennet is added and dispersed evenly throughout the milk, afterwhich curd formation begins. Rennet acts to coagulate the milk solidsinto curd.
When the curd is firm enough it is carefully cut into cubes the size oflarge peas. Cutting is done using multiple knives mounted on a frame,which is driven through the curd in two planes.
Process description

Cleaner Production Assessment in Dairy Processing
Page 42
The mixture of curd pieces and whey is then gradually heated throughthe walls of the cheese vat to a temperature of 39°C, with slow andcareful agitation. Heating assists the process of syneresis, whereby theprotein structure shrinks slightly due to the action of the heat, thusexpressing whey and creating a firmer curd. During the process ofsyneresis it is important that the curd pieces not be damaged by theagitators; this could result in a cloudy whey and high losses of fat.
When cooking is complete (determined by acidity development and curdstructure) the curd pieces are allowed to settle and the whey is drainedoff. The curd is now one cohesive mass.
Although the process described applies to cheddar cheese, it is similar tothat used for other pressed cheese processes. The primary objective isto force whey out of the curd through the action of acidity development,heat and pressure.
The curd mass is divided with a knife into blocks. These blocks areturned over and rotated regularly and stacked two or three high. Theybecome thinner as a result of the pressing action. The blocks are kepttogether as much as possible to maintain warmth. This processcontinues until the curd texture and the acidity of the whey draining outare at optimum levels. The curd blocks are then milled into pieces aboutthe size of large potato chips.
Dry salt is added to the milled pieces and thoroughly mixed, after whichthe curd pieces are filled into moulds and pressed overnight. The wheythat is expelled from the press station is salt whey and is often white.The moulded blocks of cheese are removed from the moulds andallowed to dry. They are then wrapped in an impervious material—usually a plastic shrink-wrap—and transferred to a ripening room wherethey remain for about two months, under controlled temperature andhumidity, before sale.
Due to the airtight wrapping, maturation during storage is minimal. As aresult the majority of cheddar cheeses are mild and bland in flavour andsince no rind is formed, all of the cheese can be consumed. So-called‘farmhouse’ cheddar cheese is formed and wrapped in a cheeseclothgauze instead of plastic film and is matured for up to six months. Thisallows the cheese to mature properly and gas to escape slowly, resultingin a product that has fuller flavour, buttery texture and thin rind.
Figure 3–10 is a flow diagram showing the inputs and outputs for thisprocess.
Figure 3–10 Inputs and outputs for Cheddar cheese production
Inputs and outputs
Cheese making
Steam
Electricity
Refrigerant
Culture
Rennet
Salt
Cheesebandage
Cheese whey
Rinse water withtraces of cheese, fatand detergents
Cheese milk
Ripened cheese

Chapter 3 Cleaner Production Opportunities
Page 43
The major environmental issue associated with the cheese-makingprocess is the disposal of whey. There are generally three types ofwhey:
• sweet whey, which is generated when enzymes, principallyrennet, are used to coagulate the milk. Sweet whey typicallycontains 0.6–0.9% soluble protein, up to 0.3% fat and largequantities of lactose (up to 5%). The pH value of sweet wheyfrom cheddar cheese manufacturing is generally 5.1–5.3;
• acid whey, which is generated when acid is used to coagulate themilk, for example in the production of cottage cheese. Acid wheytypically contains the same proportion of soluble proteins as sweetwhey, but less fat and somewhat less lactose (4.5%), since someof the lactose is converted to lactic acid. It has a low pH value,between 4.5 and 4.7;
• salt whey, which is the product expressed during the pressing ofsalted cheese curd, such as in the manufacturing of cheddarcheese. This whey should be collected separately from other typesof whey.
Whey produced from natural cheese-making operations containsapproximately 6% solids. In the past, whey was perceived merely as aninsurmountable problem for the dairy industry because of the high costsof disposal using traditional effluent treatment processes. All too oftendairies have taken the easy way out by simply dumping it on land, intorivers or down boreholes. Because of its lactose and protein content,untreated whey has a very high concentration of organic matter whichcan lead to pollution of rivers and streams and can create bad odours.
A number of opportunities exist for the recovery of the valuable high-grade protein from sweet whey. However it has only been in recentyears that they have become technically and economically viable. Themethod used is ultrafiltration (UF), followed by spray drying of theprotein. This process is costly, so is only worthwhile when largequantities of fresh whey are available. Spray-dried whey powdercontains between 25% and 80% protein and is used in food products,where it performs a similar function to egg proteins. Whey powder ishighly soluble, even at high acidity, and is capable of forming stablefoams and gels when heated. Whey protein powder is therefore used inthe manufacturing of bakery and meat products, where its gelatinousproperties are particularly useful.
Other options available for whey utilisation are:
• Evaporation followed by spray drying to produce whey powder
One of the problems associated with this solution is that thelactose tends to caramelise, making any heating process difficult.Unless special precautions are taken, the resulting product is veryhygroscopic due to the high concentrations of lactose (70–75%).Whey powder in this form is not suitable for use as a foodingredient because it is very sticky and absorbs moisture duringstorage, forming hard lumps.
Non-hygroscopic whey powder can be produced byprecrystallising the lactose before drying. In this way, most of thelactose is present in the alpha-crystalline form, which is non-hygroscopic. Higher-quality whey powder can be produced byincorporating a secondary crystallisation step after spray drying.
Environmental issues
Cleaner Productionopportunities

Cleaner Production Assessment in Dairy Processing
Page 44
Powder is removed from the drying chamber at 8–14% moisture.The moisture remaining in the powder permits almost completecrystallisation of the lactose and the residual moisture can then beremoved in a secondary drying system (e.g. a fluid bed) before thepowder is cooled and packaged.
• Feeding it to animals
In most countries where this is practised, the whey is normally fedto pigs or cows. This is a low-cost solution but the price obtainedfor whey, after transport costs are considered, is often only a verysmall fraction of the cost of the original milk. The advantages arethat there are no capital costs and no effluent charges.
• Demineralisation, or reduction of the mineral content of whey
This increases the range of opportunities for its use as a foodingredient. Ion exchange treatment or electrodialysis is used in thedemineralisation process, and demineralised whey is spray-dried inthe same way as whey powder. The main use of demineralisedwhey powder is in the manufacture of infant milk formulations,where it is used in combination with skimmed milk powder to givea similar composition to that of human milk. Another use ofdemineralised whey powder is in the manufacture of chocolate.Electrodialysis, or ion exchange technology, is comparativelyexpensive but it does give an end product with a higher value.
• Anaerobic digestion and fermentation
Whey can be anaerobically digested to produce methane gas,which can be captured and used as a supplementary fuel on site.Whey can also be fermented to produce alcohol.
In addition, there are a number of Cleaner Production opportunities forreducing the loss of product from the process, which include:
• preventing the loss of curds by not overfilling cheese vats;
• completely removing whey and curds from the vats before rinsing;
• segregating all whey drained from the cheese;
• sweeping up pressings instead of washing them to drain;
• screening all liquid streams to collect fines.
Case study 3–3: Recovery of lactose from sweet whey
To reduce the organic load of effluent on its wastewater treatmentplant, a New Zealand dairy expanded its whey protein concentrateplant to process all the sweet whey on site and recover all permeatefor lactose.
The company increased sweet whey treatment from 1400 m3/day to2200 m3/day. This meant that the quantity of lactose discharged wasreduced by 50–70 tonnes, and could be used in making newproducts.
Although there were some cost savings from reducing the load on thewastewater treatment plant, the most significant economic gain wasthe income generated from increased production. This was estimatedat US$3 million a year.

Chapter 3 Cleaner Production Opportunities
Page 45
Case study 3–4: Recovery of cheese solids by installation of screens andsettling tanks
An Australian dairy wanted to reduce the amount of cheese solids itdischarged to its wastewater treatment plant. To accomplish this, thecompany installed screens in the cheese room wastewater outlet andbuilt two large settling tanks in the whey room. The settling tankswere intended to remove cheese solids from the process rinse water.Recovered solids could then be reused in the cheese-making process.
The total suspended solids in the effluent decreased significantly andthere was a subsequent increase in cheese production of 1%, or17,700 kg/year. This increased production generated an additionalrevenue of US$70,000. The total cost of these changes wasUS$21,000, giving a payback period of less than 4 months.
3.4.2 Cheese packaging
After maturation cheeses are packed, either as entire cheeses (in thecase of small varieties), or in consumer portions for larger cheeses suchas cheddar. Packaging usually involves a combination of manual andautomated processes. Packaging materials include natural wax,laminated paper/foil, shrink-wrap plastic, cartons and pre-formed plasticboxes.
In some cases it is necessary to clean the surface of the cheese and dryit before packaging. This is most common with cheeses that require alonger maturing time, during which there may be considerable mouldgrowth on the surface. These growths are harmless but not aestheticallypleasing to the consumer.
Cleaning, together with stripping of the cheesecloth bandage, is often amanual process. The process of dividing larger cheeses into smallerportions and then shrink-wrapping them is often a semi-manualoperation. Wrapping and boxing of small varieties is normally fullyautomated. Farmhouse cheddar cheeses, edam, gouda and a few othervarieties are often dipped in wax to protect and seal the natural rind.
Figure 3–11 is a flow diagram showing the inputs and outputs for thisprocess.
Figure 3–11 Inputs and outputs for cheese packaging
Process description
Inputs and outputs
Cheese packagingElectricity
(compressed air)
Packaging material
Damaged packagingmaterial
Wastewaters
Ripened cheese
Packed cheese

Cleaner Production Assessment in Dairy Processing
Page 46
The major wastes from the cheese packing area are solid wastes,including discarded cuts and small pieces of cheese and damagedpackaging material.
In addition there are liquid discharges from the cleaning of packagingmachines, work surfaces and conveyors.
All cheese scraps should be collected separately from other waste andeither used as raw material for processed cheese manufacturing (wherepossible) or sold as animal feed.
Liquid wastes should be treated, together with other effluent streams.
3.4.3 Cheese storage
Cheese storage at the processing plant is limited mainly to the ripeningperiod, as cheeses are normally dispatched for sale immediately afterfinal preparation and packing.
The temperature of storage varies for different types of cheese. Quick-ripening soft cheeses require a low temperature of 4.5°C whereas theharder cheeses, requiring longer ripening periods, are normally stored atup to 18°C.
The most important aspect of cheese storage during the ripening stageis humidity control. Humidity may vary from 75% to 85% for hard, dry-rind cheeses (such as farmhouse cheddar) to over 90% for soft, rindlesscheese or surface-ripened soft cheeses.
Figure 3–12 is a flow diagram showing the inputs and outputs from thisprocess.
Figure 3–12 Inputs and outputs for cheese storage
The main environmental issues associated with cheese storage are theenergy and refrigerants consumed in refrigerated cold stores.
Methods for reducing energy consumption and minimising the impacts ofrefrigerant use are:
• installing good insulation;
• keeping doors to cold rooms closed;
• undertaking regular defrosting and maintenance of refrigerationsystems;
• avoiding refrigerants that contain CFCs. Refrigeration systemsbased on ammonia cooling are preferred.
Environmental issues
Cleaner Productionopportunities
Process description
Inputs and outputs
Environmental issues
Cleaner Productionopportunities
Cheese storageElectricity
Refrigerant
Cleaning agents
Refrigerant losses
Unripened cheese and/orpackaged cheese
Ripened or packagedcheese

Chapter 3 Cleaner Production Opportunities
Page 47
3.5 Evaporated and dried milk productionFor many centuries, the only known way to conserve the valuable solidsof milk was to manufacture butter and cheese. In the mid-1800s,however, it was found that milk could be preserved by boiling it withsugar to form a thick conserve (sweetened condensed milk) which wasprotected from spoilage by its high sugar content. This discovery wasfollowed at the end of the century by the development of unsweetenedcondensed milk. Commonly known as ‘evaporated milk’, this productwas sterilised in the can, using a revolving retort.
The manufacturing of condensed milk products grew steadily until about1950, but has since declined. The last major markets for these productsare in South-east Asia and South America, which are now mainly beingsupplied by companies that reconstitute skimmed milk powder.
The period of development of the milk conserves coincided with a majordevelopment of private and co-operative dairies in the United States, inwhich butter and cheese were made on a large scale. The skimmed milkresulting from the separation of cream for butter making was, at best,returned to farmers for cattle feed, but was often dumped in rivers andlakes. This practice continued up until the 1930s, at which time itbecame possible to dry skimmed milk.
Drying of milk was introduced at the beginning of the 20th century on avery small scale, but many years went by before equipment andprocesses were developed for extensive commercial use in the 1930s.At this time spray drying processes were introduced in parallel with theearlier roller-drying process.
Further development did not take place to any major extent, however,until after the Second World War. During the past 30 years in particular,milk drying has become recognised as an essential link between thedairy farmer and the consuming public. This is because it allows milk tobe stored for long periods in times of surplus, and for the powder to bereconstituted or recombined in times of shortage. Extensive research andpractical experience in the techniques of recombining have led to thedevelopment of a wide range of dairy products. The availability of milkpowders has allowed the developed world to help counter the increasingshortage of proteins in many countries. Milk powder is one of the foodproducts most widely used in relief programs.
In the drying process the removal of water takes place in two stages. Inthe first stage, the milk is concentrated by vacuum evaporation toremove up to 90% of the water, and the second drying stage removesmuch of the remaining moisture. The reason for this two-stage approachis that the energy required per kilogram of water evaporated in thedrying process is up to twenty times as much as that required in theevaporation process.
In order to maximise the effectiveness of the two stages of the process,multiple-effect evaporators with up to six effects and mechanical vapourre-compression, as well as double-stage dryers with energy-savingdevices, have been developed. There has been considerable progress inenergy efficiency since the major increase in price of fossil fuels thatresulted from the energy crisis of 1973.

Cleaner Production Assessment in Dairy Processing
Page 48
3.5.1 Evaporation
Falling film evaporators are the most commonly used evaporators in thedairy industry. They are long, tubular structures made from stainlesssteel. Milk is introduced at the top of the evaporator and flows as a thinfilm, down the outside surface of heated tubes or plates, which arepacked into the evaporator. The surfaces within the evaporator areheated by steam, which is injected into the top of the evaporator.
In most dairies, multiple-effect evaporation is used, in which a number ofevaporators are operated in series. The vapour generated from milkevaporated in the first evaporator is used as the steam input in the nextevaporator and so on. Up to seven effects can be operated in series, butthree to five is more common. Operating evaporators in this wayprovides for greater steam efficiency and therefore reduced energyconsumption.
In order to attain further steam efficiency, the vapour exiting eachevaporator can be recompressed to increase its energy before it is usedas the heating medium the subsequent evaporator. Traditionally, thermalrecompression, also referred to as thermal vapour recompression (TVR),was the most common recompression system in use. It involved themixing of high pressure steam with the vapour to compress the mixtureto a higher pressure. A single evaporator with a thermocompressor is asefficient as a two-effect unit without one. Therefore thermocompressionis often used together with multiple-effect evaporation systems.
The effect on energy efficiency of multiple-effect evaporation andthermal recompression is shown in Table 3–8. TVR evaporators areinexpensive, have no moving parts and provide considerable savings insteam consumption.
Table 3–8 Steam consumption for different evaporation systems 1
Type of falling film evaporator Specific steam consumption
(kg steam/kg water evaporated)
Without TVR With TVR
Two–effect evaporator 0.60 0.25
Five–effect evaporator 0.40 0.20
Seven–effect evaporator - 0.08
1 Bylund, 1995
Another form of vapour recompression is mechanical vapourrecompression (MVR). MVR evaporators were developed in Switzerlandduring the Second World War when there was a lack of fuel for raisingsteam. The pressure increase of the vapour is accomplished by themechanical energy that drives the compressor.
The advantage of the MVR evaporator is that all of the vapour isrecompressed, rather than just a portion of it, as is the case with TVRevaporators. This makes for a high degree of heat recovery. In addition,MVR systems are driven by electricity rather than steam, which meansthat operating costs are considerably lower. The operating cost of athree-effect MVR evaporator are approximately half that of a
Process description

Chapter 3 Cleaner Production Opportunities
Page 49
conventional seven-effect TVR plant. As a result, it is reasonable toexpect that older TVR plants will be replaced with MVR technology.
A disadvantage of MVR systems is that it is not possible to attain hightemperatures and thus a steam-heated ‘finisher’ is required.Furthermore, cleaning of the compressor is difficult, although theseproblems have been alleviated by the recent introduction of high-volumefans instead of compressors.
It is important to note that another option has become available for pre-concentration of the liquid to be dried. Reverse osmosis (RO), which is ahyper-filtration concentration process, can remove some of the waterfrom the milk mechanically without the application of heat. Electricalpower is used to drive pumps, which causes liquid migration through asemi-permeable membrane. However it is only possible to increase thesolids concentration to a certain extent. A two fold concentration formilk and whey is common.
Figure 3–13 is a flow diagram showing the inputs and outputs for thisprocess.
Figure 3–13 Inputs and outputs for evaporation
The main environmental issue associated with the evaporativeconcentration of milk is the very high level of energy consumption. Forexample, milk powder is a highly energy-intensive product.
TVR evaporators generate noise and have high energy consumption,especially if the condensate is not reused. The condensate from anevaporator will normally be sufficiently pure to allow direct disposal.However, it is often used for cleaning instead of hot water and thus theenvironmental loading is, in theory, very limited.
Contamination of the condensate by milk, through improperadjustments, carryover and backflows, can result in losses of milk solidsand pollution of the considerable quantities of water produced during theevaporation process.
Cleaning of MVR compressors is difficult and produces liquid wastes.So, to some extent, does the cleaning of the high-volume fans that havebegun to replace mechanical compressors. MVR evaporators use largeamounts of electrical energy, which can create a secondaryenvironmental loading.
Inputs and outputs
Environmental issues
EvaporationSteam
Electricity
Water
Wastewater
Noise
Whole or skimmed milk
Milk concentrate

Cleaner Production Assessment in Dairy Processing
Page 50
Cleaner Production opportunities in this area focus on ensuring theefficient operation of the evaporators, including:
• maintaining a liquid level low enough to prevent product boil-over;
• using entrainment separators to avoid carry-over of milk dropletsduring condensation of evaporated water;
• recirculating low concentration milk and other feedstocks until arequired concentration is reached;
• prior to scheduled shut-downs, processing rinse waters with solidscontent greater than 7% or evaporating them during the next runrather than discharging them to the effluent stream;
• draining equipment thoroughly before starting rinsing andwashing;
• collecting the first rinse water for animal feed;
• reducing the frequency of cleaning operations as much aspossible;
• reusing condensate as cooling water after circulation through acooling tower, or as feed water to the boiler.
Case study 3–5: Conversion to mechanical vapour recompression (MVR)
A Japanese dairy upgraded its milk powder process and installed afour-effect MVR evaporator to replace its existing four-effect TVRevaporator. The cost of the new MVR evaporator was US$1.5 million,compared with US$1.3 million for a new TVR evaporator.
At an evaporation rate of 30 tonnes/hour, the annual operating cost ofthe MVR evaporator was US$680,000, compared with previousannual operating costs of US$175,000 for the TVR evaporator, asaving of nearly 75%. The savings were a result of greatly reducedsteam consumption.
When the MVR system was adopted, it was necessary to prevent milkbeing scorched and contaminating the surfaces of the heat transferpipes in the evaporator, to maintain design evaporation capacity. As aresult, an automated control system was installed to control operatingparameters such as flowrate, temperature and pressure.
(CADDET, 1992)
3.5.2 The drying process
Although roller dryers may still be found in the dairy industry and aresometimes useful for specialised products, the use of spray dryers isnow almost universal. The trend towards fewer yet larger dairies,coupled with technical advances in drying techniques since the SecondWorld War, and the need for major economies in the use of energy overthe past two decades, have made spray dryers the more practicalchoice. Roller dryers will thus not be discussed other than to say thatthey have always had severe environmental problems. They generatefine milk flakes in the vapours that are exhausted through a hood andstack placed immediately over the heated rollers and led outside thebuilding. This has necessitated the use of external vapour cleaners.
Cleaner Productionopportunities
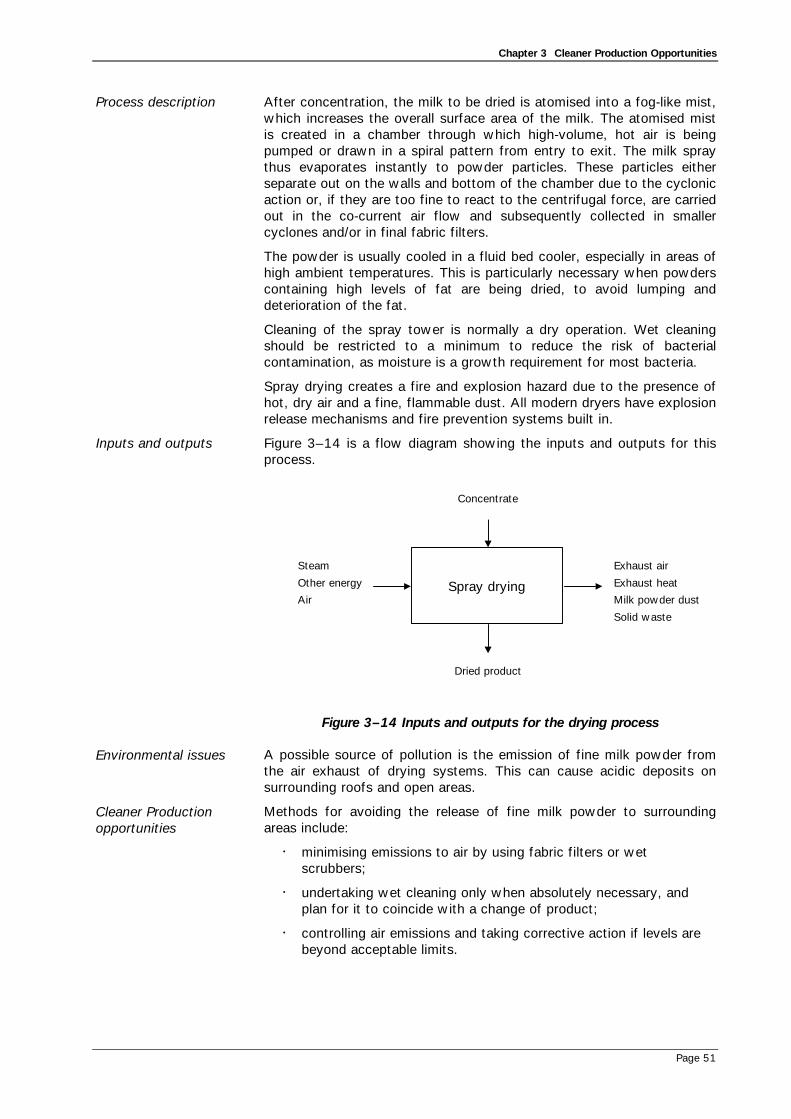
Chapter 3 Cleaner Production Opportunities
Page 51
After concentration, the milk to be dried is atomised into a fog-like mist,which increases the overall surface area of the milk. The atomised mistis created in a chamber through which high-volume, hot air is beingpumped or drawn in a spiral pattern from entry to exit. The milk spraythus evaporates instantly to powder particles. These particles eitherseparate out on the walls and bottom of the chamber due to the cyclonicaction or, if they are too fine to react to the centrifugal force, are carriedout in the co-current air flow and subsequently collected in smallercyclones and/or in final fabric filters.
The powder is usually cooled in a fluid bed cooler, especially in areas ofhigh ambient temperatures. This is particularly necessary when powderscontaining high levels of fat are being dried, to avoid lumping anddeterioration of the fat.
Cleaning of the spray tower is normally a dry operation. Wet cleaningshould be restricted to a minimum to reduce the risk of bacterialcontamination, as moisture is a growth requirement for most bacteria.
Spray drying creates a fire and explosion hazard due to the presence ofhot, dry air and a fine, flammable dust. All modern dryers have explosionrelease mechanisms and fire prevention systems built in.
Figure 3–14 is a flow diagram showing the inputs and outputs for thisprocess.
Figure 3–14 Inputs and outputs for the drying process
A possible source of pollution is the emission of fine milk powder fromthe air exhaust of drying systems. This can cause acidic deposits onsurrounding roofs and open areas.
Methods for avoiding the release of fine milk powder to surroundingareas include:
• minimising emissions to air by using fabric filters or wetscrubbers;
• undertaking wet cleaning only when absolutely necessary, andplan for it to coincide with a change of product;
• controlling air emissions and taking corrective action if levels arebeyond acceptable limits.
Process description
Inputs and outputs
Environmental issues
Cleaner Productionopportunities
Spray drying
Steam
Other energy
Air
Exhaust air
Exhaust heat
Milk powder dust
Solid waste
Concentrate
Dried product
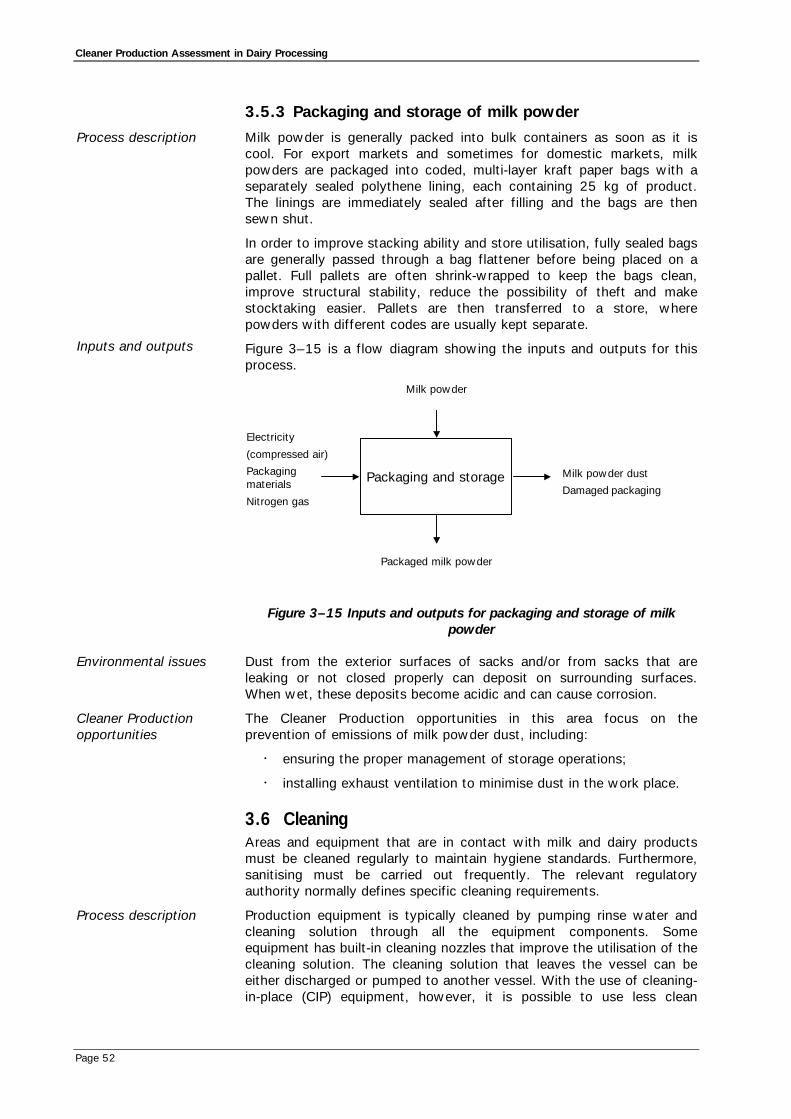
Cleaner Production Assessment in Dairy Processing
Page 52
3.5.3 Packaging and storage of milk powder
Milk powder is generally packed into bulk containers as soon as it iscool. For export markets and sometimes for domestic markets, milkpowders are packaged into coded, multi-layer kraft paper bags with aseparately sealed polythene lining, each containing 25 kg of product.The linings are immediately sealed after filling and the bags are thensewn shut.
In order to improve stacking ability and store utilisation, fully sealed bagsare generally passed through a bag flattener before being placed on apallet. Full pallets are often shrink-wrapped to keep the bags clean,improve structural stability, reduce the possibility of theft and makestocktaking easier. Pallets are then transferred to a store, wherepowders with different codes are usually kept separate.
Figure 3–15 is a flow diagram showing the inputs and outputs for thisprocess.
Figure 3–15 Inputs and outputs for packaging and storage of milkpowder
Dust from the exterior surfaces of sacks and/or from sacks that areleaking or not closed properly can deposit on surrounding surfaces.When wet, these deposits become acidic and can cause corrosion.
The Cleaner Production opportunities in this area focus on theprevention of emissions of milk powder dust, including:
• ensuring the proper management of storage operations;
• installing exhaust ventilation to minimise dust in the work place.
3.6 CleaningAreas and equipment that are in contact with milk and dairy productsmust be cleaned regularly to maintain hygiene standards. Furthermore,sanitising must be carried out frequently. The relevant regulatoryauthority normally defines specific cleaning requirements.
Production equipment is typically cleaned by pumping rinse water andcleaning solution through all the equipment components. Someequipment has built-in cleaning nozzles that improve the utilisation of thecleaning solution. The cleaning solution that leaves the vessel can beeither discharged or pumped to another vessel. With the use of cleaning-in-place (CIP) equipment, however, it is possible to use less clean
Process description
Inputs and outputs
Environmental issues
Cleaner Productionopportunities
Process description
Packaging and storage
Electricity
(compressed air)
Packagingmaterials
Nitrogen gas
Milk powder dust
Damaged packaging
Milk powder
Packaged milk powder

Chapter 3 Cleaner Production Opportunities
Page 53
solution and to recirculate cleaning waters to a significant extent. Thisallows for savings in both detergent and water.
The design of CIP equipment can vary greatly, from simple systemswhere a batch of cleaning solutions is prepared and pumped throughequipment and then drained, to fully automated plants with tanks forwater and cleaning solutions.
Modern CIP systems often involve the use of three tanks: one for hotwater rinsing, one for alkaline cleaning solution (caustic soda) and onefor acidic rinses (nitric acid). Steam is often used to heat the cleaningsolutions. The items of equipment to be cleaned are isolated fromproduct flows and the prepared cleaning solutions are pumped throughthe vessels and pipes. Simpler CIP systems can consist of only one tankand a pump.
Cleaning cycles are often automated according to set sequences andcleaning times, and usually consist of the following steps:
• rinse with cold water (discharged to sewer);• addition of detergents and/or caustic soda;• circulation of cleaning solution through the equipment with
turbulent flow to loosen and suspend soils (discharged to sewer);• rinse with water (discharged to sewer);• nitric acid rinse to prevent build-up of milk scale (discharged to
sewer);• rinse with water (discharged to sewer).
Figure 3–16 is a flow diagram showing the inputs and outputs for thisprocess.
Figure 3–16 Inputs and outputs for cleaning processes
Cleaning is one of the most water-consuming operations, typicallyaccounting for 25–40% of the total water consumption in a dairy.
The pollution load of cleaning wastewaters is considerable, due to thepresence of milk fat and proteins as well as detergents and disinfectants.
For dairies without CIP systems, consideration should be given to theirinstallation. CIP systems make the recovery and reuse of cleaningsolutions possible, and systems equipped with in-line monitoring cancontrol the quality of cleaning solutions, thereby maximising the use ofdetergents and minimising water use. For dairies with CIP equipment, itis important to determine and maintain optimum operational settings toreduce the consumption of both water and detergents.
Inputs and outputs
Environmental issues
Cleaner Productionopportunities
Cleaning
Water
Caustic soda
Nitric acid
Detergents
Steam
Wastewaterscontaining milk anddetergents
Dirty equipment
Clean equipment

Cleaner Production Assessment in Dairy Processing
Page 54
Further water reductions can be achieved by providing facilities for thecollection of final rinse waters so that they can be reused as the initialrinse water in the next CIP cycle.
Detergents and disinfectants can be significant sources of pollution if toomuch is used. It is very important, therefore, to monitor theirconsumption. An optimum detergent concentration for cleaning shouldbe determined.
Operators should ensure that tanks, pipes and hoses are as completelyempty as possible before they are cleaned. Empty pipelines can beblown with compressed air before cleaning in order to reduce any milkfilm that may have adhered to the walls of vessels and pipelines.
Cleaning of floors and equipment often consumes large quantities ofwater, due to the traditional cleaning method in which the operatordirects a jet of water from a hose onto equipment and floors until themilk and solids float down the drain. Solid wastes, such as curd particlesin the cheese making process, can be collected using a brush or broomrather than being rinsed down the drain.
The use of pigging systems to remove product residues from the internalsurfaces of pipeline prior to cleaning can help to reduce the pollutantload of cleaning wastewaters and also allow for product recovery.
Spray nozzles are subject to wear that causes deterioration of the orificeand distortion to the spray pattern. This results in an increased flowrateof water and reduced effectiveness. In general, 10% nozzle wear willresult in a 20% increase in water consumption (McNeil and Husband,1995). Nozzles made from different materials have varying abrasionresistance, as shown in Table 3–9.
Table 3–9 Abrasion wear index for nozzle materials 1
Material Abrasion wear index
Brass 1 (poor)
Stainless steel 4-6 (good)
Hard plastic 4-6 (good)
Ceramic 90-200 (excellent)
1 McNeil and Husband, 1995
Regular monitoring of spray nozzle wear should be incorporated intomaintenance programs. Nozzles in service can be compared with newnozzles to determine the extent of wear, and the flowrate of a nozzlecan be determined by measuring the time taken to fill a container ofknown volume.

Chapter 3 Cleaner Production Opportunities
Page 55
Case study 3–6: Improved monitoring and operation of CIP equipment
In a Dutch dairy, an analysis of the custard preparation and fillingunits found that a significant cause of product loss was the cleaningof the pipes and machines. Consequently, monitoring equipment wasinstalled in the cleaning circuits to measure the conductivity andtemperature of the rinse waters. The company modified its procedureby installing a level controller, lowering the temperature of the heatexchanger, shortening the cleaning program by 20 minutes, andbuying a new software program to monitor the system.
As a result of these changes, consumption of cleaning agents wasreduced by 23% and the organic load of effluent discharged to sewerfell significantly. Expenditure on detergents fell by US$28,500/yearand effluent charges by US$4200 a year. The capital outlay requiredfor the system was US$3150, so the payback period was only onemonth.
Case study 3–7: Replacement of nitric and phosphoric acids
An Australian dairy was using a mixture of nitric and phosphoric acidsfor its CIP operations. The company found that 200 litres of theseacids were being used each day, eventually ending up in surfacedrains. The potential risks to the nearby river motivated the companyto look for other cleaning agents.
The company found a new cleaning compound that, when used withcaustic soda, virtually eliminated the need for an acid wash. Only 150litres of the new compound was needed and the wash time wasreduced by 25%. The reduction in wash time meant an increase of1.5 production hours a day. Overall savings from switching cleaningchemicals amounted to US$220 per day.
Case study 3–8: Improved operation procedure in yoghurt production
In a Dutch dairy, rinsing after each batch of yoghurt was resulting insignificant product loss and an over-consumption of water. Toimprove this situation, the dairy modified its process by allowing eachbatch to drain out and then mixing the remaining product with thenext batch. Only 50 litres of ‘mixed’ product had to be sold as cattlefeed, compared to 110 litres ending up as wastewater.
By not rinsing between batches, 12,500 litres of product a year wasrecovered, resulting in a cost saving of US$4,600. Effluent treatmentcosts fell by US$2,100 and water charges by US$800. The dairysaved US$7,400 per year with no capital investment or loss ofproduct quality.

Cleaner Production Assessment in Dairy Processing
Page 56
3.6.1 Crate washing
Plastic crates (and to some extent wire crates) are washed in a cratewasher. The typical washing sequence is: rinsing with cold and warmwater, washing with a washing soda solution, and final rinsing with coldwater.
Figure 3–17 is a flow diagram showing the inputs and outputs for thisprocess.
Figure 3–17 Inputs and outputs for crate washer operation
The crate washer uses large amounts of water and detergents. Thiscauses the discharge of large quantities of water as well as dirt andsome organic matter from milk. Leaks often go undetected as the area isgenerally wet.
Cleaner Production opportunities in this area therefore focus on reducingthe consumption of water. Ways of achieving this include:
• optimising water consumption by monitoring the water pressureand the condition of the water spray nozzles;
• installation of spray nozzles of the optimum dimensions;
• fixing leaks promptly;
• turning off the crate washer when not in use;
• recirculating wash water through a holding tank.
Process description
Inputs and outputs
Environmental issues
Cleaner Productionopportunities
Crate washing
Water
Detergents
Steam
Wastewaterscontaining organicmatter anddetergents
Returned crates from distribution
Clean crates to packaging area

Chapter 3 Cleaner Production Opportunities
Page 57
3.7 Ancillary operations
3.7.1 Compressed air supply
Air is compressed in an air compressor and distributed throughout theplant in pressurised pipes. Normally, the compressor is driven byelectricity and cooled with water or air.
Figure 3–18 is a flow diagram showing the inputs and outputs for thisprocess.
Figure 3–18 Inputs and outputs for production of compressed air
With just a few small holes in the compressed air system (pipes, valvesetc.), a large amount of compressed air is continuously lost. This resultsin a waste of electricity because the compressor has to run more than isnecessary. Table 3–10 lists unnecessary electricity consumption thatcan be caused by leaks in the compressed air system.
Table 3–10 Electricity loss from compressed air leaks 1
Hole size (mm) Air losses (L/s) kW.h/day MW.h/year
1 1 6 3
3 19 74 27
5 27 199 73
1 UNEP, 1996
Air compressors are usually very noisy, causing serious risk of hearingdamage to the workers in the area.
If the air compressor is water cooled, water consumption can be quitehigh.
It is very important to check the compressed air system frequently. Thebest method is to listen for leaks during periods when there is noproduction.
Maintenance (e.g. change of compressor oil) and the keeping of accuratelog-books will often help identify the onset of system leaks.
Process description
Inputs and outputs
Environmental issues
Cleaner Productionopportunities
Air compressor
Electricity
Compressor oil
Air filters
Cooling water
Noise
Used compressor oil
Used air filters
Warm cooling water
Air
Compressed air toequipment

Cleaner Production Assessment in Dairy Processing
Page 58
A great deal of energy can be saved through these simple measures. Itpays to implement procedures that ensure the compressed air system isleak free and well maintained.
The consumption of cooling water should be regulated by a temperature-sensitive valve, ensuring the optimum cooling temperature and minimumuse of water. Furthermore, the cooling water can be recirculated via acooling tower. Alternatively, the cooling water can be reused for otherpurposes such as cleaning, where the hygiene requirements are low.
Case study 3–9: Reuse of cooling water
An air-cooled system for an air compressor was replaced with awater-cooled one. The water absorbs the heat from the compressorand is then reused in the boilers. Energy is saved in the boilersbecause the water preheated.
The installation of the water cooling system cost US$18,000 and hada payback period of less than two years.
3.7.2 Steam supply
Steam is produced in a boiler and distributed throughout the plant byinsulated pipes. Condensate is returned to a condensate tank, fromwhere it is recirculated as boiler feed water, unless it is used for heatingin the production process.
Figure 3–19 is a flow diagram showing the inputs and outputs for thisprocess.
Figure 3–19 Inputs and outputs for supply of steam
The amount and pressure of the steam produced depend on the size ofthe boiler and how the fuel is injected into the combustion chamber.Other parameters include pressure level, fuel type, and maintenance andoperation of the boiler.
Inefficiencies in boiler operation of boilers and steam leaks leads to thewaste of valuable fuel resources as well as additional operating costs.
Combustion of fuel oil results in emissions of carbon dioxide (CO2),sulphur dioxide (SO2), nitrogen oxides (NOx) and polycyclic aromatichydrocarbons (PAHs). Some fuel oils contain 3–5% sulphur and result insulphur dioxide emissions of 50–85 kg per 1000 litres of fuel oil.
Process description
Inputs and outputs
Environmental issues
Boiler
Oil (fuel oil)
Electricity
Boiler acid
Noise and heat
Air emissions(CO2, NOx, SOx,and PAH)
Spilled oil
Boiler feed waterCondensate return (90°C)
Steam 6–8 bar

Chapter 3 Cleaner Production Opportunities
Page 59
Sulphur dioxide converts to sulfuric acid in the atmosphere, resulting inthe formation of acid rain. Nitrogen oxides contribute to smog and cancause lung irritation.
If the combustion is not adjusted properly, and if the air:oil ratio is toolow, there are high emissions of soot from the burners. Soot regularlycontains PAHs that are carcinogenic.
Table 3–11 shows the emissions produced from the combustion ofvarious fuels to produce steam.
Table 3–11 Emissions from the combustion of fuel oil
Input Outputs
Fuel oil (1% sulphur) 1 kg Energy content 11.5 kW.h
Carbon dioxide (CO2) 3.5 kg
Nitrogen oxides (NOx) 0.01 kg
Sulphur dioxide (SO2) 0.02 kg
1 kg of oil = 1.16 litre of oil (0.86 kg/L)
1 kW.h = 3.6 MJ
Oil is often spilt in storage and at the boiler. If the spilt oil is notcollected and reused or sold, it can cause serious pollution of soil andwater.
Instead of using fuel oil with a high sulphur content, it is advantageousto change to a fuel oil with a low sulphur content (less than 1%). Thisincreases the efficiency of the boiler and reduces sulphur dioxideemissions. There are no investment costs involved, but the runningcosts will be higher because fuel oil with a lower sulphur content ismore expensive.
It is essential to avoid oil spills and, if they occur, to clean them upproperly and either reuse or sell the oil. A procedure for handling oil andoil spills should be instituted and followed.
If the boiler is old, installation of a new boiler should be considered.Making the change from coal to oil, or from oil to natural gas, shouldalso be considered. In some burners is it possible to install an oilatomiser and thereby increase efficiency. Both options (new boiler andatomiser) will often pay back the investment within 5 years. The actualpayback period depends on the efficiency of the existing boiler, theutilisation of the new boiler, the cost of fuel, and other factors.
Steam leaks should be repaired as soon as possible when identified.Even small steam leaks cause substantial losses of steam andcorresponding losses of oil and money.
Insulation of hot surfaces is a cheap and very effective way of reducingenergy consumption. The following equipment is often not insulated:
• valves, flanges;
• scalding vats/tanks;
• autoclaves;
• cooking vats;
• pipe connections to machinery.
Cleaner Productionopportunities

Cleaner Production Assessment in Dairy Processing
Page 60
Through proper insulation of this equipment, heat losses can be reducedby 90%. Often the payback period for insulation is less than 3 years.
If steam condensate from some areas is not returned to the boiler, bothenergy and water are wasted. Piping systems for returning condensateto the boiler should be installed to reduce energy losses. The paybackperiod is short, because 1 m3 of lost condensate represents 8.7 kg of oilat a condensate temperature of 100�C.
The efficiency of boilers depends on how they are operated. If the air tofuel ratio is wrongly adjusted incineration will be poor, causing morepollution and/or poorer utilisation of the fuel. Proper operation of theboiler requires proper training of employees and, if the expertise not isavailable within the company, frequent visits of specialists.
Case study 3–10: Poorly operated coal-fired boiler
Samples of coal and waste ash were taken from coal-fired boilers andwere measured for specific energy (kJ/kg), ash percentage andmoisture percentage. Results showed that up to 29% of the total fuelsupply was not being combusted in the boilers, with the least efficientboiler generating an additional 230 kg of unburnt material per tonne ofcoal. This unburnt material was retained in the ash and disposed of inlandfill.
To improve performance, the company trained employees in efficientboiler operations, so that boilers could be run on automatic control.After this training boiler efficiency increased by 25%, and the specificenergy fell to 6 kJ/kg.
Coal use has been reduced by 1500 tons, making an annual saving ofUS$45,000. Improved boiler operation has also reduced annual landfilldisposal by 275 tonnes. The company has hired a specialist companyto monitor boiler efficiency on an ongoing basis. The cost of thisservice is US$2100 per month.
3.1.3 Water supply
High-quality domestic water supplies may not need any treatment beforeuse in the plant. However if the available water is of poor quality it maybe necessary to treat it to meet hygiene requirements. Treatmentnormally consists of aeration and filtration through gravel or sand andchlorination may also be necessary.
Process description

Chapter 3 Cleaner Production Opportunities
Page 61
Figure 3–20 is a flow diagram showing the inputs and outputs from thisprocess.
Figure 3–20 Inputs and outputs for water treatment
Water is a valuable resource, so its use should be minimised whereverpossible. Since electricity is needed for pumping water, energyconsumption also increases with increasing water consumption.
The losses that occur due to holes in water pipes and running taps canbe considerable. Table 3–12 shows the relationship between size ofleaks and water loss.
Table 3–12 Water loss from leaks at 4.5 bar pressure 1
Hole size (mm) Water loss (m3/day) Water loss (m3/year)
0.5 0.4 140
1 1.2 430
2 3.7 1300
4 18 6400
6 47 17,000
1 UNEP, 1996.
To ensure that water consumption is optimised, consumption should bemonitored on a regular basis. It is helpful to install water meters forseparate departments and even for individual processes or pieces ofequipment. Whether this is feasible depends on the level of waterconsumption and the expected savings in each instance. Waterconsumption can be reduced by 10–50% simply by increasingemployees’ awareness and by educating them on how to reduceunnecessary consumption.
Energy-efficient pumps should be installed to reduce the energyconsumed for pumping of water. New and efficient pumps can reduceenergy consumption by up to 50% compared with standard pumps. It isvery important to select a pump with optimum pumping capacity andposition it close to the required pump work.
Environmental issues
Cleaner Productionopportunities
Water treatmentElectricity
Chlorine
Silt
Backwash water
Domestic and/orprivate water supply
Clean water

Cleaner Production Assessment in Dairy Processing
Page 62
3.1.4 Refrigeration and cooling
In refrigeration and cooling systems a refrigerant, typically ammonia or achlorofluorocarbon (CFC)-based substance, is compressed, and itssubsequent expansion is used to chill a closed circuit cooling system.The refrigerant itself can act as a primary coolant, recirculated directlythrough the cooling system, or alternatively, it can be used to chill asecondary coolant, typically brine or glycol.
CFCs were once extensively used in refrigeration systems, but they arenow prohibited in most countries, and their use is being phased out as aresult of the Montreal Protocol on ozone-depleting substances. Allcooling systems should be closed circuit systems and free of leaks.However, due to wear and tear and inadequate maintenance, leaks mayoccur.
Figure 3–21 is a flow diagram showing the inputs and outputs from thisprocess.
Figure 3–21 Inputs and outputs for cooling system
The consumption of electricity and of water can be quite high.
If CFC-based refrigerants are used there is a risk that refrigerant gaseswill be emitted to the atmosphere, contributing to the depletion of theozone layer. There is also a risk of ammonia and glycol leaks, which canbe an occupational, health and safety problem for workers, but can alsoresult in environmental problems.
CFC-based refrigerants should be replaced by the less hazardoushydrogenated chlorofluorocarbons (HCFCs) or, preferably, by ammonia.In the long run both CFCs and HCFCs should be replaced by otherrefrigerants according to the Montreal Protocol. Replacing CFCs can beexpensive, as it may require the installation of new cooling equipment.
Minimising the ingress of heat into refrigerated areas can reduce energyconsumption. This can be accomplished by insulating cold rooms andpipes that contain refrigerant, by closing doors and windows to coldareas, or by installing self-closing doors.
If water and electricity consumption in the cooling towers seems high, itcould be due to algal growth on the evaporator pipes. Another reasoncould be that the fans are running at too high a speed, blowing thewater off the cooling tower. Optimising the running of the cooling towercan save a lot of water.
Process description
Inputs and outputs
Environmental issues
Cleaner Productionopportunities
Cooling system
Electricity
Water
Compressor oil
Noise
Water vapour
Ammonia losses
Spirit/glycol losses
Old compressor oil
Expanded ammoniaWarm spirit/glycol
Cold ammoniaCold spirit/glycol

Chapter 4 Cleaner Production Case Study
Page 63
4 CLEANER PRODUCTION CASE STUDYThis chapter contains a case study of a Cleaner Production assessmentcarried out at a dairy in The Netherlands. The case study provides anexample of how to carry out a Cleaner Production assessment at a dairyas well as some specific Cleaner Production opportunities that haveproved successful.
4.1 Campina Melkunie MaasdamThe Cleaner Production assessment for this Dutch company was carriedout as part of the PRISMA project (Dutch Ministry of Economic Affairs,1991). The project identified five Cleaner Production opportunities:
� better emptying of production tanks;
� elimination of rinsing between yogurt batches;
� reduced rinsing at product change-over;
� optimisation of cleaning operations;
� recovery of low-grade heat.
This case study demonstrates that even when considerable effort hasalready been made to improve the environmental performance of acompany, it may still be possible to identify additional CleanerProduction opportunities through a formal Cleaner Productionassessment process.
4.1.1 Company descriptionCampina Melkunie Maasdam is part of the Campina Melkunie Holland co-operative. The company employs 170 people, who work two shifts. Thecompany produces a wide range of milk, custard and yogurt products. Intotal l05 million litres of milk is processed per year; 92 million litres formarket milk and 13 million litres for other dairy products.
4.1.2 Process descriptionThe milk is delivered to the plant in milk tankers, after which it isseparated. Depending on the required end product, the milk may then bemixed with non-separated milk to obtain the correct fat content. Themilk is pasteurised and homogenised, and packed into cardboard or glasspackaging. A proportion of the milk is processed further into yogurt,custard and buttermilk.
During the production process, product clings to the internal surfaces ofpipes and equipment, which can lead to reduced product quality. Toavoid this, the entire process is cleaned and sanitised after eachproduction day, and specific pieces of equipment may also be cleanedthroughout a production day. Cleaning agents containing, among otherthings, sodium hydroxide, hydrogen peroxide and peracetic acid arecommonly used.

Cleaner Production Assessment in Dairy Processing
Page 64
4.1.3 Environmental aspectsLike all dairy processing plants, the company generates a warm, liquideffluent stream containing milk constituents and cleaning and sanitisingagents. The quantity of effluent discharged per year is 130,000 L. Theorganic loading of this wastewater averages about 1240 mg COD/L,which is equivalent to 3600 pollution units (pu), where 1 pu equals theorganic pollution load generated by one person. The company is notconnected to a wastewater treatment plant and therefore dischargestreated effluent directly to surface water.
The cost for discharging effluent is calculated according to the DutchPollution of Surface Water Act and amounts to US$120,000 per year,based on US$33 per pu.
Emissions to air principally result from the combustion of fossil fuels inthe boiler for steam generation. Pollutants emitted include NOx, CO, CO2
and PAHs, but the quantities have not been measured.
The company has three chemical waste streams: ink, solvents andlaboratory waste. About 10 litres per year of each of these wastes aregenerated. This is taken away to the small municipal chemical wastedepot.
By far the largest proportion of the company’s solid waste stream is ofpackaging materials, particularly the cardboard containers used topackage milk. Approximately 125,000 containers are lost as waste peryear, which represents approximately 0.25% of the total number ofcartons consumed. The value of this waste stream has been estimatedto be about US$6000. Paper wastes are reused off site whereverpossible and reject glass bottles are also recycled off site.
The company generates its own steam in an on-site boiler for heatingand processing, and other energy needs are met using electricity.
Prior to the PRISMA project waste prevention measures had alreadybeen taken by the company, driven by financial and efficiencyconsiderations. A lot of energy was used for the production of milkproducts. With the high energy prices of the 1970s it was cost-effectiveto take energy-saving measures. A lot of water was also used. For theproduction of 1 litre of milk ten years ago, 10 litres of water wereneeded. This has since been reduced to 1.4 litres of water.
The preventive measures taken primarily involved reuse options, such asusing the cooling and rinse water several times before discharging it.Another measure, to reduce the effluent charge, is to return wasteproduct to the production process or collect it separately and take itaway as cattle feed. Only if this is not possible is the productdischarged.
4.1.4 The Cleaner Production assessmentBased on previous studies of product losses undertaken by thecompany, it was possible to identify areas where relatively largeamounts of waste and emissions were being produced.
The primary sources of pollution load are product loss to the effluentstream and the use of cleaning agents. This is caused by, among otherthings, batch production processes, which lead to the need for frequentcleaning and subsequent losses during start-up and shut-down.
Liquid effluent
Emissions to air
Chemical waste
Solid wastes
Energy
Previous environmentalinitiatives

Chapter 4 Cleaner Production Case Study
Page 65
Another area of concern was the high energy consumption for heatingand cooling.
To reduce the pollution load fourteen preventative measures were drawnup. Since then, eight of them have been implemented. Three options stillhave to be looked at more closely and three have been found to beimpracticable for various reasons.
The result has been as follows:
• a reduction in product loss by 24,000 litres (3.4% reduction);
• a 23% saving in consumption of chemicals;
• a reduction in pollution load by 198 pu./yr (a 5.5% reduction);
• a 138,000 m3/yr saving in natural gas consumption.
Total savings have amounted to US$68,000 per year, and possibly anadditional US$26,000 in reduced effluent charges. This was achieved bya single investment of US$32,000.
Table 4–1 Identified Cleaner Production options
Projects
implemented
Projects still to be
implemented
Feasibility study
required
Loss of product Improvements to
procedures
Replacement of
cooling installation
Improvements to
tank emptying
practices
Cleaning
operations
No rinsing
between yogurt
batches
Substitution of
cleansing agents
Optimisation of
cleansing process
Reuse of sour
products
Reduced rinsing
Energy Pre-heating milk
for buttermilk
Custard heating Pre-heating milk
for yogurt
production
Miscellaneous Replacement of
ink injector
4.1.5 Better emptying of the production tanksThe filling of packaging containers with product at the plant is a batchprocess. At the end of each batch, residual product remains inprocessing vessel. Previous to the Cleaner Production project, thisresidual product was discharged to sewer with the effluent stream. Nowthe residual product remaining in the processing vessel is collected andreturned to the production process or taken away as cattle feed.

Cleaner Production Assessment in Dairy Processing
Page 66
This measure has reduced the amount of product lost to the wastewaterstream by 11,500 litres, which represents a 1.6% reduction in the totalproduct loss, and a decrease in the discharge of organic matter of31 pu/yr.
Implementing this measure was a simple matter. A milk can is positionedbelow the drain point of the processing vessel. After collecting residualproduct, the can is emptied into one of the production vessels or intothe cattle feed tank, depending on the type of product.
The value of the product recovered is US$4850 and reduction in effluentdischarge came to about US$1150. The total annual savings have beenUS$6000 per year and there was no initial capital cost.
4.1.6 Avoidance of rinsing between yogurt batchesRinsing traditionally took place between different batches of yogurt toprevent the mixing of different products. Each rinsing incurred a productloss of 110 litres. Most of the rinse water was used as animal feed, withthe residual discharged to sewer. The total product loss per yearamounted to 22,880 litres, and the total volume of rinse water used was2,500 m3 per year.
The new procedure employed for product changeover was to let theprocessing vessel drain of yogurt and then allow the next batch ofyogurt into the system. The resulting mixed zone is collected and usedas animal feed. As a result, it is no longer necessary to rinse betweenthe two batches.
Investigations undertaken as part of the Cleaner Production projectshowed that product loss is reduced by 60 litres per batch, or a total of12,500 litres per year. The new procedure has also led to a 2,500 m3
per year reduction in water consumption, because rinsing betweenbatches is no longer undertaken. In addition, the time required to emptythe filling machine and collect the mixed zone takes one hour less thanthe previous rinsing procedure. The emptying of the filling machinedemands extra attention from the operators and so written workinstructions were prepared.
The annual savings resulting from the change have been US$4600 inproduct costs, US$2100 in effluent discharge costs and US$7400 inwater consumption.
4.1.7 Reduced rinsing at product change-overRinsing of process equipment is undertaken between batches of sweetand sour products and between dark and light coloured products. This isdone by passing 2000 litres of water through the system eight times insuccession. Instead of using eight successive rinses to remove residualproduct, six rinses were found to be sufficient. This measure hasreduced water consumption by 4 m3 per rinse, which amount to 3120m3 per year.
No capital expenditure was required and there were no technicalcomplications and savings amounted to US$2450 per year.

Chapter 4 Cleaner Production Case Study
Page 67
4.1.8 Optimisation of cleansing operationsAnalysis of the custard preparation and filling operations showed thatthe cleaning of pipelines and equipment was an area of significantproduct loss.
A trial was undertaken as part of the project demonstrated that cleaningprocedures were far from optimal. Measuring devices were installed inthe feed and return lines of the cleansing circuit to measure thetemperature and conductivity of the rinse waters. The consumption ofdetergents and sanitising agents before and after the trial were alsomeasured. Based on the findings of the trial the following changes weremade to the cleaning cycle:
� level controllers were installed on the mixing vessel to control thevolume of cleaning water supplied to the vessel;
� the output temperature of one of the heat exchanger was loweredto reduce the temperature of cleaning water;
� a software program was installed to better control the cleaningprogram;
� the cleaning time was reduced by 20 minutes.
As a result of the changes, the consumption of detergents and sanitisingagents reduced by 23% and the organic load of the wastewaterdischarged from the cleaning process reduced by 110 pu.
The annual savings resulting from the change have been US$28,500 indetergent costs and US$4200 in effluent discharge costs and US$7400in water consumption. The only capital cost incurred was for theinstallation of the measuring equipment, which was US$3150. Thereforethe payback on the project has been approximately one month.
4.1.9 Recovery of low-grade heatOne of the steps in the production process requires the heating ofproduct to 90°C. The company previously used steam from the on-site,natural gas boiler. The company changed their process to utiliselow-grade heat from the cooling water system.
Heat recovered from the return leg of the cooling water system wasused to the heat the product up to 30°C. Steam from the boiler wasthen used to heat the product the rest of the way, up to 90°C. As aresult, 54,000 m3 less natural gas was used.
The capital investment required for the process changes wasUS$15,800 and the resulting savings in natural gas costs came toUS$7900 per year. Therefore the payback period for the project was 2years.
4.1.10 ContactsH.D. Hofman
J.P.C. Dieleman
Erasmus Centre for Environmental Studies (ECES)
Erasmus University of Rotterdam
P.O. Box 1738
3000 DR Rotterdam

Chapter 5 Cleaner Production Assessment
Page 69
5 CLEANER PRODUCTION ASSESSMENTA Cleaner Production assessment is a methodology for identifying areasof inefficient use of resources and poor management of wastes, byfocusing on the environmental aspects and thus the impacts of industrialprocesses.
Many organisations have produced manuals describing CleanerProduction assessment methodologies at varying levels of detail.However, the underlying strategies are much the same. The basicconcept centres around a review of a company and its productionprocesses in order to identify areas where resource consumption,hazardous materials and waste generation can be reduced. Table 5-1lists some of the steps described in the more well-known methodologies.
Table 5-1 Methodologies for undertaking a Cleaner Production assessment
Organisation Document Methodology
UNEP, 1996 Guidance Materials forthe UNIDO/UNEPNational CleanerProduction Centres
1. Planning and
organisation
2. Pre-assessment
3. Assessment
4. Evaluation and
feasibility study
5. Implementation andcontinuation
UNEP, 1991 Audit and ReductionManual for IndustrialEmissions and Wastes.Technical Report SeriesNo. 7
1. Pre-assessment
2. Material balance
3. Synthesis
Dutch Ministry ofEconomic Affairs,1991
PREPARE Manual forthe Prevention of Wasteand Emissions
1. Planning and
organisation
2. Assessment
3. Feasibility
4. Implementation
USEPA, 1992 Facility PollutionPrevention Guide
1. Development of
pollution prevention
programme
2. Preliminary assessment
The rest of this chapter describes the steps within a Cleaner Productionassessment as outlined in the UNEP/UNIDO document, GuidanceMaterials for UNIDO/UNEP National Cleaner Production Centres. (UNEP,1995). The steps from this methodology are detailed further inFigure 5—1.

Cleaner Production Assessment in Dairy Processing
Page 70
Figure 5—1 Overview of the Cleaner Production assessment methodology (UNEP, 1996)
See section 5.1
See section 5.4
See section 5.5
See section 5.2
See section 5.3
Phase I: Planning and organisation
� Obtain management commitment � Establish a project team � Develop policy, objectives and targets � Plan the Cleaner Production assessment
Phase II: Pre-assessment (qualitative review)
� Company description and flow chart � Walk-through inspection � Establish a focus
Phase III: Assessment (quantitative review)
� Collection of quantitative data � Material balance � Identify Cleaner Production opportunities � Record and sort options
Phase IV: Evaluation and feasibility study
� Preliminary evaluation � Technical evaluation � Economic evaluation � Environmental evaluation � Select viable options
Phase V: Implementation and continuation
� Prepare an implementation plan � Implement selected options � Monitor performance � Sustain Cleaner Production activities

Chapter 5 Cleaner Production Assessment
Page 71
5.1 Planning and organisationThe objective of this phase is to obtain commitment to the project,initiate systems, allocate resources and plan the details of the work tocome. A project has more chance of success if this groundwork is donewell.
Figure 5—2 Planning and organisation phase
5.1.1 Obtain management commitmentExperience from companies throughout the world shows that CleanerProduction results in both environmental improvements and bettereconomic performance. However, this message has to reach themanagement of the company. Without management commitment theCleaner Production assessment may be only a short-term environmentalmanagement tool.
5.1.2 Establish a project teamIt is best to establish a project team as early in the process as possible.The project team is responsible for progressing the assessment and willnormally undertake the following tasks:
• analysis and review of present practices (knowledge);
• development and evaluation of proposed Cleaner Productioninitiatives (creativity);
• implementation and maintenance of agreed changes (authority).
5.1.3 Develop environmental policy, objectives and targetsThe environmental policy outlines the guiding principles for theassessment. It acts to focus efforts in a way considered most importantby management. The environmental policy can be refined as the projectteam gains more insight into the Cleaner Production possibilities withinthe company.
The policy contains the company’s mission and vision for continuousenvironmental improvement and compliance with legislation. Objectivesdescribe how the company will do this. For example, objectives couldinclude reducing consumption of materials and minimising the generationof waste. Targets are measurable and scheduled, and are used to
Planning andorganisation
Environmental Policy• Strategy• Objectives• Targets
Project organisation
Work plan

Cleaner Production Assessment in Dairy Processing
Page 72
monitor if the company is proceeding as planned. An example of a targetmight be a 20% reduction in electricity consumption within 2 years.
In general, objectives and targets should be:
• acceptable to those who work to achieve them;
• flexible and adaptable to changing requirements;
• measurable over time (targets only);
• motivational;
• in line with the overall policy statement.
5.1.4 Plan the Cleaner Production assessmentThe project team should draw up a detailed work plan and a timeschedule for activities within the Cleaner Production assessment.Responsibilities should be allocated for each task so that staff involvedin the project understand clearly what they have to do. It is also wise toanticipate any problems or delays that may arise and plan for themaccordingly. Lengthy delays and problems arising out of poor planningerode motivation at both the worker and management level.
5.2 Pre-assessmentThe objective of the pre-assessment is to obtain an overview of thecompany’s production and environmental aspects. Production processesare best represented by a flow chart showing inputs, outputs andenvironmental problem areas.
5.2.1 Company description and flow chartA description of the company’s processes should answer the followingquestions:
• What does the company produce?
• What is the history of the company?
• How is the company organised?
• What are the main processes?
• What are the most important inputs and outputs?
Processes which take place as part of the company’s activities can berepresented using a detailed process flow chart. Flow chart production isa key step in the assessment and forms the basis for material andenergy balances which occur later in the assessment. Process flowcharts should pay particular attention to activities which are oftenneglected in traditional process flow charts, such as:
• cleaning;• materials storage and handling;• ancillary operations (cooling, steam and compressed air
production);• equipment maintenance and repair;• materials that are not easily recognisable in output streams
(catalysts, lubricants etc.);• by-products released to the environment as fugitive emissions.

Chapter 5 Cleaner Production Assessment
Page 73
The process flow chart is meant of providing an overview and shouldthus be accompanied by individual input/output sheets for each unitoperation or department. Figure 5—3 provides an example of aninput/output worksheet, however it may be arranged in various ways.
Figure 5—3 Example of an input/output worksheet
5.2.2 Walk-through inspectionMuch of the information needed to fill out the input/output sheets,described above, may be obtained during a walk-through inspection ofthe company.
The walk-through inspection should, if possible, follow the process fromthe start to the finish, focusing on areas where products, wastes andemissions are generated. During the walk-through, it is important to talkto the operators, since they often have ideas or information that can beuseful in identifying sources of waste and Cleaner Productionopportunities. The text box over page provides examples of the types ofquestions that may be asked to prompt the investigation.
During the walk-through problems encountered along the way should belisted, and if there are obvious solutions to these they should also benoted. Special attention should be paid to no-cost and low-costsolutions. These should be implemented immediately, without waitingfor a detailed feasibility analysis.
5.2.3 Establish a focusThe last step of the pre-assessment phase is to establish a focus forfurther work. In an ideal world, all processes and unit operations shouldbe assessed. However time and resource constraints may make itnecessary to select the most important aspect or process area. It iscommon for Cleaner Production assessments to focus on thoseprocesses that:
• generate a large quantity of waste and emissions;• use or produce hazardous chemicals and materials;• entail a high financial loss;• have numerous obvious Cleaner Production benefits;• are considered to be a problem by everyone involved.
Department:
Process:
Short description:
Occupationalhealth and safety:
Raw materials:
Ancillary materials:
Hazardous materials:
Water:
Energy:
Product:
By-products:
Air emissions:
Solid waste:
Hazardous waste:
Wastewater discharge:
Inputs OutputsProcess

Cleaner Production Assessment in Dairy Processing
Page 74
All the information collected during the pre-assessment phase should bewell organised so that it is easily accessed and updated.
Questions to be answered during a walk-through inspection
Are there signs of poor housekeeping (untidy or obstructed work areasetc.)?
Are there noticeable spills or leaks? Is there any evidence of past spills,such as discoloration or corrosion on walls, work surfaces, ceilings andwalls, or pipes?
Are water taps dripping or left running?
Are there any signs of smoke, dirt or fumes to indicate material losses?
Are there any strange odours or emissions that cause irritation to eyes,nose or throat?
Is the noise level high?
Are there open containers, stacked drums, or other indicators of poorstorage procedures?
Are all containers labelled with their contents and hazards?
Have you noticed any waste and emissions being generated fromprocess equipment (dripping water, steam, evaporation)?
Do employees have any comments about the sources of waste andemissions in the company?
Is emergency equipment (fire extinguishers etc.) available and visible toensure rapid response to a fire, spill or other incident?
5.3 AssessmentThe aim of the assessment phase is to collect data and evaluate theenvironmental performance and production efficiency of the company.Data collected about management activities can be used to monitor andcontrol overall process efficiency, set targets and calculate monthly oryearly indicators. Data collected about operational activities can be usedto evaluate the performance of a specific process.

Chapter 5 Cleaner Production Assessment
Page 75
Figure 5—4 Assessment phase
5.3.1 Collection of quantitative dataIt is important to collect data on the quantities of resources consumedand wastes and emissions generated. Data should be represented basedon the scale of production: for example: water consumption per tonne oflive carcass weight (LCW) processed or mass of organic matter (COD)generated per tonne of live carcass weight (LCW) processed. Collectionand evaluation of data will most likely reveal losses. For instance, highelectricity consumption outside production time may indicate leakingcompressors or malfunctioning cooling systems.
In determining what data to collect, use the input/output worksheets,described previously, as a guide. Most data will already be availablewithin the company recording systems, e.g. stock records, accounts,purchase receipts, waste disposal receipts and the production data.Where information is not available, estimates or direct measurementswill be required.
5.3.2 Material balanceThe purpose of undertaking a material balance is to account for theconsumption of raw materials and services that are consumed by theprocess, and the losses, wastes and emissions resulting from theprocess. A material balance is based on the principle of ‘what comesinto a plant or process must equal what comes out’. Ideally inputsshould equal outputs, but in practice this is rarely the case, and somejudgment is required to determine what level of accuracy is acceptable.
A material balance makes it possible to identify and quantify previouslyunknown losses, wastes or emissions, and provide an indication of theirsources and causes. Material balances are easier, more meaningful andmore accurate when they are undertaken for individual unit operation.An overall company-wide material balance can then be constructed withthese.
The material balance can also be used to identify the costs associatedwith inputs, outputs and identified losses. It is often found that
Assessment
Input–output balanceInputs:
No. Name Quantity Valuexxx xxxxxx xxx
Outputs:No. Name Quantity Valuexxx xxxxxx xxx
List of problems and solutionsAREA (company or department)
Problem description Solutionsxxx xxx1
xxx2xxx xxx
Cleaner Production Assessment in Dairy Processing
Page 76
presenting these costs to management can result in a speedyimplementation of Cleaner Production options.
While it is not possible to lay down a precise and complete methodologyfor undertaking a material balance, the following guidelines may beuseful:
• Prepare a process flow chart for the entire process, showing asmany inputs and outputs as possible.
• Sub-divide the total process into unit operations. (Sub-division ofunit operations should occur in such a way that there is thesmallest possible number of streams entering and leaving theprocess).
• Do not spend a lot of time and rescues trying to achieve a perfectmaterial balance; even a preliminary material balance can revealplenty of Cleaner Production opportunities.
Environmental performance indicators for the process can be developedfrom the material balance data. This is achieved by dividing the quantityof a material input or waste stream by the production over the sameperiod. Performance indicators may be used to identify over-consumption of resources or excessive waste generation by comparingthem with those of other companies or figures quoted in the literature.They also help the company track its performance towards itsenvironmental targets.
5.3.3 Identify Cleaner Production opportunitiesIdentifying Cleaner Production opportunities depends on the knowledgeand creativity of the project team members and company staff, much ofwhich comes from their experience. Many Cleaner Production solutionare arrived at by carefully analysing the cause of a problem.
Another way of identifying Cleaner Production opportunities is to hold a‘brainstorming’ session, where people from different parts of theorganisation meet to discuss solutions to specific problems in an openand non-threatening environment.
Some other sources of help from outside the organisation could be:
• this guide;• external industry personnel or consultants;• trade associations;• universities, innovation centres, research institutions, government
agencies;• equipment suppliers;• information centres, such as UNEP or UNIDO;• literature and electronic databases.
5.3.4 Record and sort optionsOnce a number of Cleaner Production opportunities have been suggestedand recorded, they should be sorted into those that can be implementeddirectly and those that require further investigation.

Chapter 5 Cleaner Production Assessment
Page 77
It is helpful to follow the following steps:
• Organise the options according to unit operations or processareas, or according to inputs/outputs categories (e.g. problemsthat cause high water consumption).
• Identify any mutually interfering options, since implementation ofone option may affect the other.
• Opportunities that are cost free or low cost, that do not require anextensive feasibility study, or that are relatively easy to implement,should be implemented immediately.
• Opportunities that are obviously unfeasible, or cannot beimplemented should be eliminated from the list of options forfurther study.
Table 5—2 Example of information recorded for identified options
Problem type Problem description Cleaner Production
options
Examples:
• resource
consumption
• energy consumption
• air pollution
• solid waste
• wastewater
• hazardous waste
• occupational health
and safety
Examples:
• name of process and
department
• short background of
problem
• amount of materials
lost or concentration
of pollutants
• money lost due to
lost resources
Examples:
• how the problem
can be solved
• short-term solution
• long-term solution
• estimated reductions
in resource
consumption and
waste generation
5.4 Evaluation and feasibility studyThe objective of the evaluation and feasibility study phase is to evaluatethe proposed Cleaner Production opportunities and to select thosesuitable for implementation.
The opportunities selected during the assessment phase should all beevaluated according to their technical, economic and environmentalmerit. However, the depth of the study depends on the type of project.Complex projects naturally require more thought than simple projects.For some options, it may be necessary to collect considerably moreinformation. An important source of this information may be employeesaffected by the implementation.
Figure 5—5 Evaluation and feasibility study phase
Evaluation andfeasibility study
Evaluation
Problem Solution Evaluationxxx xxx Economic Environmental Technicalxxxxxx

Cleaner Production Assessment in Dairy Processing
Page 78
5.4.1 Preliminary evaluationThe quickest and easiest method of evaluating the different options is toform a group, consisting of the project team and management personnel,and discuss the possible solutions one by one. This process should givea good indication of which projects are feasible and what furtherinformation is required.
5.4.2 Technical evaluationThe potential impacts on products, production processes and safetyfrom the proposed changes need to be evaluated before complex andcostly projects can be decided upon. In addition, laboratory testing ortrial runs may be required when options significantly change existingpractices. A technical evaluation will determine whether the opportunityrequires staff changes or additional training or maintenance.
5.4.3 Economic evaluationThe objective of this step is to evaluate the cost effectiveness of theCleaner Production opportunities. Economic viability is often the keyparameter that determines whether or not an opportunity will beimplemented.
When performing the economic evaluation, costs of the change areweighed against the savings that may result. Costs can be broken intocapital investments and operating costs. Standard measures used toevaluate the economic feasibility of a project are payback period, netpresent value (NPV), or internal rate of return (IRR).
Capital investment is the sum of the fixed capital costs of design,equipment purchase, installation and commissioning, costs of workingcapital, licenses, training, and financing. Operating costs, if different toexisting conditions will need to be calculated. It may be that operatingcosts reduce as a result of the change, in which case, these should beaccounted for in the evaluation as an ongoing saving.
5.4.4 Environmental evaluationThe objective of the environmental evaluation is to determine thepositive and negative environmental impacts of the option. In manycases the environmental advantages are obvious: a net reduction intoxicity and/or quantity of wastes or emissions. In other cases it may benecessary to evaluate whether, for example, an increase in electricityconsumption would outweigh the environmental advantages of reducingthe consumption of materials.
For a good environmental evaluation, the following information isneeded:
• changes in amount and toxicity of wastes or emissions;
• changes in energy consumption;
• changes in material consumption;
• changes in degradability of the wastes or emissions;
• changes in the extent to which renewable raw materials are used;
• changes in the reusability of waste streams and emissions;
• changes in the environmental impacts of the product.

Chapter 5 Cleaner Production Assessment
Page 79
In many cases it will be impossible to collect all the data necessary for agood environmental evaluation. In such cases a qualified assessment willhave to be made, on the basis of the existing information.
Given the wide range of environmental issues, it will probably benecessary to prioritise those issues of greatest concern. In line with thenational environmental policy of the country, some issues may have ahigher priority than others.
Aspects to be considered in the evaluation
Preliminary evaluation
• Is the Cleaner Production option available?
• Can a supplier be found to provide the necessary equipment orinput material?
• Are consultants available to help develop an alternative?
• Has this Cleaner Production opportunity been applied elsewhere? Ifso, what have been the results and experience?
• Does the option fit in with the way the company is run?
Technical evaluation
• Will the option compromise the company's product?
• What are the consequences for internal logistics, processing timeand production planning?
• Will adjustments need to be made in other parts of the company?
• Does the change require additional training of staff and employees?
Economic evaluation
• What are the expected costs and benefits?
• Can an estimate of required capital investment be made?
• Can an estimate of the financial savings be made, such asreductions in environmental costs, waste treatment costs, materialcosts or improvements to the quality of the product?
Environmental evaluation
• What is the expected environmental effect of the option?
• How significant is the estimated reduction in wastes or emissions?
• Will the option affect public or operator health (positive ornegative)? If so, what is the magnitude of these effects in terms oftoxicity and exposure?
5.4.5 Select optionsThe most promising options must be selected in close collaboration withmanagement. A comparative ranking analysis may be used to prioritiseopportunities for implementation. The concept of such a method isshown below in Table 5-3. An option can be assigned scores, say from1 to 10, based on its performance against a set of evaluation criteria. Bymultiplying each score by a relative weight assigned to each criterion, afinal score can be arrived at. The options with the highest scores willprobably be best suited for implementation. However, the results of this

Cleaner Production Assessment in Dairy Processing
Page 80
analysis should not be blindly accepted. Instead, they should form astarting point for discussion.
All simple, cost-free and low-cost opportunities should of course beimplemented as soon as possible.
Table 5-3 Example of a weighted sum method for evaluating alternative options
Evaluation criterion Weight Score*
Option A Option B Option C
score weighed
score
score weighed
score
score weighed
score
Reduced hazardous waste treatment
Reduced wastewater treatment costs
Reduced amount of solid waste
Reduced exposure to chemicals
Reduced amount of water consumption
Reduced odour problems
Reduced noise problems
Easy to install and maintain
3
3
3
2
1
1
1
3
+3
+1
+3
+3
+1
0
–2
–1
9
3
9
6
1
0
–2
–3
+2
0
+2
0
0
–1
0
-1
6
0
6
0
0
–1
0
-3
+3
+2
+3
–1
+2
0
0
+1
9
6
9
-2
2
0
0
3
Weighted sum 23 8 27
* -3 = lowest rank, 0 = no change, +3 = highest rank (preferred)
5.5 Implementation and continuationThe objective of the last phase of the assessment is to ensure that theselected options are implemented, and that the resulting reductions inresource consumption and waste generation are monitored continuously.
Figure 5—6 Implementation and continuation phase
Implementation andfollow-up
Implementation Plan
Problem Solutions What? Who? When?xxx xxx xxx NN datexxxxxx
Monitoring
Kg waste/product

Chapter 5 Cleaner Production Assessment
Page 81
5.5.1 Prepare an implementation planTo ensure implementation of the selected options, an action plan shouldbe developed, detailing:
• activities to be carried out;
• the way in which the activities are to carried out;
• resource requirements (finance and manpower);
• the persons responsible for undertaking those activities;
• a time frame for completion with intermediate milestones.
5.5.2 Implement selected optionsAs for other investment projects, the implementation of CleanerProduction options involves modifications to operating procedures and/orprocesses and may require new equipment. The company should,therefore, follow the same procedures as it uses for implementation ofany other company projects.
However, special attention should be paid to the need for training staff.The project could be a failure if not backed up by adequately trainedemployees. Training needs should have been identified during thetechnical evaluation.
5.5.3 Monitor performanceIt is very important to evaluate the effectiveness of the implementedCleaner Production options. Typical indicators for improved performanceare:
• reductions in wastes and emissions per unit of production;• reductions in resource consumption (including energy) per unit of
production;• improved profitability.
There should be periodic monitoring to determine whether positivechanges are occurring and whether the company is progressing towardits targets. Examples of the types of aspects that could be checked toevaluate improvements are shown in Table 5-4.
5.5.4 Sustain Cleaner Production activitiesIf Cleaner Production is to take root and progress in an organisation, it isimperative that the project team does not lose momentum after it hasimplemented a few Cleaner Production options. Sustained CleanerProduction is best achieved when it becomes part of the managementculture through a formal company environmental management system ora total environmental quality management approach.
An environmental management system provides a decision-makingstructure and action plan to support continuous environmentalimprovements, such as the implementation of Cleaner Production.
If a company has already established an environmental managementsystem, the Cleaner Production assessment can be an effective tool forfocusing attention on specific environmental problems. If, on the otherhand, the company establishes a Cleaner Production assessment first,

Cleaner Production Assessment in Dairy Processing
Page 82
this can provide the foundations of an environmental managementsystem.
Regardless of which approach is undertaken, Cleaner Productionassessment and environmental management systems are compatible.While Cleaner Production projects have a technical orientation, anenvironmental management system focuses on setting a managementframework, but it needs a technical focus as well.
To assist industry in understanding and implementing environmentalmanagement systems, UNEP, together with the International Chamber ofCommerce (ICC) and the International Federation of Engineers (FIDIC),has published an Environmental Management System Training ResourceKit. This kit is compatible with the ISO 14001 standard.
Like the Cleaner Production assessment, an environmental managementsystem should be assessed and evaluated on an ongoing basis andimprovements made as required. While the specific needs andcircumstances of individual companies and countries will influence thenature of the system, every environmental management system shouldbe consistent with and complementary to a company's business plan.

Chapter 5 Cleaner Production Assessment
Page 83
Table 5—4 Evaluation checklist
Overall Cleaner Production assessment check YES NO
• Are the opportunities implemented according to the action plan?
• Are new procedures being followed correctly by the employees?
• Where do problems occur and why?
• Do licenses or permits require amendments? Which ones?
• Has compliance with legislation been maintained as a result of the changes?
Environmental performance check
• Are the opportunities cost effective? Is the cost effectiveness as expected?
• Has the number of waste and emission sources decreased? By how many?
• Has the total amount of waste and emissions decreased? By how much?
• Has the toxicity of the waste and emissions decreased? By how much?
• Has the energy consumption decreased? By how much?
• Have the Cleaner Production goals been achieved? Which have and which have not?
• Have there been any technical ramifications? Which and why?
Documentation check (The following items should be included in the files.)
• Statements of the company’s objectives and targets and the environmental policy
• Company description and flow diagram with input and outputs
• Worksheets completed during the Cleaner Production assessment
• Material balances
• List of Cleaner Production opportunities generated during brainstorming sessions
• Lists of opportunities that are technically, economically and environmentally feasible
• Implementation action plan
• Monitoring data
• ‘Before-and-after’ comparisons
• Post-implementation evaluation reports
Evaluation Questionnaire
CLEANER PRODUCTION ASSESSMENT IN DAIRY PROCESSING
As part of its continuing review of the quality and impact of publications it supports, the United Nations EnvironmentProgramme’s Division of Technology, Industry and Economics would appreciate your co-operation in completing thefollowing questionnaire.
1. Quality
Please rate the following quality aspects of the publication by ticking the appropriate box:
Very good Adequate Poor
Presentation o o oStructure of content o o oSubject coverage o o oEase of reading o o oLevel of detail o o oRigour of analysis o o oUp-to-date o o o
2. Usefulness
In general, how much of the publication is:
Most About half Little
Of technical/substantive value to you? o o oRelevant to you? o o oNew to you? o o oWill be used by you? o o o
What would make the manual more useful for you?
3. Effectiveness in achieving the objective
The objective of this publication is to provide the reader with an appreciation of how Cleaner Production can be applied to the dairy processing industry aswell as providing resources to help undertake a Cleaner Production assessment at a dairy processing facility. In your opinion, to what extend does thisdocument fulfil this objective?
Please tick one box o Fully o Adequately o Inadequately
Please state reasons for your rating:
4. Uses
a. Please state how the publication will affect or contribute to your work, illustrating your answer with examples.

b. Please indicate, in order of importance (first, second or third), the usefulness of the publication to you:
First Second Third
For your own information o o oAs reference material o o oAs guidelines for on-the-job application o o o
5. Distribution
Will others read your copy of this publication? o Yes o No o Unknown
If ‘yes’, how many?
Did you receive this publication directly from UNEP? o Yes o No o Unknown
If ‘no’, who forwarded it to you?
6. General Observations
a. Please indicate any changes in the publication that would increase its value to you.
b. Please indicate, in order of importance (first, second or third), which of the following items might increase the value of the publication to you.
First Second Third
Translation into your own language o o oSpecific regional information o o oAdditional technical information o o o
7. The following data would be useful for statistical analysis
Your name (optional)
Professional background
Position/function/occupation
Organisation
Country
Date
UNEP would like to thank you for completing this questionnaire. Please return to:
The Director
UNEP Division of Technology, Industry and Environment
Tour Mirabeau 39-43, quai André Citroën
75739 Paris Cedex 15, France
Fax: +33 (1) 44 37 14 74

Annex 1 References and Bibliography
Page 85
ANNEX 1 REFERENCES AND BIBLIOGRAPHYAckermann, H. W., 1993. Disposal and use of milk packaging waste–regulations and legislation. Consequences for the dairy industry and measuresto be taken. Bulletin of the International Dairy Federation. Number 279, pp.33–36.Anon, 1983. World Guide to Cheese. Ebury Press, London. (Translated fromItalian). ISBN 0 85223 333 7.
Baas, L. W., van der Belt, M., Huisingh, D. and Neumann, F., 1992. CleanerProduction: What some governments are doing and what all governments cando to promote sustainability. European Water Pollution Control 2(1).
Bylund, G., 1995. Dairy Handbook. Tetra Pak Processing Systems. Lund,Sweden.
Centre for Analysis and Dissemination of Demonstrated Energy Technologies(CADDET), 1992. Quadruple-effect milk evaporator uses mechanical vapourrecompression. Available at http://www.caddet-ee.org/ (14/3/2000).
Carawan, R. E., 1991. Processing Plant Waste Management Guidelines—Aquatic Fishery Products. North Carolina Pollution Prevention Program.
COWI Consulting Engineers and Planners AS, 1992. Dairy Sector Study,Hungary. EU-Phare Contract No. H900 400000-048 (in co-operation with theDanish Dairy Board and the Danish Agricultural Advisory Centre).
Cox, G.C. and Krapivansky, Z.N., 1984. Energy Conservation in DairyFactories. Department of Resources and Energy, Commonwealth of Australia.Report prepared as part of the National Energy, Research, Development andDemonstration Project, Report No. 251.
Danish Environmental Protection Agency (EPA), 1991. Cleaner Technology inthe Dairy Industry. Environmental Report No. 167 (in Danish).
Dutch Ministry of Economic Affairs, 1991. PREPARE Manual for the Preventionof Waste and Emission. NOTA Publication. Leiden, The Netherlands.ISBN 90 346 2565 6
Environment Canada, 1991. Recovery of Proteins and Fats Lost in the DairyIndustry. Environmental Protection Series, Report EPA 3/FP/2.
Environmental Protection Authority of Victoria (EPA Victoria), 1997.Environmental Guidelines for the Dairy Processing Industry. State Governmentof Victoria. Melbourne, Australia.
Harper, W. F. and Blaisdell, J.L., 1971. State of the art of dairy food plantwastes and waste treatment. Proceedings of the Second National Symposiumon Food Processing Wastes, Denver (Colorado), USA, 23–26 March.
Harper, W. J., Blaisdell, J.L. and Grosskopf, J., 1971. Dairy food plant wastesand waste treatment practices. US EPA 12060 EGU03/71.
Harper, W. J., Carawan, R. E. and Parkin, M. F., 1984. Waste ManagementControl Handbook for Dairy Food Plants. US EPA Publication No. 600/2-84-043.
Houlihan, A., Dennien, G., Marschke, R. and Smith, S., 1999. Recovery of MilkConstituents from Cleaning Solutions Used in the Dairy Industry. DairyResearch and Development Corporation (DRDC). Melbourne.
International Chamber of Commerce (ICC), 1991. ICC Guide to EffectiveEnvironmental Auditing. ICC Publishing S.A. Paris.
International Dairy Federation (IDF), 1980. Guide for dairy managers onwastage prevention in dairy plants. Bulletin of the IDF. Number 124.
International Dairy Federation (IDF), 1984. Dairy effluents. Proceedings of anIDF Seminar, Killarney, Ireland. April, 1983. Bulletin of IDF. Number 184.

Cleaner Production Assessment in Dairy Processing
Page 86
International Dairy Federation (IDF), 1985. Nutrient sources in dairy effluent.Bulletin of IDF. Number 195.
Jones, H. R., 1974. Pollution Control in the Dairy Industry. Noyes DataCorporation, Park Ridge (New Jersey), USA. ISBN 0 8155 0522 1.
Joyce, D. and Burgi, A., 1993. It’s Such a Waste of Energy. Dairy Researchand Development Corporation (DRDC), Melbourne. ISBN 0 642 20065 3.
McNeil, I. and Husband, P., 1995. Water and Waste Minimisation. Optimisationof Water Use and Control of Waste in Abattoirs. Australian Meat TechnologyPty Ltd. Cannon Hill, Australia.
Marshall, K. R. and Harper, W. J., 1984. “The treatment of wastes from thedairy industry.” in Surveys in Industrial Wastewater Treatment, Volume 1 Foodand Allied Industries, edited by Barnes, D., Forster, C. F. and Hrudey, S. E.Pitman Publishing Ltd.
Morr C. V., 1992. Whey and Whey Products Available for Utilisation, in Wheyand Lactose Processing, edited by Zadow, J.G. Elsevier Applied Science.London.
National Productivity Council, India, 1994. From Waste to Profits: Guidelinesfor Waste Minimization. National Productivity Council. New Delhi, India.
Robinson, R. K., 1986. Modern Dairy Technology, Volume 1. Elsevier AppliedScience Publishers, London. ISBN 0 85334 391 8.
Robinson, R. K., 1986. Modern Dairy Technology, Volume 2. Elsevier AppliedScience Publishers, London. ISBN 0 85334 394 2.
Schindler, M., 1993. Environmental influence of chemicals used in the dairyindustry which can enter dairy wastewater. Bulletin of IDF. Number 288.
Swedish Environmental Protection Agency (EPA), 1991. Dairies and dried milkfactories. SNV 91 620 9337 1/95-04/+500+ex.
United Nations Environment Programme (UNEP), 1991. Audit and ReductionManual for Industrial Emissions and Wastes. Technical Report Series No. 7.UNEP Industry and Environment. Paris.
United Nations Environment Programme (UNEP), 1994. Government Strategiesand Policies for Cleaner Production. UNEP Industry and Environment. Paris.
United Nations Environment Programme (UNEP), 1995. Cleaner Production: ATraining Resource Package. UNEP Industry and Environment, Paris.
United Nations Environment Programme (UNEP), 1996. EnvironmentalManagement in the Brewing Industry. Technical Report Series No. 33. UNEPIndustry and Environment.
United Nations Environment Programme (UNEP), 1996A. Guidance Materials forthe UNIDO/UNEP National Cleaner Production Centres. UNEP Industry andEnvironment. Paris.
United Nations Environment Programme, Cleaner Production Working Group forthe Food Industry, 1999. Cleaner Production Checklists for the Food Industry.Internal document. http://www.geosp.uq.edu.au/emc/CP/ Fact2.htm(14/03/2000).
United Nations Environment Programme Industry and Environment (UNEP IE),1995. Food processing and the environment. UNEP Industry and Environment18(1). ISSN 0378 9993.
United Nations Environment Programme, International Chamber of Commerceand International Federation of Consulting Engineers (UNEP/ICC/FIDIC), 1997.Environmental Management System Training Resource Kit. SMI DistributionServices Ltd. Hertsfordshire, United Kingdom. ISBN 92-807-1479-1
United States Environment Protection Agency (US EPA), 1992. WasteMinimization Assessment for a Dairy. Environmental Research Brief,EPA/600/S-92/005.

Annex 1 References and Bibliography
Page 87
United States Environment Protection Agency (US EPA), 1992A. FacilityPollution Prevention Guide. EPA/600/R-92/088. Cincinnati (Ohio), USA.
United States Environment Protection Agency (US EPA), 1998. WasteMinimization Opportunity Assessment Manual. Technology Transfer Series.EPA/625/7-88/003. Cincinnati (Ohio), USA.
Varnam, A. H. and Sutherland, J. P., 1994. Milk and Milk Products:Technology, Chemistry and Microbiology. Chapman and Hall. London.
World Bank, 1997. Industrial Pollution Prevention and Abatement Handbook:Dairy Industry. World Bank, Environment Department.

Annex 2 Glossary
Page 89
ANNEX 2 GLOSSARY
BAT Best available technology and best availabletechniques (from an environmental viewpoint). BATcovers both equipment and operation practice
Best practice The practice of seeking out, emulating and measuringperformance against the best standard identifiable
BOD Biochemical oxygen demand. A measure of thequantity of dissolved oxygen consumed by micro-organisms as the result of the breakdown ofbiodegradable constituents in wastewater
CFC Chlorofluorocarbon. CFCs have very good technicalproperties as coolants, but are causing depletion ofthe ozone layer, which protect humans, animals andcrops against ultra-violet radiation. CFCs and HCFCs(hydrogenated chlorofluorocarbon) are being phasedout according to the Montreal Protocol. CFC-11 iscommonly known as Freon
CIP Cleaning in place is the circulation of a cleaningsolution through or over the surface of productionequipment
CO2 Carbon dioxide
COD Chemical oxygen demand. A measure of the quantityof dissolved oxygen consumed during chemicaloxidation of wastewater
COD:BOD ratio An indication of how biologically degradable aneffluent is. Low values, i.e. <2, indicate relativelyeasily degradable substances, while high valuesindicate the contrary.
CP Cleaner Production
Effluent The liquid discharged from a process or treatmentsystem
EMS Environmental management system
Eutrophication High growth of algae which causes a poor penetrationof light in the water and a very high oxygenconsumption, resulting in a high risk of fish death dueto lack of oxygen
HCFC Hydrogenated chlorofluorocarbon; see CFC
ISO 14001 International Standard ISO14001 EnvironmentalManagement Systems—specification with guidancefor use. International Organization for Standardisation
MVR Mechanical vapour recompression
PAHs Polycyclic aromatic hydrocarbons. Occur in flue gasesfrom combustion of fuel. Some PAHs are carcinogenic

Cleaner Production Assessment in Dairy Processing
Page 90
pu A measure of pollution units used in The Netherlands(1 p.u. equals the organic pollution of wastewaterfrom one person)
PVC Polyvinyl chloride, a commonly used plastic
N Nitrogen
NOx Nitrogen oxides; covers both NO2 (nitrogen dioxide)and NO (nitrogen monoxide)
P Phosphorus
SOx Sulphur oxides; covers the various forms of gaseoussulphur oxide compounds found in combustion gases.
SS Suspended solids
TVR Thermal vapour recompression
UF Ultrafiltration
UN United Nations
UNEP DTIE United Nations Environment Programme, Division ofTechnology, Industry and Economics
UNIDO United Nations Industrial Development Organization
US$ US dollars
Unitsbar unit for measuring pressure (1 bar = 0.987
atmosphere)
J joule (1 W = 1 J/s)
kg kilogram
kW.h kilowatt hour (1 kW.h = 3.6 MJ)
L litre
lb pound (1 lb = 0.454 kg)
m metre
m2 square metre
m3 cubic metre (= 1000 L)
MJ 1 million joules (1 MJ = 0.278 kW.h)
MW.h megawatt hour (1 MW.h = 1000 kW.h)
Nm3 Normal cubic metre
t, tonne tonne (= 1000 kg)

Annex 3 Further Information
Page 91
ANNEX 3 FURTHER INFORMATION
Journals
International Dairy Journal
Elsevier ScienceP.O. Box 2111000 AE AmsterdamThe Netherlands(addresses for regional offices can be obtained fromhttp://www.elsevier.com/homepage/)Phone: +31 20 4853757Fax: +31 20 4853432Email: [email protected]: http://elsevier.com/inca/publications/store/4/0/5/8/6/0/
Bulletin of the International Dairy Federation (IDF)
41 Square Vergote1030 BrusselsBelgiumPhone: +322 733 9888Fax: +322 733 0413Email: [email protected]: http://www.fil-idf.org/Welcome.html
Journal of Dairy Science
American Dairy Science Association1111 N. Dunlap AvenueSavoy, IL 61874United States of AmericaPhone: +1 217 356 3182Fax: +1 217 398 4119Email: [email protected]: http://www.uniag.sk/~slpk/upi/dasci.html
Food Technology
Institute of Food Technologists221 N. La Salle St. Ste. 300, Chicago, Il. 60601United States of AmericaPhone: +1 31 27 82 84 24Fax: +1 31 27 82 83 48Email: [email protected]: http://www.ift.org/

Cleaner Production Assessment in Dairy Processing
Page 92
Organisations
UNEP DTIE
United Nations Environment ProgrammeDivision of Technology, Industry and Economics39-43, Quai André CitroënF-75739 Paris Cedex 15FrancePhone: +33 1 44 37 14 50Fax: +33 1 44 37 14 74Email: [email protected]: http://www.uneptie.org
This organisation publishes a number of useful resources, including theUNEP Technical Report Series, Cleaner Production and environmentalmanagement training packages and UNEP periodicals such as UNEPIndustry and Environment Review. It also maintains the ICPIC databasewhich contains Cleaner Production case studies (see database section).
UNEP Cleaner Production Working Group for the Food Industry
Environmental Management CentreThe University of QueenslandBrisbane, QLD 4072AustraliaPhone: +61 7 33 65 15 94Fax: +61 7 33 65 60 83Email: [email protected]: http://www.geosp.uq.edu.au/emc/CP/default.HTM
The aim of the group is to promote Cleaner Production in the foodindustry. The group’s activities include maintaining a network of foodindustry and Cleaner Production experts, maintaining a library anddatabase of information related to Cleaner Production in the foodindustry, delivering workshops and seminars and producing a newsletter.
United Nations Industrial Development Organization (UNIDO)
Vienna International CentreP.O. Box 300A-1400 ViennaAustriaPhone: +43 1 21 13 10Fax: +43 1 23 21 56E-mail: [email protected]: http://www.unido.org/doc/f50135.htmls
UNIDO provides seminars, conferences, workshops, media coverage,demonstration projects, training and information dissemination. It alsooffers support in establishing National Cleaner Production Centres.Fifteen such centres had been set up by October 1998, with severalmore on the way.
Information manuals available from UNIDO include the UNEP/UNIDOAudit and Reduction Manual for Industrial Emissions and Wastes andUNIDO’s DESIRE kit (Demonstration in Small Industries for ReducingWastes). In addition, nine of the National Cleaner Production Centreshave their own country-specific manuals. UNIDO has also prepared

Annex 3 Further Information
Page 93
seven manuals specific to particular industry sub-sectors and hascontributed to 26 UNEP Technical Reports on specific CleanerProduction options. All these publications can be obtained throughUNIDO.
International Dairy Federation (IDF)
41 Square Vergote1030 BrusselsBelgiumPhone: +322 733 9888Fax: +322 733 0413Email: [email protected]: http://www.fil-idf.org/Welcome.html
IDF is the dairy sector's international organisation that arranges eachyear a number of specialised events on all aspect related to the dairyindustry. It also regularly publishes the Bulletin of the IDF, books andstandard methods of analysis. Of special relevance is the IDF StandingCommittee on the Environment, which deals with environmental issuesconcerning the dairy sector. The Committee’s focus up to now has beenon the control of water and waste water. IDF has member countriesthroughout the world. Contact can be made through the headquartersoffice in Brussels.
Food and Agriculture Organization of the UN (FAO)
Via delle Terme di Caracalla00100 RomeItalyPhone: +39 0657051Fax: +39 0657053152Website: http://www.fao.org/
FAO’s aim is to raise levels of nutrition and standards of living, toimprove agricultural productivity, and to better the condition of ruralpopulations. It is active in the areas of land and water development,plant and animal production, forestry, fisheries, economic and socialpolicy, investment, nutrition, food standards and commodities and trade.
It provides regular and comprehensive statistics on world foodproduction and also commissions projects and publications related to theenvironmental sustainability of food production.

Cleaner Production Assessment in Dairy Processing
Page 94
Cleaner Production on the web
UNEP International Cleaner Production Information Clearinghouse (ICPIC)
ICPIC is a Cleaner Production database containing case studies,publication abstracts, lists of expert organisations, and information onthe resources available from UNEP DTIE. It is an electronic reference toolthat is searchable by key word.
The database can be accessed via the internet at the site indicatedbelow. A CD–ROM version of the database can also be ordered throughthe same website.
UNEP, Division of Technology, Industry and Economics39–43, Quai André CitroënF–75739 Paris Cedex 15FrancePhone: +33 1 44 37 14 50Fax: +33 1 44 37 14 74Email: [email protected]: http://www.unepie.org/Cp2/info_sources/icpic_data.html
US EPA Enviro$en$e
Enviro$en$e is a database of information provided through the UnitedStates Environmental Protection Agency's website. It providesinformation on pollution prevention, compliance and enforcement. Theinformation available includes pollution prevention case studies, pollutioncontrol technologies, environmental statutes and regulations, complianceand enforcement policies and environmental guidelines.
Website: http://es.epa.gov/
National Technology Transfer Centre, USA
At the National Technology Transfer Centre website you can search theinternet for Cleaner Production cases.
Wheeling Jesuit University316 Washington AvenueWheeling, WV 26003United States of AmericaPhone: +1 80 06 78 68 82Website: http://endeavor.nttc.edu/
EnviroNET Australia
The EnviroNET Australia website contains a wide range of CleanerProduction case studies from Australia.
Environment AustraliaEnvironment Protection Group40 Blackall StreetBarton ACT 2600AustraliaPhone: +61 2 62 74 17 81Fax: +61 2 62 74 16 40Email: [email protected]: http://www.erin.gov.au/net/environet.html

Annex 4 About UNEP DTIE
Page 95
ANNEX 4 ABOUT UNEP DTIEThe mission of United Nations Environment Programme is to provideleadership and encourage partnership in caring for the environment byinspiring, informing, and enabling nations and peoples to improve theirquality of life without compromising that of future generations.
The activities of UNEP DTIE, located in Paris, focus on raisingawareness, improving the transfer of information, building capacity,fostering technology transfer, improving understanding of theenvironmental impacts of trade issues, promoting integration ofenvironmental considerations into economic policies, and promotingglobal chemical safety. The division is composed of one centre and fourunits, as described below.
The International Environmental Technology Centre (Osaka) promotesthe adoption and use of environmentally sound technologies with afocus on the environmental management of cities and freshwater basinsin developing countries and countries with economies in transition.
The Production and Consumption Unit (Paris) fosters the development ofcleaner and safer production and consumption patterns that lead toincreased efficiency in the use of natural resources and reductions inpollution.
The Chemicals Unit (Geneva) promotes sustainable development bycatalysing global actions and building national capacities for the soundmanagement of chemicals and the improvement of chemical safetyworldwide, with a priority on Persistent Organic Pollutants (POPs) andPrior Informed Consent (PIC, jointly with FAO).
The Energy and OzonAction Unit (Paris) supports the phase-out ofozone-depleting substances in developing countries and countries witheconomies in transition, and promotes good management practices anduse of energy, with a focus on atmospheric impacts. The UNEP/RISØCollaborating Centre on Energy and Environment supports the work ofthis unit.
The Economics and Trade Unit (Geneva) promotes the use andapplication of assessment and incentive tools for environmental policyand helps improve the understanding of linkages between trade andenvironment and the role of financial institutions in promotingsustainable development.
For more information contact:
UNEP, Division of Technology, Industry and Economics39–43, Quai André CitroënF–75739 Paris Cedex 15FrancePhone: +33 1 44 37 14 50Fax: +33 1 44 37 14 74Email: [email protected]: http://www.uneptie.org