Clean Rivers Clean Lake -- Permeable Surfacing Lessons and Strategies
Upload
sweet-waterCategory
view
219download
0
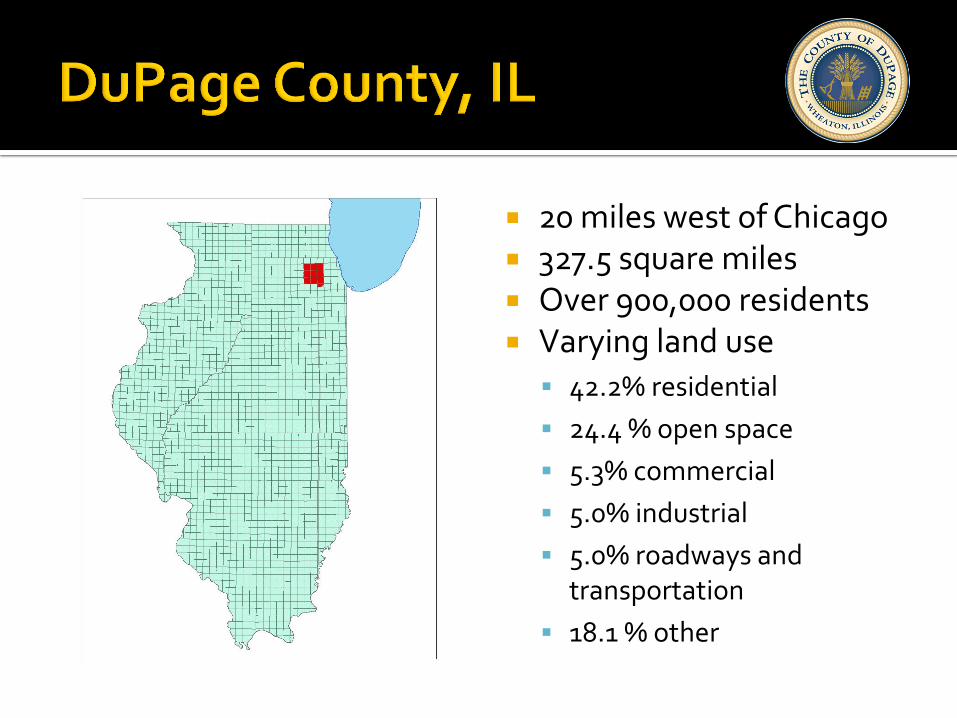
20 miles west of Chicago 327.5 square miles Over 900,000 residents Varying land use
42.2% residential
24.4 % open space
5.3% commercial
5.0% industrial
5.0% roadways and transportation
18.1 % other
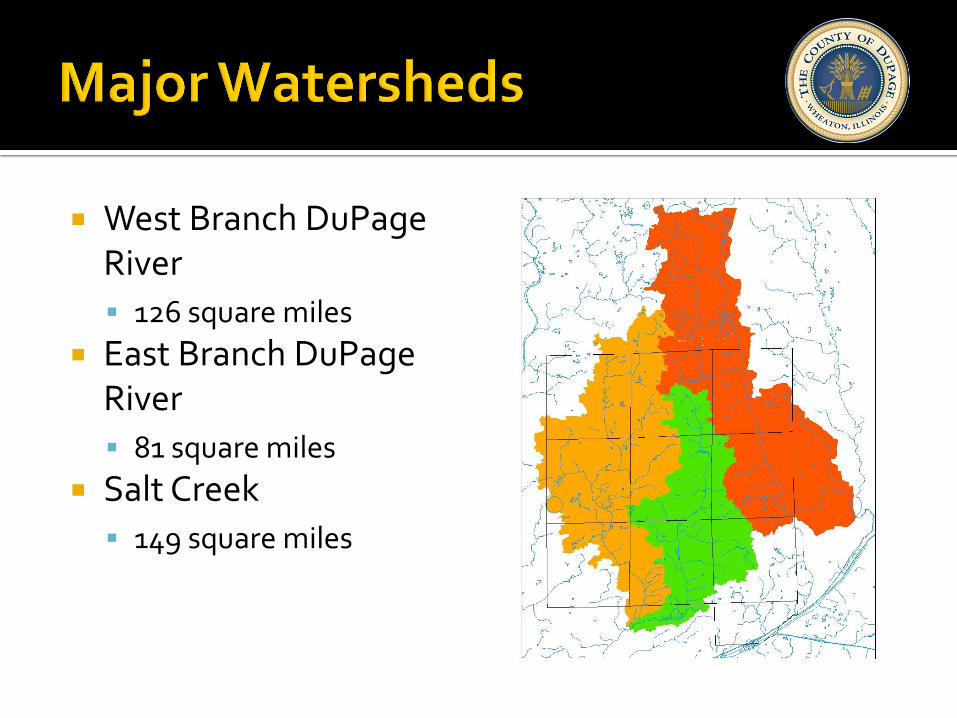
West Branch DuPage River
126 square miles
East Branch DuPage River
81 square miles
Salt Creek
149 square miles
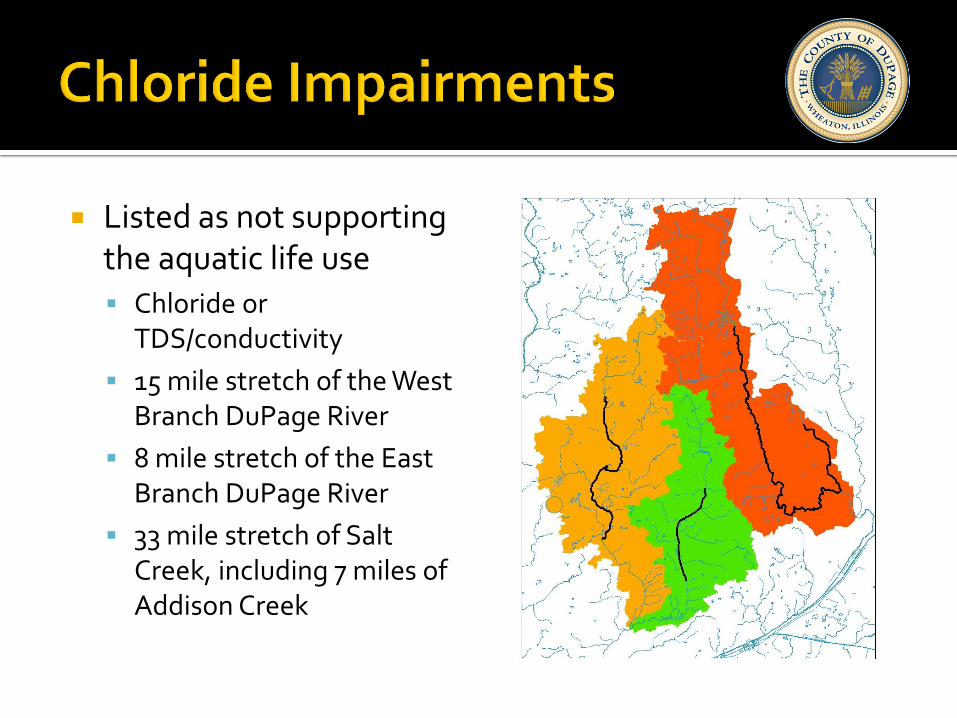
Listed as not supporting the aquatic life use
Chloride or TDS/conductivity
15 mile stretch of the West Branch DuPage River
8 mile stretch of the East Branch DuPage River
33 mile stretch of Salt Creek, including 7 miles of Addison Creek
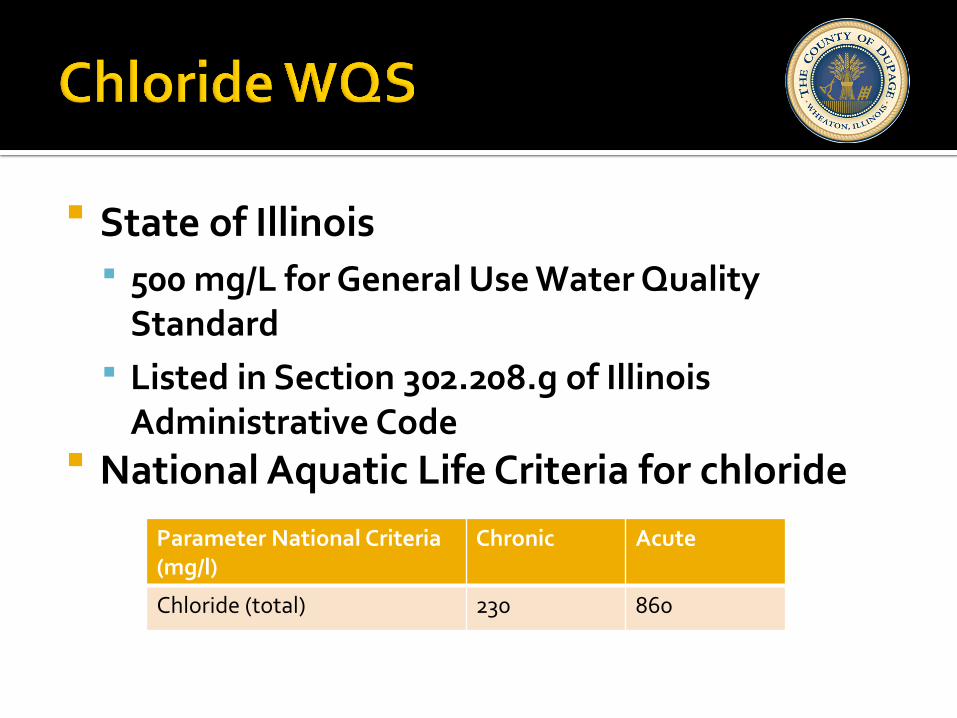
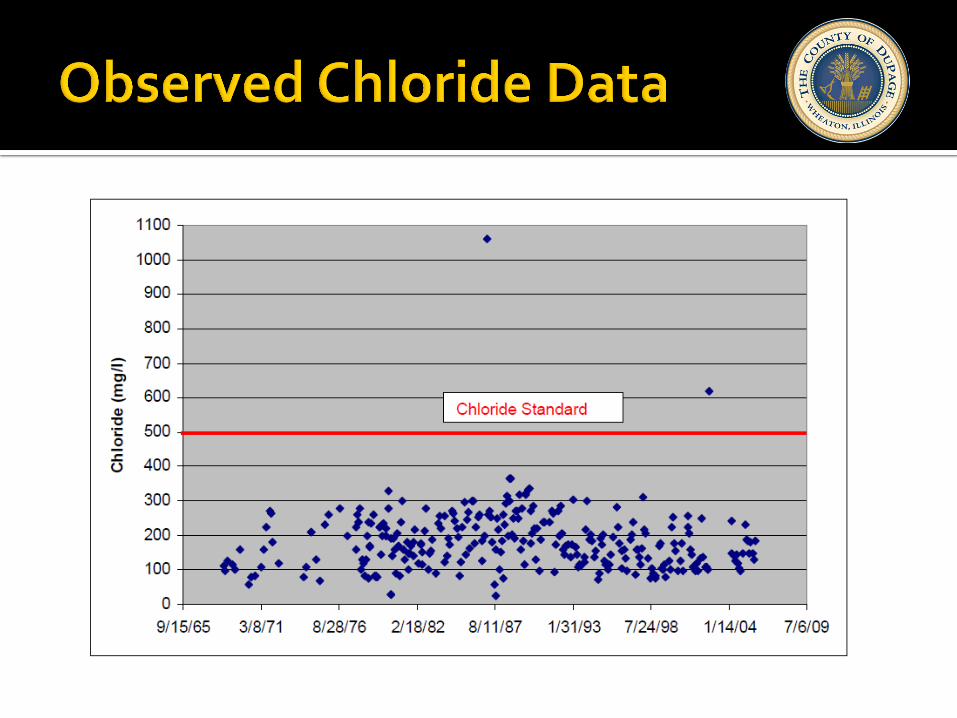
State of Illinois 500 mg/L for General Use Water Quality
Standard
Listed in Section 302.208.g of Illinois Administrative Code
National Aquatic Life Criteria for chloride Parameter National Criteria
(mg/l) Chronic Acute
Chloride (total) 230 860
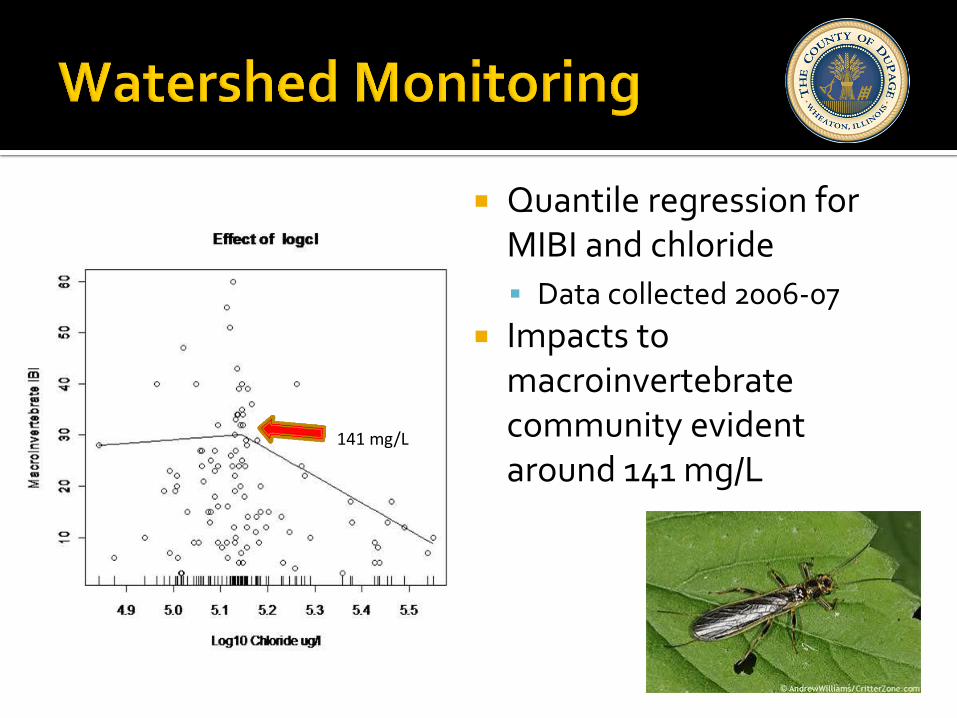
Quantile regression for MIBI and chloride
Data collected 2006-07
Impacts to macroinvertebrate community evident around 141 mg/L
141 mg/L

0
200
400
600
800
1000
1200
10/14 11/3 11/23 12/13 1/2 1/22 2/11 3/3
Ch
lori
de
Co
nce
ntr
atio
n (
mg
/L)
Date
Winter 2007-08
Winter 2008-09
Winter 2009-10
500 mg/L Chloride Standard
0
50
100
150
200
250
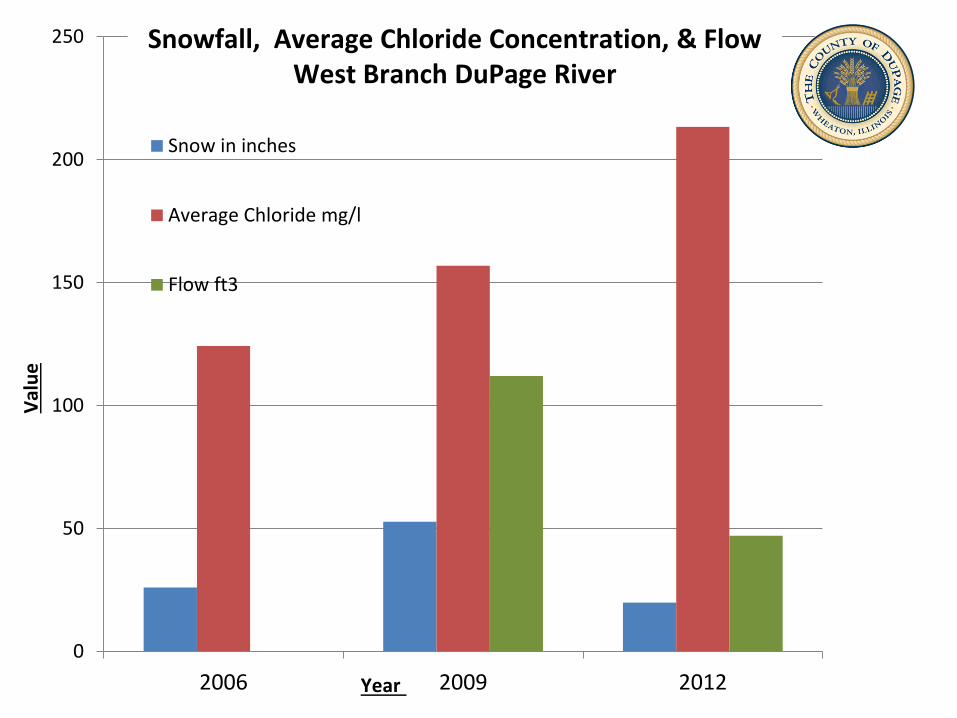
2006 2009 2012
Snow in inches
Average Chloride mg/l
Flow ft3
Val
ue
Snowfall, Average Chloride Concentration, & Flow West Branch DuPage River
Year
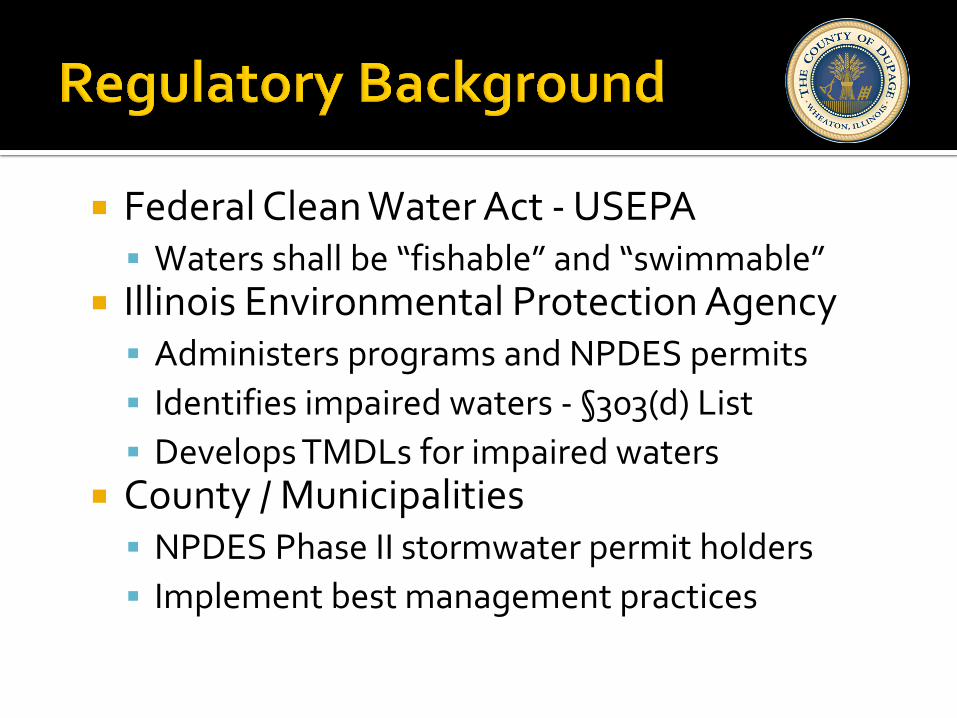
Federal Clean Water Act - USEPA Waters shall be “fishable” and “swimmable”
Illinois Environmental Protection Agency Administers programs and NPDES permits
Identifies impaired waters - §303(d) List
Develops TMDLs for impaired waters County / Municipalities
NPDES Phase II stormwater permit holders
Implement best management practices
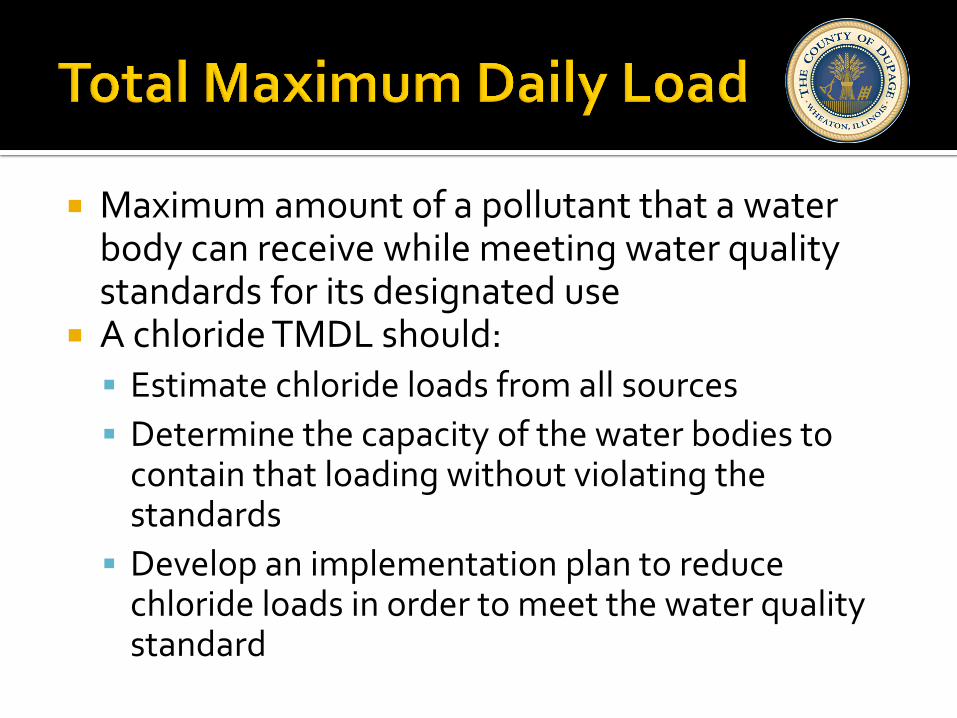
Maximum amount of a pollutant that a water body can receive while meeting water quality standards for its designated use
A chloride TMDL should: Estimate chloride loads from all sources
Determine the capacity of the water bodies to contain that loading without violating the standards
Develop an implementation plan to reduce chloride loads in order to meet the water quality standard
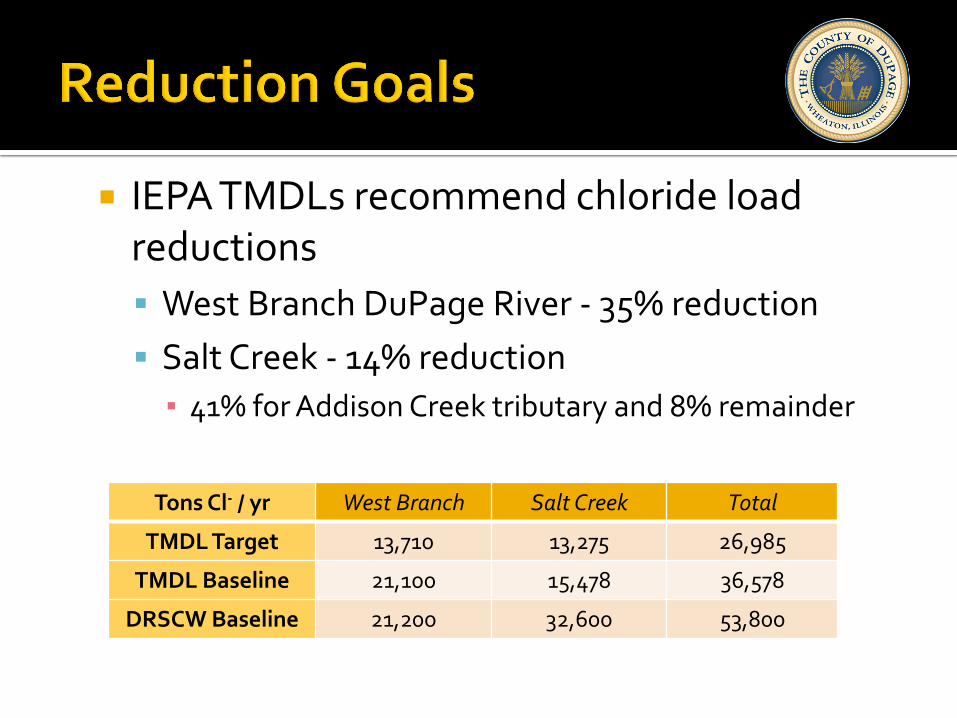
IEPA TMDLs recommend chloride load reductions
West Branch DuPage River - 35% reduction
Salt Creek - 14% reduction
▪ 41% for Addison Creek tributary and 8% remainder
Tons Cl- / yr West Branch Salt Creek Total
TMDL Target 13,710 13,275 26,985
TMDL Baseline 21,100 15,478 36,578
DRSCW Baseline 21,200 32,600 53,800
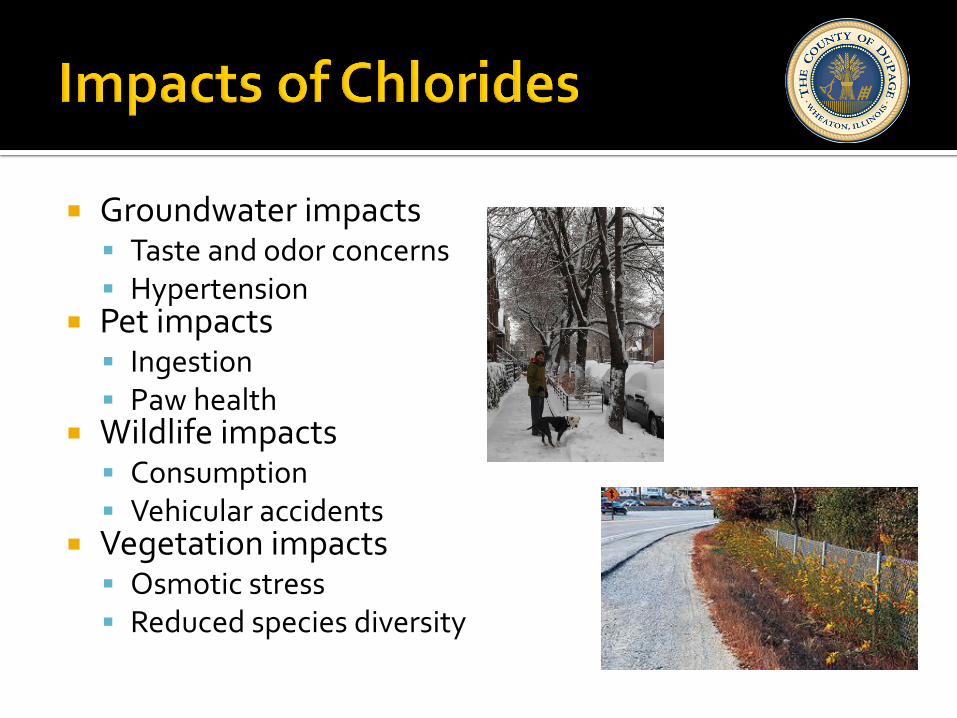
Groundwater impacts Taste and odor concerns Hypertension
Pet impacts Ingestion Paw health
Wildlife impacts Consumption Vehicular accidents
Vegetation impacts Osmotic stress Reduced species diversity
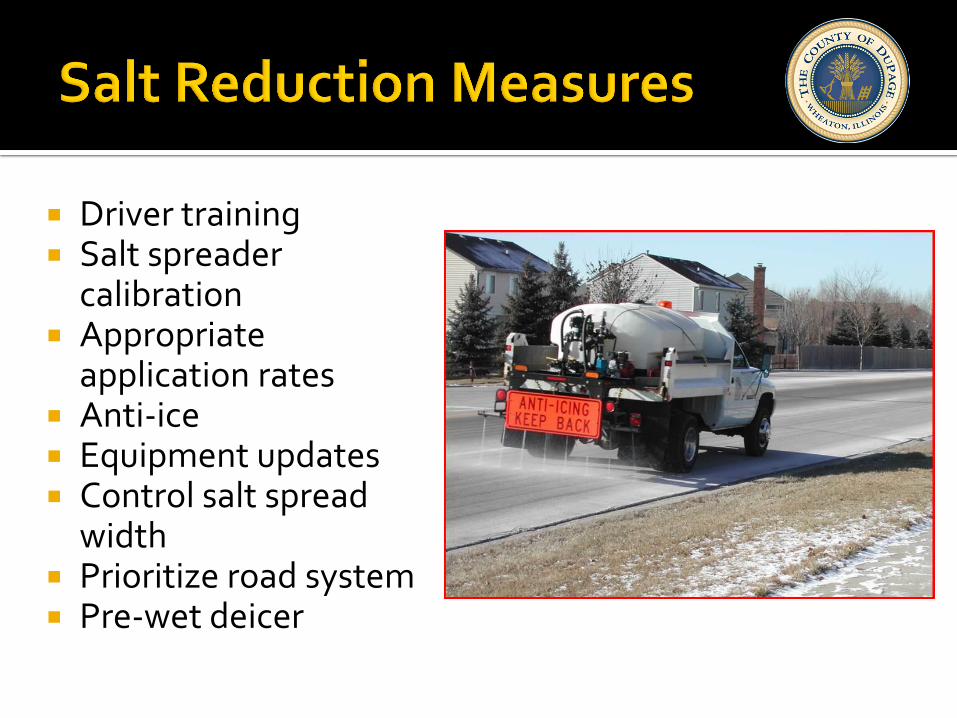
Driver training Salt spreader
calibration Appropriate
application rates Anti-ice Equipment updates Control salt spread
width Prioritize road system Pre-wet deicer
0.0%
10.0%
20.0%
30.0%
40.0%
50.0%
60.0%
70.0%
80.0%
90.0%
± 0' - 4' ± 4' - 8' ± 8' - 12' ± 12' - 24'
Untreated
Treated
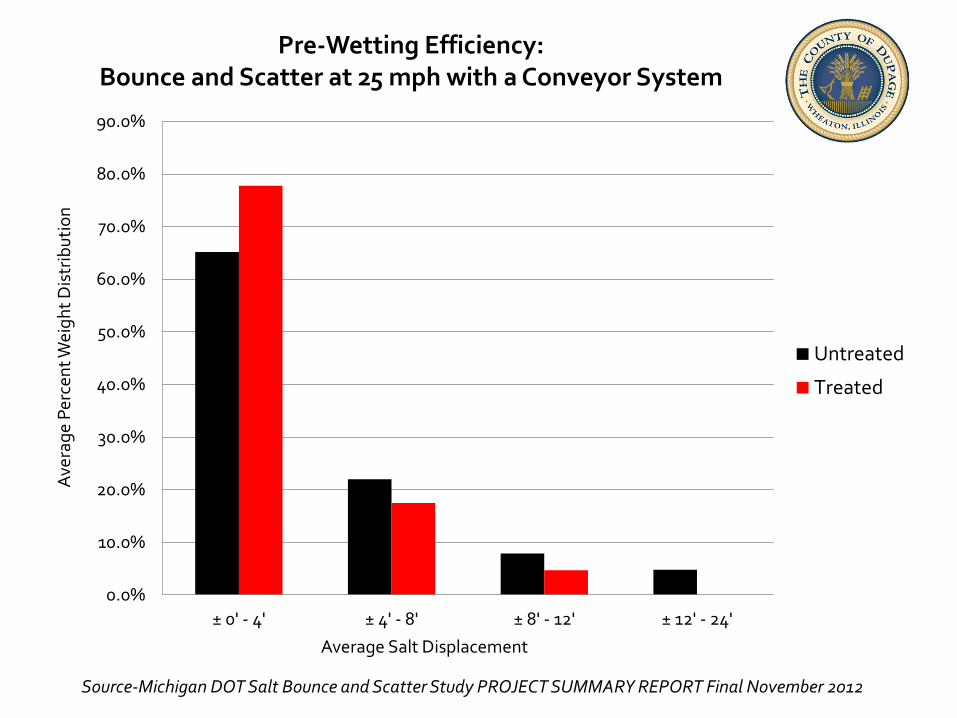
Source-Michigan DOT Salt Bounce and Scatter Study PROJECT SUMMARY REPORT Final November 2012
Ave
rag
e P
erce
nt W
eig
ht
Dis
trib
uti
on
Average Salt Displacement
Pre-Wetting Efficiency: Bounce and Scatter at 25 mph with a Conveyor System
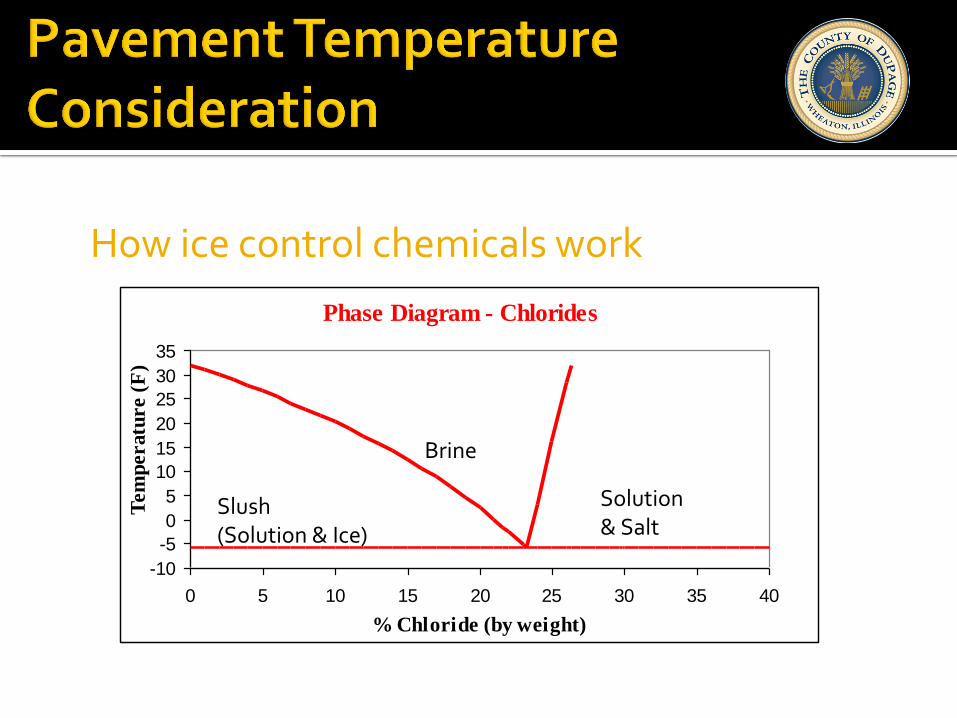
How ice control chemicals work
Phase Diagram - Chlorides
-10
-5
0
5
10
15
20
25
30
35
0 5 10 15 20 25 30 35 40
% Chloride (by weight)
Tem
peratu
re (
F)
Brine
Slush (Solution & Ice)
Solution & Salt
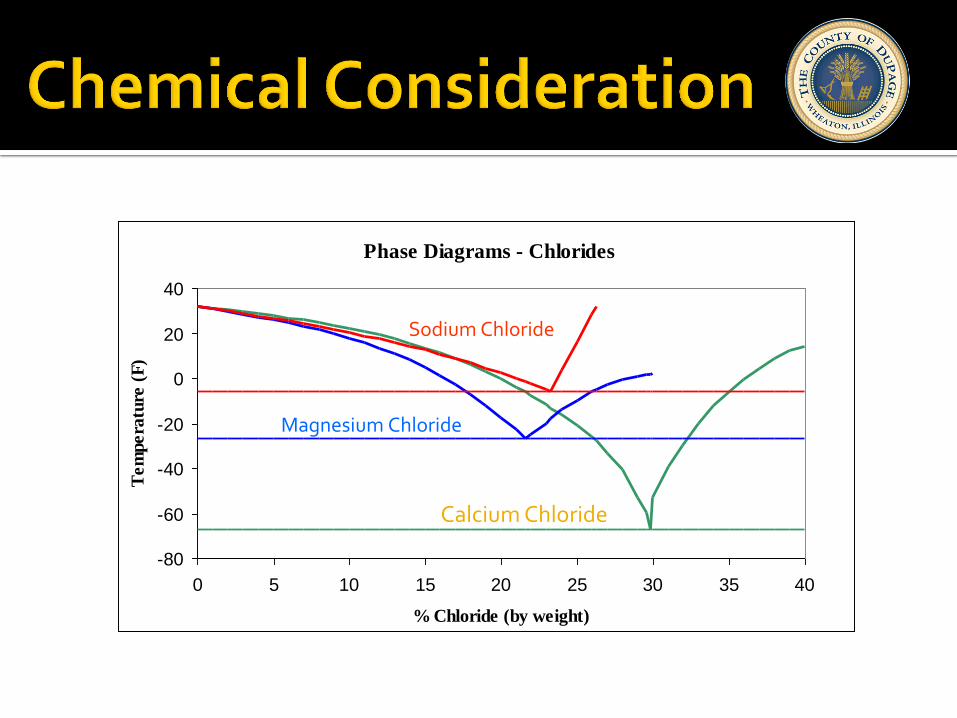
Phase Diagrams - Chlorides
-80
-60
-40
-20
0
20
40
0 5 10 15 20 25 30 35 40
% Chloride (by weight)
Tem
pera
ture
(F
)
Sodium Chloride
Magnesium Chloride
Calcium Chloride
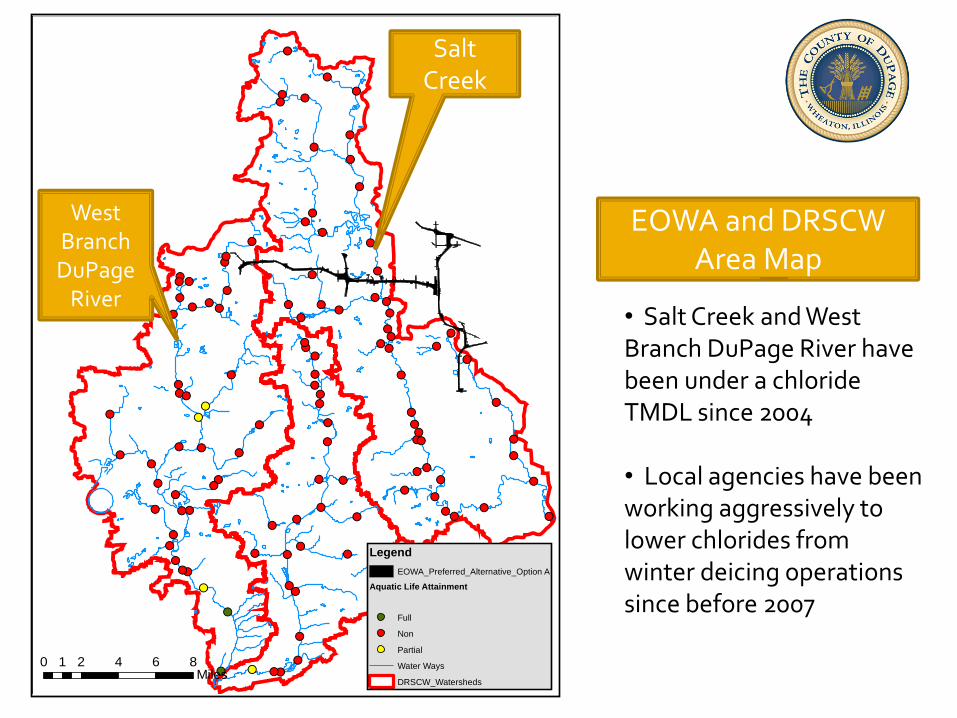
Salt Creek
West Branch DuPage
River
• Salt Creek and West Branch DuPage River have been under a chloride TMDL since 2004 • Local agencies have been working aggressively to lower chlorides from winter deicing operations since before 2007 ¯
0 2 4 6 81Miles
EOWA and DRSCW Area Map
Legend
EOWA_Preferred_Alternative_Option A
Aquatic Life Attainment
Full
Non
Partial
Water Ways
DRSCW_Watersheds
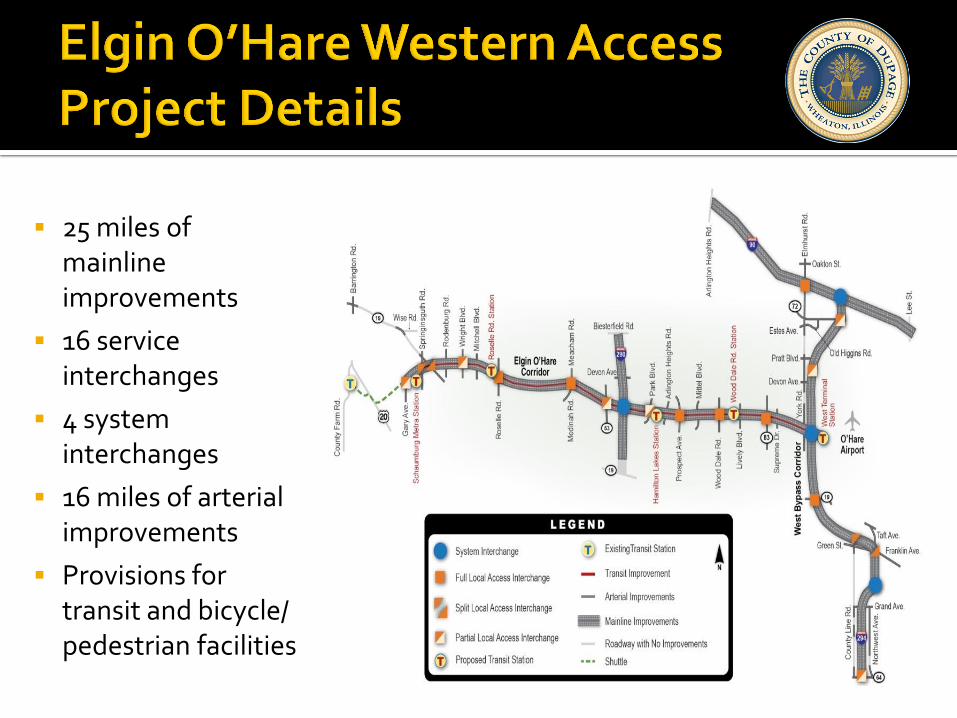
25 miles of mainline improvements
16 service interchanges
4 system interchanges
16 miles of arterial improvements
Provisions for transit and bicycle/ pedestrian facilities
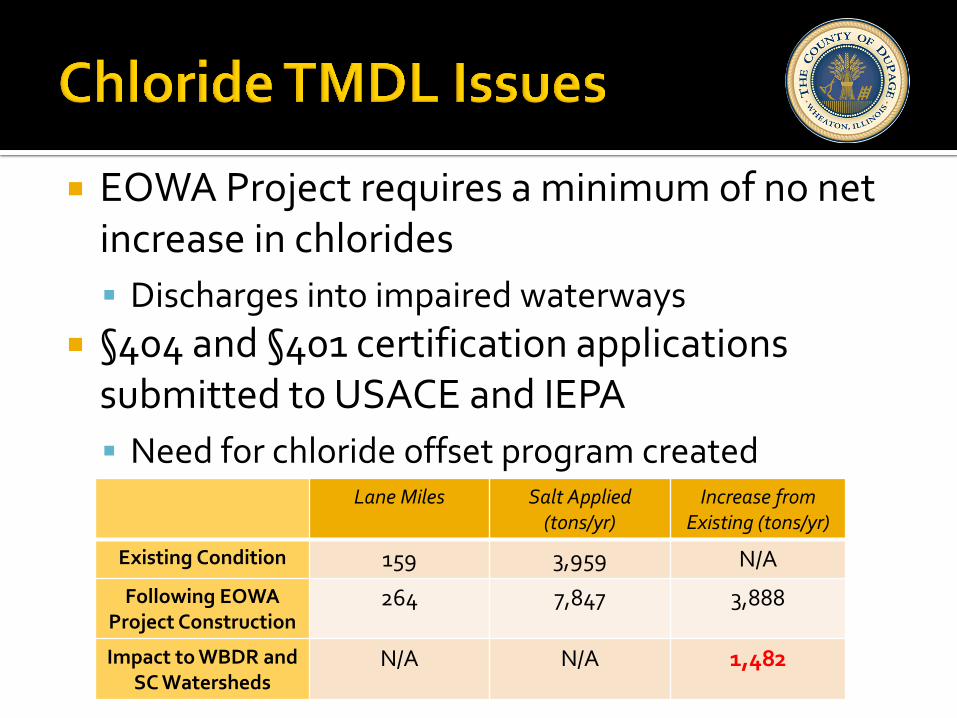
EOWA Project requires a minimum of no net increase in chlorides
Discharges into impaired waterways
§404 and §401 certification applications submitted to USACE and IEPA
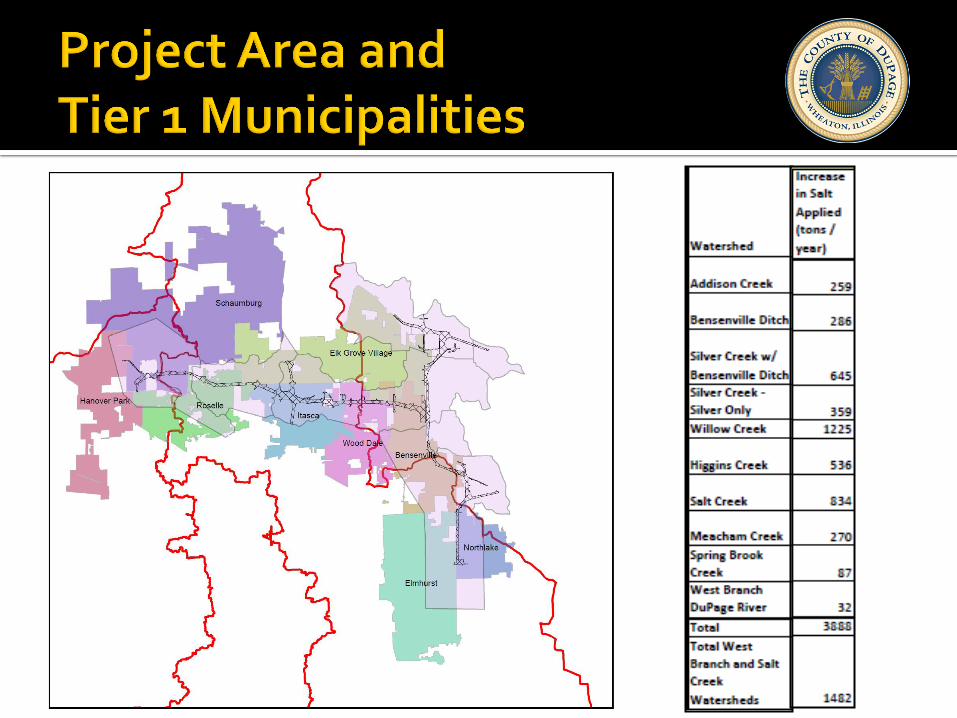
Need for chloride offset program created Lane Miles Salt Applied
(tons/yr) Increase from
Existing (tons/yr)
Existing Condition 159 3,959 N/A
Following EOWA Project Construction
264 7,847 3,888
Impact to WBDR and SC Watersheds
N/A N/A 1,482
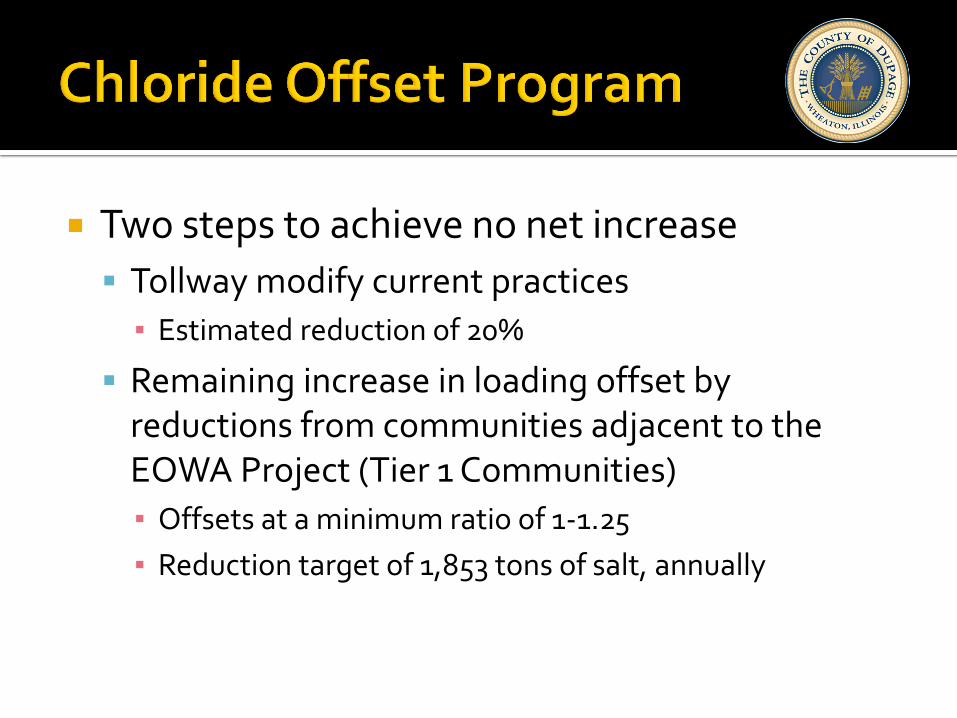
Two steps to achieve no net increase
Tollway modify current practices
▪ Estimated reduction of 20%
Remaining increase in loading offset by reductions from communities adjacent to the EOWA Project (Tier 1 Communities)
▪ Offsets at a minimum ratio of 1-1.25
▪ Reduction target of 1,853 tons of salt, annually
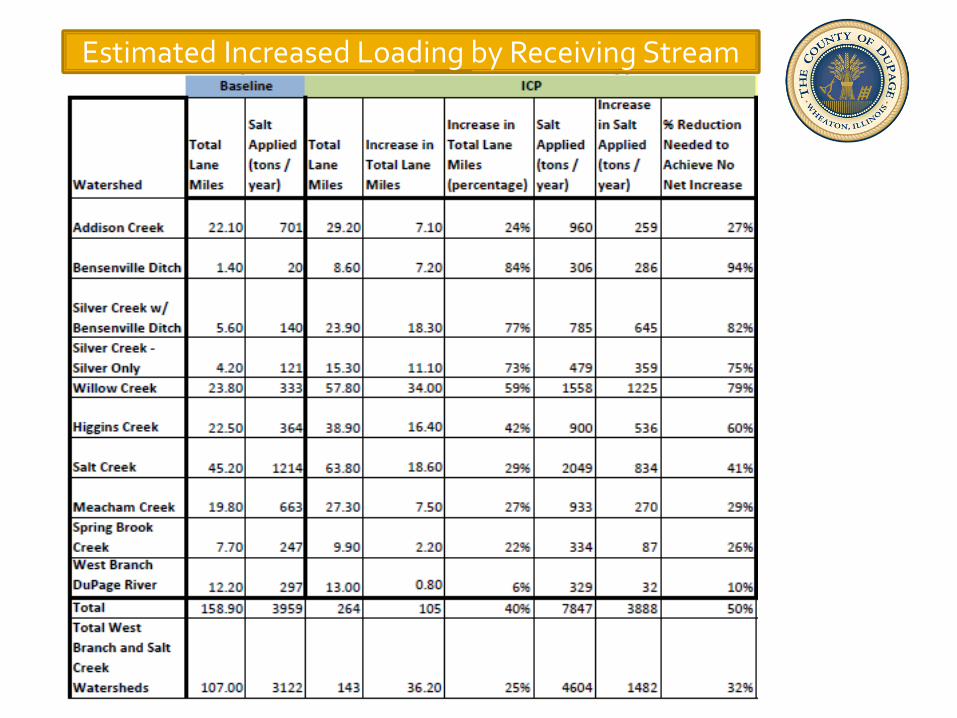
Estimated Increased Loading by Receiving Stream
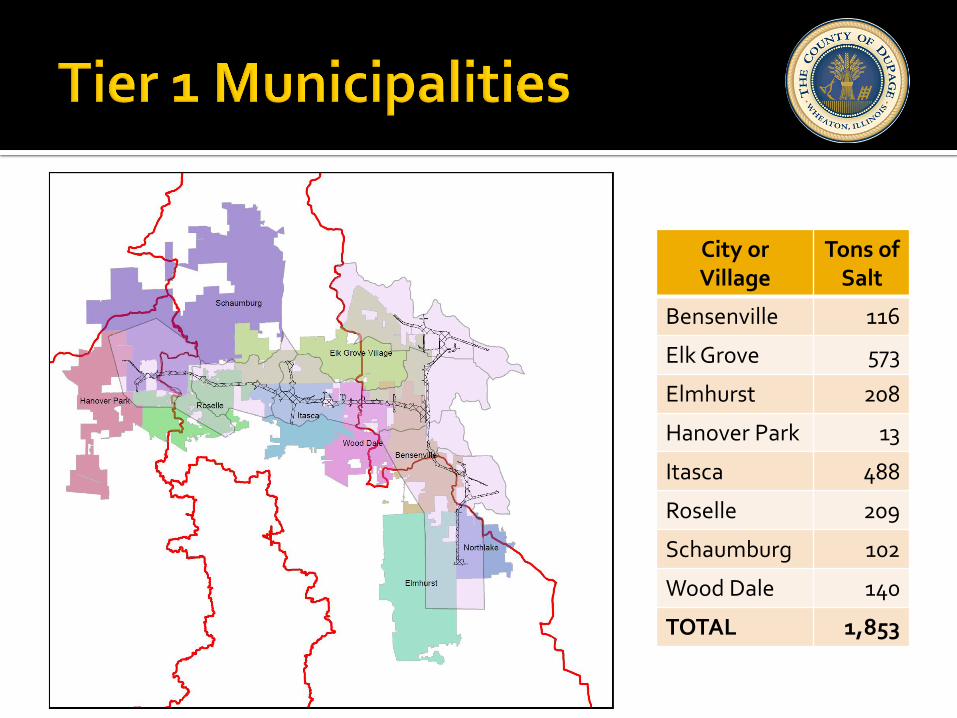
City or Village
Tons of Salt
Bensenville 116
Elk Grove 573
Elmhurst 208
Hanover Park 13
Itasca 488
Roselle 209
Schaumburg 102
Wood Dale 140
TOTAL 1,853

Analyze existing conditions, existing deicing practices, and planned highway improvements
Adopt salt reduction strategies Enhanced training, improved materials use, and
equipment upgrades Document salt application rates (per lane
mile), application totals, and calibration logs Conduct long term monitoring
Documents salt usage and stream conditions
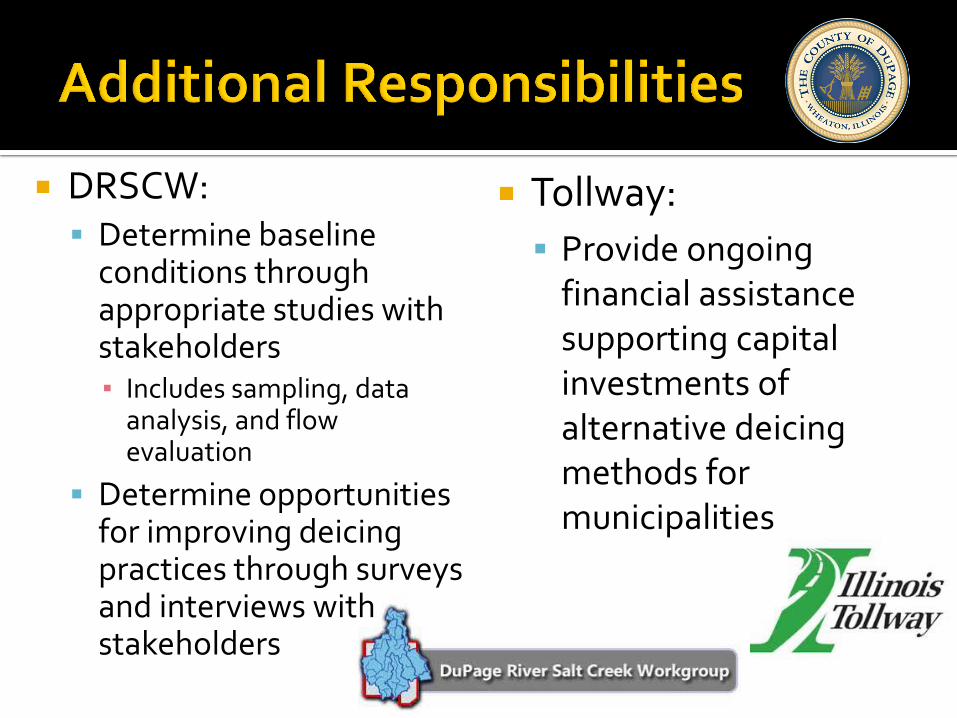
Tollway:
Provide ongoing financial assistance supporting capital investments of alternative deicing methods for municipalities
DRSCW: Determine baseline
conditions through appropriate studies with stakeholders ▪ Includes sampling, data
analysis, and flow evaluation
Determine opportunities for improving deicing practices through surveys and interviews with stakeholders

Set priorities, track offset progress, and establish a timeframe for achievement with concurrence from IEPA
Establish training and certifications for operators that enhance awareness of best practices for snow and ice management
Report, to IEPA on an annual basis, the resulting efforts and success of the program Success measured primarily by application rate
and totals reported
Consideration given to ambient monitoring
EOWA Project estimated to increase salt application in the West Branch DuPage River and Salt Creek watersheds by 1,482 tons, annually
Equal to 1,853 tons when 1.25 safety factor considered
Reduction potential of 8,372 tons per year
Assumes application rate of 14 tons/lane mile/year
Reduction attributed to pre-wetting is 25%
▪ 5,233 tons/year
Reduction attributed to anti-icing is 15%
▪ 3,140 tons/year

[email protected] 630.407.6720