
CLEAN DEVELOPMENT MECHANISM PROJECT DESIGN DOCUMENT … Ganga Hydro Power... · CLEAN DEVELOPMENT...
51
PROJECT DESIGN DOCUMENT FORM (CDM-SSC-PDD) - Version 03 CDM – Executive Board 1 CLEAN DEVELOPMENT MECHANISM PROJECT DESIGN DOCUMENT FORM (CDM-SSC-PDD) Version 03 - in effect as of: 22 December 2006 CONTENTS A. General description of the small scale project activity B. Application of a baseline and monitoring methodology C. Duration of the project activity / crediting period D. Environmental impacts E. Stakeholders’ comments Annexes Annex 1: Contact information on participants in the proposed small scale project activity Annex 2: Information regarding public funding Annex 3: Baseline information Annex 4: Monitoring Information
Transcript of CLEAN DEVELOPMENT MECHANISM PROJECT DESIGN DOCUMENT … Ganga Hydro Power... · CLEAN DEVELOPMENT...

PROJECT DESIGN DOCUMENT FORM (CDM-SSC-PDD) - Version 03 CDM – Executive Board
1
CLEAN DEVELOPMENT MECHANISM PROJECT DESIGN DOCUMENT FORM (CDM-SSC-PDD)
Version 03 - in effect as of: 22 December 2006
CONTENTS A. General description of the small scale project activity B. Application of a baseline and monitoring methodology C. Duration of the project activity / crediting period D. Environmental impacts E. Stakeholders’ comments
Annexes Annex 1: Contact information on participants in the proposed small scale project activity Annex 2: Information regarding public funding Annex 3: Baseline information
Annex 4: Monitoring Information

PROJECT DESIGN DOCUMENT FORM (CDM-SSC-PDD) - Version 03 CDM – Executive Board
2
Revision history of this document Version Number
Date Description and reason of revision
01 21 January 2003
Initial adoption
02 8 July 2005 • The Board agreed to revise the CDM SSC PDD to reflect guidance and clarifications provided by the Board since version 01 of this document.
• As a consequence, the guidelines for completing CDM SSC PDD have been revised accordingly to version 2. The latest version can be found at <http://cdm.unfccc.int/Reference/Documents>.
03 22 December 2006
• The Board agreed to revise the CDM project design document for small-scale activities (CDM-SSC-PDD), taking into account CDM-PDD and CDM-NM.

PROJECT DESIGN DOCUMENT FORM (CDM-SSC-PDD) - Version 03 CDM – Executive Board
3
SECTION A. General description of small-scale project activity A.1 Title of the small-scale project activity:
Title of the small scale project activity : Way Ganga hydro power project, Sri Lanka
Version of the document : 01
Date : 10/02/2007
A.2. Description of the small-scale project activity: Purpose of project activity The main purpose of the project activity is to generate electricity from the potential energy in the water
of river Wey river and export the net electricity after its auxiliary consumption to the state electric grid .
Project description
The project is a Run-of-river mini hydro project of 8.4 MW output capacity. The project utilizes water of
the Way Ganga in the Ratnapura District. A weir of 40 metres length with a maximum height of 4.9
metres has been constructed across the river at Kahawatta to create a head-pond from where, water is
taken through an Intake conduit of 4 metres x 3.4m x 2.8 m. Water is then taken through a channel of
3,700 metres and an aqueduct of 319 meters to a Forebay from where water flows through 3 Penstock
Intake gates into the power house causing a head of 61 meters. Each penstock leads to a horizontal shaft
Francis type turbine in the Power house. Three turbines are employed in the project. Each turbine is
connected to a Synchronous Generator of output capacity of 2.8 MW for a total output capacity of 8.4
MW. The electricity is generated at 6.3 KV, which is stepped up to 33 KV through 3 nos. 3150 kVA
Transformers. The stepped up electricity is connected to the grid of the state electric utility, Ceylon
Electric Board (CEB). The exported energy is transmitted through a 33 KV line for a distance of 6
kilometres to Nivithigala – Ratnapura 33 KV line.
The electricity required for auxiliary requirements is consumed by stepping down the generated
electricity through a 150 KVA transformer. The net electricity is exported to the CEB grid.
A standby diesel generator (DG) of 10 KVA is provided to supply electricity for lighting and other
domestic uses of the project activity when both the sources of electricity supply namely, electricity from
the project activity and the CEB grid are not available. The standby generator would be used quite

PROJECT DESIGN DOCUMENT FORM (CDM-SSC-PDD) - Version 03 CDM – Executive Board
4
sparingly because, non availability of electricity from both the sources – from the project activity and the
grid – would be a rare occurrence.
Contribution of the project activity to sustainable development in view of project participant
Contribution to sustainable development is generally measured through following attributes:
i) Social well being
ii) Economical well being
iii) Environmental well being
iv) Technological well being
i) Social well being
The social well being is assessed by contribution to improvement in living standards of the local
community. The proponents of the project activity carried out following developmental works for the
local community:
- Road chain was developed between Kahawatte and Poranuwa.
- Assistance was provided for developmental works in the Poranuwa village
- Local manpower was employed in the project activity.
- About 864,000 man hours of employment was provided during implementation of the project
activity.
ii) Economic well being
The project activity has created direct and indirect job opportunities to the local community during
construction and operation. During implementation of the project activity, several persons were provided
with job opportunities continuously for long periods. During operation of the project activity, about 14
persons are employed directly, apart from indirect employment. The project proponent have invested
SLRs. 867.64 million (US$ 7.961Million) for the project activity. This investment is quite significant in a
rural area. These activities have contributed to the economic well being of the local community.
iii) Environmental well being
The project activity produces electricity without any greenhouse gas (GHG) emissions. Additionally, the
project activity generates electricity from “renewable energy source”. The renewable energy source is
generally defined as a source of energy that gets replenished naturally and does not suffer permanent
depletion due to use.
1 1US$= SLRs.109

PROJECT DESIGN DOCUMENT FORM (CDM-SSC-PDD) - Version 03 CDM – Executive Board
5
The project activity is an environment friendly electricity generation project with no significant impact
on the environment. This is a very important contribution of the project activity for environmental well
being. Moreover, the project activity generates electricity from a renewable source of energy where the
source gets replenished and is available for use. This is another important contribution of the project
activity to the environmental well being.
Therefore, the following environmental benefits are derived from the project activity:
• Produces electricity without GHG emissions.
• Hydro power plant with no increase in volume of reservoir and no land inundation
• Produces electricity from a renewable energy source.
iv) Technological well being
The project activity improves the supply of electricity with clean, renewable hydroelectric power while
contributing to the regional/local economic development. Small-scale hydropower run-of-river plants
provide
• improved power quality for nearby areas of the grid connection;
• reduced lines losses; and
• increased system capacity with reduced transmission and distribution investment.
A.3. Project participants:
Name of Party involved (host indicates a host
Party)
Private and/or public entity (ies) project participants
(as applicable)
Kindly indicate if the Party involved wishes to be considered
as project participant (Yes/No)
Sri Lanka (Host Party)
Didul Private Limited (DPL) – Private Entity
No
A.4. Technical description of the small-scale project activity: A.4.1. Location of the small-scale project activity: A.4.1.1. Host Party(ies):
Sri Lanka
A.4.1.2. Region/State/Province etc.: Sabaragamuwa province / Ratnapura district

PROJECT DESIGN DOCUMENT FORM (CDM-SSC-PDD) - Version 03 CDM – Executive Board
6
A.4.1.3. City/Town/Community etc:
Poronuwa, Kahawatte
A.4.1.4. Details of physical location, including information allowing the unique identification of this small-scale project activity : The project activity is located at a place called Poronuwa near Kahawatte village. Kahawatte is about
166 kms from Colombo, the capital of Sri Lanka and is about 6 kms from a town called Pelmadulla,,
which is well connected to Colombo by trunk road No. A3. Colombo has an international airport and is
well connected to all parts of the world. .The location of project activity is shown in the following figure.
Sabaragabuwama
province
SRI LANKA
Project activity
Ratnapura
COLOMBO

PROJECT DESIGN DOCUMENT FORM (CDM-SSC-PDD) - Version 03 CDM – Executive Board
7
A.4.2. Type and category(ies) and technology/measure of the small-scale project activity: Since the capacity of the project activity is less than 15 MW, project activity qualifies for a small scale
CDM project activity.
Scope : 1
Sectoral Scope : Energy Industries (Renewable -Non renewable sources)
Type : I - Renewable energy projects
Category : I.D - Grid connected renewable electricity generation
The project activity is a hydropower plant and the output capacity is to generate 8.4 MW which is lesser
than 15 MW, qualifying for small scale CDM project activity. As per the provisions of Appendix B of
Simplified Modalities and Procedures for Small Scale CDM Project Activities AMS I.D, Version 10
dated 23 December, 2006, “comprises renewable energy generation units, such as photovoltaics, hydro,
tidal/wave, wind, geothermal, and renewable biomass, that supply electricity to and/or displace electricity
from an electricity distribution system that is or would have been supplied by at least one fossil fuel fired
generating unit”. The project activity comprises of hydropower plant supplying electricity to the Ceylon
Electricity Board (CEB) grid, which is being supplied by several fossil fuel generating units. With above
considerations, the Type I.D. is the most appropriate category for the project activity. The project activity
does not comprise any electricity generation from non-renewable energy sources.
Technology
The process is conversion of the potential energy, embodied in the water flowing from a higher point to a
lower point, into mechanical energy and then into electrical energy. This flowing water is guided through
a head race tunnel and penstock gate and jetted on to a turbine. This action rotates the turbine, which is
connected to a synchronous generator. The rotation of turbine causes the rotation of the generator thereby
producing electricity which after in-house auxiliary consumption is exported to grid.
The most important technology component of the project activity is the turbine and the generator.
The project activity employs horizontal Francis type turbines and brushless, synchronous generators.
Three turbines each coupled to a generator of 2.8 MW are installed in the project activity.

PROJECT DESIGN DOCUMENT FORM (CDM-SSC-PDD) - Version 03 CDM – Executive Board
8
Specification of turbine
No. of units 3
Type Horizontal shaft , Francis type
Rated head 58 metres
Operating speed 750 rpm
Design flow of one unit 5.33 m3/ sec
Installed capacity 2.8 MW
Runner Diameter of 850 mm made of stainless steel 13/4. Cr/Ni
16 runner blades
Deflectors Jet deflectors to avoid excessive pressure rise in the penstock and proper speed regulation of the unit
Other accessories Inlet valve,
Draft tube
Turbine oil governor , pressure maintained by dual pumps and pressure tank
Specification of generator No. of units 3
Type Brushless, synchronous
Duty Continuous
Shaft Continuous
Installed capacity 3000 kVA
Rated output of each unit 2.8MW
Generating voltage 6.3 kV
Power factor 0.9-1
Rated speed 750 rpm
Runaway speed 1450 rpm
Protection Over/under voltage protection
Over/under frequency protection
Over current protection
Loss of mains protection
Neutral voltage displacement protection
Inter tripping protection

PROJECT DESIGN DOCUMENT FORM (CDM-SSC-PDD) - Version 03 CDM – Executive Board
9
Specification of other components of the project Weir
Type Concrete gravity
Length 40 m
Height 4.9 m
Intake Number of openings 5
Length 1.4 m
Height 0.8 m
Intake Chamber
Size 10.5 m x 6.0 m x 1 m
Forebay tank
Length 25 m
Entry width 3.4m
Maximum width at intake 8 m
Depth at entry 1.74 m
Max depth at Intake 8 m
Penstock
No. of pipes 3
Length 464 m
Thickness 8 mm
Diameter 1500 mm
Power house
Type RCC and masonry
Size 26 m x 12 m x 10 m
Transformer – Step up for grid connection
No. of units 3
Capacity 6300 V to 33000 V
Rated power 3150 kVA
Transformer – Step down for auxiliary consumption No. of units 1
Capacity 150 kVA, 400 V

PROJECT DESIGN DOCUMENT FORM (CDM-SSC-PDD) - Version 03 CDM – Executive Board
10
The project activity produces electricity from a renewable source of electricity where there is no loss of
source and the source is completely replenished and there is very little negative impact on the
environment due to the project activity.
The technology is an established, commercially available and absolutely safe. The project activity does
not have any significant impact on air, water and land. Thus, an environmentally safe technology is
implemented in the project activity.
A.4.3 Estimated amount of emission reductions over the chosen crediting period:
S.No. Year Annual estimation of emission reductions in tonnes
of CO2e 1 2007 – 2008 17,979
2 2008 – 2009 17,979
3 2009 – 2010 17,979
4 2010– 2011 17,979
5 2011– 2012 17,979
6 2012– 2013 17,979
7 2013– 2014 17,979
Total estimated reductions (tCO2e) 125,853
Total number of crediting years 7
Annual average over the crediting period of estimated reductions (tCO2e) 17,979
A.4.4. Public funding of the small-scale project activity: There is no public funding for the project activity from Annex 1 Parties.

PROJECT DESIGN DOCUMENT FORM (CDM-SSC-PDD) - Version 03 CDM – Executive Board
11
A.4.5. Confirmation that the small-scale project activity is not a debundled component of a large scale project activity: The project proponents confirm that the proposed project activity is not a debundled component of a
larger project activity. The project activity is an independent hydro power plant generating electricity and
supplying to the grid.
The project proponents have not registered or applied to register any small scale project activity:
� in the same project category and technology/measure;
� within the previous 2 years
� whose project boundary is within 1 km of project boundary of the small scale project activity.

PROJECT DESIGN DOCUMENT FORM (CDM-SSC-PDD) - Version 03 CDM – Executive Board
12
SECTION B. Application of a baseline and monitoring methodology B.1. Title and reference of the approved baseline and monitoring methodology applied to the small-scale project activity: Title of approved baseline methodology : Grid connected renewable electricity generation
Reference : Approved small scale methodology AMS I. D. / version
10 dated 23 December 2006
Scope number : 1.
Sectoral scope : Energy industries (renewable - / non-renewable sources)
B.2 Justification of the choice of the project category: Appendix B of the simplified M&P for small-scale CDM project activities provides indicative simplified
baseline and monitoring methodologies for selected small-scale CDM project activity categories. As per
the M&P, the project activity falls under the following approved small scale methodology AMS I.D /
version 10 dated 23 December 2006 – Grid connected renewable electricity generation.
Justification of the small scale project activity as per technology/measure of AMS I. D / Version 10 dated 23 December 2006 The applicability conditions of approved baseline methodology in the context of the project activity are
given in the following table in Table B.2-1:
Technology /Measure as per AMS I.D/ Version
10 Measure of project activity
This category comprises renewable energy
generation units such as photovoltaics, hydro,
tidal/wave, wind, geothermal and biomass, that
supply electricity to and/or displace electricity
from an electricity distribution system that is or
would have been supplied by at least one fossil fuel
fired generating unit
The project activity is a renewable energy
generation unit based on hydro source. The
generated energy is supplied to CEB grid, which is
being supplied by several fossil fuel fired
generating units.
If the unit added has both renewable and non
renewable components (e.g. a wind/diesel unit), the
The unit has only renewable component and the
total output capacity of the project activity is 8.4

PROJECT DESIGN DOCUMENT FORM (CDM-SSC-PDD) - Version 03 CDM – Executive Board
13
eligibility of 15 MW for a small scale CDM project
activity applies only to the renewable component.
If the unit added co-fires fossil fuel, the capacity of
the entire unit shall not exceed 15 MW.
MW which is less than 15 MW.
The sum of all forms of energy output shall not
exceed 45 MW thermal
There is no thermal energy and the total output
capacity of the project activity is 8.4 MW.
In case of project activities that involve addition of
renewable energy generation units at an existing
renewable power generation facility, the added
capacity of the units added by the project should be
lower than 15 MW and should be physically
distinct from the existing units.
Not applicable since no addition of renewable
energy. However, the total output capacity is less
than 15 MW.
To qualify as a small scale project activity, the
total output of the modified retrofitted unit shall
not exceed the limit of 15 MW.
No retrofitting and hence not applicable. However
the total output of the project activity is less than
15 MW.
From the above table, it is evident that the project activity meets all the applicability conditions of the
approved small scale methodology AMS I.D/ Version 10 dated 23 December 2006 - Grid connected
renewable electricity generation as specified in appendix B of the simplified modalities and procedures
for small scale CDM project activities.
B.3. Description of the project boundary: Paragraph 6 of AMS I.D, mentions that, the project boundary encompasses the physical, geographical
site of the renewable generation source. For the project activity, the project boundary consists of the
following :
• Weir
• Intake
• Head race channel
• Forebay
• Penstock
• Powerhouse
• Interconnection point with the grid (within the premises of the generating station)
• Tail race channel
PROJECT DESIGN DOCUMENT FORM (CDM-SSC-PDD) - Version 03 CDM – Executive Board
14
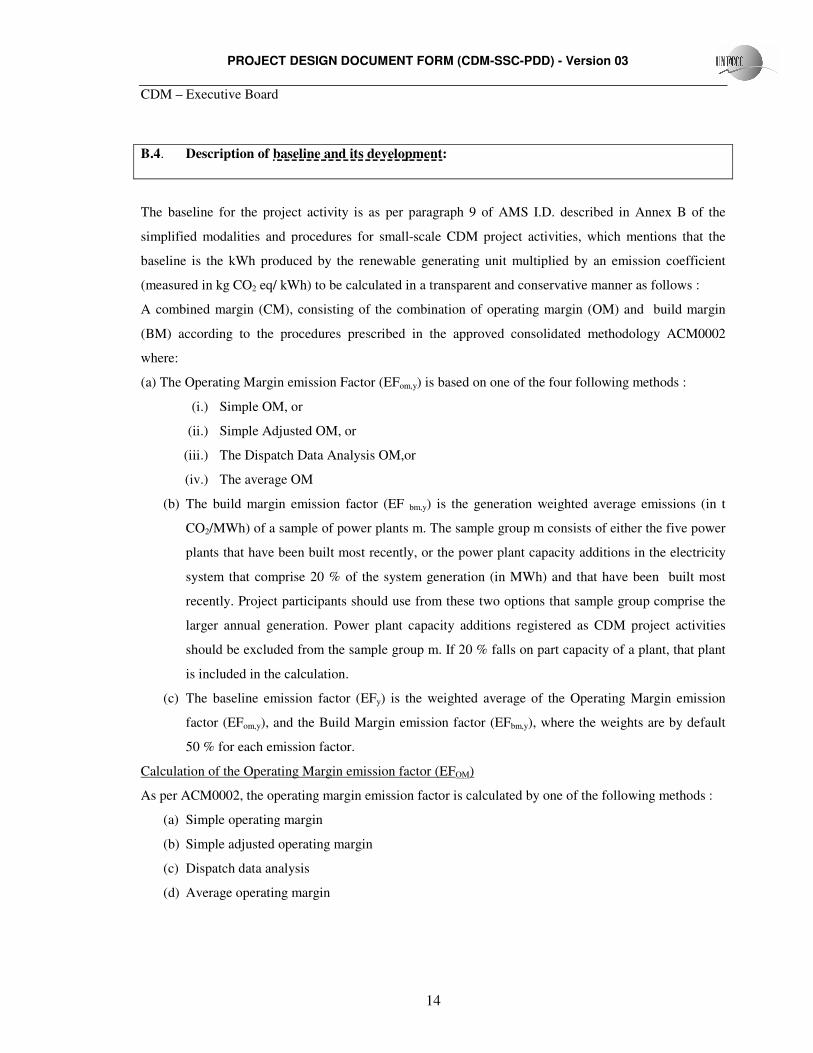
B.4. Description of baseline and its development:
The baseline for the project activity is as per paragraph 9 of AMS I.D. described in Annex B of the
simplified modalities and procedures for small-scale CDM project activities, which mentions that the
baseline is the kWh produced by the renewable generating unit multiplied by an emission coefficient
(measured in kg CO2 eq/ kWh) to be calculated in a transparent and conservative manner as follows :
A combined margin (CM), consisting of the combination of operating margin (OM) and build margin
(BM) according to the procedures prescribed in the approved consolidated methodology ACM0002
where:
(a) The Operating Margin emission Factor (EFom,y) is based on one of the four following methods :
(i.) Simple OM, or
(ii.) Simple Adjusted OM, or
(iii.) The Dispatch Data Analysis OM,or
(iv.) The average OM
(b) The build margin emission factor (EF bm,y) is the generation weighted average emissions (in t
CO2/MWh) of a sample of power plants m. The sample group m consists of either the five power
plants that have been built most recently, or the power plant capacity additions in the electricity
system that comprise 20 % of the system generation (in MWh) and that have been built most
recently. Project participants should use from these two options that sample group comprise the
larger annual generation. Power plant capacity additions registered as CDM project activities
should be excluded from the sample group m. If 20 % falls on part capacity of a plant, that plant
is included in the calculation.
(c) The baseline emission factor (EFy) is the weighted average of the Operating Margin emission
factor (EFom,y), and the Build Margin emission factor (EFbm,y), where the weights are by default
50 % for each emission factor.
Calculation of the Operating Margin emission factor (EFOM)
As per ACM0002, the operating margin emission factor is calculated by one of the following methods :
(a) Simple operating margin
(b) Simple adjusted operating margin
(c) Dispatch data analysis
(d) Average operating margin

PROJECT DESIGN DOCUMENT FORM (CDM-SSC-PDD) - Version 03 CDM – Executive Board
15
Since data required for calculation of OM as per dispatch data analysis and simple adjusted OM are not
publicly available, these methods are not adopted.
Hence, the other methods that are available are simple operating margin and average operating margin
emission method. The simple OM method has to be used where (a) low –cost / must run resources
constitute less than 50 % of total grid generation in (i) average of the five most recent years . or (ii) based
on long term normals for hydroelectricity production. The average operating margin emission rate
method has to be used only where low cost/must run resources constitute more than 50 % of total grid
generation and detailed data to apply options (b) and (c) are not available.
Hence, the share of low cost /must run resources in the grid has to be calculated for the last five years
and the average of this value has to be determined to select the method to estimate operating margin. The
table B.5-1 gives the power generation mix of low cost and other resources.
Table B.5-1 – Generation mix for the five most recent years
Power generation mix of Sri Lanka Electricity grid for the last five years - GWh Generation 2001 2002 2003 2004 2005
Total Power Generation 6,625 6,946 7,072 7,288 8,378
Total Thermal Power Generation 3,407 4,114 3,879 4,530 5,203
Total Low Cost Power Generation 3,218 2,832 3,193 2,757 3,176
Thermal % of Total grid generation 51.43 59.23 54.85 62.16 62.10
Low Cost % of Total grid generation 48.57 40.77 45.15 37.84 37.90
Average of the five most recent years of % of Low Cost generation out of Total grid generation
42.05
The average of percentage of low-cost /must run resources for the most recent 5 years as per above
data is 42.05%
Hence, simple Operating Margin option is chosen for calculation of operating margin emission factor.
The simple OM has been calculated EX-ANTE using the vintage data as the full generation-weighted
average for the most recent 3 years for which data are available at the time of PDD submission.
The build margin emission factor has been calculated based on most recent information available on
plants already built at the time of PDD submission.

PROJECT DESIGN DOCUMENT FORM (CDM-SSC-PDD) - Version 03 CDM – Executive Board
16
The baseline emission factor is determined as per approved methodology ACM 0002 and is given in
Annex 3 – Baseline information of this PDD. An excel sheet is also attached as Appendix 3 giving the
complete calculations of determination of baseline emission factor.
The baseline emission factor of the grid as per combined margin is 0.697 kg CO2 e/ kWh (0.697 ton
CO2e / MWh)
Date of completing the final draft of this baseline section (DD/MM/YYYY): 30 /01/2007 (last updated) Name of person/entity determining the baseline:
Ecoinvest Carbon S.A. 13, Rte de Florissant PO Box 518 CH-1211 Geneva 12 Switzerland Tel :+41 22-592-9121 Fax : +41 22-592-9105
The entity determining the baseline is not a project participant. B.5. Description of how the anthropogenic emissions of GHG by sources are reduced below those that would have occurred in the absence of the registered small-scale CDM project activity: Justification for additionality of the project
Simplified modalities and procedures for small scale CDM project activities guides to establish
additionality of the project activity as per Attachment A to Appendix B. The Attachment A to appendix
B mentions various barriers and requires explanation to show that the project activity would not have
occurred due to at least any one barrier.
Barrier analysis
Establishing the project activity is a voluntary step undertaken by DPL with no direct or indirect mandate
by law. The main driving forces to this ‘climate change initiative’ have been:
- GHG reduction and subsequent carbon financing against sale consideration of carbon credits.
- Rural development of the region by creating job opportunities for the local people.
- Demonstration of developing such projects to the other entrepreneurs.
However, the project had various barriers associated to project implementation. The barriers faced by the
project activity are discussed below:

PROJECT DESIGN DOCUMENT FORM (CDM-SSC-PDD) - Version 03 CDM – Executive Board
17
Investment barriers
(i) Internal Rate of Return from the Project activity
The project activity has a high capital cost . An investment analysis of the project activity was conducted
with the Internal Rate of Return as the financial indicator. ‘Internal Rate of Return’ is one of the known
financial indicators used by project developers, banks, and financial institutions for making investment
decisions.
The IRR of the project was estimated with the following project specific figures:
Table B. 5.1 - Project Cost
Parameters Value in US Dollars 2
Project development costs 0.0033 Million
Engineering, procurement and construction costs 7.86 Million
Other costs 0.1 Million
Total cost of the project 7.9633 Million
Equity investment 2.05 Million
Debt component 5.9133
Revenue from sale of electricity 1.38 Million/year (projected)
Internal rate of return of the project 8.83 %
The detailed calculations of the IRR workings are attached as Appendix 4 in an excel spread sheet. It
may be seen that IRR for the project is only 8.83 %, which is not attractive for investment in any project.
An IRR of 14 -16 % is the project proponent’s desired value for an investment. The Project proponent’s
lowest expected returns are 14 %. However DPL went ahead with the implementation of the project
expecting to realize the revenue from the sale of CERs.
(ii) Power Purchase Tariff The power purchase tariff was fixed as SLRs. 5.85 (US$0.05) per kWh . This tariff would be revised as
per “Avoided Cost of generation” principle. Avoided cost of generation is the maximum value of
generation avoided by CEB as a result of any purchase of energy from sources outside the CEB system.
According to this, the avoided cost of a kWh of electricity comprises fuel and variable O&M costs of
generation displaced at the margin by a kWh purchased at a given instant. There is a likely chance of
PROJECT DESIGN DOCUMENT FORM (CDM-SSC-PDD) - Version 03 CDM – Executive Board
18
generation of cost coming down due to cheaper power sources. This would also reduce the power
purchase tariff of the project activity greatly reducing the returns of the project activity.
iii) Determination of power purchase tariff
The project proponents of small hydropower plants in Sri Lanka face considerable investment risk barrier
as CEB does not revise the tariff transparently and also, does not pay as per agreed SPPA. The power
purchase tariff for the electricity sold to the grid is to be revised based on “Avoided Cost of generation”
principle as explained above. The method of calculation of “avoided cost of generation” is complicated.
Also, the inputs to calculate this tariff are not publicly available and therefore, the tariff is unilaterally
calculated by CEB every year. The project proponents do not have any say in working of the tariff, which
is a very big barrier for investment in power sector in Sri Lanka.
iv) 15 % reduction in revenue
The Government of Sri Lanka decided to pay additional 15 % over the calculated tariff to small hydro
power developers with a view to encourage investment in the sector and to promote renewable energy.
The project proponent had also been granted the same incentive as embodied in the SPPA. However CEB
does not pay the additional 15 %. CEB was not paying this additional 15 % to other project developers
and this practice was known to DPL. However, they went ahead with the implementation of the project
with the risk hoping that CEB would change its practice and revise the tariff as per SPPA and
Government directive and also considering that the project activity would be eligible for CDM
incentives.
This practice of CEB not paying as per SPPA reduces revenues upto 15 %. (v) Financial closure The lending institutions in Sri Lanka were apprehensive of the project activity as they were not familiar
in financing small hydroelectric projects. The lenders were more used to thermal projects and large
hydroelectric projects due to assured returns. Moreover, the lenders in Sri Lanka rely too much on
collateral securities rather than the projected cash flows of the project activity. The project proponents
were developers of a small hydro electric projects with no big collateral security and it took considerable
time to convince the lenders on the projected returns and the environmental benefits of the project
2 1 USD = 109 Sri Lankan Rupees

PROJECT DESIGN DOCUMENT FORM (CDM-SSC-PDD) - Version 03 CDM – Executive Board
19
activity. Hence, there was delay in achieving financial closure. The lending institutions were approached
in July 2002 for financial assistance of the debt component of the project. Since the type of the project
activity was fairly new to the lending institute, they took nearly 9 months to execute the loan agreements.
This delay in financial closure delayed the implementation of the project activity. This delay also caused
a cost over run as the project proponents spent equity up front pending quick disbursements of loan
capital.
(vi) Disbursement Delays Although the loan agreement was signed in October, 2002, the disbursements started only in July, 2003.
This was due to complying with several pre-disbursement conditions which were more on collateral
security with out considering the returns and cash flows from the project activity. This delay in
disbursements had escalated the project cost. This was a big barrier for the project activity.
(vii) Increased Exchange Rate
The WayGanga Hydro Power Project finalized the supply contract with Voith Siemens Hydro of
Germany for design, supply, erection and commissioning of electro mechanical equipment in August
2002 and the exchange rate was 1 Euro = SLRs 85. As per the Letter of Credit terms, the payment had to
be effected in stages over a period of 21 months. At the time of opening the Letter of Credit in October
2003 with the down payment of 20% of the contract value, the Euro/Sri Lankan Rupees (SLRs) exchange
rate was SLRs 105.9 per Euro and within a month rose to SLRs. 124.6 /Euro. This adverse exchange
fluctuation between the time of opening the Letter of Credit and final payment resulted in a cost overrun
for electro mechanical equipment alone SRs 35 Million (US$0.343 Million)
Other Barriers for the project activity Extended approval procedure In Sri Lanka, private sector small hydro power projects need to obtain various approvals from the
government agencies after receiving the LOI from the Ceylon Electricity Board (CEB) before
commencing the construction of the project activity. Such delays caused additional cost both due to extra
expenditure and increasing material costs. The Project Report was prepared in 2001 and the approvals
were received in December 2002. During this period the construction cost had increased significantly.

PROJECT DESIGN DOCUMENT FORM (CDM-SSC-PDD) - Version 03 CDM – Executive Board
20
B.6. Emission reductions:
B.6.1. Explanation of methodological choices: As per paragraph 9 of Type I.D. described in Appendix B of the simplified modalities and procedures
for small-scale CDM project activities, the baseline is the kWh produced by the renewable generating
unit multiplied by an emission coefficient (measured in kg CO2 eq/ kWh or ton CO2eq/MWh).
Ceylon Electricity Board grid is considered for estimation of baseline emission factor.
The baseline emission factor is estimated through the average of the “approximate operating margin” and
“built margin” of the CEB grid for the most recent three years of 2003, 2004 and 2005.
Formula used for estimation of the anthropogenic emissions by sources of greenhouse gases of the
baseline is given below:
Emission Reduction by project activity
The emission reduction by the project activity is given by the following formula:
ER y = BE y - PE y - L y
(ton CO2 e/year) (ton CO2 e/year) (ton CO2 e/year) (ton CO2 e/year) Where,
ER y - Emission reduction per annum by project activity in ton CO2 e/year
BE y - Baseline emissions in ton CO2 e/year
PE y - Project emissions in ton CO2 e/year
L p - Leakage in ton of ton CO2 e/year
Baseline emissions (BE y)
The baseline emissions of the project are calculated as per following formula:
BE y = El exp * EFB
(ton CO2 e/year) (MWh /year) (ton CO2e /MWh)
Where,
BE y - Baseline emissions in ton CO2e /year
El exp - Net electricity exported to grid per annum in MWh/year
EFB - Baseline emission factor in ton CO2e /MWh

PROJECT DESIGN DOCUMENT FORM (CDM-SSC-PDD) - Version 03 CDM – Executive Board
21
Project emissions (PEy)
During non operation of the project activity, the electricity required for lighting and other miscellaneous
requirements is consumed from the CEB grid. Also, the electricity required for start up of the plant is
imported from the CEB grid. The emissions due to this imported electricity would contribute the
anthropogenic emissions by sources of GHGs due to the project activity.
These emissions due to import of electricity is given by the following formula:
PE y = El imp * EFB
(ton CO2e /yr) (MWh/year) (ton CO2e /MWh)
Where PE y is the project emissions due to electricity imported from the grid in ton CO2e/year
El imp is the electricity imported from the grid in MWh/year
EFB is the baseline emission factor of the grid in ton CO2e /MWh
Emissions due to operation of standby generator
Since the DG is very sparingly used, the emissions due to the consumption of diesel are very less. The
average running time of the standby generator had been 40 hours per year and diesel consumption had
been about 0.07 ton per year and therefore, the emissions due to consumption of diesel are negligible.
Hence, these emissions are not considered for estimation of project emissions. However, the operation
time of the DG and consumption of the diesel would be monitored and emissions due to consumption of
diesel would be accounted when these emissions contribute for 1 % of the baseline emissions.
Leakage (PL y)
As per category AMS I.D/ Version 10 dated 23 December 2006, leakage is to be considered only if the
energy generating equipment is transferred from another activity or if the existing equipment is
transferred to another activity. Since this does not apply for the project activity, there is no leakage
associated with the project activity and therefore, leakage is zero.
Emission Reductions
Therefore, emission reductions by the project activity are given by the following formula:
ER y = BE y - PE y (ton CO2 e/year) (ton CO2 e/year) (ton CO2 e/year) Where,
ER y - Emission reduction per annum by project activity in ton CO2 e/year
BE y - Baseline emissions in ton CO2 e/year
PE y - Project emissions in ton CO2 e/year

PROJECT DESIGN DOCUMENT FORM (CDM-SSC-PDD) - Version 03 CDM – Executive Board
22
B.6.2. Data and parameters that are available at validation:
Data / Parameter: P czp
Data unit: MW Description: Capacity of the project activity Source of data used: - Value applied: 8.4 MW Justification of the choice of data or description of measurement methods and procedures actually applied :
Data is to justify the choice of the project category.
Any comment: - Data / Parameter: El exp Data unit: MWh/year Description: Average net electricity exported to the grid in a year Source of data used: Monthly invoice Value applied: 25,800 Justification of the choice of data or description of measurement methods and procedures actually applied :
This data is required to estimate the baseline emissions. The electricity exported by the project activity is recorded jointly by CEB and representative of the project proponents. The monthly invoice is prepared based on the jointly certified reading. Meters would be calibrated as per CEB standards by CEB.
Any comment: Average value of electricity exported to the grid is applied. Actual values would be used to estimate baseline emissions during monitoring of the project activity.
Data / Parameter: El imp Data unit: MWh/year Description: Average electricity imported from the grid in a year Source of data used: Monthly Bills by CEB Value applied: 5 Justification of the choice of data or description of measurement methods and procedures actually applied :
This data is required to estimate the project emissions. The monthly invoice from CEB would be the basis for estimation of project emissions. Meters would be calibrated as per CEB standards.
Any comment Average value of electricity imported from the grid is applied. Actual values would be used to estimate project emissions during monitoring of the project activity.

PROJECT DESIGN DOCUMENT FORM (CDM-SSC-PDD) - Version 03 CDM – Executive Board
23
B.6.3 Ex-ante calculation of emission reductions:
Baseline emissions
The ex-ante baseline emissions of the project activity are calculated as per following formula:
BE y = El exp * EFB (ton CO2 e/year) (MWh /year) (ton CO2e /MWh) Where,
BE y - Baseline emissions in ton CO2e /year
El exp - Net electricity exported to grid per annum in MWh/year
EFB - Baseline emission factor in ton CO2e /MWh
The project activity has been supplying electricity to the grid since July 2004. The estimated net
electricity supplied to the grid is estimated based on the average net electricity exported to the grid and
design export value. The net electricity exported to the grid would be around 25,800 MWh/year.
The baseline emission factor has been estimated as described in section B.4 and Annex 3. The baseline
emission factor is estimated to be 0.697 t CO2 /MWh.
Applying these values in the formula for baseline emissions,
BE y = 25,800 * 0.697 (ton CO2 e/year) (MWh /year) (ton CO2e /MWh)
= 17,982.60 t CO2 e/year
Project emissions (PEy) The ex-ante project emissions are calculated by the following formula:
PE y = El imp * EFB
(ton CO2e /yr) (MWh/year) (ton CO2e /MWh)
Where PE y is the project emissions due to electricity imported from the grid in ton CO2e/year
El imp is the electricity imported from the grid in MWh/year
EFB is the baseline emission factor of the grid in ton CO2e /MWh
On an average, the project has been consuming about 5 MWh of electricity per year. The baseline
emission factor has been estimated as described in section B.4 and Annex 3. The baseline emission factor
is estimated to be 0.697 t CO2 /MWh.
Applying these values in the formula for project emissions,
PE y = 5 * 0.697 (ton CO2 e/year) (MWh /year) (ton CO2e /MWh)
= 3.485 t CO2e /year
PROJECT DESIGN DOCUMENT FORM (CDM-SSC-PDD) - Version 03 CDM – Executive Board
24
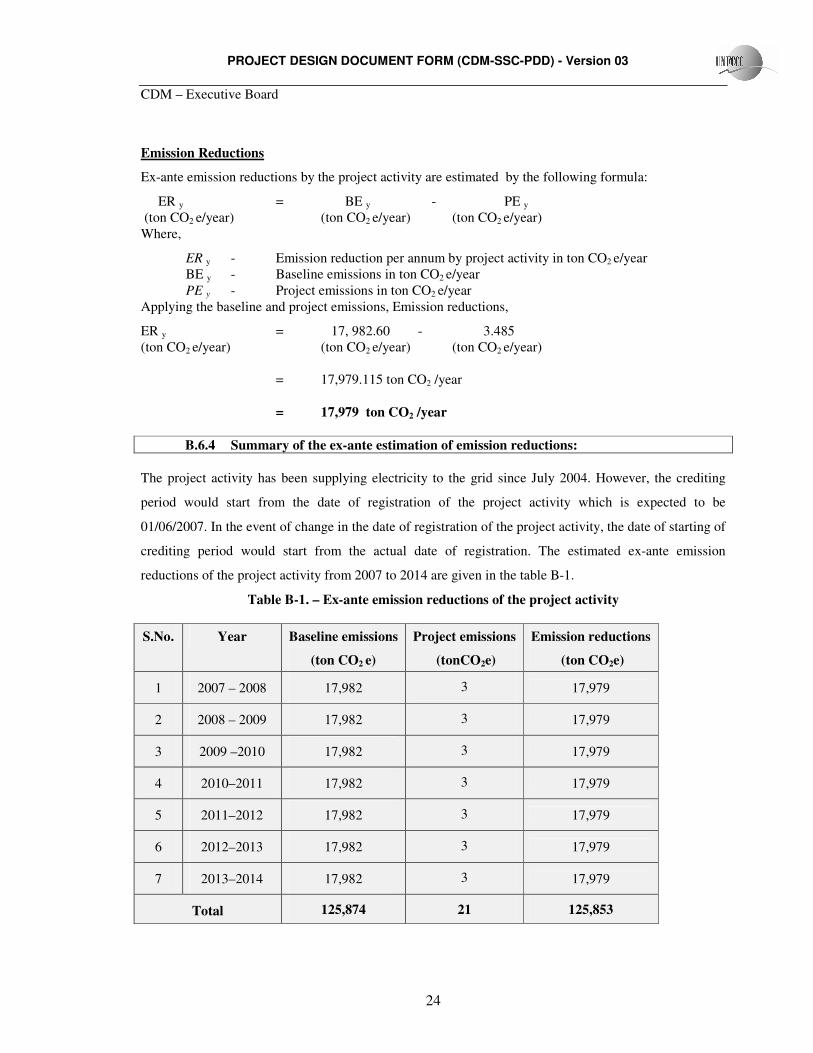
Emission Reductions
Ex-ante emission reductions by the project activity are estimated by the following formula:
ER y = BE y - PE y (ton CO2 e/year) (ton CO2 e/year) (ton CO2 e/year) Where,
ER y - Emission reduction per annum by project activity in ton CO2 e/year BE y - Baseline emissions in ton CO2 e/year PE y - Project emissions in ton CO2 e/year Applying the baseline and project emissions, Emission reductions,
ER y = 17, 982.60 - 3.485 (ton CO2 e/year) (ton CO2 e/year) (ton CO2 e/year)
= 17,979.115 ton CO2 /year = 17,979 ton CO2 /year B.6.4 Summary of the ex-ante estimation of emission reductions:
The project activity has been supplying electricity to the grid since July 2004. However, the crediting
period would start from the date of registration of the project activity which is expected to be
01/06/2007. In the event of change in the date of registration of the project activity, the date of starting of
crediting period would start from the actual date of registration. The estimated ex-ante emission
reductions of the project activity from 2007 to 2014 are given in the table B-1.
Table B-1. – Ex-ante emission reductions of the project activity
S.No. Year Baseline emissions
(ton CO2 e)
Project emissions
(tonCO2e)
Emission reductions
(ton CO2e)
1 2007 – 2008 17,982 3 17,979
2 2008 – 2009 17,982 3 17,979
3 2009 –2010 17,982 3 17,979
4 2010–2011 17,982 3 17,979
5 2011–2012 17,982 3 17,979
6 2012–2013 17,982 3 17,979
7 2013–2014 17,982 3 17,979
Total 125,874 21 125,853

PROJECT DESIGN DOCUMENT FORM (CDM-SSC-PDD) - Version 03 CDM – Executive Board
25
B.7 Application of a monitoring methodology and description of the monitoring plan:
B.7.1 Data and parameters monitored: Data / Parameter: El gross
Data unit: MWh Description: Gross electricity generated by the project activity Source of data to be used:
Generation meter in the panel board
Value of data Description of measurement methods and procedures to be applied:
Measured in the generation meter in the panel of the project activity. The data would be archived electronically for the entire crediting period and two years thereafter.
QA/QC procedures to be applied:
Meters would be calibrated as per manufacturer standards.
Any comment:
Data / Parameter: El exp
Data unit: MWh Description: Net electricity exported to the grid Source of data to be used:
Monthly invoice
Value of data Value of data would be used to calculate the baseline emissions. Description of measurement methods and procedures to be applied:
Measured in the CEB energy meter at the project boundary. The electricity exported is recorded by CEB and jointly certified by CEB and DPL. The data would be archived electronically for the entire crediting period and two years thereafter.
QA/QC procedures to be applied:
The meter is calibrated as per CEB standards.
Any comment: -
Data / Parameter: El imp
Data unit: MWh Description: Electricity imported from the grid Source of data to be used:
Monthly bill from CEB
Value of data Value of data would be used to calculate the project emissions. Description of measurement methods and procedures to be applied:
Measured in the meter by CEB for billing the project activity for the electricity imported by the project activity. This CEB bill would be used to calculate the project emissions. The data would be archived electronically for the entire crediting period and two years thereafter.
QA/QC procedures to be applied:
The meter is calibrated as per CEB standards.
Any comment:

PROJECT DESIGN DOCUMENT FORM (CDM-SSC-PDD) - Version 03 CDM – Executive Board
26
Data / Parameter: D con
Data unit: tons Description: Diesel consumed Source of data to be used:
Record of the project activity
Value of data Value of data would be used to calculate the project emissions. Description of measurement methods and procedures to be applied:
Measured by project proponents
QA/QC procedures to be applied:
-
B.7.2 Description of the monitoring plan:
The operational and management structure of the project activity is given below:
Managing Director (Colombo)
Electrical Engineer (Colombo)
Shift in Charge – 3 persons (Site)
Plant Operators – 5 persons (Site)
Dy. General Manager (Operations) (head office at
Colombo)

PROJECT DESIGN DOCUMENT FORM (CDM-SSC-PDD) - Version 03 CDM – Executive Board
27
The day today operations of the project activity are run by the Shift In charge who is in -charge of the
operations in a shift. There are three Shift In charges – one for each shift – to operate the plant. All the
Shift In charges are qualified electrical engineers and have undergone related training including plant
operations, data monitoring, report generation etc.
There are 5 plant operators to assist the Shift in charge to operate the plant.
The electricity generated by the project activity and exported to the grid would be recorded electronically
in the computer in the power plant. Apart from these, other data like Oil temperature, oil level, water
level, voltage levels etc., are monitored and recorded. The Shift in charge continuously monitors the
operating data and generation data. The computers of the power plant are networked with the computers
in the head office at Colombo. These data can be continuously viewed and monitored from the head
office at Colombo on a real time basis. The Electrical Engineer at head office at Colombo regularly
monitors the operation of the plant from head office on a continuous real time basis.
The electricity exported to the grid would be measured at the export meter within the premises of the
project activity by representatives of CEB during the last week of each month. This reading would be the
basis for invoicing the CEB by the Project Proponent. These meter readings would be maintained by the
Project Proponent in site and in the head office. Monthly invoices are prepared based on the joint
certification of meter reading.
Internal Audits
Managing Director visits the plant once in a month and conducts an internal audit periodically. He
reviews all the records, safety installations, operating procedures, etc., any corrective action to be taken
are recorded and steps are taken to implement the corrective action.
B.8 Date of completion of the application of the baseline and monitoring methodology and the name of the responsible person(s)/entity(ies) Date of completing the final draft of this baseline section (DD/MM/YYYY): 30 /01/2007 (last updated) DPL and its associates have determined the monitoring methodology.

PROJECT DESIGN DOCUMENT FORM (CDM-SSC-PDD) - Version 03 CDM – Executive Board
28
SECTION C. Duration of the project activity / crediting period C.1 Duration of the project activity: C.1.1. Starting date of the project activity: 25/09/2000. C.1.2. Expected operational lifetime of the project activity: 30 y-0m C.2 Choice of the crediting period and related information: The project activity will use a renewable crediting period. C.2.1. Renewable crediting period C.2.1.1. Starting date of the first crediting period:
01/06/2007 or the date of the registration of the project activity whichever is earlier.
C.2.1.2. Length of the first crediting period: 7y -0m C.2.2. Fixed crediting period: C.2.2.1. Starting date: Not Applicable C.2.2.2. Length: Not Applicable

PROJECT DESIGN DOCUMENT FORM (CDM-SSC-PDD) - Version 03 CDM – Executive Board
29
SECTION D. Environmental impacts >> D.1. If required by the host Party, documentation on the analysis of the environmental impacts of the project activity: Central Environmental Authority (CEA) is the regulatory body for environmental compliance in Sri
Lanka. CEA prescribes the environmental standards and monitors the compliance by industries. CEA has
specified detailed standards for various sources of discharge such as air, water, noise, solid waste etc.,
CEA issues the Terms of Reference (TOR) pertaining to each project. The project proponents submit
necessary documents for compliance with TOR. On submission of these documents, CEA gives
environmental clearance for the project based on which the construction of the project activity can start.
On construction, CEA with its representatives in the province monitors the compliance with regulations.
A detailed environmental study based on the Terms of Reference of CEA was prepared and submitted to
the project activity and the requisite environmental clearance was issued by CEA.
A brief review of the environmental aspects are presented below :
Land acquisition, compensation and physical and/or economic resettlement
The project required relocation of two families and these two families accepted the compensation and
there were no issues on this relocation. There has been no other land acquisition due to the project
activity. Since the project activity is a run of river hydroelectric project, there is no land inundation, and
therefore, there are no land submerging issues.
Potential impacts on downstream users
Since there is no change in the flow of water, there is no impact on the downstream users of the river.
Impact on Air, water and ecology
There is no impact on the air quality due to the project activity. Only source of air pollution is from the
exhausts of standby diesel generator set. The emissions from the DG do not have contaminants at a
concentration that would have an impact the environment. Moreover the standby generator is run for
very less time. The emissions from the DG are let out in compliance with statutory requirements.
No effluents are produced from the project activity and hence no impact on water. This is a run of river
hydropower project where size of the reservoir was not increased and hence there was no inundation of

PROJECT DESIGN DOCUMENT FORM (CDM-SSC-PDD) - Version 03 CDM – Executive Board
30
land due to the project activity. There are no known endangered species in the vicinity of the project
activity. Hence, there are no significant negative impacts on the ecology due to the project activity.
Impact on Flora and Fauna
CEA gives more importance for impact on flora and fauna of the surroundings of the project activity. The
project activity has no significant negative impact on the flora and fauna.
Social and economy issues
The installation of the project activity has given job opportunities to the local community during
construction and operation of the project activity. The project activity has contributed for improving the
standard of living of the local community.
D.2. If environmental impacts are considered significant by the project participants or the host Party, please provide conclusions and all references to support documentation of an environmental impact assessment undertaken in accordance with the procedures as required by the host Party: There are no significant negative impacts on the environment, ecology and local community due to the
project activity. The project has only positive impacts on the environment.

PROJECT DESIGN DOCUMENT FORM (CDM-SSC-PDD) - Version 03 CDM – Executive Board
31
SECTION E. Stakeholders’ comments >> E.1. Brief description how comments by local stakeholders have been invited and compiled: A meeting was organized on 17th August 2003 with local stakeholders of the project. The local
stakeholders were informed about the meeting and were invited by the project proponents to attend the
meeting.
Following representatives attended the meeting:
1. Mr. V. P. Premadasa, President, Poranuwa Branch Sri Lanka Freedom Party, & Justice of the
Peace
2. Mr. D. Jayasena, President, Grama Sanwardhan Samitiya (Village Development Society)
3. Mr. D. Liyanagunawardane, Former President, Pradeshiya Sabha, Pelmadulla
4. Mr. S.T. Thilakaratne, Secretary, Vilage Death Donating Society
5. Mr. D.R. Upul, Resident Project Area (Poranuwa Village)
6. Mr. P. Paranamanna, Grama Sevaka., Poranuwa
7. Mr. Wijeratne, Poranuwa School
8. Mr. K.V.V. Lal Upul, Resident, Project Area (Pornuwa Village)
9. Mr. Prabodha Sumanasekera , Director Didul Pvt Ltd.
10. Mr. A.K. Dheerasinghe , Project Manager, Vallibel Lanka (Pvt) Ltd.
11. Mr. R.A. Nandasena, Site Manager, Way Ganga Hydro Power Project
12. Mr. P.C.S. Nandasena, Site Officer, Way Ganga Hydro Power Project
13. Mr. Lasantha Dhammika, Site Supervisor, Didul Pvt Ltd.
14. Mr. Upali, Construction Manager, Way Ganga Hydro Power Project
15. Mr. S.W. Karunarathna, Purchasing Officer, Didul Pvt Ltd
E.2. Summary of the comments received: Mr. Sumanasekara - Director welcomed the attendees to the meeting and explained that the Way
Ganga Small Hydro Power Project was being constructed for the purpose of selling hydro power to the
Ceylon Electricity Board and the project was being constructed strictly within the guidelines stipulated
by the Central Environmental Authority which had granted the approval to commence construction of the

PROJECT DESIGN DOCUMENT FORM (CDM-SSC-PDD) - Version 03 CDM – Executive Board
32
project. After briefly mentioning about the background of the company and its operations, he also
explained about the contribution of the project in reduction of global warming by producing electricity
without the emissions of carbon dioxide. He stated that the Project was going to help both the economy
and the environment significantly. There was no pollution of waterways and the air.
He also informed that the Project was contemplating in obtaining the benefit of selling carbon credits.
The queries raised by the local stakeholders and answers by the project proponent are given below;
Mr. V.P. Premadasa, President Poranuwa Branch SLFP & Justice of the Peace said that these
construction activities should be conducted in such a way that poor villagers would not be
inconvenienced and their properties should not be affected due to heavy construction activities. He also
stated that once the project is completed the villages should feel that the project would be beneficial to
the villagers.
Director said that project was being constructed with all precautions not to affect the residents and the
environment. Any damage to any property would be compensated as per the official estimates He
mentioned that local people had been employed to the maximum extent possible and once the project
would become operational, the local people would be employed to the maximum extent possible. This
was no doubt a boost to the village economy.
Mr. D. Liyanagunawardane, Former President, Pradeshiya Sabha, Pelmadulla said that the road
connecting the Kahawatta and Poranuwa was in a bad condition and the local government body did not
have sufficient funds to effect the necessarry repairs and equested that the road be repaired.
Mr. V.P. Premadasa thanked the Company for maintaining the road connecting Kahawatta and
Poranuwa and requested the Company to carry out repair work.
Director informed that this would be undertaken.
Mr. P. Paranamanna, Grama Sevaka, Poranuwa asked whether the water stream would get polluted
because of the power plant.
Director said that the water stream would not get polluted at all and no waste water would be discharged
to stream as well. He further mentioned that the Central Environmental Authority (CEA) would carry out
inspection periodically to ensure the compliance of conditions stipulated by the CEA.

PROJECT DESIGN DOCUMENT FORM (CDM-SSC-PDD) - Version 03 CDM – Executive Board
33
Mr. H. Wijeratne, Principal, Poranuwa School requested some assistance to carry out repair work of
the few buildings of the school and for school development work.
Director said that such assistance would be extended to the school as part of the Proponent’s social
responsibility towards the society.
Mr. D.R. Upul requested to build a community center for the village and also requested a public address
system to be used for public functions.
Director said that the company is keen to provide such community development projects and assured
that all these would be provided.
Mr. K.V.V. Lal Upul, Resident, Project Area (Pornuwa Village) asked whether heavy blasting of
boulders will affect the nearby houses.
Director informed that that only the controlled blasting would be carried out and the possibility of
damaging any residential house was very remote. He also mentioned that such houses will be
compensated as per the official valuation or will be repaired by the Company as per the requirement of
the house owner.
Mr. D. Jayasena, President, Grama Sanwardhan Samitiya (Village Development Society) requested
the Company to pay adequate compansation for tea bushes not according to the official valuation
because such valuation was low.
Director agreed to the request.
Mr. R. A. Nandasena (Site Manager) thanked all those who attended the meeting.
E.3. Report on how due account was taken of any comments received:
All the concerns of the local stakeholders were addressed and attended. The roads as requested by the
local stakeholders were reapired. Assistance was provided to construction of buildings in school and
local residents were employed in the project activity.

PROJECT DESIGN DOCUMENT FORM (CDM-SSC-PDD) - Version 03 CDM – Executive Board
34
Annex 1
CONTACT INFORMATION ON PARTICIPANTS IN THE PROJECT ACTIVITY
Organization: Didul Private Ltd Street/P.O.Box: Building: 27-02, East Tower, World Trade Centre, City: Colombo -1 State/Region: Colombo Postfix/ZIP: Country: Sri Lanka Telephone: +94 11 2381111/23811112 FAX: +94 11 238 1115 E-Mail: URL: Represented by: Title: Managing Director Salutation: Mr. Last Name: Wickremarachchi Middle Name: First Name: Leel Department: Mobile: +94 77348 6666 Direct FAX: +94 11 238 1115 Direct tel: Personal E-Mail: [email protected]

PROJECT DESIGN DOCUMENT FORM (CDM-SSC-PDD) - Version 03 CDM – Executive Board
35
Annex 2
INFORMATION REGARDING PUBLIC FUNDING There is no public funding of the project activity from Annex 1 Parties.

PROJECT DESIGN DOCUMENT FORM (CDM-SSC-PDD) - Version 03 CDM – Executive Board
36
Annex 3
BASELINE INFORMATION
The baseline for the project activity is as per paragraph 9 of AMS I.D. described in Annex B of the
simplified modalities and procedures for small-scale CDM project activities, which mentions that the
baseline is the kWh produced by the renewable generating unit multiplied by an emission coefficient
(measured in kg CO2 eq/ kWh) to be calculated in a transparent and conservative manner as follows :
A combined margin (CM), consisting of the combination of operating margin (OM) and build margin
(BM) according to the procedures prescribed in the approved consolidated methodology ACM0002
where:
(a) The Operating Margin emission Factor (EFom,y) is based on one of the four following methods :
(i.) Simple OM, or
(ii.) Simple Adjusted OM, or
(iii.) The Dispatch Data Analysis OM,or
(iv.) The average OM
(d) The build margin emission factor (EF bm,y) is the generation weighted average emissions (in t
CO2/MWh) of a sample of power plants m. The sample group m consists of either the five power
plants that have been built most recently, or the power plant capacity additions in the electricity
system that comprise 20 % of the system generation (in MWh) and that have been built most
recently. Project participants should use from these two options that sample group comprise the
larger annual generation. Power plant capacity additions registered as CDM project activities
should be excluded from the sample group m. If 20 % falls on part capacity of a plant, that plant
is included in the calculation.
(e) The baseline emission factor (EFy) is the weighted average of the Operating Margin emission
factor (EFom,y), and the Build Margin emission factor (EFbm,y), where the weights are by default
50 % for each emission factor.
Since data required for calculation of OM as per dispatch data analysis and simple adjusted OM are not
publicly available, these methods are not adopted.
Hence, the other methods that are available are simple OM and average operating margin method. The
simple OM method has to be used where (a) low –cost / must run resources constitute less than 50 % of
total grid generation in (i) average of the five most recent years . or (ii) based on long term normals for
hydroelectricity production. The average emission rate method has to be used only where low cost/must

PROJECT DESIGN DOCUMENT FORM (CDM-SSC-PDD) - Version 03 CDM – Executive Board
37
run resources constitute more than 50 % of total grid generation and detailed data to apply options (b)
and (c) are not available.
Hence, the share of low cost /must run resources in the grid has to be calculated for the last five years
and the average of this value has to be determined to select the method to estimate operating margin. The
table A.3-1 gives the power generation mix of low cost and other resources.
The latest year for which data is available publicly is 2005. Hence, the 5 year period commences from
2001. Similarly, the estimation of operating margin emission factor and build margin emission factor is
estimated for the years 2003, 2004 and 2005 which are the most recent three years for which data is
publicly available in Sri Lanka.
The percentage of low-cost/must run resources and thermal generation for the last 5 years is given in the
table A.3-1.
Table A.3-1 – Generation mix for the five most recent years 3
Power generation mix of Sri Lanka Electricity grid for the last five years - GWh Generation 2001 2002 2003 2004 2005
Total Power Generation 6,625 6,946 7,072 7,288 8,378
Total Thermal Power Generation 3,407 4,114 3,879 4,530 5,203
Total Low Cost Power Generation 3,218 2,832 3,193 2,757 3,176
Thermal % of Total grid generation 51.43 59.23 54.85 62.16 62.10
Low Cost % of Total grid generation 48.57 40.77 45.15 37.84 37.90
Average of the five most recent years of % of Low Cost generation out of Total grid generation
42.05
The average of percentage of low-cost /must run resources for the most recent 5 years as per above
data is 42.05%
Hence, simple Operating Margin option is chosen for calculation of operating margin emission factor.
The simple OM has been calculated EX-ANTE using the vintage data as the full generation-weighted
average for the most recent 3 years for which data are available at the time of PDD submission.
3 CEB Report for Long Term Expansion Plan and Systems control and Operations Department

PROJECT DESIGN DOCUMENT FORM (CDM-SSC-PDD) - Version 03 CDM – Executive Board
38
The complete baseline emission factor is determined below. A separate excel sheet giving all calculations
to estimate the baseline emission factor is being given to DOE.
The power plants connected to the Ceylon Electricity Board (CEB) grid with installed capacities are
given in Table A.3-2 and A.3-3. below :
LIST OF POWER PLANTS IN CEYLON ELECTRICITY BOARDGRID
Table A.3-2 – Details of hydroelectric plants in Sri Lanka
S.No. Plant name Capacity (MW)
Annual average electricity generation (GWh)
Date of commissioning
Hydroelectric plants Laxapana hydro generation complex – CEB
Canyon 60 160 Unit 1 – May 1983,
Unit 2 – May 1989 Wimalasurendra 50 112 January, 1965
Old Laxapana 50 286 December, 1950 & Dec, 1958
New Laxapana 100 552 Unit 1- Feb 1974,
Unit 2 – March 1974 Polpitiya 75 453
2 Mahaweli complex
Victoria 210 865
Unit 1- Jan, 1985, Unit 2 - Oct, 1984, Unit 3 - Feb, 1986
Kotmale 201 498
Unit 1- April 1985, Unit 2&3 - Feb, 1988
Randenigala 122 454 July, 1986
Ukuwela 38 154 Unit 1- July, 1976, Unit 2 - August,1976
Bowatenna 40 48 June, 1981 Rantambe 49 239 January, 1990
3 Samanalawewa 120 344 October, 1992
4 Kukule 70 300 July, 2003
5 Small Hydro 20
Total Hydro capacity 1205 4465

PROJECT DESIGN DOCUMENT FORM (CDM-SSC-PDD) - Version 03 CDM – Executive Board
39
Table A.3-3 - Details of thermal power plants in Sri Lanka
S.no. Name of the plant Capacity (MW)
Annual average generation (GWh)
Date of commissioning
Existing thermal power plants
CEB Plants
1 Kelanitissa station - Old gas turbines 80 417 December, 1981 March, 1982, April, 1982
2 Kelanitissa station -New gas turbines 115 707 August, 1997 3 Kelanitissa station- Combined cycle plant 165 1290 August, 2002 4 Sapugaskanda diesel 80 472 May,1984 5 Sapugaskanda diesel extension 80 504 Sept, 1987 6 Chunakkam 8 - March, 1999 Independent power producers 6 Lakdhanavi 22.5 156 November, 1997
7 Asia Power Ltd 51 330 June, 1998 8 Colombo Power (Pvt) Ltd 64 420 Mid 2000 9 Diesel Plant Matara 24.8 167 March, 2002 10 Diesel Plant Horana 24.8 167 December, 2002 11 Kelanitissa AES CCY 163 1314 GT- March 2003
ST- October, 2003
12 Heladanavi (Pvt) Ltd 100 698 October, 2004 13 ACE Power Embilipitiya Ltd 100 697 March, 2005
Total Thermal power 978.5 6881
WIND BASED GENERATION 3 MW

PROJECT DESIGN DOCUMENT FORM (CDM-SSC-PDD) - Version 03 CDM – Executive Board
40
The latest year for which the generation details are publicly available in Sri Lanka is 2005. Hence, the years considered for estimation of baseline emission factor are 2003, 2004 and 2005. The electricity generation from all the power sources in Sri Lanka for the latest three years of 2003, 2004 and 2005 is given in Table A.3-4.
Table A.3-4 – Generation from each power source for the years 2003, 2004 and 2005
Hydro generation
Total cap
MW Fuel Type 2003 2004 2005
All units in GWh
Laxapana hydro generation complex - CEB owned
Canyon 60 Hydro 134.857 106.461 131.329
Wimalasurendra 50 Hydro 83.106 75.461 87.636
Old Laxapana 50 Hydro 230.890 223.101 245.804
New Laxapana 100 Hydro 465.771 392.458 466.788
Polpitaya 75 Hydro 370.986 333.463 375.802
Mahaweli hydro generation complex - CEB
Victoria 210 Hydro 496.727 344.074 351.446
Kotmale 201 Hydro 300.280 294.210 341.650
Randenigala 122 288.458 133.232 225.097
Ukuwela 38 Hydro 132.921 132.338 167.527
Bowatenna 40 Hydro 44.683 35.423 42.215
Rantambe 49 Hydro 164.989 105.969 129.134
Other hydro genration - CEB
Samanalawewa 120 Hydro 318.311 233.203 240.627
Kukule 70 Hydro 118.659 320.339 318.941
Small Hydro 20 Hydro 39.399 25.039 49.258
TOTAL HYDRO GENERATION 1205 3190.037 2754.771 3173.254

PROJECT DESIGN DOCUMENT FORM (CDM-SSC-PDD) - Version 03 CDM – Executive Board
41
Thermal Generation- CEB owned
Total cap
MW Fuel Type 2003 2004 2005
All units are in GWh
Kelanitissa Gas Power station
Gas turbine (old) 80 Diesel 37.936 141.418 22.231
Gas turbine (New) 115 Diesel 292.793 438.532 276.909
Combined cycle 165 Naphtha 855.049 1107.441 1006.715
Sapugaskanda Diesel Power station 80 Fuel oil 494.690 303.196 327.948
Sapugaskanda Diesel Ext 80 Fuel oil 512.779 512.558 527.482
Chunakkam small thermal 8 Diesel 0.000 0.000 0.590
Thermal Generation - IPP owned - Diesel
Lakdhanavi 22.5 Fuel oil 146.754 176.075 151.082
Asia Power Ltd 51 Fuel oil 344.874 368.268 353.692
Colombo Power (Pvt) Ltd 64 Fuel oil 435.697 507.023 475.780
ACE Power Matara 24.8 Fuel oil 151.075 198.380 163.308
ACE Power, Horana 24.8 Fuel oil 109.617 167.784 174.017
AES Kelanitissa (Pvt) Ltd 163 Fuel oil 497.729 407.060 475.780
Heladanavi (Pvt) Ltd 100 Fuel oil 0.000 202.726 758.887
Ace Power Embilipitiya Ltd 100 Fuel oil 0.000 0.000 488.219
Total thermal energy generation 3878.993 4530.461 5202.640
Renewable energy 3 Wind 3.388 2.661 2.438
PROJECT DESIGN DOCUMENT FORM (CDM-SSC-PDD) - Version 03 CDM – Executive Board
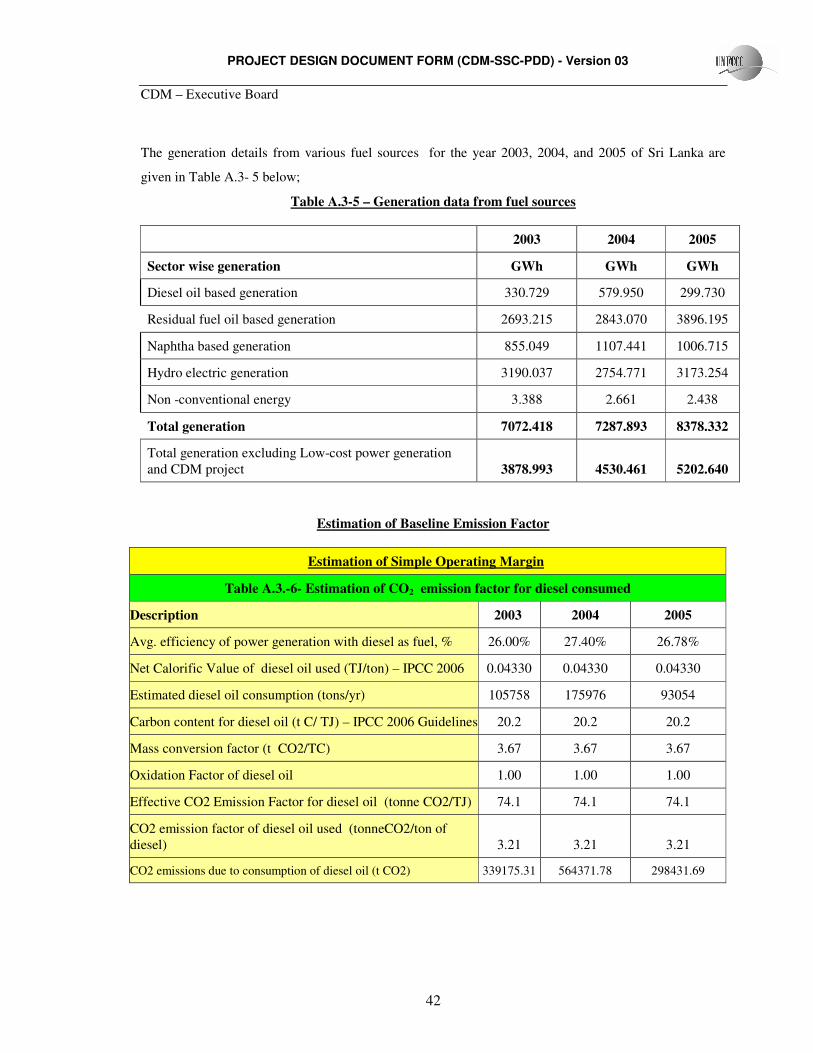
42
The generation details from various fuel sources for the year 2003, 2004, and 2005 of Sri Lanka are
given in Table A.3- 5 below;
Table A.3-5 – Generation data from fuel sources
2003 2004 2005
Sector wise generation GWh GWh GWh
Diesel oil based generation 330.729 579.950 299.730
Residual fuel oil based generation 2693.215 2843.070 3896.195
Naphtha based generation 855.049 1107.441 1006.715
Hydro electric generation 3190.037 2754.771 3173.254
Non -conventional energy 3.388 2.661 2.438
Total generation 7072.418 7287.893 8378.332
Total generation excluding Low-cost power generation and CDM project 3878.993 4530.461 5202.640
Estimation of Baseline Emission Factor
Estimation of Simple Operating Margin
Table A.3.-6- Estimation of CO2 emission factor for diesel consumed
Description 2003 2004 2005
Avg. efficiency of power generation with diesel as fuel, % 26.00% 27.40% 26.78%
Net Calorific Value of diesel oil used (TJ/ton) – IPCC 2006 0.04330 0.04330 0.04330
Estimated diesel oil consumption (tons/yr) 105758 175976 93054
Carbon content for diesel oil (t C/ TJ) – IPCC 2006 Guidelines 20.2 20.2 20.2
Mass conversion factor (t CO2/TC) 3.67 3.67 3.67
Oxidation Factor of diesel oil 1.00 1.00 1.00
Effective CO2 Emission Factor for diesel oil (tonne CO2/TJ) 74.1 74.1 74.1
CO2 emission factor of diesel oil used (tonneCO2/ton of diesel) 3.21 3.21 3.21
CO2 emissions due to consumption of diesel oil (t CO2) 339175.31 564371.78 298431.69
PROJECT DESIGN DOCUMENT FORM (CDM-SSC-PDD) - Version 03 CDM – Executive Board
43
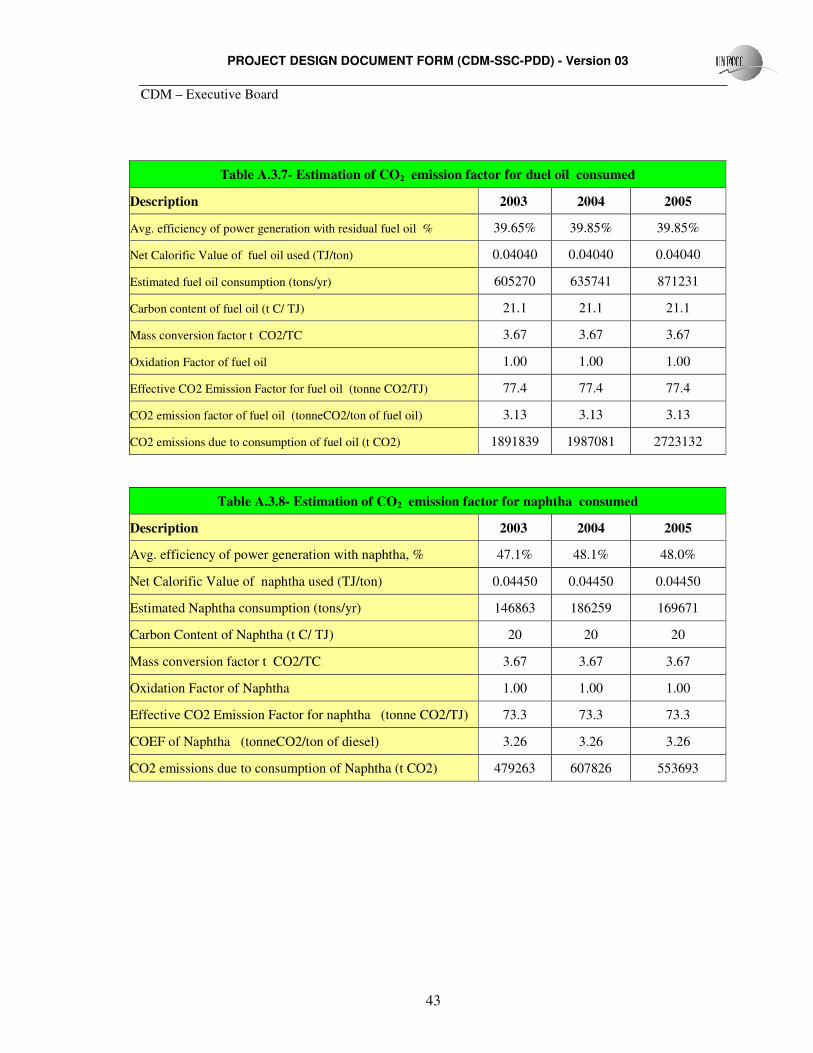
Table A.3.7- Estimation of CO2 emission factor for duel oil consumed
Description 2003 2004 2005
Avg. efficiency of power generation with residual fuel oil % 39.65% 39.85% 39.85%
Net Calorific Value of fuel oil used (TJ/ton) 0.04040 0.04040 0.04040
Estimated fuel oil consumption (tons/yr) 605270 635741 871231
Carbon content of fuel oil (t C/ TJ) 21.1 21.1 21.1
Mass conversion factor t CO2/TC 3.67 3.67 3.67
Oxidation Factor of fuel oil 1.00 1.00 1.00
Effective CO2 Emission Factor for fuel oil (tonne CO2/TJ) 77.4 77.4 77.4
CO2 emission factor of fuel oil (tonneCO2/ton of fuel oil) 3.13 3.13 3.13
CO2 emissions due to consumption of fuel oil (t CO2) 1891839 1987081 2723132
Table A.3.8- Estimation of CO2 emission factor for naphtha consumed
Description 2003 2004 2005
Avg. efficiency of power generation with naphtha, % 47.1% 48.1% 48.0%
Net Calorific Value of naphtha used (TJ/ton) 0.04450 0.04450 0.04450
Estimated Naphtha consumption (tons/yr) 146863 186259 169671
Carbon Content of Naphtha (t C/ TJ) 20 20 20
Mass conversion factor t CO2/TC 3.67 3.67 3.67
Oxidation Factor of Naphtha 1.00 1.00 1.00
Effective CO2 Emission Factor for naphtha (tonne CO2/TJ) 73.3 73.3 73.3
COEF of Naphtha (tonneCO2/ton of diesel) 3.26 3.26 3.26
CO2 emissions due to consumption of Naphtha (t CO2) 479263 607826 553693

PROJECT DESIGN DOCUMENT FORM (CDM-SSC-PDD) - Version 03 CDM – Executive Board
44
Table A.3.9- Estimation of Simple Operating Margin
Description 2003 2004 2005
CO2 emissions due to diesel oil ( t CO2/year) 339175.31 564371.78 298431.69
CO2 emissions due to fuel oil ( t CO2/year) 1891839 1987081 2723132
CO2 emissions due to naphtha/gas ( t CO2/year) 479263 607826 553693
Total CO2 emissions ( t CO2/year) 2710278 3159279 3575257
Electricity generation excluding low cost generation GWh 3878.99 4530.46 5202.64
Simple Operating Margin Emission factor (EF OM Simple), ( tCO2/GWh) 698.707 697.342 687.201
Average EFOM , tCO2/GWh 694.416
Average EFOM, tCO2/MWh 0.694
Estimation of Build Margin emission factor The Build Margin emission factor is the generation weighted average emission factor (tCO2/MWh) of
sample group of power plants . The sample group m should consist of either the five power plants that
have been built most recently, or the power plant capacity additions in the electricity system that
comprise 20 % of the system generation (in MWh) that have been built most recently considering the
sample group that comprises the larger annual generation shall be considered.
The generation of CEB for the most recent year 2005 is 8378. 332 GWh and the 20 % of the
generation is 1675.67GWh. The following table A.3.10 gives the list of most recent built plants. It
may be seen that 20 % generation is from the annual generation from the 5 most recent built plants.
Hence, the generation of 5 most recent built units which is same as 20 % generation is considered for
estimation of Build Margin.

PROJECT DESIGN DOCUMENT FORM (CDM-SSC-PDD) - Version 03 CDM – Executive Board
45
A. 3- 10 Group of sample power plants for calculation of Build Margin
Sr. No Power Plant Fuel MW Year of commissioning Generation in 2005 in GWh
1 Ace Power Embilipitiya Ltd Fuel oil 100 March, 2005 488.219
2 Heladanavi (Pvt) Ltd Fuel oil 100 October, 2004 758.887
3 AES Kelanitissa (Pvt) Ltd Fuel oil 163 GT- March 2003 ST- October, 2003 475.78
4 Kukule Hydro 70 July, 2003 318.941
5 ACE Power, Horana Fuel oil 24.8 December, 2002 174.017
Total 1727.63
20% of the total generation 1675.67
Fuel oil based generation (Total generation excluding low cost generation0 1408.68
Hydro 318.94
The Built Margin is estimated in Table A.3.11below.
Table A.3-11 CALCULATION OF BUILD MARGIN
Residual Oil
Avg. efficiency of power generation with residual fuel oil % 39.85%
Net Calorific Value of fuel oil used (TJ/ton) 0.04040
Estimated fuel oil consumption (tons/year) 314997
Carbon content of fuel oil (t C/ TJ) 21.1
Mass conversion factor (t CO2/TC) 3.67
Oxidation Factor of fuel oil 1.00
Effective CO2 Emission Factor for fuel oil (ton CO2/TJ) 77.4
CO2 emission factor of fuel oil (tonneCO2/ton of fuel oil) 3.13
CO2 emissions due to consumption of fuel oil (t CO2) 984559
Total generation excluding Low-cost power generation (GWh) 1408.68
Built Margin (BM), tCO2/GWh 698.92
Built Margin (BM), tCO2/MWh 0.6989

PROJECT DESIGN DOCUMENT FORM (CDM-SSC-PDD) - Version 03 CDM – Executive Board
46
Estimation of Baseline emission factor As per ACM 0002 /Version 06, the baseline emission factor (EF) by the combined margin method is the weighted average of operating margin and build margin.
EF = WOM * EFOM + WBM * EFBM
where WOM and WBM are the weights for operating margin and build margin respectively. As per ACM 0002, for wind energy project, the default weights WOM = 0.5 and WBM= 0.5 Hence, Emission factor EF = 0.5 *0.694 + 0.5 * 0.699 (t CO2/MWh) (t CO2/MWh) (t CO2/MWh) = 0.697 t CO2 /MWh

PROJECT DESIGN DOCUMENT FORM (CDM-SSC-PDD) - Version 03 CDM – Executive Board
47
Annex 4
MONITORING INFORMATION As emission reductions from the project activity are determined by the amount of electricity exported to
the grid, it is essential to have a monitoring system in place and ensure that the project activity produces
and exports the rated power at the stipulated norms. The sole objective of having monitoring system is to
have a constant watch on the emission reductions.
Key project parameters affecting emission reductions
Electricity generated by the project activity: The gross power generated by the project activity would be
monitored to the best accuracy and as per the table given in section B.7.1
Net electricity exported to the grid: The project revenue is based on the net electricity exported by the
project activity to the grid.
The general principles for monitoring above parameters are based on:
• Frequency
• Data recording
• Reliability
• Experience and training
Frequency
Monthly reading of meters installed for metering the electricity exported shall be taken by authorised
officials of CEB during the last week of every month. Daily data recording by the shift in-charge of DPL
is there at generation end. Meter reading of the CEB energy (export) meter shall be the basis for monthly
invoice of net energy exported to the grid by the project activity.
Data recording
Records of the meter reading of net energy exported to the grid would be maintained by DPL and CEB
and archived electronically for the entire crediting period and two years thereafter the crediting period.
Reliability
The meter to measure the electricity export is calibrated and sealed and is not interfered with, by either
DPL or CEB.
The calibration of the meter would be performed pursuant to IEC standards, by CEB or by a mutually
agreed upon qualified independent third party.

PROJECT DESIGN DOCUMENT FORM (CDM-SSC-PDD) - Version 03 CDM – Executive Board
48
The emission reductions of the project activity would be given by the following formula :
ER = BE - PE
(tCO2e) (tCO2e) (tCO2e)
Where ER is the emission reductions in ton CO2 eq
BE is the baseline emissions in ton CO2 eq
PE is the project emissions in ton CO2 eq
Baseline emissions are calculated by multiplying the net electricity exported to the grid in MWh during
the monitoring period by the baseline emission factor in t CO2/ MWh. The net electricity exported by the
project activity would be metered by CEB. The metering equipment is maintained in accordance with
CEB standards. The monthly meter readings are taken at the interconnection point at CEB energy meter
by CEB during the last week of the each month. The monthly reading is jointly certified by CEB and
representative of the project proponent.
Project emissions are calculated by multiplying the electricity imported by the project activity from the
grid in MWh during the monitoring period by the baseline emission factor in t CO2/MWh. The electricity
imported from the grid would be obtained from the monthly bills of CEB.
Emissions due to operation of standby generator
Since the DG is very sparingly used, the emissions due to the consumption of diesel are very less at
present. However, the consumption of the diesel for operation of standby diesel generator would be
monitored and emissions due to consumption of diesel would be accounted as project emissions when
these emissions contribute for 1 % of the baseline emissions.

PROJECT DESIGN DOCUMENT FORM (CDM-SSC-PDD) - Version 03 CDM – Executive Board
49
Appendix 1 –Abbreviations
AMS Approved small scale methodology
BM Built Margin
CEB Ceylon Electricity Board
CM Combined Margin
CDM Clean Development Mechanism
CEA Central Environment Authority
CEB Ceylon Electricity Board
CO2e or CO2eq Carbon di Oxide equivalent
DPL Didul Private Limited
FO Fuel oil
GHG Green House Gases
GWh Giga watt hour
IPCC Inter Governmental Panel on Climate Change
IRR Internal rate of return
kgCO2 eq/kWh Kilogram carbon di oxide equivalent per kilowatt hour
KV Kilo Volt
KVA Kilo Volt Amperes
kW Kilo watt
kWh Kilo watt hour
m Metre or metres
mm mill metre or millimetres
m3 /s Cubic meters per second
M&P Modalities and Procedures
MW Megawatt
MWh Mega watt hour
MWh/year Mega watt hour per year
MVA Mega Volt Amperes
OM Operating margin
rpm Revolutions Per Minute
RCC Reinforced Cement Concrete
SLRs Sri Lankan Rupees – the official currency of Sri Lanka, IUS$= SLRs 109

PROJECT DESIGN DOCUMENT FORM (CDM-SSC-PDD) - Version 03 CDM – Executive Board
50
SPPA Standard Power Purchase Agreement
t CO2/MWh tonnes carbon di oxide per mega watt hour
tCO2e or tCO2eq or ton CO2e
tonnes carbon di oxide equivalent
UNFCCC United Nations Framework Convention on Climate Change
US$ United States Dollars

PROJECT DESIGN DOCUMENT FORM (CDM-SSC-PDD) - Version 03 CDM – Executive Board
51
Appendix 2- List of References
Sl. No. Particulars of the references
1. United Nations Framework Convention on Climate Change (UNFCCC), http://unfccc.int
2. UNFCCC document: Clean Development Mechanism, Simplified Project Design Document for Small Scale Project Activities (SSC-PDD), Version 03
3. UNFCCC document: Simplified modalities and procedures for small–scale clean development mechanism project activities
4. UNFCCC document: Appendix B of the simplified modalities and procedures for small–scale CDM project activities - Indicative simplified baseline and monitoring methodologies for selected small-scale CDM project activity categories - Type I.D Grid connected renewable electricity generation Version 10:23 December, 2006
5. Revised 2006 IPPC guidelines for National Greenhouse Gas Inventories: Workbook and Reference Manual
6. Long Term Generation Expansion Plan 2003-2017 of Ceylon Electricity Board
7. Ceylon Electricity Board (CEB), www.ceb.lk
8. Project Report of the project activity
9. Standard Power Purchase Agreement with Ceylon Electricity Board


