Clean development mechanism project design … DEVELOPMENT MECHANISM PROJECT DESIGN DOCUMENT FORM...
67
PROJECT DESIGN DOCUMENT FORM (CDM PDD) - Version 03 CDM – Executive Board page 1 CLEAN DEVELOPMENT MECHANISM PROJECT DESIGN DOCUMENT FORM (CDM-PDD) Version 03 - in effect as of: 28 July 2006 CONTENTS A. General description of project activity B. Application of a baseline and monitoring methodology C. Duration of the project activity / crediting period D. Environmental impacts E. Stakeholders’ comments Annexes Annex 1: Contact information on participants in the project activity Annex 2: Information regarding public funding Annex 3: Baseline information Annex 4: Monitoring plan
Transcript of Clean development mechanism project design … DEVELOPMENT MECHANISM PROJECT DESIGN DOCUMENT FORM...

PROJECT DESIGN DOCUMENT FORM (CDM PDD) - Version 03 CDM – Executive Board page 1
CLEAN DEVELOPMENT MECHANISM PROJECT DESIGN DOCUMENT FORM (CDM-PDD)
Version 03 - in effect as of: 28 July 2006
CONTENTS A. General description of project activity B. Application of a baseline and monitoring methodology C. Duration of the project activity / crediting period D. Environmental impacts E. Stakeholders’ comments
Annexes Annex 1: Contact information on participants in the project activity Annex 2: Information regarding public funding Annex 3: Baseline information
Annex 4: Monitoring plan

PROJECT DESIGN DOCUMENT FORM (CDM PDD) - Version 03 CDM – Executive Board page 2 SECTION A. General description of project activity A.1. Title of the project activity: >> Biomass based Cogeneration project for Madina Enterprise Limited (MEL). Version: 1.0 Date: 10/09/2011 A.2. Description of the project activity: >> Madina Enterprise Limited (MEL) is a renowned industrial group of Pakistan with interests in Sugar, Textile and Edible Oil sectors, and is operating in different parts of Pakistan. Biomass based cogeneration project (“the project”) is first of its kind in Pakistan utilizing biomass residues for the generation of power thus substituting the equivalent amount of electricity, which would otherwise be generated in the grid. The project activity is implemented by Madina Enterprise Limited, which is the owner of power plant division and steel mill division where the electricity is consumed under the project. The project activity is the retrofit of existing boilers and installation of high pressure turbines in an existing sugar mill. Project Activity will provide surplus power to steel mill which would otherwise be imported from grid. As the project is the first of its kind in Pakistan, therefore the project entity aims to implement high pressure boiler technology and turbines to power furnaces in different stages, gradually increasing the efficiency of turbines to improve the specific steam consumption. Pakistan is an agriculture based economy and one of the largest rice and sugarcane producers in the region. Therefore utilizing biomass residues (e.g. rice husk, bagasse) is an important step towards the achievement of sustainable energy strategy. For project proponents renewable biomass residues based cogeneration is an alternative to postpone the dispatch of electricity produced by fossil-fuelled based utilities in the grid. The sale of the CERs generated by the project will boost the financial attractiveness of the project compensating the uncertain and rising biomass prices and other barriers, helping to increase the production of renewable energy and decrease the dependency on fossil fuel. Purpose of the Project Activity The main purpose of the project activity is to utilize biomass residue i.e. bagasse available in sugar mill thus substituting grid based electricity in the baseline. The project proponent will cogenerate enough steam and power for captive requirements in sugar mill and supplying surplus 20 MW to the steel mill, which would otherwise be imported from the grid. The project will generate renewable energy thus displacing grid based energy generation in the baseline scenario. How the proposed project activity reduces greenhouse gas emissions from Baseline The project activity will reduce the emissions of greenhouse gases by utilizing biomass residues in high pressure boilers and turbines to generate clean electricity thus displacing the use of grid electricity. The project therefore will reduce 28,684 tCO2e per annum for the first crediting period.

PROJECT DESIGN DOCUMENT FORM (CDM PDD) - Version 03 CDM – Executive Board page 3 Project Contribution to Sustainable Development The contributions of project activity towards sustainable development are explained with indicators like socio-economic, environmental and technological as follows: Socio-economic well being: The project has created an employment and business opportunity during construction phase for local stakeholders such as suppliers, contractors, and labor etc. contributing to economic well-being of local people, which would enhance their social status. The project will also create permanent jobs for maintaining the operations of steel mill. Environmental well being: The project activity displaces the fossil based grid electricity in the baseline by renewable biomass residues (rice husk and bagasse) and by this means resulting in reduction of greenhouse gas (GHG) emissions. Technological well being: The project activity utilizes biomass residue as fuel to generate steam. The project activity represents the environmentally safe technology for the application in steel mill, which is first of its kind in Pakistan. The refurbishment of high pressure boilers is done locally by engineers at sugar mill and other staff thus developing technological skills to efficiently operate and maintain in the future. The project will also help in
• Introducing modern high pressure turbine technology in sugar industry of the country. • Improve technical knowledge of local population through technology transfer of the system by
the supplier A.3. Project participants: >> The table below illustrates the participants involved in the project activity. Contact information is provided in Annex 1
Table A.3.1 : Project Participants
Name of Party involved * ((host) indicates a host
Party)
Private and/or public entity(ies) project participants
(as applicable)
Kindly indicate if the Party involved
wishes to be considered as
project participant (Yes/No)
Islamic Republic of Pakistan (host)
Madina Enterprises Ltd. (Private Entity) No
Australia Climate Ventures Pty Ltd. (Private Entity) No
Switzerland Vitol S.A. (private Entity) No (*) In accordance with the CDM modalities and procedures, at the time of making the CDM-PDD public at the stage of validation, a Party involved may or may not have provided its approval. At the time of requesting registration, the approval by the Party(ies) involved is required.

PROJECT DESIGN DOCUMENT FORM (CDM PDD) - Version 03 CDM – Executive Board page 4 A.4. Technical description of the project activity: A.4.1. Location of the project activity: >> A.4.1.1. Host Party(ies): >> Islamic Republic of Pakistan A.4.1.2. Region/State/Province etc.: >> Faisalabad Road, Chiniot A.4.1.3. City/Town/Community etc.: >> The project will be implemented in Chiniot district, Punjab province. A.4.1.4. Details of physical location, including information allowing the unique identification of this project activity (maximum one page): >> The project is located at Madina Sugar Mill situated at 10 KM, Faisalabad road, Chiniot. The geographic coordinates of the project are Lat: 31o 38’ 52” N and Long: 73o 0’ 58” E.
Fig A4.1.4.2: Location of the Project Site 1
1 Source:
A.4.2. Category(ies) of project activity: >> As per the sectoral scope of the project activities, the project activity falls under;
http://maps.google.com
PROJECT DESIGN DOCUMENT FORM (CDM PDD) - Version 03 CDM – Executive Board page 5
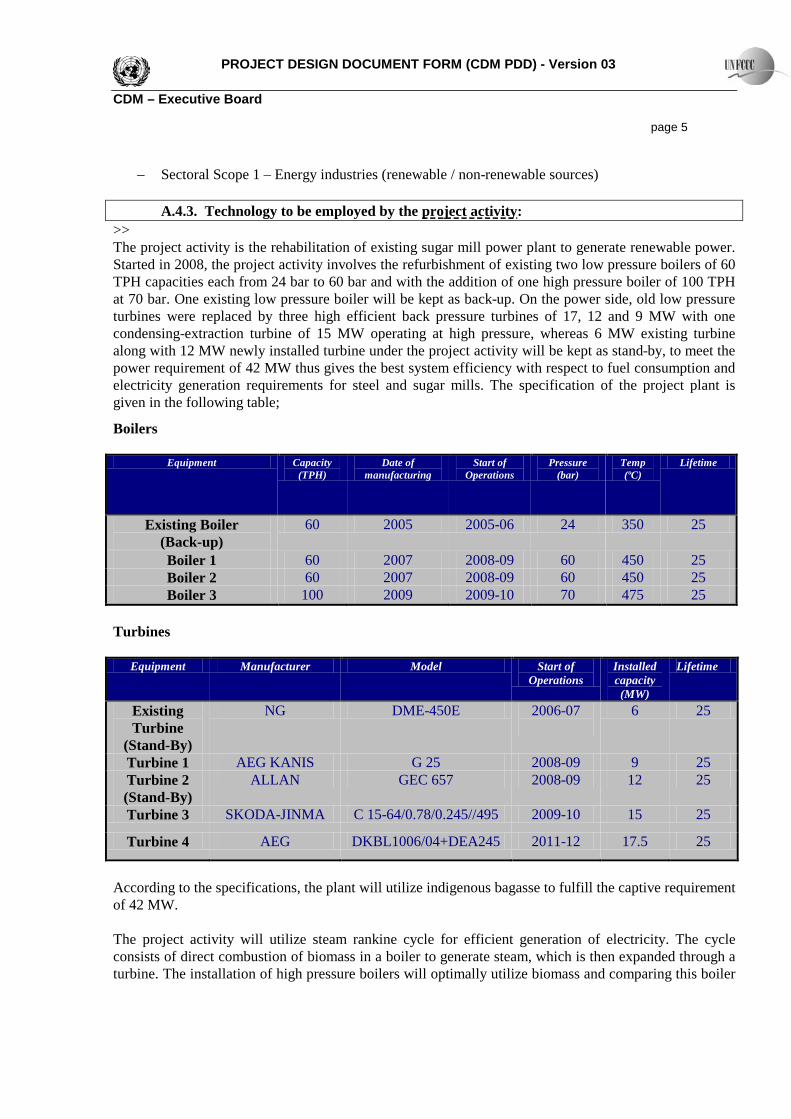
− Sectoral Scope 1 – Energy industries (renewable / non-renewable sources) A.4.3. Technology to be employed by the project activity: >> The project activity is the rehabilitation of existing sugar mill power plant to generate renewable power. Started in 2008, the project activity involves the refurbishment of existing two low pressure boilers of 60 TPH capacities each from 24 bar to 60 bar and with the addition of one high pressure boiler of 100 TPH at 70 bar. One existing low pressure boiler will be kept as back-up. On the power side, old low pressure turbines were replaced by three high efficient back pressure turbines of 17, 12 and 9 MW with one condensing-extraction turbine of 15 MW operating at high pressure, whereas 6 MW existing turbine along with 12 MW newly installed turbine under the project activity will be kept as stand-by, to meet the power requirement of 42 MW thus gives the best system efficiency with respect to fuel consumption and electricity generation requirements for steel and sugar mills. The specification of the project plant is given in the following table;
Boilers
Equipment Capacity (TPH)
Date of manufacturing
Start of Operations
Pressure (bar)
Temp (ºC)
Lifetime
Existing Boiler (Back-up)
60 2005 2005-06 24 350 25
Boiler 1 60 2007 2008-09 60 450 25 Boiler 2 60 2007 2008-09 60 450 25 Boiler 3 100 2009 2009-10 70 475 25
Turbines
Equipment Manufacturer Model Start of Operations
Installed capacity (MW)
Lifetime
Existing Turbine
(Stand-By)
NG DME-450E 2006-07
6 25
Turbine 1 AEG KANIS G 25 2008-09 9 25 Turbine 2 (Stand-By)
ALLAN GEC 657 2008-09 12 25
Turbine 3 SKODA-JINMA C 15-64/0.78/0.245//495 2009-10 15 25
Turbine 4 AEG DKBL1006/04+DEA245 2011-12 17.5 25
According to the specifications, the plant will utilize indigenous bagasse to fulfill the captive requirement of 42 MW. The project activity will utilize steam rankine cycle for efficient generation of electricity. The cycle consists of direct combustion of biomass in a boiler to generate steam, which is then expanded through a turbine. The installation of high pressure boilers will optimally utilize biomass and comparing this boiler

PROJECT DESIGN DOCUMENT FORM (CDM PDD) - Version 03 CDM – Executive Board page 6 to the conventional boilers, the steam rate required for the turbine is much less at similar amounts of bagasse consumption. In other words, it can be said that approx. 6 to 8 kg steam is required to produce 1 kWh of electricity whereas in the conventional turbines 11 to 15 kg of steam generates 1 kWh.
Fig. A.4.3 Schematic Diagram for Project Activity
A.4.4. Estimated amount of emission reductions over the chosen crediting period: >>
Years
Annual estimation of emission reductions in tonnes of CO2e
2012 14,342 2013 28,684 2014 28,684 2015 28,684 2016 28,684 2017 28,684 2018 28,684 2019 14,342
Total estimated reductions (tonnes of CO2e)
28,684
Total number of crediting years
7
Annual average over the crediting period of estimated reductions (tonnes of CO2e)
28,684
Mill House Header
Boiler 1 (60 TPH, 60 Bar)
Boiler 2 (60 TPH, 24 Bar)
Boiler 3 (60 TPH, 60 Bar)
Boiler 4 (100 TPH, 70 Bar)
Power House 6 MW Back-Pressure (Back-up) 12 MW Back-Pressure (Back-up) 9MW Back-Pressure 17 MW Back Pressure 15 MW Condensing Extraction
Steel Mill
Bagasse
Sugar Mill Captive

PROJECT DESIGN DOCUMENT FORM (CDM PDD) - Version 03 CDM – Executive Board page 7 A.4.5. Public funding of the project activity: >> No public funding is involved in this project activity.

PROJECT DESIGN DOCUMENT FORM (CDM PDD) - Version 03 CDM – Executive Board page 8 SECTION B. Application of a baseline and monitoring methodology B.1. Title and reference of the approved baseline and monitoring methodology applied to the project activity: >>
• ACM0006 Version 11.1: “Consolidated methodology for electricity generation from biomass residues”;
• Latest Tool to calculate the Emission Factor for an Electricity System B.2. Justification of the choice of the methodology and why it is applicable to the project activity: >> The project activity is the refurbishment of the existing power plant to power the newly established steel mill allowing the plant to operate more efficiently and with enhanced capacity, providing electricity to steel mill thus displacing fossil based grid electricity, which would otherwise be imported from grid. Therefore project activity is eligible under the approved baseline and monitoring methodology ACM0006 version 11.1. The project activity is the combination of energy efficiency improvement and capacity expansion projects. The project activity is based on the operation of a cogeneration plant located in an agro-industrial plant (sugar mill) generating the biomass residues (bagasse).
The methodology is applicable under the following conditions; Sr. Applicability Condition Project Activity Remarks
1 No biomass types other than biomass residues are used in the project plant;2
The project activity is the utilization of bagasse (biomass residues) which comes under the definition of the methodology.
Applicable
2 Fossil fuels may be co-fired in the project plant. However, the amount of fossil fuels co-fired does not exceed 50% of the total fuel fired on an energy basis;
No Fossil fuels are co-fired in the project activity.
Applicable
3 For projects that use biomass residues from a production process (e.g. production of sugar or wood panel boards), the implementation of the project does not result in an increase of the processing capacity of raw input (e.g. sugar, rice, logs, etc.) or in other substantial changes (e.g. product change) in this process
The project activity will utilize the sugar cane waste i.e. bagasse more efficiently without resulting in the increase of production capacity of the mill or in other substantial product change.
Applicable
2 Refuse Derived Fuel (RDF) may be used in the project plant but all carbon in the fuel, including carbon from biogenic sources, shall be considered as fossil fuel.

PROJECT DESIGN DOCUMENT FORM (CDM PDD) - Version 03 CDM – Executive Board page 9 4 The biomass residues used by the project
facility are not stored for more than one year
The bagasse produced by the sugar mill will be fully utilized in the season thus will not be stored more than 6 months.
Applicable
5 The biomass residues used by the project facility are not obtained from chemically processed biomass (e.g. through esterification, fermentation, hydrolysis, pyrolysis, bio- or chemical- degradation, etc.) prior to combustion. Moreover, the preparation of biomass-derived fuel do not involve significant energy quantities, except from transportation or mechanical treatment so as not to cause significant GHG emissions
Bagasse is agricultural residue of sugarcane and do not require any chemical processing before utilizing for energy. Similarly no significant energy is required to prepare bagasse for combustion purposes.
Applicable
6 In the case of fuel switch project activities, the use of biomass residues or the increase in the use of biomass residues as compared to the baseline scenario is technically not possible at the project site without a capital investment in:
• The retrofit or replacement of existing heat generators/boilers; or
• The installation of new heat generators/boilers; or
• A new dedicated biomass residues supply chain established for the purpose of the project (e.g. collecting and cleaning contaminated new sources of biomass residues that could otherwise not be used for energy purposes); or
• Equipment for preparation and feeding of biomass residues.
The project activity is the rehabilitation and capacity expansion of existing biomass residue based cogeneration plant, therefore does not called as fuel switch project.
Not Applicable
7 In the case that biogas is used in power and/or heat generation, this methodology is applicable under the following conditions:
• The biogas is generated by anaerobic digestion of
The project activity does not utilize biogas for cogeneration.
Not Applicable

PROJECT DESIGN DOCUMENT FORM (CDM PDD) - Version 03 CDM – Executive Board page 10
wastewaster (to be) registered as a CDM project activity and the details of the registered CDM project activity must be included in the PDD. Any CERs from biogas energy generation should be claimed under the proposed project activity registered under this methodology;
• The biogas is generated by anaerobic digestion of wastewater that is not (and will not) be registered as a CDM project activity. The amount of biogas does not exceed 50% of the total fuel fired on an energy basis.
Finally, the methodology is only applicable if the most plausible baseline scenario, as identified per the “Selection of the baseline scenario and demonstration of additionality” section hereunder, is:
• For power generation: Scenarios P2: to P7:, or a combination of any of those scenarios;
• For heat generation: Scenarios H2: to H7:, or a combination of any of those scenarios;
• For biomass residue use: Scenarios B1: to B8:, or any combination of those scenarios. For scenarios B5: to B8:, leakage emissions should be accounted for as per the procedures of the methodology.
The scenarios for power, heat and biomass applicability is discussed in section B.4. B.3. Description of the sources and gases included in the project boundary: >> The project participants have included in the project boundary, GHG emission sources from the project activity and emission sources in the baseline, as prescribed by the methodology ACM0006 Version 11.1. The project boundary includes the following emission sources:
Sugar Mill power house
Project Cogeneration Plant
Bagasse
Sugar Mill Captive Use
Steel Mill
National Grid
Bagasse/Rice Husk
Transported
PROJECT DESIGN DOCUMENT FORM (CDM PDD) - Version 03 CDM – Executive Board page 11
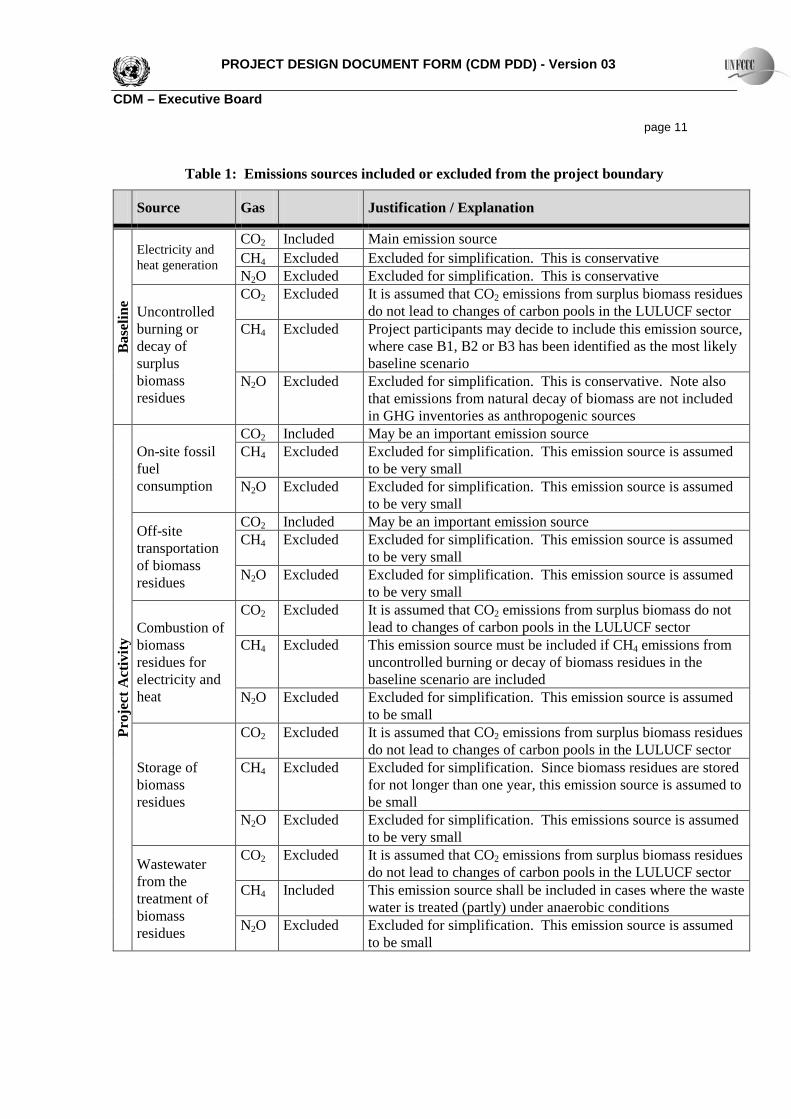
Table 1: Emissions sources included or excluded from the project boundary
Source Gas Justification / Explanation
Bas
elin
e
Electricity and heat generation
CO2 Included Main emission source CH4 Excluded Excluded for simplification. This is conservative N2O Excluded Excluded for simplification. This is conservative
Uncontrolled burning or decay of surplus biomass residues
CO2 Excluded It is assumed that CO2 emissions from surplus biomass residues do not lead to changes of carbon pools in the LULUCF sector
CH4 Excluded Project participants may decide to include this emission source, where case B1, B2 or B3 has been identified as the most likely baseline scenario
N2O Excluded Excluded for simplification. This is conservative. Note also that emissions from natural decay of biomass are not included in GHG inventories as anthropogenic sources
Proj
ect A
ctiv
ity
On-site fossil fuel consumption
CO2 Included May be an important emission source CH4 Excluded Excluded for simplification. This emission source is assumed
to be very small N2O Excluded Excluded for simplification. This emission source is assumed
to be very small
Off-site transportation of biomass residues
CO2 Included May be an important emission source CH4 Excluded Excluded for simplification. This emission source is assumed
to be very small N2O Excluded Excluded for simplification. This emission source is assumed
to be very small
Combustion of biomass residues for electricity and heat
CO2 Excluded It is assumed that CO2 emissions from surplus biomass do not lead to changes of carbon pools in the LULUCF sector
CH4 Excluded This emission source must be included if CH4 emissions from uncontrolled burning or decay of biomass residues in the baseline scenario are included
N2O Excluded Excluded for simplification. This emission source is assumed to be small
Storage of biomass residues
CO2 Excluded It is assumed that CO2 emissions from surplus biomass residues do not lead to changes of carbon pools in the LULUCF sector
CH4 Excluded Excluded for simplification. Since biomass residues are stored for not longer than one year, this emission source is assumed to be small
N2O Excluded Excluded for simplification. This emissions source is assumed to be very small
Wastewater from the treatment of biomass residues
CO2 Excluded It is assumed that CO2 emissions from surplus biomass residues do not lead to changes of carbon pools in the LULUCF sector
CH4 Included This emission source shall be included in cases where the waste water is treated (partly) under anaerobic conditions
N2O Excluded Excluded for simplification. This emission source is assumed to be small

PROJECT DESIGN DOCUMENT FORM (CDM PDD) - Version 03 CDM – Executive Board page 12 B.4. Description of how the baseline scenario is identified and description of the identified baseline scenario: >> According to methodology ACM0006 version 11.1, the selection of the baseline scenario should be conducted by applying the following steps in conjunction with latest version of the tool to identify the baseline scenario and demonstrate additionality:
Step 1: Identification of alternative scenarios
This step serves to identify alternative scenarios to the proposed CDM project activity(s) that can be the baseline scenario through the following sub-steps:
Step 1a: Define alternative scenarios to the proposed CDM project activity
Identify realistic alternative scenarios that are available to the project participants and that provide outputs or services with comparable quality, properties and application areas as the proposed CDM project activity.
The alternative scenarios should specify:
• How electric power would be generated in the absence of the CDM project activity; and
• How heat would be generated in the absence of the CDM project activity; and
• What would happen to the biomass residues in the absence of the project activity Power Baseline As indicated in the approved methodology following alternatives for power generation in the baseline shall be considered;
P1: The proposed project activity not undertaken as a CDM project activity;
P1 is a credible baseline scenario.
Identified Baseline Option
P2: If applicable,3 P2 is not considered as plausible alternative as the project activity in the baseline would not be operated under same conditions. Also there is no three years operational history before the start of implementation of the project.
the continuation of power generation in existing power plants at the project site. The existing plants would operate at the same conditions (e.g. installed capacities, average load factors, or average energy efficiencies, fuel mixes, and equipment configuration) as those observed in the most recent three years prior to the starting date of the project activity;
Excluded
3 This alternative is only applicable if there are existing plants operating at the project site.

PROJECT DESIGN DOCUMENT FORM (CDM PDD) - Version 03 CDM – Executive Board page 13
P3: If applicable3, the continuation of power generation in existing power plants at the project site. The existing plants would operate with different conditions from those observed in the most recent three years prior to the starting date of the project activity;
P3 cannot be considered as a credible alternative for sugar mill power expansion as there is a “reference plant” to be constructed in the baseline. Also there is no three years operational history for sugar mill existing plant before starting of the project.
Excluded
P4: If applicable3, the retrofitting of existing power plants at the project site. The retrofitting may or may not include a change in fuel mix;
P4 can be considered as probable alternative for project activity power plant as the current capacity and configuration doesn’t satisfy the captive electricity requirements in the sugar mill due to increased power demand from converting steam based system to electric motors and in the absence of the project activity a retrofitting of existing plant would result into the lower capacity reference plant to only suffice the sugar mill. The amount of electricity produced from steam saving is also included in reference plant to exclude its impact in project activity.
Identified Baseline Option
P5: The installation of new power plants at the project site different from those installed under the project activity;
In the absence of the project activity project entity would utilize grid electricity and hence P5 cannot be considered as plausible alternative.
Excluded
P6: The generation of power in specific off-site plants, excluding the power grid;
There is no specific off-site plant for the proposed project activity. Therefore P6 cannot be considered as plausible alternative.
Excluded
P7: The generation of power in the grid; P7 can be considered as plausible alternative as common practice for steel mills (similar industry) is to operate on grid power. Also this will not require significant investment as compared to project activity.
Identified Baseline Option
The plausible power baseline scenarios for the project activity are P1, P4 and P7.
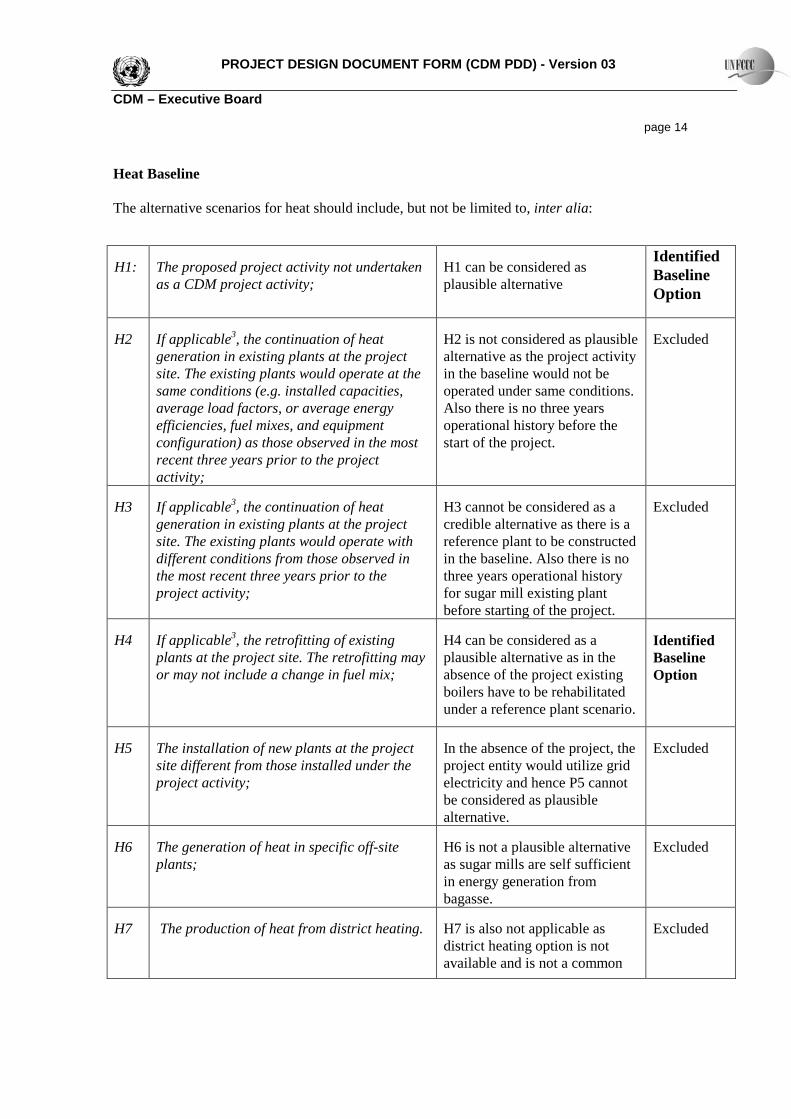
PROJECT DESIGN DOCUMENT FORM (CDM PDD) - Version 03 CDM – Executive Board page 14 Heat Baseline The alternative scenarios for heat should include, but not be limited to, inter alia:
H1: The proposed project activity not undertaken as a CDM project activity;
H1 can be considered as plausible alternative
Identified Baseline Option
H2 If applicable3, the continuation of heat generation in existing plants at the project site. The existing plants would operate at the same conditions (e.g. installed capacities, average load factors, or average energy efficiencies, fuel mixes, and equipment configuration) as those observed in the most recent three years prior to the project activity;
H2 is not considered as plausible alternative as the project activity in the baseline would not be operated under same conditions. Also there is no three years operational history before the start of the project.
Excluded
H3 If applicable3, the continuation of heat generation in existing plants at the project site. The existing plants would operate with different conditions from those observed in the most recent three years prior to the project activity;
H3 cannot be considered as a credible alternative as there is a reference plant to be constructed in the baseline. Also there is no three years operational history for sugar mill existing plant before starting of the project.
Excluded
H4 If applicable3, the retrofitting of existing plants at the project site. The retrofitting may or may not include a change in fuel mix;
H4 can be considered as a plausible alternative as in the absence of the project existing boilers have to be rehabilitated under a reference plant scenario.
Identified Baseline Option
H5 The installation of new plants at the project site different from those installed under the project activity;
In the absence of the project, the project entity would utilize grid electricity and hence P5 cannot be considered as plausible alternative.
Excluded
H6 The generation of heat in specific off-site plants;
H6 is not a plausible alternative as sugar mills are self sufficient in energy generation from bagasse.
Excluded
H7 The production of heat from district heating. H7 is also not applicable as district heating option is not available and is not a common
Excluded

PROJECT DESIGN DOCUMENT FORM (CDM PDD) - Version 03 CDM – Executive Board page 15
practice in Pakistan.
The most plausible scenarios for heat generation are H1 and H4. Biomass Baseline
For the use of biomass residues, the realistic and credible alternative(s) may include, inter alia:
B1: The biomass residues are dumped or left to decay mainly under aerobic conditions. This applies, for example, to dumping and decay of biomass residues on fields;
In the absence of CDM project activity the existing bagasse would be utilized for power and heat generation at sugar mill. However the extra amount of bagasse and rice husk required would be purchased from other sugar mills. As country produces huge amount of rice husk and large number of sugar and rice mills have surplus bagasse and husks which would otherwise left to decay, therefore this option can be considered as plausible baseline. Also during rainy season most of the rice husk get damage and there is no mechanism for its storage.
Identified Baseline Option
B2: The biomass residues are dumped or left to decay under clearly anaerobic conditions. This applies, for example, to landfills which are deeper than 5 meters. This does not apply to biomass residues that are stock-piled or left to decay on fields;
B2 is not applicable, as deep landfills are not the case in Pakistan for dumping agricultural residues.
Excluded
B3: The biomass residues are burnt in an uncontrolled manner without utilizing it for energy purposes;
The project proponent will utilize self generated bagasse from sugar mill, previously used in sugar mill. Therefore B3 is not applicable baseline scenario.
Excluded
B4: The biomass residues are used for power or heat generation at the project site in new and/or existing plants;
B4 can be considered as plausible alternative as biomass residues produced in the sugar mill (bagasse) will be used in the project plant.
Identified Baseline Option

PROJECT DESIGN DOCUMENT FORM (CDM PDD) - Version 03 CDM – Executive Board page 16
B5: The biomass residues are used for power or heat generation at other sites in new and/or existing plants;
Project proponents were already using bagasse prior to the implementation of project activity therefore B5 cannot be considered as plausible alternative.
Excluded
B6: The biomass residues are used for other energy purposes, such as the generation of biofuels;
B6 is not applicable as there is no bio-fuel production facility generating bio-fuels from rice husk in Pakistan.
Excluded
B7: The biomass residues are used for non-energy purposes, e.g. as fertilizer or as feedstock in processes (e.g. in the pulp and paper industry);
B7 is not applicable as in Pakistan the biomass residues are not used as feedstock for fertilizer as the market is dominated by chemical fertilizers.
Excluded
B8: Biomass residues are purchased from a market, or biomass residues retailers, or the primary source of the biomass residues and/or their fate in the absence of the project activity cannot be clearly identified.
Project proponent intended to utilize existing bagasse in the sugar mill in reference baseline plant, therefore B8 cannot be considered as plausible alternative
Excluded
So the plausible alternatives for biomass residues are B1 and B4. As per the guidance of ACM0006 v11.1 following table should be explained with respect to the project activity.

PROJECT DESIGN DOCUMENT FORM (CDM PDD) - Version 03 CDM – Executive Board page 17
Outcome of Step 1a:
Scenario Baseline Options
Description of Situation Power Heat Biomass
residues
1 P1 H1 B1, B4 The Project activity without being considered as CDM activity.
2 P4 and P7 H4, B1, B4 Reference plant installed capacity of 23 MW and
importing 20 MW of electricity for steel mill from grid.
Sub-step 1b: Consistency with mandatory applicable laws and regulations All of the alternative scenarios identified in sub-step 1a are in compliance with all mandatory applicable laws and regulations; therefore they are all available to the project owner. The proposed project activity without considering as a CDM project activity is not the only alternative among them.
Biomass residues category (k)
Biomass residues type
Biomass residues source
Biomass residues fate in the absence of the project activity
Biomass residues use in project scenario
Biomass residues quantity (tonnes)
1 Bagasse On-site production
Electricity generation on-site (B4:)
Electricity generation on-site (biomass-only boiler)
176,750
2 Bagasse Off-site from an identified Sugar mill
Dumped (B1:)
Electricity generation on-site (biomass-only boiler)
40,881
3 Rice husks Off-site from an identified rice mill
Dumped (B1:)
Electricity generation on-site (biomass-only boiler)
51,292

PROJECT DESIGN DOCUMENT FORM (CDM PDD) - Version 03 CDM – Executive Board page 18 Outcome of Step 1b: As all the alternatives are in compliance with national laws and regulations therefore all the above scenarios can be considered for further analysis in step 2.
Scenario Baseline Options
Description of Situation Power Heat Biomass
residues
1 P1, H1 B4 and B8 The Project activity without being considered as CDM activity.
2 P4 and P7 H4, B4 Reference plant installed capacity of 23 MW and
importing 20 MW of electricity for steel mill from grid.
It is worth mentioning here that latest version of ACM0006 ver 11.1.0 prefer the use of biomass if it is already being used prior to the project activity. Unless there is additional steam demand for process in the baseline the benefit of biomass utilization is treated as uncertain. As in sugar mills the process heat demand remain the same and there is no need to install high pressure boilers and turbines and power generation under the project activity, therefore to remain conservative as biomass is already being used in sugar mill and is preferred as baseline biomass consumption. B.5. Description of how the anthropogenic emissions of GHG by sources are reduced below those that would have occurred in the absence of the registered CDM project activity (assessment and demonstration of additionality): >> As per the methodology ACM0006 Ver. 11.1 the demonstration of additionality is determined using the steps;
• STEP 1: Identification of alternative scenarios; • STEP 2: Barrier Analysis; • STEP 3: Investment Analysis (if applicable); • STEP 4: Common practice Analysis.
Step 1: Identification of alternative scenarios; This step has already been carried out in section B.4. in the determination of baseline options against the project activity. Step 2: Barrier analysis This step serves to identify barriers and to assess which alternatives are prevented by these barriers. Apply the following sub-steps:

PROJECT DESIGN DOCUMENT FORM (CDM PDD) - Version 03 CDM – Executive Board page 19 Sub-step 2a. Identify barriers that would prevent the implementation of alternative scenarios: Alternative Scenario 1: (Project Activity without CDM consideration)
i) Investment Barrier The project activity requires a massive capital investment as compared to power import from grid. Therefore there is an investment barrier for project proponents without considering any CDM benefits.
ii) Technological Barriers: The generation of power for steel mills in Pakistan is dominated through direct import from grid. However the steel mill under the project activity is - the first of its kind in Pakistan – that will get electricity from renewable source in high pressure boilers, which lead to technological challenges. The project activity has significant technological risks which make it impossible to raise conventional equity without the support of CDM revenues. The conventional boilers in sugar mills generate electricity at 24 bar pressure and therefore going upto 70 Bar pressure is the first of its kind specifically for captive requirements, which would otherwise be imported from grid.
iii) Barriers due to prevailing practice: The project activity is the first of its kind in Pakistan. It is not known to the project participants that any power plant previously in such dimensions (42 Mwe) for captive power requirements exists. The only existing projects Almoiz4 bagasse based cogeneration and Shakarganj5 biogas based energy generation have already made possible through CDM registration. However those above mention projects are grid connected exporting excess power to grid whereas the project activity is the first of its kind supplying electricity to steel mill, which would otherwise be imported from the grid. As the baseline for steel mills is the import of power for their induction furnaces from grid 6
i) Investment Barrier
. Alternative Scenario 2: (Grid Imports)
In the baseline situation the steel mill would have been importing electricity from the grid for which there is no investment barrier.
ii) Technological Barriers For alternative scenario 2, the power required for steel mill would be imported from the grid with no technical barrier and is an industry norm. 4 http://cdm.unfccc.int/Projects/DB/DNV-CUK1263988840.89/view 5 http://cdm.unfccc.int/Projects/Validation/DB/A3NHVX69CFJUAGP6TPZJSIU0ZU8MZN/view.html 6 http://pid.adb.org/pid/TaView.htm?projNo=42051&seqNo=01&typeCd=2

PROJECT DESIGN DOCUMENT FORM (CDM PDD) - Version 03 CDM – Executive Board page 20
iii) Prevailing Practice barriers Importing power from the grid for steel furnaces6 is the normal practice as mentioned above and therefore there is no prevailing practice barrier in this scenario. Sub-step 2b: Eliminate alternative scenarios which are prevented by the identified barriers: Following table indicates results of barrier analysis;
Barriers Alternative 1
(Project without CDM) Alternative 2
(Grid Imports)
Investment Yes No
Technological Yes No Lack of Prevailing Practice Yes No
Outcome of Step 2: The baseline option faces no barrier and import of grid power is also an industrial norm for steel furnaces, therefore can be considered as baseline scenario, which is also a common practice in Pakistan 6. STEP 3: Investment Analysis It indicates that the implementation of the project activity not undertaken as a CDM project face barriers and the baseline identified faces no barriers as compared to CDM project activity. Therefore the barrier analysis alone is sufficient to prove the additionality of this first of its kind project in Pakistan. STEP 4: Common Practice Analysis The Project activity is the first of its kind in Pakistan. It is the first steel mill known so far in Pakistan to utilize renewable energy to fulfill its captive requirement. As mentioned above that existing biomass based projects are already being implemented through CDM and this situation stresses that the project activity shall not be considered as common practice. Therefore, the project activity shall be considered additional. CDM consideration and real and continual effort in securing the CDM status: For project activities starting dates before and on 2nd August, 2008 the guidelines on demonstration and assessment of prior consideration of the CDM (EB 48, Annex 61) for which the starting date is prior to the date of publication of the PDD for global stakeholder consultation is demonstrated through following table;
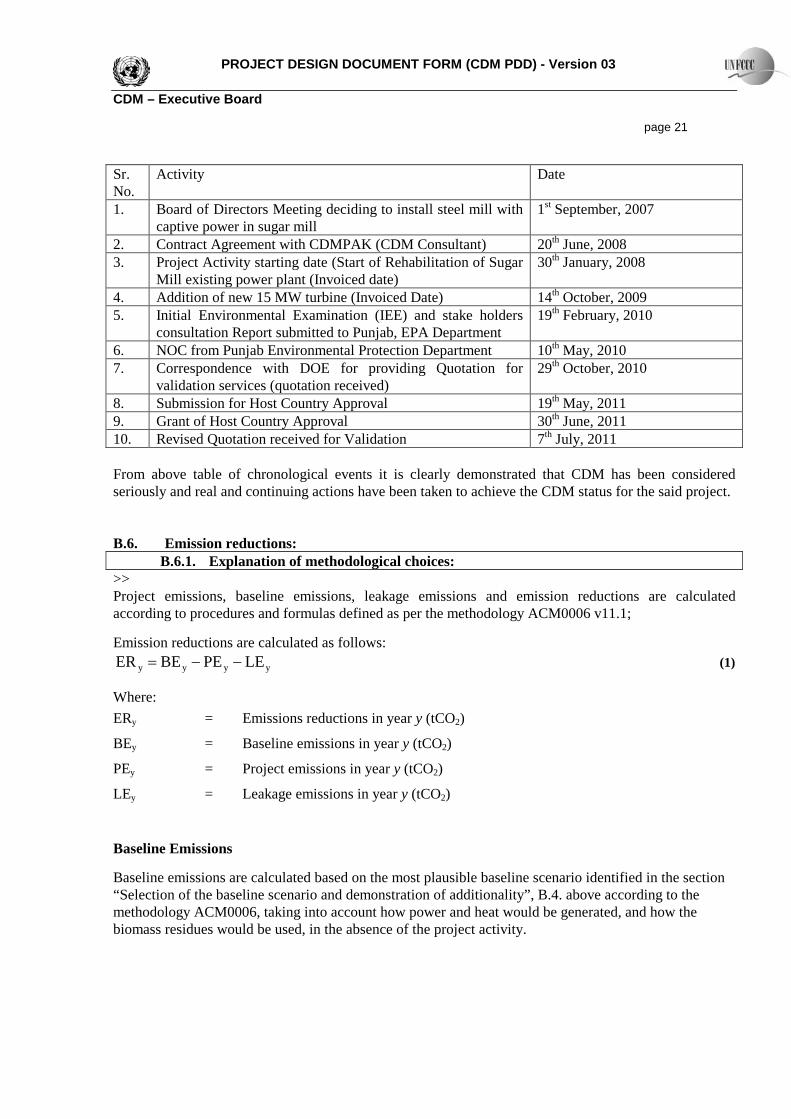
PROJECT DESIGN DOCUMENT FORM (CDM PDD) - Version 03 CDM – Executive Board page 21 Sr. No.
Activity Date
1. Board of Directors Meeting deciding to install steel mill with captive power in sugar mill
1st September, 2007
2. Contract Agreement with CDMPAK (CDM Consultant) 20th June, 2008 3. Project Activity starting date (Start of Rehabilitation of Sugar
Mill existing power plant (Invoiced date) 30th January, 2008
4. Addition of new 15 MW turbine (Invoiced Date) 14th October, 2009 5. Initial Environmental Examination (IEE) and stake holders
consultation Report submitted to Punjab, EPA Department 19th February, 2010
6. NOC from Punjab Environmental Protection Department 10th May, 2010 7. Correspondence with DOE for providing Quotation for
validation services (quotation received) 29th October, 2010
8. Submission for Host Country Approval 19th May, 2011 9. Grant of Host Country Approval 30th June, 2011 10. Revised Quotation received for Validation 7th July, 2011 From above table of chronological events it is clearly demonstrated that CDM has been considered seriously and real and continuing actions have been taken to achieve the CDM status for the said project. B.6. Emission reductions:
B.6.1. Explanation of methodological choices: >> Project emissions, baseline emissions, leakage emissions and emission reductions are calculated according to procedures and formulas defined as per the methodology ACM0006 v11.1;
Emission reductions are calculated as follows: yyyy LEPEBEER −−= (1)
Where: ERy = Emissions reductions in year y (tCO2)
BEy = Baseline emissions in year y (tCO2)
PEy = Project emissions in year y (tCO2)
LEy = Leakage emissions in year y (tCO2)
Baseline Emissions
Baseline emissions are calculated based on the most plausible baseline scenario identified in the section “Selection of the baseline scenario and demonstration of additionality”, B.4. above according to the methodology ACM0006, taking into account how power and heat would be generated, and how the biomass residues would be used, in the absence of the project activity.

PROJECT DESIGN DOCUMENT FORM (CDM PDD) - Version 03 CDM – Executive Board page 22 As explained in the methodology that in many cases, power and heat would be generated in the baseline by a combination of following three ways;
i) Use of biomass residues at the project site
ii) Use of fossil fuels at the project site.
iii) Power generation in the electricity grid.
and it may be difficult to clearly determine the precise mix of power generation in the grid and power or heat generation with biomass residues or fossil fuels that would have occurred in the absence of the project activity. If power can be generated in an on-site fossil fuel power plant or can be purchased from the grid, it is particularly challenging to determine how electricity would be generated in the baseline. For example, to what extent an existing coal power plant is dispatched and to what extent electricity is purchased from the grid can depend on the prices for electricity and coal which change over time. For this reason, this methodology adopts a conservative approach and assumes that biomass residues, if available, would be used in the baseline as a priority for the generation of power and heat.
Furthermore, it is assumed that the heat provided by heat generators is used first in heat engines which operate in cogeneration mode, then in thermal applications to satisfy the heat demand, and after that in heat engines which operate for the generation of power only.
Therefore taking into account above considerations, baseline emissions as calculated below would be lowest emission factor from import of grid power (more than 20% of the current steel industry usage) according to the methodology step 2 outcome options.
Based on these assumptions, baseline emissions are calculated as follows:
yBR,yFF,EG,yGR,EG,y,GR/FF,BLf
fy,FF,fy,HG,BL,yGR,EG,yGR,BL,y BE)EF,EFmin(ELEFFFEFELBE +⋅+⋅+⋅= ∑ (2)
Where: BEy = Baseline emissions in year y (tCO2)
ELBL,GR,y = Baseline minimum electricity generation in the grid in year y (MWh)
EFEG,GR,y = Grid emission factor in year y (tCO2/MWh)
FFBL,HG,y,f = Baseline fossil fuel demand for process heat in year y (GJ)
EFFF,y,f = CO2 emission factor for fossil fuel type f in year y (tCO2/GJ)
ELBL,FF/GR,y = Baseline uncertain electricity generation in the grid or on-site in year y (MWh)
EFEG,FF,y = CO2 emission factor for electricity generation with fossil fuels at the project site in the baseline in year y (tCO2/MWh)
BEBR,y = Baseline emissions due to disposal of biomass residues in year y (tCO2e)
y = Year of the crediting period
f = Fossil fuel type

PROJECT DESIGN DOCUMENT FORM (CDM PDD) - Version 03 CDM – Executive Board page 23 The algorithm used to determine the data above can be summarized as follows:
• Step 1: Determine biomass availability, generation and capacity constraints, efficiencies and power emission factors;
• Step 2: Determine the minimum baseline electricity generation in the grid;
• Step 3: Determine the baseline biomass-based heat and power generation;
• Step 4: Determine the baseline demand for fossil fuels to meet the balance of process heat and the corresponding electricity generation;
• Step 5: Determine the baseline emissions due to uncontrolled burning or decay of biomass residues;
• Step 6: Calculate baseline emissions. A flow chart is presented in following figure for ease of reference.

PROJECT DESIGN DOCUMENT FORM (CDM PDD) - Version 03 CDM – Executive Board page 24
Step 1.1: Baseline process heat generation
Step 1.2: Baseline electricity generation
Step 1.3: Baseline capacity of elect.
generation
Step 1.4 Baseline availability of
biomass residues
Step 5 Determine biomass
emissions
Step 1.7 Det. the grid emission
factor
Step 1.6 Det. on-site elect.
emission factor
Step 1.5 Determine efficiencies
EFEG,FF,y EFEG,GR,y
BEBR,y
Step 6 Calculate baseline
emissionsBEy
Step 2 Minimum grid electricity
generation
Step 3.1 Baseline biomass heat generation
Step 3.2 Baseline biomass
cogeneration
Step 3.3 Electricity in
power-only mode
Step 4.1 Baseline fossil fuels for process heat
Case 1
Step 3.2 (ctd.) Process heat extraction
Step 4.2 Cogen. of electricity with
fossil fuels
ELBL,GR,y
FFBL,HG,y,f
Case 4
Case 2Case 3
Case 4.3
Case 4.2Case 4.1
ELBL,FF/GR,y
FFBL,HG,y,f
ELBL,FF/GR,y
FFBL,HG,y,f
ELBL,FF/GR,y
Flow chart for the calculation of baseline emissions
PROJECT DESIGN DOCUMENT FORM (CDM PDD) - Version 03 CDM – Executive Board page 25 Step 1: Determine biomass availability, generation and capacity constraints, efficiencies and power emission factors in the baseline
Step 1.1: Determine total baseline process heat generation
The amount of process heat that would be generated in the baseline in year y (HCBL,y) is determined as the difference of the enthalpy of the process heat (steam or hot water) supplied to process heat loads in the project activity minus the enthalpy of the feed-water, the boiler blow-down and any condensate return to the heat generators. The respective enthalpies should be determined based on the mass (or volume) flows, the temperatures and, in case of superheated steam, the pressure. Steam tables or appropriate thermodynamic equations may be used to calculate the enthalpy as a function of temperature and pressure.7
yaux,PJ,y,imp,PJygross,PJ,yBL, ELELLEEL −+=
The process heat should be calculated net of any parasitic heat used for drying of biomass.
This methodology assumes for the sake of simplicity that the proposed CDM project activity consumes steam from the same quality as in baseline process transported through one steam header. Project activities in which the baseline includes multiple steam headers with different enthalpies may apply this procedure as if their process included only one steam header as this leads to a conservative outcome of the baseline emission estimation.
However, there may be cases where the baseline situations involve steam headers with different steam enthalpies and applying the algorithm as if there is one steam header may be difficult or may result in a very different baseline emission situation. For example, a baseline scenario could consist of biomass boilers generating low enthalpy steam for direct use as process heat while fossil fuel boilers would generate steam with a higher enthalpy for use in a backpressure turbine. In such cases the project participant may consider the existence of multiple steam headers as a technical constraint in the application of the algorithm (as specified in Steps 3 and 4).
Step 1.2: Determine total baseline electricity generation
The amount of electricity that would be generated in the baseline in year y is calculated as follows: (3)
Where: ELBL,y = Baseline electricity generation in year y (MWh)
ELPJ,gross,y = Gross quantity of electricity generated in all power plants which are located at the project site and included in the project boundary in year y (MWh)
ELPJ,imp,y = Project electricity imports from the grid in year y (MWh)
ELPJ,aux,y = Total auxiliary electricity consumption required for the operation of the power plants at the project site in year y (MWh)
y = Year of the crediting period
7 Heat supplied during the project activity to a district heating system shall count as process heat and be included in
the process heat.

PROJECT DESIGN DOCUMENT FORM (CDM PDD) - Version 03 CDM – Executive Board page 26 ELPJ,aux,y shall include all electricity required for the operation of equipment related to the preparation, storage and transport of biomass residues (e.g. for mechanical treatment of the biomass, conveyor belts, driers, etc.) and electricity required for the operation of all power or heat generating plants which are located at the project site and included in the project boundary (e.g. for pumps, fans, cooling towers, instrumentation and control, etc.).
For this methodology, it is assumed that transmission and distribution losses in the electricity grid are not influenced significantly by the project activity and are therefore not accounted for.
Step 1.3: Determine baseline capacity of electricity generation
The total capacity of electricity generation available in the baseline should be calculated using the equation below. The heat engines i and j should be obtained from the baseline scenario identified using the “Selection of the baseline scenario and demonstration of additionality” and the load factors should take into account seasonal operational constraints as well as other technical constraints in the system (e.g. availability of heat to drive heat engines).
( ) ( )
⋅+⋅⋅= ∑∑
jj,PO,EGj,PO,EG
ii,CG,EGi,CG,EGyy,total,EG LFCCAPLFCCAPLOCCAP (4)
Where: CAPEG,total,y = Baseline electricity generation capacity in year y (MWh)
CAPEG,CG,i = Baseline electricity generation capacity of heat engine i (MW)
CAPEG,PO,j = Baseline electricity generation capacity of heat engine j (MW)
LFCEG,CG,i = Baseline load factor of heat engine i (ratio)
LFCEG,PO,j = Baseline load factor of heat engine j (ratio)
LOCy = Length of the operational campaign in year y (hour)
i = Cogeneration-type heat engine in the baseline scenario
j = Power-only-type heat engine in the baseline scenario
y = Year of the crediting period
Step 1.4: Determine the baseline availability of biomass residues
Where the baseline scenario includes the use of biomass residues for the generation of power and/or heat, the amount of biomass residues of category n that would be available in the baseline in year y (BRB4,n,y) has to be determined.
The determination of this parameter shall be based on the monitored amounts of biomass residues used for power and/or heat generation in the project boundary for which B4: or BG3 has been identified as the most plausible baseline scenario in the CDM-PDD. The biomass residues quantities used should be monitored separately for (a) each type of biomass residue (e.g. sugarcane bagasse, rice husks, empty fruit bunches, etc.) and each source (e.g. produced on-site, obtained from biomass residues suppliers, obtained from a biomass residues market, obtained from an identified biomass residues producer, etc.).

PROJECT DESIGN DOCUMENT FORM (CDM PDD) - Version 03 CDM – Executive Board page 27 Where the whole amount of biomass residues of one particular type and from one particular source would be used in the baseline in clearly identifiable baseline heat generators, the monitored quantities of biomass residues used in the project can be directly allocated to those heat generators in the baseline scenario. However, the following situations require particular attention:
• One biomass residue type from one particular source could be used in the baseline in two or more heat generators. In this case, the use of this biomass residue type from this source has to be allocated to the different heat generators should they have different efficiencies;
• One biomass residue type from one particular source could have two different fates in the baseline scenario. The biomass categories 1 and 2 in Table 2 on page Error! Bookmark not defined. illustrate this situation: the rice husks are obtained from one source but would in the baseline partly be dumped (B1:) and partly be used for power generation (B4:). This can apply, for example, if parts of one biomass residue type were already collected prior to the implementation of the project activity while another part was not needed and thus dumped, left to decay or burnt. In this case, it is necessary to allocate the biomass residue quantity used under the project to the following fates in the baseline scenario:
(a) Power or heat generation (B4:), or
(b) Dumping, leaving to decay or burning (B1:, B2: and/or B3:), or
(c) Scenarios required for the purpose of calculating leakage effects: other fates (B5: - B8:).
Where one of these situations arises, the project participants should specify and justify in the CDM-PDD in a transparent manner how the relevant allocations should be made. The approaches used should be consistent with the identified baseline scenario and reflect the particular situation of the underlying project activity. In doing so, the following allocation rules should be adhered to:
• The sum of biomass residues used in the baseline for power or heat generation in all heat generators shall be equal to the total amount of biomass residues which are used under the project activity and for which the baseline scenario is B4;
• The allocation of biomass residues should be undertaken in a conservative manner. This means that in case of uncertainty an allocation rule should be applied that tends to result in lower emission reductions.
• In the case a biomass residues type from one particular source has been used prior to the implementation of the project activity partly in heat generators operated at the project site (scenario B4:) and partly has been dumped, left to decay or burnt (scenarios B1:, B2:, B3:) and if this situation would continue in the baseline scenario, then use, as a conservative approach to address the uncertainty associated with such an allocation, the maximum value among the following two approaches for the quantity of biomass residue of category n allocated to scenario B4:
(a) The quantity of biomass residue of category n is the highest annual historical use of that biomass residue type from that source for power and/or heat generation at the project site observed in the most recent three calendar years prior the date of submission of the PDD for validation of the project activity for which data is already available; and

PROJECT DESIGN DOCUMENT FORM (CDM PDD) - Version 03 CDM – Executive Board page 28
(b) In the case of projects that use biomass residues from a on-site production process (e.g. production of sugar cane or rice), the quantity of biomass residues of category n is calculated as follows:
⋅=−
−
−
−
2x
2x,n,HIST
1x
1x,n,HIST
x
x,n,HISTyyn,,4B P
BR;
PBR
;P
BRMAXPBR (5)
Where: BRB4,n,y = Quantity of biomass residues of category n used in the project activity in
year y for which the baseline scenario is B4: (tonne on dry-basis)
BRHIST,n,x = Quantity of biomass residues of category n used for power or heat generation at the project site in year x prior the date of submission of the PDD for validation of the project activity (tonnes on dry-basis) prior the date of submission of the PDD for validation of the project activity
Py = Quantity of the main product of the production process (e.g. sugar cane, rice) produced in year y from plants operated at the project site
Px = Quantity of the main product of the production process (e.g. sugar cane, rice) produced in year x from plants operated at the project site
y = Year of the crediting period
x = Last calendar year prior to the start of the crediting period for which data is already available at the date of submission of the PDD for validation
n = Biomass residue category
Step 1.5: Determine the efficiencies of heat generators, and efficiencies and heat-to-power ratio of heat engines
The efficiencies of heat generators and heat engines should be calculated using one of the following options:
Option 2: Manufacturer’s data. This option is only applicable to heat engines and heat generators that were operated at the project site prior to the implementation of the project activity (and not new equipment that would be constructed and operated at the project site in the baseline scenario). The efficiency of the heat generator or heat engine is determined based on manufacturer’s data of the efficiency under optimal operating conditions and take into account the actual conditions of the fuel used (including moisture content of biomass residues).
The heat-to-power ratio of cogeneration-type heat engines (e.g. backpressure and heat-extraction steam turbines) should be calculated as follows.

PROJECT DESIGN DOCUMENT FORM (CDM PDD) - Version 03 CDM – Executive Board page 29 Case 2: For heat engines without a minimum three-year operational history prior to the project activity the heat-to-power ratio should be determined as per the design conditions of the plant, for the configuration identified as baseline scenario in the “Selection of the baseline scenario and demonstration of additionality”.
Step 1.6: Determination of the emission factor of on-site electricity generation with fossil fuels
Not applicable as project baseline is not fossil based onsite electricity generation.
Step 1.7: Determination of the emission factor of grid electricity generation
The parameter EFEG,GR,y should be determined as the combined margin CO2 emission factor for grid to which the project activity is connected in year y, calculated using the latest approved version of the “Tool to calculate the emission factor for an electricity system”.
Step 2: Determine the minimum baseline electricity generation in the grid
The calculation of the minimum amount of electricity that would be generated in the grid in the baseline is based on the assumption that the amount of electricity generated on-site in the baseline cannot be higher than the installed capacity of power generation available in the baseline scenario. Therefore, the following equation should be used:
( )y,total,EGy,BLyGR,BL, CAPEL,0maxEL −= (13)
Where: ELBL,GR,y = Baseline minimum electricity generation in the grid in year y (MWh)
ELBL,y = Baseline electricity generation in year y (MWh)
CAPEG,total,y = Baseline electricity generation capacity in year y (MWh)
y = Year of the crediting period For baseline alternatives not connected to the grid or otherwise technically or legally impossible to export power to the grid ELBL,GR,y = 0.
Step 3: Determine the baseline biomass-based heat and power generation
Step 3.1: Determine the baseline biomass-based heat generation
It is assumed that the use of biomass residues for which scenario B4: has been identified as the baseline scenario (BRB4,n,y) would be prioritized over the use of any fossil fuels in the baseline. From that assumption, the equivalent amount of heat that would be generated with biomass residues (HGBL,BR,y) should be determined. Considering that the several heat generators and different categories of biomass residues might be identified as part of the baseline scenario, the prioritization of heat generators use and the allocation of biomass residues to different heat generators may be challenging and much dependent on specific site conditions. For that reason, the methodology proposes general principles that should be adhered to in
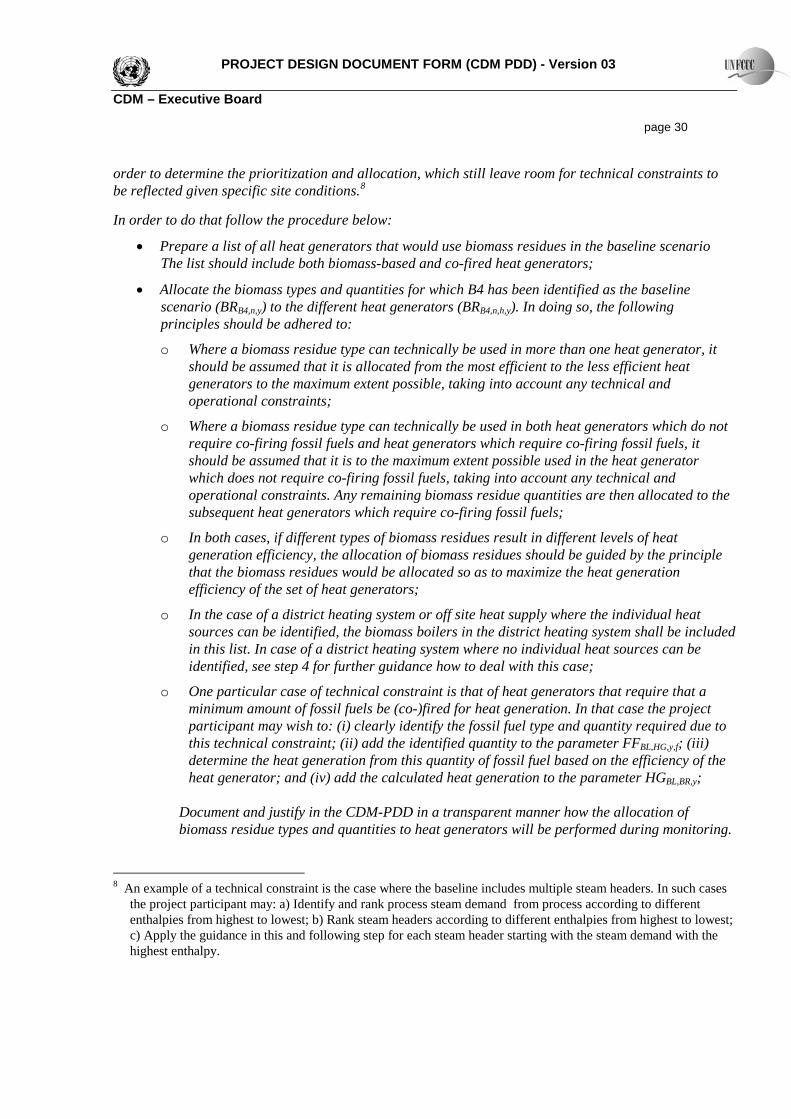
PROJECT DESIGN DOCUMENT FORM (CDM PDD) - Version 03 CDM – Executive Board page 30 order to determine the prioritization and allocation, which still leave room for technical constraints to be reflected given specific site conditions.8
• Prepare a list of all heat generators that would use biomass residues in the baseline scenario The list should include both biomass-based and co-fired heat generators;
In order to do that follow the procedure below:
• Allocate the biomass types and quantities for which B4 has been identified as the baseline scenario (BRB4,n,y) to the different heat generators (BRB4,n,h,y). In doing so, the following principles should be adhered to:
o Where a biomass residue type can technically be used in more than one heat generator, it should be assumed that it is allocated from the most efficient to the less efficient heat generators to the maximum extent possible, taking into account any technical and operational constraints;
o Where a biomass residue type can technically be used in both heat generators which do not require co-firing fossil fuels and heat generators which require co-firing fossil fuels, it should be assumed that it is to the maximum extent possible used in the heat generator which does not require co-firing fossil fuels, taking into account any technical and operational constraints. Any remaining biomass residue quantities are then allocated to the subsequent heat generators which require co-firing fossil fuels;
o In both cases, if different types of biomass residues result in different levels of heat generation efficiency, the allocation of biomass residues should be guided by the principle that the biomass residues would be allocated so as to maximize the heat generation efficiency of the set of heat generators;
o In the case of a district heating system or off site heat supply where the individual heat sources can be identified, the biomass boilers in the district heating system shall be included in this list. In case of a district heating system where no individual heat sources can be identified, see step 4 for further guidance how to deal with this case;
o One particular case of technical constraint is that of heat generators that require that a minimum amount of fossil fuels be (co-)fired for heat generation. In that case the project participant may wish to: (i) clearly identify the fossil fuel type and quantity required due to this technical constraint; (ii) add the identified quantity to the parameter FFBL,HG,y,f; (iii) determine the heat generation from this quantity of fossil fuel based on the efficiency of the heat generator; and (iv) add the calculated heat generation to the parameter HGBL,BR,y;
Document and justify in the CDM-PDD in a transparent manner how the allocation of biomass residue types and quantities to heat generators will be performed during monitoring.
8 An example of a technical constraint is the case where the baseline includes multiple steam headers. In such cases
the project participant may: a) Identify and rank process steam demand from process according to different enthalpies from highest to lowest; b) Rank steam headers according to different enthalpies from highest to lowest; c) Apply the guidance in this and following step for each steam header starting with the steam demand with the highest enthalpy.

PROJECT DESIGN DOCUMENT FORM (CDM PDD) - Version 03 CDM – Executive Board page 31
• Calculate the amount of heat generated with biomass residues based on the allocation rules established in the CDM-PDD using the following equations:
( )∑∑ ⋅⋅=h n
hBRHGBLynBRNCV ,,,,,yh,n,B4,yBR,BL, BRHG η (14)
Subject to,
∑∑∑ =n
yn,B4,h n
yh,n,B4, BRBR , i.e. the biomass residues used in each heat generator
should not exceed the total amount of biomass residues available. (15)
( ) h,HGhHG,yn
h,BR,HG,BLy,n,BRyh,n,B4, LFCCAPLOCNCVBR ⋅⋅≤η⋅⋅∑ , i.e. the heat
generation in each heat generator should not exceed the total capacity of the heat generator; (16)
Where: HGBL,BR,y = Baseline biomass-based heat generation in year y (GJ)
BRB4,n,h,y = Quantity of biomass residues of category n used in heat generator h in year y with baseline scenario B4 (tonne on dry-basis)
NCVBR,n,y = Net calorific value of biomass residue of category n in year y (GJ/tonne on dry-basis)
ηBL,HG,BR,h = Baseline biomass-based heat generation efficiency of heat generator h (ratio)
BRB4,n,y = Quantity of biomass residues of category n used in the project activity in year y for which the baseline scenario is B4: (tonne on dry-basis)
LOCy = Length of the operational campaign in year y (hour)
CAPHG,h = Baseline capacity of heat generator h (GJ/h)
LFCHG,h = Baseline load factor of heat generator h (ratio)
y = Year of the crediting period
h = Heat generator in the baseline scenario
Step 3.2: Determine the baseline biomass-based cogeneration of process heat and electricity and heat extraction
It is assumed that cogeneration of process heat and power using biomass-based heat (HGBL,BR,y) would be prioritized over the use of fossil fuels for the generation of process heat and power on-site. From that assumption the equivalent amount of electricity (ELBL,BR,CG,y) and process heat (HCBL,BR,CG,y) that would be generated are determined. Considering that the several heat engines of different types might be identified as part of the baseline scenario, the prioritization of heat engines use may be challenging and much dependent on specific site conditions. For that reason, the methodology proposes general principles that should be adhered to in

PROJECT DESIGN DOCUMENT FORM (CDM PDD) - Version 03 CDM – Executive Board page 32 order to determine the prioritization of use, which still leave room for technical constraints to be reflected given specific site conditions.
In order to do that follow the procedure below:
• Prepare a list containing the heat engines identified in the baseline scenario for which heat and power can be co-generated. The list should contain, in case of steam cycles, only back-pressure and heat-extraction steam turbines. Condensing steam turbines should not be considered at this stage;
• Allocate the total biomass-based heat (HGBL,BR,y) to the different heat engines (HGBL,BR,CG,y,i). In doing so, the following principles should be adhered to:
o Where heat can technically be used in more than one heat engine type, it should be assumed that it is allocated so as to maximize the co-generation of process heat. For instance, in case of steam cycles, if both back-pressure and heat-extraction steam turbines are identified in the baseline, heat should be first allocated to back-pressure turbines and then to heat-extraction turbines to the maximum extent possible, taking into account any technical and operational constraints;
o Subject to the allocation rule above, it should be assumed that heat is allocated from the most efficient to the less efficient heat engines to the maximum extent possible, taking into account any technical and operational constraints;
Document and justify in the CDM-PDD in a transparent manner how the allocation of biomass-based heat to heat engines will be performed during monitoring.
• Calculate the amount of electricity and process heat generation based on the allocation above using the following equations:
∑
⋅
++⋅=
iiy,CG,BR,BL,
defaulti,BLyCG,BR,BL, HG
)GGL1HPR(1
6.31EL (17)
∑
⋅
++=
i defaultiBL
iBL HGGGLHPR
HPRiy,CG,BR,BL,
,
,yCG,BR,BL, )1(
HC (18)
Subject to,
y,BR,BLi
iy,CG,BR,BL, HGHG ≤∑ , i.e. the biomass-based heat used in cogeneration mode should not
exceed the total biomass-based heat generated; (19)
yBL,,,, HC≤yCGBRBLHC , i.e. the process heat co-generated should not exceed the total process heat demand; (20) ( ) i,CG,EGiCG,EG,yiy,CG,BR,BL,i,CG,EG,BL LFCCAPLOCHG ⋅⋅≤⋅η , i.e. the electricity generation in each heat engine should not exceed the total capacity of the heat engine. (21)
Where: ELBL,BR,CG,y = Baseline biomass-based co-generated electricity in year y (MWh)
ηBL,EG,CG,i = Baseline electricity generation efficiency of heat engine i (MWh/GJ)
HGBL,BR,CG,y,i = Baseline biomass-based heat used in heat engine i in year y (GJ)
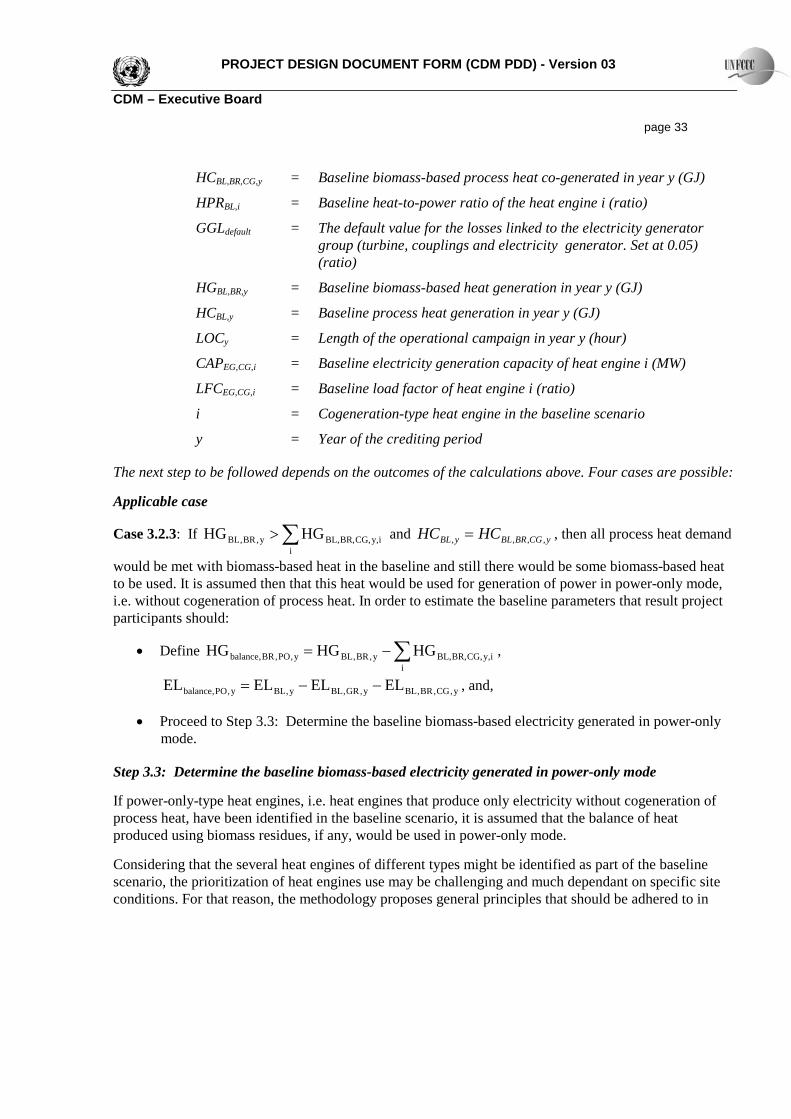
PROJECT DESIGN DOCUMENT FORM (CDM PDD) - Version 03 CDM – Executive Board page 33
HCBL,BR,CG,y = Baseline biomass-based process heat co-generated in year y (GJ)
HPRBL,i = Baseline heat-to-power ratio of the heat engine i (ratio)
GGLdefault = The default value for the losses linked to the electricity generator group (turbine, couplings and electricity generator. Set at 0.05) (ratio)
HGBL,BR,y = Baseline biomass-based heat generation in year y (GJ)
HCBL,y = Baseline process heat generation in year y (GJ)
LOCy = Length of the operational campaign in year y (hour)
CAPEG,CG,i = Baseline electricity generation capacity of heat engine i (MW)
LFCEG,CG,i = Baseline load factor of heat engine i (ratio)
i = Cogeneration-type heat engine in the baseline scenario
y = Year of the crediting period
The next step to be followed depends on the outcomes of the calculations above. Four cases are possible:
Applicable case
Case 3.2.3: If ∑>i
iy,CG,BR,BL,y,BR,BL HGHG and yCGBRBLyBL HCHC ,,,, = , then all process heat demand
would be met with biomass-based heat in the baseline and still there would be some biomass-based heat to be used. It is assumed then that this heat would be used for generation of power in power-only mode, i.e. without cogeneration of process heat. In order to estimate the baseline parameters that result project participants should:
• Define ∑−=i
iy,CG,BR,BL,y,BR,BLy,PO,BR,balance HGHGHG ,
y,CG,BR,BLy,GR,BLy,BLy,PO,balance ELELELEL −−= , and,
• Proceed to Step 3.3: Determine the baseline biomass-based electricity generated in power-only mode.
Step 3.3: Determine the baseline biomass-based electricity generated in power-only mode
If power-only-type heat engines, i.e. heat engines that produce only electricity without cogeneration of process heat, have been identified in the baseline scenario, it is assumed that the balance of heat produced using biomass residues, if any, would be used in power-only mode.
Considering that the several heat engines of different types might be identified as part of the baseline scenario, the prioritization of heat engines use may be challenging and much dependant on specific site conditions. For that reason, the methodology proposes general principles that should be adhered to in

PROJECT DESIGN DOCUMENT FORM (CDM PDD) - Version 03 CDM – Executive Board page 34 order to determine the prioritization of use, which still leave room for technical constraints to be reflected given specific site conditions.9
• Prepare a list containing the power-only-type heat engines (i.e. heat engines that do not co-generate any process heat) identified in the baseline scenario. The list should contain, in case of steam cycles, only condensing steam turbines. Back-pressure and heat-extraction steam turbines should not be considered here;
In order to do that follow the procedure below:
• Allocate the balance of biomass-based heat (HGbalance,BR,PO,y) to the different heat engines (HGBL,BR,PO,y,j). In doing so, the following principles should be adhered to:
o Where heat can technically be used in more than one heat engine, it should be assumed that heat is allocated from the most efficient to the less efficient heat engines to the maximum extent possible, taking into account any technical and operational constraints;
o Document and justify in the CDM-PDD in a transparent manner how the allocation of heat to heat engines will be performed during monitoring.
• Calculate the amount of electricity generated based on the allocation above using the following equations:
( )∑ η⋅=i
j,PO,EG,BLjy,PO,BR,BL,yPO,BR,BL, HGEL (22)
Subject to,
yPO,BR,balance,i
jy,PO,BR,BL, HGHG ≤∑ , i.e. the biomass-based heat used in the heat engines should
not exceed the biomass-based heat balance; (23) ( ) j,PO,EGjPO,EG,yj,PO,EG,BLjy,PO,BR,BL, LFCCAPLOCHG ⋅⋅≤η⋅ , i.e. the electricity generation in
each heat engine should not exceed the total capacity of the heat engine. (24)
Where: ELBL,BR,PO,y = Baseline biomass-based electricity (power-only) in year y (MWh)
HGBL,BR,PO,y,j = Baseline biomass-based heat used in heat engine j in year y (GJ)
ηBL,EG,PO,j = Average electric power generation efficiency of heat engine j (MWh/GJ)
HGbalance,BR,PO,y = Baseline biomass-based heat balance after cogeneration in year y (GJ)
LOCy = Length of the operational campaign in year y (hour)
CAPEG,PO,j = Baseline electricity generation capacity of heat engine j (MW)
LFCEG,PO,j = Baseline load factor of heat engine j (ratio)
9 An example of a technical constraint could be that the enthalpy of the biomass generated steam would not meet the
minimum enthalpy required for a power-only type heat engine. In that case it shall be assumed that there would be no power generated by biomass fired power-only heat engines in the baseline.

PROJECT DESIGN DOCUMENT FORM (CDM PDD) - Version 03 CDM – Executive Board page 35
The following cases are possible depending on the results of the calculations above:
Case 3.3.1: If y,PO,BR,BLy,PO,balance ELEL ≥ , the amount of electricity generated on-site in the baseline is either equal to or less than the amount of electricity generated in the project scenario. In that case:
• Define y,PO,BR,BLy,PO,balancey,GR/FF,BL ELELEL −= , ELPJ,offset,y = 0, FFBL,HG,y,f = 0, and,
Proceed to Step 5: Determine the baseline emissions due to uncontrolled burning or decay of biomass residues.
As the process heat in the baseline is equal to the project activity and there is no condensing turbine using extra steam in power only mode, therefore proceed to step 5.
Step 4: Determine the baseline emissions due to uncontrolled burning or decay of biomass residues
The calculation of baseline emissions due to uncontrolled burning or decay of biomass residues is optional and project participants can decide whether to include these emission sources or not. If project participants wish to include these emission sources, the procedure below should be followed, and emissions from combustion of biomass residues under the project activity should be also be determined. Otherwise, this section does not need to be applied and project emissions do not need to include emissions from the combustion of biomass residues under the project activity.
Baseline emissions due to uncontrolled burning or decay of biomass residues are only determined for those categories of biomass residues for which B1, B2 or B3 has been identified as the most plausible baseline scenario, as summarized in Table 2. The guidance provided before for the determination of the baseline scenario for biomass residues and allocation of biomass residues in the baseline should be considered in determining the quantities of biomass residues for each biomass residue category.
The emissions are determined separately for biomass residues categories for which scenarios B1 and B3 (aerobic decay or uncontrolled burning) apply, and for biomass residues categories for which scenario B2 (anaerobic decay) apply:
yB2,BR,yB1/B3,BR,yBR, BEBEBE += (35)
Where: BEBR,y = Baseline emissions due to disposal of biomass residues in year y (tCO2e)
BEBR,B1/B3,y = Baseline emissions due to aerobic decay or uncontrolled burning of biomass residues in year y (tCO2)
BEBR,B2,y = Baseline emissions due to anearobic decay of biomass residues in year y (tCO2)
To remain conservative the emissions from biomass in baseline is not considered.
Step 5: Calculate baseline emissions
The equation 2 of methodology can be reduced to following;
yGR,EG,yGR,BL,y EFBE ⋅= EL

PROJECT DESIGN DOCUMENT FORM (CDM PDD) - Version 03 CDM – Executive Board page 36 Project emissions
For the purpose of determining GHG emissions of the project activity, project participants shall include the following emissions sources:
• Emissions from fossil fuel consumption at the project site for the generation of electric power and heat and for auxiliary loads related to the generation of electric power and heat;
• CO2 emissions from grid-connected fossil fuel power plants in the electricity system for any electricity that is imported from the grid to the project site;
• If either y,PO,BR,BLy,PO,balance ELEL < (Case 3.3.2) or y,FF,BLy,FF,balance ELEL < (Case 4.2.2), CO2 emissions from grid-connected fossil fuel power plants in the electricity system due to reduction in electricity generation at the project site as compared to the baseline scenario;
• CO2 emissions from off-site transportation of biomass residues that are combusted in the project plant;
• If applicable, CH4 emissions from combustion of biomass residues for electric power and heat generation at the project site;
• If applicable, emissions from anaerobic treatment of wastewater originating from the treatment of the biomass residues prior to their combustion.
Project emissions are calculated as follows:
y,2BGyWW,yBR,yTR,y,2GRy,1GRyFF,y PEPEPEPEPEPEPEPE ++++++= (37)
Where: PEy = Project emissions in year y (tCO2)
PEFF,y = Emissions during the year y due to fossil fuel consumption at the project site (tCO2)
PEGR1,y = Emissions during the year y due to grid electricity imports to the project site (tCO2)
PEGR2,y = Emissions due to a reduction in electricity generation at the project site as compared to the baseline scenario in year y (tCO2)
PETR,y = Emissions during the year y due to transport of the biomass residues to the project plant (tCO2)
PEBR,y = Emissions from the combustion of biomass residues during the year y (tCO2e)
PEWW,y = Emissions from wastewater generated from the treatment of biomass residues in year y (tCO2e)
PEBG2,y = Emissions from the production of biogas in year y (tCO2e) The above equation 37 of the methodology can be reduced to following;
yTR,y PEPE =

PROJECT DESIGN DOCUMENT FORM (CDM PDD) - Version 03 CDM – Executive Board page 37 Determination of PETR,y
In cases where the biomass residues are not generated directly at the project site, project participants shall determine CO2 emissions resulting from transportation of the biomass residues to the project plant. In many cases transportation is undertaken by vehicles. Project participants may choose between two different approaches to determine emissions: an approach based on distance and vehicle type (Option 1) or on fuel consumption (Option 2).
Option 1
Emissions are calculated on the basis of distance and the number of trips (or the average truck load):
y,kmyyy,TR EFAVDNPE ⋅⋅= (40)
or
y,kmyy
y,TRy,TR EFAVD
TLBR
PE ⋅⋅= (41)
Where: PETR,y = Emissions during the year y due to transport of the biomass residues to the project plant
(tCO2)
Ny = Number of truck trips for the transportation of biomass during the year y
AVDy = Average round trip distance (from and to) between the biomass residues fuel supply sites and the site of the project plant during the year y (km)
EFkm,y = Average CO2 emission factor for the trucks measured during the year y (tCO2/km)
BRTR,y = Quantity of biomass residues that has been transported to the project site during the year y (tonnes of dry matter)
TLy = Average truck load of the trucks used during the year y (tonnes of dry matter)
Leakage
The main potential source of leakage for this project activity is an increase in emissions from fossil fuel combustion or other sources due to diversion of biomass residues from other uses to the project plant as a result of the project activity. Changes in carbon stocks in the LULUCF sector are expected to be insignificant since this methodology is limited to biomass residues, as defined in the applicability conditions above. The baseline scenarios for biomass residues for which this potential leakage is relevant are B5:, B6:, B7: and B8:.
The actual leakage emissions in each of these cases may differ significantly and depend on the specific situation of each project activity. For that reason, a simplified approach is used in this methodology: it is assumed that an equivalent amount of fossil fuels, on energy basis, would be used if biomass residues are diverted from other users, no matter what the use of biomass residues would be in the baseline scenario.

PROJECT DESIGN DOCUMENT FORM (CDM PDD) - Version 03 CDM – Executive Board page 38 Therefore, for the categories of biomass residues whose baseline scenario has been identified as B5:, B6:, B7: or B8:, project participants shall calculate leakage emissions as follows:
∑ ⋅⋅=n
y,n,BRy,n,8B/5BLE,2COy NCVBREFLE (45)
Where: LEy = Leakage emissions in year y (tCO2)
EFCO2,LE = CO2 emission factor of the most carbon intensive fossil fuel used in the country (tCO2/GJ)
BRB5/B8,n,y = Quantity of biomass residues of category n used in the project activity in year y, for which the baseline scenario is B5:, B6:, B7: or B8: (tonnes on dry-basis)
NCVBR,n,y = Net calorific value of biomass residue of category n in year y (GJ/tonne on dry-basis)
n = Biomass residue category
y = Year of the crediting period
The determination of BRB5/B8,n,y shall be based on the monitored amounts of biomass residues used in power plants included in the project boundary.
In the case that negative overall emission reductions arise in a year through application of the leakage emissions, CERs are not issued to project participants for the year concerned and in subsequent years, until emission reductions from subsequent years have compensated the quantity of negative emission reductions from the year concerned. For example, if negative emission reductions of 30 tCO2e occur in the year t and positive emission reductions of 100 tCO2e occur in the year t+1, only 70 CERs are issued for the year t+1.
According to the methodology, the main potential source of leakage for this project activity is an increase in emissions from fossil fuel combustion or other sources due to diversion of biomass residues from other uses to the project plant as a result of the project activity. Thus for the baseline scenario selected, the leakage for the biomass residues are not considered.
Emission reductions calculation According to the methodology, the emission reductions are calculated using eq 1 as follows:
yyyy LEPEBEER −−= (4)
Where: ERy = Emissions reductions in year y (tCO2)
BEy = Baseline emissions in year y (tCO2)
PEy = Project emissions in year y (tCO2)
LEy = Leakage emissions in year y (tCO2)

PROJECT DESIGN DOCUMENT FORM (CDM PDD) - Version 03 CDM – Executive Board page 39
B.6.2. Data and parameters that are available at validation:
The following are not monitored data and parameters:
Data / Parameter: Biomass residues categories and quantities used for the selection of the baseline scenario selection and assessment of additionality
Data unit: - Type (i.e. bagasse, rice husks, empty fruit bunches, etc.); - Source (e.g. produced on-site, obtained from an identified biomass residues producer, obtained from a biomass residues market, etc.); - Fate in the absence of the project activity (scenarios B); - Use in the project scenario (scenarios P); - Quantity (tonnes on dry-basis)
Description: Explain and document transparently in the CDM-PDD, using a table similar to Table 2, which quantities of which biomass residues categories are used in which installation(s) under the project activity and what is their baseline scenario. The last column of Table 2 corresponds to the quantity of each category of biomass residues (tonnes). For the selection of the baseline scenario and demonstration of additionality, at the validation stage, an ex ante estimation of these quantities should be provided
Source of data used: On-site assessment of biomass residues categories and quantities Value applied:
Type Source Fate Use in Project Quantity Bagasse Indigenous
Sugar Cane Milling
Used in existing Sugar Mill cogeneration plant
Cogeneration of Power and Heat
176,750
Bagasse Purchased Sugar Cane Milling
Dumped Cogeneration of Power and Heat
40,881 (30% of extra demand)
Rice Husk
Rice Milling Dumped Cogeneration of Power and Heat
51,292 (70% of extra demand)
Note: The values are on wet basis
Justification of the choice of data or description of measurement methods and procedures actually applied :
Sugar Mill standard procedures. Purchase receipts and weighing records will be cross matched with actual biomass fired in project activity.
Any comment: --

PROJECT DESIGN DOCUMENT FORM (CDM PDD) - Version 03 CDM – Executive Board page 40 Data / Parameter: BRHIST,n,x
Data unit: tonnes on dry-basis Description: BRHIST,n,x = Quantity of biomass residues of category n used for power or heat
generation at the project site in year x prior the date of submission of the PDD for validation of the project activity (tonnes on dry-basis) prior the time of submission of the PDD for validation of the project activity
Source of data used: On-site measurements Value applied:
Year BRHIST,n,x 2007-08 194,342 2008-09 126,819 2009-10 129,156 2010-11 176,750
Note: Values are on wet basis
Justification of the choice of data or description of measurement methods and procedures actually applied :
Use weight or volume meters. Adjust for the moisture content in order to determine the quantity of dry biomass. The quantity shall be cross-checked with the quantity of heat generated and any fuel purchase receipts (if available).
Any comment: -- Data / Parameter: BRHIST,n,x
Data unit: tonnes on dry-basis Description: BRHIST,n,x = Quantity of biomass residues of category n used for power or heat
generation at the project site in year x prior the date of submission of the PDD for validation of the project activity (tonnes on dry-basis) prior the time of submission of the PDD for validation of the project activity
Source of data used: On-site measurements Value applied:
Year BRHIST,n,x 2008-09 126,819 2009-10 129,156 2010-11 176,750
Note: Values are on wet basis
Justification of the choice of data or description of measurement methods and procedures
Use weight or volume meters. Adjust for the moisture content in order to determine the quantity of dry biomass. The quantity shall be cross-checked with the quantity of heat generated and any fuel purchase receipts (if available).

PROJECT DESIGN DOCUMENT FORM (CDM PDD) - Version 03 CDM – Executive Board page 41 actually applied : Any comment: --
Data / Parameter: Px Data unit: Use suitable units, as appropriate (tonnes) Description: Px = Quantity of the main product of the production process (e.g. sugar cane,
rice) produced in year x from plants operated at the project site Source of data used: On-site measurements Value applied:
2010-11 2009-10 2008-09 601,292 460,892 453,039
Justification of the choice of data or description of measurement methods and procedures actually applied :
Data from sugar mill
Any comment: --
Data / Parameter: CAPHG,h Data unit: GJ/h Description: CAPHG,h = Baseline capacity of heat generator h (GJ/h) Source of data used: On-site measurements or reference plant design parameters Value applied:
This parameter should reflect the design maximum heat generation capacity (in GJ/h) of the baseline heat generator h. It should be based on the installed capacity of the heat generator. Project participants should document transparently and justify in the CDM-PDD how this parameter was determined
h1 h2 h3
188 198 198
Justification of the choice of data or description of measurement methods and procedures actually applied :
Value applied for reference plant based on maximum design (installed) heat capacity. In the baseline 3 heat generators each with capacity of 60 TPH with 24, 60 and 60 Bar pressures. Accordingly the heat generation capacity in GJ is calculated.
Any comment: --
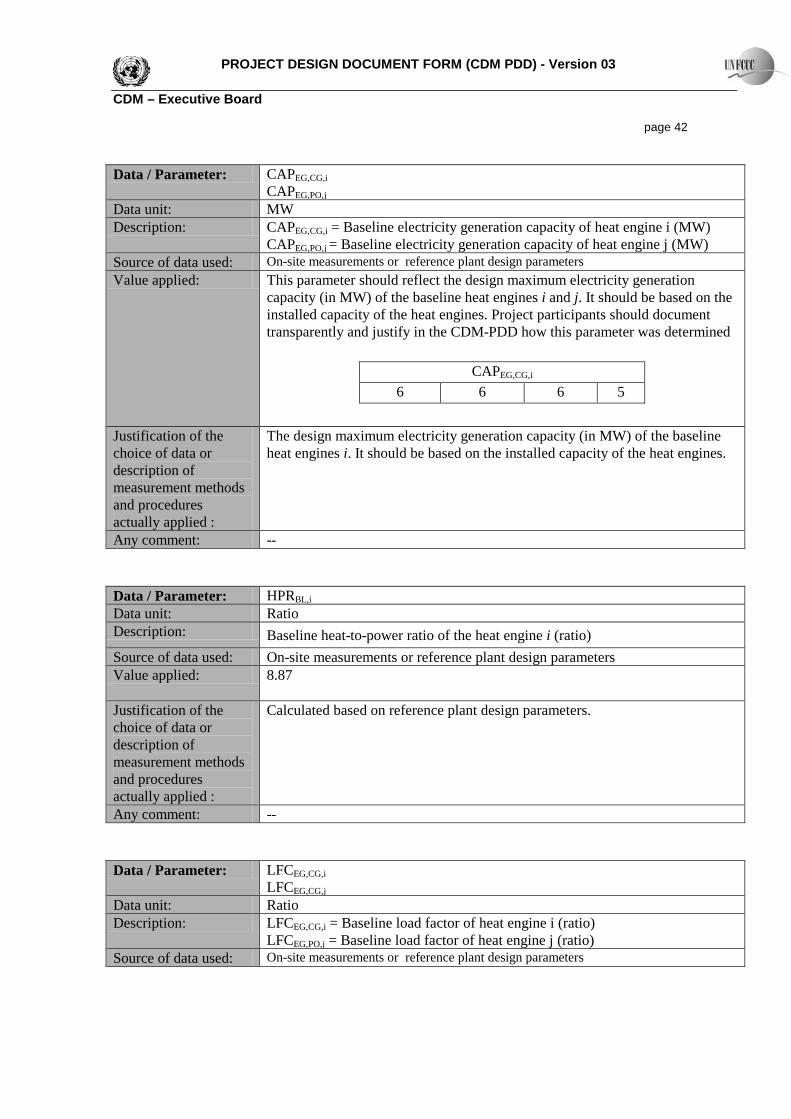
PROJECT DESIGN DOCUMENT FORM (CDM PDD) - Version 03 CDM – Executive Board page 42 Data / Parameter: CAPEG,CG,i
CAPEG,PO,j
Data unit: MW Description: CAPEG,CG,i = Baseline electricity generation capacity of heat engine i (MW)
CAPEG,PO,j = Baseline electricity generation capacity of heat engine j (MW) Source of data used: On-site measurements or reference plant design parameters Value applied: This parameter should reflect the design maximum electricity generation
capacity (in MW) of the baseline heat engines i and j. It should be based on the installed capacity of the heat engines. Project participants should document transparently and justify in the CDM-PDD how this parameter was determined
CAPEG,CG,i 6 6 6 5
Justification of the choice of data or description of measurement methods and procedures actually applied :
The design maximum electricity generation capacity (in MW) of the baseline heat engines i. It should be based on the installed capacity of the heat engines.
Any comment: --
Data / Parameter: HPRBL,i Data unit: Ratio Description: Baseline heat-to-power ratio of the heat engine i (ratio) Source of data used: On-site measurements or reference plant design parameters Value applied: 8.87
Justification of the choice of data or description of measurement methods and procedures actually applied :
Calculated based on reference plant design parameters.
Any comment: --
Data / Parameter: LFCEG,CG,i LFCEG,CG,j
Data unit: Ratio Description: LFCEG,CG,i = Baseline load factor of heat engine i (ratio)
LFCEG,PO,j = Baseline load factor of heat engine j (ratio) Source of data used: On-site measurements or reference plant design parameters

PROJECT DESIGN DOCUMENT FORM (CDM PDD) - Version 03 CDM – Executive Board page 43 Value applied: 0.8 Justification of the choice of data or description of measurement methods and procedures actually applied :
This parameter should reflect the maximum load factor (i.e. the ratio between the ‘actual electricity generation’ of the heat engine and its ‘design maximum electricity generation’ along one year of operation) of the baseline heat engine I or j. The actual electricity generation of the heat engine should be determined taking into account downtime due to maintenance, seasonal operational patterns, and any other technical constraints.
Any comment:
Data / Parameter: NCVBR,n,x Data unit: GJ/tonnes on dry-basis Description: Net calorific value of biomass residues of category n in year x Source of data used: Either conduct measurements or use accurate and reliable local or national data
where available. Where such data is not available, use IPCC default net calorific values (country-specific, if available) if they are deemed to reasonably represent local circumstances. Choose the values in a conservative manner and justify the choice
Value applied: 7.58 on wet basis Justification of the choice of data or description of measurement methods and procedures actually applied :
Measurements shall be carried out at reputed laboratories and according to relevant international standards
Any comment: The NCV is to be calculated for wet biomass as used in the heat generator (i.e. deducting the energy used for the evaporation of the water contained in the biomass residues).
Data / Parameter: EFgrid,CM,y Data unit: tCO2-eq Description: Combined margin emission factor for grid electricity Source of data used: Pakistan Energy Year Book (2008-10) Value applied: 0.517 Justification of the choice of data or description of measurement methods and procedures actually applied :
Calculated based on latest tool to calculate the emission factor of electricity system.
Any comment: --

PROJECT DESIGN DOCUMENT FORM (CDM PDD) - Version 03 CDM – Executive Board page 44
B.6.3. Ex-ante calculation of emission reductions: >>
According to the methodology steps mentioned in the section B.6.1, baseline emissions are calculated as follows:
yBR,yFF,EG,yGR,EG,y,GR/FF,BLf
fy,FF,fy,HG,BL,yGR,EG,yGR,BL,y BE)EF,EFmin(ELEFFFEFELBE +⋅+⋅+⋅= ∑ Step 6: Determine biomass availability, generation and capacity constraints, efficiencies and power emission factors in the baseline
Step 1.8: Determine total baseline process heat generation
For the project activity the baseline is the “reference plant” and the amount of heat generated for process is determined for sugar mill. Process Heat generated in sugar mill is normally of different enthalpies and contained in different headers. However to remain conservative the maximum enthalpy is considered to maximize the baseline process heat generation.
HCBL, = (180tons/day*120days*24hrs* ((2.748 GJ/ton) – (feed water 0.4 GJ/ton) = 1217.2 TJ
Step 1.9: Determine total baseline electricity generation
The total amount of electricity that would be generated in the baseline in year y is calculated as follows:
yaux,PJ,y,imp,PJygross,PJ,yBL, ELELLEEL −+=
Year (y) ELBL,y
(MWh) ELPJ,gross,y
(MWh) ELPJ,imp,y
(MWh) ELPJ,aux,y
(MWh)
2012 105,327
53,030
57,600
5,303
Step 1.10: Determine baseline capacity of electricity generation
( ) ( )
⋅+⋅⋅= ∑∑
jj,PO,EGj,PO,EG
ii,CG,EGi,CG,EGyy,total,EG LFCCAPLFCCAPLOCCAP
Year (y) CAPEG,total,y CAPEG,CG,i CAPEG,PO,j LFCEG,CG,i LFCEG,PO,j LOCy
2012 49,266 23 0 0.85 0 2520

PROJECT DESIGN DOCUMENT FORM (CDM PDD) - Version 03 CDM – Executive Board page 45 Step 1.4: Determine the baseline availability of biomass residues
⋅=−
−
−
−
2x
2x,n,HIST
1x
1x,n,HIST
x
x,n,HISTyyn,,4B P
BR;
PBR
;P
BRMAXPBR
Py BRHIST,n,x-2 BRHIST,n,x-1 BRHIST,n,x Px-2 Px-1 Px
2008-09 2009-10 2010-11 2008-09 2009-10 2010-11
601,292 126,819 129,156 176,750 453,039 460,892 601,292
Step 1.11: Determine the efficiencies of heat generators, and efficiencies and heat-to-power ratio of heat engines
Heat Generator Eff Heat Engine Eff HPR
Heat Engines
1 70% 5 MW 85% 16.8693 HE1 2 75%
6+6+6 MW 85% 4.8633 HE2, HE3,
HE4 3 75% 85% 4.8633
Step 1.12: Determination of the emission factor of on-site electricity generation with fossil fuels Not required as no fossil based identified as baseline Step 1.7: Determination of the emission factor of grid electricity generation
Year 2008 EFOM (tCO2/GWh) 0.6634
Annual generation (GWh) 46,194 Year 2009
EFOM (tCO2/GWh) 0.6805 Annual generation (GWh) 44,096
Year 2010 EFOM (tCO2/GWh) 0.6884
Annual generation (GWh) 46,320 Combined Margin
EFCM = 0.5*EFOM,2008-2010 + 0.5*EFBM,2010 = 0.517
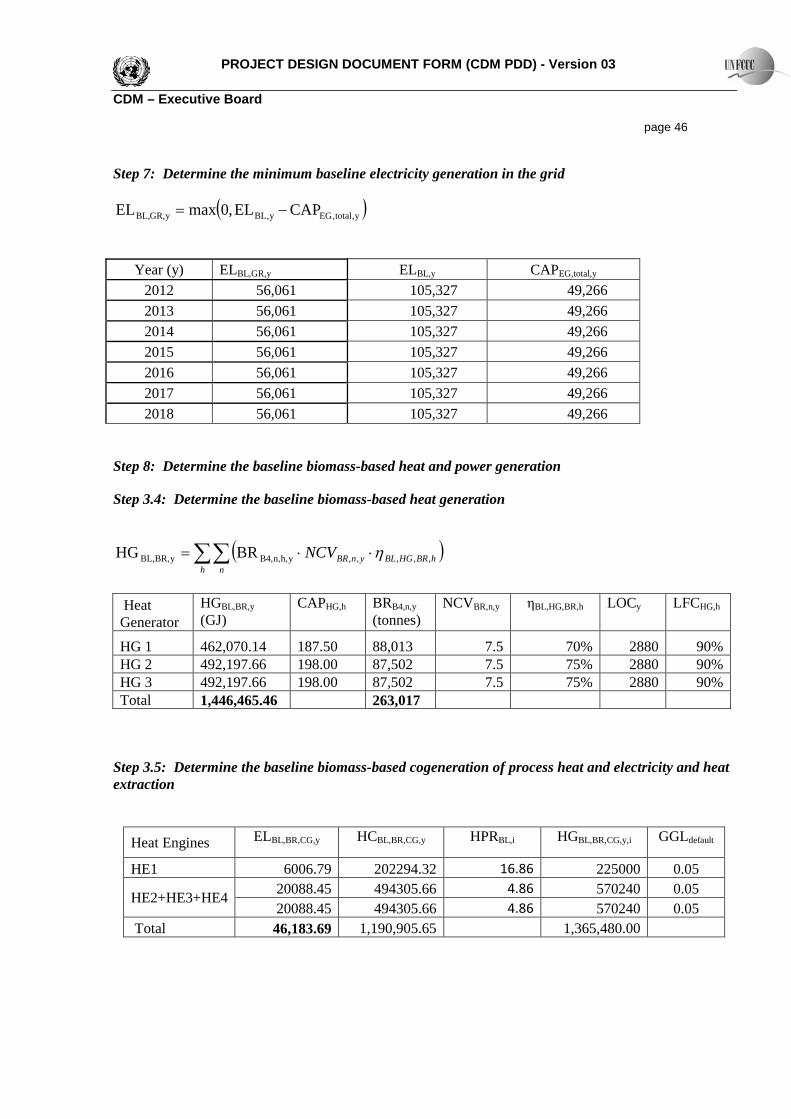
PROJECT DESIGN DOCUMENT FORM (CDM PDD) - Version 03 CDM – Executive Board page 46 Step 7: Determine the minimum baseline electricity generation in the grid
( )y,total,EGy,BLyGR,BL, CAPEL,0maxEL −=
Year (y) ELBL,GR,y ELBL,y CAPEG,total,y 2012 56,061 105,327 49,266 2013 56,061 105,327 49,266 2014 56,061 105,327 49,266 2015 56,061 105,327 49,266 2016 56,061 105,327 49,266 2017 56,061 105,327 49,266 2018 56,061 105,327 49,266
Step 8: Determine the baseline biomass-based heat and power generation
Step 3.4: Determine the baseline biomass-based heat generation
( )∑∑ ⋅⋅=
h nhBRHGBLynBRNCV ,,,,,yh,n,B4,yBR,BL, BRHG η
Heat Generator
HGBL,BR,y (GJ)
CAPHG,h BRB4,n,y (tonnes)
NCVBR,n,y ηBL,HG,BR,h LOCy LFCHG,h
HG 1 462,070.14 187.50 88,013 7.5 70% 2880 90% HG 2 492,197.66 198.00 87,502 7.5 75% 2880 90% HG 3 492,197.66 198.00 87,502 7.5 75% 2880 90% Total 1,446,465.46 263,017
Step 3.5: Determine the baseline biomass-based cogeneration of process heat and electricity and heat extraction
Heat Engines ELBL,BR,CG,y HCBL,BR,CG,y HPRBL,i HGBL,BR,CG,y,i GGLdefault
HE1 6006.79 202294.32 16.86 225000 0.05
HE2+HE3+HE4 20088.45 494305.66 4.86 570240 0.05 20088.45 494305.66 4.86 570240 0.05
Total 46,183.69 1,190,905.65 1,365,480.00

PROJECT DESIGN DOCUMENT FORM (CDM PDD) - Version 03 CDM – Executive Board page 47
B.6.4 Summary of the ex-ante estimation of emission reductions: >>
Year Estimation of
Baseline Emissions (tCO2e)
Estimation of Project Activity Emissions
(tCO2e)
Estimation of Leakages (tCO2e)
Estimation of Overall Emission
Reductions (tCO2e)
2012 14,478.09 135.50 0 14,342.59 2013 28,956.19 271.37 0 28,684.82 2014 28,956.19 271.37 0 28,684.82 2015 28,956.19 271.37 0 28,684.82 2016 28,956.19 271.37 0 28,684.82 2017 28,956.19 271.37 0 28,684.82 2018 28,956.19 271.37 0 28,684.82 2019 14,478.09 135.50 0 14,342.59
Total (7 Yrs) 202,693.31 1,899.60 0 200,793.71
B.7. Application of the monitoring methodology and description of the monitoring plan: >>
B.7.1 Data and parameters monitored: Data / Parameter: Biomass residues categories and quantities used in the project activity Data unit: - Type;
- Source; - Fate in the absence of the project activity (scenarios B); - Use in the project scenario (scenarios P and H); - Quantity (tonnes on dry-basis)
Description: Explain and document transparently in the CDM-PDD, using a table similar to Table 2, which quantities of which biomass residues categories are used in which installation(s) under the project activity and what is their baseline scenario.
The last column of Table 2 corresponds to the quantity of each category of biomass residues (tonnes on dry-basis). These quantities should be updated every year of the crediting period as part of the monitoring plan so as to reflect the actual use of biomass residues in the project scenario. These updated values should be used for emissions reductions calculations.
Along the crediting period, new categories of biomass residues (i.e. new types, new sources, with different fate) can be used in the project activity. In this case, a new line should be added to the table. If those new categories are of the type B1:, B2: or B3:, the baseline scenario for those types of biomass residues should be assessed using the procedures outlined in the guidance provided in the procedure for the selection of the baseline scenario and demonstration of additionality
Source of data to be On-site measurements

PROJECT DESIGN DOCUMENT FORM (CDM PDD) - Version 03 CDM – Executive Board page 48 used: Value of data applied for the purpose of calculating expected emission reductions in section B.5
Type Source Fate Use in Project Quantity Bagasse Indigenous
Sugar Cane Milling
Used in existing Sugar Mill cogeneration plant
Cogeneration of Power and Heat
176,750
Bagasse Purchased Sugar Cane Milling
Dumped Cogeneration of Power and Heat
40,881 (30% of extra demand)
Rice Husk
Rice Milling Dumped Cogeneration of Power and Heat
51,292 (70% of extra demand)
Description of measurement methods and procedures to be applied:
Use weight meters. Adjust for the moisture content in order to determine the quantity of dry biomass
QA/QC procedures to be applied:
Crosscheck the measurements with an annual energy balance that is based on purchased quantities and stock changes
Any comment: -- Data / Parameter: BRB4,n,y Data unit: tonnes on dry-basis Description: BRB4,n,y = Quantity of biomass residues of category n used in the project activity
in year y for which the baseline scenario is B4: (tonne on dry-basis) Source of data to be used:
On-site measurements
Value of data applied for the purpose of calculating expected emission reductions in section B.5
Category (n) Quantity Bagasse Indigenous 230,140
Description of measurement methods and procedures to be applied:
Use weight meters. Adjust for the moisture content in order to determine the quantity of dry biomass. Data monitored continuously and aggregated as appropriate, to calculate emissions reductions
QA/QC procedures to be applied:
Crosscheck the measurements with an annual energy balance that is based on purchased quantities and stock changes

PROJECT DESIGN DOCUMENT FORM (CDM PDD) - Version 03 CDM – Executive Board page 49 Any comment: The procedures in Step 1.4 on page 26 should also be followed Data / Parameter: BRTR,y Data unit: tonnes on dry-basis Description: BRTR,y = Quantity of biomass residues that has been transported to the project
site during the year y (tonnes of dry matter) Source of data to be used:
On-site measurements
Value of data applied for the purpose of calculating expected emission reductions in section B.5
136,269 (on Wet Basis)
Description of measurement methods and procedures to be applied:
Use weight or volume meters. If volume meters are used convert to mass units using the density of each category of biomass residues. Adjust for the moisture content in order to determine the quantity of dry biomass. Data monitored continuously and aggregated as appropriate, to calculate emissions reductions
QA/QC procedures to be applied:
Crosscheck the measurements with an annual energy balance that is based on purchased quantities and stock changes
Any comment: --- Data / Parameter: EFkm,y Data unit: tCO2/km Description: EFkm,y = Average CO2 emission factor for the trucks measured during the year y
(tCO2/km) Source of data to be used:
Conduct sample measurements of the fuel type, fuel consumption and distance travelled for all truck types.
Value of data applied for the purpose of calculating expected emission reductions in section B.5
0.000319
Description of measurement methods and procedures to be applied:
Calculate CO2 emissions from fuel consumption by multiplying with appropriate net calorific values and CO2 emission factors. For net calorific values and CO2 emission factors, use reliable national default values or, if not available, (country-specific) IPCC default values. Alternatively, choose emission factors applicable for the truck types used from the literature in a conservative manner (i.e. the higher end within a plausible range)
QA/QC procedures to be applied:
Cross-check measurement results with emission factors referred to in the literature
Any comment: --- Data / Parameter: HCBL,y

PROJECT DESIGN DOCUMENT FORM (CDM PDD) - Version 03 CDM – Executive Board page 50 Data unit: GJ Description: HCBL,y = Baseline process heat generation in year y (GJ) Source of data to be used:
On-site measurements
Value of data applied for the purpose of calculating expected emission reductions in section B.5
1,065,053
Description of measurement methods and procedures to be applied:
Calculated based on continuously monitored data and aggregated as appropriate, to calculate emissions reductions
QA/QC procedures to be applied:
This parameter should be determined as the difference of the enthalpy of the process heat (steam or hot water) supplied to process heat loads in the project activity minus the enthalpy of the feed-water, the boiler blow-down and any condensate return ot the heat generators. The respective enthalpies should be determined based on the mass (or volume) flows, the temperatures and, in case of superheated steam, the pressure. Steam tables or appropriate thermodynamic equations may be used to calculate the enthalpy as a function of temperature and pressure.
Any comment: -- Data / Parameter: ELPJ,gross,y Data unit: MWh Description: ELPJ,gross,y = Gross quantity of electricity generated in all power plants which are
located at the project site and included in the project boundary in year y (MWh) Source of data to be used:
On-site measurements
Value of data applied for the purpose of calculating expected emission reductions in section B.5
53,030
Description of measurement methods and procedures to be applied:
Use calibrated electricity meters Data monitored continuously and aggregated as appropriate, to calculate emissions reductions
QA/QC procedures to be applied:
The consistency of metered electricity generation should be cross-checked with receipts from electricity sales (if available) and the quantity of fuels fired (e.g. check whether the electricity generation divided by the quantity of fuels fired results in a reasonable efficiency that is comparable to previous years)
Any comment: ---
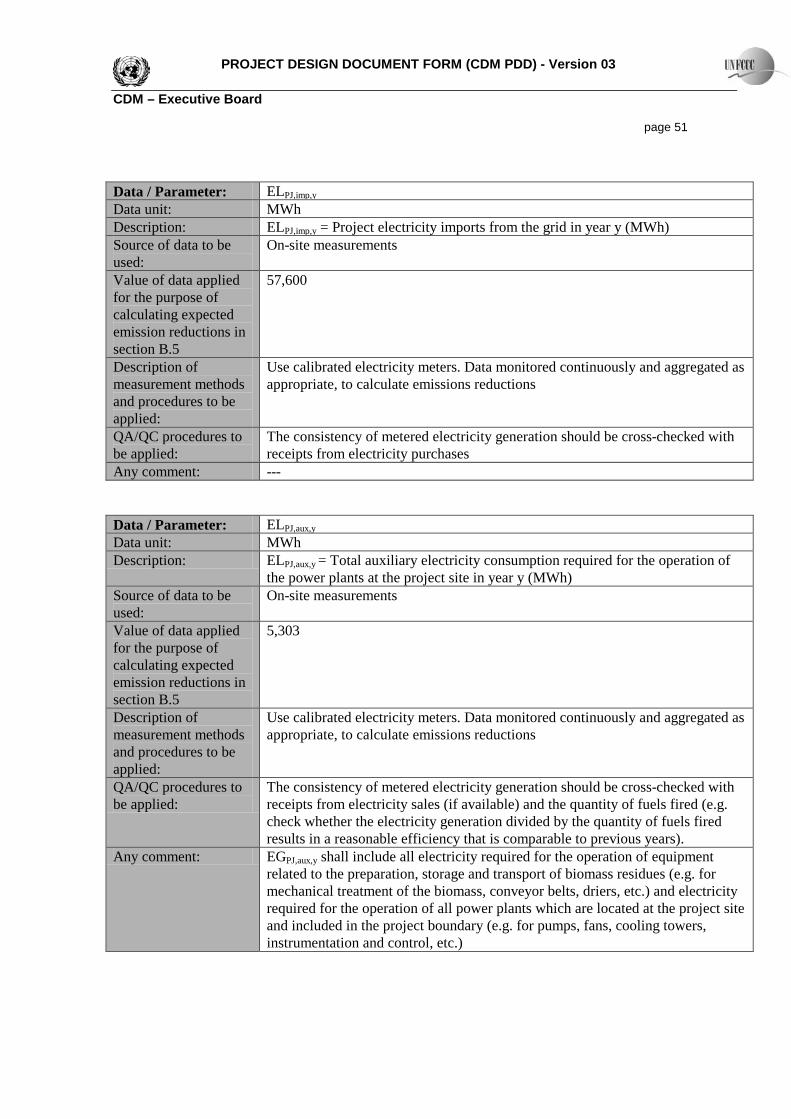
PROJECT DESIGN DOCUMENT FORM (CDM PDD) - Version 03 CDM – Executive Board page 51 Data / Parameter: ELPJ,imp,y Data unit: MWh Description: ELPJ,imp,y = Project electricity imports from the grid in year y (MWh) Source of data to be used:
On-site measurements
Value of data applied for the purpose of calculating expected emission reductions in section B.5
57,600
Description of measurement methods and procedures to be applied:
Use calibrated electricity meters. Data monitored continuously and aggregated as appropriate, to calculate emissions reductions
QA/QC procedures to be applied:
The consistency of metered electricity generation should be cross-checked with receipts from electricity purchases
Any comment: --- Data / Parameter: ELPJ,aux,y Data unit: MWh Description: ELPJ,aux,y = Total auxiliary electricity consumption required for the operation of
the power plants at the project site in year y (MWh) Source of data to be used:
On-site measurements
Value of data applied for the purpose of calculating expected emission reductions in section B.5
5,303
Description of measurement methods and procedures to be applied:
Use calibrated electricity meters. Data monitored continuously and aggregated as appropriate, to calculate emissions reductions
QA/QC procedures to be applied:
The consistency of metered electricity generation should be cross-checked with receipts from electricity sales (if available) and the quantity of fuels fired (e.g. check whether the electricity generation divided by the quantity of fuels fired results in a reasonable efficiency that is comparable to previous years).
Any comment: EGPJ,aux,y shall include all electricity required for the operation of equipment related to the preparation, storage and transport of biomass residues (e.g. for mechanical treatment of the biomass, conveyor belts, driers, etc.) and electricity required for the operation of all power plants which are located at the project site and included in the project boundary (e.g. for pumps, fans, cooling towers, instrumentation and control, etc.)

PROJECT DESIGN DOCUMENT FORM (CDM PDD) - Version 03 CDM – Executive Board page 52 Data / Parameter: NCVBR,n,y Data unit: GJ/tonnes of dry matter Description: NCVBR,n,y = Net calorific value of biomass residue of category n in year y
(GJ/tonne on dry-basis) Source of data to be used:
On-site measurements
Value of data applied for the purpose of calculating expected emission reductions in section B.5
Bagasse 7.58 Rice Husk 14.0
Bagasse NCV is on wet basis.
Description of measurement methods and procedures to be applied:
Measurements shall be carried out at reputed laboratories and according to relevant international standards. Measure the NCV on dry-basis. At least every six months, taking at least three samples for each measurement.
QA/QC procedures to be applied:
Check the consistency of the measurements by comparing the measurement results with measurements from previous years, relevant data sources (e.g. values in the literature, values used in the national GHG inventory) and default values by the IPCC. If the measurement results differ significantly from previous measurements or other relevant data sources, conduct additional measurements. Ensure that the NCV is determined on the basis of dry biomass
Any comment: Biogas should be included as appropriate if applicable (in which case convenient units such as GJ/m3 should be used)
Data / Parameter: Py Data unit: Use suitable units, as appropriate Description: Py = Quantity of the main product of the production process (e.g. sugar cane,
rice) produced in year y from plants operated at the project site Source of data to be used:
On-site measurements
Value of data applied for the purpose of calculating expected emission reductions in section B.5
601,292 (Sugar Cane)
Description of measurement methods and procedures to be applied:
Data aggregated as appropriate, to calculate emissions reductions
QA/QC procedures to be applied:
Sugar Mill cane crushing data will be available
Any comment: ---

PROJECT DESIGN DOCUMENT FORM (CDM PDD) - Version 03 CDM – Executive Board page 53 Data / Parameter: Ny Data unit: --- Description: Ny = Number of truck trips for the transportation of biomass during the year y Source of data to be used:
On-site measurements
Value of data applied for the purpose of calculating expected emission reductions in section B.5
17,000
Description of measurement methods and procedures to be applied:
Data monitored continuously and aggregated as appropriate, to calculate emissions reductions
QA/QC procedures to be applied:
Check consistency of the number of truck trips with the quantity of biomass combusted, e.g. by the relation with previous years
Any comment: --- Data / Parameter: AVDy Data unit: Km Description: AVDy = Average round trip distance (from and to) between the biomass residues
fuel supply sites and the site of the project plant during the year y (km) Source of data to be used:
Records by project participants on the origin of the biomass
Value of data applied for the purpose of calculating expected emission reductions in section B.5
50
Description of measurement methods and procedures to be applied:
Data monitored continuously and aggregated as appropriate, to calculate emissions reductions
QA/QC procedures to be applied:
Check consistency of distance records provided by the truckers by comparing recorded distances with other information from other sources (e.g. maps).
Any comment: Applicable if option 1 is chosen to estimate CO2 emissions from transportation. If biomass is supplied from different sites, this parameter should correspond to the mean value of km traveled by trucks that supply the biomass plant
Data / Parameter: TLy Data unit: tonnes of dry matter Description: Average truck load of the trucks used during the year y Source of data to be On-site measurements

PROJECT DESIGN DOCUMENT FORM (CDM PDD) - Version 03 CDM – Executive Board page 54 used: Value of data applied for the purpose of calculating expected emission reductions in section B.5
10 tonnes (Wet basis)
Description of measurement methods and procedures to be applied:
Data monitored continuously and aggregated as appropriate, to calculate emissions reductions
QA/QC procedures to be applied:
Determined by averaging the weights of each truck carrying biomass to the project plant
Any comment: --- Data / Parameter: LOCy Data unit: Hour Description: LOCy = Length of the operational campaign in year y (hour) Source of data to be used:
On-site measurements
Value of data applied for the purpose of calculating expected emission reductions in section B.5
2,520
Description of measurement methods and procedures to be applied:
Record and sum the hours of operation of the project activity facilities during year y.
QA/QC procedures to be applied:
---
Any comment: ---
B.7.2. Description of the monitoring plan: >> This Monitoring plan will embark a number of monitoring tasks in order to make sure that all facets of projected greenhouse gas (GHG) emission reductions for the project activity are controlled and reported. This requires an ongoing monitoring of the project to ensure performance according to its design and that claimed Certified Emission Reductions (CERs) are actually achieved. The monitoring plan of the proposed project activity is a guidance document that provides the set of procedures for preparing key project indicators and monitoring parameters as mentioned above of the proposed project activity. The monitoring plan will be used throughout the crediting period for the project to determine and provide documentation of GHG emission impacts from the proposed project.
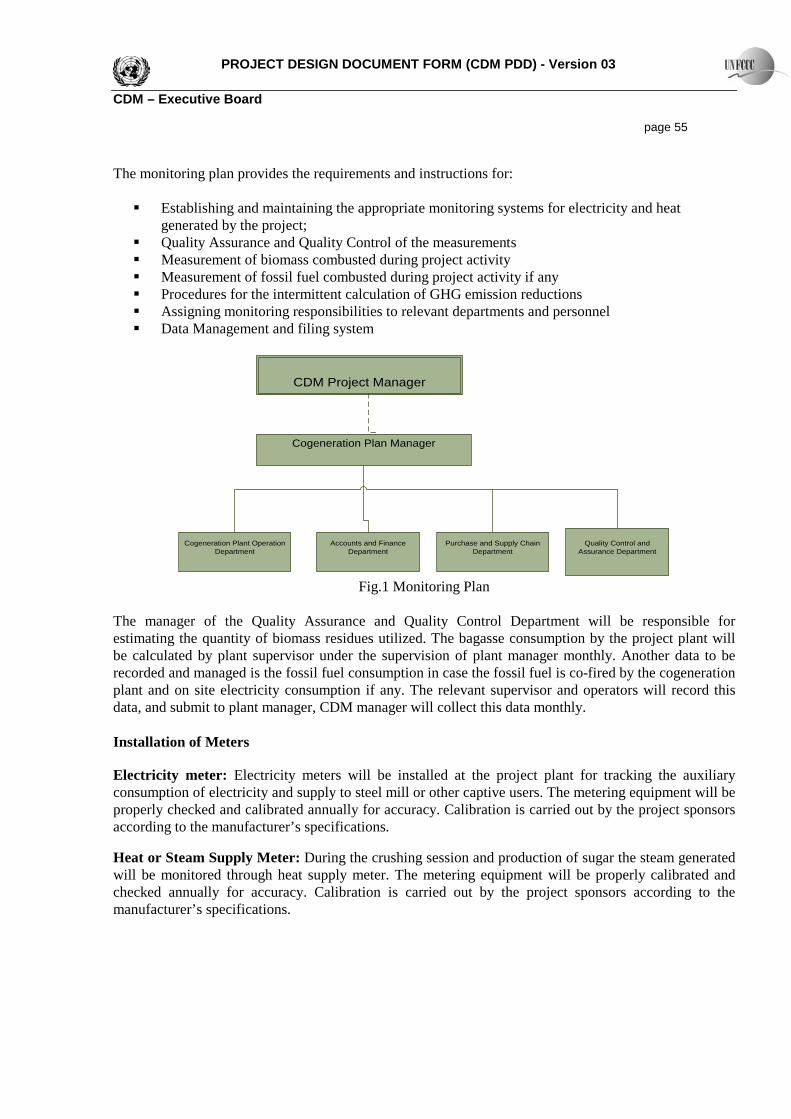
PROJECT DESIGN DOCUMENT FORM (CDM PDD) - Version 03 CDM – Executive Board page 55 The monitoring plan provides the requirements and instructions for: Establishing and maintaining the appropriate monitoring systems for electricity and heat
generated by the project; Quality Assurance and Quality Control of the measurements Measurement of biomass combusted during project activity Measurement of fossil fuel combusted during project activity if any Procedures for the intermittent calculation of GHG emission reductions Assigning monitoring responsibilities to relevant departments and personnel Data Management and filing system
CDM Project Manager
Cogeneration Plan Manager
Cogeneration Plant Operation Department
Accounts and Finance Department
Purchase and Supply Chain Department
Quality Control and Assurance Department
Fig.1 Monitoring Plan
The manager of the Quality Assurance and Quality Control Department will be responsible for estimating the quantity of biomass residues utilized. The bagasse consumption by the project plant will be calculated by plant supervisor under the supervision of plant manager monthly. Another data to be recorded and managed is the fossil fuel consumption in case the fossil fuel is co-fired by the cogeneration plant and on site electricity consumption if any. The relevant supervisor and operators will record this data, and submit to plant manager, CDM manager will collect this data monthly. Installation of Meters
Electricity meter: Electricity meters will be installed at the project plant for tracking the auxiliary consumption of electricity and supply to steel mill or other captive users. The metering equipment will be properly checked and calibrated annually for accuracy. Calibration is carried out by the project sponsors according to the manufacturer’s specifications.
Heat or Steam Supply Meter: During the crushing session and production of sugar the steam generated will be monitored through heat supply meter. The metering equipment will be properly calibrated and checked annually for accuracy. Calibration is carried out by the project sponsors according to the manufacturer’s specifications.

PROJECT DESIGN DOCUMENT FORM (CDM PDD) - Version 03 CDM – Executive Board page 56 Monitoring
Electricity generated by Cogeneration Plant: Biomass based electricity generation by the project plant will be monitored through metering equipment as mentioned above. The data can also be monitored and recorded through on site computer system. The meter will be easily readable for DOE.
Fossil fuel consumption by the cogeneration plant: In case the project plant is co-fired with fossil fuel the quantity of fossil fuel consumption will be recorded and monitored during the operation period of the project. All the relevant data will be recorded and maintained for verification.
Heat or Steam Supplied: The heat generated will be monitored for captive consumption in sugar plant. Heat or steam supplied by the proposed project will be monitored through metering equipments. The meter reading will be readily accessible for DOE. Calibration is carried out by the project owner according to the specifications.
Quality Assurance and Quality Control
The quality assurance and quality control procedures for recording, maintaining and archiving data shall be improved as part of this CDM project activity. This is an on-going process that will be ensured through the CDM in terms of the need for verification of the emissions on an annual basis according to this PDD. Data Management System
This provides information on record keeping of the data collected during monitoring. Record keeping is the most important exercise in relation to the monitoring process. Without accurate and efficient record keeping, project emission reductions cannot be verified.
Verification and Monitoring Results
The verification of the monitoring results of the project is a mandatory process required for all CDM projects. The main objective of the verification is to independently verify that the project has achieved the emission reductions as reported and projected in the PDD. It is expected that the verification will be done after the end of season. B.8. Date of completion of the application of the baseline study and monitoring methodology and the name of the responsible person(s)/entity(ies): >> Date of Completion (DD/MM/YYYY): 10/05/2011
Table B.8.1: Name of Responsible Entities Climate Ventures Pakistan (Pvt) Ltd. 48-N, Model Town Extension Lahore 54700, Pakistan URL: www.climateventures.com Contact person: Mr. Fahd Bin Zafar Email: [email protected]

PROJECT DESIGN DOCUMENT FORM (CDM PDD) - Version 03 CDM – Executive Board page 57 SECTION C. Duration of the project activity / crediting period C.1. Duration of the project activity: C.1.1. Starting date of the project activity: >> 04/01/2008 C.1.2. Expected operational lifetime of the project activity: >> 25 years C.2. Choice of the crediting period and related information: C.2.1. Renewable crediting period: C.2.1.1. Starting date of the first crediting period: >> July 01, 2012 or the date of registration by the CDM-EB, whichever is earlier. C.2.1.2. Length of the first crediting period: >> 21 years (7*3) C.2.2. Fixed crediting period: C.2.2.1. Starting date: >> NA C.2.2.2. Length: >> NA SECTION D. Environmental impacts >> D.1. Documentation on the analysis of the environmental impacts, including transboundary impacts: >> Madina sugar mill cogeneration plant meet all environmental laws and regulations as set out by the local government environmental agencies.

PROJECT DESIGN DOCUMENT FORM (CDM PDD) - Version 03 CDM – Executive Board page 58 Initial Environmental Examination (IEE) report was conducted for the biomass (Rice husk) cogeneration plant. Environmental Protection Agency (EPA) and the environment department of the Government of Punjab regularly visit the site to check its compliance with existing regulations. The project activity complies with all environmental legislation and meets all the consent requirements given by the Punjab provincial government environment department. D.2. If environmental impacts are considered significant by the project participants or the host Party, please provide conclusions and all references to support documentation of an environmental impact assessment undertaken in accordance with the procedures as required by the host Party: >> The Initial Environmental Examination (IEE) report did not indicate any significant environmental impacts. However following are the environmental impacts and mitigation measures. Sources Impacts Mitigation Land Productivity and Use 1. Conversion of agriculture land into
commercial land (i.e. under use of industrial units) which is not a problem in this project
2. Surface run-off from the impervious surface can further aggravate the flooding
1. Project facilities will be located at a minimum distance of 500 m from existing settlements and other sensitive sites
2. Contractor will be made responsible for the clearing of left over material at the site
Soil Erosion and Land Sliding Soil erosion may occur in the workshop areas as a result of improper runoff drawn
1. Main drainage courses within the proposed development area should be lined to avoid erosion
2. A tree plantation program will be developed to reduce the soil erosion
Soil Contamination The possible contamination of soil by oils and chemicals at workshop areas, and equipment washing-yards may limit the future use of land
1. The contractors will be required to instruct and train their workforce in the storage and handling of materials and chemicals
2. Solid waste generated during construction will be properly treated and safely disposed
3. Oil leakages, chemicals and other materials will be minimized
4. Chemicals will be stored as per their MSDS
Ambient Air Quality
Air quality will be affected by the fugitive dust and emissions from the construction machinery, and vehicular traffic during the construction phase
1. Vehicles and other construction machinery should be properly tuned and maintained, so as not to emit any smoke
2. National Environmental Quality Standards (NEQS) applicable to gaseous emissions generated by the construction vehicles, equipment and machinery
3. Selection of air pollution control devices
4. Control of gaseous emissions arising from fuel sources
Noise Level
Noise generated by the construction machinery during the project
1. Proponent will set up a system to monitor the noise levels in the

PROJECT DESIGN DOCUMENT FORM (CDM PDD) - Version 03 CDM – Executive Board page 59
construction project area 2. Facilitate the EPD Punjab in
enforcing noise standards Contamination of Surface and Ground Water Resources
1. Surface and subsurface water resources in the vicinity of the proposed project site may be contaminated by fuel and chemical spills
2. Seepage of polluted water during monsoon season through garbage areas will deteriorate the groundwater quality during operation stage of the Project
Wastewater effluent from contractors’ workshops and equipment washing-yards will be passed through gravel/sand beds to remove oil/grease contaminants before discharging it into natural streams/drains.
SECTION E. Stakeholders’ comments >> E.1. Brief description how comments by local stakeholders have been invited and compiled: >> As per Pakistan environmental rules and regulation Public hearing and stakeholders consultation is required for project activities for which detailed Environmental Impact Assessment (EIA) is required. Environmental & Socio-Economic Technical Services Lahore is responsible along with Madina sugar mills carried out stakeholder consultation process. The stakeholders identified for the project activity are as under;
i. Local farmers ii. Labourers
iii. Students iv. Females v. Vendors/Suppliers
vi. Public representatives etc Madina sugar mills organized stakeholder’s consultation meetings with local farmers, labourers, students, vendors and public representatives. Environmental & Socio-Economic Technical Services Lahore an independent environmental consultant and Madina sugar mills presented the biomass cogeneration project in non-technical language and informed the stakeholders regarding environmental and social impacts of the project activity and also discuss the issues regarding project activity. Invitations for stakeholder consultation were sent out requesting the local people of the community to participate and communicate any suggestion/ objection regarding the project activity. The opinion and suggestion expressed by them were recorded and will be available on request. E.2. Summary of the comments received: >> The employees were very positive about the coming up of the project activity as it would improve the overall quality of life of local people. Stakeholders also have some concerns regarding noise pollution, vegetation, safety, soil contamination, solid waste management of chemical and fuel and proper working times particularly for woman.

PROJECT DESIGN DOCUMENT FORM (CDM PDD) - Version 03 CDM – Executive Board page 60 The local people also have appreciated the project activity as it has resulted in additional employment generation in the area and also provided the local rice mill owner’s source of revenue generation through the sale of rice husk for the project activity which is mostly decay in open fields. The Punjab government environment department has given the non objection certificate (NOC) to the project activity for producing captive power. E.3. Report on how due account was taken of any comments received: >> In view of various direct and indirect benefits (environmental, social and economical) some concerns were raised during stakeholder’s consultations. Following measures will be adopted to address the stakeholders’ concerns. Existing trees will not be cut down. There will be utilized for landscaping and esthetic purposes. More plantations will be added to cover the blank and barren look. Preference will be given to the local people for employment during construction activates. Contractor will comply all the local norms and customs. Waste of construction camps will not be disposed into the community area. Proper working timings will be adopted to minimize the hindrance to the local community mobility particularly woman. Local population will be provided the job opportunities in industries. Proper management of liquid and solid wastes will be ensured during operation phase. Proper measures to control the noise and air pollution will be adopted by the Project. Special emergency contingency plans will be adopted to handle any emergency situation like fire fighting, storms, earthquake, etc. Community consultation process will be continued even at operation stage.

PROJECT DESIGN DOCUMENT FORM (CDM PDD) - Version 03 CDM – Executive Board page 61
Annex 1
CONTACT INFORMATION ON PARTICIPANTS IN THE PROJECT ACTIVITY
Organization: Madina Enterprise Limited Street/P.O.Box: 10 Km, Faisalabad Road, Building: City: Chiniot State/Region: Punjab Postcode/ZIP: Country: Pakistan Telephone: +92-41-38869891-5 FAX: +92-41-38869899 E-Mail: [email protected] URL: www.madinagroup.com Represented by: Title: Director Salutation: Major Last name: Ahsan Middle name: First name: Izhar ul Department: Mobile: +92-300-8665383 Direct FAX: Direct tel: Personal e-mail: [email protected]

PROJECT DESIGN DOCUMENT FORM (CDM PDD) - Version 03 CDM – Executive Board page 62
Organization: Vitol S.A. Street/P.O.Box: Boulevard du Pont D'Arve 28, Building: CH 1205, City: Geneva, State/Region: Postfix/ZIP: Country: Switzerland Telephone: FAX: E-Mail: URL: www.vitol.com Represented by: Title: Mr. Salutation: Last Name: Kaul Middle Name: First Name: Sudhir Department: Mobile: +65 9155 3224 Direct FAX: Direct tel: +65 6737 9922 Personal E-Mail: [email protected]

PROJECT DESIGN DOCUMENT FORM (CDM PDD) - Version 03 CDM – Executive Board page 63
Organization: Climate Ventures Pty Ltd. Street/P.O.Box: Level 10, Building: 50 Market Street, City: Melbourne 3000, State/Region: Victoria Postfix/ZIP: Country: Australia Telephone: +61 3 9008 5957 FAX: +61 3 8678 1269 E-Mail: [email protected] URL: http://www.climateventures.com/ Represented by: Title: Director, Carbon Origination Projects Salutation: Mr. Last Name: Zafar Middle Name: Bin First Name: Fahd Department: Mobile: +92-321-8818828 Direct FAX: +92-42-35693351 Direct tel: Personal E-Mail: [email protected]

PROJECT DESIGN DOCUMENT FORM (CDM PDD) - Version 03 CDM – Executive Board page 64
Annex 2
INFORMATION REGARDING PUBLIC FUNDING
No public funding has been sought for this project activity.

PROJECT DESIGN DOCUMENT FORM (CDM PDD) - Version 03 CDM – Executive Board page 65
Annex 3
BASELINE INFORMATION
Baseline Electricity Generation Emission Factor i. Built Margin
Project Date of Commissioning
FUEL SOURCE (C=Coal. H =Hydro, N = Nuclear, Gas = G, Oil = O)
2010 generation
(MWh)
Emission tCO2-eq
Total System
76,670.31 20% of WAPDA system
15,334.06
5 Most recent plants Build
10,699.14
Engro Energy 2010 G 426.9 253
Atlas Power 2009 O 890.9 690
Ghazi Brotha 2004 H
6,795.96 -
TNB Liberty Power September-2001 G
1,527.30 906
Chashma July-2001 H
1,058.08 -
Altern Energy June-2001 G - -
Uch Power October-2000 G,O
4,119.30 2,445
Jagran October-2000 H
143.56 -
Japan Power March-2000 O
207.90 161
Rousch Power December-1999 G,O
3,256.40 1,937
Saba Power December-1999 O
382.50 296
Actual total generation (20% of the system) - -
18,808.80
Built Margin 0.35562

PROJECT DESIGN DOCUMENT FORM (CDM PDD) - Version 03 CDM – Executive Board page 66 ii. Operating Margin
Year 2008
EFOM (tCO2/GWh) 0.6634 Annual generation (GWh) 46,194
Year 2009
EFOM (tCO2/GWh) 0.6805 Annual generation (GWh) 44,096
Year 2010
EFOM (tCO2/GWh) 0.6884 Annual generation (GWh) 46,320
Combined Margin
EFCM = 0.5*EFOM,2008-2010 + 0.5*EFBM,2010 = 0.517

PROJECT DESIGN DOCUMENT FORM (CDM PDD) - Version 03 CDM – Executive Board page 67
Annex 4
MONITORING INFORMATION
Please Refer to Section B.7 for monitoring information.