Clean Development Mechanism and Development Dividend: An Empirical Study from India March 27, 2006.
22
Mechanism and Development Dividend: An Empirical Study from India March 27, 2006
-
Upload
vivian-fletcher -
Category
Documents
-
view
213 -
download
0
Transcript of Clean Development Mechanism and Development Dividend: An Empirical Study from India March 27, 2006.

Clean Development Mechanism and
Development Dividend: An Empirical Study from
India
March 27, 2006

Scope of the studyTo explore the contribution of CDM projects
for delivering the development dividend.

The Millennium Development Goals
Sustainable Development Benefits
CDM link
GOAL1 : Eradicate extreme poverty and hunger
Target 1: Half the number of people whose income is less than one dollar per day
Intra-generational equity is a key component of the social dimension of SD High
GOAL 5 :Improve maternal health
Target 6: Reduce by three-quarters ,the maternal mortality ratio
Relevant to Intra-generational equity ,investment in human capital and reduction in indoor air quality Medium
GOAL 7 :Ensure Environmental Sustainability
Target 9 :Integrate the principles of sustainable development into countries policies and programmes
Relevant to the environmental dimensions,CO2 per capita ,energy use of alternate fuel High
Linkages between MDGs, Sustainable Development Benefits
and CDM
Source: Adapted from UNEP, 2004

Outline sectoral GHG mitigation potential in India and
the other social, environmental, health and employment benefits expected.
link to supportive government policies and enabling initiatives to evaluate the projected developmental benefits in different sectors.
overview of definitions of SD used by Indian DNA, and for a sample of projects accorded host country approval, examine the claims made on their contribution to SD.
SD benefits claimed in the registered Indian CDM projectsvis a vis the screening criterion of the DNA.

Seen as one of the key players for sale of CERs Potential for
• Mitigation• Energy sector• Industrial• Other
• Sequestration• Afforestation and reforestation activities
Potential is however linked to • Demand • Frameworks and institutional support
India’s CDM potential

GHG mitigation potential: Key sectors
Total 417 MTCO2eq. by 2012
Short-term technological potential based on various interventions, at different stages of planning
Long-term potential 865-1080 MTCO2eq. (ALGAS)Source: NSS, India

Development Imperatives of India
Reduction of poverty Rural infrastructure development Bharat Nirman Electrification of all Indian villages A targeted economic rog of 10% pa
Electricity and energy services provision will be at the heart of these developmental programmes and therein lies the scope for strengthening CDM, mitigation potential and DD linkages

India Sustainable Development Criterion for CDM Project Approval
•Environmental well being
•Economic well being
•Social well being
•Technological well being
Broad definitional framework provided, and a broad interpretation of the same while according host country approval

Measuring Development Dividend through SD Criterion and Indicators

SD criteria: Menu of indicators for effective measurement of Development Dividend
Environmentimprove local economy
increase in local employment
local infrastructure development
balance of payments
increased investment in primary sector
transfer of technology
reduction in import of energy at local level
Environmental
reduction in local pollutants like Sox,Nox
reduction in water pollution
reduction in soil erosion
conservation of bio-diversity
Local ebvironmental and health benefits
reduction in noise pollution
reduction in emission of Ozone depleting substances
Social
Capacity building and transfer of technical skills
Income distribution and quality of life improvement
increased local employment
increased penetration of power supply in rural areas
Legal and regulatory issues/IPRs
New institution building and information sharing Gender Equity
Source: Various studies

Typology of CDM project type wrt SDTypes Market prospects, Sustainable Development SD
Methane industrial gases HFC, PFC, N2O,
Low hanging fruits -> up to 50% CDM market share; high GWP leverage -> attractive deals, HFC projects yield low or neg. contribution to SD
Industry energy efficiency and clean coal
Few proven business cases but good prospects for energy efficiency; Prevailing barriers in large – scale power sector
Renewable energy Good number of projects well placed in project CDM pipeline; Strong SD benefits but projects prone to adverse regulatory barriers
Small scale sector projects
Commercially not viable at low carbon prices. Need clients ready to pay premium for high SD benefits, limited mitigation potential
Source: Adapted from NSS, India

Distribution of Registered CDM projects across different sectors
4% 12%
4%
80%
Energy Efficiency
Indusrial Process
MSW
Renewable Energy
Total No : 25 registered with EB
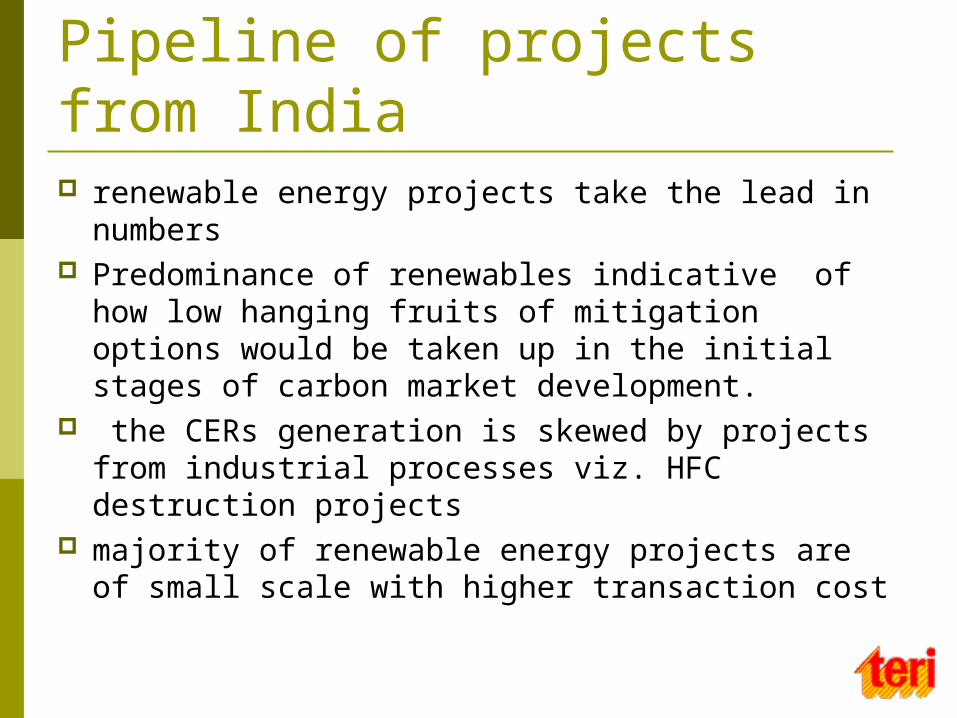
Pipeline of projects from India renewable energy projects take the lead in
numbers Predominance of renewables indicative of how
low hanging fruits of mitigation options would be taken up in the initial stages of carbon market development.
the CERs generation is skewed by projects from industrial processes viz. HFC destruction projects
majority of renewable energy projects are of small scale with higher transaction cost

Development Dividend and CDM: Critical Issues using the socio-economic imperatives, the Indian Context
Agricultural Income and Poverty
Non-farm employment and rural poverty
Infrastructural development and rural poverty
FDI (Foreign Direct Investment), technology Transfer and Rural Poverty

Agricultural Income and Poverty The scope of increasing agricultural income is
limited only to projects on biomass energy generation, do not involve any technology transfer to the sector and are not focused on activities that can increase agricultural productivity and income.
PDDs do not provide any information on purchase price of different biomass by the power plants or the estimates of additional income accruing to cultivators to support their claims of promoting socio-economic development.

Non-farm employment and rural poverty wage employment in the construction and operation of a
CDM project cannot be analogous with employment generation schemes undertaken by the Government for poverty alleviation. Moreover, there is no built-in mechanism in the CDM project to ensure that those persons who are absorbed in long-term jobs are below the poverty line.
Although the linkages are tenuous, there exists the potential of a multiplier effect on new job opportunities on a continuing basis outside the CDM project boundary, particularly with regard to projects on renewable energy. For e.g., the employment potential from generation of 100,000 MW of biomass power is reported to be 30 million persons annually (GoI 2002).
Infrastructural development and rural poverty Among various infrastructural facilities,
energy infrastructure is expected to get a major boost under CDM through increased power generation from renewable energy sources. However, despite improved physical access, the real access to energy services are curtailed by issues of purchasing power of the household, cost of energy, access to and cost of energy using end-use equipment.

FDI (Foreign Direct Investment), technology Transfer and Rural Poverty
CDM projects in India are primarily in the area of renewable, energy efficiency in industry, cement industry and fuel switching, where traditionally, FDI flows have been either negligible or in small proportion. The greatest contribution of FDI to economic growth and hence to poverty alleviation if technology transfer. However, as per the current status of CDM projects, the benefits accruing out of this seem very limited.

Some insights….. “Social development objective not lying at the
heart of the formulation of the projects, currently”.
The project by project approach may not be able to deliver any significant gains on all fronts (env, eco, social)
Redirecting and Greening FDI may give more env gains relative to CDM (Expected investment, mostly from Indian sources, for 256projects with HCA is $ 3.7 bn over next few years, while FDI in 2005/06 is $ 5.6 bn , but FDI to India currently flowing to IT, finance,services etc)
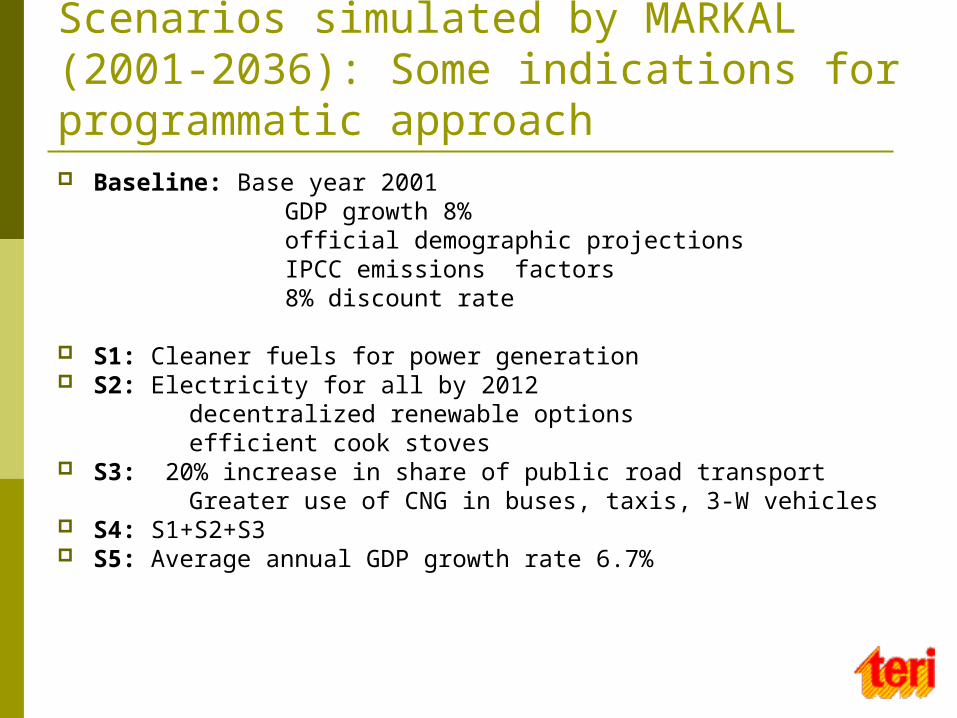
India’s Energy Policies: Scenarios simulated by MARKAL (2001-2036): Some indications for programmatic approach Baseline: Base year 2001
GDP growth 8% official demographic projections
IPCC emissions factors 8% discount rate
S1: Cleaner fuels for power generation S2: Electricity for all by 2012
decentralized renewable optionsefficient cook stoves
S3: 20% increase in share of public road transport Greater use of CNG in buses, taxis, 3-W vehicles
S4: S1+S2+S3 S5: Average annual GDP growth rate 6.7%

CO2 emissions
500
1000
1500
2000
2500
3000
3500
2001 2006 2011 2016 2021 2026 2031
Year
MM
T
BASELINE S1 S2 S3 S4 S5
TERI analysis
Lower carbon trajectory with a programme approach

Thank you