
CLEA GEOREFERENCED ELECTORAL DISTRICTS DATASETS (BETA 2) beta2/GRED_bet… · ·...
46
GRED Version: May 30, 2017 (20170530) Codebook Page 1 of 46 CLEA GEOREFERENCED ELECTORAL DISTRICTS DATASETS (BETA 2) CODEBOOK Version: May 30, 2017 (20170530)
Transcript of CLEA GEOREFERENCED ELECTORAL DISTRICTS DATASETS (BETA 2) beta2/GRED_bet… · ·...
GRED Version: May 30, 2017 (20170530)
Codebook Page 1 of 46
CLEA GEOREFERENCED ELECTORAL DISTRICTS DATASETS (BETA 2)
CODEBOOK
Version: May 30, 2017 (20170530)

GRED Version: May 30, 2017 (20170530)
Codebook Page 2 of 46
TABLE OF CONTENTS
Section Page INTRODUCTION
PROJECT DESCRIPTION FUNDING SUPPORT BIBLIOGRAPHIC CITATION CREDITS
DATA PREPARATION
DATA DESIGN DATA FILE TYPES
DOCUMENTATION OF VARIABLES
VARIABLE LIST VARIABLE DESCRIPTIONS
COUNTRY SOURCE DOCUMENTATION
3 3 4 5
6 7
10 10
13

GRED Version: May 30, 2017 (20170530)
Codebook Page 3 of 46
INTRODUCTION GeoReferenced Electoral Districts Datasets (Beta) Project Description The GeoReferenced Electoral Districts (GRED) datasets provide geo-referenced maps for electoral districts in the Constituency-Level Elections Archive (CLEA). The goal of this project is to offer maps formatted in a manner so they can be linked to other standard geo-referenced data, allowing researchers to test a variety of research questions at the constituency level. To date, there is no cross-country collection of geo-referenced maps of electoral constituencies that is coded consistently and accurately, and the GRED dataset strives to fulfill this need in the research community. Beta Disclaimer The purpose of this second beta version is to give users an opportunity to test the datasets and provide feedback so that the geo-referencing and CLEA constituency matching procedures can be further refined. Users are advised to proceed cautiously and to backup important data before using the GRED datasets. Please direct problems or questions about the data to [email protected]. CLEA Project Description The central aim of the Constituency-Level Elections Archive (CLEA) project is to produce a repository of detailed results – i.e., votes received by each candidate/party, total votes cast, number of eligible voters – at a constituency level for the lower house legislative elections that have been conducted around the world. Our motivation is to preserve and consolidate these valuable data in one comprehensive reference resource that is publicly available at no cost. This public good is expected to be of use to a range of audiences for purposes of research, education, and policy-making and evaluation. Funding Support We gratefully acknowledge the American National Science Foundation (www.nsf.gov), the University of Michigan’s Office of Research, and the Taiwan Foundation for Democracy for funding CLEA, and we thank the Institute of Political Science at the University of St. Gallen for research assistance. These materials are based on work supported by the National Science Foundation (under grants SES-0617101, SES-1021915, and SMA-1519594) and the University of Michigan’s Office of Research. Any opinions, findings and conclusions or recommendations expressed in these materials are those of the author(s) and do not necessarily reflect the views of the funding organizations.

GRED Version: May 30, 2017 (20170530)
Codebook Page 4 of 46
Bibliographic Citation For citation of the entire GRED database, the following formats are recommended:
APA (6th edition) Kollman, K., Hicken, A., Caramani, D., Backer, D., Lublin, D., Selway, J., and Vasselai, F. (2017). GeoReferenced Electoral Districts Datasets (Beta) [data files and codebook]. Ann Arbor, MI: Center for Political Studies, University of Michigan [producer and distributor].
MLA (7th edition) Kollman, Ken, Allen Hicken, Daniele Caramani, David Backer, David Lublin, Joel Selway, David Lublin and Fabricio Vasselai. GeoReferenced Electoral Districts Datasets (Beta). Ann Arbor, MI: Center for Political Studies, University of Michigan [producer and distributor], 2017. Web. 22 February 2017.
Chicago (16th edition) Kollman, Ken, Allen Hicken, Daniele Caramani, David Backer, David Lublin, Joel Selway, and Fabricio Vasselai. 2017. GeoReferenced Electoral Districts Datasets (Beta). Produced and distributed by Ann Arbor, MI: Center for Political Studies, University of Michigan. For citation of one set of country files from GRED, inclusion of the country name and year is recommended. For example:
APA (6th edition) Kollman, K., Hicken, A., Caramani, D., Backer, D., David Lublin, Selway, J., and Vasselai, F. (2017). GeoReferenced Electoral Districts Datasets (Beta 2): Albania 2009 [data files and codebook]. Ann Arbor, MI: Center for Political Studies, University of Michigan [producer and distributor].
MLA (7th edition) Kollman, Ken, Allen Hicken, Daniele Caramani, David Backer, David Lublin, Joel Selway, and Fabricio Vasselai. GeoReferenced Electoral Districts Datasets (Beta 2): Albania 2009. Ann Arbor, MI: Center for Political Studies, University of Michigan [producer and distributor], 2017. Web. 30 May 2017.
Chicago (16th edition) Kollman, Ken, Allen Hicken, Daniele Caramani, David Backer, David Lublin, Joel Selway, and Fabricio Vasselai. 2017. GeoReferenced Electoral Districts Datasets (Beta 2): Albania 2009. Produced and distributed by Ann Arbor, MI: Center for Political Studies, University of Michigan.

GRED Version: May 30, 2017 (20170530)
Codebook Page 5 of 46
Credits The co-directors of CLEA are Ken Kollman of the University of Michigan, Allen Hicken of the University of Michigan, Daniele Caramani of the University of Zurich, David Backer of the University of Maryland, and David Lublin of American University. The project manager is Yioryos Nardis of the Center for Political Studies, University of Michigan. Fabricio Vasselai and Joel Selway provided GIS files and curated the maps provided in this second beta release. Research assistance was provided by students from Brigham Young University. Catherine Allen-West of the Center for Political Studies at the University of Michigan provided programming and website assistance for this release.

GRED Version: May 30, 2017 (20170530)
Codebook Page 6 of 46
DATA PREPARATION
We have collected geo-referenced maps from a variety of sources and adapted them when necessary, including eventual redrawing of electoral constituencies of countries, in order to make maps that suitably match the constituencies for an election in a given country from the most recent release (20170530) of CLEA. Maps for GRED were created using ArcGIS® 10.5 by ESRI (ArcGIS® and ArcMap™ are the intellectual property of ESRI and are used herein under license) and the open source QGIS 2.18.4. OpenOffice 4.0.1 and R-software 3.3.1 were used for matching and merging CLEA districts with the mapping files. All maps use the WGS 1984 geographic coordinates system and the coordination type is degrees. Although great care has been taken to prepare the data and codebook as accurately as possible prior to release, we would appreciate receiving your comments, feedback, and notification of errors. Contact us at [email protected]. Data design In addition to the drawing, coordinate, projection and other map information, all GIS data, irrespective of file format, present at least one datatable – with the desired information regarding each of the areas (features) into which the map is divided. In a GIS map of a country’s electoral constituencies, such a mandatory table will have a row for each electoral constituency and a column for each information point related to the electoral constituencies (e.g. their names, length, area, etc.). In each country’s map in GRED, such a main datatable will generally be called the “GRED_map” table and will contain the following variables: country name (CTR_N), country code (CTR), electoral constituency name (CST_N) and a unique electoral constituency code (GRED_CST). For convenience, we will also deliver an additional second table to allow for easy matching between GRED and CLEA. The reason why one needs such a second table to match GRED with CLEA, is that in the future GRED will start covering more than one election per country. However, in the CLEA dataset to which GRED is directly related, the electoral constituency numerical codes (CST variable in CLEA) may vary over time – that is, the same code may or may not belong to the same constituency across elections, depending upon whether redistricting occurs between elections or if constituency names change.

GRED Version: May 30, 2017 (20170530)
Codebook Page 7 of 46
Thus, the second additional table here matches GRED_CST to CLEA_CST for each election year. We will generally call such a table, CLEA_cstyr, and it will have the following variables: GRED’s electoral constituency code (GRED_CST), country code (CTR), the year of a given election (YR) and the CLEA electoral constituency code (CLEA_CST) that corresponds to each of the electoral constituencies being linked from the main table, for the corresponding election year. This gives us flexibility to cover elections by the same country map in additional GRED releases in the future. The researcher can match the two tables for each country the same way: using the GRED_map table for information on the electoral constituencies that does not change across years, and using the second additional CLEA_cstyr table for information on the electoral constituencies that do change across years. Data file types In this second beta release, each country has a separate folder, containing three subfolders (“geodatabase”, “geopackage” and “shapefile”) with the country’s GIS map in one of the three file types currently made available in GRED: ESRI Geodatabases, the open sourced GeoPackages and ESRI Shapefiles.
1) Geodatabases The first file format is the ESRI Geodatabase (*.gdb): • GRED_COUNTRYNAME_YEARS_RELEASE.gdb “COUNTRYNAME” identifies the name of the country whose map refers to. “YEARS” identifies the country’s electioral period both included in CLEA and covered by the map. “RELEASE” identifies the release version to which the file belongs. This file format is a proprietary GIS relational database developed by ESRI, which can only be opened directly by ESRI software (e.g. the ArcGIS suite) or by third-party software (e.g. R-software, through the R-ArcGIS package) but still with ESRI software installed in the machine. Inside the *.gdb file, users will find the two data tables, one called GRED_map and another called CLEA_cstyr. The first contains the GIS map geometry, with basic information like name and code of countries and of electoral constituencies1. The second is the convenience table to match GRED to CLEA, which also contains information on the code of those electoral constituencies in each election year covered both by the map and present in the CLEA dataset.
1 Note that when ESRI ArcGIS software opens Geodatabase files, they automatically also display information on the Length and Area of each map feature.

GRED Version: May 30, 2017 (20170530)
Codebook Page 8 of 46
2) GeoPackages The second file format is the open source Geopackage (*.gpkg): • GRED_COUNTRYNAME_YEARS_RELEASE.gpkg “COUNTRYNAME” identifies the name of the country whose map refers to. “YEARS” identifies the country’s electioral period both included in CLEA and covered by the map. “RELEASE” identifies the release version to which the file belongs. This file format is an open source GIS relational database format, which can be directly opened by multiple software – from free open source (e.g. R-software, QGIS, GeoDa, etc.) to proprietary software (e.g. ESRI ArcGIS suite). Inside the *.gpkg file, users will find the two data tables, one called GRED_map and another called CLEA_cstyr. The first contains the GIS map geometry, with basic info like name and code of countries and of electoral constituencies. The second is the convenience table to match GRED to CLEA, which also contains information on the code of those electoral constituencies in each election year covered both by the map and present in the CLEA dataset.
3) Shapefiles The third file format is the widely used ESRI Shapefile (*.shp). However, despite the shapefiles being the files whose extension is of type *.shp, they require at least three mode files, with extensions *.shx, *.dbf and *.prj. Therefore, ESRI Shapefiles are actually composed of at least four (4) files2 per country: • GRED_ COUNTRYNAME_YEARS_RELEASE.shp
The main Shapefile, with map drawing information.
• GRED_ COUNTRYNAME_YEARS_RELEASE.shx Companion file to the .shp that stores the position of individual feature IDs in the .shp file.
• GRED_ COUNTRYNAME_YEARS_RELEASE.dbf A table in dBASE format, that contains the information on each map feature (i.e. our GRED_map table).
2 These files have to always be placed together in the same folder and have exactly the same names (with the exception, of course, of having different file type extensions).

GRED Version: May 30, 2017 (20170530)
Codebook Page 9 of 46
• GRED_ COUNTRYNAME_YEARS_RELEASE.prj The coordinate system information.
“COUNTRYNAME” identifies the name of the country whose map refers to. “YEARS” identifies the country’s electioral period both included in CLEA and covered by the map. “RELEASE” identifies the release version to which the file belongs. This file format is a free, non-database style file format created and owed by ESRI, that can be opened by virtually any GIS software - from free open source (e.g. R-software, QGIS, GeoDa, etc.) to proprietary software (e.g. ESRI ArcGIS suite). All software directly open the *.shp file, automatically reading the information contained from the other companion files. In this GIS format the datatable containing information on each areas (features) of a map is not inside the GIS file but explicitely stored in an additional file, of type *.dbf where each row in the file corresponds to each area (feature) into which the map contained in the *.shp file is divided3. For the purposes of GRED, such a table contains basic information such as the name and code of countries and electoral constituencies. The table: • CLEAcstyr_COUNTRYNAME_RELEASE.dbf
A table in dBASE format, that contains the information on each map feature (i.e. the CLEA_cstyr table).
It also contains information on the CLEA code of each electoral constituency in each election year covered both by the map and present in the CLEA dataset.
3 Note that the main *.dbf file should never have its rows reordered, without also updating the ordering information inside the *.shx file. For that reason, it is recommended that any reordering of the datatable should be done inside a GIS processing software that directly reads *.shp files, rather than opening each file one by one.

GRED Version: May 30, 2017 (20170530)
Codebook Page 10 of 46
DOCUMENTATION OF VARIABLES Variable List GRED_map table: CTR_N Country Name CTR Country Code CST_N Electoral Constituency Name GRED_CST GRED’s unique Electoral Constituency Code
CLEA_cstyr table: GRED_CST GRED’s unique Electoral Constituency Code CTR Country Code YR Country Election Year CLEA_CST Electoral Constituency Code from CLEA, for the
corresponding election year
Variable Descriptions CTR_N Country Name
Names of countries included in the GRED (Beta-2) datasets.
Afghanistan Albania Argentina Australia Austria Bangladesh Belgium Belize Bhutan Bolivia Brazil Bulgaria Cameroon Canada Cape Verde Chile
Colombia Costa Rica Croatia Cyprus Czech Republic Denmark Dominican Republic Ecuador El Salvador Estonia Finland Germany Grenada Guatemala Guyana Honduras
Iceland India Indonesia Ireland Israel Italy Kazakhstan Latvia Liechtenstein Luxembourg Macedonia Marshall Islands Mexico Moldova Montenegro Namibia
GRED Version: May 30, 2017 (20170530)
Codebook Page 11 of 46
Netherlands New Zealand Nicaragua Norway Paraguay Peru Poland Portugal Romania
Russia Saint Lucia San Marino Serbia Singapore Slovakia South Africa Spain Sri Lanka
Suriname Sweden Switzerland Trinidad and Tobago United Kingdom United States Uruguay Zambia
--------------------------------------------------------- CTR Country Code
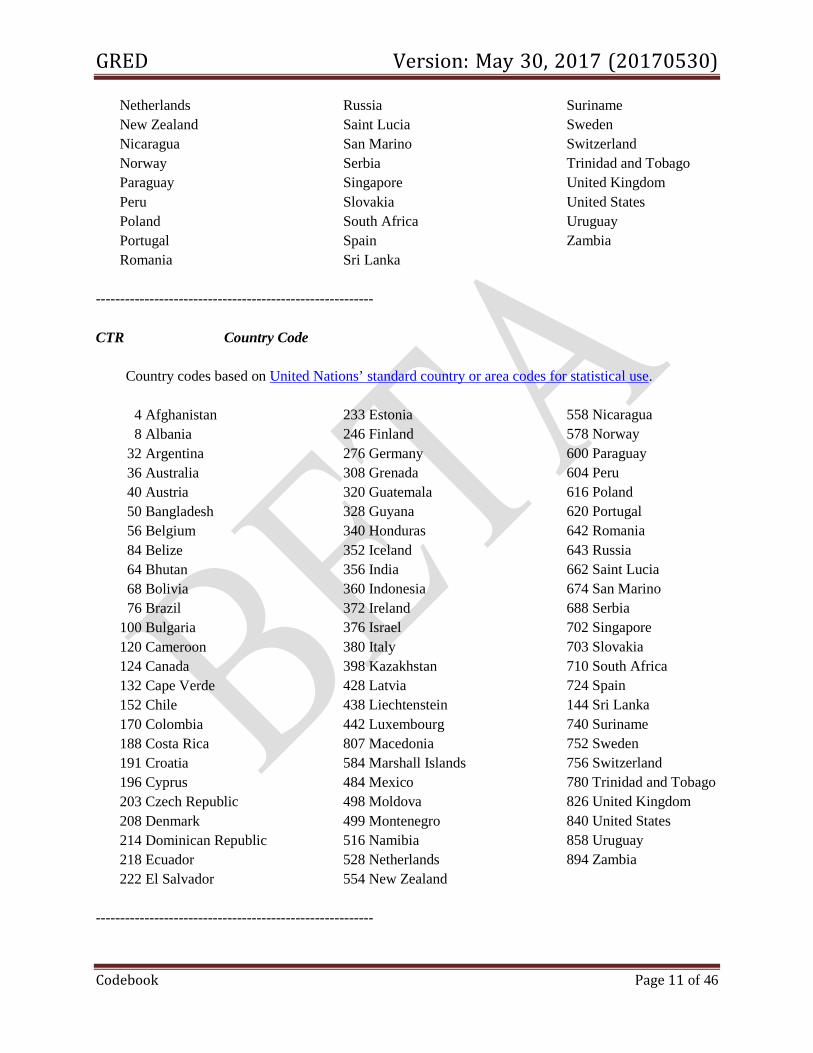
Country codes based on United Nations’ standard country or area codes for statistical use.
4 Afghanistan 8 Albania 32 Argentina 36 Australia 40 Austria 50 Bangladesh 56 Belgium 84 Belize 64 Bhutan 68 Bolivia 76 Brazil 100 Bulgaria 120 Cameroon 124 Canada 132 Cape Verde 152 Chile 170 Colombia 188 Costa Rica 191 Croatia 196 Cyprus 203 Czech Republic 208 Denmark 214 Dominican Republic 218 Ecuador 222 El Salvador
233 Estonia 246 Finland 276 Germany 308 Grenada 320 Guatemala 328 Guyana 340 Honduras 352 Iceland 356 India 360 Indonesia 372 Ireland 376 Israel 380 Italy 398 Kazakhstan 428 Latvia 438 Liechtenstein 442 Luxembourg 807 Macedonia 584 Marshall Islands 484 Mexico 498 Moldova 499 Montenegro 516 Namibia 528 Netherlands 554 New Zealand
558 Nicaragua 578 Norway 600 Paraguay 604 Peru 616 Poland 620 Portugal 642 Romania 643 Russia 662 Saint Lucia 674 San Marino 688 Serbia 702 Singapore 703 Slovakia 710 South Africa 724 Spain 144 Sri Lanka 740 Suriname 752 Sweden 756 Switzerland 780 Trinidad and Tobago 826 United Kingdom 840 United States 858 Uruguay 894 Zambia
---------------------------------------------------------

GRED Version: May 30, 2017 (20170530)
Codebook Page 12 of 46
CST_N Constituency Name
Name of geographical area that a particular elected representative or group of elected representatives represents. In some instances, the name differs slightly from the CLEA election archive data where the official map source used a variation on the name. -------------------------------------------------------------- GRED_CST GRED’s unique Electoral Constituency Code
Unique and time-consistent numeric code per electoral constituency (consistent across time while the country map remains the same). -------------------------------------------------------------- YR Country Election Year
Election year both covered by the country’s electoral constituency map and for which electoral results are available in CLEA. -------------------------------------------------------------- CLEA_CST Electoral Constituency Code from CLEA, for the corresponding election year
The numeric code used by CLEA to identify a country’s electoral constituency for a given election year.
--------------------------------------------------------------

GRED Version: May 30, 2017 (20170530)
Codebook Page 13 of 46
COUNTRY SOURCE DOCUMENTATION
(in alphabetical order by country)
Afghanistan
1. Included elections: 2005 2. Sources: Global Administrative Areas (2012). “Afghanistan.” GADM database of Global Administrative Areas, version 2.0. [online] URL: www.gadm.org.
3. Modifications to source data: Since the electoral constituencies are the 1st level administration divisions (provinces), which are readily available in the GADM data, such map was matched for usage in GRED. This excludes, of course, the tribal minority constituency of Kuchi, which does not have any specific geographical representation.
Albania
1. Included elections: 2009 2. Sources: Global Administrative Areas (2012). “Albania.” GADM database of Global Administrative Areas, version 2.0. [online] URL: www.gadm.org.
3. Modifications to source data: Since the electoral constituencies are the 1st level administration divisions (counties), which are readily available in the GADM data, such map was matched for usage in GRED.

GRED Version: May 30, 2017 (20170530)
Codebook Page 14 of 46
Argentina
1. Included elections: 2003 2. Sources: Global Administrative Areas (2012). “Argentina.” GADM database of Global Administrative Areas, version 2.0. [online] URL: www.gadm.org.
3. Modifications to source data: Since the electoral constituencies are the 1st level administration divisions - provinces (províncias) and the federal district (districto federal) - which are readily available in the GADM data, such map was matched for usage in GRED. Update: two minor corrections were also perfomed, eliminating intra-polygon tiny holes at decimal coordinates (-59.129, -38.703) and (-62.137, -39.000). We acknowledge Alton B. H. Worthington for bringing this to our attention.
Australia
1. Included elections: 2003 2. Sources: Australian Electoral Commission. “Maps and spatial data” [online] URL: http://www.aec.gov.au/Electorates/maps.htm
3. Modifications to source data: Electoral constituency map came directly as a Shapefile from the official source.

GRED Version: May 30, 2017 (20170530)
Codebook Page 15 of 46
Austria
1. Included elections: 2008 2. Sources: Global Administrative Areas (2012). “Austria.” GADM database of Global Administrative Areas, version 2.0. [online] URL: www.gadm.org.
Statistics Austria (2014). “Regional electoral zones – Overview, key date 2014.” Statistics Austria: The Information Manager. [online] URL: http://www.statistik.at/web_en/classifications/regional_breakdown/regional_electoral_zones/index.html
3. Modifications to source data: The GADM map with 2nd level administrative divisions was used and matched to the Statistics Austria list. In Austria, the Districts (Bezirke) and Statutory cities (Statutarstädte) were merged to form the electoral constituencies.
Bangladesh
1. Included elections: 2008 2. Sources: Dhaka Tribune (2014). Map of electoral constituencies of Bangladesh [online] URL: http://election.dhakatribune.com/app/webroot/img/bangladesh.png.
3. Modifications to source data: First, the original PNG image was georeferenced automatically. Next, the following constituencies’ boundaries were manually corrected for accuracy: Bagerhat-1, Barguna-1, Barguna-2, Barisal-3, Barisal-4, Bhola-3, Bhola-4, Chittagong-16, Cox’s Bazar-3, Dhaka-1 to Dhaka-20, Jessore-4, Khulna-1, Khulna-4, Lakshmipur-4, Noakhali-4, Noakhali-5, Noakhali-6, Patuakhali-1, Patuakhali-2, Patuakhali-3, Patuakhali-4, Satkhira-2, Shariatpur-2, Shariatpur-3.

GRED Version: May 30, 2017 (20170530)
Codebook Page 16 of 46
Belgium
1. Included elections: 1995 2. Sources: Global Administrative Areas (2012). “Belgium.” GADM database of Global Administrative Areas, version 2.0. [online] URL: www.gadm.org.
3. Modifications to source data: In the original CLEA data, the provinces were disaggregated to the level of the circonscriptions (20 in total). For the GRED map, the electoral constituencies were created by merging the 2nd level administrative divisions of Belgium (arrondissements), which were taken from the 3rd level GADM file. Information to identify which arrondissement belonged to each electoral constituency was compared to data available at the Direction Générale Institutions et Population (http://www.ibz.rrn.fgov.be/).
Belize 1. Included elections: 2012 2. Sources: Global Administrative Areas (2012). “Belize.” GADM database of Global Administrative Areas, version 2.0. [online] URL: www.gadm.org.
Elections and Boundaries Department (2016). “Electoral Boundaries and Maps”. [online] URL: http://www.elections.gov.bz/modules/wfdownloads/viewcat.php?cid=83.
3. Modifications to source data: Electoral constituencies were built by merging administrative divisions present in the GADM maps, following official information from the Elections and Boundaries Department on which areas belonged to which constituencies

GRED Version: May 30, 2017 (20170530)
Codebook Page 17 of 46
Bhutan
1. Included elections: 2008 2. Sources: Professor Joel Selway, Brigham Young University.
Bolivia
1. Included elections: 2014 (both SMD and PR tiers available) 2. Sources: Órgano Electoral Plurinacional. [online] URL: http://www.oep.org.bo/index.php/geografia-electoral
3. Modifications to source data:
Electoral constituencies for the Single-Member district tier were directly downloaded from the electoral authorithy. The electoral constituencies for the Proportional tier (i.e plurinominales) were derived with official information on which SMD belonged to each plurinominal districts.
Brazil
1. Included elections: 2006 2. Sources: Brazilian Institute of Geography and Statistics. “Maps: Bases and References.” IBGE DIVISÃO DE MAPAS [online] URL: http://mapas.ibge.gov.br/bases-e-referenciais
3. Modifications to source data: Electoral constituencies were matched with the 1st level administrative divisions, which were the 26 states (províncias) and the federal district (distrito federal).

GRED Version: May 30, 2017 (20170530)
Codebook Page 18 of 46
Bulgaria
1. Included elections: 2009 2. Sources: Professor Joel Selway, Brigham Young University.
Cameroon
1. Included elections: 1997 2. Sources: Global Administrative Areas (2012). “Cameroon” GADM database of Global Administrative Areas, version 2.0. [online] URL: www.gadm.org.
3. Modifications to source data: Electoral constituencies are equivalet to the 2st level administrative divisions of Cameroon (the departments). Therefore, constituencies were matched to those maps present in GADM.
Canada
1. Included elections: 2011 2. Sources: Canada Centre for Mapping and Earth Observation (2011). “Federal Electoral Districts of Canada – 2011.” Government of Canada, Natural Resources Canada, Earth Sciences Sector [online] URL: http://geogratis.gc.ca/api/en/nrcan-rncan/ess-sst/6d1d8f90-1c25-5fd0-880d-138d27c8cb57.html
3. Modifications to source data: Electoral constituency map came directly as a Shapefile from the official source.

GRED Version: May 30, 2017 (20170530)
Codebook Page 19 of 46
Cape Verde
1. Included elections: 2016 2. Sources: Comissão Nacional Eleitoral (2011). “Mapas eleitorais” [online] URL: http://www.cne.cv/.
Wikimedia (2016). “Map results of Cape Verde Parliamentary Election 2016”. [online] URL: https://upload.wikimedia.org/wikipedia/commons/2/23/Map_results_of_Cape_Verde_Parliamentary_Elections_2016.png
3. Modifications to source data: Electoral constituency map was recreated from the online image at Wikimedia, with official information fron the National Electoral Commission (Comissão Nacional Eleitoral).
Chile
1. Included elections: 2013 2. Sources: Biblioteca del Congreso Nacional de Chile (2011). “División comunal: polígonos de las comunas de Chile”. Mapas vectoriales. [online] URL: http://siit2.bcn.cl/mapas_vectoriales/index_html/.
Biblioteca del Congreso Nacional de Chile (2016). “División Político-Electoral”. Chile nuestro país. [online] URL: http://www.bcn.cl/siit/nuestropais/divisionelectoral/index.htm.
3. Modifications to source data: Electoral constituencies were generated using a recent map of Chilean communes (which are a low level administrative division of Chile) and information about which communes belong to each electoral constituency. With such data and information at hand, it was possible to merge communes appropriately to generate the electoral constituencies.

GRED Version: May 30, 2017 (20170530)
Codebook Page 20 of 46
Colombia
1. Included elections: 2006 2. Sources: Global Administrative Areas (2012). “Colombia.” GADM database of Global Administrative Areas, version 2.0. [online] URL: www.gadm.org.
3. Modifications to source data: Almost all electoral constituencies matched the 1st level administrative divisions, which were the Departments (Departamentos), Intendancies (Intendencias) or Commissaries (Comisarías). For these, the 1st level map from GADM served as the main electoral constituency map. The polygon corresponding to the capital district from the 2nd level GADM map of Colombian municipalities (municipios) was used to create the capital district (distrito capital). This was added to the map based on 1st level administrative divisions by clipping it over the department of Cundinamarca to avoid overlaps.
Costa Rica
1. Included elections: 2006 2. Sources: Global Administrative Areas (2012). “Costa Rica.” GADM database of Global Administrative Areas, version 2.0. [online] URL: www.gadm.org.
3. Modifications to source data: Electoral constituencies matched the 1st level administrative divisions, which were the provinces (províncias).

GRED Version: May 30, 2017 (20170530)
Codebook Page 21 of 46
Croatia
1. Included elections: 2011 2. Sources: Professor Joel Selway, Brigham Young University.
3. Modifications to source data: Note that the 11th constituency for electors from abroad and also the exclusive non-geographical constituencies for minorities cannot be appropriately represented in maps.
Cyprus
1. Included elections: 2016 2. Sources: Global Administrative Areas (2012). “Cyprus” GADM database of Global Administrative Areas, version 2.0. [online] URL: www.gadm.org.
3. Modifications to source data: Electoral constituencies are equivalent to the 1st level administrative divisions (districts). Therefore, the districtal map in GADM was matched accordingly.

GRED Version: May 30, 2017 (20170530)
Codebook Page 22 of 46
Czech Republic
1. Included elections: 2006 2. Sources: Global Administrative Areas (2012). “Czech Republic.” GADM database of Global Administrative Areas, version 2.0. [online] URL: www.gadm.org.
3. Modifications to source data: Electoral constituencies matched the 1st level administrative divisions—the regions (kraje).
Denmark
1. Included elections: 2007 2. Sources: Danish Ministry of the Environment (2014). “Survey and Cadastre of Denmark.” Danish Geodata Agency. [online] URL: http://eng.gst.dk/maps-topography/#.U7_xofldXmc .
3. Modifications to source data: Electoral constituency map came directly as a Shapefile from the official source and corresponds to the countries (which does not include Greenland or the Faore Islands among the official electoral constituencies of Denmark). Raw maps from the Public Agency Kort & Matrikelstryelsen were provided by Prof. Søren Risbjerg Thomsen.

GRED Version: May 30, 2017 (20170530)
Codebook Page 23 of 46
Dominican Republic
1. Included elections: 1998 2. Sources: Global Administrative Areas (2012). “Dominican Republic.” GADM database of Global Administrative Areas, version 2.0. [online] URL: www.gadm.org.
3. Modifications to source data: Electoral constituencies matched the 1st level administrative divisions, which were the provinces (províncias) plus the national district (distrito nacional). However, a more recent 1st level map from GADM (with 32 provinces) was used to cover an older election (when the country had 30 administrative divisions and thus 30 electoral constituencies). The newer map recreated the older district map, as follows. First, the National District and the province of Santo Domingo (from the GADM file) were merged, forming the older National District. Second, the provinces of Peravia and of San José de Ocoa were merged, thus forming the older province of Peravia.
Ecuador
1. Included elections: 2009 2. Sources: Global Administrative Areas (2012). “Ecuador” GADM database of Global Administrative Areas, version 2.0. [online] URL: www.gadm.org.
3. Modifications to source data: Electoral constituencies are equivalent to the 1st level administrative divisions (provinces). Therefore, the districtal map in GADM was matched accordingly.

GRED Version: May 30, 2017 (20170530)
Codebook Page 24 of 46
El Salvador
1. Included elections: 2015 2. Sources: Electoral Geography Website (2009). “El Salvador. Legislative Election 2009” [online] URL: https://www.electoralgeography.com/new/en/wp-content/gallery/el-salvador2009l/2009-elsalvador.gif.
3. Modifications to source data: Digital map was automatically georeferenced from the original GIF image and checked for errors.
Estonia
1. Included elections: 2015 2. Sources: Maps of World (2015). “Map of Elections in Estonia 2015” [online] URL: http://www.mapsofworld.com/elections/estonia/.
Valimised (n.d.). “Elections and referendums”. [online] URL: http://www.vvk.ee/past-elections/.
3. Modifications to source data: Digital map was automatically georeferenced from the original online image and checked for errors using information from the ValimisedI, the Estonian electoral commission.

GRED Version: May 30, 2017 (20170530)
Codebook Page 25 of 46
Finland
1. Included elections: 2007 2. Sources: Global Administrative Areas (2012). “Finland.” GADM database of Global Administrative Areas, version 2.0. [online] URL: www.gadm.org.
Ministry of Justice (2014). “Parliamentary Elections 18.3.2007 - Results”. Ministry of Justice Election Unit. [online] URL: http://tulospalvelu.vaalit.fi/E2007/e/tulos/lasktila.html.
3. Modifications to source data: Electoral constituencies were created by merging lower administrative units from GADM maps. Almost all were merged from Finish sub-regions (Seutukunta/Ekonomisk region), which are in the 3rd level GADM file. A last constituency, the city of Helsinki, was copied from the municipality (Kunt/Kommun) in the map 4th level GADM file, added into the main map cropping from the Sub-region of Uusimaa to avoid overlapping. Information on the sub-regions and municipalities that formed each electoral constituency came from the Ministry of Justice (Vaalit).
Germany
1. Included elections: 2009 (only Proportional tier currently available) 2. Sources: Federal Statistical Office (2014). “Regional Atlas.” Statistical Offices of the Federation and Länder. [online] URL: https://www.destatis.de/EN/FactsFigures/CountriesRegions/RegionalStatistics/RegionalStatistics.html
3. Modifications to source data: Electoral constituencies matched the 1st level administrative divisions, which were the states (länder). Additional map files were provided via email from the Federal Returning Office (http://www.bundeswahlleiter.de/en/).
GRED Version: May 30, 2017 (20170530)
Codebook Page 26 of 46
Grenada
1. Included elections: 2013 2. Sources: Professor Joel Selway, Brigham Young University.
Guatemala
1. Included elections: 2007 2. Sources: Professor Joel Selway, Brigham Young University.
Guyana
1. Included elections: 2001 2. Sources: Global Administrative Areas (2012). “Guyana.” GADM database of Global Administrative Areas, version 2.0. [online] URL: www.gadm.org.
3. Modifications to source data: Electoral constituencies matched the 1st level administrative divisions, which were the administrative regions.

GRED Version: May 30, 2017 (20170530)
Codebook Page 27 of 46
Honduras
1. Included elections: 2005 2. Sources: Global Administrative Areas (2012). “Honduras.” GADM database of Global Administrative Areas, version 2.0. [online] URL: www.gadm.org.
3. Modifications to source data: Electoral constituencies matched the 1st level administrative divisions, which were the departments (departamentos).
Iceland
1. Included elections: 2005 2. Sources: Global Administrative Areas (2012). “Iceland.” GADM database of Global Administrative Areas, version 2.0. [online] URL: www.gadm.org.
3. Modifications to source data: Electoral constituencies matched the 1st level administrative divisions, which were the regions (landsvæðun).
GRED Version: May 30, 2017 (20170530)
Codebook Page 28 of 46
India
1. Included elections: 2009 2. Sources: Travel India Guide. “Parliamentary Constituencies of India for Election 2009.” Travel India Guide – Parliamentary Constituencies Map & India Elections. [online] URL: http://www.travelindia-guide.com/elections-indian-lok-sabha/parliamentary-constituencies.php
Maps of India. “India General Election 2009.” Maps of India – India Parliamentary Constituencies Map. [online] URL: http://www.mapsofindia.com/parliamentaryconstituencies/ [date retrieved 1 April 2014]
Election Commission of India. “Detailed Results of Latest Elections – 2009.” Election Commission of India – Election Results – Full Statistical Reports. [online] URL: http://eci.nic.in/eci_main1/ElectionStatistics.aspx
3. Modifications to source data: Images for the electoral constituencies first were converted into Shapefiles by Joel Selway from the website Travel India Guide. Next, the images were modified and boundaries redrawn using Maps of India and information from the Election Commission of India.
Indonesia
1. Included elections: 2004 2. Sources: Center for Southeast Asian Studies (2015). “Maps of the 2004 electoral districts”. Northern Illinois University. [online] URL: http://www.seasite.niu.edu/Indonesian/Indonesian_Elections/Districts04.htm. Professor Ursula Daxecker, University of Amsterdam. 3. Modifications to source data: Electoral constituencies were geocoded by professor Ursula Daxecker from high quality maps created by Northern Illinois University.

GRED Version: May 30, 2017 (20170530)
Codebook Page 29 of 46
Ireland
1. Included elections: 2011 2. Sources: Central Statistics Office (2014). “Electoral divisions”. Census 2011 Boundary Files . [online] URL: http://www.cso.ie/en/census/census2011boundaryfiles/.
3. Modifications to source data: Electoral constituency map came directly as a Shapefile from the official source.
Israel
1. Included elections: 2015 2. Sources: Global Administrative Areas (2012). “Israel.” GADM database of Global Administrative Areas, version 2.0. [online] URL: www.gadm.org.
3. Modifications to source data: The single nation-wide electoral constituency is simply the map of the country without any division (i.e. GADM’s 0 level administrative divisions).

GRED Version: May 30, 2017 (20170530)
Codebook Page 30 of 46
Italy
1. Included elections: 1996 (only Proportional tier currently available) 2. Sources: Global Administrative Areas (2012). “Italy.” GADM database of Global Administrative Areas, version 2.0. [online] URL: www.gadm.org.
3. Modifications to source data: Electoral constituencies were created by merging the Italian 1st level administrative divisions, which are provinces (provincias). Information on which province belonged to each electoral constituency was provided by the Italian Ministry of Interior (http://www.interno.gov.it/) and sent to the project team via email. Note that this is for the PR tier (1996), and the region Valle d'Aosta did not have a PR tier. Therefore, the map does not include this region.
Kazakhstan
1. Included elections: 2012 2. Sources: Global Administrative Areas (2012). “Kazakhstan.” GADM database of Global Administrative Areas, version 2.0. [online] URL: www.gadm.org.
3. Modifications to source data: The single nation-wide electoral constituency is simply the map of the country without any division (i.e. GADM’s 0 level administrative divisions).

GRED Version: May 30, 2017 (20170530)
Codebook Page 31 of 46
Latvia
1. Included elections: 2000 2. Sources: Global Administrative Areas (2012). “Latvia.” GADM database of Global Administrative Areas, version 2.0. [online] URL: www.gadm.org.
3. Modifications to source data: Electoral constituencies matched the Latvian provinces in the GADM database.
Liechtenstien
1. Included elections: 2013 2. Sources: Professor Joel Selway, Brigham Young University.

GRED Version: May 30, 2017 (20170530)
Codebook Page 32 of 46
Luxembourg
1. Included elections: 1994 2. Sources: Global Administrative Areas (2012). “Luxembourg.” GADM database of Global Administrative Areas, version 2.0. [online] URL: www.gadm.org.
Le Gouvernement Du Grand-Duche De Luxembourg (2014). “Elections 1994.” Le Site Officiel Des Elections au Grand-Duche de Luxembourg. [online] URL: http://www.elections.public.lu/fr/elections-legislatives/1994/index.html
3. Modifications to source data: Electoral constituencies were created by merging the 2st level administrative divisions, which were the cantons. Information on which cantons formed each electoral constituency was obtained from the official electoral authority of Luxembourg.
Macedonia
1. Included elections: 2011 2. Sources: Professor Joel Selway, Brigham Young University.
Marshall Islands
1. Included elections: 2011 2. Sources: Professor Joel Selway, Brigham Young University.
GRED Version: May 30, 2017 (20170530)
Codebook Page 33 of 46
Mexico
1. Included elections: 2012 (both SMD and PR tiers available) 2. Sources: Instituto Nacional Electoral (2016). “Productos de Geografía Electoral Descargables”. [online] URL: http://portalanterior.ine.mx/archivos3/portal/historico/contenido/interiores/Detalle_Geografia_Electoral_y_Cartografia-id-04a9d8bd4ac04210VgnVCM1000000c68000aRCRD/
Instituto Nacional Electoral (2016). “Mapa de la República Mexicana con División de Circunscripciones Plurinominales”. [online] UL:
Global Administrative Areas (2012). “Mexico.” GADM database of Global Administrative Areas, version 2.0. [online] URL: http://portalanterior.ine.mx/archivos1/Cartografia/CIRCUNSCRIPCIONES/CIRCUNSCRIPCIONES_COLOR_90x60_280813.pdf.
3. Modifications to source data: A shapefile with the single-member districts was directly downloaded from the Instituto Nacional Electoral [first link above] but it was lacking these districts’ names. Such information was provided by Diego Valle-Jones through email. To aggreate the SMD districts into the five PR districts, the official source [second link above] and information provided by Professor Scott Morgenstern were used.
Moldova
1. Included elections: 2010 2. Sources: Global Administrative Areas (2012). “Moldova.” GADM database of Global Administrative Areas, version 2.0. [online] URL: www.gadm.org.
3. Modifications to source data: The single nation-wide electoral constituency is simply the map of the country without any division (i.e. GADM’s 0 level administrative divisions).

GRED Version: May 30, 2017 (20170530)
Codebook Page 34 of 46
Montenegro
1. Included elections: 2010 2. Sources: Global Administrative Areas (2012). “Montenegro.” GADM database of Global Administrative Areas, version 2.0. [online] URL: www.gadm.org.
3. Modifications to source data: The single nation-wide electoral constituency is simply the map of the country without any division (i.e. GADM’s 0 level administrative divisions).
Namibia
1. Included elections: 2014 2. Sources: Global Administrative Areas (2012). “Namibia.” GADM database of Global Administrative Areas, version 2.0. [online] URL: www.gadm.org.
3. Modifications to source data: The single nation-wide electoral constituency is simply the map of the country without any division (i.e. GADM’s 0 level administrative divisions).

GRED Version: May 30, 2017 (20170530)
Codebook Page 35 of 46
Netherlands
1. Included elections: 2010 2. Sources: Global Administrative Areas (2014). “Netherlands.” GADM database of Global Administrative Areas, version 2.0. [online] URL: www.gadm.org.
Nlverkiezingen (2014). “Electoral constituencies”. Elections in Netherland. [online] URL: http://www.nlverkiezingen.com/en/kk.html.
3. Modifications to source data: Although the Netherlands formally employs a single nation-wide electoral constituency, other sub-national electoral constituencies are relevant for the calculation of votes and distribution of seats. GRED maps for the Netherlands deliver those constituencies, whose geometries were built using different level administrative divisions from GADM and information from Nlverkiezingen.
New Zealand
1. Included elections: 2008 2. Sources: Statistics New Zealand (2007). “New Zealand Electoral Districts (NZTM).” Statistics New Zealand. [online] URL: https://www3.stats.govt.nz/digitalboundaries/annual/New%20Zealand%202007%20Electoral%20Districts%20(NZTM)%20(8.35MB).zip
3. Modifications to source data: Electoral constituency map came directly as a Shapefile from the official source. However, the Maori districts are exlcuded, both to follow the definition of main districts in the CLEA main dataset and to avoid confusion as in New Zealand these districts overlap the whole country. They are available upon request.

GRED Version: May 30, 2017 (20170530)
Codebook Page 36 of 46
Nicaragua
1. Included elections: 2011 2. Sources: Global Administrative Areas (2012). “Nicaragua” GADM database of Global Administrative Areas, version 2.0. [online] URL: www.gadm.org.
3. Modifications to source data: Electoral constituencies are equivalent to the 1st level administrative divisions (departments). Therefore, the districtal map in GADM was matched accordingly.
Norway
1. Included elections: 2009 2. Sources: Global Administrative Areas (2012). “Norway.” GADM database of Global Administrative Areas, version 2.0. [online] URL: www.gadm.org.
3. Modifications to source data: Electoral constituencies matched the 1st level administrative divisions, i.e., counties (fylker).

GRED Version: May 30, 2017 (20170530)
Codebook Page 37 of 46
Paraguay
1. Included elections: 2008 2. Sources: Global Administrative Areas (2012). “Paraguay” GADM database of Global Administrative Areas, version 2.0. [online] URL: www.gadm.org.
3. Modifications to source data: Electoral constituencies are equivalent to the 1st level administrative divisions (departments). Therefore, the districtal map in GADM was matched accordingly.
Peru
1. Included elections: 2006 2. Sources: Global Administrative Areas (2012). “Peru.” GADM database of Global Administrative Areas, version 2.0. [online] URL: www.gadm.org.
3. Modifications to source data: Electoral constituencies matched the 1st level administrative divisions, which were the departments (departamentos).

GRED Version: May 30, 2017 (20170530)
Codebook Page 38 of 46
Poland
1. Included elections: 2011 2. Sources: Global Administrative Areas (2012). “Poland” GADM database of Global Administrative Areas, version 2.0. [online] URL: www.gadm.org.
National Electoral Commission (2014). “Election to the Sejm. The Republic of Poland, 25 September 2005”. Election results. http://www.wybory2005.pkw.gov.pl/SJM/PL/WYN/M/17.htm.
3. Modifications to source data: Electoral constituencies were built by merging administrative divisions at multiple levels available in GADM, with information on which areas belonged to each constituency from the National Electoral Commission.
Portugal
1. Included elections: 2009 2. Sources: Global Administrative Areas (2012). “Portugal.” GADM database of Global Administrative Areas, version 2.0. [online] URL: www.gadm.org.
3. Modifications to source data: Electoral constituencies matched the 1st level administrative divisions, which were the departments (distritos).

GRED Version: May 30, 2017 (20170530)
Codebook Page 39 of 46
Romania
1. Included elections: 2000 2. Sources: Global Administrative Areas (2012). “Romania.” GADM database of Global Administrative Areas, version 2.0. [online] URL: www.gadm.org.
3. Modifications to source data: Almost all electoral constituencies matched the 1st level administrative divisions, which are the counties (judete), and the 1st level map from GADM which is the main electoral constituency map. Then, to get the last constituency, which coincided with the city of Bucharest, the city boundary was drawn over the main map, creating a new polygon. This polygon was then separated from the previous county of Bucharest and named Ilfov, as in the official electoral sources.
Russia
1. Included elections: 2003 2. Sources: Global Administrative Areas (2012). “Russia.” GADM database of Global Administrative Areas, version 2.0. [online] URL: www.gadm.org.
3. Modifications to source data: The electoral constituencies considered here were the federal subjects with the addition of the City of Moscow. The federal subjects came from the 1st level GADM file. The city of Moscow was cut from the 2nd level GADM file. Then it was pasted together with the federal subjects, clipping it from the Region of Moscow to avoid overlapping.
GRED Version: May 30, 2017 (20170530)
Codebook Page 40 of 46
Saint Lucia
1. Included elections: 2016 2. Sources: Professor Joel Selway, Brigham Young University.
San Marino
1. Included elections: 2008 2. Sources: Global Administrative Areas (2012). “San Marino.” GADM database of Global Administrative Areas, version 2.0. [online] URL: www.gadm.org.
3. Modifications to source data: The single nation-wide electoral constituency is simply the map of the country without any division (i.e. GADM’s 0 level administrative divisions).
Serbia
1. Included elections: 2012 2. Sources: Global Administrative Areas (2012). “Serbia.” GADM database of Global Administrative Areas, version 2.0. [online] URL: www.gadm.org.
3. Modifications to source data: The single nation-wide electoral constituency is simply the map of the country without any division (i.e. GADM’s 0 level administrative divisions).
GRED Version: May 30, 2017 (20170530)
Codebook Page 41 of 46
Singapore
1. Included elections: 2006 2. Sources: Kireev, Alexander (2014). “Singapore. Legislative Elections 2006.” Electoral Geography 2.0. [online] URL: http://www.electoralgeography.com/new/en/countries/s/singapore/singapore-legislative-election-2006.html
Urban Redevelopment Authority. “Regoin_Census2010.” Singapore Government Data Portal. [online] URL: http://data.gov.sg/Metadata/OneMapMetadata.aspx?id=Region_Census2010&mid=125346&t=SPATIA
3. Modifications to source data: The map from the Urban Redevelopment Authority (URA) was used as the primary image and corrected with satellite images from Google Maps. The image available at Electoral Georgraphy was used as the basis for drawing the boundaries over the URA map. The district names were verified using the list at the Singapore Elections Department (http://www.eld.gov.sg/homepage.html).
Slovakia
1. Included elections: 2016 2. Sources: Global Administrative Areas (2012). “Slovakia.” GADM database of Global Administrative Areas, version 2.0. [online] URL: www.gadm.org.
3. Modifications to source data: The single nation-wide electoral constituency is simply the map of the country without any division (i.e. GADM’s 0 level administrative divisions).

GRED Version: May 30, 2017 (20170530)
Codebook Page 42 of 46
South Africa
1. Included elections: 2014 2. Sources: Electoral Geography Website (2009). “South Africa. Legislative Election 2009” [online] URL: https://www.electoralgeography.com/new/en/wp-content/gallery/south-africa2009/2009-south-africa-legislative.PNG.
3. Modifications to source data: Digital map was automatically georeferenced from the original PNG image and checked for errors.
Spain
1. Included elections: 2008 2. Sources: Global Administrative Areas (2012). “Spain.” GADM database of Global Administrative Areas, version 2.0. [online] URL: www.gadm.org. 3. Modifications to source data: Electoral constituencies coincided with the 1st level administrative divisions, which were the provinces (provincias). They were taken from the 2nd level GADM file. However, this source has the Canary Islands as a sole province, which we then divided into the provinces of Las Palmas and of Santa Cruz de Tenerife.
GRED Version: May 30, 2017 (20170530)
Codebook Page 43 of 46
Sri Lanka
1. Included elections: 2010 2. Sources: Global Administrative Areas (2012). “Sri Lanka.” GADM database of Global Administrative Areas, version 2.0. [online] URL: www.gadm.org.
Election Commission of Sri Lanka. “Electoral Process”. [online] URL: http://www.slelections.gov.lk.
3. Modifications to source data: The electoral constituencies are mostly equivalent to the country’s 1st level administrative divisions. In those cases, constituencies were directly matched over GADM’s maps. For the constituencies that are not, they were manually built using lower level administrative divisions and information from the Election Commission.
Suriname
1. Included elections: 2010 2. Sources: Professor Joel Selway, Brigham Young University.

GRED Version: May 30, 2017 (20170530)
Codebook Page 44 of 46
Sweden
1. Included elections: 2006 2. Sources: Global Administrative Areas (2012). “Sweden.” GADM database of Global Administrative Areas, version 2.0. [online] URL: www.gadm.org. 3. Modifications to source data: Electoral constituencies were created by merging the Swedish municipalities (kommune). Information on which municipality was part of each electoral constituency came from the official electoral authority (http://www.val.se/val/val2006/slutlig/K/rike/delar.html).
Switzerland
1. Included elections: 1995 2. Sources: Global Administrative Areas (2012). “Switzerland.” GADM database of Global Administrative Areas, version 2.0. [online] URL: www.gadm.org. 3. Modifications to source data: Electoral constituencies were drawn using the 1st level administrative units.
Trinidad and Tobago
1. Included elections: 2010 2. Sources: Professor Joel Selway, Brigham Young University.

GRED Version: May 30, 2017 (20170530)
Codebook Page 45 of 46
United Kingdom
1. Included elections: 2010 2. Sources: United Kingdom Ordnance Survey (2014). “OS OpenData: Mapping data and geographic information from Ordnance Survey” United Kingdom Ordnance Survey. [online] URL: https://www.ordnancesurvey.co.uk/opendatadownload/products.html Boundary Commission of Northern Ireland (2014). “Existing Constituencies.” Boundary Commission of Northern Ireland. [online] URL: http://www.boundarycommission.org.uk/index/maps/existing-constituencies-maps.htm 3. Modifications to source data: The final map of the electoral constituencies of the UK was created by merging the official map from the UK Ordnance Survey (which does not include the Northern Irish constituencies) with the official map from the Boundary Commission of Northern Ireland.
United States of America
1. Included elections: 2006 2. Sources: The United States Census Bureau. “Cartographic Boundary Shapefiles – Congressional Districts.” United States Census Bureau [online] URL: http://www.census.gov/geo/maps-data/data/cbf/cbf_cds.html 3. Modifications to source data: Electoral constituency map came directly as Shapefiles from the official source.

GRED Version: May 30, 2017 (20170530)
Codebook Page 46 of 46
Uruguay
1. Included elections: 2014 2. Sources: Global Administrative Areas (2012). “Uruguay” GADM database of Global Administrative Areas, version 2.0. [online] URL: www.gadm.org.
3. Modifications to source data: Electoral constituencies are equivalent to the 1st level administrative divisions (departments). Therefore, the districtal map in GADM was matched accordingly.
Zambia
1. Included elections: 2006 2. Sources: Environmental Systems Resources Institute (2013). “Zambia ENEP in 2004.” ArcGIS Public Repository [online] URL: http://www.arcgis.com/home/item.html?id=2c9ecbe3929444a89e47b6737e935f06
3. Modifications to source data: The Shapefile boundaries correspond to the electoral districts.


