CLB024 Intro duction to Cost Risk Analysis • Exp la in how ...cbafaculty.org/CLB024_Cost Risk...
32
CLB024 Intr o duct ion to Cost Risk Analysi s Lesson 5 - Cost as a Probability Distribution TOC I RESOURCES I PRINT I HELP Lesson Obj ecti ves This lesson pr ovides an ov erv iew of various Probabili ty Distributions and how th ey are used fo r cost elements . • Examine how cos t is tr eated as a probabili ty dist ribut ion • Explain how a To tal Cost Dist ribution is developed • Ident ify four typical types of probabili ty distr ibut ions to represent cost elements • Poge1of 2S I .... Back Next
Transcript of CLB024 Intro duction to Cost Risk Analysis • Exp la in how ...cbafaculty.org/CLB024_Cost Risk...

CLB024 Introduction to Cost Risk Analysis Lesson 5 - Cost as a Probability Distribution TOC I RESOURCES I PRINT I HELP
Lesson Obj ectives
This lesson provides an overview o f v arious Probability Distributions and how they are used for cost elements
bull Examine how cost is treated as a probability distribution
bull Explain how a Total Cost Distribution is developed
bull Identi fy four typical types o f probabili ty distributions to represen t cost elements
bull
~ I Poge1of 2S I Back Next
CLB024 Introduction to Cost Risk Analysis Lesson 5 - Cost as a Probability Distribution TOC I RESOURCES I PRINT I HELP
Cost as a Probability Distribution
The graphic illustrates that different random variables (with different probability distributions) and their Muttlple Probability Distribution __uncertainties can be combined into a
-)probability distribution representing the to tal potential project cost __ ~-----+
This is the finished produc t o f a Cost Risk Analysis - a distribu tion representing the L ---+1u tlllim~~ling
possible total system cos t Rollltiomhip
The cos t of a system can be significan tly bullbull ~-----+1 affected by uncertainty This uncer tainty implies that costs (or any parameter) will vary over some range of values This ~ L - ---J range of possible values allows us to think of cost as a random variable over this range
How do we show the chance (probability) that a par ticular cost in this range of possible costs will be realized One m et hod is w it h a probabili ty d istrjby t jon - a distribution that represents a range of values and associated probabilit ies
The following pages will examine the charac teristics of different POs that are typically used to represent a cost element and methods to develop a Total Cos t Distribution
I Poge 2 of 2S I Back iO 1 Next
CLB024 Introduction to Cost Risk Analysis Lesson 5 - Cost as a Probability Distribution TOC I RESOURCES I PRINT I HELP
Sequential Development
We must do trt2 things w ith respect to these PDFs in order to complete a Cost Risk Analysis
STEP 1 Identify a Probability Density Function (PDF) for each uncertain cost element in the cost estimate
To do this you must
a Iden ti fy high low and most likely values (most likely values are normally the values computed in the cost estimate)
b Choose a shape for the PDF
STEP 2 Combine the input PDFs in to a Total Cost PDF
There are two ways to do this
a Use the method of Symmetric Approximation
b Use the method of Monte carlo Simulation
I Poge 3 of 2S I Back ii 1 Next
CLB024 Introduction to Cost Risk Analysis Lesson 5- Cost as a Probability Distribution TOC I RESOURCES I PRINT 1HELP
High Low and Most Likely
One o f the first steps in developing a to tal cost distribu tion is to iden ti fy the PDFs for each uncer tain cost elemen t These PDFs will be described by either two or three values consisting o f a High Low and Most Likely
To iden ti fy the High and Low values associated with the cost elemen t specialty exper ts are employed
bull Have exper ts verbalize the risks associated with each cost elemen t
Exper ts need to state
bull What could go wrong bull What breakthroughs are possible bull What is cer tain abou t this elemen t
Exper ts need to iden ti fy list the inpu ts that affec t the cost elemen t
bull Inpu t examples system weigh t award fees or composit ion o f material
bull Translate the iden ti fied risks in to possible values for the inpu ts
a Translation becomes more reliable when technical exper ts are involved and boundaries well defined
b Translated risks help iden ti fy high and low values that bound the most likely value from the estimate
rfl I Page 4 of 25 Back liiii ) Next
CLB024 Introduction t o Cost Risk Analysis Lesson 5- Cost as a Probability Distribution TOC I RESO URCES I PRINT I HELP
PDF Shapes
Next s t e p choose the shape o f a dis tribution that the range o f values for a speci fic cos t element would follow
T his will be the Probabili ty Densi ty Func t ion (PDF) and i t represents the dis tribution o f a cos t elements po tential range o f values T here are four PDF shapes that are typically used to represent uncertain cos t elements
T hese four do no t represent all possible PDFs that could be used (e g the lognormal dis tribution is some times seen in cos t risk analysis)
~ I Page 5 of 25 I Back Next
CLB024 Introduction to Cost Risk Analysis Lesson 5 - Cost as a Probability Distribution TOC I RESOURCES I PRINT I HELP
Uniform Distribution
Characteristics
bull All outcomes between high and low are equally Un iform Distribut ion likely
bull Parameters are a ( the low value) and b ( the high value)
bull x coordinates represen t costs
bull y coordinates represen t the likelihood of occLwence
Applica t ion
bull Use when there is no information about the relative likelihood of possible outcomes across the range of possible v alues
I Pogeampof2S I Back Next
CLB024 Introduction to Cost Risk Analysis Lesson 5 - Cost as a Probability Distribution TOC I RESOURCES I PRINT I HELP
Tr iangular Distr ibution
Characteristics
bull Simple to apply Triangle Distribut ion
bull Parameters are the high (b) low (a) and most likely (c )
bull Can be o f any shape between end points with varying degrees o f variance and skewness (size o f the tails) (PDFs with more area in the distribution tails have more probabili ty o f outcomes further from the most likely value)
bull x coordinates represent costs tt661 bull y coordinates represent the likelihood of
c bbulloccurrence Application
bull For a wide range of cost elements and variables
bull Can be shaped to fit most any potential cost
I Poge7of2S I Back Next
CLB024 Introduction to Cost Risk Analysis Lesson 5 - Cost as a Probability Distribution TOC I RESOURCES I PRINT I HELP
Normal Distr ibution
Also known as a Bell Curve
Characteristics No rmal Dist ribution
bull Symmetrical - both sides o f the mean are identical
bull Must be used cautiously for costs because costs generally are not symmetric in nature
bull Parameters required are the mean and standard deviation ( these parameters will be calculated using the low high and most likely values)
bull x coordinates represent costs
bull y coordinates represent the likelihood of bbull
occurrence
Application
More accurate when measurement errors are used as such as the measurements of Mean Tjme Between Failures (MTBF l
I Poge8of 2S I Back Next
Popup Text
Mean Time Between Failures (MTBF)
The mean (average) time between failures of a system Calculations of MTBF assume that the system is fixed after each failure and returned to service immediately after each failure
CLB024 Introduction t o Cost Risk Analysis Lesson 5- Cost as a Probability Distribution TOC I RESO URCES I PRINT I HELP
Beta Distribution
Characterist ics
bull Most flexible o f the distribution shapes - i t can take many forms
bull Difficult to specify parameters a and ~
bull In prac tice assume PERT Beta
PERT (Program Evaluation and Review Technique) Be ta - uses low most likely and high estimates as parameters
Application
bull Wide range o f applications - most cost func tions can be described by PERT Be ta
bull We will use PERT Beta which is a func tion o f the low high and most likely estimates (L H ML) Example shapes o f the Beta distribution
~ I Page9 of25 I Back Next
CLB024 Introduction to Cost Risk Analysis Lesson 5 - Cost as a Probability Distribution TOC I RESOURCES I PRINT I HELP
Uniform Model
To dev elop a Total Cost Distribution using the Sy mmetric Approximation t ec hnique each element must
hav e the mean (JJ) and v ariance (o2) calculat ed The high low and most likely values are inserted into algorithms which approximate the distributions respective parameters
Select the next button to view the algorithms for a Uniform Dist ri but ion
Uniform Distribu tio n
bull Note There is Dll most likely value Uniform Distribution
I I ~ shyJ shy~ shy
)0 U 1S tJS UUS 12S tlaJS 1SlS IN )I tIO1 -~-------------4-bull b
I Pope 10 of 2S I Back Next
CLB024 Introduction to Cost Risk Analysis Lesson 5 - Cost as a Probability Distribution TOC I RESOURCES I PRINT I HELP
Uniform Algorithms
Uniform Distribution - Calculating mean and variance
where a bull min value (low) b = max value (high) 11 bull mean (average) and o bull variance There Is no mode Reason All y values are equivalent Frequency does not change
o2 Average (mean) cost = (low + hlgh)2 variance= ci = (high shy low) 2 12
ci bull 2ru 12
II bull (70 + 1801 2
ci - (180-70) 12
11 bull 125 ci - LQ12
ci bull 12110 12
o = 100833
I Pope 11 of 2S I Back Next
Long Description
Uniform Algorithms
Uniform Distribution - Calculating mean and standard deviation
where a = min value (low) b = max value (high) micro = mean and σ = sd There is no mode Reason All y values are equivalent Frequency does not change
micro σ 2
Average (mean) cost = (low + high)2 Variance = σ sup2 = (high - low) sup212
μ = (a + b) σ sup2 = (b - a) sup2 2 12
μ = (70 + 180) σ sup2 = (180 - 70) sup2 2 12
μ = 125 σ sup2 = (110) 2
12
σ 2 = 12110 12
σ 2 = 100833
CLB024 Introduction to Cost Risk Analysis Lesson 5 - Cost as a Probability Distribution TOC I RESOURCES I PRINT I HELP
Tr iangular Model
Triangular Distribu t ion
bull Represents wide range of possible distribution shapes
Selec t nextbull to view the algorithms for a Triangular Distribution
Triangle Distribution
b
I Pope 12 of 2S I Back Next
CLB024 Intro duction to Cost Risk Analysis
Lesson 5 - Cost as a Probability Distribution TOC I RESOURCES I PRINT I HELP
Tr iangular Algor i thms
Triangle Distribution - Calculating mean and variance
where a a m in value (cost) b = maximum value (cost) c = mode (most likely) (cost) 11 bull mean and a =Variance
0 2IJ Average (mean) cost = Variance = a
( low + most likely + high)3
11 = (atctb a bull Ca2tc2tb1-ab-ac-bcl 3 18
a= 2ZQQ 11 = (70 t 100 + 180 18
3 a= 53889
11 = 11667
I Pope 13 of 2S I Back Next
Long Description
Triangle Distribution - Calculating mean and variance
where a = min value (cost) b = maximum value (cost) c = mode (most likely cost) μ = mean and σ 2 = variance
μ σ 2
Average (mean) cost = (low + most likely + high) 3 Variance = σ sup2
μ = (a + c + b) σ sup2 = (a sup2 + c sup2 + b sup2 - ab - ac - bc) 3 18
μ = (70 + 180 + 100) σ sup2 = 9700 3 18
μ = 11667 σ 2 = 53888
CLB024 Introduction to Cost Risk Analysis Lesson 5 - Cost as a Probability Distribution TOC I RESOURCES I PRINT I HELP
Normal Model
Norm al Distribution
bull Also known as a Bell Curve
Select the next button to view the algorithms for a Normal Distribu tion
Normal Dist r ibution
10 bullJn JJS lllU IU b a
I Pope 14 of 2S I Back Next
CLB024 Introduction to Cost Risk Analysis Lesson 5 - Cost as a Probability Distribution TOC I RESOURCES I PRINT I HELP
Normal Algor ithms
Normal Distribution - Calculating mean and variance
~ 0 2 where c approximates the mean of the normal where a = min value ( low) distribution b = max value (high)
~ = mean (average) c = most likely value
Variance = a Average (mean ) ~ = c
~ = 125 a = (Jla)l 36
a= (180-70~ 36
a= ( 110 )l
36 a= 12100
36 a= 33611
I Pope 15 of 25 I Back Next
Long Description
Normal Distribution - Calculating mean and variance
μ
where c approximates the mean of the normal distribution (high)
c = most likely value
Average (mean) μ = c μ = 125
σ 2
where a = min value (low) b = max value
μ = mean (average)
Variance = σ2
σ 2 = (b - a)2
36
σ 2 = (180 - 70)2
36
σ 2 = (110)2
36
σ 2 = 12100 36
σ 2 = 33611
CLB024 Introduction to Cost Risk Analysis Lesson 5 - Cost as a Probability Distribution TOC I RESOURCES I PRINT I HELP
Beta Model
Bet a Distribu tion
bull Beta shapes are determined by a and 13 parameters - which are difficult to determine
bull Use low most likely and high estimates
Selec t the next button to view the algori thms for a Be ta Distribu tion
Beta Distribution
I Pope 18 of 2S I Back Next
CLB024 Introduction to Cost Risk Analysis Lesson 5 - Cost as a Probability Distribution TOC I RESOURCES I PRINT I HELP
Beta Algor ithms
Beta (Pert Distribution - Calculating mean and variance
where a min value (low) b max value (high) c most likely value 11 bull mean (average) and a variance
tl Average (mean) cost = Variance a 0
(low + 4(rnost II ely + hlgh)6 a c Lbal0 36
11 = (aplusmn4cplusmnb) a 0 (180-70)2 6 36
11 = (70 plusmn 4(1 00) plusmn 80) 6 a = UlU
36
a a 12100 36
II = 125 a c 33611
o c
Q
I Pope 17 of 2S I Back Next
Long Description
Calculating mean and standard deviation
where a = min value (cost) b = maximum value (cost) c = mode (most likely cost) μ = mean and σ sup2 = variance
micro Average (mean) cost = (low + 4(most likely) + high)6 micro = (a + 4c + b)
6 micro = (70 + 4(125) + 180)
6
micro = 750 6
micro = 125
σ2
Variance = σ2
σ2 = (b - a)2
36 σ2 = (180 - 70)2
36
σ2 = (110)2
36 σ2 = 12100
36 σ2 = 33611
CLB024 Introduction t o Cost Risk Analysis Lesson 5- Cost as a Probability Distribution TOC I RESO URCES I PRINT I HELP
Symmet ric Approxi mation
The second step in developing a to tal cost distribu tion is to combine all the iden ti fied risks and their associated ranges in to a single distribu tion One technique is Symmetric Approximatio n
Symmetric Approximation is also known as the Summatio n of Moments PDFs have four momen ts 1st shyMean 2nd - Variance 3rd - Coe ffic ien t o f Skewness (symmetry ) and 4 th - Coe ffic ien t o f Kurtosis (heigh t )
Data o f the Symmetric Approximation method is placed in a linear table o f calculations Work Breakdown Struc ture cost elemen ts are listed with their distribu tion type mean and variance The means and variances are summed ( the summation o f momen ts ) which describe an approximate normal distribu tion Probabili ty statemen ts can then be made concerning funding levels This procedure assumes that all summed elemen ts are independen t o f each o ther This will no t normally be the case and addit ional techniques must be used to de termine the impac t o f dependence among elemen ts This calculation is beyond the scope o f this module
Click here to view an example
~ I Page 18 of 25 I Back Next
Popup Text
Uncertainty Analysis by Symmetric Approximation Example
CLB024 Introduction to Cost Risk Analysis Lesson 5- Cost as a Probability Distribution TOC I RESOURCES I PRINT 1HELP
Monte Carlo Simulation
A distribution is de fined for each cost element from which a random sample is drawn The samples from each cost elements distribution are summed to a to tal cost This sampling and summing process is repeated many times (eg 1000- 10000 times) The result is a distribution representing the to tal cost o f the system with all described uncertainties taken into account The distribution can be displayed by a cumulative probabili ty distribution
Iterations in Monte Carlo Simulation
Rot~~
_ l4_-RbullU~ OA TCoot 12tu middot 182clamp bull sa-12 Ul
I $l4SU
12511t $4501t $562
Maiefllll bull~- - -+ I I I
1000 bull=o7----J
~
bull
-ld ~toe lL_ _ ampft 10
no~us Do~~W -~
~ I Pa ge 19 of 25 I Back Next
CLB024 Introduction to Cost Risk Analysis Lesson 5 - Cost as a Probability Distribution TOC I RESOURCES I PRINT I HELP
Knowledge Review
Which input would not affect cost
Award fees
Composition o f materials
System weight
~ None of the above
Any o f t he input s would affect cost
Muttlple Probability Distribution centol(
)______ ~
M~ L---~ --~-
L ----+00 _
tlllimoling Rotnliommipa
I Pope 20 of 2S I Back Next
CLB024 Introduction to Cost Risk Analysis Lesson 5- Cost as a Probability Distribution TOC I RESOURCES I PRINT 1HELP
Knowledge Review
A distribu t ion represen ting a systems to tal cost wi th uncer tain t ies inc luded is the sum o f many indiv idual cost elemen t distribu t ions
~ True Iterations in Monte Carlo Simulation _ --~_~
1bull111nbull $C bull Mlt10 middot- -bull --False rshybull=- middot u-middot~-middot 1 - middot~ - r-+ J
bull -shy- _ shy I - --~- bull bull bull bull bull bullmiddot~ --lA~ -
Check Answer
T he answer is True T his is the de fini t ion o f the to tal system cost distribu t ion
~ I Page 21 of 25 I Back Next
CLB024 Introduction to Cost Risk Analysis Lesson 5 - Cost as a Probability Distribution TOC I RESOURCES I PRINT I HELP
Know ledge Review
Each probability distribution has distinct characteristics Choose the correct match below and submit your answer
High and Low values are eguallv likely - Normal Distribution More accyrate when MTBF measurements are ysed - Uniform Distribution Wide range o f dis tribu tion shapes with potentjally large tails - Beta Distribu tion Parameters are difficult to determine use PERI approximation - Triangular Distribution
~ High and Low values are equally likely - Uniform Distribu tion More accyrate when MTBF measuremen ts are used - Normal Distribution Wide range of dis tribu tion shapes with potentjaly large tails - Triangular Distribution Parameters are difficult t o determine use PERT approximation - Beta Distribution
Check Answ er
The answer is High a nd Low values are equally likely - Uniform Dist ri but ion More accurat e when MTBF measurement s are used - Normal Dist ribut ion Wid e range o f d ist ri but ion s hapes wit h pot ent ially large t ails - Triangular Dist ribut ion and Param et e rs are difficult t o de t ermine use PERT a pproximat ion - Bet a Dist ri but ion
I Pope 22 of 2S I Back Next
CLB024 Introduction to Cost Risk Analysis Lesson 5 - Cost as a Probability Distribution TOC I RESOURCES I PRINT I HELP
Summary
To complete a Cost Risk Analysis
bull Identify a Probability Density Function for each uncertain element in the cost estimate
bull Combine the element uncertainties into a Total Cost PDF
There are two mathematical approaches
bull Symmetric Approximation (Summation o f Moments )
bull Monte Carlo Simulation
Uniform Distribution - High and Low values are equally likely
bull Used when there is no likelihood information
Triangular Distribu t ion - Includes all three parameters high low and most likely v alue
bull Tails can be heavy or fat
Normal Distribu ti on - Bell Curve
bull Symmetrical on both sides o f the mean
bull ReqLiires mean and standard deviation
I Pope 23 of 2S I Back Next
CLB024 Introduction t o Cost Risk Analysis Lesson 5- Cost as a Probability Distribution TOC I RESO URCES I PRINT I HELP
Summary Cont
Beta Dist rib ut io n - can take on many possible shapes
bull Requires a and ~
bull Assume PERT Beta use low most likely and high estimates
Table o f Algori thms for calculating means and variances for four distribu tions
Distribution Mean Variance
ll=(a + b) 02 =(b - al2 Uniform
2 12
ll = la+c+b) 02= a 2 + b2+ c2-ab - ac - be) Triangular 3 18
o 2 b - a)2
Normal ll = C 36
ll=a + 4c + b) o2 b - a)2 Beta
6 36 I
Q
~ I Page24of 25 I Back Next
Long Description
Table of Algorithms for each distribution shape
Distribution Uniform Mean μ = (a + b) 2 Variance σ2 = (b-a)2 12
Distribution Triangular Mean μ = (a + c + b) 3 Variance σ2 = (a2 + b2 + c2 - ab - ac - bc) 18
Distribution Normal Mean μ = c Variance σ2 = (b - a)2 36
Distribution Beta Mean μ = (a + 4c + b) 6 Variance σ2 = (b - a )2 36
CLB024 Introduction to Cost Risk Analysis Lesson 5 - Cost as a Probability Distribution TOC I RESOURCES I PRINT I HELP
Lesson Completion
You have comple ted the content for this lesson
To continue selec t ano ther lesson from the Table o f Con ten ts on the le ft
If you have closed or hidden the Table of Conten ts click the Show TOC button at the top in the Atlas navigation bar
I Poobull 25 of 25 I Back Next

CLB024 Introduction to Cost Risk Analysis Lesson 5 - Cost as a Probability Distribution TOC I RESOURCES I PRINT I HELP
Sequential Development
We must do trt2 things w ith respect to these PDFs in order to complete a Cost Risk Analysis
STEP 1 Identify a Probability Density Function (PDF) for each uncertain cost element in the cost estimate
To do this you must
a Iden ti fy high low and most likely values (most likely values are normally the values computed in the cost estimate)
b Choose a shape for the PDF
STEP 2 Combine the input PDFs in to a Total Cost PDF
There are two ways to do this
a Use the method of Symmetric Approximation
b Use the method of Monte carlo Simulation
I Poge 3 of 2S I Back ii 1 Next
CLB024 Introduction to Cost Risk Analysis Lesson 5- Cost as a Probability Distribution TOC I RESOURCES I PRINT 1HELP
High Low and Most Likely
One o f the first steps in developing a to tal cost distribu tion is to iden ti fy the PDFs for each uncer tain cost elemen t These PDFs will be described by either two or three values consisting o f a High Low and Most Likely
To iden ti fy the High and Low values associated with the cost elemen t specialty exper ts are employed
bull Have exper ts verbalize the risks associated with each cost elemen t
Exper ts need to state
bull What could go wrong bull What breakthroughs are possible bull What is cer tain abou t this elemen t
Exper ts need to iden ti fy list the inpu ts that affec t the cost elemen t
bull Inpu t examples system weigh t award fees or composit ion o f material
bull Translate the iden ti fied risks in to possible values for the inpu ts
a Translation becomes more reliable when technical exper ts are involved and boundaries well defined
b Translated risks help iden ti fy high and low values that bound the most likely value from the estimate
rfl I Page 4 of 25 Back liiii ) Next
CLB024 Introduction t o Cost Risk Analysis Lesson 5- Cost as a Probability Distribution TOC I RESO URCES I PRINT I HELP
PDF Shapes
Next s t e p choose the shape o f a dis tribution that the range o f values for a speci fic cos t element would follow
T his will be the Probabili ty Densi ty Func t ion (PDF) and i t represents the dis tribution o f a cos t elements po tential range o f values T here are four PDF shapes that are typically used to represent uncertain cos t elements
T hese four do no t represent all possible PDFs that could be used (e g the lognormal dis tribution is some times seen in cos t risk analysis)
~ I Page 5 of 25 I Back Next
CLB024 Introduction to Cost Risk Analysis Lesson 5 - Cost as a Probability Distribution TOC I RESOURCES I PRINT I HELP
Uniform Distribution
Characteristics
bull All outcomes between high and low are equally Un iform Distribut ion likely
bull Parameters are a ( the low value) and b ( the high value)
bull x coordinates represen t costs
bull y coordinates represen t the likelihood of occLwence
Applica t ion
bull Use when there is no information about the relative likelihood of possible outcomes across the range of possible v alues
I Pogeampof2S I Back Next
CLB024 Introduction to Cost Risk Analysis Lesson 5 - Cost as a Probability Distribution TOC I RESOURCES I PRINT I HELP
Tr iangular Distr ibution
Characteristics
bull Simple to apply Triangle Distribut ion
bull Parameters are the high (b) low (a) and most likely (c )
bull Can be o f any shape between end points with varying degrees o f variance and skewness (size o f the tails) (PDFs with more area in the distribution tails have more probabili ty o f outcomes further from the most likely value)
bull x coordinates represent costs tt661 bull y coordinates represent the likelihood of
c bbulloccurrence Application
bull For a wide range of cost elements and variables
bull Can be shaped to fit most any potential cost
I Poge7of2S I Back Next
CLB024 Introduction to Cost Risk Analysis Lesson 5 - Cost as a Probability Distribution TOC I RESOURCES I PRINT I HELP
Normal Distr ibution
Also known as a Bell Curve
Characteristics No rmal Dist ribution
bull Symmetrical - both sides o f the mean are identical
bull Must be used cautiously for costs because costs generally are not symmetric in nature
bull Parameters required are the mean and standard deviation ( these parameters will be calculated using the low high and most likely values)
bull x coordinates represent costs
bull y coordinates represent the likelihood of bbull
occurrence
Application
More accurate when measurement errors are used as such as the measurements of Mean Tjme Between Failures (MTBF l
I Poge8of 2S I Back Next
Popup Text
Mean Time Between Failures (MTBF)
The mean (average) time between failures of a system Calculations of MTBF assume that the system is fixed after each failure and returned to service immediately after each failure
CLB024 Introduction t o Cost Risk Analysis Lesson 5- Cost as a Probability Distribution TOC I RESO URCES I PRINT I HELP
Beta Distribution
Characterist ics
bull Most flexible o f the distribution shapes - i t can take many forms
bull Difficult to specify parameters a and ~
bull In prac tice assume PERT Beta
PERT (Program Evaluation and Review Technique) Be ta - uses low most likely and high estimates as parameters
Application
bull Wide range o f applications - most cost func tions can be described by PERT Be ta
bull We will use PERT Beta which is a func tion o f the low high and most likely estimates (L H ML) Example shapes o f the Beta distribution
~ I Page9 of25 I Back Next
CLB024 Introduction to Cost Risk Analysis Lesson 5 - Cost as a Probability Distribution TOC I RESOURCES I PRINT I HELP
Uniform Model
To dev elop a Total Cost Distribution using the Sy mmetric Approximation t ec hnique each element must
hav e the mean (JJ) and v ariance (o2) calculat ed The high low and most likely values are inserted into algorithms which approximate the distributions respective parameters
Select the next button to view the algorithms for a Uniform Dist ri but ion
Uniform Distribu tio n
bull Note There is Dll most likely value Uniform Distribution
I I ~ shyJ shy~ shy
)0 U 1S tJS UUS 12S tlaJS 1SlS IN )I tIO1 -~-------------4-bull b
I Pope 10 of 2S I Back Next
CLB024 Introduction to Cost Risk Analysis Lesson 5 - Cost as a Probability Distribution TOC I RESOURCES I PRINT I HELP
Uniform Algorithms
Uniform Distribution - Calculating mean and variance
where a bull min value (low) b = max value (high) 11 bull mean (average) and o bull variance There Is no mode Reason All y values are equivalent Frequency does not change
o2 Average (mean) cost = (low + hlgh)2 variance= ci = (high shy low) 2 12
ci bull 2ru 12
II bull (70 + 1801 2
ci - (180-70) 12
11 bull 125 ci - LQ12
ci bull 12110 12
o = 100833
I Pope 11 of 2S I Back Next
Long Description
Uniform Algorithms
Uniform Distribution - Calculating mean and standard deviation
where a = min value (low) b = max value (high) micro = mean and σ = sd There is no mode Reason All y values are equivalent Frequency does not change
micro σ 2
Average (mean) cost = (low + high)2 Variance = σ sup2 = (high - low) sup212
μ = (a + b) σ sup2 = (b - a) sup2 2 12
μ = (70 + 180) σ sup2 = (180 - 70) sup2 2 12
μ = 125 σ sup2 = (110) 2
12
σ 2 = 12110 12
σ 2 = 100833
CLB024 Introduction to Cost Risk Analysis Lesson 5 - Cost as a Probability Distribution TOC I RESOURCES I PRINT I HELP
Tr iangular Model
Triangular Distribu t ion
bull Represents wide range of possible distribution shapes
Selec t nextbull to view the algorithms for a Triangular Distribution
Triangle Distribution
b
I Pope 12 of 2S I Back Next
CLB024 Intro duction to Cost Risk Analysis
Lesson 5 - Cost as a Probability Distribution TOC I RESOURCES I PRINT I HELP
Tr iangular Algor i thms
Triangle Distribution - Calculating mean and variance
where a a m in value (cost) b = maximum value (cost) c = mode (most likely) (cost) 11 bull mean and a =Variance
0 2IJ Average (mean) cost = Variance = a
( low + most likely + high)3
11 = (atctb a bull Ca2tc2tb1-ab-ac-bcl 3 18
a= 2ZQQ 11 = (70 t 100 + 180 18
3 a= 53889
11 = 11667
I Pope 13 of 2S I Back Next
Long Description
Triangle Distribution - Calculating mean and variance
where a = min value (cost) b = maximum value (cost) c = mode (most likely cost) μ = mean and σ 2 = variance
μ σ 2
Average (mean) cost = (low + most likely + high) 3 Variance = σ sup2
μ = (a + c + b) σ sup2 = (a sup2 + c sup2 + b sup2 - ab - ac - bc) 3 18
μ = (70 + 180 + 100) σ sup2 = 9700 3 18
μ = 11667 σ 2 = 53888
CLB024 Introduction to Cost Risk Analysis Lesson 5 - Cost as a Probability Distribution TOC I RESOURCES I PRINT I HELP
Normal Model
Norm al Distribution
bull Also known as a Bell Curve
Select the next button to view the algorithms for a Normal Distribu tion
Normal Dist r ibution
10 bullJn JJS lllU IU b a
I Pope 14 of 2S I Back Next
CLB024 Introduction to Cost Risk Analysis Lesson 5 - Cost as a Probability Distribution TOC I RESOURCES I PRINT I HELP
Normal Algor ithms
Normal Distribution - Calculating mean and variance
~ 0 2 where c approximates the mean of the normal where a = min value ( low) distribution b = max value (high)
~ = mean (average) c = most likely value
Variance = a Average (mean ) ~ = c
~ = 125 a = (Jla)l 36
a= (180-70~ 36
a= ( 110 )l
36 a= 12100
36 a= 33611
I Pope 15 of 25 I Back Next
Long Description
Normal Distribution - Calculating mean and variance
μ
where c approximates the mean of the normal distribution (high)
c = most likely value
Average (mean) μ = c μ = 125
σ 2
where a = min value (low) b = max value
μ = mean (average)
Variance = σ2
σ 2 = (b - a)2
36
σ 2 = (180 - 70)2
36
σ 2 = (110)2
36
σ 2 = 12100 36
σ 2 = 33611
CLB024 Introduction to Cost Risk Analysis Lesson 5 - Cost as a Probability Distribution TOC I RESOURCES I PRINT I HELP
Beta Model
Bet a Distribu tion
bull Beta shapes are determined by a and 13 parameters - which are difficult to determine
bull Use low most likely and high estimates
Selec t the next button to view the algori thms for a Be ta Distribu tion
Beta Distribution
I Pope 18 of 2S I Back Next
CLB024 Introduction to Cost Risk Analysis Lesson 5 - Cost as a Probability Distribution TOC I RESOURCES I PRINT I HELP
Beta Algor ithms
Beta (Pert Distribution - Calculating mean and variance
where a min value (low) b max value (high) c most likely value 11 bull mean (average) and a variance
tl Average (mean) cost = Variance a 0
(low + 4(rnost II ely + hlgh)6 a c Lbal0 36
11 = (aplusmn4cplusmnb) a 0 (180-70)2 6 36
11 = (70 plusmn 4(1 00) plusmn 80) 6 a = UlU
36
a a 12100 36
II = 125 a c 33611
o c
Q
I Pope 17 of 2S I Back Next
Long Description
Calculating mean and standard deviation
where a = min value (cost) b = maximum value (cost) c = mode (most likely cost) μ = mean and σ sup2 = variance
micro Average (mean) cost = (low + 4(most likely) + high)6 micro = (a + 4c + b)
6 micro = (70 + 4(125) + 180)
6
micro = 750 6
micro = 125
σ2
Variance = σ2
σ2 = (b - a)2
36 σ2 = (180 - 70)2
36
σ2 = (110)2
36 σ2 = 12100
36 σ2 = 33611
CLB024 Introduction t o Cost Risk Analysis Lesson 5- Cost as a Probability Distribution TOC I RESO URCES I PRINT I HELP
Symmet ric Approxi mation
The second step in developing a to tal cost distribu tion is to combine all the iden ti fied risks and their associated ranges in to a single distribu tion One technique is Symmetric Approximatio n
Symmetric Approximation is also known as the Summatio n of Moments PDFs have four momen ts 1st shyMean 2nd - Variance 3rd - Coe ffic ien t o f Skewness (symmetry ) and 4 th - Coe ffic ien t o f Kurtosis (heigh t )
Data o f the Symmetric Approximation method is placed in a linear table o f calculations Work Breakdown Struc ture cost elemen ts are listed with their distribu tion type mean and variance The means and variances are summed ( the summation o f momen ts ) which describe an approximate normal distribu tion Probabili ty statemen ts can then be made concerning funding levels This procedure assumes that all summed elemen ts are independen t o f each o ther This will no t normally be the case and addit ional techniques must be used to de termine the impac t o f dependence among elemen ts This calculation is beyond the scope o f this module
Click here to view an example
~ I Page 18 of 25 I Back Next
Popup Text
Uncertainty Analysis by Symmetric Approximation Example
CLB024 Introduction to Cost Risk Analysis Lesson 5- Cost as a Probability Distribution TOC I RESOURCES I PRINT 1HELP
Monte Carlo Simulation
A distribution is de fined for each cost element from which a random sample is drawn The samples from each cost elements distribution are summed to a to tal cost This sampling and summing process is repeated many times (eg 1000- 10000 times) The result is a distribution representing the to tal cost o f the system with all described uncertainties taken into account The distribution can be displayed by a cumulative probabili ty distribution
Iterations in Monte Carlo Simulation
Rot~~
_ l4_-RbullU~ OA TCoot 12tu middot 182clamp bull sa-12 Ul
I $l4SU
12511t $4501t $562
Maiefllll bull~- - -+ I I I
1000 bull=o7----J
~
bull
-ld ~toe lL_ _ ampft 10
no~us Do~~W -~
~ I Pa ge 19 of 25 I Back Next
CLB024 Introduction to Cost Risk Analysis Lesson 5 - Cost as a Probability Distribution TOC I RESOURCES I PRINT I HELP
Knowledge Review
Which input would not affect cost
Award fees
Composition o f materials
System weight
~ None of the above
Any o f t he input s would affect cost
Muttlple Probability Distribution centol(
)______ ~
M~ L---~ --~-
L ----+00 _
tlllimoling Rotnliommipa
I Pope 20 of 2S I Back Next
CLB024 Introduction to Cost Risk Analysis Lesson 5- Cost as a Probability Distribution TOC I RESOURCES I PRINT 1HELP
Knowledge Review
A distribu t ion represen ting a systems to tal cost wi th uncer tain t ies inc luded is the sum o f many indiv idual cost elemen t distribu t ions
~ True Iterations in Monte Carlo Simulation _ --~_~
1bull111nbull $C bull Mlt10 middot- -bull --False rshybull=- middot u-middot~-middot 1 - middot~ - r-+ J
bull -shy- _ shy I - --~- bull bull bull bull bull bullmiddot~ --lA~ -
Check Answer
T he answer is True T his is the de fini t ion o f the to tal system cost distribu t ion
~ I Page 21 of 25 I Back Next
CLB024 Introduction to Cost Risk Analysis Lesson 5 - Cost as a Probability Distribution TOC I RESOURCES I PRINT I HELP
Know ledge Review
Each probability distribution has distinct characteristics Choose the correct match below and submit your answer
High and Low values are eguallv likely - Normal Distribution More accyrate when MTBF measurements are ysed - Uniform Distribution Wide range o f dis tribu tion shapes with potentjally large tails - Beta Distribu tion Parameters are difficult to determine use PERI approximation - Triangular Distribution
~ High and Low values are equally likely - Uniform Distribu tion More accyrate when MTBF measuremen ts are used - Normal Distribution Wide range of dis tribu tion shapes with potentjaly large tails - Triangular Distribution Parameters are difficult t o determine use PERT approximation - Beta Distribution
Check Answ er
The answer is High a nd Low values are equally likely - Uniform Dist ri but ion More accurat e when MTBF measurement s are used - Normal Dist ribut ion Wid e range o f d ist ri but ion s hapes wit h pot ent ially large t ails - Triangular Dist ribut ion and Param et e rs are difficult t o de t ermine use PERT a pproximat ion - Bet a Dist ri but ion
I Pope 22 of 2S I Back Next
CLB024 Introduction to Cost Risk Analysis Lesson 5 - Cost as a Probability Distribution TOC I RESOURCES I PRINT I HELP
Summary
To complete a Cost Risk Analysis
bull Identify a Probability Density Function for each uncertain element in the cost estimate
bull Combine the element uncertainties into a Total Cost PDF
There are two mathematical approaches
bull Symmetric Approximation (Summation o f Moments )
bull Monte Carlo Simulation
Uniform Distribution - High and Low values are equally likely
bull Used when there is no likelihood information
Triangular Distribu t ion - Includes all three parameters high low and most likely v alue
bull Tails can be heavy or fat
Normal Distribu ti on - Bell Curve
bull Symmetrical on both sides o f the mean
bull ReqLiires mean and standard deviation
I Pope 23 of 2S I Back Next
CLB024 Introduction t o Cost Risk Analysis Lesson 5- Cost as a Probability Distribution TOC I RESO URCES I PRINT I HELP
Summary Cont
Beta Dist rib ut io n - can take on many possible shapes
bull Requires a and ~
bull Assume PERT Beta use low most likely and high estimates
Table o f Algori thms for calculating means and variances for four distribu tions
Distribution Mean Variance
ll=(a + b) 02 =(b - al2 Uniform
2 12
ll = la+c+b) 02= a 2 + b2+ c2-ab - ac - be) Triangular 3 18
o 2 b - a)2
Normal ll = C 36
ll=a + 4c + b) o2 b - a)2 Beta
6 36 I
Q
~ I Page24of 25 I Back Next
Long Description
Table of Algorithms for each distribution shape
Distribution Uniform Mean μ = (a + b) 2 Variance σ2 = (b-a)2 12
Distribution Triangular Mean μ = (a + c + b) 3 Variance σ2 = (a2 + b2 + c2 - ab - ac - bc) 18
Distribution Normal Mean μ = c Variance σ2 = (b - a)2 36
Distribution Beta Mean μ = (a + 4c + b) 6 Variance σ2 = (b - a )2 36
CLB024 Introduction to Cost Risk Analysis Lesson 5 - Cost as a Probability Distribution TOC I RESOURCES I PRINT I HELP
Lesson Completion
You have comple ted the content for this lesson
To continue selec t ano ther lesson from the Table o f Con ten ts on the le ft
If you have closed or hidden the Table of Conten ts click the Show TOC button at the top in the Atlas navigation bar
I Poobull 25 of 25 I Back Next

CLB024 Introduction to Cost Risk Analysis Lesson 5- Cost as a Probability Distribution TOC I RESOURCES I PRINT 1HELP
High Low and Most Likely
One o f the first steps in developing a to tal cost distribu tion is to iden ti fy the PDFs for each uncer tain cost elemen t These PDFs will be described by either two or three values consisting o f a High Low and Most Likely
To iden ti fy the High and Low values associated with the cost elemen t specialty exper ts are employed
bull Have exper ts verbalize the risks associated with each cost elemen t
Exper ts need to state
bull What could go wrong bull What breakthroughs are possible bull What is cer tain abou t this elemen t
Exper ts need to iden ti fy list the inpu ts that affec t the cost elemen t
bull Inpu t examples system weigh t award fees or composit ion o f material
bull Translate the iden ti fied risks in to possible values for the inpu ts
a Translation becomes more reliable when technical exper ts are involved and boundaries well defined
b Translated risks help iden ti fy high and low values that bound the most likely value from the estimate
rfl I Page 4 of 25 Back liiii ) Next
CLB024 Introduction t o Cost Risk Analysis Lesson 5- Cost as a Probability Distribution TOC I RESO URCES I PRINT I HELP
PDF Shapes
Next s t e p choose the shape o f a dis tribution that the range o f values for a speci fic cos t element would follow
T his will be the Probabili ty Densi ty Func t ion (PDF) and i t represents the dis tribution o f a cos t elements po tential range o f values T here are four PDF shapes that are typically used to represent uncertain cos t elements
T hese four do no t represent all possible PDFs that could be used (e g the lognormal dis tribution is some times seen in cos t risk analysis)
~ I Page 5 of 25 I Back Next
CLB024 Introduction to Cost Risk Analysis Lesson 5 - Cost as a Probability Distribution TOC I RESOURCES I PRINT I HELP
Uniform Distribution
Characteristics
bull All outcomes between high and low are equally Un iform Distribut ion likely
bull Parameters are a ( the low value) and b ( the high value)
bull x coordinates represen t costs
bull y coordinates represen t the likelihood of occLwence
Applica t ion
bull Use when there is no information about the relative likelihood of possible outcomes across the range of possible v alues
I Pogeampof2S I Back Next
CLB024 Introduction to Cost Risk Analysis Lesson 5 - Cost as a Probability Distribution TOC I RESOURCES I PRINT I HELP
Tr iangular Distr ibution
Characteristics
bull Simple to apply Triangle Distribut ion
bull Parameters are the high (b) low (a) and most likely (c )
bull Can be o f any shape between end points with varying degrees o f variance and skewness (size o f the tails) (PDFs with more area in the distribution tails have more probabili ty o f outcomes further from the most likely value)
bull x coordinates represent costs tt661 bull y coordinates represent the likelihood of
c bbulloccurrence Application
bull For a wide range of cost elements and variables
bull Can be shaped to fit most any potential cost
I Poge7of2S I Back Next
CLB024 Introduction to Cost Risk Analysis Lesson 5 - Cost as a Probability Distribution TOC I RESOURCES I PRINT I HELP
Normal Distr ibution
Also known as a Bell Curve
Characteristics No rmal Dist ribution
bull Symmetrical - both sides o f the mean are identical
bull Must be used cautiously for costs because costs generally are not symmetric in nature
bull Parameters required are the mean and standard deviation ( these parameters will be calculated using the low high and most likely values)
bull x coordinates represent costs
bull y coordinates represent the likelihood of bbull
occurrence
Application
More accurate when measurement errors are used as such as the measurements of Mean Tjme Between Failures (MTBF l
I Poge8of 2S I Back Next
Popup Text
Mean Time Between Failures (MTBF)
The mean (average) time between failures of a system Calculations of MTBF assume that the system is fixed after each failure and returned to service immediately after each failure
CLB024 Introduction t o Cost Risk Analysis Lesson 5- Cost as a Probability Distribution TOC I RESO URCES I PRINT I HELP
Beta Distribution
Characterist ics
bull Most flexible o f the distribution shapes - i t can take many forms
bull Difficult to specify parameters a and ~
bull In prac tice assume PERT Beta
PERT (Program Evaluation and Review Technique) Be ta - uses low most likely and high estimates as parameters
Application
bull Wide range o f applications - most cost func tions can be described by PERT Be ta
bull We will use PERT Beta which is a func tion o f the low high and most likely estimates (L H ML) Example shapes o f the Beta distribution
~ I Page9 of25 I Back Next
CLB024 Introduction to Cost Risk Analysis Lesson 5 - Cost as a Probability Distribution TOC I RESOURCES I PRINT I HELP
Uniform Model
To dev elop a Total Cost Distribution using the Sy mmetric Approximation t ec hnique each element must
hav e the mean (JJ) and v ariance (o2) calculat ed The high low and most likely values are inserted into algorithms which approximate the distributions respective parameters
Select the next button to view the algorithms for a Uniform Dist ri but ion
Uniform Distribu tio n
bull Note There is Dll most likely value Uniform Distribution
I I ~ shyJ shy~ shy
)0 U 1S tJS UUS 12S tlaJS 1SlS IN )I tIO1 -~-------------4-bull b
I Pope 10 of 2S I Back Next
CLB024 Introduction to Cost Risk Analysis Lesson 5 - Cost as a Probability Distribution TOC I RESOURCES I PRINT I HELP
Uniform Algorithms
Uniform Distribution - Calculating mean and variance
where a bull min value (low) b = max value (high) 11 bull mean (average) and o bull variance There Is no mode Reason All y values are equivalent Frequency does not change
o2 Average (mean) cost = (low + hlgh)2 variance= ci = (high shy low) 2 12
ci bull 2ru 12
II bull (70 + 1801 2
ci - (180-70) 12
11 bull 125 ci - LQ12
ci bull 12110 12
o = 100833
I Pope 11 of 2S I Back Next
Long Description
Uniform Algorithms
Uniform Distribution - Calculating mean and standard deviation
where a = min value (low) b = max value (high) micro = mean and σ = sd There is no mode Reason All y values are equivalent Frequency does not change
micro σ 2
Average (mean) cost = (low + high)2 Variance = σ sup2 = (high - low) sup212
μ = (a + b) σ sup2 = (b - a) sup2 2 12
μ = (70 + 180) σ sup2 = (180 - 70) sup2 2 12
μ = 125 σ sup2 = (110) 2
12
σ 2 = 12110 12
σ 2 = 100833
CLB024 Introduction to Cost Risk Analysis Lesson 5 - Cost as a Probability Distribution TOC I RESOURCES I PRINT I HELP
Tr iangular Model
Triangular Distribu t ion
bull Represents wide range of possible distribution shapes
Selec t nextbull to view the algorithms for a Triangular Distribution
Triangle Distribution
b
I Pope 12 of 2S I Back Next
CLB024 Intro duction to Cost Risk Analysis
Lesson 5 - Cost as a Probability Distribution TOC I RESOURCES I PRINT I HELP
Tr iangular Algor i thms
Triangle Distribution - Calculating mean and variance
where a a m in value (cost) b = maximum value (cost) c = mode (most likely) (cost) 11 bull mean and a =Variance
0 2IJ Average (mean) cost = Variance = a
( low + most likely + high)3
11 = (atctb a bull Ca2tc2tb1-ab-ac-bcl 3 18
a= 2ZQQ 11 = (70 t 100 + 180 18
3 a= 53889
11 = 11667
I Pope 13 of 2S I Back Next
Long Description
Triangle Distribution - Calculating mean and variance
where a = min value (cost) b = maximum value (cost) c = mode (most likely cost) μ = mean and σ 2 = variance
μ σ 2
Average (mean) cost = (low + most likely + high) 3 Variance = σ sup2
μ = (a + c + b) σ sup2 = (a sup2 + c sup2 + b sup2 - ab - ac - bc) 3 18
μ = (70 + 180 + 100) σ sup2 = 9700 3 18
μ = 11667 σ 2 = 53888
CLB024 Introduction to Cost Risk Analysis Lesson 5 - Cost as a Probability Distribution TOC I RESOURCES I PRINT I HELP
Normal Model
Norm al Distribution
bull Also known as a Bell Curve
Select the next button to view the algorithms for a Normal Distribu tion
Normal Dist r ibution
10 bullJn JJS lllU IU b a
I Pope 14 of 2S I Back Next
CLB024 Introduction to Cost Risk Analysis Lesson 5 - Cost as a Probability Distribution TOC I RESOURCES I PRINT I HELP
Normal Algor ithms
Normal Distribution - Calculating mean and variance
~ 0 2 where c approximates the mean of the normal where a = min value ( low) distribution b = max value (high)
~ = mean (average) c = most likely value
Variance = a Average (mean ) ~ = c
~ = 125 a = (Jla)l 36
a= (180-70~ 36
a= ( 110 )l
36 a= 12100
36 a= 33611
I Pope 15 of 25 I Back Next
Long Description
Normal Distribution - Calculating mean and variance
μ
where c approximates the mean of the normal distribution (high)
c = most likely value
Average (mean) μ = c μ = 125
σ 2
where a = min value (low) b = max value
μ = mean (average)
Variance = σ2
σ 2 = (b - a)2
36
σ 2 = (180 - 70)2
36
σ 2 = (110)2
36
σ 2 = 12100 36
σ 2 = 33611
CLB024 Introduction to Cost Risk Analysis Lesson 5 - Cost as a Probability Distribution TOC I RESOURCES I PRINT I HELP
Beta Model
Bet a Distribu tion
bull Beta shapes are determined by a and 13 parameters - which are difficult to determine
bull Use low most likely and high estimates
Selec t the next button to view the algori thms for a Be ta Distribu tion
Beta Distribution
I Pope 18 of 2S I Back Next
CLB024 Introduction to Cost Risk Analysis Lesson 5 - Cost as a Probability Distribution TOC I RESOURCES I PRINT I HELP
Beta Algor ithms
Beta (Pert Distribution - Calculating mean and variance
where a min value (low) b max value (high) c most likely value 11 bull mean (average) and a variance
tl Average (mean) cost = Variance a 0
(low + 4(rnost II ely + hlgh)6 a c Lbal0 36
11 = (aplusmn4cplusmnb) a 0 (180-70)2 6 36
11 = (70 plusmn 4(1 00) plusmn 80) 6 a = UlU
36
a a 12100 36
II = 125 a c 33611
o c
Q
I Pope 17 of 2S I Back Next
Long Description
Calculating mean and standard deviation
where a = min value (cost) b = maximum value (cost) c = mode (most likely cost) μ = mean and σ sup2 = variance
micro Average (mean) cost = (low + 4(most likely) + high)6 micro = (a + 4c + b)
6 micro = (70 + 4(125) + 180)
6
micro = 750 6
micro = 125
σ2
Variance = σ2
σ2 = (b - a)2
36 σ2 = (180 - 70)2
36
σ2 = (110)2
36 σ2 = 12100
36 σ2 = 33611
CLB024 Introduction t o Cost Risk Analysis Lesson 5- Cost as a Probability Distribution TOC I RESO URCES I PRINT I HELP
Symmet ric Approxi mation
The second step in developing a to tal cost distribu tion is to combine all the iden ti fied risks and their associated ranges in to a single distribu tion One technique is Symmetric Approximatio n
Symmetric Approximation is also known as the Summatio n of Moments PDFs have four momen ts 1st shyMean 2nd - Variance 3rd - Coe ffic ien t o f Skewness (symmetry ) and 4 th - Coe ffic ien t o f Kurtosis (heigh t )
Data o f the Symmetric Approximation method is placed in a linear table o f calculations Work Breakdown Struc ture cost elemen ts are listed with their distribu tion type mean and variance The means and variances are summed ( the summation o f momen ts ) which describe an approximate normal distribu tion Probabili ty statemen ts can then be made concerning funding levels This procedure assumes that all summed elemen ts are independen t o f each o ther This will no t normally be the case and addit ional techniques must be used to de termine the impac t o f dependence among elemen ts This calculation is beyond the scope o f this module
Click here to view an example
~ I Page 18 of 25 I Back Next
Popup Text
Uncertainty Analysis by Symmetric Approximation Example
CLB024 Introduction to Cost Risk Analysis Lesson 5- Cost as a Probability Distribution TOC I RESOURCES I PRINT 1HELP
Monte Carlo Simulation
A distribution is de fined for each cost element from which a random sample is drawn The samples from each cost elements distribution are summed to a to tal cost This sampling and summing process is repeated many times (eg 1000- 10000 times) The result is a distribution representing the to tal cost o f the system with all described uncertainties taken into account The distribution can be displayed by a cumulative probabili ty distribution
Iterations in Monte Carlo Simulation
Rot~~
_ l4_-RbullU~ OA TCoot 12tu middot 182clamp bull sa-12 Ul
I $l4SU
12511t $4501t $562
Maiefllll bull~- - -+ I I I
1000 bull=o7----J
~
bull
-ld ~toe lL_ _ ampft 10
no~us Do~~W -~
~ I Pa ge 19 of 25 I Back Next
CLB024 Introduction to Cost Risk Analysis Lesson 5 - Cost as a Probability Distribution TOC I RESOURCES I PRINT I HELP
Knowledge Review
Which input would not affect cost
Award fees
Composition o f materials
System weight
~ None of the above
Any o f t he input s would affect cost
Muttlple Probability Distribution centol(
)______ ~
M~ L---~ --~-
L ----+00 _
tlllimoling Rotnliommipa
I Pope 20 of 2S I Back Next
CLB024 Introduction to Cost Risk Analysis Lesson 5- Cost as a Probability Distribution TOC I RESOURCES I PRINT 1HELP
Knowledge Review
A distribu t ion represen ting a systems to tal cost wi th uncer tain t ies inc luded is the sum o f many indiv idual cost elemen t distribu t ions
~ True Iterations in Monte Carlo Simulation _ --~_~
1bull111nbull $C bull Mlt10 middot- -bull --False rshybull=- middot u-middot~-middot 1 - middot~ - r-+ J
bull -shy- _ shy I - --~- bull bull bull bull bull bullmiddot~ --lA~ -
Check Answer
T he answer is True T his is the de fini t ion o f the to tal system cost distribu t ion
~ I Page 21 of 25 I Back Next
CLB024 Introduction to Cost Risk Analysis Lesson 5 - Cost as a Probability Distribution TOC I RESOURCES I PRINT I HELP
Know ledge Review
Each probability distribution has distinct characteristics Choose the correct match below and submit your answer
High and Low values are eguallv likely - Normal Distribution More accyrate when MTBF measurements are ysed - Uniform Distribution Wide range o f dis tribu tion shapes with potentjally large tails - Beta Distribu tion Parameters are difficult to determine use PERI approximation - Triangular Distribution
~ High and Low values are equally likely - Uniform Distribu tion More accyrate when MTBF measuremen ts are used - Normal Distribution Wide range of dis tribu tion shapes with potentjaly large tails - Triangular Distribution Parameters are difficult t o determine use PERT approximation - Beta Distribution
Check Answ er
The answer is High a nd Low values are equally likely - Uniform Dist ri but ion More accurat e when MTBF measurement s are used - Normal Dist ribut ion Wid e range o f d ist ri but ion s hapes wit h pot ent ially large t ails - Triangular Dist ribut ion and Param et e rs are difficult t o de t ermine use PERT a pproximat ion - Bet a Dist ri but ion
I Pope 22 of 2S I Back Next
CLB024 Introduction to Cost Risk Analysis Lesson 5 - Cost as a Probability Distribution TOC I RESOURCES I PRINT I HELP
Summary
To complete a Cost Risk Analysis
bull Identify a Probability Density Function for each uncertain element in the cost estimate
bull Combine the element uncertainties into a Total Cost PDF
There are two mathematical approaches
bull Symmetric Approximation (Summation o f Moments )
bull Monte Carlo Simulation
Uniform Distribution - High and Low values are equally likely
bull Used when there is no likelihood information
Triangular Distribu t ion - Includes all three parameters high low and most likely v alue
bull Tails can be heavy or fat
Normal Distribu ti on - Bell Curve
bull Symmetrical on both sides o f the mean
bull ReqLiires mean and standard deviation
I Pope 23 of 2S I Back Next
CLB024 Introduction t o Cost Risk Analysis Lesson 5- Cost as a Probability Distribution TOC I RESO URCES I PRINT I HELP
Summary Cont
Beta Dist rib ut io n - can take on many possible shapes
bull Requires a and ~
bull Assume PERT Beta use low most likely and high estimates
Table o f Algori thms for calculating means and variances for four distribu tions
Distribution Mean Variance
ll=(a + b) 02 =(b - al2 Uniform
2 12
ll = la+c+b) 02= a 2 + b2+ c2-ab - ac - be) Triangular 3 18
o 2 b - a)2
Normal ll = C 36
ll=a + 4c + b) o2 b - a)2 Beta
6 36 I
Q
~ I Page24of 25 I Back Next
Long Description
Table of Algorithms for each distribution shape
Distribution Uniform Mean μ = (a + b) 2 Variance σ2 = (b-a)2 12
Distribution Triangular Mean μ = (a + c + b) 3 Variance σ2 = (a2 + b2 + c2 - ab - ac - bc) 18
Distribution Normal Mean μ = c Variance σ2 = (b - a)2 36
Distribution Beta Mean μ = (a + 4c + b) 6 Variance σ2 = (b - a )2 36
CLB024 Introduction to Cost Risk Analysis Lesson 5 - Cost as a Probability Distribution TOC I RESOURCES I PRINT I HELP
Lesson Completion
You have comple ted the content for this lesson
To continue selec t ano ther lesson from the Table o f Con ten ts on the le ft
If you have closed or hidden the Table of Conten ts click the Show TOC button at the top in the Atlas navigation bar
I Poobull 25 of 25 I Back Next

CLB024 Introduction t o Cost Risk Analysis Lesson 5- Cost as a Probability Distribution TOC I RESO URCES I PRINT I HELP
PDF Shapes
Next s t e p choose the shape o f a dis tribution that the range o f values for a speci fic cos t element would follow
T his will be the Probabili ty Densi ty Func t ion (PDF) and i t represents the dis tribution o f a cos t elements po tential range o f values T here are four PDF shapes that are typically used to represent uncertain cos t elements
T hese four do no t represent all possible PDFs that could be used (e g the lognormal dis tribution is some times seen in cos t risk analysis)
~ I Page 5 of 25 I Back Next
CLB024 Introduction to Cost Risk Analysis Lesson 5 - Cost as a Probability Distribution TOC I RESOURCES I PRINT I HELP
Uniform Distribution
Characteristics
bull All outcomes between high and low are equally Un iform Distribut ion likely
bull Parameters are a ( the low value) and b ( the high value)
bull x coordinates represen t costs
bull y coordinates represen t the likelihood of occLwence
Applica t ion
bull Use when there is no information about the relative likelihood of possible outcomes across the range of possible v alues
I Pogeampof2S I Back Next
CLB024 Introduction to Cost Risk Analysis Lesson 5 - Cost as a Probability Distribution TOC I RESOURCES I PRINT I HELP
Tr iangular Distr ibution
Characteristics
bull Simple to apply Triangle Distribut ion
bull Parameters are the high (b) low (a) and most likely (c )
bull Can be o f any shape between end points with varying degrees o f variance and skewness (size o f the tails) (PDFs with more area in the distribution tails have more probabili ty o f outcomes further from the most likely value)
bull x coordinates represent costs tt661 bull y coordinates represent the likelihood of
c bbulloccurrence Application
bull For a wide range of cost elements and variables
bull Can be shaped to fit most any potential cost
I Poge7of2S I Back Next
CLB024 Introduction to Cost Risk Analysis Lesson 5 - Cost as a Probability Distribution TOC I RESOURCES I PRINT I HELP
Normal Distr ibution
Also known as a Bell Curve
Characteristics No rmal Dist ribution
bull Symmetrical - both sides o f the mean are identical
bull Must be used cautiously for costs because costs generally are not symmetric in nature
bull Parameters required are the mean and standard deviation ( these parameters will be calculated using the low high and most likely values)
bull x coordinates represent costs
bull y coordinates represent the likelihood of bbull
occurrence
Application
More accurate when measurement errors are used as such as the measurements of Mean Tjme Between Failures (MTBF l
I Poge8of 2S I Back Next
Popup Text
Mean Time Between Failures (MTBF)
The mean (average) time between failures of a system Calculations of MTBF assume that the system is fixed after each failure and returned to service immediately after each failure
CLB024 Introduction t o Cost Risk Analysis Lesson 5- Cost as a Probability Distribution TOC I RESO URCES I PRINT I HELP
Beta Distribution
Characterist ics
bull Most flexible o f the distribution shapes - i t can take many forms
bull Difficult to specify parameters a and ~
bull In prac tice assume PERT Beta
PERT (Program Evaluation and Review Technique) Be ta - uses low most likely and high estimates as parameters
Application
bull Wide range o f applications - most cost func tions can be described by PERT Be ta
bull We will use PERT Beta which is a func tion o f the low high and most likely estimates (L H ML) Example shapes o f the Beta distribution
~ I Page9 of25 I Back Next
CLB024 Introduction to Cost Risk Analysis Lesson 5 - Cost as a Probability Distribution TOC I RESOURCES I PRINT I HELP
Uniform Model
To dev elop a Total Cost Distribution using the Sy mmetric Approximation t ec hnique each element must
hav e the mean (JJ) and v ariance (o2) calculat ed The high low and most likely values are inserted into algorithms which approximate the distributions respective parameters
Select the next button to view the algorithms for a Uniform Dist ri but ion
Uniform Distribu tio n
bull Note There is Dll most likely value Uniform Distribution
I I ~ shyJ shy~ shy
)0 U 1S tJS UUS 12S tlaJS 1SlS IN )I tIO1 -~-------------4-bull b
I Pope 10 of 2S I Back Next
CLB024 Introduction to Cost Risk Analysis Lesson 5 - Cost as a Probability Distribution TOC I RESOURCES I PRINT I HELP
Uniform Algorithms
Uniform Distribution - Calculating mean and variance
where a bull min value (low) b = max value (high) 11 bull mean (average) and o bull variance There Is no mode Reason All y values are equivalent Frequency does not change
o2 Average (mean) cost = (low + hlgh)2 variance= ci = (high shy low) 2 12
ci bull 2ru 12
II bull (70 + 1801 2
ci - (180-70) 12
11 bull 125 ci - LQ12
ci bull 12110 12
o = 100833
I Pope 11 of 2S I Back Next
Long Description
Uniform Algorithms
Uniform Distribution - Calculating mean and standard deviation
where a = min value (low) b = max value (high) micro = mean and σ = sd There is no mode Reason All y values are equivalent Frequency does not change
micro σ 2
Average (mean) cost = (low + high)2 Variance = σ sup2 = (high - low) sup212
μ = (a + b) σ sup2 = (b - a) sup2 2 12
μ = (70 + 180) σ sup2 = (180 - 70) sup2 2 12
μ = 125 σ sup2 = (110) 2
12
σ 2 = 12110 12
σ 2 = 100833
CLB024 Introduction to Cost Risk Analysis Lesson 5 - Cost as a Probability Distribution TOC I RESOURCES I PRINT I HELP
Tr iangular Model
Triangular Distribu t ion
bull Represents wide range of possible distribution shapes
Selec t nextbull to view the algorithms for a Triangular Distribution
Triangle Distribution
b
I Pope 12 of 2S I Back Next
CLB024 Intro duction to Cost Risk Analysis
Lesson 5 - Cost as a Probability Distribution TOC I RESOURCES I PRINT I HELP
Tr iangular Algor i thms
Triangle Distribution - Calculating mean and variance
where a a m in value (cost) b = maximum value (cost) c = mode (most likely) (cost) 11 bull mean and a =Variance
0 2IJ Average (mean) cost = Variance = a
( low + most likely + high)3
11 = (atctb a bull Ca2tc2tb1-ab-ac-bcl 3 18
a= 2ZQQ 11 = (70 t 100 + 180 18
3 a= 53889
11 = 11667
I Pope 13 of 2S I Back Next
Long Description
Triangle Distribution - Calculating mean and variance
where a = min value (cost) b = maximum value (cost) c = mode (most likely cost) μ = mean and σ 2 = variance
μ σ 2
Average (mean) cost = (low + most likely + high) 3 Variance = σ sup2
μ = (a + c + b) σ sup2 = (a sup2 + c sup2 + b sup2 - ab - ac - bc) 3 18
μ = (70 + 180 + 100) σ sup2 = 9700 3 18
μ = 11667 σ 2 = 53888
CLB024 Introduction to Cost Risk Analysis Lesson 5 - Cost as a Probability Distribution TOC I RESOURCES I PRINT I HELP
Normal Model
Norm al Distribution
bull Also known as a Bell Curve
Select the next button to view the algorithms for a Normal Distribu tion
Normal Dist r ibution
10 bullJn JJS lllU IU b a
I Pope 14 of 2S I Back Next
CLB024 Introduction to Cost Risk Analysis Lesson 5 - Cost as a Probability Distribution TOC I RESOURCES I PRINT I HELP
Normal Algor ithms
Normal Distribution - Calculating mean and variance
~ 0 2 where c approximates the mean of the normal where a = min value ( low) distribution b = max value (high)
~ = mean (average) c = most likely value
Variance = a Average (mean ) ~ = c
~ = 125 a = (Jla)l 36
a= (180-70~ 36
a= ( 110 )l
36 a= 12100
36 a= 33611
I Pope 15 of 25 I Back Next
Long Description
Normal Distribution - Calculating mean and variance
μ
where c approximates the mean of the normal distribution (high)
c = most likely value
Average (mean) μ = c μ = 125
σ 2
where a = min value (low) b = max value
μ = mean (average)
Variance = σ2
σ 2 = (b - a)2
36
σ 2 = (180 - 70)2
36
σ 2 = (110)2
36
σ 2 = 12100 36
σ 2 = 33611
CLB024 Introduction to Cost Risk Analysis Lesson 5 - Cost as a Probability Distribution TOC I RESOURCES I PRINT I HELP
Beta Model
Bet a Distribu tion
bull Beta shapes are determined by a and 13 parameters - which are difficult to determine
bull Use low most likely and high estimates
Selec t the next button to view the algori thms for a Be ta Distribu tion
Beta Distribution
I Pope 18 of 2S I Back Next
CLB024 Introduction to Cost Risk Analysis Lesson 5 - Cost as a Probability Distribution TOC I RESOURCES I PRINT I HELP
Beta Algor ithms
Beta (Pert Distribution - Calculating mean and variance
where a min value (low) b max value (high) c most likely value 11 bull mean (average) and a variance
tl Average (mean) cost = Variance a 0
(low + 4(rnost II ely + hlgh)6 a c Lbal0 36
11 = (aplusmn4cplusmnb) a 0 (180-70)2 6 36
11 = (70 plusmn 4(1 00) plusmn 80) 6 a = UlU
36
a a 12100 36
II = 125 a c 33611
o c
Q
I Pope 17 of 2S I Back Next
Long Description
Calculating mean and standard deviation
where a = min value (cost) b = maximum value (cost) c = mode (most likely cost) μ = mean and σ sup2 = variance
micro Average (mean) cost = (low + 4(most likely) + high)6 micro = (a + 4c + b)
6 micro = (70 + 4(125) + 180)
6
micro = 750 6
micro = 125
σ2
Variance = σ2
σ2 = (b - a)2
36 σ2 = (180 - 70)2
36
σ2 = (110)2
36 σ2 = 12100
36 σ2 = 33611
CLB024 Introduction t o Cost Risk Analysis Lesson 5- Cost as a Probability Distribution TOC I RESO URCES I PRINT I HELP
Symmet ric Approxi mation
The second step in developing a to tal cost distribu tion is to combine all the iden ti fied risks and their associated ranges in to a single distribu tion One technique is Symmetric Approximatio n
Symmetric Approximation is also known as the Summatio n of Moments PDFs have four momen ts 1st shyMean 2nd - Variance 3rd - Coe ffic ien t o f Skewness (symmetry ) and 4 th - Coe ffic ien t o f Kurtosis (heigh t )
Data o f the Symmetric Approximation method is placed in a linear table o f calculations Work Breakdown Struc ture cost elemen ts are listed with their distribu tion type mean and variance The means and variances are summed ( the summation o f momen ts ) which describe an approximate normal distribu tion Probabili ty statemen ts can then be made concerning funding levels This procedure assumes that all summed elemen ts are independen t o f each o ther This will no t normally be the case and addit ional techniques must be used to de termine the impac t o f dependence among elemen ts This calculation is beyond the scope o f this module
Click here to view an example
~ I Page 18 of 25 I Back Next
Popup Text
Uncertainty Analysis by Symmetric Approximation Example
CLB024 Introduction to Cost Risk Analysis Lesson 5- Cost as a Probability Distribution TOC I RESOURCES I PRINT 1HELP
Monte Carlo Simulation
A distribution is de fined for each cost element from which a random sample is drawn The samples from each cost elements distribution are summed to a to tal cost This sampling and summing process is repeated many times (eg 1000- 10000 times) The result is a distribution representing the to tal cost o f the system with all described uncertainties taken into account The distribution can be displayed by a cumulative probabili ty distribution
Iterations in Monte Carlo Simulation
Rot~~
_ l4_-RbullU~ OA TCoot 12tu middot 182clamp bull sa-12 Ul
I $l4SU
12511t $4501t $562
Maiefllll bull~- - -+ I I I
1000 bull=o7----J
~
bull
-ld ~toe lL_ _ ampft 10
no~us Do~~W -~
~ I Pa ge 19 of 25 I Back Next
CLB024 Introduction to Cost Risk Analysis Lesson 5 - Cost as a Probability Distribution TOC I RESOURCES I PRINT I HELP
Knowledge Review
Which input would not affect cost
Award fees
Composition o f materials
System weight
~ None of the above
Any o f t he input s would affect cost
Muttlple Probability Distribution centol(
)______ ~
M~ L---~ --~-
L ----+00 _
tlllimoling Rotnliommipa
I Pope 20 of 2S I Back Next
CLB024 Introduction to Cost Risk Analysis Lesson 5- Cost as a Probability Distribution TOC I RESOURCES I PRINT 1HELP
Knowledge Review
A distribu t ion represen ting a systems to tal cost wi th uncer tain t ies inc luded is the sum o f many indiv idual cost elemen t distribu t ions
~ True Iterations in Monte Carlo Simulation _ --~_~
1bull111nbull $C bull Mlt10 middot- -bull --False rshybull=- middot u-middot~-middot 1 - middot~ - r-+ J
bull -shy- _ shy I - --~- bull bull bull bull bull bullmiddot~ --lA~ -
Check Answer
T he answer is True T his is the de fini t ion o f the to tal system cost distribu t ion
~ I Page 21 of 25 I Back Next
CLB024 Introduction to Cost Risk Analysis Lesson 5 - Cost as a Probability Distribution TOC I RESOURCES I PRINT I HELP
Know ledge Review
Each probability distribution has distinct characteristics Choose the correct match below and submit your answer
High and Low values are eguallv likely - Normal Distribution More accyrate when MTBF measurements are ysed - Uniform Distribution Wide range o f dis tribu tion shapes with potentjally large tails - Beta Distribu tion Parameters are difficult to determine use PERI approximation - Triangular Distribution
~ High and Low values are equally likely - Uniform Distribu tion More accyrate when MTBF measuremen ts are used - Normal Distribution Wide range of dis tribu tion shapes with potentjaly large tails - Triangular Distribution Parameters are difficult t o determine use PERT approximation - Beta Distribution
Check Answ er
The answer is High a nd Low values are equally likely - Uniform Dist ri but ion More accurat e when MTBF measurement s are used - Normal Dist ribut ion Wid e range o f d ist ri but ion s hapes wit h pot ent ially large t ails - Triangular Dist ribut ion and Param et e rs are difficult t o de t ermine use PERT a pproximat ion - Bet a Dist ri but ion
I Pope 22 of 2S I Back Next
CLB024 Introduction to Cost Risk Analysis Lesson 5 - Cost as a Probability Distribution TOC I RESOURCES I PRINT I HELP
Summary
To complete a Cost Risk Analysis
bull Identify a Probability Density Function for each uncertain element in the cost estimate
bull Combine the element uncertainties into a Total Cost PDF
There are two mathematical approaches
bull Symmetric Approximation (Summation o f Moments )
bull Monte Carlo Simulation
Uniform Distribution - High and Low values are equally likely
bull Used when there is no likelihood information
Triangular Distribu t ion - Includes all three parameters high low and most likely v alue
bull Tails can be heavy or fat
Normal Distribu ti on - Bell Curve
bull Symmetrical on both sides o f the mean
bull ReqLiires mean and standard deviation
I Pope 23 of 2S I Back Next
CLB024 Introduction t o Cost Risk Analysis Lesson 5- Cost as a Probability Distribution TOC I RESO URCES I PRINT I HELP
Summary Cont
Beta Dist rib ut io n - can take on many possible shapes
bull Requires a and ~
bull Assume PERT Beta use low most likely and high estimates
Table o f Algori thms for calculating means and variances for four distribu tions
Distribution Mean Variance
ll=(a + b) 02 =(b - al2 Uniform
2 12
ll = la+c+b) 02= a 2 + b2+ c2-ab - ac - be) Triangular 3 18
o 2 b - a)2
Normal ll = C 36
ll=a + 4c + b) o2 b - a)2 Beta
6 36 I
Q
~ I Page24of 25 I Back Next
Long Description
Table of Algorithms for each distribution shape
Distribution Uniform Mean μ = (a + b) 2 Variance σ2 = (b-a)2 12
Distribution Triangular Mean μ = (a + c + b) 3 Variance σ2 = (a2 + b2 + c2 - ab - ac - bc) 18
Distribution Normal Mean μ = c Variance σ2 = (b - a)2 36
Distribution Beta Mean μ = (a + 4c + b) 6 Variance σ2 = (b - a )2 36
CLB024 Introduction to Cost Risk Analysis Lesson 5 - Cost as a Probability Distribution TOC I RESOURCES I PRINT I HELP
Lesson Completion
You have comple ted the content for this lesson
To continue selec t ano ther lesson from the Table o f Con ten ts on the le ft
If you have closed or hidden the Table of Conten ts click the Show TOC button at the top in the Atlas navigation bar
I Poobull 25 of 25 I Back Next

CLB024 Introduction to Cost Risk Analysis Lesson 5 - Cost as a Probability Distribution TOC I RESOURCES I PRINT I HELP
Normal Distr ibution
Also known as a Bell Curve
Characteristics No rmal Dist ribution
bull Symmetrical - both sides o f the mean are identical
bull Must be used cautiously for costs because costs generally are not symmetric in nature
bull Parameters required are the mean and standard deviation ( these parameters will be calculated using the low high and most likely values)
bull x coordinates represent costs
bull y coordinates represent the likelihood of bbull
occurrence
Application
More accurate when measurement errors are used as such as the measurements of Mean Tjme Between Failures (MTBF l
I Poge8of 2S I Back Next
Popup Text
Mean Time Between Failures (MTBF)
The mean (average) time between failures of a system Calculations of MTBF assume that the system is fixed after each failure and returned to service immediately after each failure
CLB024 Introduction t o Cost Risk Analysis Lesson 5- Cost as a Probability Distribution TOC I RESO URCES I PRINT I HELP
Beta Distribution
Characterist ics
bull Most flexible o f the distribution shapes - i t can take many forms
bull Difficult to specify parameters a and ~
bull In prac tice assume PERT Beta
PERT (Program Evaluation and Review Technique) Be ta - uses low most likely and high estimates as parameters
Application
bull Wide range o f applications - most cost func tions can be described by PERT Be ta
bull We will use PERT Beta which is a func tion o f the low high and most likely estimates (L H ML) Example shapes o f the Beta distribution
~ I Page9 of25 I Back Next
CLB024 Introduction to Cost Risk Analysis Lesson 5 - Cost as a Probability Distribution TOC I RESOURCES I PRINT I HELP
Uniform Model
To dev elop a Total Cost Distribution using the Sy mmetric Approximation t ec hnique each element must
hav e the mean (JJ) and v ariance (o2) calculat ed The high low and most likely values are inserted into algorithms which approximate the distributions respective parameters
Select the next button to view the algorithms for a Uniform Dist ri but ion
Uniform Distribu tio n
bull Note There is Dll most likely value Uniform Distribution
I I ~ shyJ shy~ shy
)0 U 1S tJS UUS 12S tlaJS 1SlS IN )I tIO1 -~-------------4-bull b
I Pope 10 of 2S I Back Next
CLB024 Introduction to Cost Risk Analysis Lesson 5 - Cost as a Probability Distribution TOC I RESOURCES I PRINT I HELP
Uniform Algorithms
Uniform Distribution - Calculating mean and variance
where a bull min value (low) b = max value (high) 11 bull mean (average) and o bull variance There Is no mode Reason All y values are equivalent Frequency does not change
o2 Average (mean) cost = (low + hlgh)2 variance= ci = (high shy low) 2 12
ci bull 2ru 12
II bull (70 + 1801 2
ci - (180-70) 12
11 bull 125 ci - LQ12
ci bull 12110 12
o = 100833
I Pope 11 of 2S I Back Next
Long Description
Uniform Algorithms
Uniform Distribution - Calculating mean and standard deviation
where a = min value (low) b = max value (high) micro = mean and σ = sd There is no mode Reason All y values are equivalent Frequency does not change
micro σ 2
Average (mean) cost = (low + high)2 Variance = σ sup2 = (high - low) sup212
μ = (a + b) σ sup2 = (b - a) sup2 2 12
μ = (70 + 180) σ sup2 = (180 - 70) sup2 2 12
μ = 125 σ sup2 = (110) 2
12
σ 2 = 12110 12
σ 2 = 100833
CLB024 Introduction to Cost Risk Analysis Lesson 5 - Cost as a Probability Distribution TOC I RESOURCES I PRINT I HELP
Tr iangular Model
Triangular Distribu t ion
bull Represents wide range of possible distribution shapes
Selec t nextbull to view the algorithms for a Triangular Distribution
Triangle Distribution
b
I Pope 12 of 2S I Back Next
CLB024 Intro duction to Cost Risk Analysis
Lesson 5 - Cost as a Probability Distribution TOC I RESOURCES I PRINT I HELP
Tr iangular Algor i thms
Triangle Distribution - Calculating mean and variance
where a a m in value (cost) b = maximum value (cost) c = mode (most likely) (cost) 11 bull mean and a =Variance
0 2IJ Average (mean) cost = Variance = a
( low + most likely + high)3
11 = (atctb a bull Ca2tc2tb1-ab-ac-bcl 3 18
a= 2ZQQ 11 = (70 t 100 + 180 18
3 a= 53889
11 = 11667
I Pope 13 of 2S I Back Next
Long Description
Triangle Distribution - Calculating mean and variance
where a = min value (cost) b = maximum value (cost) c = mode (most likely cost) μ = mean and σ 2 = variance
μ σ 2
Average (mean) cost = (low + most likely + high) 3 Variance = σ sup2
μ = (a + c + b) σ sup2 = (a sup2 + c sup2 + b sup2 - ab - ac - bc) 3 18
μ = (70 + 180 + 100) σ sup2 = 9700 3 18
μ = 11667 σ 2 = 53888
CLB024 Introduction to Cost Risk Analysis Lesson 5 - Cost as a Probability Distribution TOC I RESOURCES I PRINT I HELP
Normal Model
Norm al Distribution
bull Also known as a Bell Curve
Select the next button to view the algorithms for a Normal Distribu tion
Normal Dist r ibution
10 bullJn JJS lllU IU b a
I Pope 14 of 2S I Back Next
CLB024 Introduction to Cost Risk Analysis Lesson 5 - Cost as a Probability Distribution TOC I RESOURCES I PRINT I HELP
Normal Algor ithms
Normal Distribution - Calculating mean and variance
~ 0 2 where c approximates the mean of the normal where a = min value ( low) distribution b = max value (high)
~ = mean (average) c = most likely value
Variance = a Average (mean ) ~ = c
~ = 125 a = (Jla)l 36
a= (180-70~ 36
a= ( 110 )l
36 a= 12100
36 a= 33611
I Pope 15 of 25 I Back Next
Long Description
Normal Distribution - Calculating mean and variance
μ
where c approximates the mean of the normal distribution (high)
c = most likely value
Average (mean) μ = c μ = 125
σ 2
where a = min value (low) b = max value
μ = mean (average)
Variance = σ2
σ 2 = (b - a)2
36
σ 2 = (180 - 70)2
36
σ 2 = (110)2
36
σ 2 = 12100 36
σ 2 = 33611
CLB024 Introduction to Cost Risk Analysis Lesson 5 - Cost as a Probability Distribution TOC I RESOURCES I PRINT I HELP
Beta Model
Bet a Distribu tion
bull Beta shapes are determined by a and 13 parameters - which are difficult to determine
bull Use low most likely and high estimates
Selec t the next button to view the algori thms for a Be ta Distribu tion
Beta Distribution
I Pope 18 of 2S I Back Next
CLB024 Introduction to Cost Risk Analysis Lesson 5 - Cost as a Probability Distribution TOC I RESOURCES I PRINT I HELP
Beta Algor ithms
Beta (Pert Distribution - Calculating mean and variance
where a min value (low) b max value (high) c most likely value 11 bull mean (average) and a variance
tl Average (mean) cost = Variance a 0
(low + 4(rnost II ely + hlgh)6 a c Lbal0 36
11 = (aplusmn4cplusmnb) a 0 (180-70)2 6 36
11 = (70 plusmn 4(1 00) plusmn 80) 6 a = UlU
36
a a 12100 36
II = 125 a c 33611
o c
Q
I Pope 17 of 2S I Back Next
Long Description
Calculating mean and standard deviation
where a = min value (cost) b = maximum value (cost) c = mode (most likely cost) μ = mean and σ sup2 = variance
micro Average (mean) cost = (low + 4(most likely) + high)6 micro = (a + 4c + b)
6 micro = (70 + 4(125) + 180)
6
micro = 750 6
micro = 125
σ2
Variance = σ2
σ2 = (b - a)2
36 σ2 = (180 - 70)2
36
σ2 = (110)2
36 σ2 = 12100
36 σ2 = 33611
CLB024 Introduction t o Cost Risk Analysis Lesson 5- Cost as a Probability Distribution TOC I RESO URCES I PRINT I HELP
Symmet ric Approxi mation
The second step in developing a to tal cost distribu tion is to combine all the iden ti fied risks and their associated ranges in to a single distribu tion One technique is Symmetric Approximatio n
Symmetric Approximation is also known as the Summatio n of Moments PDFs have four momen ts 1st shyMean 2nd - Variance 3rd - Coe ffic ien t o f Skewness (symmetry ) and 4 th - Coe ffic ien t o f Kurtosis (heigh t )
Data o f the Symmetric Approximation method is placed in a linear table o f calculations Work Breakdown Struc ture cost elemen ts are listed with their distribu tion type mean and variance The means and variances are summed ( the summation o f momen ts ) which describe an approximate normal distribu tion Probabili ty statemen ts can then be made concerning funding levels This procedure assumes that all summed elemen ts are independen t o f each o ther This will no t normally be the case and addit ional techniques must be used to de termine the impac t o f dependence among elemen ts This calculation is beyond the scope o f this module
Click here to view an example
~ I Page 18 of 25 I Back Next
Popup Text
Uncertainty Analysis by Symmetric Approximation Example
CLB024 Introduction to Cost Risk Analysis Lesson 5- Cost as a Probability Distribution TOC I RESOURCES I PRINT 1HELP
Monte Carlo Simulation
A distribution is de fined for each cost element from which a random sample is drawn The samples from each cost elements distribution are summed to a to tal cost This sampling and summing process is repeated many times (eg 1000- 10000 times) The result is a distribution representing the to tal cost o f the system with all described uncertainties taken into account The distribution can be displayed by a cumulative probabili ty distribution
Iterations in Monte Carlo Simulation
Rot~~
_ l4_-RbullU~ OA TCoot 12tu middot 182clamp bull sa-12 Ul
I $l4SU
12511t $4501t $562
Maiefllll bull~- - -+ I I I
1000 bull=o7----J
~
bull
-ld ~toe lL_ _ ampft 10
no~us Do~~W -~
~ I Pa ge 19 of 25 I Back Next
CLB024 Introduction to Cost Risk Analysis Lesson 5 - Cost as a Probability Distribution TOC I RESOURCES I PRINT I HELP
Knowledge Review
Which input would not affect cost
Award fees
Composition o f materials
System weight
~ None of the above
Any o f t he input s would affect cost
Muttlple Probability Distribution centol(
)______ ~
M~ L---~ --~-
L ----+00 _
tlllimoling Rotnliommipa
I Pope 20 of 2S I Back Next
CLB024 Introduction to Cost Risk Analysis Lesson 5- Cost as a Probability Distribution TOC I RESOURCES I PRINT 1HELP
Knowledge Review
A distribu t ion represen ting a systems to tal cost wi th uncer tain t ies inc luded is the sum o f many indiv idual cost elemen t distribu t ions
~ True Iterations in Monte Carlo Simulation _ --~_~
1bull111nbull $C bull Mlt10 middot- -bull --False rshybull=- middot u-middot~-middot 1 - middot~ - r-+ J
bull -shy- _ shy I - --~- bull bull bull bull bull bullmiddot~ --lA~ -
Check Answer
T he answer is True T his is the de fini t ion o f the to tal system cost distribu t ion
~ I Page 21 of 25 I Back Next
CLB024 Introduction to Cost Risk Analysis Lesson 5 - Cost as a Probability Distribution TOC I RESOURCES I PRINT I HELP
Know ledge Review
Each probability distribution has distinct characteristics Choose the correct match below and submit your answer
High and Low values are eguallv likely - Normal Distribution More accyrate when MTBF measurements are ysed - Uniform Distribution Wide range o f dis tribu tion shapes with potentjally large tails - Beta Distribu tion Parameters are difficult to determine use PERI approximation - Triangular Distribution
~ High and Low values are equally likely - Uniform Distribu tion More accyrate when MTBF measuremen ts are used - Normal Distribution Wide range of dis tribu tion shapes with potentjaly large tails - Triangular Distribution Parameters are difficult t o determine use PERT approximation - Beta Distribution
Check Answ er
The answer is High a nd Low values are equally likely - Uniform Dist ri but ion More accurat e when MTBF measurement s are used - Normal Dist ribut ion Wid e range o f d ist ri but ion s hapes wit h pot ent ially large t ails - Triangular Dist ribut ion and Param et e rs are difficult t o de t ermine use PERT a pproximat ion - Bet a Dist ri but ion
I Pope 22 of 2S I Back Next
CLB024 Introduction to Cost Risk Analysis Lesson 5 - Cost as a Probability Distribution TOC I RESOURCES I PRINT I HELP
Summary
To complete a Cost Risk Analysis
bull Identify a Probability Density Function for each uncertain element in the cost estimate
bull Combine the element uncertainties into a Total Cost PDF
There are two mathematical approaches
bull Symmetric Approximation (Summation o f Moments )
bull Monte Carlo Simulation
Uniform Distribution - High and Low values are equally likely
bull Used when there is no likelihood information
Triangular Distribu t ion - Includes all three parameters high low and most likely v alue
bull Tails can be heavy or fat
Normal Distribu ti on - Bell Curve
bull Symmetrical on both sides o f the mean
bull ReqLiires mean and standard deviation
I Pope 23 of 2S I Back Next
CLB024 Introduction t o Cost Risk Analysis Lesson 5- Cost as a Probability Distribution TOC I RESO URCES I PRINT I HELP
Summary Cont
Beta Dist rib ut io n - can take on many possible shapes
bull Requires a and ~
bull Assume PERT Beta use low most likely and high estimates
Table o f Algori thms for calculating means and variances for four distribu tions
Distribution Mean Variance
ll=(a + b) 02 =(b - al2 Uniform
2 12
ll = la+c+b) 02= a 2 + b2+ c2-ab - ac - be) Triangular 3 18
o 2 b - a)2
Normal ll = C 36
ll=a + 4c + b) o2 b - a)2 Beta
6 36 I
Q
~ I Page24of 25 I Back Next
Long Description
Table of Algorithms for each distribution shape
Distribution Uniform Mean μ = (a + b) 2 Variance σ2 = (b-a)2 12
Distribution Triangular Mean μ = (a + c + b) 3 Variance σ2 = (a2 + b2 + c2 - ab - ac - bc) 18
Distribution Normal Mean μ = c Variance σ2 = (b - a)2 36
Distribution Beta Mean μ = (a + 4c + b) 6 Variance σ2 = (b - a )2 36
CLB024 Introduction to Cost Risk Analysis Lesson 5 - Cost as a Probability Distribution TOC I RESOURCES I PRINT I HELP
Lesson Completion
You have comple ted the content for this lesson
To continue selec t ano ther lesson from the Table o f Con ten ts on the le ft
If you have closed or hidden the Table of Conten ts click the Show TOC button at the top in the Atlas navigation bar
I Poobull 25 of 25 I Back Next

Popup Text
Mean Time Between Failures (MTBF)
The mean (average) time between failures of a system Calculations of MTBF assume that the system is fixed after each failure and returned to service immediately after each failure
CLB024 Introduction t o Cost Risk Analysis Lesson 5- Cost as a Probability Distribution TOC I RESO URCES I PRINT I HELP
Beta Distribution
Characterist ics
bull Most flexible o f the distribution shapes - i t can take many forms
bull Difficult to specify parameters a and ~
bull In prac tice assume PERT Beta
PERT (Program Evaluation and Review Technique) Be ta - uses low most likely and high estimates as parameters
Application
bull Wide range o f applications - most cost func tions can be described by PERT Be ta
bull We will use PERT Beta which is a func tion o f the low high and most likely estimates (L H ML) Example shapes o f the Beta distribution
~ I Page9 of25 I Back Next
CLB024 Introduction to Cost Risk Analysis Lesson 5 - Cost as a Probability Distribution TOC I RESOURCES I PRINT I HELP
Uniform Model
To dev elop a Total Cost Distribution using the Sy mmetric Approximation t ec hnique each element must
hav e the mean (JJ) and v ariance (o2) calculat ed The high low and most likely values are inserted into algorithms which approximate the distributions respective parameters
Select the next button to view the algorithms for a Uniform Dist ri but ion
Uniform Distribu tio n
bull Note There is Dll most likely value Uniform Distribution
I I ~ shyJ shy~ shy
)0 U 1S tJS UUS 12S tlaJS 1SlS IN )I tIO1 -~-------------4-bull b
I Pope 10 of 2S I Back Next
CLB024 Introduction to Cost Risk Analysis Lesson 5 - Cost as a Probability Distribution TOC I RESOURCES I PRINT I HELP
Uniform Algorithms
Uniform Distribution - Calculating mean and variance
where a bull min value (low) b = max value (high) 11 bull mean (average) and o bull variance There Is no mode Reason All y values are equivalent Frequency does not change
o2 Average (mean) cost = (low + hlgh)2 variance= ci = (high shy low) 2 12
ci bull 2ru 12
II bull (70 + 1801 2
ci - (180-70) 12
11 bull 125 ci - LQ12
ci bull 12110 12
o = 100833
I Pope 11 of 2S I Back Next
Long Description
Uniform Algorithms
Uniform Distribution - Calculating mean and standard deviation
where a = min value (low) b = max value (high) micro = mean and σ = sd There is no mode Reason All y values are equivalent Frequency does not change
micro σ 2
Average (mean) cost = (low + high)2 Variance = σ sup2 = (high - low) sup212
μ = (a + b) σ sup2 = (b - a) sup2 2 12
μ = (70 + 180) σ sup2 = (180 - 70) sup2 2 12
μ = 125 σ sup2 = (110) 2
12
σ 2 = 12110 12
σ 2 = 100833
CLB024 Introduction to Cost Risk Analysis Lesson 5 - Cost as a Probability Distribution TOC I RESOURCES I PRINT I HELP
Tr iangular Model
Triangular Distribu t ion
bull Represents wide range of possible distribution shapes
Selec t nextbull to view the algorithms for a Triangular Distribution
Triangle Distribution
b
I Pope 12 of 2S I Back Next
CLB024 Intro duction to Cost Risk Analysis
Lesson 5 - Cost as a Probability Distribution TOC I RESOURCES I PRINT I HELP
Tr iangular Algor i thms
Triangle Distribution - Calculating mean and variance
where a a m in value (cost) b = maximum value (cost) c = mode (most likely) (cost) 11 bull mean and a =Variance
0 2IJ Average (mean) cost = Variance = a
( low + most likely + high)3
11 = (atctb a bull Ca2tc2tb1-ab-ac-bcl 3 18
a= 2ZQQ 11 = (70 t 100 + 180 18
3 a= 53889
11 = 11667
I Pope 13 of 2S I Back Next
Long Description
Triangle Distribution - Calculating mean and variance
where a = min value (cost) b = maximum value (cost) c = mode (most likely cost) μ = mean and σ 2 = variance
μ σ 2
Average (mean) cost = (low + most likely + high) 3 Variance = σ sup2
μ = (a + c + b) σ sup2 = (a sup2 + c sup2 + b sup2 - ab - ac - bc) 3 18
μ = (70 + 180 + 100) σ sup2 = 9700 3 18
μ = 11667 σ 2 = 53888
CLB024 Introduction to Cost Risk Analysis Lesson 5 - Cost as a Probability Distribution TOC I RESOURCES I PRINT I HELP
Normal Model
Norm al Distribution
bull Also known as a Bell Curve
Select the next button to view the algorithms for a Normal Distribu tion
Normal Dist r ibution
10 bullJn JJS lllU IU b a
I Pope 14 of 2S I Back Next
CLB024 Introduction to Cost Risk Analysis Lesson 5 - Cost as a Probability Distribution TOC I RESOURCES I PRINT I HELP
Normal Algor ithms
Normal Distribution - Calculating mean and variance
~ 0 2 where c approximates the mean of the normal where a = min value ( low) distribution b = max value (high)
~ = mean (average) c = most likely value
Variance = a Average (mean ) ~ = c
~ = 125 a = (Jla)l 36
a= (180-70~ 36
a= ( 110 )l
36 a= 12100
36 a= 33611
I Pope 15 of 25 I Back Next
Long Description
Normal Distribution - Calculating mean and variance
μ
where c approximates the mean of the normal distribution (high)
c = most likely value
Average (mean) μ = c μ = 125
σ 2
where a = min value (low) b = max value
μ = mean (average)
Variance = σ2
σ 2 = (b - a)2
36
σ 2 = (180 - 70)2
36
σ 2 = (110)2
36
σ 2 = 12100 36
σ 2 = 33611
CLB024 Introduction to Cost Risk Analysis Lesson 5 - Cost as a Probability Distribution TOC I RESOURCES I PRINT I HELP
Beta Model
Bet a Distribu tion
bull Beta shapes are determined by a and 13 parameters - which are difficult to determine
bull Use low most likely and high estimates
Selec t the next button to view the algori thms for a Be ta Distribu tion
Beta Distribution
I Pope 18 of 2S I Back Next
CLB024 Introduction to Cost Risk Analysis Lesson 5 - Cost as a Probability Distribution TOC I RESOURCES I PRINT I HELP
Beta Algor ithms
Beta (Pert Distribution - Calculating mean and variance
where a min value (low) b max value (high) c most likely value 11 bull mean (average) and a variance
tl Average (mean) cost = Variance a 0
(low + 4(rnost II ely + hlgh)6 a c Lbal0 36
11 = (aplusmn4cplusmnb) a 0 (180-70)2 6 36
11 = (70 plusmn 4(1 00) plusmn 80) 6 a = UlU
36
a a 12100 36
II = 125 a c 33611
o c
Q
I Pope 17 of 2S I Back Next
Long Description
Calculating mean and standard deviation
where a = min value (cost) b = maximum value (cost) c = mode (most likely cost) μ = mean and σ sup2 = variance
micro Average (mean) cost = (low + 4(most likely) + high)6 micro = (a + 4c + b)
6 micro = (70 + 4(125) + 180)
6
micro = 750 6
micro = 125
σ2
Variance = σ2
σ2 = (b - a)2
36 σ2 = (180 - 70)2
36
σ2 = (110)2
36 σ2 = 12100
36 σ2 = 33611
CLB024 Introduction t o Cost Risk Analysis Lesson 5- Cost as a Probability Distribution TOC I RESO URCES I PRINT I HELP
Symmet ric Approxi mation
The second step in developing a to tal cost distribu tion is to combine all the iden ti fied risks and their associated ranges in to a single distribu tion One technique is Symmetric Approximatio n
Symmetric Approximation is also known as the Summatio n of Moments PDFs have four momen ts 1st shyMean 2nd - Variance 3rd - Coe ffic ien t o f Skewness (symmetry ) and 4 th - Coe ffic ien t o f Kurtosis (heigh t )
Data o f the Symmetric Approximation method is placed in a linear table o f calculations Work Breakdown Struc ture cost elemen ts are listed with their distribu tion type mean and variance The means and variances are summed ( the summation o f momen ts ) which describe an approximate normal distribu tion Probabili ty statemen ts can then be made concerning funding levels This procedure assumes that all summed elemen ts are independen t o f each o ther This will no t normally be the case and addit ional techniques must be used to de termine the impac t o f dependence among elemen ts This calculation is beyond the scope o f this module
Click here to view an example
~ I Page 18 of 25 I Back Next
Popup Text
Uncertainty Analysis by Symmetric Approximation Example
CLB024 Introduction to Cost Risk Analysis Lesson 5- Cost as a Probability Distribution TOC I RESOURCES I PRINT 1HELP
Monte Carlo Simulation
A distribution is de fined for each cost element from which a random sample is drawn The samples from each cost elements distribution are summed to a to tal cost This sampling and summing process is repeated many times (eg 1000- 10000 times) The result is a distribution representing the to tal cost o f the system with all described uncertainties taken into account The distribution can be displayed by a cumulative probabili ty distribution
Iterations in Monte Carlo Simulation
Rot~~
_ l4_-RbullU~ OA TCoot 12tu middot 182clamp bull sa-12 Ul
I $l4SU
12511t $4501t $562
Maiefllll bull~- - -+ I I I
1000 bull=o7----J
~
bull
-ld ~toe lL_ _ ampft 10
no~us Do~~W -~
~ I Pa ge 19 of 25 I Back Next
CLB024 Introduction to Cost Risk Analysis Lesson 5 - Cost as a Probability Distribution TOC I RESOURCES I PRINT I HELP
Knowledge Review
Which input would not affect cost
Award fees
Composition o f materials
System weight
~ None of the above
Any o f t he input s would affect cost
Muttlple Probability Distribution centol(
)______ ~
M~ L---~ --~-
L ----+00 _
tlllimoling Rotnliommipa
I Pope 20 of 2S I Back Next
CLB024 Introduction to Cost Risk Analysis Lesson 5- Cost as a Probability Distribution TOC I RESOURCES I PRINT 1HELP
Knowledge Review
A distribu t ion represen ting a systems to tal cost wi th uncer tain t ies inc luded is the sum o f many indiv idual cost elemen t distribu t ions
~ True Iterations in Monte Carlo Simulation _ --~_~
1bull111nbull $C bull Mlt10 middot- -bull --False rshybull=- middot u-middot~-middot 1 - middot~ - r-+ J
bull -shy- _ shy I - --~- bull bull bull bull bull bullmiddot~ --lA~ -
Check Answer
T he answer is True T his is the de fini t ion o f the to tal system cost distribu t ion
~ I Page 21 of 25 I Back Next
CLB024 Introduction to Cost Risk Analysis Lesson 5 - Cost as a Probability Distribution TOC I RESOURCES I PRINT I HELP
Know ledge Review
Each probability distribution has distinct characteristics Choose the correct match below and submit your answer
High and Low values are eguallv likely - Normal Distribution More accyrate when MTBF measurements are ysed - Uniform Distribution Wide range o f dis tribu tion shapes with potentjally large tails - Beta Distribu tion Parameters are difficult to determine use PERI approximation - Triangular Distribution
~ High and Low values are equally likely - Uniform Distribu tion More accyrate when MTBF measuremen ts are used - Normal Distribution Wide range of dis tribu tion shapes with potentjaly large tails - Triangular Distribution Parameters are difficult t o determine use PERT approximation - Beta Distribution
Check Answ er
The answer is High a nd Low values are equally likely - Uniform Dist ri but ion More accurat e when MTBF measurement s are used - Normal Dist ribut ion Wid e range o f d ist ri but ion s hapes wit h pot ent ially large t ails - Triangular Dist ribut ion and Param et e rs are difficult t o de t ermine use PERT a pproximat ion - Bet a Dist ri but ion
I Pope 22 of 2S I Back Next
CLB024 Introduction to Cost Risk Analysis Lesson 5 - Cost as a Probability Distribution TOC I RESOURCES I PRINT I HELP
Summary
To complete a Cost Risk Analysis
bull Identify a Probability Density Function for each uncertain element in the cost estimate
bull Combine the element uncertainties into a Total Cost PDF
There are two mathematical approaches
bull Symmetric Approximation (Summation o f Moments )
bull Monte Carlo Simulation
Uniform Distribution - High and Low values are equally likely
bull Used when there is no likelihood information
Triangular Distribu t ion - Includes all three parameters high low and most likely v alue
bull Tails can be heavy or fat
Normal Distribu ti on - Bell Curve
bull Symmetrical on both sides o f the mean
bull ReqLiires mean and standard deviation
I Pope 23 of 2S I Back Next
CLB024 Introduction t o Cost Risk Analysis Lesson 5- Cost as a Probability Distribution TOC I RESO URCES I PRINT I HELP
Summary Cont
Beta Dist rib ut io n - can take on many possible shapes
bull Requires a and ~
bull Assume PERT Beta use low most likely and high estimates
Table o f Algori thms for calculating means and variances for four distribu tions
Distribution Mean Variance
ll=(a + b) 02 =(b - al2 Uniform
2 12
ll = la+c+b) 02= a 2 + b2+ c2-ab - ac - be) Triangular 3 18
o 2 b - a)2
Normal ll = C 36
ll=a + 4c + b) o2 b - a)2 Beta
6 36 I
Q
~ I Page24of 25 I Back Next
Long Description
Table of Algorithms for each distribution shape
Distribution Uniform Mean μ = (a + b) 2 Variance σ2 = (b-a)2 12
Distribution Triangular Mean μ = (a + c + b) 3 Variance σ2 = (a2 + b2 + c2 - ab - ac - bc) 18
Distribution Normal Mean μ = c Variance σ2 = (b - a)2 36
Distribution Beta Mean μ = (a + 4c + b) 6 Variance σ2 = (b - a )2 36
CLB024 Introduction to Cost Risk Analysis Lesson 5 - Cost as a Probability Distribution TOC I RESOURCES I PRINT I HELP
Lesson Completion
You have comple ted the content for this lesson
To continue selec t ano ther lesson from the Table o f Con ten ts on the le ft
If you have closed or hidden the Table of Conten ts click the Show TOC button at the top in the Atlas navigation bar
I Poobull 25 of 25 I Back Next

CLB024 Introduction t o Cost Risk Analysis Lesson 5- Cost as a Probability Distribution TOC I RESO URCES I PRINT I HELP
Beta Distribution
Characterist ics
bull Most flexible o f the distribution shapes - i t can take many forms
bull Difficult to specify parameters a and ~
bull In prac tice assume PERT Beta
PERT (Program Evaluation and Review Technique) Be ta - uses low most likely and high estimates as parameters
Application
bull Wide range o f applications - most cost func tions can be described by PERT Be ta
bull We will use PERT Beta which is a func tion o f the low high and most likely estimates (L H ML) Example shapes o f the Beta distribution
~ I Page9 of25 I Back Next
CLB024 Introduction to Cost Risk Analysis Lesson 5 - Cost as a Probability Distribution TOC I RESOURCES I PRINT I HELP
Uniform Model
To dev elop a Total Cost Distribution using the Sy mmetric Approximation t ec hnique each element must
hav e the mean (JJ) and v ariance (o2) calculat ed The high low and most likely values are inserted into algorithms which approximate the distributions respective parameters
Select the next button to view the algorithms for a Uniform Dist ri but ion
Uniform Distribu tio n
bull Note There is Dll most likely value Uniform Distribution
I I ~ shyJ shy~ shy
)0 U 1S tJS UUS 12S tlaJS 1SlS IN )I tIO1 -~-------------4-bull b
I Pope 10 of 2S I Back Next
CLB024 Introduction to Cost Risk Analysis Lesson 5 - Cost as a Probability Distribution TOC I RESOURCES I PRINT I HELP
Uniform Algorithms
Uniform Distribution - Calculating mean and variance
where a bull min value (low) b = max value (high) 11 bull mean (average) and o bull variance There Is no mode Reason All y values are equivalent Frequency does not change
o2 Average (mean) cost = (low + hlgh)2 variance= ci = (high shy low) 2 12
ci bull 2ru 12
II bull (70 + 1801 2
ci - (180-70) 12
11 bull 125 ci - LQ12
ci bull 12110 12
o = 100833
I Pope 11 of 2S I Back Next
Long Description
Uniform Algorithms
Uniform Distribution - Calculating mean and standard deviation
where a = min value (low) b = max value (high) micro = mean and σ = sd There is no mode Reason All y values are equivalent Frequency does not change
micro σ 2
Average (mean) cost = (low + high)2 Variance = σ sup2 = (high - low) sup212
μ = (a + b) σ sup2 = (b - a) sup2 2 12
μ = (70 + 180) σ sup2 = (180 - 70) sup2 2 12
μ = 125 σ sup2 = (110) 2
12
σ 2 = 12110 12
σ 2 = 100833
CLB024 Introduction to Cost Risk Analysis Lesson 5 - Cost as a Probability Distribution TOC I RESOURCES I PRINT I HELP
Tr iangular Model
Triangular Distribu t ion
bull Represents wide range of possible distribution shapes
Selec t nextbull to view the algorithms for a Triangular Distribution
Triangle Distribution
b
I Pope 12 of 2S I Back Next
CLB024 Intro duction to Cost Risk Analysis
Lesson 5 - Cost as a Probability Distribution TOC I RESOURCES I PRINT I HELP
Tr iangular Algor i thms
Triangle Distribution - Calculating mean and variance
where a a m in value (cost) b = maximum value (cost) c = mode (most likely) (cost) 11 bull mean and a =Variance
0 2IJ Average (mean) cost = Variance = a
( low + most likely + high)3
11 = (atctb a bull Ca2tc2tb1-ab-ac-bcl 3 18
a= 2ZQQ 11 = (70 t 100 + 180 18
3 a= 53889
11 = 11667
I Pope 13 of 2S I Back Next
Long Description
Triangle Distribution - Calculating mean and variance
where a = min value (cost) b = maximum value (cost) c = mode (most likely cost) μ = mean and σ 2 = variance
μ σ 2
Average (mean) cost = (low + most likely + high) 3 Variance = σ sup2
μ = (a + c + b) σ sup2 = (a sup2 + c sup2 + b sup2 - ab - ac - bc) 3 18
μ = (70 + 180 + 100) σ sup2 = 9700 3 18
μ = 11667 σ 2 = 53888
CLB024 Introduction to Cost Risk Analysis Lesson 5 - Cost as a Probability Distribution TOC I RESOURCES I PRINT I HELP
Normal Model
Norm al Distribution
bull Also known as a Bell Curve
Select the next button to view the algorithms for a Normal Distribu tion
Normal Dist r ibution
10 bullJn JJS lllU IU b a
I Pope 14 of 2S I Back Next
CLB024 Introduction to Cost Risk Analysis Lesson 5 - Cost as a Probability Distribution TOC I RESOURCES I PRINT I HELP
Normal Algor ithms
Normal Distribution - Calculating mean and variance
~ 0 2 where c approximates the mean of the normal where a = min value ( low) distribution b = max value (high)
~ = mean (average) c = most likely value
Variance = a Average (mean ) ~ = c
~ = 125 a = (Jla)l 36
a= (180-70~ 36
a= ( 110 )l
36 a= 12100
36 a= 33611
I Pope 15 of 25 I Back Next
Long Description
Normal Distribution - Calculating mean and variance
μ
where c approximates the mean of the normal distribution (high)
c = most likely value
Average (mean) μ = c μ = 125
σ 2
where a = min value (low) b = max value
μ = mean (average)
Variance = σ2
σ 2 = (b - a)2
36
σ 2 = (180 - 70)2
36
σ 2 = (110)2
36
σ 2 = 12100 36
σ 2 = 33611
CLB024 Introduction to Cost Risk Analysis Lesson 5 - Cost as a Probability Distribution TOC I RESOURCES I PRINT I HELP
Beta Model
Bet a Distribu tion
bull Beta shapes are determined by a and 13 parameters - which are difficult to determine
bull Use low most likely and high estimates
Selec t the next button to view the algori thms for a Be ta Distribu tion
Beta Distribution
I Pope 18 of 2S I Back Next
CLB024 Introduction to Cost Risk Analysis Lesson 5 - Cost as a Probability Distribution TOC I RESOURCES I PRINT I HELP
Beta Algor ithms
Beta (Pert Distribution - Calculating mean and variance
where a min value (low) b max value (high) c most likely value 11 bull mean (average) and a variance
tl Average (mean) cost = Variance a 0
(low + 4(rnost II ely + hlgh)6 a c Lbal0 36
11 = (aplusmn4cplusmnb) a 0 (180-70)2 6 36
11 = (70 plusmn 4(1 00) plusmn 80) 6 a = UlU
36
a a 12100 36
II = 125 a c 33611
o c
Q
I Pope 17 of 2S I Back Next
Long Description
Calculating mean and standard deviation
where a = min value (cost) b = maximum value (cost) c = mode (most likely cost) μ = mean and σ sup2 = variance
micro Average (mean) cost = (low + 4(most likely) + high)6 micro = (a + 4c + b)
6 micro = (70 + 4(125) + 180)
6
micro = 750 6
micro = 125
σ2
Variance = σ2
σ2 = (b - a)2
36 σ2 = (180 - 70)2
36
σ2 = (110)2
36 σ2 = 12100
36 σ2 = 33611
CLB024 Introduction t o Cost Risk Analysis Lesson 5- Cost as a Probability Distribution TOC I RESO URCES I PRINT I HELP
Symmet ric Approxi mation
The second step in developing a to tal cost distribu tion is to combine all the iden ti fied risks and their associated ranges in to a single distribu tion One technique is Symmetric Approximatio n
Symmetric Approximation is also known as the Summatio n of Moments PDFs have four momen ts 1st shyMean 2nd - Variance 3rd - Coe ffic ien t o f Skewness (symmetry ) and 4 th - Coe ffic ien t o f Kurtosis (heigh t )
Data o f the Symmetric Approximation method is placed in a linear table o f calculations Work Breakdown Struc ture cost elemen ts are listed with their distribu tion type mean and variance The means and variances are summed ( the summation o f momen ts ) which describe an approximate normal distribu tion Probabili ty statemen ts can then be made concerning funding levels This procedure assumes that all summed elemen ts are independen t o f each o ther This will no t normally be the case and addit ional techniques must be used to de termine the impac t o f dependence among elemen ts This calculation is beyond the scope o f this module
Click here to view an example
~ I Page 18 of 25 I Back Next
Popup Text
Uncertainty Analysis by Symmetric Approximation Example
CLB024 Introduction to Cost Risk Analysis Lesson 5- Cost as a Probability Distribution TOC I RESOURCES I PRINT 1HELP
Monte Carlo Simulation
A distribution is de fined for each cost element from which a random sample is drawn The samples from each cost elements distribution are summed to a to tal cost This sampling and summing process is repeated many times (eg 1000- 10000 times) The result is a distribution representing the to tal cost o f the system with all described uncertainties taken into account The distribution can be displayed by a cumulative probabili ty distribution
Iterations in Monte Carlo Simulation
Rot~~
_ l4_-RbullU~ OA TCoot 12tu middot 182clamp bull sa-12 Ul
I $l4SU
12511t $4501t $562
Maiefllll bull~- - -+ I I I
1000 bull=o7----J
~
bull
-ld ~toe lL_ _ ampft 10
no~us Do~~W -~
~ I Pa ge 19 of 25 I Back Next
CLB024 Introduction to Cost Risk Analysis Lesson 5 - Cost as a Probability Distribution TOC I RESOURCES I PRINT I HELP
Knowledge Review
Which input would not affect cost
Award fees
Composition o f materials
System weight
~ None of the above
Any o f t he input s would affect cost
Muttlple Probability Distribution centol(
)______ ~
M~ L---~ --~-
L ----+00 _
tlllimoling Rotnliommipa
I Pope 20 of 2S I Back Next
CLB024 Introduction to Cost Risk Analysis Lesson 5- Cost as a Probability Distribution TOC I RESOURCES I PRINT 1HELP
Knowledge Review
A distribu t ion represen ting a systems to tal cost wi th uncer tain t ies inc luded is the sum o f many indiv idual cost elemen t distribu t ions
~ True Iterations in Monte Carlo Simulation _ --~_~
1bull111nbull $C bull Mlt10 middot- -bull --False rshybull=- middot u-middot~-middot 1 - middot~ - r-+ J
bull -shy- _ shy I - --~- bull bull bull bull bull bullmiddot~ --lA~ -
Check Answer
T he answer is True T his is the de fini t ion o f the to tal system cost distribu t ion
~ I Page 21 of 25 I Back Next
CLB024 Introduction to Cost Risk Analysis Lesson 5 - Cost as a Probability Distribution TOC I RESOURCES I PRINT I HELP
Know ledge Review
Each probability distribution has distinct characteristics Choose the correct match below and submit your answer
High and Low values are eguallv likely - Normal Distribution More accyrate when MTBF measurements are ysed - Uniform Distribution Wide range o f dis tribu tion shapes with potentjally large tails - Beta Distribu tion Parameters are difficult to determine use PERI approximation - Triangular Distribution
~ High and Low values are equally likely - Uniform Distribu tion More accyrate when MTBF measuremen ts are used - Normal Distribution Wide range of dis tribu tion shapes with potentjaly large tails - Triangular Distribution Parameters are difficult t o determine use PERT approximation - Beta Distribution
Check Answ er
The answer is High a nd Low values are equally likely - Uniform Dist ri but ion More accurat e when MTBF measurement s are used - Normal Dist ribut ion Wid e range o f d ist ri but ion s hapes wit h pot ent ially large t ails - Triangular Dist ribut ion and Param et e rs are difficult t o de t ermine use PERT a pproximat ion - Bet a Dist ri but ion
I Pope 22 of 2S I Back Next
CLB024 Introduction to Cost Risk Analysis Lesson 5 - Cost as a Probability Distribution TOC I RESOURCES I PRINT I HELP
Summary
To complete a Cost Risk Analysis
bull Identify a Probability Density Function for each uncertain element in the cost estimate
bull Combine the element uncertainties into a Total Cost PDF
There are two mathematical approaches
bull Symmetric Approximation (Summation o f Moments )
bull Monte Carlo Simulation
Uniform Distribution - High and Low values are equally likely
bull Used when there is no likelihood information
Triangular Distribu t ion - Includes all three parameters high low and most likely v alue
bull Tails can be heavy or fat
Normal Distribu ti on - Bell Curve
bull Symmetrical on both sides o f the mean
bull ReqLiires mean and standard deviation
I Pope 23 of 2S I Back Next
CLB024 Introduction t o Cost Risk Analysis Lesson 5- Cost as a Probability Distribution TOC I RESO URCES I PRINT I HELP
Summary Cont
Beta Dist rib ut io n - can take on many possible shapes
bull Requires a and ~
bull Assume PERT Beta use low most likely and high estimates
Table o f Algori thms for calculating means and variances for four distribu tions
Distribution Mean Variance
ll=(a + b) 02 =(b - al2 Uniform
2 12
ll = la+c+b) 02= a 2 + b2+ c2-ab - ac - be) Triangular 3 18
o 2 b - a)2
Normal ll = C 36
ll=a + 4c + b) o2 b - a)2 Beta
6 36 I
Q
~ I Page24of 25 I Back Next
Long Description
Table of Algorithms for each distribution shape
Distribution Uniform Mean μ = (a + b) 2 Variance σ2 = (b-a)2 12
Distribution Triangular Mean μ = (a + c + b) 3 Variance σ2 = (a2 + b2 + c2 - ab - ac - bc) 18
Distribution Normal Mean μ = c Variance σ2 = (b - a)2 36
Distribution Beta Mean μ = (a + 4c + b) 6 Variance σ2 = (b - a )2 36
CLB024 Introduction to Cost Risk Analysis Lesson 5 - Cost as a Probability Distribution TOC I RESOURCES I PRINT I HELP
Lesson Completion
You have comple ted the content for this lesson
To continue selec t ano ther lesson from the Table o f Con ten ts on the le ft
If you have closed or hidden the Table of Conten ts click the Show TOC button at the top in the Atlas navigation bar
I Poobull 25 of 25 I Back Next

CLB024 Introduction to Cost Risk Analysis Lesson 5 - Cost as a Probability Distribution TOC I RESOURCES I PRINT I HELP
Uniform Algorithms
Uniform Distribution - Calculating mean and variance
where a bull min value (low) b = max value (high) 11 bull mean (average) and o bull variance There Is no mode Reason All y values are equivalent Frequency does not change
o2 Average (mean) cost = (low + hlgh)2 variance= ci = (high shy low) 2 12
ci bull 2ru 12
II bull (70 + 1801 2
ci - (180-70) 12
11 bull 125 ci - LQ12
ci bull 12110 12
o = 100833
I Pope 11 of 2S I Back Next
Long Description
Uniform Algorithms
Uniform Distribution - Calculating mean and standard deviation
where a = min value (low) b = max value (high) micro = mean and σ = sd There is no mode Reason All y values are equivalent Frequency does not change
micro σ 2
Average (mean) cost = (low + high)2 Variance = σ sup2 = (high - low) sup212
μ = (a + b) σ sup2 = (b - a) sup2 2 12
μ = (70 + 180) σ sup2 = (180 - 70) sup2 2 12
μ = 125 σ sup2 = (110) 2
12
σ 2 = 12110 12
σ 2 = 100833
CLB024 Introduction to Cost Risk Analysis Lesson 5 - Cost as a Probability Distribution TOC I RESOURCES I PRINT I HELP
Tr iangular Model
Triangular Distribu t ion
bull Represents wide range of possible distribution shapes
Selec t nextbull to view the algorithms for a Triangular Distribution
Triangle Distribution
b
I Pope 12 of 2S I Back Next
CLB024 Intro duction to Cost Risk Analysis
Lesson 5 - Cost as a Probability Distribution TOC I RESOURCES I PRINT I HELP
Tr iangular Algor i thms
Triangle Distribution - Calculating mean and variance
where a a m in value (cost) b = maximum value (cost) c = mode (most likely) (cost) 11 bull mean and a =Variance
0 2IJ Average (mean) cost = Variance = a
( low + most likely + high)3
11 = (atctb a bull Ca2tc2tb1-ab-ac-bcl 3 18
a= 2ZQQ 11 = (70 t 100 + 180 18
3 a= 53889
11 = 11667
I Pope 13 of 2S I Back Next
Long Description
Triangle Distribution - Calculating mean and variance
where a = min value (cost) b = maximum value (cost) c = mode (most likely cost) μ = mean and σ 2 = variance
μ σ 2
Average (mean) cost = (low + most likely + high) 3 Variance = σ sup2
μ = (a + c + b) σ sup2 = (a sup2 + c sup2 + b sup2 - ab - ac - bc) 3 18
μ = (70 + 180 + 100) σ sup2 = 9700 3 18
μ = 11667 σ 2 = 53888
CLB024 Introduction to Cost Risk Analysis Lesson 5 - Cost as a Probability Distribution TOC I RESOURCES I PRINT I HELP
Normal Model
Norm al Distribution
bull Also known as a Bell Curve
Select the next button to view the algorithms for a Normal Distribu tion
Normal Dist r ibution
10 bullJn JJS lllU IU b a
I Pope 14 of 2S I Back Next
CLB024 Introduction to Cost Risk Analysis Lesson 5 - Cost as a Probability Distribution TOC I RESOURCES I PRINT I HELP
Normal Algor ithms
Normal Distribution - Calculating mean and variance
~ 0 2 where c approximates the mean of the normal where a = min value ( low) distribution b = max value (high)
~ = mean (average) c = most likely value
Variance = a Average (mean ) ~ = c
~ = 125 a = (Jla)l 36
a= (180-70~ 36
a= ( 110 )l
36 a= 12100
36 a= 33611
I Pope 15 of 25 I Back Next
Long Description
Normal Distribution - Calculating mean and variance
μ
where c approximates the mean of the normal distribution (high)
c = most likely value
Average (mean) μ = c μ = 125
σ 2
where a = min value (low) b = max value
μ = mean (average)
Variance = σ2
σ 2 = (b - a)2
36
σ 2 = (180 - 70)2
36
σ 2 = (110)2
36
σ 2 = 12100 36
σ 2 = 33611
CLB024 Introduction to Cost Risk Analysis Lesson 5 - Cost as a Probability Distribution TOC I RESOURCES I PRINT I HELP
Beta Model
Bet a Distribu tion
bull Beta shapes are determined by a and 13 parameters - which are difficult to determine
bull Use low most likely and high estimates
Selec t the next button to view the algori thms for a Be ta Distribu tion
Beta Distribution
I Pope 18 of 2S I Back Next
CLB024 Introduction to Cost Risk Analysis Lesson 5 - Cost as a Probability Distribution TOC I RESOURCES I PRINT I HELP
Beta Algor ithms
Beta (Pert Distribution - Calculating mean and variance
where a min value (low) b max value (high) c most likely value 11 bull mean (average) and a variance
tl Average (mean) cost = Variance a 0
(low + 4(rnost II ely + hlgh)6 a c Lbal0 36
11 = (aplusmn4cplusmnb) a 0 (180-70)2 6 36
11 = (70 plusmn 4(1 00) plusmn 80) 6 a = UlU
36
a a 12100 36
II = 125 a c 33611
o c
Q
I Pope 17 of 2S I Back Next
Long Description
Calculating mean and standard deviation
where a = min value (cost) b = maximum value (cost) c = mode (most likely cost) μ = mean and σ sup2 = variance
micro Average (mean) cost = (low + 4(most likely) + high)6 micro = (a + 4c + b)
6 micro = (70 + 4(125) + 180)
6
micro = 750 6
micro = 125
σ2
Variance = σ2
σ2 = (b - a)2
36 σ2 = (180 - 70)2
36
σ2 = (110)2
36 σ2 = 12100
36 σ2 = 33611
CLB024 Introduction t o Cost Risk Analysis Lesson 5- Cost as a Probability Distribution TOC I RESO URCES I PRINT I HELP
Symmet ric Approxi mation
The second step in developing a to tal cost distribu tion is to combine all the iden ti fied risks and their associated ranges in to a single distribu tion One technique is Symmetric Approximatio n
Symmetric Approximation is also known as the Summatio n of Moments PDFs have four momen ts 1st shyMean 2nd - Variance 3rd - Coe ffic ien t o f Skewness (symmetry ) and 4 th - Coe ffic ien t o f Kurtosis (heigh t )
Data o f the Symmetric Approximation method is placed in a linear table o f calculations Work Breakdown Struc ture cost elemen ts are listed with their distribu tion type mean and variance The means and variances are summed ( the summation o f momen ts ) which describe an approximate normal distribu tion Probabili ty statemen ts can then be made concerning funding levels This procedure assumes that all summed elemen ts are independen t o f each o ther This will no t normally be the case and addit ional techniques must be used to de termine the impac t o f dependence among elemen ts This calculation is beyond the scope o f this module
Click here to view an example
~ I Page 18 of 25 I Back Next
Popup Text
Uncertainty Analysis by Symmetric Approximation Example
CLB024 Introduction to Cost Risk Analysis Lesson 5- Cost as a Probability Distribution TOC I RESOURCES I PRINT 1HELP
Monte Carlo Simulation
A distribution is de fined for each cost element from which a random sample is drawn The samples from each cost elements distribution are summed to a to tal cost This sampling and summing process is repeated many times (eg 1000- 10000 times) The result is a distribution representing the to tal cost o f the system with all described uncertainties taken into account The distribution can be displayed by a cumulative probabili ty distribution
Iterations in Monte Carlo Simulation
Rot~~
_ l4_-RbullU~ OA TCoot 12tu middot 182clamp bull sa-12 Ul
I $l4SU
12511t $4501t $562
Maiefllll bull~- - -+ I I I
1000 bull=o7----J
~
bull
-ld ~toe lL_ _ ampft 10
no~us Do~~W -~
~ I Pa ge 19 of 25 I Back Next
CLB024 Introduction to Cost Risk Analysis Lesson 5 - Cost as a Probability Distribution TOC I RESOURCES I PRINT I HELP
Knowledge Review
Which input would not affect cost
Award fees
Composition o f materials
System weight
~ None of the above
Any o f t he input s would affect cost
Muttlple Probability Distribution centol(
)______ ~
M~ L---~ --~-
L ----+00 _
tlllimoling Rotnliommipa
I Pope 20 of 2S I Back Next
CLB024 Introduction to Cost Risk Analysis Lesson 5- Cost as a Probability Distribution TOC I RESOURCES I PRINT 1HELP
Knowledge Review
A distribu t ion represen ting a systems to tal cost wi th uncer tain t ies inc luded is the sum o f many indiv idual cost elemen t distribu t ions
~ True Iterations in Monte Carlo Simulation _ --~_~
1bull111nbull $C bull Mlt10 middot- -bull --False rshybull=- middot u-middot~-middot 1 - middot~ - r-+ J
bull -shy- _ shy I - --~- bull bull bull bull bull bullmiddot~ --lA~ -
Check Answer
T he answer is True T his is the de fini t ion o f the to tal system cost distribu t ion
~ I Page 21 of 25 I Back Next
CLB024 Introduction to Cost Risk Analysis Lesson 5 - Cost as a Probability Distribution TOC I RESOURCES I PRINT I HELP
Know ledge Review
Each probability distribution has distinct characteristics Choose the correct match below and submit your answer
High and Low values are eguallv likely - Normal Distribution More accyrate when MTBF measurements are ysed - Uniform Distribution Wide range o f dis tribu tion shapes with potentjally large tails - Beta Distribu tion Parameters are difficult to determine use PERI approximation - Triangular Distribution
~ High and Low values are equally likely - Uniform Distribu tion More accyrate when MTBF measuremen ts are used - Normal Distribution Wide range of dis tribu tion shapes with potentjaly large tails - Triangular Distribution Parameters are difficult t o determine use PERT approximation - Beta Distribution
Check Answ er
The answer is High a nd Low values are equally likely - Uniform Dist ri but ion More accurat e when MTBF measurement s are used - Normal Dist ribut ion Wid e range o f d ist ri but ion s hapes wit h pot ent ially large t ails - Triangular Dist ribut ion and Param et e rs are difficult t o de t ermine use PERT a pproximat ion - Bet a Dist ri but ion
I Pope 22 of 2S I Back Next
CLB024 Introduction to Cost Risk Analysis Lesson 5 - Cost as a Probability Distribution TOC I RESOURCES I PRINT I HELP
Summary
To complete a Cost Risk Analysis
bull Identify a Probability Density Function for each uncertain element in the cost estimate
bull Combine the element uncertainties into a Total Cost PDF
There are two mathematical approaches
bull Symmetric Approximation (Summation o f Moments )
bull Monte Carlo Simulation
Uniform Distribution - High and Low values are equally likely
bull Used when there is no likelihood information
Triangular Distribu t ion - Includes all three parameters high low and most likely v alue
bull Tails can be heavy or fat
Normal Distribu ti on - Bell Curve
bull Symmetrical on both sides o f the mean
bull ReqLiires mean and standard deviation
I Pope 23 of 2S I Back Next
CLB024 Introduction t o Cost Risk Analysis Lesson 5- Cost as a Probability Distribution TOC I RESO URCES I PRINT I HELP
Summary Cont
Beta Dist rib ut io n - can take on many possible shapes
bull Requires a and ~
bull Assume PERT Beta use low most likely and high estimates
Table o f Algori thms for calculating means and variances for four distribu tions
Distribution Mean Variance
ll=(a + b) 02 =(b - al2 Uniform
2 12
ll = la+c+b) 02= a 2 + b2+ c2-ab - ac - be) Triangular 3 18
o 2 b - a)2
Normal ll = C 36
ll=a + 4c + b) o2 b - a)2 Beta
6 36 I
Q
~ I Page24of 25 I Back Next
Long Description
Table of Algorithms for each distribution shape
Distribution Uniform Mean μ = (a + b) 2 Variance σ2 = (b-a)2 12
Distribution Triangular Mean μ = (a + c + b) 3 Variance σ2 = (a2 + b2 + c2 - ab - ac - bc) 18
Distribution Normal Mean μ = c Variance σ2 = (b - a)2 36
Distribution Beta Mean μ = (a + 4c + b) 6 Variance σ2 = (b - a )2 36
CLB024 Introduction to Cost Risk Analysis Lesson 5 - Cost as a Probability Distribution TOC I RESOURCES I PRINT I HELP
Lesson Completion
You have comple ted the content for this lesson
To continue selec t ano ther lesson from the Table o f Con ten ts on the le ft
If you have closed or hidden the Table of Conten ts click the Show TOC button at the top in the Atlas navigation bar
I Poobull 25 of 25 I Back Next

Long Description
Uniform Algorithms
Uniform Distribution - Calculating mean and standard deviation
where a = min value (low) b = max value (high) micro = mean and σ = sd There is no mode Reason All y values are equivalent Frequency does not change
micro σ 2
Average (mean) cost = (low + high)2 Variance = σ sup2 = (high - low) sup212
μ = (a + b) σ sup2 = (b - a) sup2 2 12
μ = (70 + 180) σ sup2 = (180 - 70) sup2 2 12
μ = 125 σ sup2 = (110) 2
12
σ 2 = 12110 12
σ 2 = 100833
CLB024 Introduction to Cost Risk Analysis Lesson 5 - Cost as a Probability Distribution TOC I RESOURCES I PRINT I HELP
Tr iangular Model
Triangular Distribu t ion
bull Represents wide range of possible distribution shapes
Selec t nextbull to view the algorithms for a Triangular Distribution
Triangle Distribution
b
I Pope 12 of 2S I Back Next
CLB024 Intro duction to Cost Risk Analysis
Lesson 5 - Cost as a Probability Distribution TOC I RESOURCES I PRINT I HELP
Tr iangular Algor i thms
Triangle Distribution - Calculating mean and variance
where a a m in value (cost) b = maximum value (cost) c = mode (most likely) (cost) 11 bull mean and a =Variance
0 2IJ Average (mean) cost = Variance = a
( low + most likely + high)3
11 = (atctb a bull Ca2tc2tb1-ab-ac-bcl 3 18
a= 2ZQQ 11 = (70 t 100 + 180 18
3 a= 53889
11 = 11667
I Pope 13 of 2S I Back Next
Long Description
Triangle Distribution - Calculating mean and variance
where a = min value (cost) b = maximum value (cost) c = mode (most likely cost) μ = mean and σ 2 = variance
μ σ 2
Average (mean) cost = (low + most likely + high) 3 Variance = σ sup2
μ = (a + c + b) σ sup2 = (a sup2 + c sup2 + b sup2 - ab - ac - bc) 3 18
μ = (70 + 180 + 100) σ sup2 = 9700 3 18
μ = 11667 σ 2 = 53888
CLB024 Introduction to Cost Risk Analysis Lesson 5 - Cost as a Probability Distribution TOC I RESOURCES I PRINT I HELP
Normal Model
Norm al Distribution
bull Also known as a Bell Curve
Select the next button to view the algorithms for a Normal Distribu tion
Normal Dist r ibution
10 bullJn JJS lllU IU b a
I Pope 14 of 2S I Back Next
CLB024 Introduction to Cost Risk Analysis Lesson 5 - Cost as a Probability Distribution TOC I RESOURCES I PRINT I HELP
Normal Algor ithms
Normal Distribution - Calculating mean and variance
~ 0 2 where c approximates the mean of the normal where a = min value ( low) distribution b = max value (high)
~ = mean (average) c = most likely value
Variance = a Average (mean ) ~ = c
~ = 125 a = (Jla)l 36
a= (180-70~ 36
a= ( 110 )l
36 a= 12100
36 a= 33611
I Pope 15 of 25 I Back Next
Long Description
Normal Distribution - Calculating mean and variance
μ
where c approximates the mean of the normal distribution (high)
c = most likely value
Average (mean) μ = c μ = 125
σ 2
where a = min value (low) b = max value
μ = mean (average)
Variance = σ2
σ 2 = (b - a)2
36
σ 2 = (180 - 70)2
36
σ 2 = (110)2
36
σ 2 = 12100 36
σ 2 = 33611
CLB024 Introduction to Cost Risk Analysis Lesson 5 - Cost as a Probability Distribution TOC I RESOURCES I PRINT I HELP
Beta Model
Bet a Distribu tion
bull Beta shapes are determined by a and 13 parameters - which are difficult to determine
bull Use low most likely and high estimates
Selec t the next button to view the algori thms for a Be ta Distribu tion
Beta Distribution
I Pope 18 of 2S I Back Next
CLB024 Introduction to Cost Risk Analysis Lesson 5 - Cost as a Probability Distribution TOC I RESOURCES I PRINT I HELP
Beta Algor ithms
Beta (Pert Distribution - Calculating mean and variance
where a min value (low) b max value (high) c most likely value 11 bull mean (average) and a variance
tl Average (mean) cost = Variance a 0
(low + 4(rnost II ely + hlgh)6 a c Lbal0 36
11 = (aplusmn4cplusmnb) a 0 (180-70)2 6 36
11 = (70 plusmn 4(1 00) plusmn 80) 6 a = UlU
36
a a 12100 36
II = 125 a c 33611
o c
Q
I Pope 17 of 2S I Back Next
Long Description
Calculating mean and standard deviation
where a = min value (cost) b = maximum value (cost) c = mode (most likely cost) μ = mean and σ sup2 = variance
micro Average (mean) cost = (low + 4(most likely) + high)6 micro = (a + 4c + b)
6 micro = (70 + 4(125) + 180)
6
micro = 750 6
micro = 125
σ2
Variance = σ2
σ2 = (b - a)2
36 σ2 = (180 - 70)2
36
σ2 = (110)2
36 σ2 = 12100
36 σ2 = 33611
CLB024 Introduction t o Cost Risk Analysis Lesson 5- Cost as a Probability Distribution TOC I RESO URCES I PRINT I HELP
Symmet ric Approxi mation
The second step in developing a to tal cost distribu tion is to combine all the iden ti fied risks and their associated ranges in to a single distribu tion One technique is Symmetric Approximatio n
Symmetric Approximation is also known as the Summatio n of Moments PDFs have four momen ts 1st shyMean 2nd - Variance 3rd - Coe ffic ien t o f Skewness (symmetry ) and 4 th - Coe ffic ien t o f Kurtosis (heigh t )
Data o f the Symmetric Approximation method is placed in a linear table o f calculations Work Breakdown Struc ture cost elemen ts are listed with their distribu tion type mean and variance The means and variances are summed ( the summation o f momen ts ) which describe an approximate normal distribu tion Probabili ty statemen ts can then be made concerning funding levels This procedure assumes that all summed elemen ts are independen t o f each o ther This will no t normally be the case and addit ional techniques must be used to de termine the impac t o f dependence among elemen ts This calculation is beyond the scope o f this module
Click here to view an example
~ I Page 18 of 25 I Back Next
Popup Text
Uncertainty Analysis by Symmetric Approximation Example
CLB024 Introduction to Cost Risk Analysis Lesson 5- Cost as a Probability Distribution TOC I RESOURCES I PRINT 1HELP
Monte Carlo Simulation
A distribution is de fined for each cost element from which a random sample is drawn The samples from each cost elements distribution are summed to a to tal cost This sampling and summing process is repeated many times (eg 1000- 10000 times) The result is a distribution representing the to tal cost o f the system with all described uncertainties taken into account The distribution can be displayed by a cumulative probabili ty distribution
Iterations in Monte Carlo Simulation
Rot~~
_ l4_-RbullU~ OA TCoot 12tu middot 182clamp bull sa-12 Ul
I $l4SU
12511t $4501t $562
Maiefllll bull~- - -+ I I I
1000 bull=o7----J
~
bull
-ld ~toe lL_ _ ampft 10
no~us Do~~W -~
~ I Pa ge 19 of 25 I Back Next
CLB024 Introduction to Cost Risk Analysis Lesson 5 - Cost as a Probability Distribution TOC I RESOURCES I PRINT I HELP
Knowledge Review
Which input would not affect cost
Award fees
Composition o f materials
System weight
~ None of the above
Any o f t he input s would affect cost
Muttlple Probability Distribution centol(
)______ ~
M~ L---~ --~-
L ----+00 _
tlllimoling Rotnliommipa
I Pope 20 of 2S I Back Next
CLB024 Introduction to Cost Risk Analysis Lesson 5- Cost as a Probability Distribution TOC I RESOURCES I PRINT 1HELP
Knowledge Review
A distribu t ion represen ting a systems to tal cost wi th uncer tain t ies inc luded is the sum o f many indiv idual cost elemen t distribu t ions
~ True Iterations in Monte Carlo Simulation _ --~_~
1bull111nbull $C bull Mlt10 middot- -bull --False rshybull=- middot u-middot~-middot 1 - middot~ - r-+ J
bull -shy- _ shy I - --~- bull bull bull bull bull bullmiddot~ --lA~ -
Check Answer
T he answer is True T his is the de fini t ion o f the to tal system cost distribu t ion
~ I Page 21 of 25 I Back Next
CLB024 Introduction to Cost Risk Analysis Lesson 5 - Cost as a Probability Distribution TOC I RESOURCES I PRINT I HELP
Know ledge Review
Each probability distribution has distinct characteristics Choose the correct match below and submit your answer
High and Low values are eguallv likely - Normal Distribution More accyrate when MTBF measurements are ysed - Uniform Distribution Wide range o f dis tribu tion shapes with potentjally large tails - Beta Distribu tion Parameters are difficult to determine use PERI approximation - Triangular Distribution
~ High and Low values are equally likely - Uniform Distribu tion More accyrate when MTBF measuremen ts are used - Normal Distribution Wide range of dis tribu tion shapes with potentjaly large tails - Triangular Distribution Parameters are difficult t o determine use PERT approximation - Beta Distribution
Check Answ er
The answer is High a nd Low values are equally likely - Uniform Dist ri but ion More accurat e when MTBF measurement s are used - Normal Dist ribut ion Wid e range o f d ist ri but ion s hapes wit h pot ent ially large t ails - Triangular Dist ribut ion and Param et e rs are difficult t o de t ermine use PERT a pproximat ion - Bet a Dist ri but ion
I Pope 22 of 2S I Back Next
CLB024 Introduction to Cost Risk Analysis Lesson 5 - Cost as a Probability Distribution TOC I RESOURCES I PRINT I HELP
Summary
To complete a Cost Risk Analysis
bull Identify a Probability Density Function for each uncertain element in the cost estimate
bull Combine the element uncertainties into a Total Cost PDF
There are two mathematical approaches
bull Symmetric Approximation (Summation o f Moments )
bull Monte Carlo Simulation
Uniform Distribution - High and Low values are equally likely
bull Used when there is no likelihood information
Triangular Distribu t ion - Includes all three parameters high low and most likely v alue
bull Tails can be heavy or fat
Normal Distribu ti on - Bell Curve
bull Symmetrical on both sides o f the mean
bull ReqLiires mean and standard deviation
I Pope 23 of 2S I Back Next
CLB024 Introduction t o Cost Risk Analysis Lesson 5- Cost as a Probability Distribution TOC I RESO URCES I PRINT I HELP
Summary Cont
Beta Dist rib ut io n - can take on many possible shapes
bull Requires a and ~
bull Assume PERT Beta use low most likely and high estimates
Table o f Algori thms for calculating means and variances for four distribu tions
Distribution Mean Variance
ll=(a + b) 02 =(b - al2 Uniform
2 12
ll = la+c+b) 02= a 2 + b2+ c2-ab - ac - be) Triangular 3 18
o 2 b - a)2
Normal ll = C 36
ll=a + 4c + b) o2 b - a)2 Beta
6 36 I
Q
~ I Page24of 25 I Back Next
Long Description
Table of Algorithms for each distribution shape
Distribution Uniform Mean μ = (a + b) 2 Variance σ2 = (b-a)2 12
Distribution Triangular Mean μ = (a + c + b) 3 Variance σ2 = (a2 + b2 + c2 - ab - ac - bc) 18
Distribution Normal Mean μ = c Variance σ2 = (b - a)2 36
Distribution Beta Mean μ = (a + 4c + b) 6 Variance σ2 = (b - a )2 36
CLB024 Introduction to Cost Risk Analysis Lesson 5 - Cost as a Probability Distribution TOC I RESOURCES I PRINT I HELP
Lesson Completion
You have comple ted the content for this lesson
To continue selec t ano ther lesson from the Table o f Con ten ts on the le ft
If you have closed or hidden the Table of Conten ts click the Show TOC button at the top in the Atlas navigation bar
I Poobull 25 of 25 I Back Next

CLB024 Introduction to Cost Risk Analysis Lesson 5 - Cost as a Probability Distribution TOC I RESOURCES I PRINT I HELP
Tr iangular Model
Triangular Distribu t ion
bull Represents wide range of possible distribution shapes
Selec t nextbull to view the algorithms for a Triangular Distribution
Triangle Distribution
b
I Pope 12 of 2S I Back Next
CLB024 Intro duction to Cost Risk Analysis
Lesson 5 - Cost as a Probability Distribution TOC I RESOURCES I PRINT I HELP
Tr iangular Algor i thms
Triangle Distribution - Calculating mean and variance
where a a m in value (cost) b = maximum value (cost) c = mode (most likely) (cost) 11 bull mean and a =Variance
0 2IJ Average (mean) cost = Variance = a
( low + most likely + high)3
11 = (atctb a bull Ca2tc2tb1-ab-ac-bcl 3 18
a= 2ZQQ 11 = (70 t 100 + 180 18
3 a= 53889
11 = 11667
I Pope 13 of 2S I Back Next
Long Description
Triangle Distribution - Calculating mean and variance
where a = min value (cost) b = maximum value (cost) c = mode (most likely cost) μ = mean and σ 2 = variance
μ σ 2
Average (mean) cost = (low + most likely + high) 3 Variance = σ sup2
μ = (a + c + b) σ sup2 = (a sup2 + c sup2 + b sup2 - ab - ac - bc) 3 18
μ = (70 + 180 + 100) σ sup2 = 9700 3 18
μ = 11667 σ 2 = 53888
CLB024 Introduction to Cost Risk Analysis Lesson 5 - Cost as a Probability Distribution TOC I RESOURCES I PRINT I HELP
Normal Model
Norm al Distribution
bull Also known as a Bell Curve
Select the next button to view the algorithms for a Normal Distribu tion
Normal Dist r ibution
10 bullJn JJS lllU IU b a
I Pope 14 of 2S I Back Next
CLB024 Introduction to Cost Risk Analysis Lesson 5 - Cost as a Probability Distribution TOC I RESOURCES I PRINT I HELP
Normal Algor ithms
Normal Distribution - Calculating mean and variance
~ 0 2 where c approximates the mean of the normal where a = min value ( low) distribution b = max value (high)
~ = mean (average) c = most likely value
Variance = a Average (mean ) ~ = c
~ = 125 a = (Jla)l 36
a= (180-70~ 36
a= ( 110 )l
36 a= 12100
36 a= 33611
I Pope 15 of 25 I Back Next
Long Description
Normal Distribution - Calculating mean and variance
μ
where c approximates the mean of the normal distribution (high)
c = most likely value
Average (mean) μ = c μ = 125
σ 2
where a = min value (low) b = max value
μ = mean (average)
Variance = σ2
σ 2 = (b - a)2
36
σ 2 = (180 - 70)2
36
σ 2 = (110)2
36
σ 2 = 12100 36
σ 2 = 33611
CLB024 Introduction to Cost Risk Analysis Lesson 5 - Cost as a Probability Distribution TOC I RESOURCES I PRINT I HELP
Beta Model
Bet a Distribu tion
bull Beta shapes are determined by a and 13 parameters - which are difficult to determine
bull Use low most likely and high estimates
Selec t the next button to view the algori thms for a Be ta Distribu tion
Beta Distribution
I Pope 18 of 2S I Back Next
CLB024 Introduction to Cost Risk Analysis Lesson 5 - Cost as a Probability Distribution TOC I RESOURCES I PRINT I HELP
Beta Algor ithms
Beta (Pert Distribution - Calculating mean and variance
where a min value (low) b max value (high) c most likely value 11 bull mean (average) and a variance
tl Average (mean) cost = Variance a 0
(low + 4(rnost II ely + hlgh)6 a c Lbal0 36
11 = (aplusmn4cplusmnb) a 0 (180-70)2 6 36
11 = (70 plusmn 4(1 00) plusmn 80) 6 a = UlU
36
a a 12100 36
II = 125 a c 33611
o c
Q
I Pope 17 of 2S I Back Next
Long Description
Calculating mean and standard deviation
where a = min value (cost) b = maximum value (cost) c = mode (most likely cost) μ = mean and σ sup2 = variance
micro Average (mean) cost = (low + 4(most likely) + high)6 micro = (a + 4c + b)
6 micro = (70 + 4(125) + 180)
6
micro = 750 6
micro = 125
σ2
Variance = σ2
σ2 = (b - a)2
36 σ2 = (180 - 70)2
36
σ2 = (110)2
36 σ2 = 12100
36 σ2 = 33611
CLB024 Introduction t o Cost Risk Analysis Lesson 5- Cost as a Probability Distribution TOC I RESO URCES I PRINT I HELP
Symmet ric Approxi mation
The second step in developing a to tal cost distribu tion is to combine all the iden ti fied risks and their associated ranges in to a single distribu tion One technique is Symmetric Approximatio n
Symmetric Approximation is also known as the Summatio n of Moments PDFs have four momen ts 1st shyMean 2nd - Variance 3rd - Coe ffic ien t o f Skewness (symmetry ) and 4 th - Coe ffic ien t o f Kurtosis (heigh t )
Data o f the Symmetric Approximation method is placed in a linear table o f calculations Work Breakdown Struc ture cost elemen ts are listed with their distribu tion type mean and variance The means and variances are summed ( the summation o f momen ts ) which describe an approximate normal distribu tion Probabili ty statemen ts can then be made concerning funding levels This procedure assumes that all summed elemen ts are independen t o f each o ther This will no t normally be the case and addit ional techniques must be used to de termine the impac t o f dependence among elemen ts This calculation is beyond the scope o f this module
Click here to view an example
~ I Page 18 of 25 I Back Next
Popup Text
Uncertainty Analysis by Symmetric Approximation Example
CLB024 Introduction to Cost Risk Analysis Lesson 5- Cost as a Probability Distribution TOC I RESOURCES I PRINT 1HELP
Monte Carlo Simulation
A distribution is de fined for each cost element from which a random sample is drawn The samples from each cost elements distribution are summed to a to tal cost This sampling and summing process is repeated many times (eg 1000- 10000 times) The result is a distribution representing the to tal cost o f the system with all described uncertainties taken into account The distribution can be displayed by a cumulative probabili ty distribution
Iterations in Monte Carlo Simulation
Rot~~
_ l4_-RbullU~ OA TCoot 12tu middot 182clamp bull sa-12 Ul
I $l4SU
12511t $4501t $562
Maiefllll bull~- - -+ I I I
1000 bull=o7----J
~
bull
-ld ~toe lL_ _ ampft 10
no~us Do~~W -~
~ I Pa ge 19 of 25 I Back Next
CLB024 Introduction to Cost Risk Analysis Lesson 5 - Cost as a Probability Distribution TOC I RESOURCES I PRINT I HELP
Knowledge Review
Which input would not affect cost
Award fees
Composition o f materials
System weight
~ None of the above
Any o f t he input s would affect cost
Muttlple Probability Distribution centol(
)______ ~
M~ L---~ --~-
L ----+00 _
tlllimoling Rotnliommipa
I Pope 20 of 2S I Back Next
CLB024 Introduction to Cost Risk Analysis Lesson 5- Cost as a Probability Distribution TOC I RESOURCES I PRINT 1HELP
Knowledge Review
A distribu t ion represen ting a systems to tal cost wi th uncer tain t ies inc luded is the sum o f many indiv idual cost elemen t distribu t ions
~ True Iterations in Monte Carlo Simulation _ --~_~
1bull111nbull $C bull Mlt10 middot- -bull --False rshybull=- middot u-middot~-middot 1 - middot~ - r-+ J
bull -shy- _ shy I - --~- bull bull bull bull bull bullmiddot~ --lA~ -
Check Answer
T he answer is True T his is the de fini t ion o f the to tal system cost distribu t ion
~ I Page 21 of 25 I Back Next
CLB024 Introduction to Cost Risk Analysis Lesson 5 - Cost as a Probability Distribution TOC I RESOURCES I PRINT I HELP
Know ledge Review
Each probability distribution has distinct characteristics Choose the correct match below and submit your answer
High and Low values are eguallv likely - Normal Distribution More accyrate when MTBF measurements are ysed - Uniform Distribution Wide range o f dis tribu tion shapes with potentjally large tails - Beta Distribu tion Parameters are difficult to determine use PERI approximation - Triangular Distribution
~ High and Low values are equally likely - Uniform Distribu tion More accyrate when MTBF measuremen ts are used - Normal Distribution Wide range of dis tribu tion shapes with potentjaly large tails - Triangular Distribution Parameters are difficult t o determine use PERT approximation - Beta Distribution
Check Answ er
The answer is High a nd Low values are equally likely - Uniform Dist ri but ion More accurat e when MTBF measurement s are used - Normal Dist ribut ion Wid e range o f d ist ri but ion s hapes wit h pot ent ially large t ails - Triangular Dist ribut ion and Param et e rs are difficult t o de t ermine use PERT a pproximat ion - Bet a Dist ri but ion
I Pope 22 of 2S I Back Next
CLB024 Introduction to Cost Risk Analysis Lesson 5 - Cost as a Probability Distribution TOC I RESOURCES I PRINT I HELP
Summary
To complete a Cost Risk Analysis
bull Identify a Probability Density Function for each uncertain element in the cost estimate
bull Combine the element uncertainties into a Total Cost PDF
There are two mathematical approaches
bull Symmetric Approximation (Summation o f Moments )
bull Monte Carlo Simulation
Uniform Distribution - High and Low values are equally likely
bull Used when there is no likelihood information
Triangular Distribu t ion - Includes all three parameters high low and most likely v alue
bull Tails can be heavy or fat
Normal Distribu ti on - Bell Curve
bull Symmetrical on both sides o f the mean
bull ReqLiires mean and standard deviation
I Pope 23 of 2S I Back Next
CLB024 Introduction t o Cost Risk Analysis Lesson 5- Cost as a Probability Distribution TOC I RESO URCES I PRINT I HELP
Summary Cont
Beta Dist rib ut io n - can take on many possible shapes
bull Requires a and ~
bull Assume PERT Beta use low most likely and high estimates
Table o f Algori thms for calculating means and variances for four distribu tions
Distribution Mean Variance
ll=(a + b) 02 =(b - al2 Uniform
2 12
ll = la+c+b) 02= a 2 + b2+ c2-ab - ac - be) Triangular 3 18
o 2 b - a)2
Normal ll = C 36
ll=a + 4c + b) o2 b - a)2 Beta
6 36 I
Q
~ I Page24of 25 I Back Next
Long Description
Table of Algorithms for each distribution shape
Distribution Uniform Mean μ = (a + b) 2 Variance σ2 = (b-a)2 12
Distribution Triangular Mean μ = (a + c + b) 3 Variance σ2 = (a2 + b2 + c2 - ab - ac - bc) 18
Distribution Normal Mean μ = c Variance σ2 = (b - a)2 36
Distribution Beta Mean μ = (a + 4c + b) 6 Variance σ2 = (b - a )2 36
CLB024 Introduction to Cost Risk Analysis Lesson 5 - Cost as a Probability Distribution TOC I RESOURCES I PRINT I HELP
Lesson Completion
You have comple ted the content for this lesson
To continue selec t ano ther lesson from the Table o f Con ten ts on the le ft
If you have closed or hidden the Table of Conten ts click the Show TOC button at the top in the Atlas navigation bar
I Poobull 25 of 25 I Back Next

Long Description
Triangle Distribution - Calculating mean and variance
where a = min value (cost) b = maximum value (cost) c = mode (most likely cost) μ = mean and σ 2 = variance
μ σ 2
Average (mean) cost = (low + most likely + high) 3 Variance = σ sup2
μ = (a + c + b) σ sup2 = (a sup2 + c sup2 + b sup2 - ab - ac - bc) 3 18
μ = (70 + 180 + 100) σ sup2 = 9700 3 18
μ = 11667 σ 2 = 53888
CLB024 Introduction to Cost Risk Analysis Lesson 5 - Cost as a Probability Distribution TOC I RESOURCES I PRINT I HELP
Normal Model
Norm al Distribution
bull Also known as a Bell Curve
Select the next button to view the algorithms for a Normal Distribu tion
Normal Dist r ibution
10 bullJn JJS lllU IU b a
I Pope 14 of 2S I Back Next
CLB024 Introduction to Cost Risk Analysis Lesson 5 - Cost as a Probability Distribution TOC I RESOURCES I PRINT I HELP
Normal Algor ithms
Normal Distribution - Calculating mean and variance
~ 0 2 where c approximates the mean of the normal where a = min value ( low) distribution b = max value (high)
~ = mean (average) c = most likely value
Variance = a Average (mean ) ~ = c
~ = 125 a = (Jla)l 36
a= (180-70~ 36
a= ( 110 )l
36 a= 12100
36 a= 33611
I Pope 15 of 25 I Back Next
Long Description
Normal Distribution - Calculating mean and variance
μ
where c approximates the mean of the normal distribution (high)
c = most likely value
Average (mean) μ = c μ = 125
σ 2
where a = min value (low) b = max value
μ = mean (average)
Variance = σ2
σ 2 = (b - a)2
36
σ 2 = (180 - 70)2
36
σ 2 = (110)2
36
σ 2 = 12100 36
σ 2 = 33611
CLB024 Introduction to Cost Risk Analysis Lesson 5 - Cost as a Probability Distribution TOC I RESOURCES I PRINT I HELP
Beta Model
Bet a Distribu tion
bull Beta shapes are determined by a and 13 parameters - which are difficult to determine
bull Use low most likely and high estimates
Selec t the next button to view the algori thms for a Be ta Distribu tion
Beta Distribution
I Pope 18 of 2S I Back Next
CLB024 Introduction to Cost Risk Analysis Lesson 5 - Cost as a Probability Distribution TOC I RESOURCES I PRINT I HELP
Beta Algor ithms
Beta (Pert Distribution - Calculating mean and variance
where a min value (low) b max value (high) c most likely value 11 bull mean (average) and a variance
tl Average (mean) cost = Variance a 0
(low + 4(rnost II ely + hlgh)6 a c Lbal0 36
11 = (aplusmn4cplusmnb) a 0 (180-70)2 6 36
11 = (70 plusmn 4(1 00) plusmn 80) 6 a = UlU
36
a a 12100 36
II = 125 a c 33611
o c
Q
I Pope 17 of 2S I Back Next
Long Description
Calculating mean and standard deviation
where a = min value (cost) b = maximum value (cost) c = mode (most likely cost) μ = mean and σ sup2 = variance
micro Average (mean) cost = (low + 4(most likely) + high)6 micro = (a + 4c + b)
6 micro = (70 + 4(125) + 180)
6
micro = 750 6
micro = 125
σ2
Variance = σ2
σ2 = (b - a)2
36 σ2 = (180 - 70)2
36
σ2 = (110)2
36 σ2 = 12100
36 σ2 = 33611
CLB024 Introduction t o Cost Risk Analysis Lesson 5- Cost as a Probability Distribution TOC I RESO URCES I PRINT I HELP
Symmet ric Approxi mation
The second step in developing a to tal cost distribu tion is to combine all the iden ti fied risks and their associated ranges in to a single distribu tion One technique is Symmetric Approximatio n
Symmetric Approximation is also known as the Summatio n of Moments PDFs have four momen ts 1st shyMean 2nd - Variance 3rd - Coe ffic ien t o f Skewness (symmetry ) and 4 th - Coe ffic ien t o f Kurtosis (heigh t )
Data o f the Symmetric Approximation method is placed in a linear table o f calculations Work Breakdown Struc ture cost elemen ts are listed with their distribu tion type mean and variance The means and variances are summed ( the summation o f momen ts ) which describe an approximate normal distribu tion Probabili ty statemen ts can then be made concerning funding levels This procedure assumes that all summed elemen ts are independen t o f each o ther This will no t normally be the case and addit ional techniques must be used to de termine the impac t o f dependence among elemen ts This calculation is beyond the scope o f this module
Click here to view an example
~ I Page 18 of 25 I Back Next
Popup Text
Uncertainty Analysis by Symmetric Approximation Example
CLB024 Introduction to Cost Risk Analysis Lesson 5- Cost as a Probability Distribution TOC I RESOURCES I PRINT 1HELP
Monte Carlo Simulation
A distribution is de fined for each cost element from which a random sample is drawn The samples from each cost elements distribution are summed to a to tal cost This sampling and summing process is repeated many times (eg 1000- 10000 times) The result is a distribution representing the to tal cost o f the system with all described uncertainties taken into account The distribution can be displayed by a cumulative probabili ty distribution
Iterations in Monte Carlo Simulation
Rot~~
_ l4_-RbullU~ OA TCoot 12tu middot 182clamp bull sa-12 Ul
I $l4SU
12511t $4501t $562
Maiefllll bull~- - -+ I I I
1000 bull=o7----J
~
bull
-ld ~toe lL_ _ ampft 10
no~us Do~~W -~
~ I Pa ge 19 of 25 I Back Next
CLB024 Introduction to Cost Risk Analysis Lesson 5 - Cost as a Probability Distribution TOC I RESOURCES I PRINT I HELP
Knowledge Review
Which input would not affect cost
Award fees
Composition o f materials
System weight
~ None of the above
Any o f t he input s would affect cost
Muttlple Probability Distribution centol(
)______ ~
M~ L---~ --~-
L ----+00 _
tlllimoling Rotnliommipa
I Pope 20 of 2S I Back Next
CLB024 Introduction to Cost Risk Analysis Lesson 5- Cost as a Probability Distribution TOC I RESOURCES I PRINT 1HELP
Knowledge Review
A distribu t ion represen ting a systems to tal cost wi th uncer tain t ies inc luded is the sum o f many indiv idual cost elemen t distribu t ions
~ True Iterations in Monte Carlo Simulation _ --~_~
1bull111nbull $C bull Mlt10 middot- -bull --False rshybull=- middot u-middot~-middot 1 - middot~ - r-+ J
bull -shy- _ shy I - --~- bull bull bull bull bull bullmiddot~ --lA~ -
Check Answer
T he answer is True T his is the de fini t ion o f the to tal system cost distribu t ion
~ I Page 21 of 25 I Back Next
CLB024 Introduction to Cost Risk Analysis Lesson 5 - Cost as a Probability Distribution TOC I RESOURCES I PRINT I HELP
Know ledge Review
Each probability distribution has distinct characteristics Choose the correct match below and submit your answer
High and Low values are eguallv likely - Normal Distribution More accyrate when MTBF measurements are ysed - Uniform Distribution Wide range o f dis tribu tion shapes with potentjally large tails - Beta Distribu tion Parameters are difficult to determine use PERI approximation - Triangular Distribution
~ High and Low values are equally likely - Uniform Distribu tion More accyrate when MTBF measuremen ts are used - Normal Distribution Wide range of dis tribu tion shapes with potentjaly large tails - Triangular Distribution Parameters are difficult t o determine use PERT approximation - Beta Distribution
Check Answ er
The answer is High a nd Low values are equally likely - Uniform Dist ri but ion More accurat e when MTBF measurement s are used - Normal Dist ribut ion Wid e range o f d ist ri but ion s hapes wit h pot ent ially large t ails - Triangular Dist ribut ion and Param et e rs are difficult t o de t ermine use PERT a pproximat ion - Bet a Dist ri but ion
I Pope 22 of 2S I Back Next
CLB024 Introduction to Cost Risk Analysis Lesson 5 - Cost as a Probability Distribution TOC I RESOURCES I PRINT I HELP
Summary
To complete a Cost Risk Analysis
bull Identify a Probability Density Function for each uncertain element in the cost estimate
bull Combine the element uncertainties into a Total Cost PDF
There are two mathematical approaches
bull Symmetric Approximation (Summation o f Moments )
bull Monte Carlo Simulation
Uniform Distribution - High and Low values are equally likely
bull Used when there is no likelihood information
Triangular Distribu t ion - Includes all three parameters high low and most likely v alue
bull Tails can be heavy or fat
Normal Distribu ti on - Bell Curve
bull Symmetrical on both sides o f the mean
bull ReqLiires mean and standard deviation
I Pope 23 of 2S I Back Next
CLB024 Introduction t o Cost Risk Analysis Lesson 5- Cost as a Probability Distribution TOC I RESO URCES I PRINT I HELP
Summary Cont
Beta Dist rib ut io n - can take on many possible shapes
bull Requires a and ~
bull Assume PERT Beta use low most likely and high estimates
Table o f Algori thms for calculating means and variances for four distribu tions
Distribution Mean Variance
ll=(a + b) 02 =(b - al2 Uniform
2 12
ll = la+c+b) 02= a 2 + b2+ c2-ab - ac - be) Triangular 3 18
o 2 b - a)2
Normal ll = C 36
ll=a + 4c + b) o2 b - a)2 Beta
6 36 I
Q
~ I Page24of 25 I Back Next
Long Description
Table of Algorithms for each distribution shape
Distribution Uniform Mean μ = (a + b) 2 Variance σ2 = (b-a)2 12
Distribution Triangular Mean μ = (a + c + b) 3 Variance σ2 = (a2 + b2 + c2 - ab - ac - bc) 18
Distribution Normal Mean μ = c Variance σ2 = (b - a)2 36
Distribution Beta Mean μ = (a + 4c + b) 6 Variance σ2 = (b - a )2 36
CLB024 Introduction to Cost Risk Analysis Lesson 5 - Cost as a Probability Distribution TOC I RESOURCES I PRINT I HELP
Lesson Completion
You have comple ted the content for this lesson
To continue selec t ano ther lesson from the Table o f Con ten ts on the le ft
If you have closed or hidden the Table of Conten ts click the Show TOC button at the top in the Atlas navigation bar
I Poobull 25 of 25 I Back Next

CLB024 Introduction to Cost Risk Analysis Lesson 5 - Cost as a Probability Distribution TOC I RESOURCES I PRINT I HELP
Normal Algor ithms
Normal Distribution - Calculating mean and variance
~ 0 2 where c approximates the mean of the normal where a = min value ( low) distribution b = max value (high)
~ = mean (average) c = most likely value
Variance = a Average (mean ) ~ = c
~ = 125 a = (Jla)l 36
a= (180-70~ 36
a= ( 110 )l
36 a= 12100
36 a= 33611
I Pope 15 of 25 I Back Next
Long Description
Normal Distribution - Calculating mean and variance
μ
where c approximates the mean of the normal distribution (high)
c = most likely value
Average (mean) μ = c μ = 125
σ 2
where a = min value (low) b = max value
μ = mean (average)
Variance = σ2
σ 2 = (b - a)2
36
σ 2 = (180 - 70)2
36
σ 2 = (110)2
36
σ 2 = 12100 36
σ 2 = 33611
CLB024 Introduction to Cost Risk Analysis Lesson 5 - Cost as a Probability Distribution TOC I RESOURCES I PRINT I HELP
Beta Model
Bet a Distribu tion
bull Beta shapes are determined by a and 13 parameters - which are difficult to determine
bull Use low most likely and high estimates
Selec t the next button to view the algori thms for a Be ta Distribu tion
Beta Distribution
I Pope 18 of 2S I Back Next
CLB024 Introduction to Cost Risk Analysis Lesson 5 - Cost as a Probability Distribution TOC I RESOURCES I PRINT I HELP
Beta Algor ithms
Beta (Pert Distribution - Calculating mean and variance
where a min value (low) b max value (high) c most likely value 11 bull mean (average) and a variance
tl Average (mean) cost = Variance a 0
(low + 4(rnost II ely + hlgh)6 a c Lbal0 36
11 = (aplusmn4cplusmnb) a 0 (180-70)2 6 36
11 = (70 plusmn 4(1 00) plusmn 80) 6 a = UlU
36
a a 12100 36
II = 125 a c 33611
o c
Q
I Pope 17 of 2S I Back Next
Long Description
Calculating mean and standard deviation
where a = min value (cost) b = maximum value (cost) c = mode (most likely cost) μ = mean and σ sup2 = variance
micro Average (mean) cost = (low + 4(most likely) + high)6 micro = (a + 4c + b)
6 micro = (70 + 4(125) + 180)
6
micro = 750 6
micro = 125
σ2
Variance = σ2
σ2 = (b - a)2
36 σ2 = (180 - 70)2
36
σ2 = (110)2
36 σ2 = 12100
36 σ2 = 33611
CLB024 Introduction t o Cost Risk Analysis Lesson 5- Cost as a Probability Distribution TOC I RESO URCES I PRINT I HELP
Symmet ric Approxi mation
The second step in developing a to tal cost distribu tion is to combine all the iden ti fied risks and their associated ranges in to a single distribu tion One technique is Symmetric Approximatio n
Symmetric Approximation is also known as the Summatio n of Moments PDFs have four momen ts 1st shyMean 2nd - Variance 3rd - Coe ffic ien t o f Skewness (symmetry ) and 4 th - Coe ffic ien t o f Kurtosis (heigh t )
Data o f the Symmetric Approximation method is placed in a linear table o f calculations Work Breakdown Struc ture cost elemen ts are listed with their distribu tion type mean and variance The means and variances are summed ( the summation o f momen ts ) which describe an approximate normal distribu tion Probabili ty statemen ts can then be made concerning funding levels This procedure assumes that all summed elemen ts are independen t o f each o ther This will no t normally be the case and addit ional techniques must be used to de termine the impac t o f dependence among elemen ts This calculation is beyond the scope o f this module
Click here to view an example
~ I Page 18 of 25 I Back Next
Popup Text
Uncertainty Analysis by Symmetric Approximation Example
CLB024 Introduction to Cost Risk Analysis Lesson 5- Cost as a Probability Distribution TOC I RESOURCES I PRINT 1HELP
Monte Carlo Simulation
A distribution is de fined for each cost element from which a random sample is drawn The samples from each cost elements distribution are summed to a to tal cost This sampling and summing process is repeated many times (eg 1000- 10000 times) The result is a distribution representing the to tal cost o f the system with all described uncertainties taken into account The distribution can be displayed by a cumulative probabili ty distribution
Iterations in Monte Carlo Simulation
Rot~~
_ l4_-RbullU~ OA TCoot 12tu middot 182clamp bull sa-12 Ul
I $l4SU
12511t $4501t $562
Maiefllll bull~- - -+ I I I
1000 bull=o7----J
~
bull
-ld ~toe lL_ _ ampft 10
no~us Do~~W -~
~ I Pa ge 19 of 25 I Back Next
CLB024 Introduction to Cost Risk Analysis Lesson 5 - Cost as a Probability Distribution TOC I RESOURCES I PRINT I HELP
Knowledge Review
Which input would not affect cost
Award fees
Composition o f materials
System weight
~ None of the above
Any o f t he input s would affect cost
Muttlple Probability Distribution centol(
)______ ~
M~ L---~ --~-
L ----+00 _
tlllimoling Rotnliommipa
I Pope 20 of 2S I Back Next
CLB024 Introduction to Cost Risk Analysis Lesson 5- Cost as a Probability Distribution TOC I RESOURCES I PRINT 1HELP
Knowledge Review
A distribu t ion represen ting a systems to tal cost wi th uncer tain t ies inc luded is the sum o f many indiv idual cost elemen t distribu t ions
~ True Iterations in Monte Carlo Simulation _ --~_~
1bull111nbull $C bull Mlt10 middot- -bull --False rshybull=- middot u-middot~-middot 1 - middot~ - r-+ J
bull -shy- _ shy I - --~- bull bull bull bull bull bullmiddot~ --lA~ -
Check Answer
T he answer is True T his is the de fini t ion o f the to tal system cost distribu t ion
~ I Page 21 of 25 I Back Next
CLB024 Introduction to Cost Risk Analysis Lesson 5 - Cost as a Probability Distribution TOC I RESOURCES I PRINT I HELP
Know ledge Review
Each probability distribution has distinct characteristics Choose the correct match below and submit your answer
High and Low values are eguallv likely - Normal Distribution More accyrate when MTBF measurements are ysed - Uniform Distribution Wide range o f dis tribu tion shapes with potentjally large tails - Beta Distribu tion Parameters are difficult to determine use PERI approximation - Triangular Distribution
~ High and Low values are equally likely - Uniform Distribu tion More accyrate when MTBF measuremen ts are used - Normal Distribution Wide range of dis tribu tion shapes with potentjaly large tails - Triangular Distribution Parameters are difficult t o determine use PERT approximation - Beta Distribution
Check Answ er
The answer is High a nd Low values are equally likely - Uniform Dist ri but ion More accurat e when MTBF measurement s are used - Normal Dist ribut ion Wid e range o f d ist ri but ion s hapes wit h pot ent ially large t ails - Triangular Dist ribut ion and Param et e rs are difficult t o de t ermine use PERT a pproximat ion - Bet a Dist ri but ion
I Pope 22 of 2S I Back Next
CLB024 Introduction to Cost Risk Analysis Lesson 5 - Cost as a Probability Distribution TOC I RESOURCES I PRINT I HELP
Summary
To complete a Cost Risk Analysis
bull Identify a Probability Density Function for each uncertain element in the cost estimate
bull Combine the element uncertainties into a Total Cost PDF
There are two mathematical approaches
bull Symmetric Approximation (Summation o f Moments )
bull Monte Carlo Simulation
Uniform Distribution - High and Low values are equally likely
bull Used when there is no likelihood information
Triangular Distribu t ion - Includes all three parameters high low and most likely v alue
bull Tails can be heavy or fat
Normal Distribu ti on - Bell Curve
bull Symmetrical on both sides o f the mean
bull ReqLiires mean and standard deviation
I Pope 23 of 2S I Back Next
CLB024 Introduction t o Cost Risk Analysis Lesson 5- Cost as a Probability Distribution TOC I RESO URCES I PRINT I HELP
Summary Cont
Beta Dist rib ut io n - can take on many possible shapes
bull Requires a and ~
bull Assume PERT Beta use low most likely and high estimates
Table o f Algori thms for calculating means and variances for four distribu tions
Distribution Mean Variance
ll=(a + b) 02 =(b - al2 Uniform
2 12
ll = la+c+b) 02= a 2 + b2+ c2-ab - ac - be) Triangular 3 18
o 2 b - a)2
Normal ll = C 36
ll=a + 4c + b) o2 b - a)2 Beta
6 36 I
Q
~ I Page24of 25 I Back Next
Long Description
Table of Algorithms for each distribution shape
Distribution Uniform Mean μ = (a + b) 2 Variance σ2 = (b-a)2 12
Distribution Triangular Mean μ = (a + c + b) 3 Variance σ2 = (a2 + b2 + c2 - ab - ac - bc) 18
Distribution Normal Mean μ = c Variance σ2 = (b - a)2 36
Distribution Beta Mean μ = (a + 4c + b) 6 Variance σ2 = (b - a )2 36
CLB024 Introduction to Cost Risk Analysis Lesson 5 - Cost as a Probability Distribution TOC I RESOURCES I PRINT I HELP
Lesson Completion
You have comple ted the content for this lesson
To continue selec t ano ther lesson from the Table o f Con ten ts on the le ft
If you have closed or hidden the Table of Conten ts click the Show TOC button at the top in the Atlas navigation bar
I Poobull 25 of 25 I Back Next
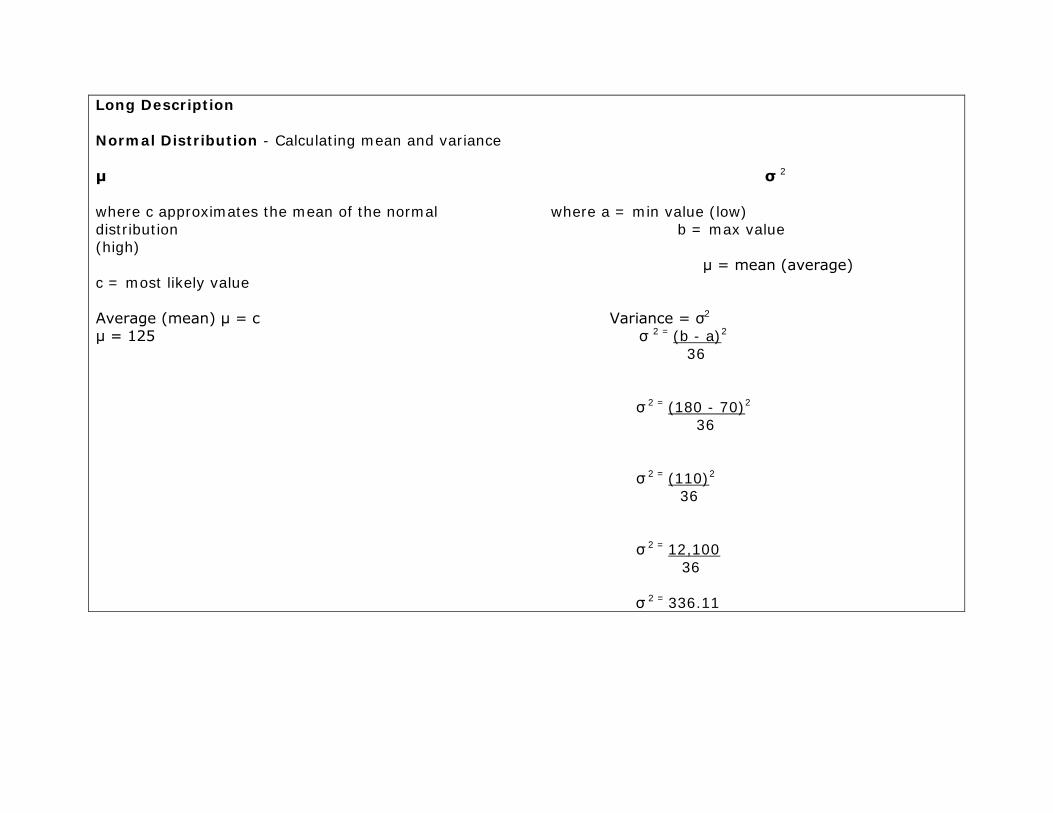
Long Description
Normal Distribution - Calculating mean and variance
μ
where c approximates the mean of the normal distribution (high)
c = most likely value
Average (mean) μ = c μ = 125
σ 2
where a = min value (low) b = max value
μ = mean (average)
Variance = σ2
σ 2 = (b - a)2
36
σ 2 = (180 - 70)2
36
σ 2 = (110)2
36
σ 2 = 12100 36
σ 2 = 33611
CLB024 Introduction to Cost Risk Analysis Lesson 5 - Cost as a Probability Distribution TOC I RESOURCES I PRINT I HELP
Beta Model
Bet a Distribu tion
bull Beta shapes are determined by a and 13 parameters - which are difficult to determine
bull Use low most likely and high estimates
Selec t the next button to view the algori thms for a Be ta Distribu tion
Beta Distribution
I Pope 18 of 2S I Back Next
CLB024 Introduction to Cost Risk Analysis Lesson 5 - Cost as a Probability Distribution TOC I RESOURCES I PRINT I HELP
Beta Algor ithms
Beta (Pert Distribution - Calculating mean and variance
where a min value (low) b max value (high) c most likely value 11 bull mean (average) and a variance
tl Average (mean) cost = Variance a 0
(low + 4(rnost II ely + hlgh)6 a c Lbal0 36
11 = (aplusmn4cplusmnb) a 0 (180-70)2 6 36
11 = (70 plusmn 4(1 00) plusmn 80) 6 a = UlU
36
a a 12100 36
II = 125 a c 33611
o c
Q
I Pope 17 of 2S I Back Next
Long Description
Calculating mean and standard deviation
where a = min value (cost) b = maximum value (cost) c = mode (most likely cost) μ = mean and σ sup2 = variance
micro Average (mean) cost = (low + 4(most likely) + high)6 micro = (a + 4c + b)
6 micro = (70 + 4(125) + 180)
6
micro = 750 6
micro = 125
σ2
Variance = σ2
σ2 = (b - a)2
36 σ2 = (180 - 70)2
36
σ2 = (110)2
36 σ2 = 12100
36 σ2 = 33611
CLB024 Introduction t o Cost Risk Analysis Lesson 5- Cost as a Probability Distribution TOC I RESO URCES I PRINT I HELP
Symmet ric Approxi mation
The second step in developing a to tal cost distribu tion is to combine all the iden ti fied risks and their associated ranges in to a single distribu tion One technique is Symmetric Approximatio n
Symmetric Approximation is also known as the Summatio n of Moments PDFs have four momen ts 1st shyMean 2nd - Variance 3rd - Coe ffic ien t o f Skewness (symmetry ) and 4 th - Coe ffic ien t o f Kurtosis (heigh t )
Data o f the Symmetric Approximation method is placed in a linear table o f calculations Work Breakdown Struc ture cost elemen ts are listed with their distribu tion type mean and variance The means and variances are summed ( the summation o f momen ts ) which describe an approximate normal distribu tion Probabili ty statemen ts can then be made concerning funding levels This procedure assumes that all summed elemen ts are independen t o f each o ther This will no t normally be the case and addit ional techniques must be used to de termine the impac t o f dependence among elemen ts This calculation is beyond the scope o f this module
Click here to view an example
~ I Page 18 of 25 I Back Next
Popup Text
Uncertainty Analysis by Symmetric Approximation Example
CLB024 Introduction to Cost Risk Analysis Lesson 5- Cost as a Probability Distribution TOC I RESOURCES I PRINT 1HELP
Monte Carlo Simulation
A distribution is de fined for each cost element from which a random sample is drawn The samples from each cost elements distribution are summed to a to tal cost This sampling and summing process is repeated many times (eg 1000- 10000 times) The result is a distribution representing the to tal cost o f the system with all described uncertainties taken into account The distribution can be displayed by a cumulative probabili ty distribution
Iterations in Monte Carlo Simulation
Rot~~
_ l4_-RbullU~ OA TCoot 12tu middot 182clamp bull sa-12 Ul
I $l4SU
12511t $4501t $562
Maiefllll bull~- - -+ I I I
1000 bull=o7----J
~
bull
-ld ~toe lL_ _ ampft 10
no~us Do~~W -~
~ I Pa ge 19 of 25 I Back Next
CLB024 Introduction to Cost Risk Analysis Lesson 5 - Cost as a Probability Distribution TOC I RESOURCES I PRINT I HELP
Knowledge Review
Which input would not affect cost
Award fees
Composition o f materials
System weight
~ None of the above
Any o f t he input s would affect cost
Muttlple Probability Distribution centol(
)______ ~
M~ L---~ --~-
L ----+00 _
tlllimoling Rotnliommipa
I Pope 20 of 2S I Back Next
CLB024 Introduction to Cost Risk Analysis Lesson 5- Cost as a Probability Distribution TOC I RESOURCES I PRINT 1HELP
Knowledge Review
A distribu t ion represen ting a systems to tal cost wi th uncer tain t ies inc luded is the sum o f many indiv idual cost elemen t distribu t ions
~ True Iterations in Monte Carlo Simulation _ --~_~
1bull111nbull $C bull Mlt10 middot- -bull --False rshybull=- middot u-middot~-middot 1 - middot~ - r-+ J
bull -shy- _ shy I - --~- bull bull bull bull bull bullmiddot~ --lA~ -
Check Answer
T he answer is True T his is the de fini t ion o f the to tal system cost distribu t ion
~ I Page 21 of 25 I Back Next
CLB024 Introduction to Cost Risk Analysis Lesson 5 - Cost as a Probability Distribution TOC I RESOURCES I PRINT I HELP
Know ledge Review
Each probability distribution has distinct characteristics Choose the correct match below and submit your answer
High and Low values are eguallv likely - Normal Distribution More accyrate when MTBF measurements are ysed - Uniform Distribution Wide range o f dis tribu tion shapes with potentjally large tails - Beta Distribu tion Parameters are difficult to determine use PERI approximation - Triangular Distribution
~ High and Low values are equally likely - Uniform Distribu tion More accyrate when MTBF measuremen ts are used - Normal Distribution Wide range of dis tribu tion shapes with potentjaly large tails - Triangular Distribution Parameters are difficult t o determine use PERT approximation - Beta Distribution
Check Answ er
The answer is High a nd Low values are equally likely - Uniform Dist ri but ion More accurat e when MTBF measurement s are used - Normal Dist ribut ion Wid e range o f d ist ri but ion s hapes wit h pot ent ially large t ails - Triangular Dist ribut ion and Param et e rs are difficult t o de t ermine use PERT a pproximat ion - Bet a Dist ri but ion
I Pope 22 of 2S I Back Next
CLB024 Introduction to Cost Risk Analysis Lesson 5 - Cost as a Probability Distribution TOC I RESOURCES I PRINT I HELP
Summary
To complete a Cost Risk Analysis
bull Identify a Probability Density Function for each uncertain element in the cost estimate
bull Combine the element uncertainties into a Total Cost PDF
There are two mathematical approaches
bull Symmetric Approximation (Summation o f Moments )
bull Monte Carlo Simulation
Uniform Distribution - High and Low values are equally likely
bull Used when there is no likelihood information
Triangular Distribu t ion - Includes all three parameters high low and most likely v alue
bull Tails can be heavy or fat
Normal Distribu ti on - Bell Curve
bull Symmetrical on both sides o f the mean
bull ReqLiires mean and standard deviation
I Pope 23 of 2S I Back Next
CLB024 Introduction t o Cost Risk Analysis Lesson 5- Cost as a Probability Distribution TOC I RESO URCES I PRINT I HELP
Summary Cont
Beta Dist rib ut io n - can take on many possible shapes
bull Requires a and ~
bull Assume PERT Beta use low most likely and high estimates
Table o f Algori thms for calculating means and variances for four distribu tions
Distribution Mean Variance
ll=(a + b) 02 =(b - al2 Uniform
2 12
ll = la+c+b) 02= a 2 + b2+ c2-ab - ac - be) Triangular 3 18
o 2 b - a)2
Normal ll = C 36
ll=a + 4c + b) o2 b - a)2 Beta
6 36 I
Q
~ I Page24of 25 I Back Next
Long Description
Table of Algorithms for each distribution shape
Distribution Uniform Mean μ = (a + b) 2 Variance σ2 = (b-a)2 12
Distribution Triangular Mean μ = (a + c + b) 3 Variance σ2 = (a2 + b2 + c2 - ab - ac - bc) 18
Distribution Normal Mean μ = c Variance σ2 = (b - a)2 36
Distribution Beta Mean μ = (a + 4c + b) 6 Variance σ2 = (b - a )2 36
CLB024 Introduction to Cost Risk Analysis Lesson 5 - Cost as a Probability Distribution TOC I RESOURCES I PRINT I HELP
Lesson Completion
You have comple ted the content for this lesson
To continue selec t ano ther lesson from the Table o f Con ten ts on the le ft
If you have closed or hidden the Table of Conten ts click the Show TOC button at the top in the Atlas navigation bar
I Poobull 25 of 25 I Back Next

CLB024 Introduction to Cost Risk Analysis Lesson 5 - Cost as a Probability Distribution TOC I RESOURCES I PRINT I HELP
Beta Algor ithms
Beta (Pert Distribution - Calculating mean and variance
where a min value (low) b max value (high) c most likely value 11 bull mean (average) and a variance
tl Average (mean) cost = Variance a 0
(low + 4(rnost II ely + hlgh)6 a c Lbal0 36
11 = (aplusmn4cplusmnb) a 0 (180-70)2 6 36
11 = (70 plusmn 4(1 00) plusmn 80) 6 a = UlU
36
a a 12100 36
II = 125 a c 33611
o c
Q
I Pope 17 of 2S I Back Next
Long Description
Calculating mean and standard deviation
where a = min value (cost) b = maximum value (cost) c = mode (most likely cost) μ = mean and σ sup2 = variance
micro Average (mean) cost = (low + 4(most likely) + high)6 micro = (a + 4c + b)
6 micro = (70 + 4(125) + 180)
6
micro = 750 6
micro = 125
σ2
Variance = σ2
σ2 = (b - a)2
36 σ2 = (180 - 70)2
36
σ2 = (110)2
36 σ2 = 12100
36 σ2 = 33611
CLB024 Introduction t o Cost Risk Analysis Lesson 5- Cost as a Probability Distribution TOC I RESO URCES I PRINT I HELP
Symmet ric Approxi mation
The second step in developing a to tal cost distribu tion is to combine all the iden ti fied risks and their associated ranges in to a single distribu tion One technique is Symmetric Approximatio n
Symmetric Approximation is also known as the Summatio n of Moments PDFs have four momen ts 1st shyMean 2nd - Variance 3rd - Coe ffic ien t o f Skewness (symmetry ) and 4 th - Coe ffic ien t o f Kurtosis (heigh t )
Data o f the Symmetric Approximation method is placed in a linear table o f calculations Work Breakdown Struc ture cost elemen ts are listed with their distribu tion type mean and variance The means and variances are summed ( the summation o f momen ts ) which describe an approximate normal distribu tion Probabili ty statemen ts can then be made concerning funding levels This procedure assumes that all summed elemen ts are independen t o f each o ther This will no t normally be the case and addit ional techniques must be used to de termine the impac t o f dependence among elemen ts This calculation is beyond the scope o f this module
Click here to view an example
~ I Page 18 of 25 I Back Next
Popup Text
Uncertainty Analysis by Symmetric Approximation Example
CLB024 Introduction to Cost Risk Analysis Lesson 5- Cost as a Probability Distribution TOC I RESOURCES I PRINT 1HELP
Monte Carlo Simulation
A distribution is de fined for each cost element from which a random sample is drawn The samples from each cost elements distribution are summed to a to tal cost This sampling and summing process is repeated many times (eg 1000- 10000 times) The result is a distribution representing the to tal cost o f the system with all described uncertainties taken into account The distribution can be displayed by a cumulative probabili ty distribution
Iterations in Monte Carlo Simulation
Rot~~
_ l4_-RbullU~ OA TCoot 12tu middot 182clamp bull sa-12 Ul
I $l4SU
12511t $4501t $562
Maiefllll bull~- - -+ I I I
1000 bull=o7----J
~
bull
-ld ~toe lL_ _ ampft 10
no~us Do~~W -~
~ I Pa ge 19 of 25 I Back Next
CLB024 Introduction to Cost Risk Analysis Lesson 5 - Cost as a Probability Distribution TOC I RESOURCES I PRINT I HELP
Knowledge Review
Which input would not affect cost
Award fees
Composition o f materials
System weight
~ None of the above
Any o f t he input s would affect cost
Muttlple Probability Distribution centol(
)______ ~
M~ L---~ --~-
L ----+00 _
tlllimoling Rotnliommipa
I Pope 20 of 2S I Back Next
CLB024 Introduction to Cost Risk Analysis Lesson 5- Cost as a Probability Distribution TOC I RESOURCES I PRINT 1HELP
Knowledge Review
A distribu t ion represen ting a systems to tal cost wi th uncer tain t ies inc luded is the sum o f many indiv idual cost elemen t distribu t ions
~ True Iterations in Monte Carlo Simulation _ --~_~
1bull111nbull $C bull Mlt10 middot- -bull --False rshybull=- middot u-middot~-middot 1 - middot~ - r-+ J
bull -shy- _ shy I - --~- bull bull bull bull bull bullmiddot~ --lA~ -
Check Answer
T he answer is True T his is the de fini t ion o f the to tal system cost distribu t ion
~ I Page 21 of 25 I Back Next
CLB024 Introduction to Cost Risk Analysis Lesson 5 - Cost as a Probability Distribution TOC I RESOURCES I PRINT I HELP
Know ledge Review
Each probability distribution has distinct characteristics Choose the correct match below and submit your answer
High and Low values are eguallv likely - Normal Distribution More accyrate when MTBF measurements are ysed - Uniform Distribution Wide range o f dis tribu tion shapes with potentjally large tails - Beta Distribu tion Parameters are difficult to determine use PERI approximation - Triangular Distribution
~ High and Low values are equally likely - Uniform Distribu tion More accyrate when MTBF measuremen ts are used - Normal Distribution Wide range of dis tribu tion shapes with potentjaly large tails - Triangular Distribution Parameters are difficult t o determine use PERT approximation - Beta Distribution
Check Answ er
The answer is High a nd Low values are equally likely - Uniform Dist ri but ion More accurat e when MTBF measurement s are used - Normal Dist ribut ion Wid e range o f d ist ri but ion s hapes wit h pot ent ially large t ails - Triangular Dist ribut ion and Param et e rs are difficult t o de t ermine use PERT a pproximat ion - Bet a Dist ri but ion
I Pope 22 of 2S I Back Next
CLB024 Introduction to Cost Risk Analysis Lesson 5 - Cost as a Probability Distribution TOC I RESOURCES I PRINT I HELP
Summary
To complete a Cost Risk Analysis
bull Identify a Probability Density Function for each uncertain element in the cost estimate
bull Combine the element uncertainties into a Total Cost PDF
There are two mathematical approaches
bull Symmetric Approximation (Summation o f Moments )
bull Monte Carlo Simulation
Uniform Distribution - High and Low values are equally likely
bull Used when there is no likelihood information
Triangular Distribu t ion - Includes all three parameters high low and most likely v alue
bull Tails can be heavy or fat
Normal Distribu ti on - Bell Curve
bull Symmetrical on both sides o f the mean
bull ReqLiires mean and standard deviation
I Pope 23 of 2S I Back Next
CLB024 Introduction t o Cost Risk Analysis Lesson 5- Cost as a Probability Distribution TOC I RESO URCES I PRINT I HELP
Summary Cont
Beta Dist rib ut io n - can take on many possible shapes
bull Requires a and ~
bull Assume PERT Beta use low most likely and high estimates
Table o f Algori thms for calculating means and variances for four distribu tions
Distribution Mean Variance
ll=(a + b) 02 =(b - al2 Uniform
2 12
ll = la+c+b) 02= a 2 + b2+ c2-ab - ac - be) Triangular 3 18
o 2 b - a)2
Normal ll = C 36
ll=a + 4c + b) o2 b - a)2 Beta
6 36 I
Q
~ I Page24of 25 I Back Next
Long Description
Table of Algorithms for each distribution shape
Distribution Uniform Mean μ = (a + b) 2 Variance σ2 = (b-a)2 12
Distribution Triangular Mean μ = (a + c + b) 3 Variance σ2 = (a2 + b2 + c2 - ab - ac - bc) 18
Distribution Normal Mean μ = c Variance σ2 = (b - a)2 36
Distribution Beta Mean μ = (a + 4c + b) 6 Variance σ2 = (b - a )2 36
CLB024 Introduction to Cost Risk Analysis Lesson 5 - Cost as a Probability Distribution TOC I RESOURCES I PRINT I HELP
Lesson Completion
You have comple ted the content for this lesson
To continue selec t ano ther lesson from the Table o f Con ten ts on the le ft
If you have closed or hidden the Table of Conten ts click the Show TOC button at the top in the Atlas navigation bar
I Poobull 25 of 25 I Back Next

Long Description
Calculating mean and standard deviation
where a = min value (cost) b = maximum value (cost) c = mode (most likely cost) μ = mean and σ sup2 = variance
micro Average (mean) cost = (low + 4(most likely) + high)6 micro = (a + 4c + b)
6 micro = (70 + 4(125) + 180)
6
micro = 750 6
micro = 125
σ2
Variance = σ2
σ2 = (b - a)2
36 σ2 = (180 - 70)2
36
σ2 = (110)2
36 σ2 = 12100
36 σ2 = 33611
CLB024 Introduction t o Cost Risk Analysis Lesson 5- Cost as a Probability Distribution TOC I RESO URCES I PRINT I HELP
Symmet ric Approxi mation
The second step in developing a to tal cost distribu tion is to combine all the iden ti fied risks and their associated ranges in to a single distribu tion One technique is Symmetric Approximatio n
Symmetric Approximation is also known as the Summatio n of Moments PDFs have four momen ts 1st shyMean 2nd - Variance 3rd - Coe ffic ien t o f Skewness (symmetry ) and 4 th - Coe ffic ien t o f Kurtosis (heigh t )
Data o f the Symmetric Approximation method is placed in a linear table o f calculations Work Breakdown Struc ture cost elemen ts are listed with their distribu tion type mean and variance The means and variances are summed ( the summation o f momen ts ) which describe an approximate normal distribu tion Probabili ty statemen ts can then be made concerning funding levels This procedure assumes that all summed elemen ts are independen t o f each o ther This will no t normally be the case and addit ional techniques must be used to de termine the impac t o f dependence among elemen ts This calculation is beyond the scope o f this module
Click here to view an example
~ I Page 18 of 25 I Back Next
Popup Text
Uncertainty Analysis by Symmetric Approximation Example
CLB024 Introduction to Cost Risk Analysis Lesson 5- Cost as a Probability Distribution TOC I RESOURCES I PRINT 1HELP
Monte Carlo Simulation
A distribution is de fined for each cost element from which a random sample is drawn The samples from each cost elements distribution are summed to a to tal cost This sampling and summing process is repeated many times (eg 1000- 10000 times) The result is a distribution representing the to tal cost o f the system with all described uncertainties taken into account The distribution can be displayed by a cumulative probabili ty distribution
Iterations in Monte Carlo Simulation
Rot~~
_ l4_-RbullU~ OA TCoot 12tu middot 182clamp bull sa-12 Ul
I $l4SU
12511t $4501t $562
Maiefllll bull~- - -+ I I I
1000 bull=o7----J
~
bull
-ld ~toe lL_ _ ampft 10
no~us Do~~W -~
~ I Pa ge 19 of 25 I Back Next
CLB024 Introduction to Cost Risk Analysis Lesson 5 - Cost as a Probability Distribution TOC I RESOURCES I PRINT I HELP
Knowledge Review
Which input would not affect cost
Award fees
Composition o f materials
System weight
~ None of the above
Any o f t he input s would affect cost
Muttlple Probability Distribution centol(
)______ ~
M~ L---~ --~-
L ----+00 _
tlllimoling Rotnliommipa
I Pope 20 of 2S I Back Next
CLB024 Introduction to Cost Risk Analysis Lesson 5- Cost as a Probability Distribution TOC I RESOURCES I PRINT 1HELP
Knowledge Review
A distribu t ion represen ting a systems to tal cost wi th uncer tain t ies inc luded is the sum o f many indiv idual cost elemen t distribu t ions
~ True Iterations in Monte Carlo Simulation _ --~_~
1bull111nbull $C bull Mlt10 middot- -bull --False rshybull=- middot u-middot~-middot 1 - middot~ - r-+ J
bull -shy- _ shy I - --~- bull bull bull bull bull bullmiddot~ --lA~ -
Check Answer
T he answer is True T his is the de fini t ion o f the to tal system cost distribu t ion
~ I Page 21 of 25 I Back Next
CLB024 Introduction to Cost Risk Analysis Lesson 5 - Cost as a Probability Distribution TOC I RESOURCES I PRINT I HELP
Know ledge Review
Each probability distribution has distinct characteristics Choose the correct match below and submit your answer
High and Low values are eguallv likely - Normal Distribution More accyrate when MTBF measurements are ysed - Uniform Distribution Wide range o f dis tribu tion shapes with potentjally large tails - Beta Distribu tion Parameters are difficult to determine use PERI approximation - Triangular Distribution
~ High and Low values are equally likely - Uniform Distribu tion More accyrate when MTBF measuremen ts are used - Normal Distribution Wide range of dis tribu tion shapes with potentjaly large tails - Triangular Distribution Parameters are difficult t o determine use PERT approximation - Beta Distribution
Check Answ er
The answer is High a nd Low values are equally likely - Uniform Dist ri but ion More accurat e when MTBF measurement s are used - Normal Dist ribut ion Wid e range o f d ist ri but ion s hapes wit h pot ent ially large t ails - Triangular Dist ribut ion and Param et e rs are difficult t o de t ermine use PERT a pproximat ion - Bet a Dist ri but ion
I Pope 22 of 2S I Back Next
CLB024 Introduction to Cost Risk Analysis Lesson 5 - Cost as a Probability Distribution TOC I RESOURCES I PRINT I HELP
Summary
To complete a Cost Risk Analysis
bull Identify a Probability Density Function for each uncertain element in the cost estimate
bull Combine the element uncertainties into a Total Cost PDF
There are two mathematical approaches
bull Symmetric Approximation (Summation o f Moments )
bull Monte Carlo Simulation
Uniform Distribution - High and Low values are equally likely
bull Used when there is no likelihood information
Triangular Distribu t ion - Includes all three parameters high low and most likely v alue
bull Tails can be heavy or fat
Normal Distribu ti on - Bell Curve
bull Symmetrical on both sides o f the mean
bull ReqLiires mean and standard deviation
I Pope 23 of 2S I Back Next
CLB024 Introduction t o Cost Risk Analysis Lesson 5- Cost as a Probability Distribution TOC I RESO URCES I PRINT I HELP
Summary Cont
Beta Dist rib ut io n - can take on many possible shapes
bull Requires a and ~
bull Assume PERT Beta use low most likely and high estimates
Table o f Algori thms for calculating means and variances for four distribu tions
Distribution Mean Variance
ll=(a + b) 02 =(b - al2 Uniform
2 12
ll = la+c+b) 02= a 2 + b2+ c2-ab - ac - be) Triangular 3 18
o 2 b - a)2
Normal ll = C 36
ll=a + 4c + b) o2 b - a)2 Beta
6 36 I
Q
~ I Page24of 25 I Back Next
Long Description
Table of Algorithms for each distribution shape
Distribution Uniform Mean μ = (a + b) 2 Variance σ2 = (b-a)2 12
Distribution Triangular Mean μ = (a + c + b) 3 Variance σ2 = (a2 + b2 + c2 - ab - ac - bc) 18
Distribution Normal Mean μ = c Variance σ2 = (b - a)2 36
Distribution Beta Mean μ = (a + 4c + b) 6 Variance σ2 = (b - a )2 36
CLB024 Introduction to Cost Risk Analysis Lesson 5 - Cost as a Probability Distribution TOC I RESOURCES I PRINT I HELP
Lesson Completion
You have comple ted the content for this lesson
To continue selec t ano ther lesson from the Table o f Con ten ts on the le ft
If you have closed or hidden the Table of Conten ts click the Show TOC button at the top in the Atlas navigation bar
I Poobull 25 of 25 I Back Next

CLB024 Introduction t o Cost Risk Analysis Lesson 5- Cost as a Probability Distribution TOC I RESO URCES I PRINT I HELP
Symmet ric Approxi mation
The second step in developing a to tal cost distribu tion is to combine all the iden ti fied risks and their associated ranges in to a single distribu tion One technique is Symmetric Approximatio n
Symmetric Approximation is also known as the Summatio n of Moments PDFs have four momen ts 1st shyMean 2nd - Variance 3rd - Coe ffic ien t o f Skewness (symmetry ) and 4 th - Coe ffic ien t o f Kurtosis (heigh t )
Data o f the Symmetric Approximation method is placed in a linear table o f calculations Work Breakdown Struc ture cost elemen ts are listed with their distribu tion type mean and variance The means and variances are summed ( the summation o f momen ts ) which describe an approximate normal distribu tion Probabili ty statemen ts can then be made concerning funding levels This procedure assumes that all summed elemen ts are independen t o f each o ther This will no t normally be the case and addit ional techniques must be used to de termine the impac t o f dependence among elemen ts This calculation is beyond the scope o f this module
Click here to view an example
~ I Page 18 of 25 I Back Next
Popup Text
Uncertainty Analysis by Symmetric Approximation Example
CLB024 Introduction to Cost Risk Analysis Lesson 5- Cost as a Probability Distribution TOC I RESOURCES I PRINT 1HELP
Monte Carlo Simulation
A distribution is de fined for each cost element from which a random sample is drawn The samples from each cost elements distribution are summed to a to tal cost This sampling and summing process is repeated many times (eg 1000- 10000 times) The result is a distribution representing the to tal cost o f the system with all described uncertainties taken into account The distribution can be displayed by a cumulative probabili ty distribution
Iterations in Monte Carlo Simulation
Rot~~
_ l4_-RbullU~ OA TCoot 12tu middot 182clamp bull sa-12 Ul
I $l4SU
12511t $4501t $562
Maiefllll bull~- - -+ I I I
1000 bull=o7----J
~
bull
-ld ~toe lL_ _ ampft 10
no~us Do~~W -~
~ I Pa ge 19 of 25 I Back Next
CLB024 Introduction to Cost Risk Analysis Lesson 5 - Cost as a Probability Distribution TOC I RESOURCES I PRINT I HELP
Knowledge Review
Which input would not affect cost
Award fees
Composition o f materials
System weight
~ None of the above
Any o f t he input s would affect cost
Muttlple Probability Distribution centol(
)______ ~
M~ L---~ --~-
L ----+00 _
tlllimoling Rotnliommipa
I Pope 20 of 2S I Back Next
CLB024 Introduction to Cost Risk Analysis Lesson 5- Cost as a Probability Distribution TOC I RESOURCES I PRINT 1HELP
Knowledge Review
A distribu t ion represen ting a systems to tal cost wi th uncer tain t ies inc luded is the sum o f many indiv idual cost elemen t distribu t ions
~ True Iterations in Monte Carlo Simulation _ --~_~
1bull111nbull $C bull Mlt10 middot- -bull --False rshybull=- middot u-middot~-middot 1 - middot~ - r-+ J
bull -shy- _ shy I - --~- bull bull bull bull bull bullmiddot~ --lA~ -
Check Answer
T he answer is True T his is the de fini t ion o f the to tal system cost distribu t ion
~ I Page 21 of 25 I Back Next
CLB024 Introduction to Cost Risk Analysis Lesson 5 - Cost as a Probability Distribution TOC I RESOURCES I PRINT I HELP
Know ledge Review
Each probability distribution has distinct characteristics Choose the correct match below and submit your answer
High and Low values are eguallv likely - Normal Distribution More accyrate when MTBF measurements are ysed - Uniform Distribution Wide range o f dis tribu tion shapes with potentjally large tails - Beta Distribu tion Parameters are difficult to determine use PERI approximation - Triangular Distribution
~ High and Low values are equally likely - Uniform Distribu tion More accyrate when MTBF measuremen ts are used - Normal Distribution Wide range of dis tribu tion shapes with potentjaly large tails - Triangular Distribution Parameters are difficult t o determine use PERT approximation - Beta Distribution
Check Answ er
The answer is High a nd Low values are equally likely - Uniform Dist ri but ion More accurat e when MTBF measurement s are used - Normal Dist ribut ion Wid e range o f d ist ri but ion s hapes wit h pot ent ially large t ails - Triangular Dist ribut ion and Param et e rs are difficult t o de t ermine use PERT a pproximat ion - Bet a Dist ri but ion
I Pope 22 of 2S I Back Next
CLB024 Introduction to Cost Risk Analysis Lesson 5 - Cost as a Probability Distribution TOC I RESOURCES I PRINT I HELP
Summary
To complete a Cost Risk Analysis
bull Identify a Probability Density Function for each uncertain element in the cost estimate
bull Combine the element uncertainties into a Total Cost PDF
There are two mathematical approaches
bull Symmetric Approximation (Summation o f Moments )
bull Monte Carlo Simulation
Uniform Distribution - High and Low values are equally likely
bull Used when there is no likelihood information
Triangular Distribu t ion - Includes all three parameters high low and most likely v alue
bull Tails can be heavy or fat
Normal Distribu ti on - Bell Curve
bull Symmetrical on both sides o f the mean
bull ReqLiires mean and standard deviation
I Pope 23 of 2S I Back Next
CLB024 Introduction t o Cost Risk Analysis Lesson 5- Cost as a Probability Distribution TOC I RESO URCES I PRINT I HELP
Summary Cont
Beta Dist rib ut io n - can take on many possible shapes
bull Requires a and ~
bull Assume PERT Beta use low most likely and high estimates
Table o f Algori thms for calculating means and variances for four distribu tions
Distribution Mean Variance
ll=(a + b) 02 =(b - al2 Uniform
2 12
ll = la+c+b) 02= a 2 + b2+ c2-ab - ac - be) Triangular 3 18
o 2 b - a)2
Normal ll = C 36
ll=a + 4c + b) o2 b - a)2 Beta
6 36 I
Q
~ I Page24of 25 I Back Next
Long Description
Table of Algorithms for each distribution shape
Distribution Uniform Mean μ = (a + b) 2 Variance σ2 = (b-a)2 12
Distribution Triangular Mean μ = (a + c + b) 3 Variance σ2 = (a2 + b2 + c2 - ab - ac - bc) 18
Distribution Normal Mean μ = c Variance σ2 = (b - a)2 36
Distribution Beta Mean μ = (a + 4c + b) 6 Variance σ2 = (b - a )2 36
CLB024 Introduction to Cost Risk Analysis Lesson 5 - Cost as a Probability Distribution TOC I RESOURCES I PRINT I HELP
Lesson Completion
You have comple ted the content for this lesson
To continue selec t ano ther lesson from the Table o f Con ten ts on the le ft
If you have closed or hidden the Table of Conten ts click the Show TOC button at the top in the Atlas navigation bar
I Poobull 25 of 25 I Back Next

CLB024 Introduction to Cost Risk Analysis Lesson 5- Cost as a Probability Distribution TOC I RESOURCES I PRINT 1HELP
Monte Carlo Simulation
A distribution is de fined for each cost element from which a random sample is drawn The samples from each cost elements distribution are summed to a to tal cost This sampling and summing process is repeated many times (eg 1000- 10000 times) The result is a distribution representing the to tal cost o f the system with all described uncertainties taken into account The distribution can be displayed by a cumulative probabili ty distribution
Iterations in Monte Carlo Simulation
Rot~~
_ l4_-RbullU~ OA TCoot 12tu middot 182clamp bull sa-12 Ul
I $l4SU
12511t $4501t $562
Maiefllll bull~- - -+ I I I
1000 bull=o7----J
~
bull
-ld ~toe lL_ _ ampft 10
no~us Do~~W -~
~ I Pa ge 19 of 25 I Back Next
CLB024 Introduction to Cost Risk Analysis Lesson 5 - Cost as a Probability Distribution TOC I RESOURCES I PRINT I HELP
Knowledge Review
Which input would not affect cost
Award fees
Composition o f materials
System weight
~ None of the above
Any o f t he input s would affect cost
Muttlple Probability Distribution centol(
)______ ~
M~ L---~ --~-
L ----+00 _
tlllimoling Rotnliommipa
I Pope 20 of 2S I Back Next
CLB024 Introduction to Cost Risk Analysis Lesson 5- Cost as a Probability Distribution TOC I RESOURCES I PRINT 1HELP
Knowledge Review
A distribu t ion represen ting a systems to tal cost wi th uncer tain t ies inc luded is the sum o f many indiv idual cost elemen t distribu t ions
~ True Iterations in Monte Carlo Simulation _ --~_~
1bull111nbull $C bull Mlt10 middot- -bull --False rshybull=- middot u-middot~-middot 1 - middot~ - r-+ J
bull -shy- _ shy I - --~- bull bull bull bull bull bullmiddot~ --lA~ -
Check Answer
T he answer is True T his is the de fini t ion o f the to tal system cost distribu t ion
~ I Page 21 of 25 I Back Next
CLB024 Introduction to Cost Risk Analysis Lesson 5 - Cost as a Probability Distribution TOC I RESOURCES I PRINT I HELP
Know ledge Review
Each probability distribution has distinct characteristics Choose the correct match below and submit your answer
High and Low values are eguallv likely - Normal Distribution More accyrate when MTBF measurements are ysed - Uniform Distribution Wide range o f dis tribu tion shapes with potentjally large tails - Beta Distribu tion Parameters are difficult to determine use PERI approximation - Triangular Distribution
~ High and Low values are equally likely - Uniform Distribu tion More accyrate when MTBF measuremen ts are used - Normal Distribution Wide range of dis tribu tion shapes with potentjaly large tails - Triangular Distribution Parameters are difficult t o determine use PERT approximation - Beta Distribution
Check Answ er
The answer is High a nd Low values are equally likely - Uniform Dist ri but ion More accurat e when MTBF measurement s are used - Normal Dist ribut ion Wid e range o f d ist ri but ion s hapes wit h pot ent ially large t ails - Triangular Dist ribut ion and Param et e rs are difficult t o de t ermine use PERT a pproximat ion - Bet a Dist ri but ion
I Pope 22 of 2S I Back Next
CLB024 Introduction to Cost Risk Analysis Lesson 5 - Cost as a Probability Distribution TOC I RESOURCES I PRINT I HELP
Summary
To complete a Cost Risk Analysis
bull Identify a Probability Density Function for each uncertain element in the cost estimate
bull Combine the element uncertainties into a Total Cost PDF
There are two mathematical approaches
bull Symmetric Approximation (Summation o f Moments )
bull Monte Carlo Simulation
Uniform Distribution - High and Low values are equally likely
bull Used when there is no likelihood information
Triangular Distribu t ion - Includes all three parameters high low and most likely v alue
bull Tails can be heavy or fat
Normal Distribu ti on - Bell Curve
bull Symmetrical on both sides o f the mean
bull ReqLiires mean and standard deviation
I Pope 23 of 2S I Back Next
CLB024 Introduction t o Cost Risk Analysis Lesson 5- Cost as a Probability Distribution TOC I RESO URCES I PRINT I HELP
Summary Cont
Beta Dist rib ut io n - can take on many possible shapes
bull Requires a and ~
bull Assume PERT Beta use low most likely and high estimates
Table o f Algori thms for calculating means and variances for four distribu tions
Distribution Mean Variance
ll=(a + b) 02 =(b - al2 Uniform
2 12
ll = la+c+b) 02= a 2 + b2+ c2-ab - ac - be) Triangular 3 18
o 2 b - a)2
Normal ll = C 36
ll=a + 4c + b) o2 b - a)2 Beta
6 36 I
Q
~ I Page24of 25 I Back Next
Long Description
Table of Algorithms for each distribution shape
Distribution Uniform Mean μ = (a + b) 2 Variance σ2 = (b-a)2 12
Distribution Triangular Mean μ = (a + c + b) 3 Variance σ2 = (a2 + b2 + c2 - ab - ac - bc) 18
Distribution Normal Mean μ = c Variance σ2 = (b - a)2 36
Distribution Beta Mean μ = (a + 4c + b) 6 Variance σ2 = (b - a )2 36
CLB024 Introduction to Cost Risk Analysis Lesson 5 - Cost as a Probability Distribution TOC I RESOURCES I PRINT I HELP
Lesson Completion
You have comple ted the content for this lesson
To continue selec t ano ther lesson from the Table o f Con ten ts on the le ft
If you have closed or hidden the Table of Conten ts click the Show TOC button at the top in the Atlas navigation bar
I Poobull 25 of 25 I Back Next

CLB024 Introduction to Cost Risk Analysis Lesson 5 - Cost as a Probability Distribution TOC I RESOURCES I PRINT I HELP
Knowledge Review
Which input would not affect cost
Award fees
Composition o f materials
System weight
~ None of the above
Any o f t he input s would affect cost
Muttlple Probability Distribution centol(
)______ ~
M~ L---~ --~-
L ----+00 _
tlllimoling Rotnliommipa
I Pope 20 of 2S I Back Next
CLB024 Introduction to Cost Risk Analysis Lesson 5- Cost as a Probability Distribution TOC I RESOURCES I PRINT 1HELP
Knowledge Review
A distribu t ion represen ting a systems to tal cost wi th uncer tain t ies inc luded is the sum o f many indiv idual cost elemen t distribu t ions
~ True Iterations in Monte Carlo Simulation _ --~_~
1bull111nbull $C bull Mlt10 middot- -bull --False rshybull=- middot u-middot~-middot 1 - middot~ - r-+ J
bull -shy- _ shy I - --~- bull bull bull bull bull bullmiddot~ --lA~ -
Check Answer
T he answer is True T his is the de fini t ion o f the to tal system cost distribu t ion
~ I Page 21 of 25 I Back Next
CLB024 Introduction to Cost Risk Analysis Lesson 5 - Cost as a Probability Distribution TOC I RESOURCES I PRINT I HELP
Know ledge Review
Each probability distribution has distinct characteristics Choose the correct match below and submit your answer
High and Low values are eguallv likely - Normal Distribution More accyrate when MTBF measurements are ysed - Uniform Distribution Wide range o f dis tribu tion shapes with potentjally large tails - Beta Distribu tion Parameters are difficult to determine use PERI approximation - Triangular Distribution
~ High and Low values are equally likely - Uniform Distribu tion More accyrate when MTBF measuremen ts are used - Normal Distribution Wide range of dis tribu tion shapes with potentjaly large tails - Triangular Distribution Parameters are difficult t o determine use PERT approximation - Beta Distribution
Check Answ er
The answer is High a nd Low values are equally likely - Uniform Dist ri but ion More accurat e when MTBF measurement s are used - Normal Dist ribut ion Wid e range o f d ist ri but ion s hapes wit h pot ent ially large t ails - Triangular Dist ribut ion and Param et e rs are difficult t o de t ermine use PERT a pproximat ion - Bet a Dist ri but ion
I Pope 22 of 2S I Back Next
CLB024 Introduction to Cost Risk Analysis Lesson 5 - Cost as a Probability Distribution TOC I RESOURCES I PRINT I HELP
Summary
To complete a Cost Risk Analysis
bull Identify a Probability Density Function for each uncertain element in the cost estimate
bull Combine the element uncertainties into a Total Cost PDF
There are two mathematical approaches
bull Symmetric Approximation (Summation o f Moments )
bull Monte Carlo Simulation
Uniform Distribution - High and Low values are equally likely
bull Used when there is no likelihood information
Triangular Distribu t ion - Includes all three parameters high low and most likely v alue
bull Tails can be heavy or fat
Normal Distribu ti on - Bell Curve
bull Symmetrical on both sides o f the mean
bull ReqLiires mean and standard deviation
I Pope 23 of 2S I Back Next
CLB024 Introduction t o Cost Risk Analysis Lesson 5- Cost as a Probability Distribution TOC I RESO URCES I PRINT I HELP
Summary Cont
Beta Dist rib ut io n - can take on many possible shapes
bull Requires a and ~
bull Assume PERT Beta use low most likely and high estimates
Table o f Algori thms for calculating means and variances for four distribu tions
Distribution Mean Variance
ll=(a + b) 02 =(b - al2 Uniform
2 12
ll = la+c+b) 02= a 2 + b2+ c2-ab - ac - be) Triangular 3 18
o 2 b - a)2
Normal ll = C 36
ll=a + 4c + b) o2 b - a)2 Beta
6 36 I
Q
~ I Page24of 25 I Back Next
Long Description
Table of Algorithms for each distribution shape
Distribution Uniform Mean μ = (a + b) 2 Variance σ2 = (b-a)2 12
Distribution Triangular Mean μ = (a + c + b) 3 Variance σ2 = (a2 + b2 + c2 - ab - ac - bc) 18
Distribution Normal Mean μ = c Variance σ2 = (b - a)2 36
Distribution Beta Mean μ = (a + 4c + b) 6 Variance σ2 = (b - a )2 36
CLB024 Introduction to Cost Risk Analysis Lesson 5 - Cost as a Probability Distribution TOC I RESOURCES I PRINT I HELP
Lesson Completion
You have comple ted the content for this lesson
To continue selec t ano ther lesson from the Table o f Con ten ts on the le ft
If you have closed or hidden the Table of Conten ts click the Show TOC button at the top in the Atlas navigation bar
I Poobull 25 of 25 I Back Next
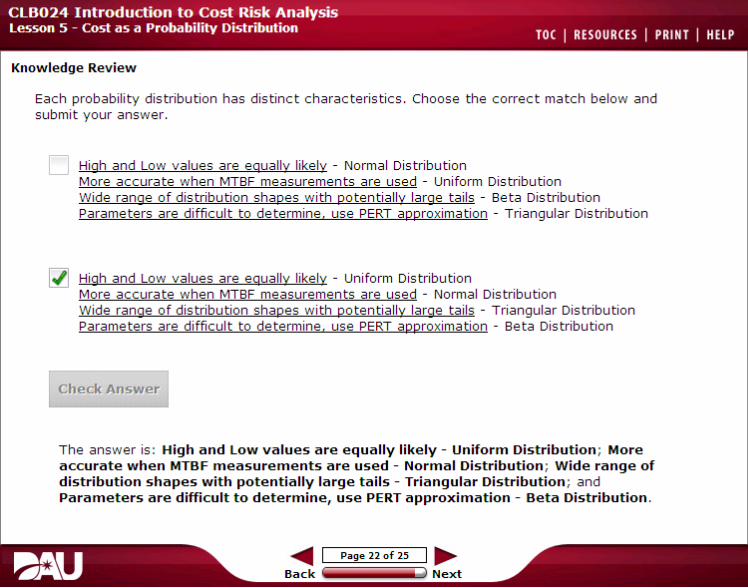
CLB024 Introduction to Cost Risk Analysis Lesson 5 - Cost as a Probability Distribution TOC I RESOURCES I PRINT I HELP
Summary
To complete a Cost Risk Analysis
bull Identify a Probability Density Function for each uncertain element in the cost estimate
bull Combine the element uncertainties into a Total Cost PDF
There are two mathematical approaches
bull Symmetric Approximation (Summation o f Moments )
bull Monte Carlo Simulation
Uniform Distribution - High and Low values are equally likely
bull Used when there is no likelihood information
Triangular Distribu t ion - Includes all three parameters high low and most likely v alue
bull Tails can be heavy or fat
Normal Distribu ti on - Bell Curve
bull Symmetrical on both sides o f the mean
bull ReqLiires mean and standard deviation
I Pope 23 of 2S I Back Next
CLB024 Introduction t o Cost Risk Analysis Lesson 5- Cost as a Probability Distribution TOC I RESO URCES I PRINT I HELP
Summary Cont
Beta Dist rib ut io n - can take on many possible shapes
bull Requires a and ~
bull Assume PERT Beta use low most likely and high estimates
Table o f Algori thms for calculating means and variances for four distribu tions
Distribution Mean Variance
ll=(a + b) 02 =(b - al2 Uniform
2 12
ll = la+c+b) 02= a 2 + b2+ c2-ab - ac - be) Triangular 3 18
o 2 b - a)2
Normal ll = C 36
ll=a + 4c + b) o2 b - a)2 Beta
6 36 I
Q
~ I Page24of 25 I Back Next
Long Description
Table of Algorithms for each distribution shape
Distribution Uniform Mean μ = (a + b) 2 Variance σ2 = (b-a)2 12
Distribution Triangular Mean μ = (a + c + b) 3 Variance σ2 = (a2 + b2 + c2 - ab - ac - bc) 18
Distribution Normal Mean μ = c Variance σ2 = (b - a)2 36
Distribution Beta Mean μ = (a + 4c + b) 6 Variance σ2 = (b - a )2 36
CLB024 Introduction to Cost Risk Analysis Lesson 5 - Cost as a Probability Distribution TOC I RESOURCES I PRINT I HELP
Lesson Completion
You have comple ted the content for this lesson
To continue selec t ano ther lesson from the Table o f Con ten ts on the le ft
If you have closed or hidden the Table of Conten ts click the Show TOC button at the top in the Atlas navigation bar
I Poobull 25 of 25 I Back Next