Cichowicz, lindsay, 406, cohort #1, classroom managementnewsletter.docx
Upload
md-ashraf-siddiqueCategory
view
105download
0

Classroom Practices of Primary and Secondary Teachers Participating in English in Action: Second Cohort (2013) 1
Classroom Practices of Primary and Secondary Teachers Participating in English in Action: Second Cohort (2013)
Executive summary
a) Background
The purpose of this study was to ascertain whether there had been changes in the classroom practice of teachers and students participating in English in Action (EIA) over the period of the 2012–13 intervention (Cohort 2). Previous research in language teaching has established that when teachers take up most of the lesson time talking, this can severely limit students’ opportunities to develop proficiency in the target language (Cook 2008), while a general goal of English language (EL) teachers is to motivate their students to speak and to practise using the target language (Nunan 1991). This study therefore focused upon the extent of teacher and student talk, the use of the target language by both, and the forms of classroom organisation (individual, pair, group or choral work) in which student talk is situated. Of course, the amount of teacher talk is not the only indicator of quality language teaching; the nature of that talk is also important – for example, whether teachers engage the attention of the class, present them with new information in an understandable way and allow them time to ask questions and comment.
Classroom Practice 2013 is a repeat of the studies on the pilot EIA programme (Cohort 1) (EIA 2011a & 2012a).
The students and teachers of Cohort 2 are sixfold greater in number (4,368 teachers, compared to 751 teachers, in schools). To enable this increase in scale, the programme has been delivered through a more decentralised model, with much less direct contact with English language teaching (ELT) experts, a greater embedding of expertise within teacher development materials (especially video), and a greater dependence upon localised peer support.
This study addresses two main questions:
1. To what extent do the teachers of Cohort 2 show improved classroom practice, particularly in relation to the amount and language of student talk, compared with the pre-intervention baseline?
2. To what extent has the programme been successful in repeating the post-intervention improvements in teachers’ classroom practice seen in Cohort 1, at the much larger scale of Cohort 2?
b) Research methodology
The EIA classroom practice baseline (EIA 2009a & b) was originally adapted from a general classroom observation study, and was geographically limited, due to an uncertain social and political context at the time of the fieldwork. Subsequently the methodology was revised to give more fine-grained data about student and teacher talk, use of the target language, and forms of classroom organisation, and was implemented on a representative sample of EIA teachers, four months after the launch of the pilot programme (EIA 2011a) and again 12–16 months after the programme start (EIA 2012a).
The research instrument is a timed observation schedule (see Appendix 1), directly comparable to that used in the earlier studies on the EIA pilot intervention (2010 and 2011).
The sample comprised 401 lesson observations – 230 of primary teachers, 145 of secondary teachers, and 26 of primary head teachers.
For this study, the practices observed were compared directly (statistically) with the earlier pilot studies (EIA 2011a and 2012a), and indirectly with the earlier baseline (EIA 2009a & b).
2 Classroom Practices of Primary and Secondary Teachers Participating in English in Action: Second Cohort (2013)
c) Key findings: Primary classrooms
i) Teachers’ talk and activity
In the observation of Cohort 2 lessons, average primary teacher talk had dropped to less than half of the lesson time (45%). This represents a very significant reduction in teacher talk from 2009 baseline practices, where teacher talk was the predominant classroom activity. Although this is a higher figure than was found in the 2010 early-intervention observations (34%), it had not caused any reciprocal drop in student talk-time (compared to that found in 2010). Teachers’ use of the target language was very much greater than that observed in the 2009 baseline, and slightly higher (76%) than that found in 2010 (71%) or 2011 (72%).
In the observation of Cohort 2 lessons, there was a notable increase in time teachers spent organising and a decrease in time spent presenting when compared with the baseline and with the 2011 study. Primary teachers were using a wide range of activities in the classroom and involving students in these activities. Primary teachers were found to be organising for 32% of the time, presenting 25% of the time, asking questions 23% of the time, and giving feedback 20% of the time. This is a change from the baseline studies (EIA 2009a & b), where teachers were observed to be primarily reading from the textbook and rarely involving students in activities. Compared to 2011, primary teachers spent less talk-time ‘asking questions’ (falling from 27% to 23%) and more time ‘organising’ classroom activity (rising to 32% from 22%), and much less time presenting (falling from 40% in 2011, to 25% in 2013).
These observations suggest EIA Cohort 2 primary teachers were making great and sustained efforts to increase the use of the target language, and involve students more actively in their English lessons.
ii) Students’ talk and activity
In the observation of Cohort 2 lessons, average student talk-time accounted for 27% of the lesson. This figure represents a very different situation to the 2009 baseline, where in two-thirds of lessons observed ‘none or hardly any’ of the students spoke. The figure is identical to that found in the 2010 observations. Students’ use of the target language had also increased substantially over the baseline, to 91% of student talk in English. The proportion of primary students’ talk in English was higher than that observed in 2010 (88%) and 2011 (81%), with the difference between 2011 being statistically significant (p<0.05).
Almost half (46%) of student talk was observed in the context of choral activities, while approximately a third (36%) was individual student talk. 18% of student talk was pair (10%) or group (8%) work, a figure midway between that observed in 2010 (30%) and 2011 (9%). In all forms of talk organisation, English was the main language used by students (86–91%). The fact that students were often engaged in activities in which they interacted with their classmates marks a notable change from the baseline studies (EIA 2009a & b), which identified few occasions when individual students or groups were encouraged to speak in English (2–4% of the lesson time) and which showed that in most classes students were not interactive at all.
d) Key findings: Secondary classrooms
i) Teachers’ talk and activity
In the observation of Cohort 2 lessons, average secondary teacher talk had dropped to less than half of the lesson time (48%). This represents a very significant reduction in teacher talk from 2009 baseline practices, where teacher talk was the predominant classroom activity. Although this is a higher figure than was found in the 2010 early-intervention observations (33%), it is lower than 2011 (50%), and is not related to any reciprocal drop in student talk-time (compared to that found in 2010 or 2011). Teachers’
Classroom Practices of Primary and Secondary Teachers Participating in English in Action: Second Cohort (2013) 3
use of target language was much greater than that observed in the 2009 baseline, and slightly higher (87%) than that in 2010 (86%) or 2011 (79%).
In the observation of Cohort 2 lessons, there was a notable increase in the time teachers spent organising and a decrease in the time spent presenting when compared with the baseline and the 2011 study. Secondary teachers were using a wide range of activities in the classroom and involving students in these activities. They were found to be organising 29% of the time, presenting 32% of the time, asking questions 22% of the time, and giving feedback 17% of the time. This is a change from the baseline studies (EIA 2009a & b), where teachers were observed to be primarily reading from the textbook and rarely involving students in activities. Compared to 2011, secondary teachers spent similar talk-time ‘asking questions’ (22% compared to 23%), more time organising classroom activity (rising from 22% to 29%), and much less time presenting (falling from 45% to 32%).
These observations suggest EIA Cohort 2 secondary teachers were making great and sustained efforts to increase the use of the target language, and involve students more actively in their English lessons.
ii) Students’ talk and activity
In the observation of Cohort 2 lessons, average secondary student talk-time accounted for 24% of the lesson. This figure represents a very different situation to the 2009 baseline, where in two-thirds of lessons observed ‘none or hardly any’ of the students spoke. The figure is about the same as that found in the 2010 (23%) and 2011 (24%) observations. Students’ use of the target language had also increased substantially over the baseline, rising to 87% of student talk in English. The proportion of secondary students’ talk in English was similar to that observed in 2010 (88%) and 2011 (85%).
Over half (53%) of student talk observed was individual talk, while 28% was pair (13%) or group (15%) work, a figure similar to that observed in 2011 (27%), but below that observed in 2010 (57%). In all forms of talk organisation, English was the main language used by students in all forms of classroom organisation (85–92% for individual, pair and choral work); though as might be expected, in group work English still predominated (64%), but students used Bangla more (36%) than they did in other forms of organisation. The fact that students were often engaged in activities in which they interacted with their classmates marks a notable change from the baseline studies (EIA 2009a & b), which identified few occasions when individual students or groups were encouraged to speak in English (2–4% of the lesson time) and showed that in most classes students were not interactive at all.
e) Conclusions
Despite a sixfold increase in scale for Cohort 2, and a more decentralised, peer-supported approach to teacher development, observations of Cohort 2 classroom practices show substantial and important changes compared with the baseline studies, which show teachers making great efforts to promote and model the target language, and to organise increased student participation in lessons. The observations show substantial increases in students’ active participation, with more opportunities to speak and practise the target language.
These latest findings mark a notable increase in the time teachers spent organising and a decrease in the time spent presenting when compared with the baseline and with the 2011 study. The results show that both primary and secondary teachers were using a wide range of activities in the classroom and involving students in these activities.
In summary, the 2013 cohort of teachers observed in the EIA programme were using more English in their classes, involving students in more activities and encouraging them to spend more of their class time speaking in English.
4 Classroom Practices of Primary and Secondary Teachers Participating in English in Action: Second Cohort (2013)
Table of contents
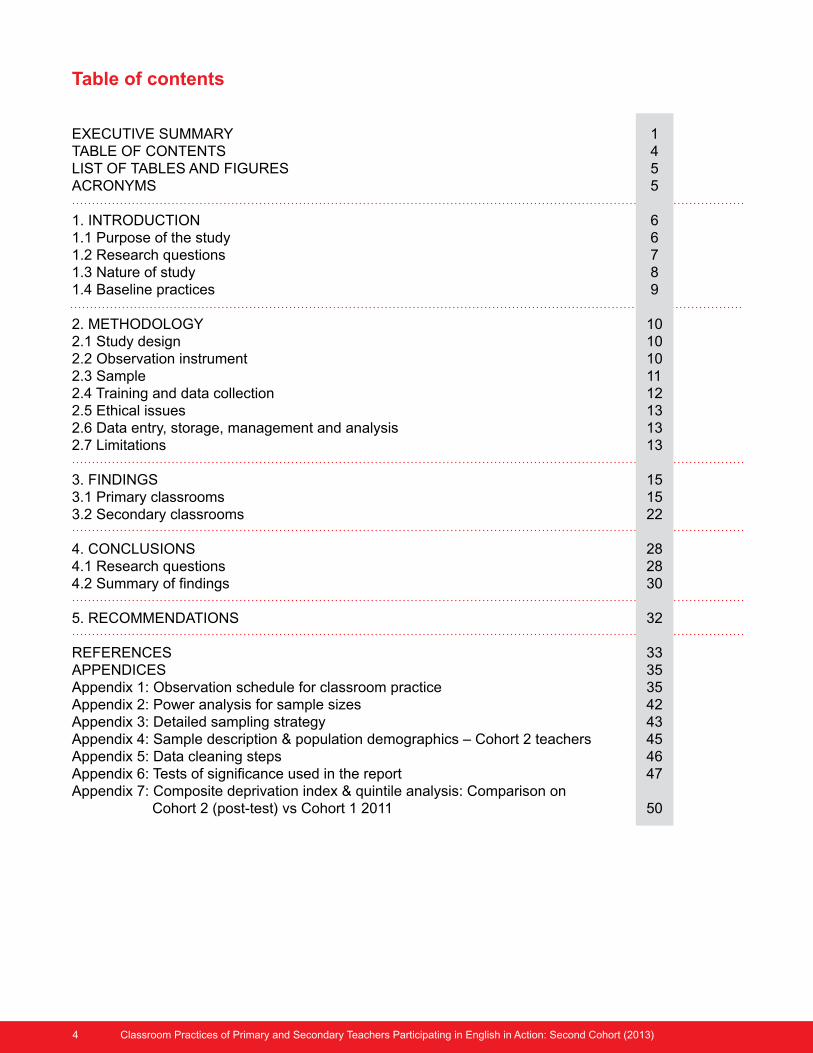
EXECUTIVE SUMMARY 1TABLE OF CONTENTS 4LIST OF TABLES AND FIGURES 5ACRONYMS 5
1. INTRODUCTION 61.1 Purpose of the study 61.2 Research questions 7 1.3 Nature of study 81.4 Baseline practices 9
2. METHODOLOGY 102.1 Study design 102.2 Observation instrument 102.3 Sample 112.4 Training and data collection 122.5 Ethical issues 132.6 Data entry, storage, management and analysis 132.7 Limitations 13
3. FINDINGS 153.1 Primary classrooms 153.2 Secondary classrooms 22
4. CONCLUSIONS 284.1 Research questions 284.2 Summary of findings 30
5. RECOMMENDATIONS 32
REFERENCES 33APPENDICES 35Appendix 1: Observation schedule for classroom practice 35Appendix 2: Power analysis for sample sizes 42Appendix 3: Detailed sampling strategy 43Appendix 4: Sample description & population demographics – Cohort 2 teachers 45Appendix 5: Data cleaning steps 46Appendix 6: Tests of significance used in the report 47Appendix 7: Composite deprivation index & quintile analysis: Comparison on Cohort 2 (post-test) vs Cohort 1 2011 50
Classroom Practices of Primary and Secondary Teachers Participating in English in Action: Second Cohort (2013) 5
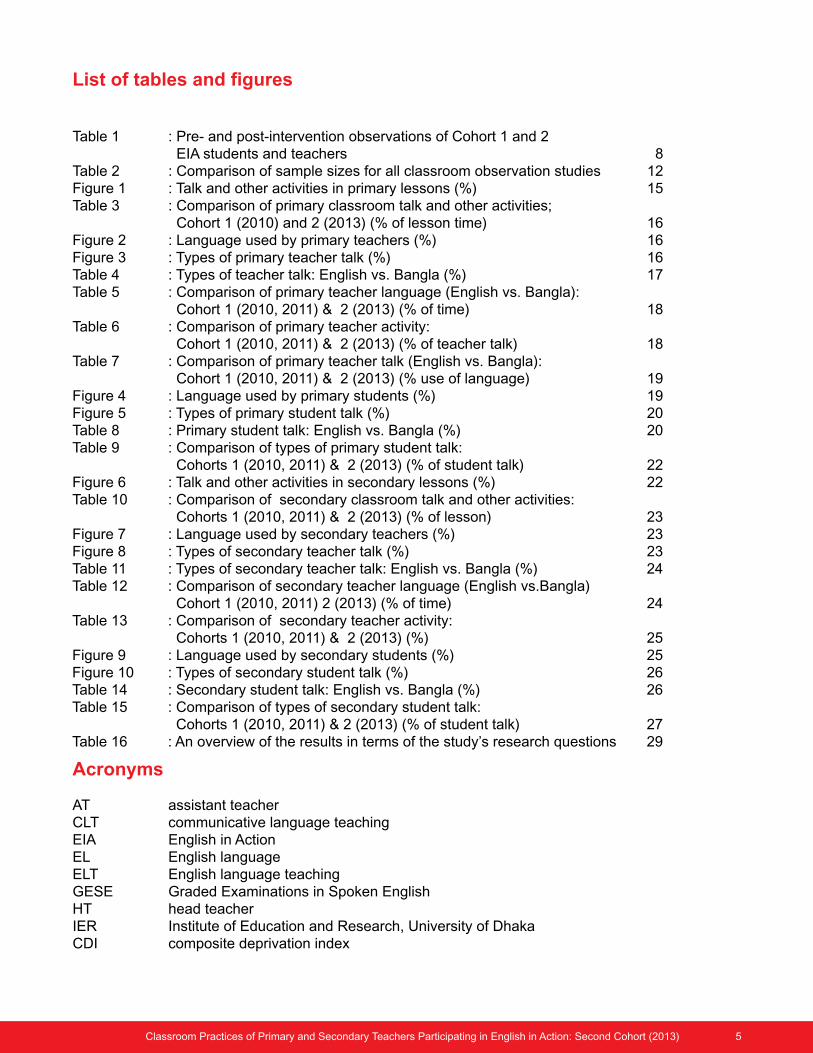
List of tables and figures
Table 1 : Pre- and post-intervention observations of Cohort 1 and 2 EIA students and teachers 8Table 2 : Comparison of sample sizes for all classroom observation studies 12Figure 1 : Talk and other activities in primary lessons (%) 15Table 3 : Comparison of primary classroom talk and other activities; Cohort 1 (2010) and 2 (2013) (% of lesson time) 16Figure 2 : Language used by primary teachers (%) 16Figure 3 : Types of primary teacher talk (%) 16Table 4 : Types of teacher talk: English vs. Bangla (%) 17Table 5 : Comparison of primary teacher language (English vs. Bangla): Cohort 1 (2010, 2011) & 2 (2013) (% of time) 18Table 6 : Comparison of primary teacher activity: Cohort 1 (2010, 2011) & 2 (2013) (% of teacher talk) 18Table 7 : Comparison of primary teacher talk (English vs. Bangla): Cohort 1 (2010, 2011) & 2 (2013) (% use of language) 19Figure 4 : Language used by primary students (%) 19Figure 5 : Types of primary student talk (%) 20Table 8 : Primary student talk: English vs. Bangla (%) 20Table 9 : Comparison of types of primary student talk: Cohorts 1 (2010, 2011) & 2 (2013) (% of student talk) 22Figure 6 : Talk and other activities in secondary lessons (%) 22Table 10 : Comparison of secondary classroom talk and other activities: Cohorts 1 (2010, 2011) & 2 (2013) (% of lesson) 23Figure 7 : Language used by secondary teachers (%) 23Figure 8 : Types of secondary teacher talk (%) 23Table 11 : Types of secondary teacher talk: English vs. Bangla (%) 24Table 12 : Comparison of secondary teacher language (English vs.Bangla) Cohort 1 (2010, 2011) 2 (2013) (% of time) 24Table 13 : Comparison of secondary teacher activity: Cohorts 1 (2010, 2011) & 2 (2013) (%) 25Figure 9 : Language used by secondary students (%) 25Figure 10 : Types of secondary student talk (%) 26Table 14 : Secondary student talk: English vs. Bangla (%) 26Table 15 : Comparison of types of secondary student talk: Cohorts 1 (2010, 2011) & 2 (2013) (% of student talk) 27Table 16 : An overview of the results in terms of the study’s research questions 29
Acronyms
AT assistant teacherCLT communicative language teachingEIA English in ActionEL English languageELT English language teachingGESE Graded Examinations in Spoken EnglishHT head teacherIER Institute of Education and Research, University of Dhaka CDI composite deprivation index
6 Classroom Practices of Primary and Secondary Teachers Participating in English in Action: Second Cohort (2013)
1. Introduction
A key principle of communicative language teaching (CLT) is that the students should receive as much opportunity to use the target language as is possible. This is particularly important when students only have the chance to practise the language through formal education, as is generally the case with students learning English in Bangladesh. Previous research into language teaching has established that when teachers take up most of the lesson time talking, this can severely limit students’ opportunities to develop proficiency in the target language (Cook 2008). A general goal of English language (EL) teachers is to motivate their students to speak – to use the language they are learning (Nunan 1991). Thus, an increase in student ‘talk-time’ during lessons is of key importance for the primary and secondary English in Action (EIA) interventions. Of course, the amount of teacher talk is not the only indicator of quality language teaching. The nature of that talk – for example, whether teachers engage the attention of the class, present them with new information in an understandable way and allow them time to ask questions and comment – is just as important.
1.1 Purpose of the study
The purpose of this study was to ascertain whether there had been changes in the classroom practice of teachers and students participating in EIA over the period of the 2012–13 intervention (Cohort 2). Previous studies of classroom practice were conducted first on a sample that represented teachers and students in Bangladesh prior to any intervention by EIA (EIA 2009a & b), and also with the cohort of students and teachers taking part in the EIA pilot intervention (Cohort 1: 2010–11). These latter studies were designed to investigate the classroom practice of EIA Pilot teachers. The 2010 ‘early intervention’ observations took place four months after the launch of the pilot programme (June 2010), while the 2011 post-intervention observations were carried out on samples of the same student and teacher populations after they had taken part in the programme for 12–16 months (February (primary) and June 2011 (secondary)). Early and post-intervention observation findings were published in separate reports (EIA 2011a & 2012a).
Following the pilot intervention, in 2012 the EIA programme up-scaled its implementation with a cohort of 4,368 teachers and an estimated 887,000 students (Cohort 2: 2012–13). To gauge the extent of teachers’ classroom practice improvements for this larger cohort, post-intervention observations of classrooms were carried out after a year of participation in the programme (September–October 2013). Whereas the previous two studies were early-intervention and post-intervention observations on the same cohort, this study used only a post-intervention observation, comparing this to the ‘pre-intervention’ baseline carried out in 2009 (EIA 2009a & b). In the other associated EIA studies on Cohort 2 (such as that on EL proficiency (EIA 2014a), this has been established by using the pre-intervention study on the pilot cohort (Cohort 1). This would have been the earlier study in 2010 (EIA 2011a). However, this study was carried out four months into the intervention, and hence is not a ‘true’ baseline. As noted above, a pre-intervention baseline classroom observation study was carried out (EIA 2009a & b). There are two reasons why this original baseline cannot be used to compare directly with observations post-intervention: firstly, the baseline was undertaken at a time of political and social uncertainty, which prevented a proper sampling of the population of teachers and students in Bangladesh; secondly, the methodology used a more general observation schedule, not one specific to EL teaching, which was why there was an attempt to provide another baseline in 2010 (EIA 2011a). Because the Cohort 1 baseline was not a true one (the study having taken place after the programme had started) we included an initial description of classrooms observed in the original baseline (2009) to provide a contrast to the ones observed during the EIA intervention (see Section 1.4, Baseline practices). How this comparison will be used is discussed next and in Section 2, Methodology.
Classroom Practices of Primary and Secondary Teachers Participating in English in Action: Second Cohort (2013) 7
1.2 Research questions
As well as presenting the new (2013) findings, this current report makes comparisons between these and those of the two earlier studies (2010 and 2011) and the pre-intervention study (2009). This study addresses two main questions:
1. To what extent do the teachers of Cohort 2 show improved classroom practice, particularly in relation to the amount of student talk and the language (English or Bangla) employed by teachers and students, compared with the pre-intervention baseline?
2. To what extent has the programme been successful in repeating the post-intervention improvements in teachers’ classroom practice seen in Cohort 1, at the much larger scale of Cohort 2?
While the students and teachers in Cohort 2 had undergone an essentially similar programme as those of 2011 (Cohort 1), they are much greater in number. To enable this increase in scale for Cohort 2, the programme was delivered through a more decentralised model, with much less direct contact with national or international ELT experts, a greater embedding of expertise within teacher development materials (especially video), and a greater dependence upon localised peer support (i.e. locally-recruited teachers trained to facilitate cluster meetings).
The first research question seeks to establish if EIA can improve teachers’ classroom practice over the ‘baseline’, with this increased scale and a reduced intensity of central support. This is an essential step in moving from the pilot phase (Phase II) to the fully institutionalised phase (Phase IV) in 2014–17. However, as will be indicated in the final section, there is no direct ‘baseline’ study with which to compare Cohort 2. Although general conditions of classrooms in the pre-intervention baseline situation (2009) can be compared with those found in 2013, no direct statistical comparisons can be made. Such comparisons can, however, be made with the 2010 study conducted just four months into the intervention (EIA 2011a), when it might be thought that the teachers had not changed their practices as much as after a full 12 months of the intervention (as observed in the 2011 study [EIA 2012a]). It turns out that, after four months of intervention, classrooms had indeed changed (e.g. students and teachers used more English), and therefore the 2010 study in effect is an early ‘post-intervention’ one. Nevertheless, this report uses this for statistical comparison, as was done in the previous report of the post-intervention after 12-16 months (EIA 2011a), while recognising that this is a demanding benchmark.
The second research question seeks to establish if the classroom practice of Cohort 2 teachers is comparable to that observed in the pilot intervention, as this gives a guide to the likely success of a full scaling up of EIA in the final phase of the programme. In particular, whether the developments in materials (for students, teachers and those who support them) and training of support staff, including the use of those staff in the Government system, can reproduce the same improvements. There is no reason to expect 2013 to reproduce the same degree of improvement in classroom practice as observed in 2011 (for the pilot cohort), and there may well be reasons to anticipate poorer practice, as a result of the larger-scale, decentralised and essentially peer-supported nature of the model. Indeed, recent research has shown that success in a pilot phase, where robust, randomized, control-trial evidence indicated an effective programme, does not guarantee success when this is transferred to a government-implemented (i.e. institutionalised) programme (Bold et al. 2013).
8 Classroom Practices of Primary and Secondary Teachers Participating in English in Action: Second Cohort (2013)
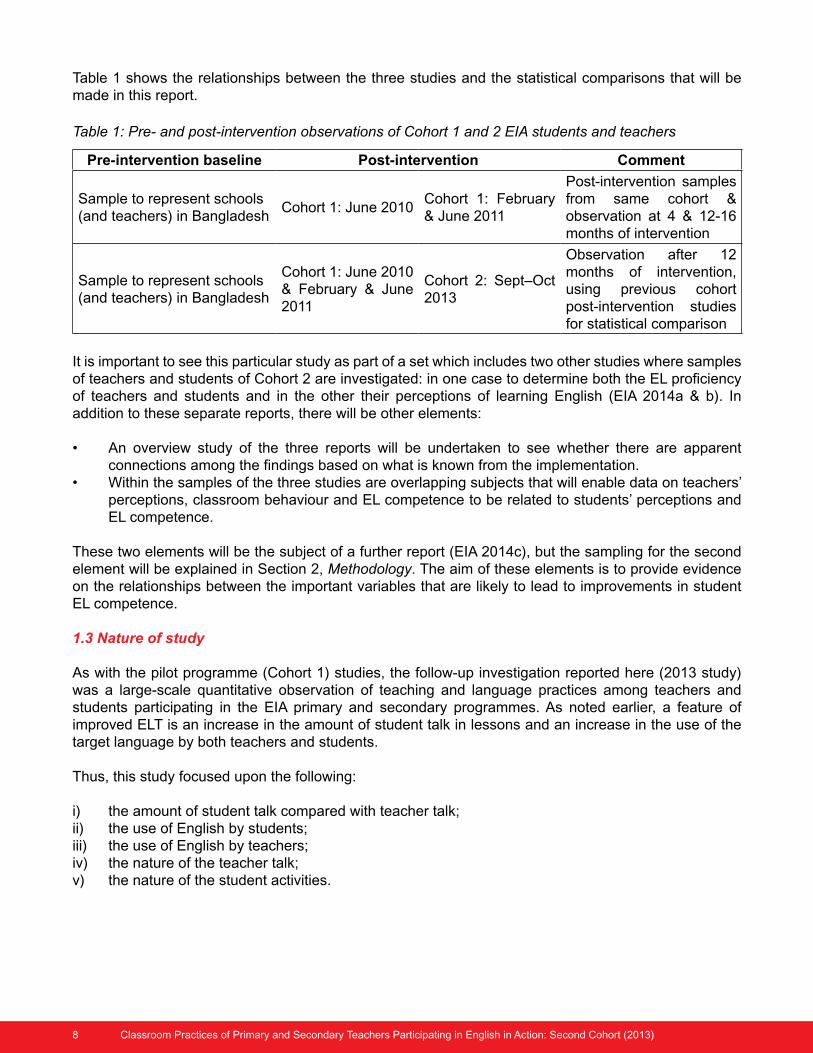
Table 1 shows the relationships between the three studies and the statistical comparisons that will be made in this report.
Table 1: Pre- and post-intervention observations of Cohort 1 and 2 EIA students and teachers
Pre-intervention baseline Post-intervention Comment
Sample to represent schools (and teachers) in Bangladesh
Cohort 1: June 2010Cohort 1: February & June 2011
Post-intervention samples from same cohort & observation at 4 & 12-16 months of intervention
Sample to represent schools (and teachers) in Bangladesh
Cohort 1: June 2010 & February & June 2011
Cohort 2: Sept–Oct 2013
Observation after 12 months of intervention, using previous cohort post-intervention studies for statistical comparison
It is important to see this particular study as part of a set which includes two other studies where samples of teachers and students of Cohort 2 are investigated: in one case to determine both the EL proficiency of teachers and students and in the other their perceptions of learning English (EIA 2014a & b). In addition to these separate reports, there will be other elements:
• An overview study of the three reports will be undertaken to see whether there are apparentconnections among the findings based on what is known from the implementation.
• Withinthesamplesofthethreestudiesareoverlappingsubjectsthatwillenabledataonteachers’perceptions, classroom behaviour and EL competence to be related to students’ perceptions and EL competence.
These two elements will be the subject of a further report (EIA 2014c), but the sampling for the second element will be explained in Section 2, Methodology. The aim of these elements is to provide evidence on the relationships between the important variables that are likely to lead to improvements in student EL competence.
1.3 Nature of study
As with the pilot programme (Cohort 1) studies, the follow-up investigation reported here (2013 study) was a large-scale quantitative observation of teaching and language practices among teachers and students participating in the EIA primary and secondary programmes. As noted earlier, a feature of improved ELT is an increase in the amount of student talk in lessons and an increase in the use of the target language by both teachers and students.
Thus, this study focused upon the following:
i) the amount of student talk compared with teacher talk;ii) the use of English by students;iii) the use of English by teachers;iv) the nature of the teacher talk;v) the nature of the student activities.
Classroom Practices of Primary and Secondary Teachers Participating in English in Action: Second Cohort (2013) 9
1.4 Baseline practices
This study, together with the pilot (Cohort 1) early intervention (EIA 2011) and post-intervention studies (EIA 2012), was designed to follow on from the baseline studies (EIA 2009a & b). This baseline provided an indication of the types of activity that happened in English classes in Bangladesh prior to the EIA intervention1. Conducted in 2009, the study was based on a total of 252 classroom observations (162 of secondary classes and 90 of primary classes). Regarding interactivity and language use, this baseline study concluded the following (EIA 2009a & b):
• Thepedagogicapproachadoptedinmostlessonsobserveddidnotencourageacommunicativeapproach to learning English. Teachers tended to read from the textbook, ask closed questions or move around the classroom monitoring and facilitating students as they worked individually. All other pedagogic activities were observed in less than 10% of classes.
• Intwo-thirdsoftheEnglishlessons(67%),theteacherspokeinEnglishlessthaninBangla,while27% of teachers spoke in English more than in Bangla. Only infrequently did teachers explain something in English (from 0–5% at any of the times sampled).
• OnlyasmallproportionofstudentsspokeinEnglishduringalesson.Intwo-thirdsoftheclassesobserved (68%) ‘none or hardly any’ spoke in English, while in 23% of classes only ‘some’ (<50%) had an opportunity to do so. There were only a few occasions when individual students or groups were encouraged to speak in English (2–4% of classes at any of the times sampled).
• Intwo-thirdsofclasses,lessthanhalfofthestudentshadopportunitiestoparticipateactivelyindiscussion or to answer questions. In most classes students were not interactive at all. The students only participated by answering the questions asked by the teacher.
Although the results above are not statistically comparable to those of the subsequent studies, including this one, they provide an important backdrop to consider any improvements brought about by teachers in their classroom interactions on the basis of involvement with EIA.
1 Note the reservations about this indicated earlier.
10 Classroom Practices of Primary and Secondary Teachers Participating in English in Action: Second Cohort (2013)
2. Methodology
2.1 Study design
As indicated in the Introduction, Cohort 1 (the EIA pilot intervention) is essentially similar to Cohort 2, in terms of general key variables (gender, phase, location and divisions), although it was carried out in different upazilas. Thus, the Cohort 1 early intervention study (2010) is used here as a comparison for Cohort 2 (as indicated in Table 1). The Cohort 1 post-intervention (2011) study is also used for comparison. From the discussion of the 2009 baseline situation in the Introduction (Section 1.4), it is unlikely that in the subsequent year the classroom practice of teachers as they started the EIA intervention had not improved2, and there is evidence that the quality of English teaching in general has not improved; even after conventional interventions with teacher training in Bangladesh, there is no improvement in classroom results (Rahman et al, 2006)3. However, the 2010 study (EIA 2011a) was a more demanding baseline than that found in 2009, and this changes the comparison of baseline and post-intervention observations to one more like comparing two treatments that have different lengths of intervention.
The second research question implies a comparison of similar treatments, in that the results of 12-16 months of intervention for Cohort 1 (pilot) are compared with one year of intervention for Cohort 2 (an up-scaled and more decentralised and peer-supported implementation than the pilot approach). The hypothesis in this case is that EIA can attain the same levels of classroom practice (in terms of the list of behaviours i–v in Section 1.3) in Cohort 2 as it did with Cohort 1, but in more demanding conditions of implementation.
As noted in the Introduction, embedded in this study design is a sub-study that enables the variables of student and teacher perceptions and teacher classroom behaviour to be linked to student and teacher EL competence by use of a common set of samples. This design is not described here (see EIA 2014c), though the effect on sampling is described below.
2.2 Observation instrument
The instrument used was an observation schedule (see Appendix 1); a directly comparable version to that used in the previous classroom practice studies on Cohort 1 (2010 and 2011). It was designed to capture what teachers and students were doing at one-minute intervals during the lesson (instantaneous sampling, i.e. recording behaviour at that moment) and which language was being used. It was designed in reference to other instruments that measure classroom interaction and the features of CLT (e.g. Malamah-Thomas 1987, Spada 1990). At each minute of a lesson, the instrument enabled the following information to be recorded:
1. Whether the teacher or student(s) was/were speaking (in one of the columns under either ‘Teacher is speaking’ or ‘Students are speaking’).
2. Whether the students were carrying out an activity (in one of the columns under ‘Students are’).3. Whether visual materials were being used (in the ‘Visual materials’ column).
2 Hamid (2011: 197) indicates poor levels of English that have not improved despite several efforts to introduce communicative
approaches into the classroom. The overall framework for ELT is not always supportive of effective classroom practice (Education
Watch 2011; EIA 2009b; Hamid and Balfour 2008, Kraft et al. 2009, World Bank 2008). 3 There is evidence that less than 50% of secondary teachers receive any kind of training (UNESCO 2012: 138), and what
training is available to both primary and secondary teachers is weak and has had little effect in the past (Kraft et al. 2009: 8 & 14).
Classroom Practices of Primary and Secondary Teachers Participating in English in Action: Second Cohort (2013) 11
4. Whether another classroom activity was taking place which did not feature under ‘Teacher is speaking, ‘Students are speaking’ or ‘Students are’ columns (i.e. in the ‘Other activity’ column).
The instrument did not require an expert understanding of CLT practices, but did require the researchers undertaking the observations to have training to recognise the various classroom activities (presenting, organising, asking questions, giving feedback). The discussion in the Introduction (especially Section 1.3) on the important communicative approaches was used by the instrument designers when the instrument was first designed (2010) to define the categories that are valid for communicative approaches to ELT. This instrument was validated by the EIA team’s ELT experts and has been indirectly validated in a number of project Annual Reviews by ELT experts4.
In terms of the reliability of the instrument, there are two components: the nature of the items to be observed and the skill of the observers in using the schedule. On the former, all items rely on relatively low-level decisions being made: who is talking, in what language, if the teacher is talking, in what mode (presenting, organising, and so on), if students are talking, in what context (individual, pair, group, chorus) or whether students are doing one of three activities (reading, writing or listening to audio), along with two other items (visuals used or ‘other’). The second element to ensure maximum reliability is to make certain that the observers are trained and have experience of using the schedule in classrooms. Section 2.4 outlines the training given to the observers who, although not ELT experts, are following a higher degree programme in education, and have a good base level of understanding of classrooms and schools.
2.3 Sample
2.3.1 Sample design
A total of 4,368 teachers and approximately 887,000 students participated in EIA’s Cohort 2: 1,802 primary teachers (ATs) and 900 primary head teachers (HTs), and 1,666 secondary teachers (ATs); and approximately 195,000 primary students and 692,000 secondary students. This study was designed to reach approximately 10% of the total government teacher population (4,164 teachers) taking part in EIA Cohort 2.
A minimum sample size was determined through a power analysis, conducted to ensure the sample was sufficiently large to enable statistically valid comparisons between the 2010, 2011 and 2013 studies (see Appendix 2). The analysis established that a minimum sample size of 264 primary and 149 secondary classes (413 in total) should be observed.
On the basis of this, 416 teachers (266 primary; 150 secondary) from 208 schools (133 primary; 75 secondary – two teachers per school) were selected for the study across 14 upazilas. It was intended that one lesson of each of the 416 teachers would be observed.
A multi-layer stratified random sampling strategy underpinned the sample selection, with random sampling used at each stage where possible. The process began by selecting upazilas, then clusters within those upazilas, then schools within the clusters.
4 In the 2011 project Output to Purpose (Annual) Review, the review team specifically considered the observation schedule and
commended the project’s Research, Monitoring and Evaluation output saying the ‘quality of the work undertaken is strong’ (DFID
2011: 12).
12 Classroom Practices of Primary and Secondary Teachers Participating in English in Action: Second Cohort (2013)
Note that the same schools were selected for both this classroom practice study and the EIA perceptions study (EIA 2014b); and there was also sample crossover with the EIA English language proficiency study (EIA 2014a)5.
The actual sample achieved was 401 teachers (230 primary; 26 primary head teachers (HTs); 145 secondary) from 207 schools (130 primary; 77 secondary), very close to the original planned size. Overall, 47% of teachers were female; the gender split differed for primary and secondary (61% female for primary; 21% for secondary, which broadly reflects the gender proportions in the Government of Bangladesh school teacher generally)6 7.
A few issues hampered the data collection with the effect of slightly reducing the planned sample size and changing selection of teachers in some instances: a national strike by primary teachers; national hartals [political strikes] and blockades; difficulties due to geographical remoteness and associated transportation issues; and instances where selected teachers could not be observed because they had transferred to other schools or left their jobs. (In this final case, where possible, the researchers selected other teachers from the same school or from that area.)
2.3.2 Statistical comparisons of samples
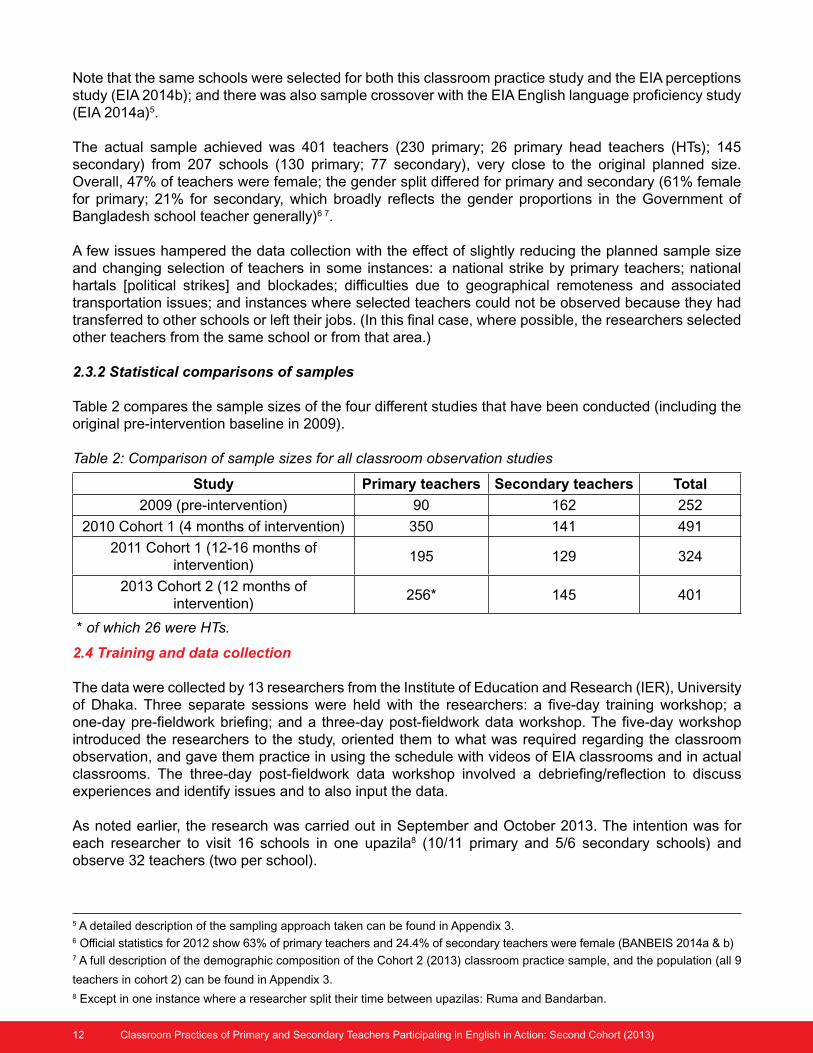
Table 2 compares the sample sizes of the four different studies that have been conducted (including the original pre-intervention baseline in 2009).
Table 2: Comparison of sample sizes for all classroom observation studies
Study Primary teachers Secondary teachers Total
2009 (pre-intervention) 90 162 252
2010 Cohort 1 (4 months of intervention) 350 141 491
2011 Cohort 1 (12-16 months of intervention)
195 129 324
2013 Cohort 2 (12 months of intervention)
256* 145 401
2.4 Training and data collection
The data were collected by 13 researchers from the Institute of Education and Research (IER), University of Dhaka. Three separate sessions were held with the researchers: a five-day training workshop; a one-day pre-fieldwork briefing; and a three-day post-fieldwork data workshop. The five-day workshop introduced the researchers to the study, oriented them to what was required regarding the classroom observation, and gave them practice in using the schedule with videos of EIA classrooms and in actual classrooms. The three-day post-fieldwork data workshop involved a debriefing/reflection to discuss experiences and identify issues and to also input the data.
As noted earlier, the research was carried out in September and October 2013. The intention was for each researcher to visit 16 schools in one upazila8 (10/11 primary and 5/6 secondary schools) and observe 32 teachers (two per school).
5 A detailed description of the sampling approach taken can be found in Appendix 3. 6 Official statistics for 2012 show 63% of primary teachers and 24.4% of secondary teachers were female (BANBEIS 2014a & b)7 A full description of the demographic composition of the Cohort 2 (2013) classroom practice sample, and the population (all 9
teachers in cohort 2) can be found in Appendix 3.8 Except in one instance where a researcher split their time between upazilas: Ruma and Bandarban.
* of which 26 were HTs.
Classroom Practices of Primary and Secondary Teachers Participating in English in Action: Second Cohort (2013) 13
The duration of the classes observed varied from 8 to 70 minutes, with an average for primary lessons of 29 minutes and for secondary of 33 minutes.
The researchers negotiated access to schools directly. Local education mangers were informed about the research taking place in their geographical area and their consent was gained prior to the fieldwork taking place.
2.5 Ethical issues
As part of the normal ethical procedures adhered to by EIA, prior permission was obtained from the head teacher, the teacher and the students. Each teacher was again asked for her/his verbal and written consent to be involved in the study at the time of the observation.
All information within the EIA project is held under strict confidentiality and all teachers and students observed are anonymous in this report.
2.6 Data entry, storage, management and analysis
The data were entered by the researchers into an Excel database from paper instruments in the post-fieldwork data workshop. The 13 databases were then collated into one dataset. Random checks were carried out on the data to identify potential miscoding and other errors. Before the analysis was carried out, the data were cleaned to prepare them for analysis (see Appendix 5 for details).
Count data analysis was conducted, which used the Poisson model to provide appropriate analyses for count data. Statistical comparisons were conducted through statistical methods, such as cross tabulation and statistical significance tests. Results are reported with degrees of freedom and sample size in parentheses, the p value and the significance. (All tests of significance, along with full data that support the figures used in this report, are given in Appendix 6.) In order to ensure rigorour in the analysis, the data were analysed independently by a highly-qualified statistician.
2.7 Limitations
As noted above, fieldwork plans were disrupted by an uncertain political context in September and October 2013 in the run up to the general election, with a series of nationwide hartals and blockades. Further to this, a strike was held by primary teachers which meant primary schools were closed in some areas. These events had the effect of changing almost daily which schools were available for field visits. Flexible and responsive field management and coordination largely overcame these challenges. While the actual sample achieved was a little smaller than planned, it was sufficient to enable comparability; and school and cluster selection remained both random and representative, with regard to the wider cohort under study.
Cohort 1 EIA intervention schools, teachers and students were selected in order to be representative of Government schools across Bangladesh, in terms of national divisions and rural and urban locations. But to further strengthen the programme’s social inclusion perspective, selection for the Cohort 2 upazilas (within the division) additionally took account of the UNICEF composite deprivation index (CDI), to ensure that EIA specifically targeted areas of greater social deprivation. The sample design for this study sought to obtain a representative sample of Cohort 2 teachers, but the selection of the cohort was inevitably biased towards high CDI areas, compared with the previous cohort and studies. Therefore, it is likely that the sample reported in this study, intended to be representative of Cohort 2, is associated with a higher than average CDI than the previous cohort and hence samples.
14 Classroom Practices of Primary and Secondary Teachers Participating in English in Action: Second Cohort (2013)
While the use of CDI in the selection of Cohort 2 intervention upazilas might lead to an expectation that the sample of Cohort 2 has a higher than average CDI than previous studies, it has not yet been possible to quantify this difference. Similarly, while we suspect it is possible, perhaps probable, that there may be a negative correlation between the CDI and classroom practice, we have not yet established this quantitatively. Therefore, further investigation is required, in order to establish:
1. the relationship between CDI of upazilas and classroom practice;2. the comparability of the sample in this study, and those of previous studies (EIA 2012), when CDI
is taken into account.
This change in composition risks limiting the improvement in classroom practice demonstrated by EIA teachers in Cohort 2 when compared with Cohort 1 findings.
As with all cases of classroom observation, the presence of the observer is likely to have had an effect on both the teacher and the students being observed. Teachers who were being observed may have felt an obligation to ‘perform’ the types of activities that are a focus of the EIA interventions. Although there is no way of knowing the importance of this effect, it is a common factor for all studies, and it is assumed not to add a particular bias to this current study.
Classroom Practices of Primary and Secondary Teachers Participating in English in Action: Second Cohort (2013) 15
3. Findings9
3.1 Primary classrooms
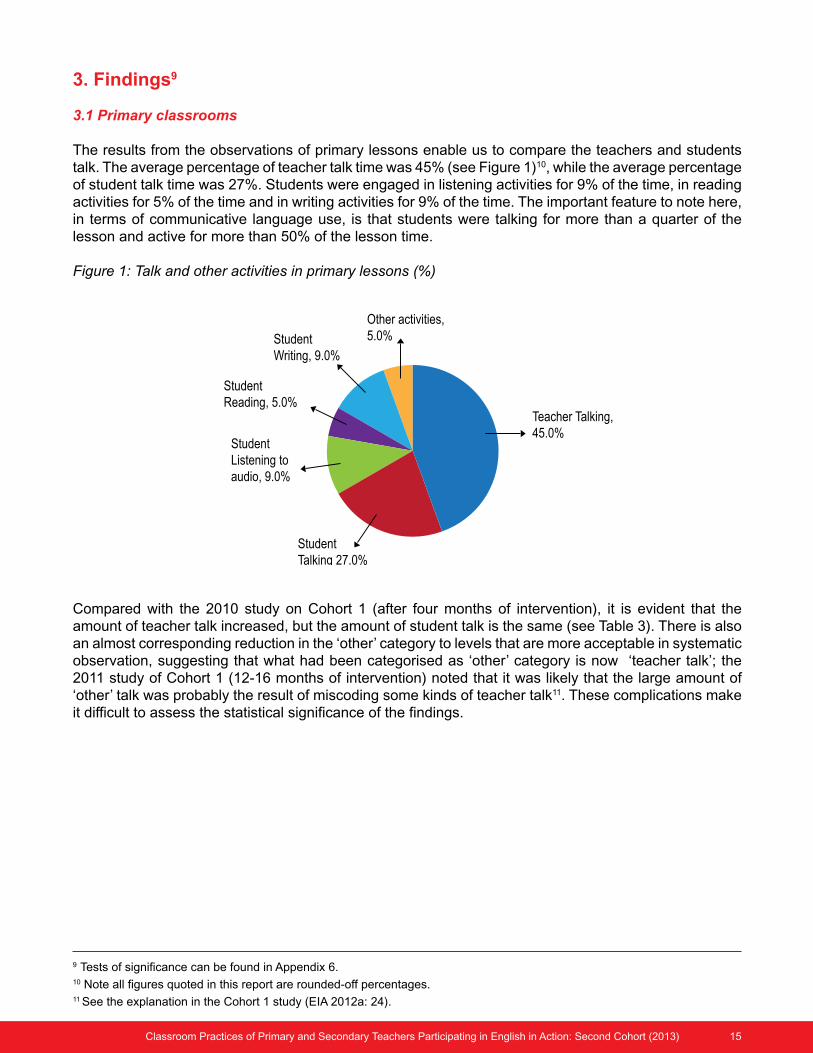
The results from the observations of primary lessons enable us to compare the teachers and students talk. The average percentage of teacher talk time was 45% (see Figure 1)10, while the average percentage of student talk time was 27%. Students were engaged in listening activities for 9% of the time, in reading activities for 5% of the time and in writing activities for 9% of the time. The important feature to note here, in terms of communicative language use, is that students were talking for more than a quarter of the lesson and active for more than 50% of the lesson time.
Figure 1: Talk and other activities in primary lessons (%)
Compared with the 2010 study on Cohort 1 (after four months of intervention), it is evident that the amount of teacher talk increased, but the amount of student talk is the same (see Table 3). There is also an almost corresponding reduction in the ‘other’ category to levels that are more acceptable in systematic observation, suggesting that what had been categorised as ‘other’ category is now ‘teacher talk’; the 2011 study of Cohort 1 (12-16 months of intervention) noted that it was likely that the large amount of ‘other’ talk was probably the result of miscoding some kinds of teacher talk11. These complications make it difficult to assess the statistical significance of the findings.
9 Tests of significance can be found in Appendix 6.10 Note all figures quoted in this report are rounded-off percentages.11 See the explanation in the Cohort 1 study (EIA 2012a: 24).
Teacher Talking,45.0%
Other activities,5.0%Student
Writing, 9.0%
StudentReading, 5.0%
StudentListening toaudio, 9.0%
StudentTalking 27.0%
16 Classroom Practices of Primary and Secondary Teachers Participating in English in Action: Second Cohort (2013)
Table 3: Comparison of primary classroom talk and other activities; Cohort 1 (2010) and 2 (2013) (% of lesson time)
Talk and other activities in lesson Cohort 1 (2010) Cohort 2 (2013)
Teacher talking 34% 45%
Student talking 27% 27%
Students listening (to audio) 10% 9%
Students writing 4% 9%
Students reading 4% 5%
Other 21% 5%
3.1.1 Primary teachers
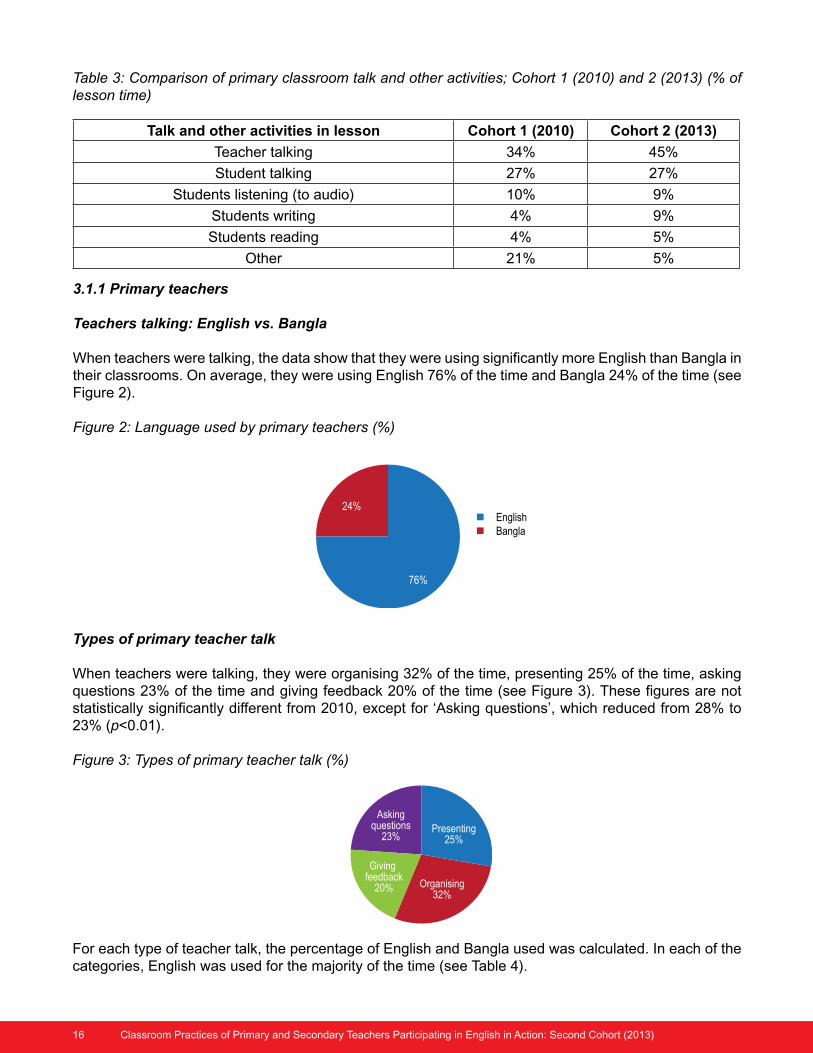
Teachers talking: English vs. Bangla When teachers were talking, the data show that they were using significantly more English than Bangla in their classrooms. On average, they were using English 76% of the time and Bangla 24% of the time (see Figure 2).
Figure 2: Language used by primary teachers (%)
76%
24% English Bangla
Askingquestions
23%Presenting
25%
Organising32%
Giving feedback
20%
Types of primary teacher talk
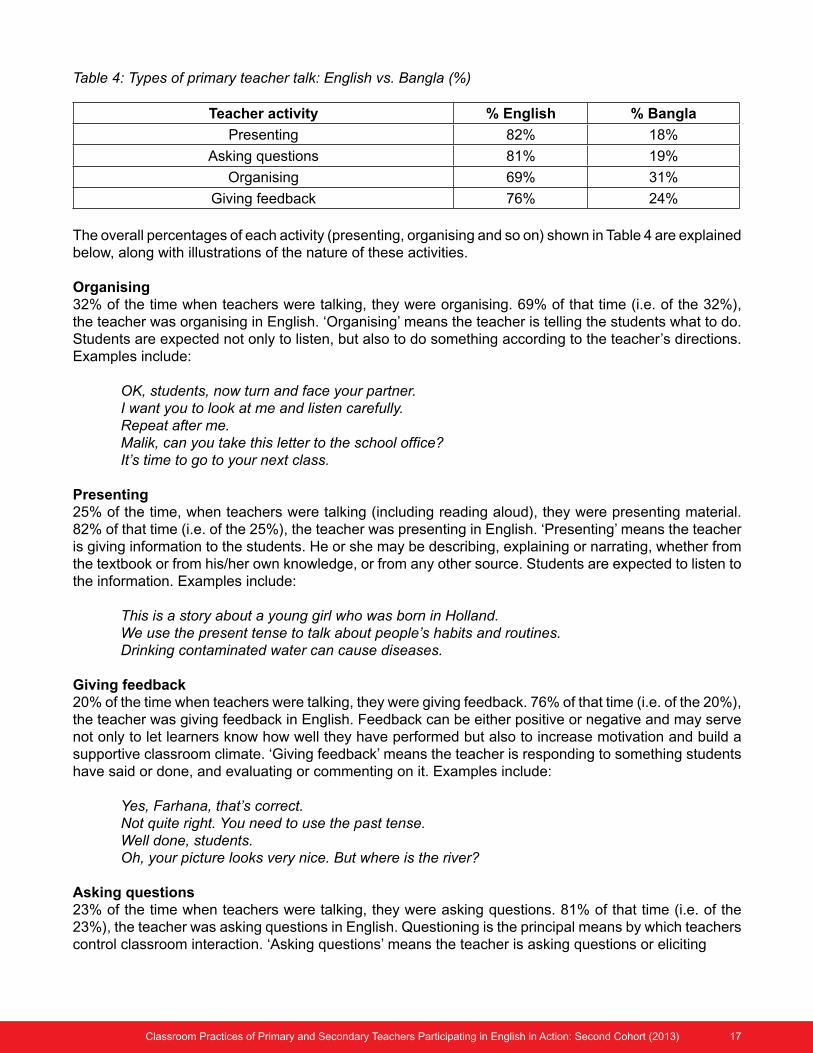
When teachers were talking, they were organising 32% of the time, presenting 25% of the time, asking questions 23% of the time and giving feedback 20% of the time (see Figure 3). These figures are not statistically significantly different from 2010, except for ‘Asking questions’, which reduced from 28% to 23% (p<0.01).
Figure 3: Types of primary teacher talk (%)
For each type of teacher talk, the percentage of English and Bangla used was calculated. In each of the categories, English was used for the majority of the time (see Table 4).
Classroom Practices of Primary and Secondary Teachers Participating in English in Action: Second Cohort (2013) 17
Table 4: Types of primary teacher talk: English vs. Bangla (%)
Teacher activity % English % Bangla
Presenting 82% 18%
Asking questions 81% 19%
Organising 69% 31%
Giving feedback 76% 24%
The overall percentages of each activity (presenting, organising and so on) shown in Table 4 are explained below, along with illustrations of the nature of these activities.
Organising 32% of the time when teachers were talking, they were organising. 69% of that time (i.e. of the 32%), the teacher was organising in English. ‘Organising’ means the teacher is telling the students what to do. Students are expected not only to listen, but also to do something according to the teacher’s directions. Examples include:
OK, students, now turn and face your partner. I want you to look at me and listen carefully. Repeat after me. Malik, can you take this letter to the school office? It’s time to go to your next class.
Presenting 25% of the time, when teachers were talking (including reading aloud), they were presenting material. 82% of that time (i.e. of the 25%), the teacher was presenting in English. ‘Presenting’ means the teacher is giving information to the students. He or she may be describing, explaining or narrating, whether from the textbook or from his/her own knowledge, or from any other source. Students are expected to listen to the information. Examples include:
This is a story about a young girl who was born in Holland. We use the present tense to talk about people’s habits and routines. Drinking contaminated water can cause diseases.
Giving feedback 20% of the time when teachers were talking, they were giving feedback. 76% of that time (i.e. of the 20%), the teacher was giving feedback in English. Feedback can be either positive or negative and may serve not only to let learners know how well they have performed but also to increase motivation and build a supportive classroom climate. ‘Giving feedback’ means the teacher is responding to something students have said or done, and evaluating or commenting on it. Examples include:
Yes, Farhana, that’s correct. Not quite right. You need to use the past tense. Well done, students. Oh, your picture looks very nice. But where is the river?
Asking questions 23% of the time when teachers were talking, they were asking questions. 81% of that time (i.e. of the 23%), the teacher was asking questions in English. Questioning is the principal means by which teachers control classroom interaction. ‘Asking questions’ means the teacher is asking questions or eliciting
18 Classroom Practices of Primary and Secondary Teachers Participating in English in Action: Second Cohort (2013)
information. Students are expected to respond verbally (as opposed to organising, when they respond non-verbally). Examples include:
What colour is the flag? Do you know what a ‘tiger’ is? Now I want you to think carefully and explain why we need vitamins in our diet. Can you tell me which lesson we are doing today?
Summary of changes in primary teacher practice
Here a summary is given in terms of the way in which the 2013 study compares with the Cohort 1 studies (2010 and 2011) and the original baseline (in as much as that can be done) on a number of important dimensions that relate to the improvement in teacher practice to make their ELT more effective through the use of a communicative approach. In particular, this is done through considering the amount of English they use in the classroom and the types of talk employed.
Substantial increase in teachers’ spoken EnglishWhereas, in the baseline (2009), the majority of teacher talk was in Bangla, in Cohort 2 teachers used English to communicate with students for the majority of the lesson, and the proportion of English spoken by Cohort 2 teachers showed a slight increase in the use of this target language compared with Cohort 1, though this is not statistically significant (Table 5).
Table 5: Comparison of primary teacher language (English Vs. Bangla): Cohorts 1 (2010, 2011) & 2 (2013) (% of time)
Language Cohort 1 (2010) Cohort 1 (2011) Cohort 2 (2013)
English 71% 72% 76%
Bangla 28% 28% 24%
Teacher activity Cohort 1 (2010) Cohort 1 (2011) Cohort 2 (2013)
Presenting 23% 40% 25%
Asking questions 28% 27% 23%
Organising 27% 22% 32%
Giving feedback 19% 11% 20%
It would be expected that teachers would use Bangla more for ‘Organising’ than other types of teacher talk, as is borne out in the data (see Table 4), because instructions tend to be more complex than the target language aimed for in the activity and can be much more easily explained in Bangla than by attempting to use English.
These findings mark a significant change from the classroom practices observed in the baseline studies (EIA 2009a & b), where only 27% of teachers spoke in English more than they did in Bangla, and where teachers tended to read from the textbook and speak in Bangla more than in English (in 67% of the lesson).
Substantial change in teachers’ activitiesTable 6 shows that the proportions of the Cohort 2 teachers’ talking activities were much the same as in 2010 (after four months of the pilot intervention), apart from ‘Asking questions’ where there is a statistically significant difference (p<0.01). There was an increase in the amount of time spent ‘Organising’ and decrease in time spent ‘Presenting’ compared to the 2011 study, though this helps to restore the situation to that found in the first study (2010).
Table 6: Comparison of primary teacher activity: Cohorts 1 (2010, 2011) & 2 (2013) (% of teacher talk)
Classroom Practices of Primary and Secondary Teachers Participating in English in Action: Second Cohort (2013) 19
Cohort 1 (2010)12 Cohort 1 (2011) Cohort 2 (2013)
Teacher activity English Bangla English Bangla English Bangla
Presenting 66% 24% 71% 29% 82% 18%
Asking questions 69% 22% 72% 28% 81% 19%
Organising 5% 33% 66% 34% 69% 31%
Giving feedback 68% 24% 83% 17% 76% 24%
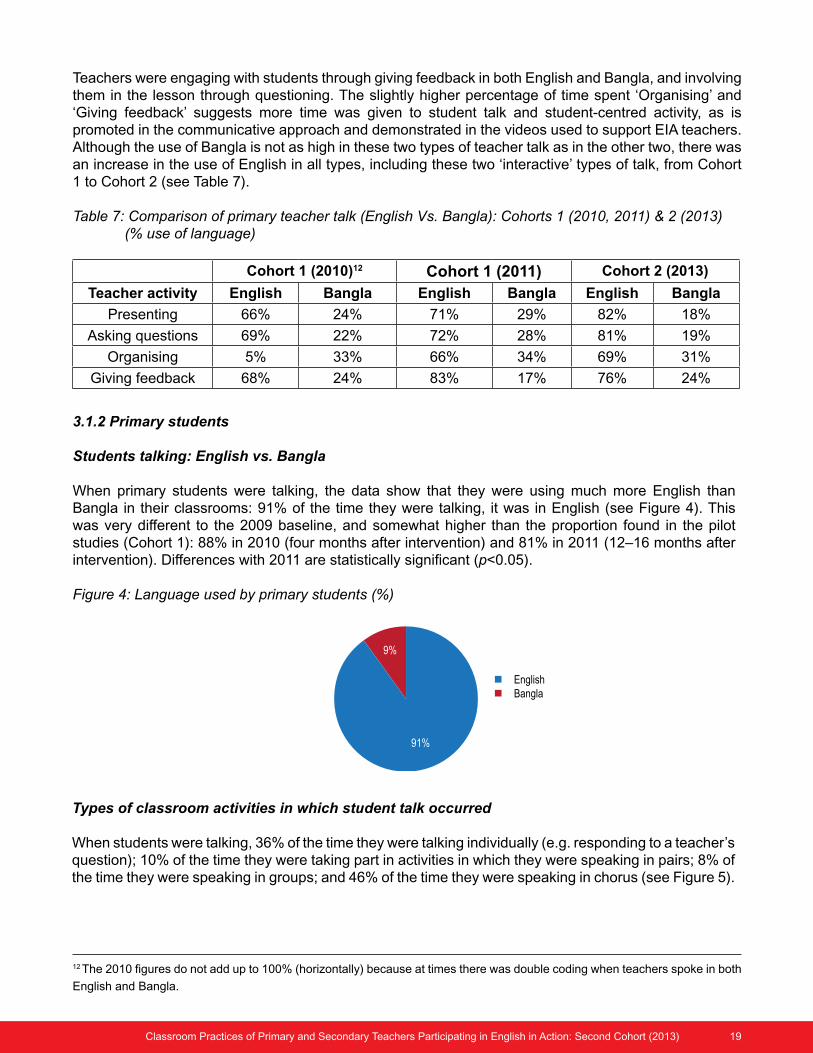
Teachers were engaging with students through giving feedback in both English and Bangla, and involving them in the lesson through questioning. The slightly higher percentage of time spent ‘Organising’ and ‘Giving feedback’ suggests more time was given to student talk and student-centred activity, as is promoted in the communicative approach and demonstrated in the videos used to support EIA teachers. Although the use of Bangla is not as high in these two types of teacher talk as in the other two, there was an increase in the use of English in all types, including these two ‘interactive’ types of talk, from Cohort 1 to Cohort 2 (see Table 7).
Table 7: Comparison of primary teacher talk (English Vs. Bangla): Cohorts 1 (2010, 2011) & 2 (2013) (% use of language)
3.1.2 Primary students
Students talking: English vs. Bangla
When primary students were talking, the data show that they were using much more English than Bangla in their classrooms: 91% of the time they were talking, it was in English (see Figure 4). This was very different to the 2009 baseline, and somewhat higher than the proportion found in the pilot studies (Cohort 1): 88% in 2010 (four months after intervention) and 81% in 2011 (12–16 months after intervention). Differences with 2011 are statistically significant (p<0.05).
Figure 4: Language used by primary students (%)
Types of classroom activities in which student talk occurred
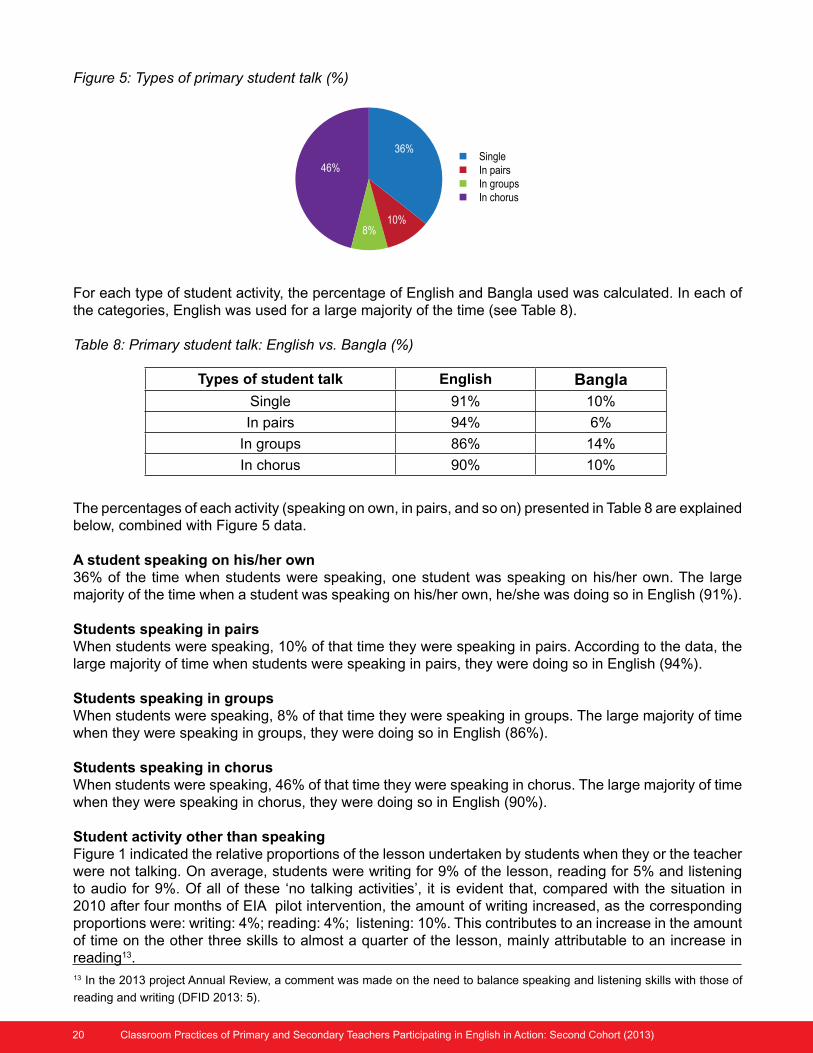
When students were talking, 36% of the time they were talking individually (e.g. responding to a teacher’s question); 10% of the time they were taking part in activities in which they were speaking in pairs; 8% of the time they were speaking in groups; and 46% of the time they were speaking in chorus (see Figure 5).
12 The 2010 figures do not add up to 100% (horizontally) because at times there was double coding when teachers spoke in both
English and Bangla.
91%
9%
English Bangla
20 Classroom Practices of Primary and Secondary Teachers Participating in English in Action: Second Cohort (2013)
Figure 5: Types of primary student talk (%)
10%8%
46%36%
Single In pairs In groups In chorus
For each type of student activity, the percentage of English and Bangla used was calculated. In each of the categories, English was used for a large majority of the time (see Table 8).
Table 8: Primary student talk: English vs. Bangla (%)
Types of student talk English BanglaSingle 91% 10%
In pairs 94% 6%
In groups 86% 14%
In chorus 90% 10%
The percentages of each activity (speaking on own, in pairs, and so on) presented in Table 8 are explained below, combined with Figure 5 data.
A student speaking on his/her own36% of the time when students were speaking, one student was speaking on his/her own. The large majority of the time when a student was speaking on his/her own, he/she was doing so in English (91%).
Students speaking in pairs When students were speaking, 10% of that time they were speaking in pairs. According to the data, the large majority of time when students were speaking in pairs, they were doing so in English (94%).
Students speaking in groups When students were speaking, 8% of that time they were speaking in groups. The large majority of time when they were speaking in groups, they were doing so in English (86%).
Students speaking in chorus When students were speaking, 46% of that time they were speaking in chorus. The large majority of time when they were speaking in chorus, they were doing so in English (90%).
Student activity other than speakingFigure 1 indicated the relative proportions of the lesson undertaken by students when they or the teacher were not talking. On average, students were writing for 9% of the lesson, reading for 5% and listening to audio for 9%. Of all of these ‘no talking activities’, it is evident that, compared with the situation in 2010 after four months of EIA pilot intervention, the amount of writing increased, as the corresponding proportions were: writing: 4%; reading: 4%; listening: 10%. This contributes to an increase in the amount of time on the other three skills to almost a quarter of the lesson, mainly attributable to an increase in reading13. 13 In the 2013 project Annual Review, a comment was made on the need to balance speaking and listening skills with those of
reading and writing (DFID 2013: 5).
Classroom Practices of Primary and Secondary Teachers Participating in English in Action: Second Cohort (2013) 21
Summary of primary student performance
As with primary teachers, this summary is given in terms of the way in which the 2013 study compares with the Cohort 1 studies (2010 and 2011) and the original baseline (in as much as can be done) onseveral important dimensions that relate to the improvement in the classroom to make EL learning more effective through the use of a communicative approach. In particular, this is done through considering the amount of English students used in the classroom, the types of talk employed and their participation in communicative activity.
Increase in student talkStudents were speaking for 27% of the lesson time, while teachers were talking for 45% of the time. Classic studies of US classrooms typically show student talk taking up around a quarter of the lesson (Flanders 1970)14. Therefore, student talk time in EIA classrooms is comparable to international standards. This also compares favourably with research into language classrooms, which established that teachers tend to do most of the classroom talk, with teacher talk around 70% of the total talk (Cook 2008, Chaudron 1988, Musumeci 1996). This proportion of student talk is identical to that in the 2010 Cohort 1 study (after four months of intervention); it is not possible to compare it with that in 2011, as a double-coding error for teacher and student talk prevented it from being computed.
Substantial increase in student use of EnglishStudents were using the target language (i.e. English) for 91% of the time they are speaking during a lesson. This marks a notable change from the results of the baseline studies, where students were found to be talking almost exclusively in Bangla. These figures are also higher than those found in the Cohort 1 studies, where students were using English 88% and 81% of the time they were talking (for 2010 and 2011 respectively).
Student participation in communicative activityThe fact that students were often engaged in activities in which they interact with their classmates marks a notable change from the baseline studies (2009a & b), which identified few occasions when individual students or groups were encouraged to speak in English (2–4% of the lesson time) and which showed that in most classes students were not interactive at all.
Just over a third of activities recorded required a response from an individual student, and there was a notable amount of pair and group work (18% in total), with more pair and group work recorded than in the Cohort 1 study in 2011 (p<0.05), where the total was over 9%, a recovery to the levels found in the 2010 study (see Table 9). Similarly, chorusing reduced to nearer the 2010 level, an approach that is seen as appropriate in language learning for young learners, particularly when teaching large classes. When the Cohort 2 study’s talk types were compared statistically with either of the Cohort 1 studies, a significant difference was found, except in the case of ‘single’ talk for Cohort 1, 2011 compared with Cohort 2, and ‘talk in pairs’ for Cohort 1, 2010 compared with Cohort 2.
14 Flanders also had the ‘two-thirds rule’: two-thirds of the lesson is talk, two-thirds of the talk is by the teacher and two-thirds of
teacher talk is presenting, giving instructions or exposition. The typical EIA classroom corresponds to this rule.
22 Classroom Practices of Primary and Secondary Teachers Participating in English in Action: Second Cohort (2013)
Table 9: Comparison of types of primary student talk: Cohorts 1 (2010, 2011) & 2 (2013) (% of student talk)
Types of student talk Cohort 1 (2010) Cohort 1 (2011) Cohort 2 (2013)
Single 30% 38% 36%
In pairs 14% 5% 10%
In groups 16% 4% 8%
In chorus 40% 53% 46%
3.1.3 Summary of changes in primary student and teacher practices
It is possible to consider the talk and activities of primary students and teachers in terms of typical lesson time found in these classrooms. The average class duration of the primary lessons observed was 37 minutes. Using this length of lesson as an average, the lesson might look like this:
In a lesson of 37 minutes, the teacher was speaking for 17 minutes and the students were speaking for 10 minutes. For 3 minutes of the lesson, the students were listening to audio materials, for 2 minutes they were reading and for 3 minutes they were writing. Of the 10 minutes when students were speaking, they were talking in English for 9 of those minutes. In total, students were active for 18 minutes i.e. 50% of the lesson.
Of the 17 minutes when teachers were talking, they were speaking in English for about 13 minutes. Of those 17 minutes, teachers were presenting for 4 minutes, organising for more than 5 minutes, giving feedback for 3 minutes and asking questions for 4 minutes. These activities were happening in English the majority of the time. Other activities were going on for 2 minutes.
3.2 Secondary classrooms
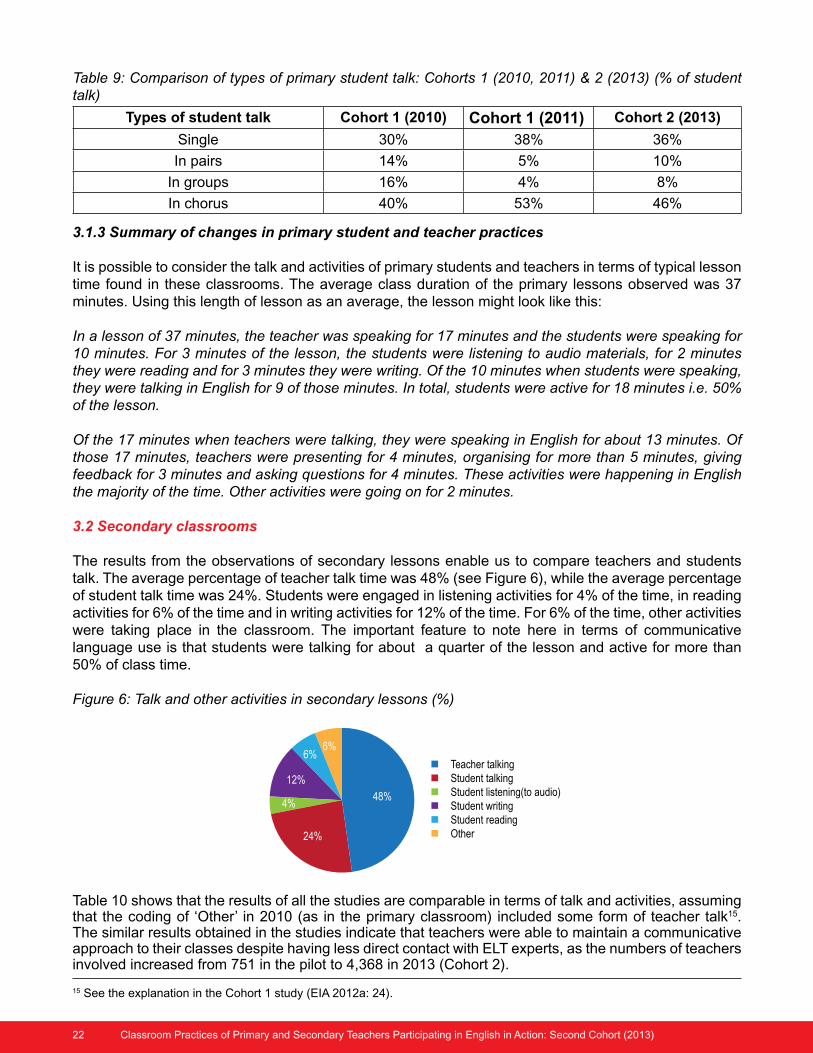
The results from the observations of secondary lessons enable us to compare teachers and students talk. The average percentage of teacher talk time was 48% (see Figure 6), while the average percentage of student talk time was 24%. Students were engaged in listening activities for 4% of the time, in reading activities for 6% of the time and in writing activities for 12% of the time. For 6% of the time, other activities were taking place in the classroom. The important feature to note here in terms of communicative language use is that students were talking for about a quarter of the lesson and active for more than 50% of class time.
Figure 6: Talk and other activities in secondary lessons (%)
6%6%
24%
12%
4% 48%
Teacher talking Student talking Student listening(to audio) Student writing Student reading Other
Table 10 shows that the results of all the studies are comparable in terms of talk and activities, assuming that the coding of ‘Other’ in 2010 (as in the primary classroom) included some form of teacher talk15. The similar results obtained in the studies indicate that teachers were able to maintain a communicative approach to their classes despite having less direct contact with ELT experts, as the numbers of teachers involved increased from 751 in the pilot to 4,368 in 2013 (Cohort 2).
15 See the explanation in the Cohort 1 study (EIA 2012a: 24).
Classroom Practices of Primary and Secondary Teachers Participating in English in Action: Second Cohort (2013) 23
Talk and other activities in lesson Cohort 1 (2010) Cohort 1 (2011) Cohort 2 (2013)
Teacher talking 33% 50% 48%
Student talking 23% 24% 24%
Students listening (to audio) 4% 3% 4%
Students writing 8% 9% 12%
Students reading 4% 4% 6%Other 28% 10% 6%
Table 10: Comparison of secondary classroom talk and other activities: Cohorts 1 (2010, 2011) & 2 (2013) (% of lesson)
3.2.1 Secondary teachers
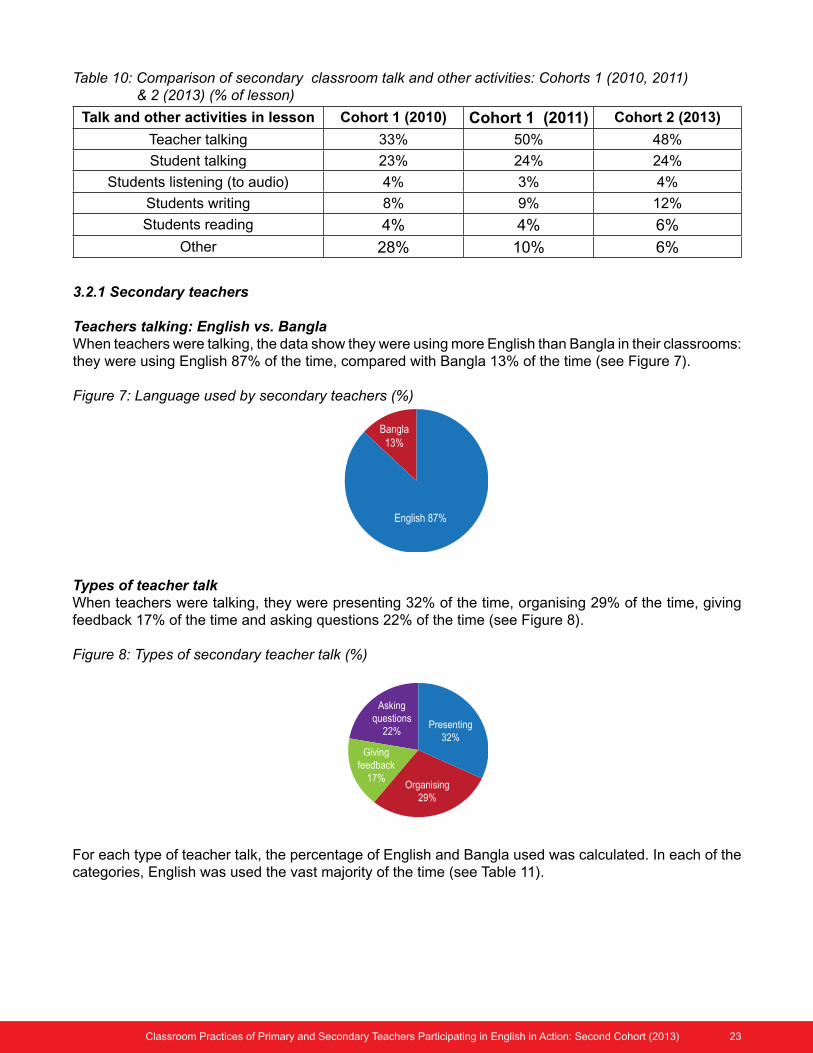
Teachers talking: English vs. Bangla When teachers were talking, the data show they were using more English than Bangla in their classrooms: they were using English 87% of the time, compared with Bangla 13% of the time (see Figure 7).
Figure 7: Language used by secondary teachers (%)
English 87%
Bangla13%
Organising29%
Givingfeedback
17%
Askingquestions
22% Presenting32%
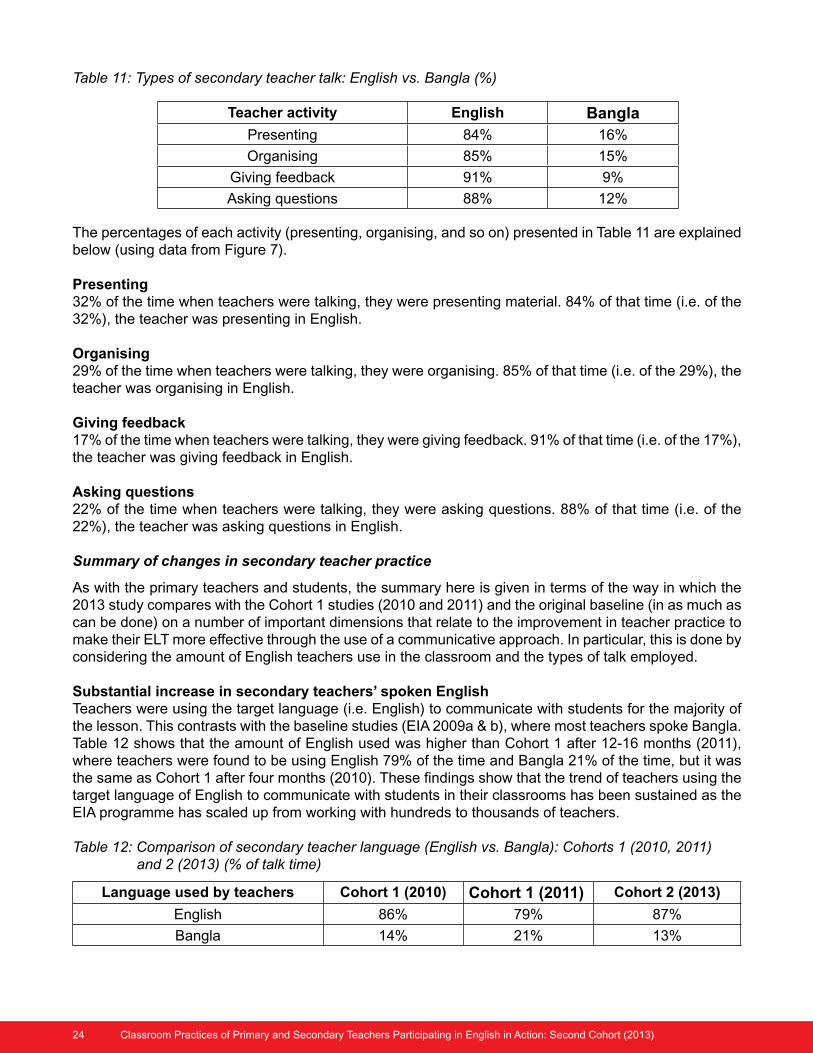
Types of teacher talk When teachers were talking, they were presenting 32% of the time, organising 29% of the time, giving feedback 17% of the time and asking questions 22% of the time (see Figure 8).
Figure 8: Types of secondary teacher talk (%)
For each type of teacher talk, the percentage of English and Bangla used was calculated. In each of the categories, English was used the vast majority of the time (see Table 11).
24 Classroom Practices of Primary and Secondary Teachers Participating in English in Action: Second Cohort (2013)
The percentages of each activity (presenting, organising, and so on) presented in Table 11 are explained below (using data from Figure 7).
Presenting 32% of the time when teachers were talking, they were presenting material. 84% of that time (i.e. of the 32%), the teacher was presenting in English.
Organising 29% of the time when teachers were talking, they were organising. 85% of that time (i.e. of the 29%), the teacher was organising in English.
Giving feedback 17% of the time when teachers were talking, they were giving feedback. 91% of that time (i.e. of the 17%), the teacher was giving feedback in English.
Asking questions 22% of the time when teachers were talking, they were asking questions. 88% of that time (i.e. of the 22%), the teacher was asking questions in English.
Summary of changes in secondary teacher practice
As with the primary teachers and students, the summary here is given in terms of the way in which the 2013 study compares with the Cohort 1 studies (2010 and 2011) and the original baseline (in as much as can be done) on a number of important dimensions that relate to the improvement in teacher practice to make their ELT more effective through the use of a communicative approach. In particular, this is done by considering the amount of English teachers use in the classroom and the types of talk employed.
Substantial increase in secondary teachers’ spoken English Teachers were using the target language (i.e. English) to communicate with students for the majority of the lesson. This contrasts with the baseline studies (EIA 2009a & b), where most teachers spoke Bangla. Table 12 shows that the amount of English used was higher than Cohort 1 after 12-16 months (2011), where teachers were found to be using English 79% of the time and Bangla 21% of the time, but it was the same as Cohort 1 after four months (2010). These findings show that the trend of teachers using the target language of English to communicate with students in their classrooms has been sustained as the EIA programme has scaled up from working with hundreds to thousands of teachers.
Table 12: Comparison of secondary teacher language (English vs. Bangla): Cohorts 1 (2010, 2011) and 2 (2013) (% of talk time)
Language used by teachers Cohort 1 (2010) Cohort 1 (2011) Cohort 2 (2013)
English 86% 79% 87%
Bangla 14% 21% 13%
Teacher activity English BanglaPresenting 84% 16%
Organising 85% 15%
Giving feedback 91% 9%
Asking questions 88% 12%
Table 11: Types of secondary teacher talk: English vs. Bangla (%)
Classroom Practices of Primary and Secondary Teachers Participating in English in Action: Second Cohort (2013) 25
Change in teachers’ activitiesWhen comparing data gathered in the 2013 study (Cohort 2) with that of the 2011 study (Cohort 1), it can be seen that teachers’ presentation time fell to approximately a third of the lesson and, as with primary teachers, returned to the level of the 2010 study of Cohort 1 (Table 13). The time spent ‘organising’ increased slightly above the levels in both of the Cohort 1 studies. While moving away from traditional practice requires support, there is growing evidence of communicative activity in the classroom, as teachers were spending more time organising the lesson and were engaging with students through feedback and involving them in the lesson through questioning.
As with the primary lessons, the profile of teacher activity changed slightly, with time more evenly distributed across the four activities. The difference between the organising in 2010 and 2013 and presenting between 2011 and 2013 is significant (p<0.05). This reflects a very different picture to that of the teacher-focused baseline studies (2009a & b), where teachers tended to spend most of their time presenting from the textbook.
Table 13: Comparison of secondary teacher activity: Cohorts 1 (2010, 2011) & 2 (2013) (% of teacher talk)
Teacher activity Cohort 1 (2010) Cohort 1 (2011) Cohort 2 (2013)
Presenting 30% 45% 32%
Asking questions 26% 23% 22%
Organising 20% 22% 29%Giving feedback 24% 10% 17%
3.2.2 Secondary students
A communicative classroom shows evidence of all four skills (speaking, listening, writing and reading) being used in an integrated manner. In the classes observed, students were speaking for 24% of the lesson time (see Figure 6). Students were engaged in listening activities with the audio for 4% of the time, reading activities for 6% of the time and writing activities for 12% of the time. Students were therefore active for over 50% of the lesson. We can assume that most of this listening activity took place in English as EIA audio materials are in English. Furthermore, as the students’ reading and writing tasks focus around the textbook, which is in English, one can also assume that the majority of this activity took place in English.
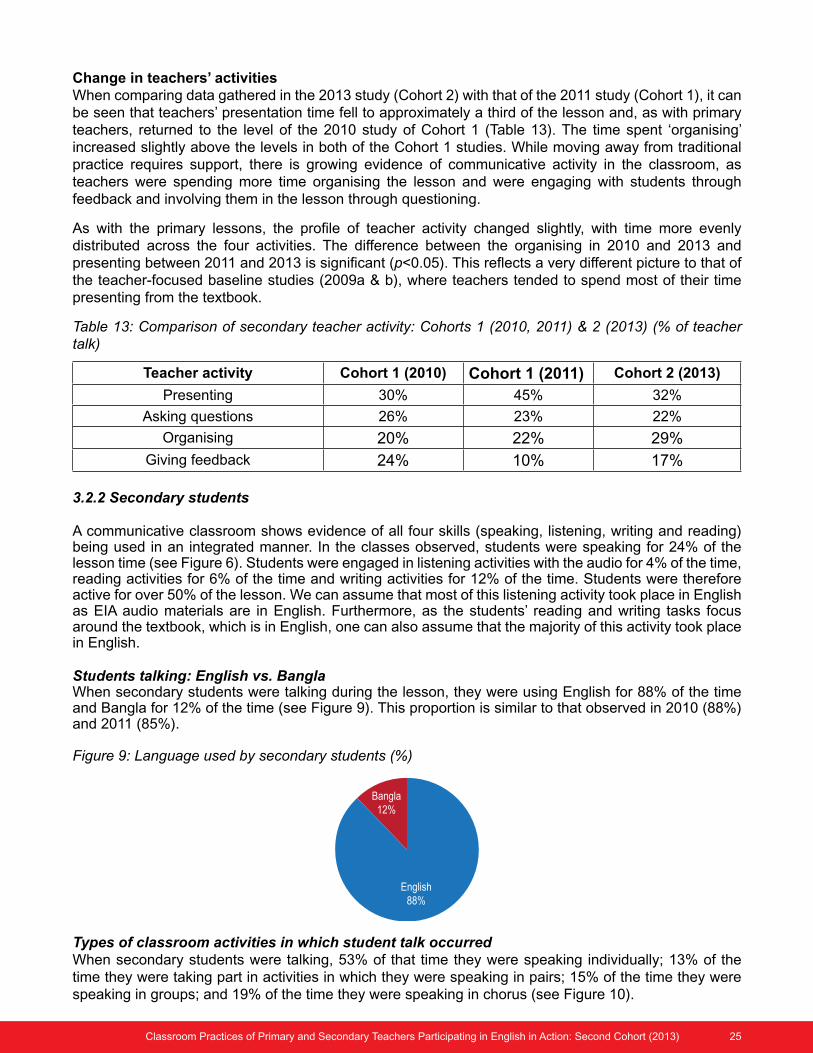
Students talking: English vs. Bangla When secondary students were talking during the lesson, they were using English for 88% of the time and Bangla for 12% of the time (see Figure 9). This proportion is similar to that observed in 2010 (88%) and 2011 (85%).
Figure 9: Language used by secondary students (%)
English88%
Bangla12%
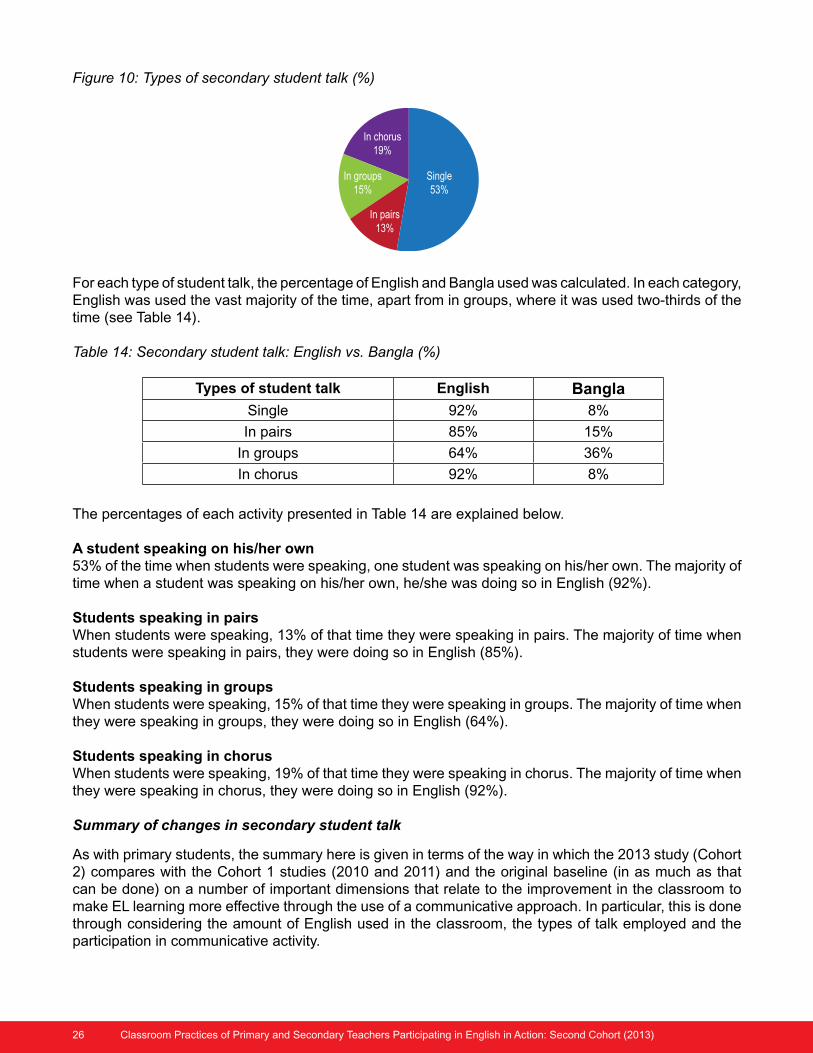
Types of classroom activities in which student talk occurred When secondary students were talking, 53% of that time they were speaking individually; 13% of the time they were taking part in activities in which they were speaking in pairs; 15% of the time they were speaking in groups; and 19% of the time they were speaking in chorus (see Figure 10).
26 Classroom Practices of Primary and Secondary Teachers Participating in English in Action: Second Cohort (2013)
Figure 10: Types of secondary student talk (%)
Single53%
In pairs13%
In chorus19%
In groups15%
For each type of student talk, the percentage of English and Bangla used was calculated. In each category, English was used the vast majority of the time, apart from in groups, where it was used two-thirds of the time (see Table 14).
Table 14: Secondary student talk: English vs. Bangla (%)
Types of student talk English BanglaSingle 92% 8%
In pairs 85% 15%
In groups 64% 36%
In chorus 92% 8%
The percentages of each activity presented in Table 14 are explained below.
A student speaking on his/her own 53% of the time when students were speaking, one student was speaking on his/her own. The majority of time when a student was speaking on his/her own, he/she was doing so in English (92%).
Students speaking in pairs When students were speaking, 13% of that time they were speaking in pairs. The majority of time when students were speaking in pairs, they were doing so in English (85%).
Students speaking in groups When students were speaking, 15% of that time they were speaking in groups. The majority of time when they were speaking in groups, they were doing so in English (64%).
Students speaking in chorus When students were speaking, 19% of that time they were speaking in chorus. The majority of time when they were speaking in chorus, they were doing so in English (92%).
Summary of changes in secondary student talk
As with primary students, the summary here is given in terms of the way in which the 2013 study (Cohort 2) compares with the Cohort 1 studies (2010 and 2011) and the original baseline (in as much as that can be done) on a number of important dimensions that relate to the improvement in the classroom to make EL learning more effective through the use of a communicative approach. In particular, this is done through considering the amount of English used in the classroom, the types of talk employed and the participation in communicative activity.
Classroom Practices of Primary and Secondary Teachers Participating in English in Action: Second Cohort (2013) 27
Increase in student talkStudents were speaking for 24% of the lesson time, with teachers talking for 48% of the time. As indicated for primary students, secondary student talk time in EIA classrooms is comparable to international standards, and compares favourably with research into language classrooms. The proportions of student talk across the three studies is similar (23 or 24%), thus indicating that Cohort 2 has the same level of secondary student talk as in Cohort 1, despite the more demanding implementation conditions.
Increase in students’ spoken EnglishStudents were using the target language (i.e. English) for 88% of the time that they are speaking during a lesson. Again, this figure was similar to that in Cohort 1 (88% in 2010 and 85% in 2011 studies). This marks an important change in the classroom practices observed in the baseline studies (2009a & b), where only a small proportion of students spoke in English during a lesson, while most students were found to be talking almost exclusively in Bangla.
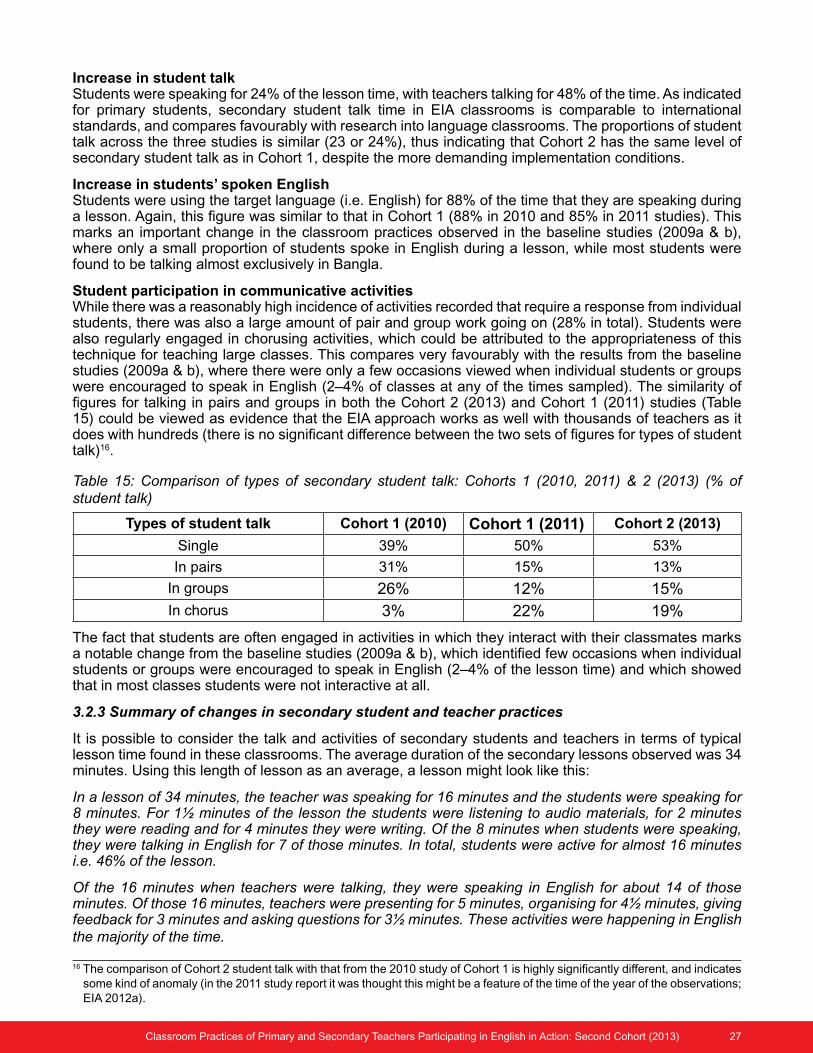
Student participation in communicative activitiesWhile there was a reasonably high incidence of activities recorded that require a response from individual students, there was also a large amount of pair and group work going on (28% in total). Students were also regularly engaged in chorusing activities, which could be attributed to the appropriateness of this technique for teaching large classes. This compares very favourably with the results from the baseline studies (2009a & b), where there were only a few occasions viewed when individual students or groups were encouraged to speak in English (2–4% of classes at any of the times sampled). The similarity of figures for talking in pairs and groups in both the Cohort 2 (2013) and Cohort 1 (2011) studies (Table 15) could be viewed as evidence that the EIA approach works as well with thousands of teachers as it does with hundreds (there is no significant difference between the two sets of figures for types of student talk)16.
Table 15: Comparison of types of secondary student talk: Cohorts 1 (2010, 2011) & 2 (2013) (% of student talk)
Types of student talk Cohort 1 (2010) Cohort 1 (2011) Cohort 2 (2013)
Single 39% 50% 53%
In pairs 31% 15% 13%
In groups 26% 12% 15%In chorus 3% 22% 19%
The fact that students are often engaged in activities in which they interact with their classmates marks a notable change from the baseline studies (2009a & b), which identified few occasions when individual students or groups were encouraged to speak in English (2–4% of the lesson time) and which showed that in most classes students were not interactive at all.
3.2.3 Summary of changes in secondary student and teacher practices
It is possible to consider the talk and activities of secondary students and teachers in terms of typical lesson time found in these classrooms. The average duration of the secondary lessons observed was 34 minutes. Using this length of lesson as an average, a lesson might look like this:
In a lesson of 34 minutes, the teacher was speaking for 16 minutes and the students were speaking for 8 minutes. For 1½ minutes of the lesson the students were listening to audio materials, for 2 minutes they were reading and for 4 minutes they were writing. Of the 8 minutes when students were speaking, they were talking in English for 7 of those minutes. In total, students were active for almost 16 minutes i.e. 46% of the lesson.
Of the 16 minutes when teachers were talking, they were speaking in English for about 14 of those minutes. Of those 16 minutes, teachers were presenting for 5 minutes, organising for 4½ minutes, giving feedback for 3 minutes and asking questions for 3½ minutes. These activities were happening in English the majority of the time.
16 The comparison of Cohort 2 student talk with that from the 2010 study of Cohort 1 is highly significantly different, and indicates some kind of anomaly (in the 2011 study report it was thought this might be a feature of the time of the year of the observations; EIA 2012a).
28 Classroom Practices of Primary and Secondary Teachers Participating in English in Action: Second Cohort (2013)
4. Conclusions
4.1 Research questions
The purpose of this study was to determine the extent of any changes observed in the classroom practice of teachers participating in EIA in the second cohort, with reference to that observed in the baseline studies (2009a & b) of a sample of schools prior to the intervention, and to that in the pilot cohort (Cohort 1). The pilot phase involved working with 751 teachers and this 2013 study was designed to see whether changes witnessed in the pilot were repeated in Cohort 2 working with 4,368 teachers, after 12 months of intervention. The study provides insight into aspects of CLT and interactive pedagogy outlined below and presents evidence of sustained positive change in teacher practices and the use of English in the classes observed. In particular, the study sought to investigate two research questions:
1. To what extent do the teachers of Cohort 2 show improved classroom practice, particularly in relation to the amount and language of student talk, compared with the pre-intervention baseline?
2. To what extent has the programme been successful in repeating the post-intervention improvements in teachers’ classroom practice seen in Cohort 1, at the much larger scale of Cohort 2?
Teacher and student talk and activities in both primary and secondary classrooms have been compared across four studies: pre-intervention (2009), Cohort 1 (after four months and 12-16 months of intervention; 2010 & 2011), Cohort 2 (after 12 months of intervention; 2013). The dimensions considered have been:
i) the amount of student talk, compared with teacher talk;ii) the use of English by students;iii) the use of English by teachers; iv) the nature of the teacher talk;v) the nature of the student activities.
Each of these activities are examined in Table 16 in relation to the research questions (comparison against the 2009 pre-intervention baseline and Cohort 1 studies in 2010 and 2011).
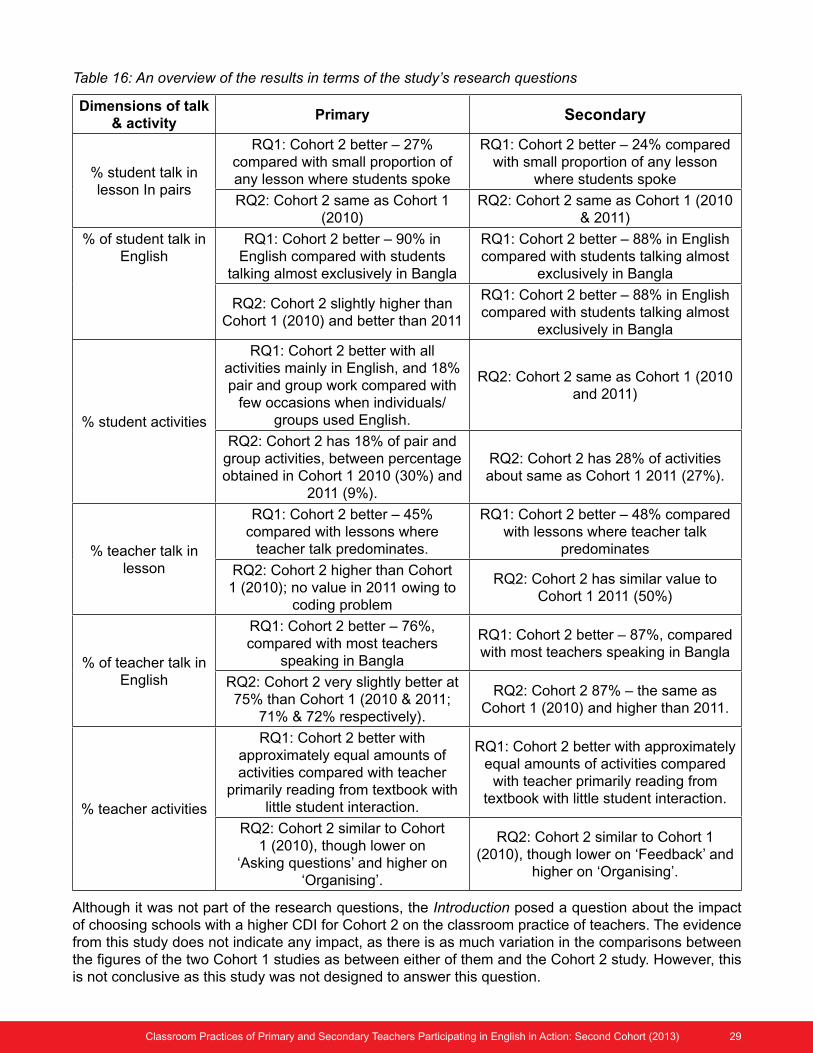
Classroom Practices of Primary and Secondary Teachers Participating in English in Action: Second Cohort (2013) 29
Table 16: An overview of the results in terms of the study’s research questions
Dimensions of talk & activity
Primary Secondary
% student talk in lesson In pairs
RQ1: Cohort 2 better – 27% compared with small proportion of any lesson where students spoke
RQ1: Cohort 2 better – 24% compared with small proportion of any lesson
where students spoke
RQ2: Cohort 2 same as Cohort 1 (2010)
RQ2: Cohort 2 same as Cohort 1 (2010 & 2011)
% of student talk in English
RQ1: Cohort 2 better – 90% in English compared with students
talking almost exclusively in Bangla
RQ1: Cohort 2 better – 88% in English compared with students talking almost
exclusively in Bangla
RQ2: Cohort 2 slightly higher than Cohort 1 (2010) and better than 2011
RQ1: Cohort 2 better – 88% in English compared with students talking almost
exclusively in Bangla
% student activities
RQ1: Cohort 2 better with all activities mainly in English, and 18% pair and group work compared with
few occasions when individuals/groups used English.
RQ2: Cohort 2 same as Cohort 1 (2010 and 2011)
RQ2: Cohort 2 has 18% of pair and group activities, between percentage obtained in Cohort 1 2010 (30%) and
2011 (9%).
RQ2: Cohort 2 has 28% of activities about same as Cohort 1 2011 (27%).
% teacher talk in lesson
RQ1: Cohort 2 better – 45% compared with lessons where
teacher talk predominates.
RQ1: Cohort 2 better – 48% compared with lessons where teacher talk
predominates
RQ2: Cohort 2 higher than Cohort 1 (2010); no value in 2011 owing to
coding problem
RQ2: Cohort 2 has similar value to Cohort 1 2011 (50%)
% of teacher talk in English
RQ1: Cohort 2 better – 76%, compared with most teachers
speaking in Bangla
RQ1: Cohort 2 better – 87%, compared with most teachers speaking in Bangla
RQ2: Cohort 2 very slightly better at 75% than Cohort 1 (2010 & 2011;
71% & 72% respectively).
RQ2: Cohort 2 87% – the same as Cohort 1 (2010) and higher than 2011.
% teacher activities
RQ1: Cohort 2 better with approximately equal amounts of activities compared with teacher
primarily reading from textbook with little student interaction.
RQ1: Cohort 2 better with approximately equal amounts of activities compared
with teacher primarily reading from textbook with little student interaction.
RQ2: Cohort 2 similar to Cohort 1 (2010), though lower on
‘Asking questions’ and higher on ‘Organising’.
RQ2: Cohort 2 similar to Cohort 1 (2010), though lower on ‘Feedback’ and
higher on ‘Organising’.
Although it was not part of the research questions, the Introduction posed a question about the impact of choosing schools with a higher CDI for Cohort 2 on the classroom practice of teachers. The evidence from this study does not indicate any impact, as there is as much variation in the comparisons between the figures of the two Cohort 1 studies as between either of them and the Cohort 2 study. However, this is not conclusive as this study was not designed to answer this question.
30 Classroom Practices of Primary and Secondary Teachers Participating in English in Action: Second Cohort (2013)
4.2 Summary of findings
4.2.1 The amount of teacher talk time versus the amount of student talk time
The study found that in both primary and secondary classes, teacher talk time took up just less than half the lesson, while student talk time took up approximately a quarter of the lesson. This compares favourably with other research into language classrooms, which established that teachers tend to do most of the classroom talk, with teacher talk around 70% of the total talk (Chaudron 1988, Cook 2008, Musumeci 1996). This marks an improvement from the findings in the baseline studies (EIA 2009a & b), which showed that in only a small proportion of lessons did the students have opportunities to participate actively in discussion.
4.2.2 Teachers’ use of English
The results show that both primary and secondary teachers in the EIA intervention were observed to be using English the majority of the time; the primary teachers used English 76% of the time, while the secondary teachers used English 87% of the time. This is a marked contrast to the baseline studies (EIA 2009a & b), where teachers spoke English less than Bangla in two-thirds of the lessons; it also improved on the Cohort 1 2011 study (EIA 2012a), where primary teachers used English 72% of the time and secondary teachers 79% of the time.
4.2.3 Students’ use of English
The data clearly support the observation that both primary and secondary students are using English the majority of the time when they spoke in lessons (91% of the time in primary and 88% of the time in secondary). This marks a notable change from the results of the baseline studies (EIA 2009a & b), which showed that students spoke in English in only a small proportion of lessons, and also shows a slight improvement on the Cohort 1 2011 study (EIA 2012a), particularly in primary lessons where students were observed to speak in English for 81% of the time (and 85% of the time in secondary lessons).
4.2.4 Teachers’ use of interactive teaching strategies
These latest findings mark a notable increase in the time teachers spent organising and a decrease in the time spent presenting when compared with the baseline (2009) and with the Cohort 1 2011 study. The results show that both primary and secondary teachers were using a wide range of activities in the classroom and involving students in these activities. In this study, primary teachers were found to be organising 32% of the time, presenting 25% of the time, asking questions 23% of the time, and giving feedback 20% of the time. Secondary teachers were found to be organising 29% of the time, presenting 32% of the time, asking questions 22% of the time, and giving feedback 17% of the time. This is a change from the baseline studies (EIA 2009a & b), where teachers were observed to be primarily reading from the textbook and rarely involving students in activities.
This more balanced percentage of time spent asking questions, organising, presenting and giving feedback indicates that teachers made great and sustained efforts to involve students in their English lessons.
4.2.5 Students’ participation in interactive activities
The results show evidence of student pair and group work being used in both primary and secondary classrooms. When students were talking, 36% of the time they were talking individually in primary and 53% in secondary classrooms; 10% of the time they were taking part in activities in which they were
Classroom Practices of Primary and Secondary Teachers Participating in English in Action: Second Cohort (2013) 31
speaking in pairs in primary and 13% in secondary; 8% of the time they were speaking in groups in primary and 15% in secondary; and 46% of the time they were speaking in chorus in primary and 19% in secondary.
In secondary classrooms, students were interacting with each other in pairs or groups for 28% of the class time and approximately 75% of that time was spent speaking in English. In primary classrooms, students were interacting in pairs and groups for 18% of the time, of which 90% was in English. This marks a notable change from the baseline studies (EIA 2009a & b), which identified few occasions when individual students or groups were encouraged to speak in English (2–4% of the lesson time) and which showed that in most classes students were not interactive at all. The figures also compare very closely with the Cohort 1 (2011) study (EIA 2012a), which observed secondary students working in pairs and groups for 28% of the time, and primary students for 10% of the time, thus showing a sustained use of interactive pair and group activities within English classes at scale.
4.2.6 The range of language skills practised in a lesson
The current study observed that secondary students were involved in speaking and listening activities for 28% of their lessons (24% speaking and 4% listening), reading activities for 6% of the lesson and writing activities for 12% of the lesson. This marks a change from the results of the baseline studies (EIA 2009a & b), where teachers tended to read from the textbook, ask closed questions or move around the classroom monitoring and facilitating students as they worked individually. All other pedagogic activities were observed in less than 10% of classes. The Cohort 2 (2013) study shows slightly more time spent speaking and listening than the Cohort 1(2011) study (24% and 3% respectively).
4.2.7 Teachers’ use of audio
The results indicate that teachers were using audio materials for 4% of secondary lessons on average and 9% of primary lessons. The findings of the baseline studies (EIA 2009a & b) did not indicate that audio materials were being used in any of the classes observed.
4.2.8 In Summary
In summary, the 2013 cohort of teachers observed in the EIA programme were using more English in their classes, involving students in more activities and encouraging them to spend more of their class time speaking in English.
32 Classroom Practices of Primary and Secondary Teachers Participating in English in Action: Second Cohort (2013)
5. Recommendations
This study shows that the EIA school interventions have been helping teachers to implement CLT practices in their classrooms, and that both cohorts achieved a similar degree of success. The higher number of teachers involved in Phase III Cohort 2 (4,368) and the inevitable reduction of face-to-face direct contact with experts in the ELT field (both national and international) and commensurate increase in peer support compared with the pilot phase intervention (Cohort 1) does not seem to have had any negative impact on teachers’ classroom practice. Indeed, the more even division between the four elements of presenting, organising, asking questions and giving feedback evidenced in this current study suggests that teachers are being heavily influenced by input from the mediated video resources that model this practice. A comparison with the qualitative research (EIA 2014d) may show some interesting synergies in this area.
The focus on appropriate classroom language in the EIA video and print materials for professional development may have supported and had an impact on teachers’ ability to use an appropriate level of English with their students, and the need for selective use of the mother-tongue to support their students’ acquisition of English. The relationship between this focus on classroom language and the general EL competence of teachers is not clear and will benefit from an investigation in the data where measures of classroom practice and teacher EL competence are known for the same teachers, something that will be revealed in the composite report (EIA 2014c).
This study of Cohort 2 suggests that teachers are attempting to use a wider range of activities in the classroom and involve a greater number of students in activities (compared with the baseline studies [2009a & b]). The fact that teachers are asking more questions, organising and giving more feedback is an indication that they are attempting to implement more communicative practices in their teaching, again influenced possibly by the mediated classroom video materials. However, a deeper understanding of teacher–student and student–student classroom interactions (to be obtained through the current qualitative studies (EIA 2014d)) will provide detailed insight into the techniques of CLT that the teachers are implementing, and where they need further support.
While students are speaking more in lessons and using English the majority of the time, because of an increase in the amount of pair and group work, this improvement needs to be reinforced. Meaningful implementation of pair and group work among both primary and secondary teachers should be encouraged and can be analysed in more detail when looking at the richer data gleaned from recent EIA qualitative research (EIA 2014d). The implementation of increased communicative choral work should also be supported, particularly in secondary classrooms where it occurred relatively infrequently and in teaching large classes.
There is evidence in the data of speaking, listening, reading and writing being integrated in lessons; more qualitative observations will allow better insight into how these four skills are being integrated in classroom activities.
Classroom Practices of Primary and Secondary Teachers Participating in English in Action: Second Cohort (2013) 33
References
BANBEIS (2014a) ‘Chapter 2: Primary Education’, available online at: http://www.banbeis.gov.bd/webnew/images/2pe.pdf
BANBEIS (2014b) ‘Chapter 3: School education’, available online at: http://www.banbeis.gov.bd/webnew/images/3se.pdf
Bold, T., Kimenyi, M., Mwabu, G., Ng’ang’a, A. & Sandefur, J. (2013) Scaling-up what works: experimental evidence on external validity in Kenyan education, Working Paper no. 321. Washington: Centre for Global Development.
Chaudron, C. (1988) Second Language Classrooms: Research on Teaching and Learning, Cambridge: Cambridge University Press.
Cohen, J. (1988). Statistical power analysis for the behavioral sciences (2nd ed.), Hillsdale, NJ: Lawrence Erlbaum.
Cook, V. (2008) Second Language Learning and Language Teaching (2nd ed.). London: Hodder.
DFID (2011) Annual Review. Output to Purpose. English in Action Project Bangladesh, 4 – 18 April 2011. London: DFID
Education Watch (2011) ‘Exploring low performance in Education: The Case Study of Sylhet division’, available at: www.campebd.org/download/EW2009-10FullReportEnglish.pdf
EIA (2009a) Baseline Study 3: An Observation Study of English Lessons in Primary and Secondary Schools in Bangladesh. Dhaka: English in Action.
EIA (2009b) Baseline Study 3, 2nd Phase of Fieldwork: An Observation Study of English Lessons in Primary and Secondary Schools in Bangladesh. Dhaka: English in Action.
EIA (2011a) The Classroom Practices of Primary and Secondary Teachers Participating in English in Action (Study 2a). Dhaka: English in Action.
EIA (2011b) A Qualitative Observation Study of Primary and Secondary Lessons Conducted by Teachers Participating in English in Action, Report 1: Synopsis (Study 2b practice). Dhaka: English in Action.
EIA (2011c) A Qualitative Observation Study of Primary and Secondary Lessons Conducted by Teachers Participating in English in Action, Report 2: Cross-case analysis (Study 2b practice). Dhaka: English in Action.
EIA (2011d) A Qualitative Observation Study of Primary and Secondary Lessons Conducted by Teachers Participating in English in Action, Report 3: Case studies (Study 2b practice). Dhaka: English in Action.
EIA (2012a) The Classroom Practices of Primary and Secondary Teachers Participating in English in Action (Study 2a2). Dhaka: English in Action.
EIA (2012b) Proficiency Assessments of Primary and Secondary Teachers and Students Participating in English in Action. Dhaka: English in Action.
EIA (2014a) English Proficiency Assessments of Primary and Secondary Teachers and Students Participating in English in Action: Cohort 2 (2013). Dhaka: EIA.
EIA (2014b) Perceptions of English Language Learning and Teaching Among Primary and Secondary Teachers and Students Participating in English in Action: Cohort 2 (2013). Dhaka: EIA.
EIA (2014c) English in Action: A Consideration of Primary and Secondary Students’ and Teachers’ English Language Competence and Perceptions and Teachers’ Classroom Practice: Cohort 2 (2013). A Composite Report. Dhaka: EIA. (forthcoming)
EIA (2014d) New Elements Study. Dhaka: EIA.
Flanders, N.A. (1970) Analysing Teaching Behaviour. London: Addison-Wesley.
34 Classroom Practices of Primary and Secondary Teachers Participating in English in Action: Second Cohort (2013)
Hamid, O.M. (2011) ‘Planning for failure: English and language policy and planning in Bangladesh’, in J.A. Fishman and O. García (eds.) Handbook of Language and Ethnic Identify: the success-failure continuum in language and ethnic identify efforts (pp.192–203). (Volume 2). Oxford: Oxford University Press.
Hamid, M.O. & Baldauf, R.B.J. (2008) ‘Will CLT bail out the bogged down ELT in Bangladesh?’, English Today, 24:16–24
Kraft, R.J., Ehsan, A. and Khanam, R. (2009) Comprehensive Primary Teacher Education and Continuing Professional Development: A Framework for Reform. Dhaka: UNICEF.
Malamah-Thomas, A. (1987) Classroom Interaction. Oxford: Oxford University Press.
Musumeci, D. (1996) ‘Teacher-learner negotiation in content-based instruction: communication at cross-purposes?’, Applied Linguistics, 17: pp.236–325.
Nunan, D. (1991) Language Teaching Methodology: A Textbook for Teachers. Cambridge: Cambridge University Press.
Rahman, A., Kobir, Md. M. and Afroze, R. (2006) Effect of BRAC-PACE Training on English Language Learning of Teachers in Rural Non-Government Secondary Schools. Dhaka: BRAC Centre.
Spada, N. (1990) ‘Observing classroom behaviours and learning outcomes in different second language programs’, in J. Richards and D. Nunan (eds) Second Language Teacher Education (pp.293–310). Cambridge: Cambridge University Press.
UNESCO (2012) 2012 Education for all Global Monitoring Report – Youth Skills and Work: Statistical Tables – long version.
UNICEF (2010) A Case for Geographic Targeting of Basic Social Services to Mitigate Inequalities in Bangladesh, Dhaka, available online at: http://www.unicef.org/socialpolicy/files/Geo_targeting_web.pdf
World Bank (2008) ‘Education for all in Bangladesh: Where does Bangladesh stand in achieving EFA Goals by 2015?’, Bangladesh development Series, Paper no. 24 Dhaka: World Bank.
World Bank [WB] (2013) Bangladesh Educational Sector Review. Seeding fertile ground: education that works for Bangladesh. (Report No. 80613-BD). Dhaka: World Bank Office Dhaka.
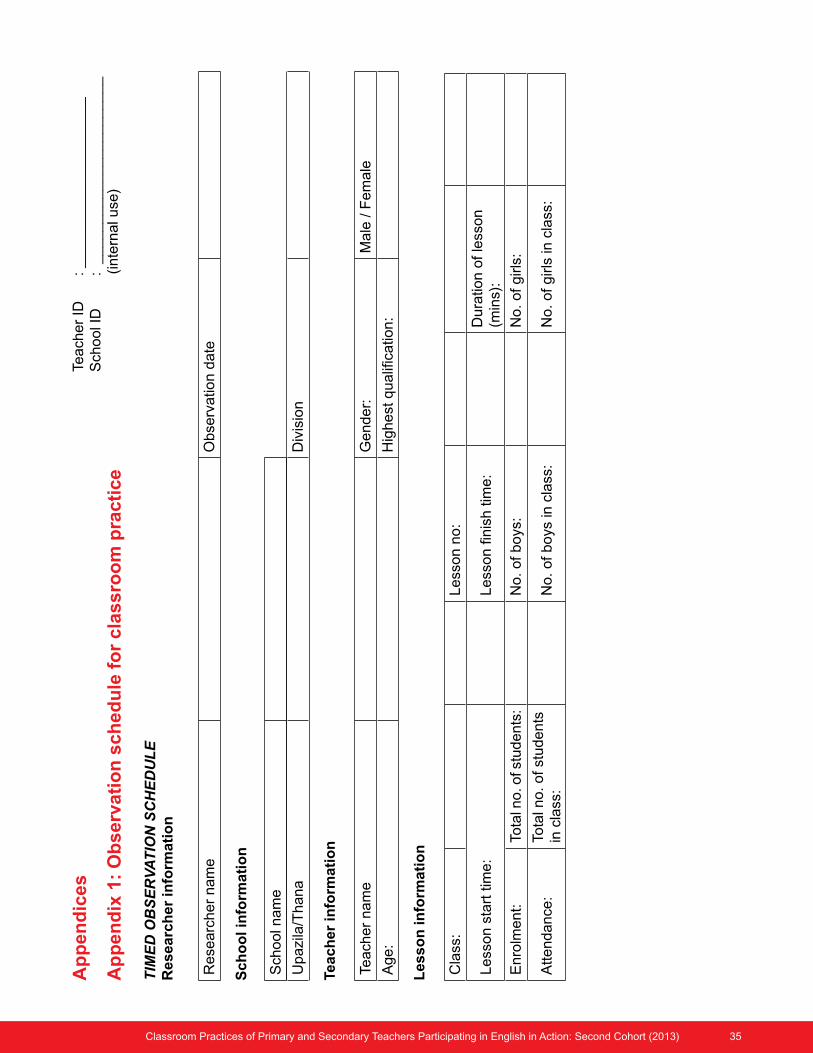
Classroom Practices of Primary and Secondary Teachers Participating in English in Action: Second Cohort (2013) 35
Ap
pen
dic
es A
pp
end
ix 1
: O
bse
rvat
ion
sch
edu
le f
or
clas
sro
om
pra
ctic
e
TIM
ED
OB
SE
RV
AT
ION
SC
HE
DU
LE
Res
earc
her
info
rmat
ion
Tea
che
r ID
: _
__
__
__
__
__
__
__
__
__
__
Sch
oo
l ID
: _
__
__
__
__
__
__
__
__
__
__
__
(in
tern
al u
se)
Rese
arc
her
nam
eO
bse
rvatio
n d
ate
Sch
ool n
am
e
Upazi
la/T
hana
Div
isio
n
Teach
er
nam
eG
ender:
Ma
le / F
em
ale
Age:
Hig
hest
qualif
ica
tion
:
Sch
oo
l in
form
atio
n
Teac
her
info
rmat
ion
Les
son
info
rmat
ion
Cla
ss:
Less
on n
o:
Less
on s
tart
tim
e:
Less
on f
inis
h t
ime:
Du
ratio
n o
f le
sso
n
(min
s):
Enro
lment:
Tota
l no. o
f stu
dents
:N
o.
of
boys
:N
o. o
f g
irls
:
Attendance
:To
tal n
o. of st
udents
in
cla
ss:
No.
of
boys
in c
lass
:N
o. o
f g
irls
in c
lass
:
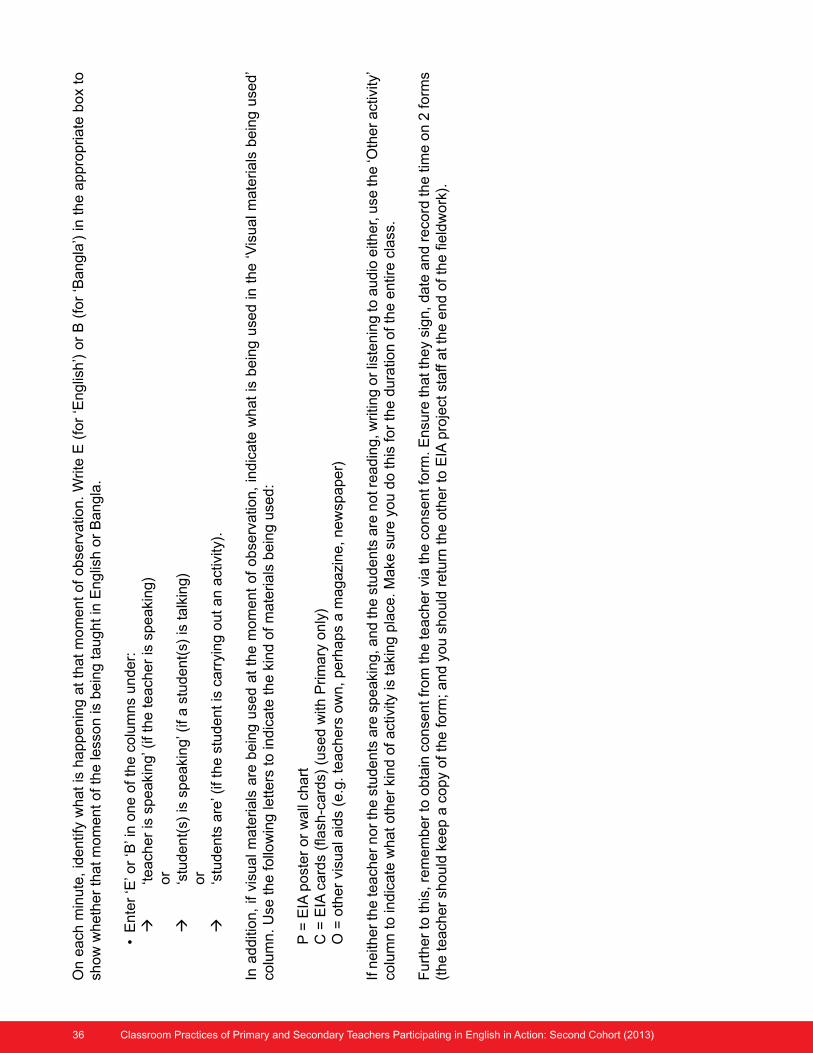
36 Classroom Practices of Primary and Secondary Teachers Participating in English in Action: Second Cohort (2013)
On e
ach
min
ute
, id
entif
y w
hat
is h
appenin
g a
t th
at
mom
ent
of
obse
rvatio
n.
Write
E (
for
‘Englis
h’) o
r B
(fo
r ‘B
an
gla
’) in
th
e a
pp
rop
ria
te b
ox
to
show
wheth
er
that m
om
ent of th
e le
sson is
bein
g t
aught
in E
nglis
h o
r B
angla
.
•Enter‘E’or‘B’inoneofthecolumnsunder:
‘te
ach
er
is s
peaki
ng’ (
if th
e t
each
er
is s
peaki
ng)
or
‘s
tudent(
s) is
speaki
ng’ (
if a
stu
dent(
s) is
talk
ing)
o
r
‘s
tudents
are
’ (if
the s
tudent
is c
arr
ying o
ut
an a
ctiv
ity).
In a
dditi
on,
if vi
sual m
ate
rials
are
bein
g u
sed a
t th
e m
om
ent
of
obse
rvatio
n,
indic
ate
what
is b
ein
g u
sed
in t
he
‘Vis
ua
l ma
teria
ls b
ein
g u
sed
’ co
lum
n. U
se the follo
win
g le
tters
to in
dic
ate
the k
ind o
f m
ate
rials
bein
g u
sed:
P
= E
IA p
ost
er
or
wall
chart
C
= E
IA c
ard
s (f
lash
-card
s) (
use
d w
ith P
rim
ary
only
)
O =
oth
er
visu
al a
ids
(e.g
. te
ach
ers
ow
n,
perh
aps
a m
agazi
ne,
new
spaper)
If n
eith
er
the te
ach
er
nor
the s
tudents
are
speaki
ng, a
nd th
e s
tudents
are
not r
eadin
g, w
ritin
g o
r lis
ten
ing
to a
ud
io e
ithe
r, u
se th
e ‘O
the
r a
ctiv
ity’
colu
mn to in
dic
ate
what oth
er
kind o
f act
ivity
is t
aki
ng p
lace
. M
ake
sure
you d
o t
his
for
the d
ura
tion
of th
e e
ntir
e c
lass
.
Furt
her
to th
is, r
em
em
ber
to o
bta
in c
onse
nt f
rom
the te
ach
er
via th
e c
onse
nt f
orm
. Ensu
re th
at t
he
y si
gn
, da
te a
nd
re
cord
the
tim
e o
n 2
form
s (t
he teach
er
sho
uld
keep a
copy
of th
e form
; and y
ou s
hould
retu
rn t
he o
ther
to E
IA p
roje
ct s
taff
at th
e e
nd
of th
e fie
ldw
ork
).
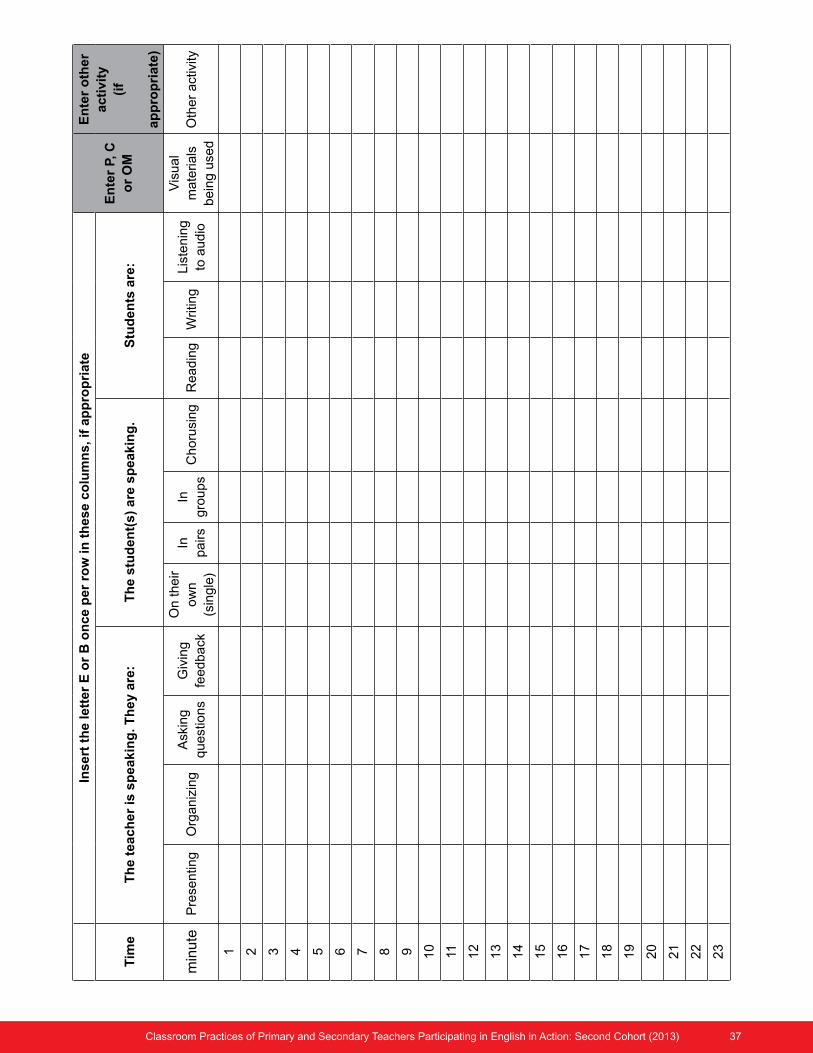
Classroom Practices of Primary and Secondary Teachers Participating in English in Action: Second Cohort (2013) 37
Inse
rt t
he
lett
er E
or
B o
nce
per
ro
w in
th
ese
colu
mn
s, if
ap
pro
pri
ate
En
ter
P, C
o
r O
M
En
ter
oth
er
acti
vity
(i
f ap
pro
pri
ate)
Tim
eT
he
teac
her
is s
pea
kin
g. T
hey
are
:T
he
stu
den
t(s)
are
sp
eaki
ng
.S
tud
ents
are
:
min
ute
Pre
sentin
gO
rganiz
ing
Ask
ing
quest
ion
sG
ivin
g
feedback
On their
ow
n
(sin
gle
)
In
pairs
In
gro
ups
Choru
sing
Rea
din
gW
ritin
gLis
tenin
g
to a
udio
Vis
ual
mate
rials
bein
g u
sed
Oth
er
act
ivity
1 2 3 4 5 6 7 8 9 10 11 12
13
14
15
16
17
18
19
20
21
22
23
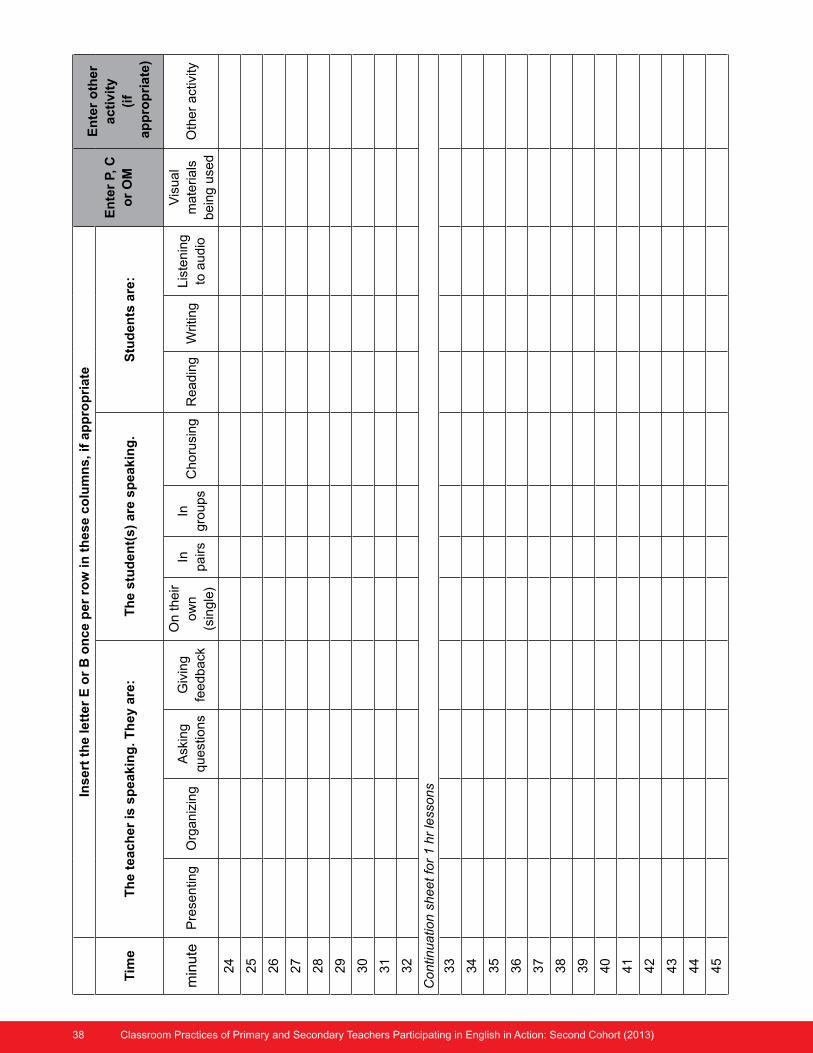
38 Classroom Practices of Primary and Secondary Teachers Participating in English in Action: Second Cohort (2013)
Inse
rt t
he
lett
er E
or
B o
nce
per
ro
w in
th
ese
colu
mn
s, if
ap
pro
pri
ate
En
ter
P, C
o
r O
M
En
ter
oth
er
acti
vity
(i
f a
pp
rop
riat
e)T
ime
Th
e te
ach
er is
sp
eaki
ng
. Th
ey a
re:
Th
e st
ud
ent(
s) a
re s
pea
kin
g.
Stu
den
ts a
re:
min
ute
Pre
sentin
gO
rganiz
ing
Ask
ing
quest
ions
Giv
ing
feedback
On their
ow
n
(sin
gle
)
In
pairs
In
gro
ups
Choru
sing
Readin
gW
ritin
gLis
tenin
g
to a
udio
Vis
ual
mate
rials
bein
g u
sed
Oth
er
act
ivity
24
25
26
27
28
29
30
31
32
Co
ntin
uatio
n s
hee
t fo
r 1 h
r le
ssons
33
34
35
36
37
38
39
40
41
42
43
44
45
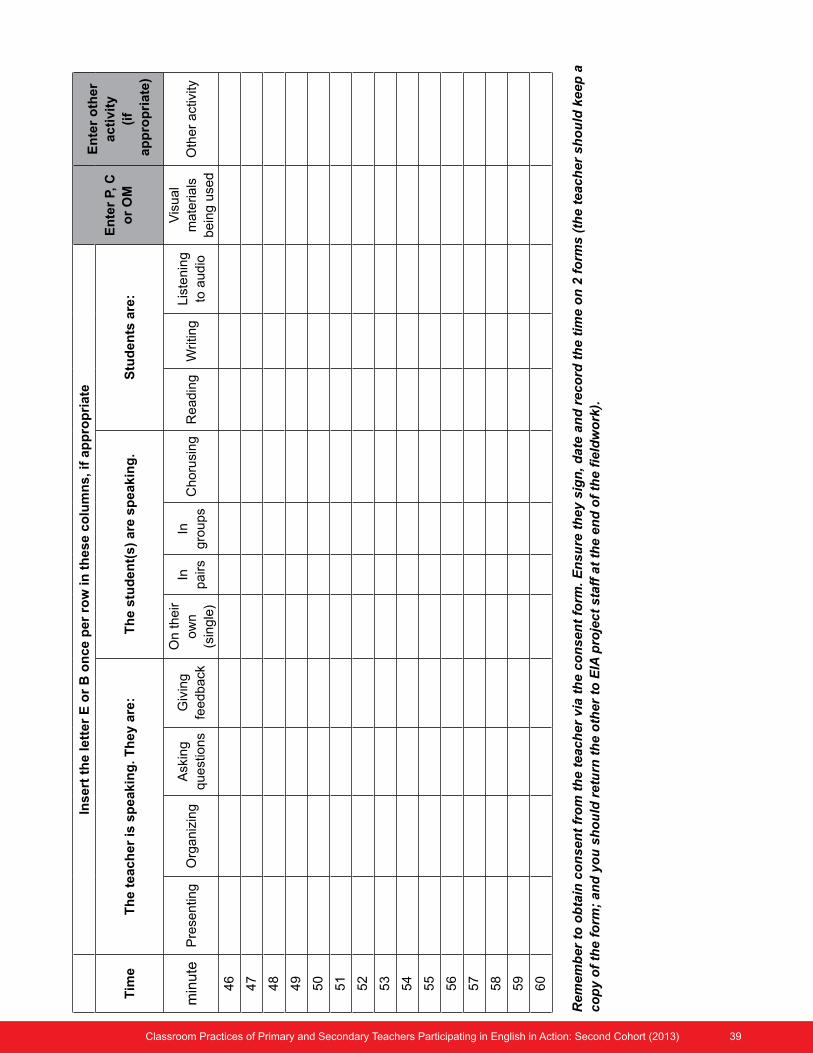
Classroom Practices of Primary and Secondary Teachers Participating in English in Action: Second Cohort (2013) 39
Inse
rt t
he
lett
er E
or
B o
nce
per
ro
w in
th
ese
colu
mn
s, if
ap
pro
pri
ate
En
ter
P, C
o
r O
M
En
ter
oth
er
acti
vity
(i
f a
pp
rop
riat
e)T
ime
Th
e te
ach
er is
sp
eaki
ng
. Th
ey a
re:
Th
e st
ud
ent(
s) a
re s
pea
kin
g.
Stu
den
ts a
re:
min
ute
Pre
sentin
gO
rganiz
ing
Ask
ing
quest
ions
Giv
ing
feedback
On their
ow
n
(sin
gle
)
In
pairs
In
gro
ups
Choru
sing
Readin
gW
ritin
gLis
tenin
g
to a
udio
Vis
ual
mate
rials
bein
g u
sed
Oth
er
act
ivity
46
47
48
49
50
51
52
53
54
55
56
57
58
59
60
Rem
emb
er t
o o
bta
in c
on
sen
t fr
om
th
e te
ach
er v
ia t
he
con
sen
t fo
rm.
En
sure
th
ey s
ign
, d
ate
and
rec
ord
th
e ti
me
on
2 f
orm
s (t
he
teac
her
sh
ou
ld k
eep
a
cop
y o
f th
e fo
rm;
and
yo
u s
ho
uld
ret
urn
th
e o
ther
to
EIA
pro
ject
sta
ff a
t th
e en
d o
f th
e fi
eld
wo
rk).
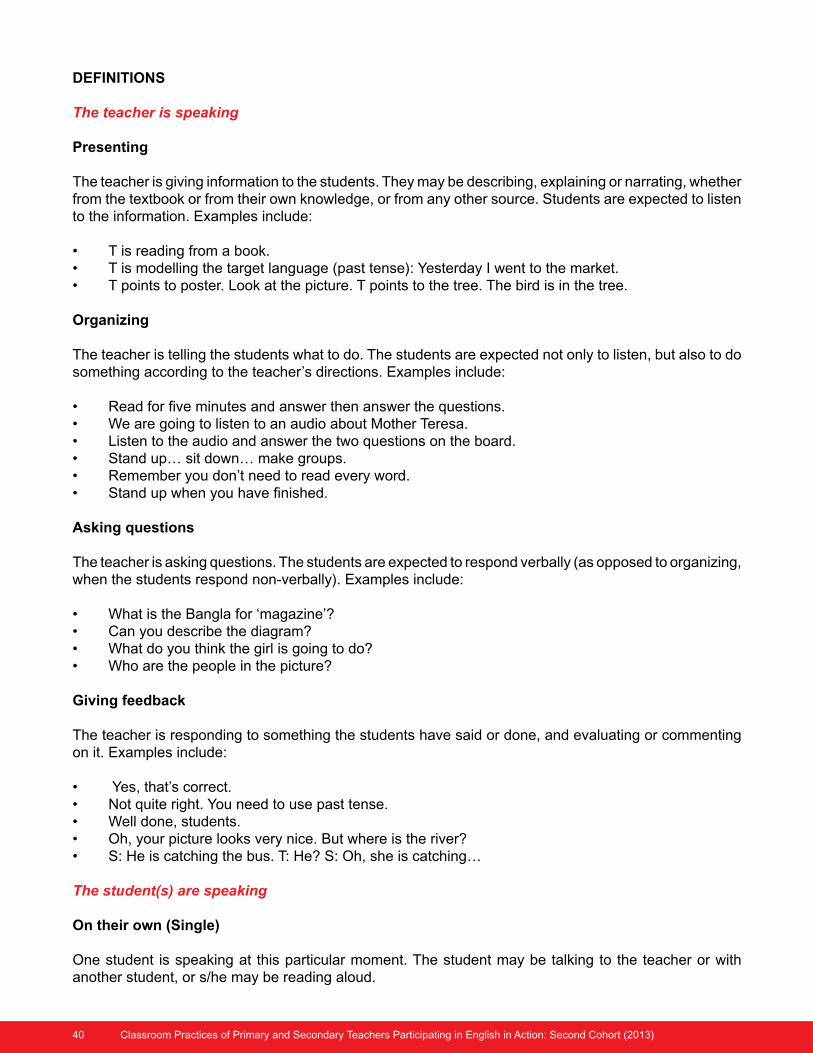
40 Classroom Practices of Primary and Secondary Teachers Participating in English in Action: Second Cohort (2013)
DEFINITIONS
The teacher is speaking
Presenting
The teacher is giving information to the students. They may be describing, explaining or narrating, whether from the textbook or from their own knowledge, or from any other source. Students are expected to listen to the information. Examples include:
• Tisreadingfromabook.• Tismodellingthetargetlanguage(pasttense):YesterdayIwenttothemarket.• Tpointstoposter.Lookatthepicture.Tpointstothetree.Thebirdisinthetree.
Organizing
The teacher is telling the students what to do. The students are expected not only to listen, but also to do something according to the teacher’s directions. Examples include:
• Readforfiveminutesandanswerthenanswerthequestions.• WearegoingtolistentoanaudioaboutMotherTeresa.• Listentotheaudioandanswerthetwoquestionsontheboard.• Standup…sitdown…makegroups.• Rememberyoudon’tneedtoreadeveryword.• Standupwhenyouhavefinished.
Asking questions
The teacher is asking questions. The students are expected to respond verbally (as opposed to organizing, when the students respond non-verbally). Examples include:
• WhatistheBanglafor‘magazine’?• Canyoudescribethediagram?• Whatdoyouthinkthegirlisgoingtodo?• Whoarethepeopleinthepicture?
Giving feedback
The teacher is responding to something the students have said or done, and evaluating or commenting on it. Examples include:
• Yes,that’scorrect.• Notquiteright.Youneedtousepasttense.• Welldone,students.• Oh,yourpicturelooksverynice.Butwhereistheriver?• S:Heiscatchingthebus.T:He?S:Oh,sheiscatching… The student(s) are speaking
On their own (Single)
One student is speaking at this particular moment. The student may be talking to the teacher or with another student, or s/he may be reading aloud.
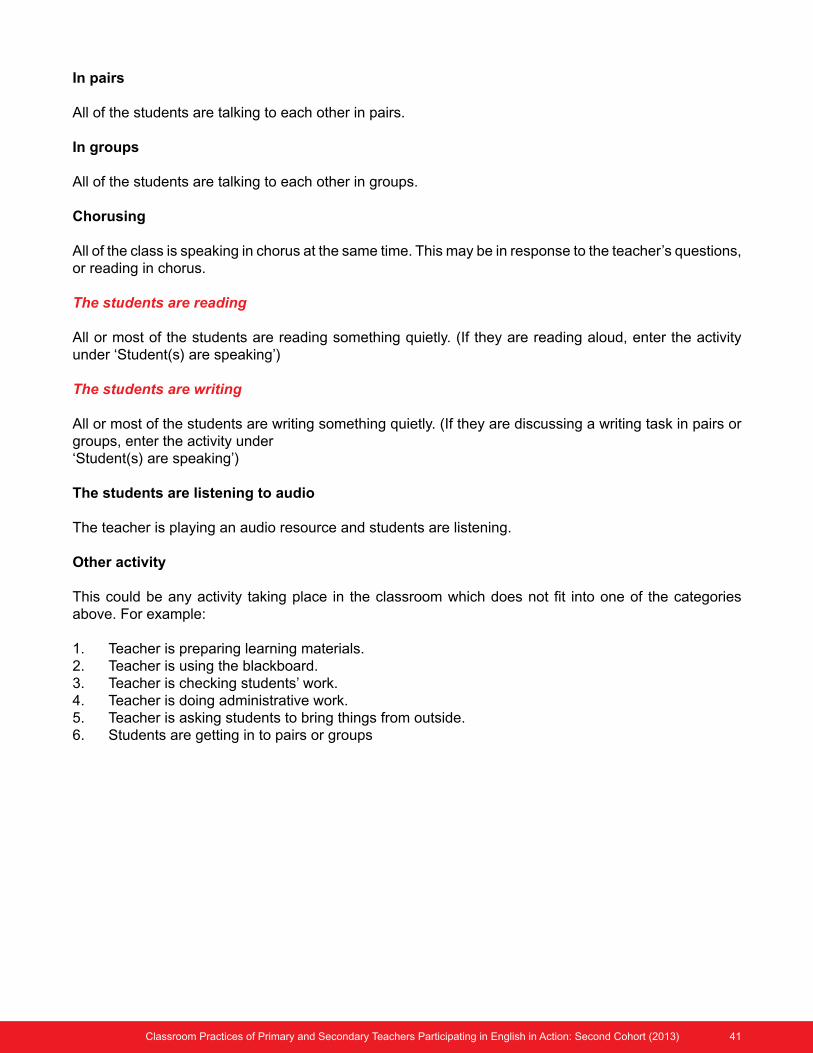
Classroom Practices of Primary and Secondary Teachers Participating in English in Action: Second Cohort (2013) 41
In pairs
All of the students are talking to each other in pairs.
In groups
All of the students are talking to each other in groups.
Chorusing
All of the class is speaking in chorus at the same time. This may be in response to the teacher’s questions, or reading in chorus. The students are reading
All or most of the students are reading something quietly. (If they are reading aloud, enter the activity under ‘Student(s) are speaking’)
The students are writing
All or most of the students are writing something quietly. (If they are discussing a writing task in pairs or groups, enter the activity under ‘Student(s) are speaking’)
The students are listening to audio
The teacher is playing an audio resource and students are listening.
Other activity
This could be any activity taking place in the classroom which does not fit into one of the categories above. For example:
1. Teacher is preparing learning materials.2. Teacher is using the blackboard.3. Teacher is checking students’ work.4. Teacher is doing administrative work.5. Teacher is asking students to bring things from outside.6. Students are getting in to pairs or groups
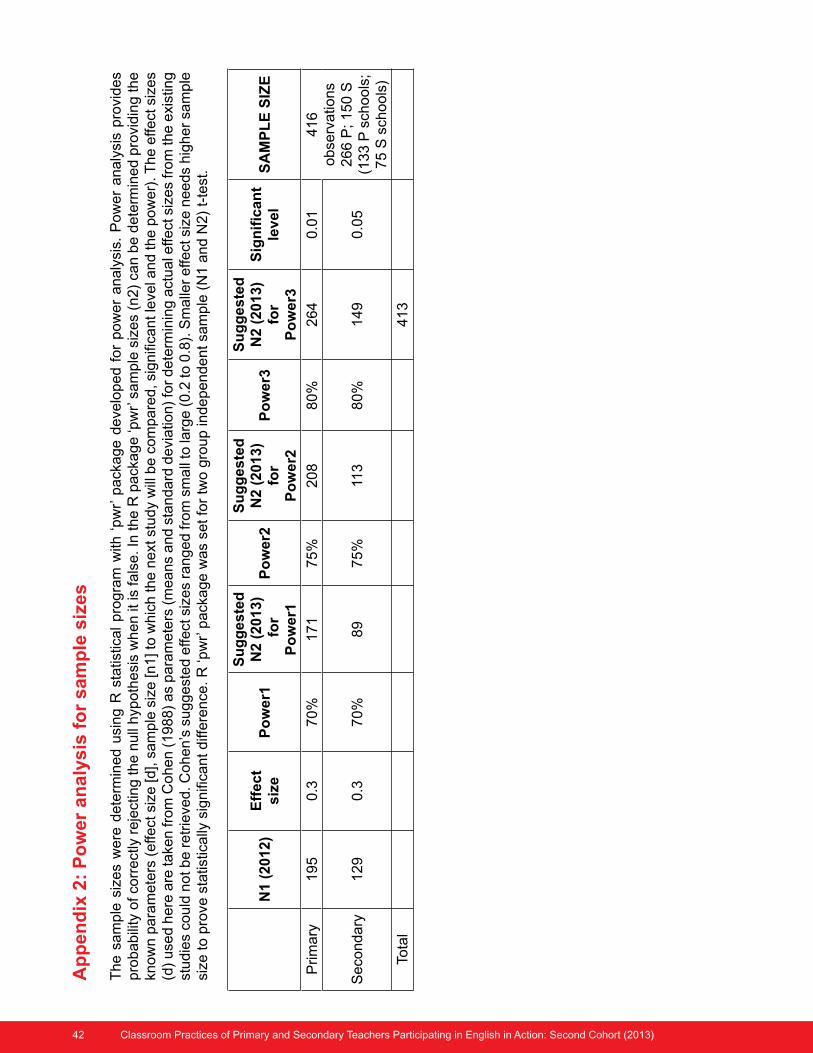
42 Classroom Practices of Primary and Secondary Teachers Participating in English in Action: Second Cohort (2013)
Ap
pen
dix
2:
Po
wer
an
alys
is f
or
sam
ple
siz
es
The s
am
ple
siz
es
were
dete
rmin
ed u
sing
R s
tatis
tical
pro
gra
m w
ith ‘
pw
r’ p
ack
age d
eve
loped f
or
po
we
r a
na
lysi
s. P
ow
er
an
aly
sis
pro
vid
es
pro
babili
ty o
f co
rrect
ly r
eje
ctin
g th
e n
ull
hyp
oth
esi
s w
hen it
is fa
lse. I
n th
e R
pack
age ‘p
wr’ s
am
ple
siz
es
(n2
) ca
n b
e d
ete
rmin
ed
pro
vid
ing
the
kn
ow
n p
ara
mete
rs (
effe
ct s
ize [d
], s
am
ple
siz
e [n
1] t
o w
hic
h th
e n
ext
stu
dy
will
be c
om
pare
d, s
ign
ifica
nt l
eve
l an
d th
e p
ow
er)
. Th
e e
ffect
siz
es
(d)
use
d h
ere
are
take
n fr
om
Cohen (
1988
) as
para
mete
rs (
means
and s
tandard
devi
atio
n)
for
de
term
inin
g a
ctu
al e
ffect
siz
es
fro
m th
e e
xist
ing
st
udie
s co
uld
not b
e r
etr
ieve
d. C
ohen’s
suggest
ed e
ffect
siz
es
ranged fr
om
sm
all
to la
rge (
0.2
to 0
.8).
Sm
alle
r e
ffect
siz
e n
ee
ds
hig
he
r sa
mp
le
size
to p
rove
sta
tistic
ally
sig
nifi
cant diff
ere
nce
. R
‘pw
r’ p
ack
age w
as
set
for
two g
roup in
depend
en
t sa
mp
le (
N1
an
d N
2)
t-te
st.
N1
(201
2)E
ffec
t si
zeP
ow
er1
Su
gg
este
d
N2
(201
3) f
or
Po
wer
1
Po
wer
2
Su
gg
este
d
N2
(201
3)
for
Po
wer
2
Po
wer
3
Su
gg
este
d
N2
(201
3)
for
Po
wer
3
Sig
nif
ican
t le
vel
SA
MP
LE
SIZ
E
Prim
ary
195
0.3
70
%171
75%
208
80%
26
40
.01
41
6
ob
serv
atio
ns
26
6 P
; 1
50
S(1
33
P s
cho
ols
; 7
5 S
sch
oo
ls)
Seco
ndary
129
0.3
70%
89
75%
113
80%
14
90
.05
Tota
l4
13
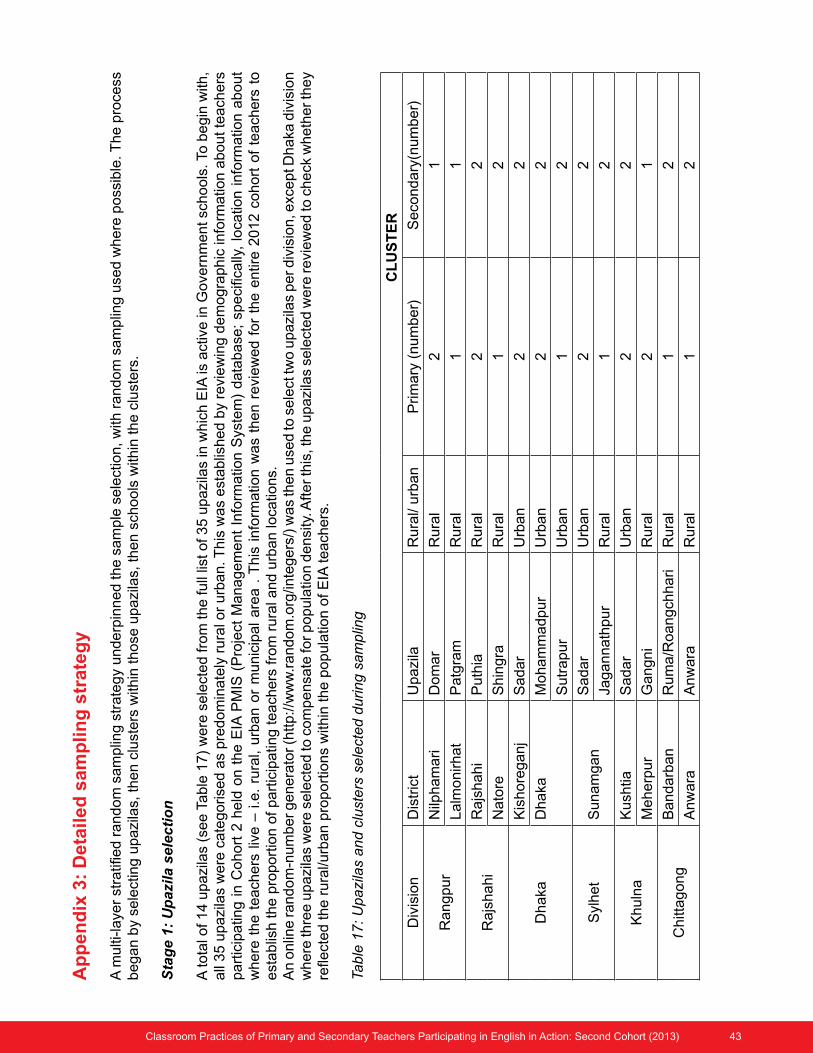
Classroom Practices of Primary and Secondary Teachers Participating in English in Action: Second Cohort (2013) 43
C
LU
ST
ER
Div
isio
nD
istr
ict
Upazi
laR
ura
l/ urb
an
Prim
ary
(n
um
be
r)S
eco
nd
ary
(nu
mb
er)
Rangpur
Nilp
ham
ari
Dom
ar
Rura
l2
1
Lalm
onirhat
Patg
ram
Rura
l1
1
Rajs
hahi
Rajs
hahi
Puth
iaR
ura
l2
2
Nato
reS
hin
gra
Rura
l1
2
Dhaka
Kis
hore
ganj
Sadar
Urb
an
22
Dhaka
Moham
madpur
Urb
an
22
Sutr
apur
Urb
an
12
Syl
het
Sunam
gan
Sadar
Urb
an
22
Jagannath
pur
Rura
l1
2
Khuln
aK
ush
tiaS
adar
Urb
an
22
Meherp
ur
Gangni
Rura
l2
1
Chitt
agong
Bandarb
an
Rum
a/R
oangch
hari
Rura
l1
2
Anw
ara
Anw
ara
Rura
l1
2
Ap
pen
dix
3:
Det
aile
d s
amp
ling
str
ateg
y
A m
ulti
-laye
r st
ratif
ied r
andom
sam
plin
g s
trate
gy
underp
inned th
e s
am
ple
sele
ctio
n, w
ith r
andom
sa
mp
ling
use
d w
he
re p
oss
ible
. Th
e p
roce
ss
be
gan b
y se
lect
ing u
pazi
las,
then c
lust
ers
with
in t
hose
upazi
las,
then s
chools
with
in t
he c
lust
ers
.
Sta
ge
1: U
paz
ila s
elec
tio
n
A to
tal o
f 14 u
pazi
las
(see T
able
17)
were
sele
cted fr
om
the fu
ll lis
t of 3
5 u
pazi
las
in w
hic
h E
IA is
act
ive
in G
ove
rnm
en
t sch
oo
ls. T
o b
eg
in w
ith,
all
35 u
pazi
las
were
cate
gorise
d a
s pre
dom
inate
ly r
ura
l or
urb
an. T
his
was
est
ablis
hed b
y re
vie
win
g d
em
og
rap
hic
info
rma
tion
ab
ou
t te
ach
ers
p
art
icip
atin
g i
n C
ohort
2 h
eld
on t
he E
IA P
MIS
(P
roje
ct M
anagem
ent
Info
rmatio
n S
yste
m)
data
ba
se;
spe
cific
ally
, lo
catio
n i
nfo
rma
tion
ab
ou
t w
here
the t
each
ers
liv
e –
i.e
. ru
ral,
urb
an o
r m
unic
ipal
are
a .
This
info
rmatio
n w
as
then r
evi
ew
ed
fo
r th
e e
ntir
e 2
01
2 c
oh
ort
of
tea
che
rs t
o
est
ablis
h the p
roport
ion o
f part
icip
atin
g tea
chers
fro
m r
ura
l and u
rban lo
catio
ns.
A
n o
nlin
e ra
ndo
m-n
um
ber g
enera
tor (
http:/
/ww
w.r
andom
.org
/inte
gers
/) w
as
then u
sed to
sele
ct tw
o u
pa
zila
s p
er d
ivis
ion
, exc
ep
t Dh
aka
div
isio
n
where
thre
e u
pa
zila
s w
ere
sele
cted to
com
pensa
te fo
r popula
tion d
ensi
ty. A
fter t
his
, the u
pazi
las
sele
cte
d w
ere
revi
ew
ed
to c
he
ck w
he
the
r th
ey
refle
cted the r
ura
l/urb
an p
roport
ions
with
in t
he p
opula
tion o
f E
IA t
each
ers
.
Table
17: U
pazi
las
and c
lust
ers
sele
cted d
uring s
am
plin
g
44 Classroom Practices of Primary and Secondary Teachers Participating in English in Action: Second Cohort (2013)
Stage 2: Cluster selection
Each upazila in which EIA is active has five clusters: two primary, two secondary and one primary head teacher. One primary and one secondary cluster were chosen per upazila in order to select both primary and secondary schools within that upazila. The online random number generator was used to select a primary and a secondary cluster in each upazila (see Table 17).
Stage 3: School selection
Each cluster consists of approximately 24 teachers from 12 schools. Using the online random number generator, 10/11 schools were selected from the primary cluster and 5/6 from each secondary cluster. Within each upazila, a total of 16 schools were selected (10/11 primary; 5/6 secondary).
Stage 4: Teacher selection
There are two assistant teachers (ATs) and one head teacher taking part in the EIA programme in each primary school that is part of the programme. Therefore, primary head teachers make up one-third of primary personnel taking part in the programme. As this study required two teachers from each primary school, it was necessary to select from among the three participating teachers. The online random number generator was used to select three or four schools per upazila where the head teacher would be observed (approximately a third of primary schools), and then used again to select which of the two ATs would be observed. In each secondary school selected, both of the EIA teachers were selected for observation.
18 The municipal and urban categories were merged and classed as urban.19 Again, municipal and urban categories were merged.
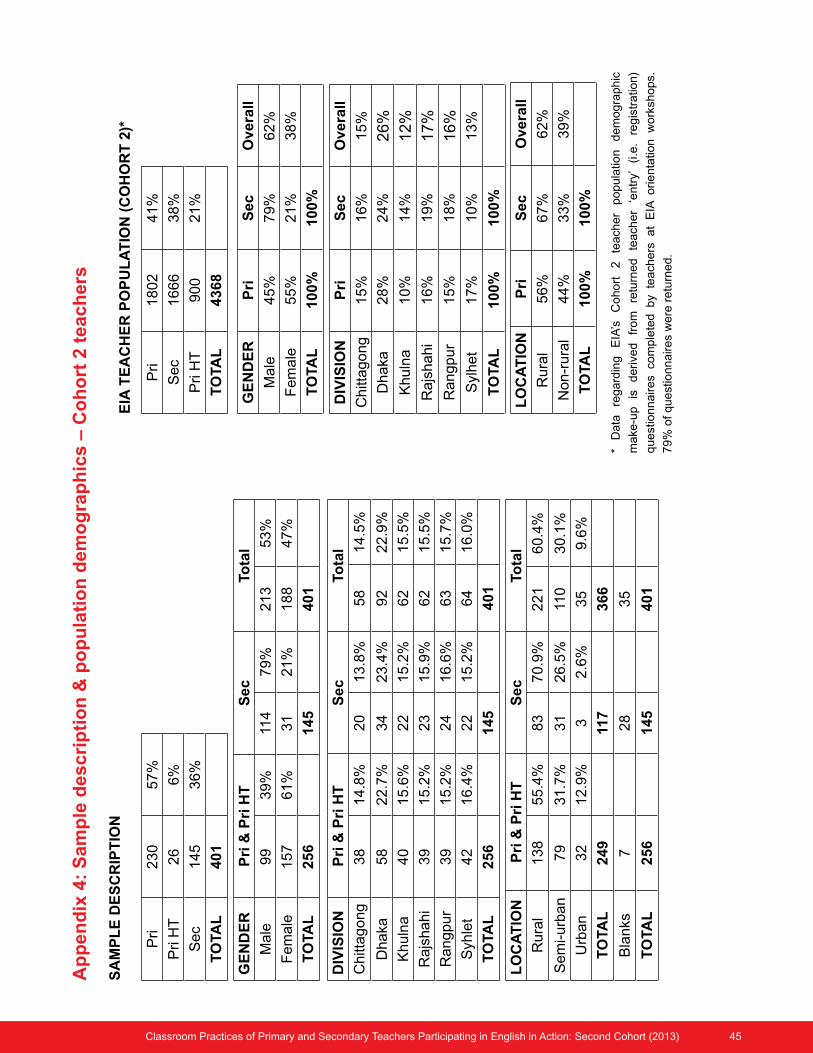
Classroom Practices of Primary and Secondary Teachers Participating in English in Action: Second Cohort (2013) 45
Ap
pen
dix
4:
Sam
ple
des
crip
tio
n &
po
pu
lati
on
dem
og
rap
hic
s –
Co
ho
rt 2
tea
cher
s
EIA
TE
AC
HE
R P
OP
UL
AT
ION
(C
OH
OR
T 2
)*S
AM
PL
E D
ES
CR
IPT
ION
GE
ND
ER
Pri
& P
ri H
TS
ecTo
tal
Male
99
39%
114
79%
213
53%
Fem
ale
157
61%
31
21%
188
47%
TO
TAL
256
145
401
Pri
230
57%
Pri H
T26
6%
Sec
145
36%
TO
TAL
401
Pri
18
02
41
%
Sec
16
66
38
%
Pri H
T9
00
21
%
TO
TAL
4368
GE
ND
ER
Pri
Sec
Ove
rall
Male
45
%7
9%
62
%
Fem
ale
55
%2
1%
38
%
TO
TAL
100%
100%
DIV
ISIO
NP
riS
ecO
vera
ll
Chitt
ag
on
g1
5%
16
%1
5%
Dhaka
28
%2
4%
26%
Khu
lna
10
%1
4%
12%
Rajs
ha
hi
16
%1
9%
17%
Rangp
ur
15
%1
8%
16%
Syl
he
t1
7%
10
%1
3%
TO
TAL
100%
100%
LO
CA
TIO
NP
riS
ecO
vera
ll
Rura
l5
6%
67
%6
2%
Non-r
ura
l4
4%
33
%3
9%
TO
TAL
100%
100%
DIV
ISIO
NP
ri &
Pri
HT
Sec
Tota
l
Chitt
agong
38
14.8
%20
13.8
%58
14.5
%
Dhaka
58
22.7
%34
23.4
%92
22.9
%
Khuln
a40
15.6
%22
15.2
%62
15.5
%
Rajs
hahi
39
15.2
%23
15.9
%62
15.5
%
Rangpur
39
15.2
%24
16.6
%63
15.7
%
Syh
let
42
16.4
%22
15.2
%64
16.0
%
TO
TAL
256
145
401
LO
CA
TIO
NP
ri &
Pri
HT
Sec
Tota
l
Rura
l138
55.4
%83
70.9
%221
60.4
%
Sem
i-urb
an
79
31.7
%31
26.5
%11
030.1
%
Urb
an
32
12.9
%3
2.6
%35
9.6
%
TO
TAL
249
117
366
Bla
nks
728
35
TO
TAL
256
145
401
* D
ata
re
gard
ing
E
IA’s
C
oh
ort
2
te
ach
er
po
pu
latio
n
de
mo
gra
ph
ic
make
-up
is
de
rive
d
fro
m
retu
rne
d
tea
che
r ‘e
ntr
y’
(i.e
. re
gis
tra
tion
)
quest
ionnaires
com
ple
ted
by
tea
che
rs a
t E
IA o
rie
nta
tion
wo
rksh
op
s.
79%
of
quest
ionn
aire
s w
ere
re
turn
ed
.
46 Classroom Practices of Primary and Secondary Teachers Participating in English in Action: Second Cohort (2013)
Appendix 5: Data cleaning steps
The following actions were taken to clean the dataset:
• adata screeningexerciseby rangechecking,andcheckingvariable valuesagainstpredefinedmaximum and minimum bounds to catch spurious values or data entry;
• contingencytablesconstructedtocarryoutconsistencychecks;• missingdata,non-responses,dataimputationformissingvaluesdealtwith,andoutlierdetectionto
ensure the data is in the right shape and format for analysis;• data transformation, involving re-categorising and altering variables (e.g. fromoriginal string to
numerical variable);• derived/newlycreatedvariablesfromexistingvariables.
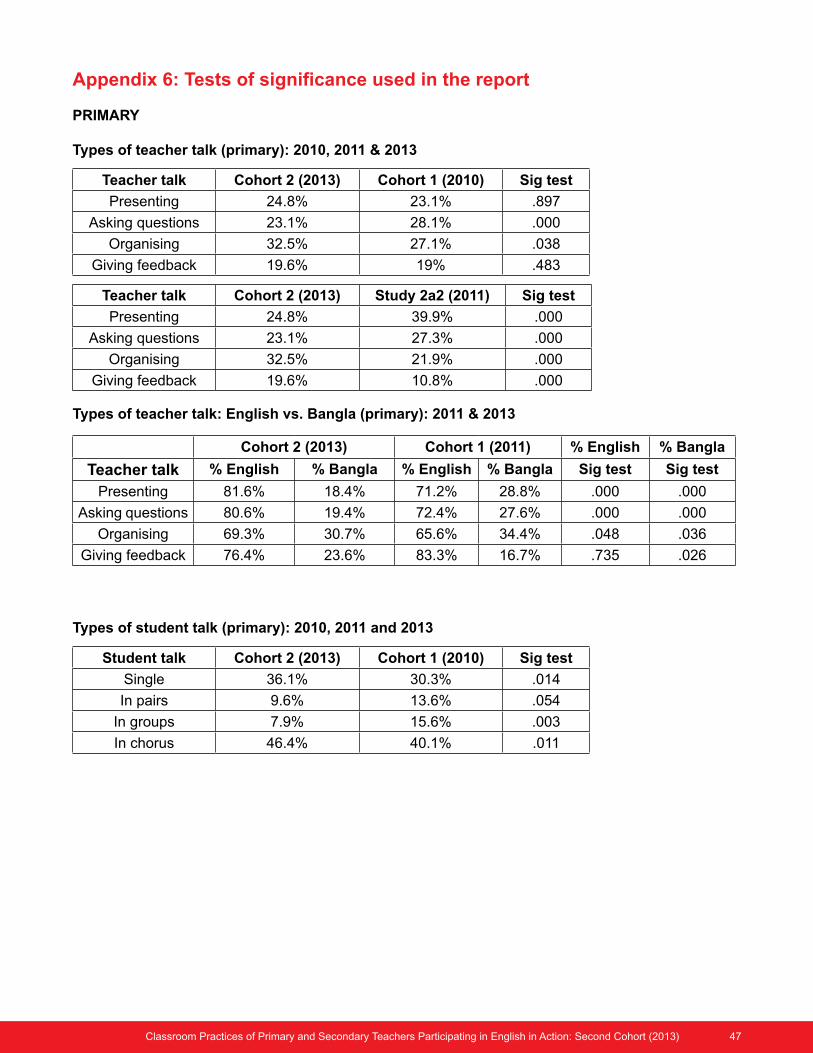
Classroom Practices of Primary and Secondary Teachers Participating in English in Action: Second Cohort (2013) 47
Appendix 6: Tests of significance used in the report
PRIMARY
Types of teacher talk (primary): 2010, 2011 & 2013
Teacher talk Cohort 2 (2013) Cohort 1 (2010) Sig test
Presenting 24.8% 23.1% .897
Asking questions 23.1% 28.1% .000
Organising 32.5% 27.1% .038
Giving feedback 19.6% 19% .483
Student talk Cohort 2 (2013) Cohort 1 (2010) Sig test
Single 36.1% 30.3% .014
In pairs 9.6% 13.6% .054
In groups 7.9% 15.6% .003
In chorus 46.4% 40.1% .011
Teacher talk Cohort 2 (2013) Study 2a2 (2011) Sig test
Presenting 24.8% 39.9% .000
Asking questions 23.1% 27.3% .000
Organising 32.5% 21.9% .000
Giving feedback 19.6% 10.8% .000
Cohort 2 (2013) Cohort 1 (2011) % English % Bangla
Teacher talk % English % Bangla % English % Bangla Sig test Sig test
Presenting 81.6% 18.4% 71.2% 28.8% .000 .000
Asking questions 80.6% 19.4% 72.4% 27.6% .000 .000
Organising 69.3% 30.7% 65.6% 34.4% .048 .036
Giving feedback 76.4% 23.6% 83.3% 16.7% .735 .026
Types of teacher talk: English vs. Bangla (primary): 2011 & 2013
Types of student talk (primary): 2010, 2011 and 2013
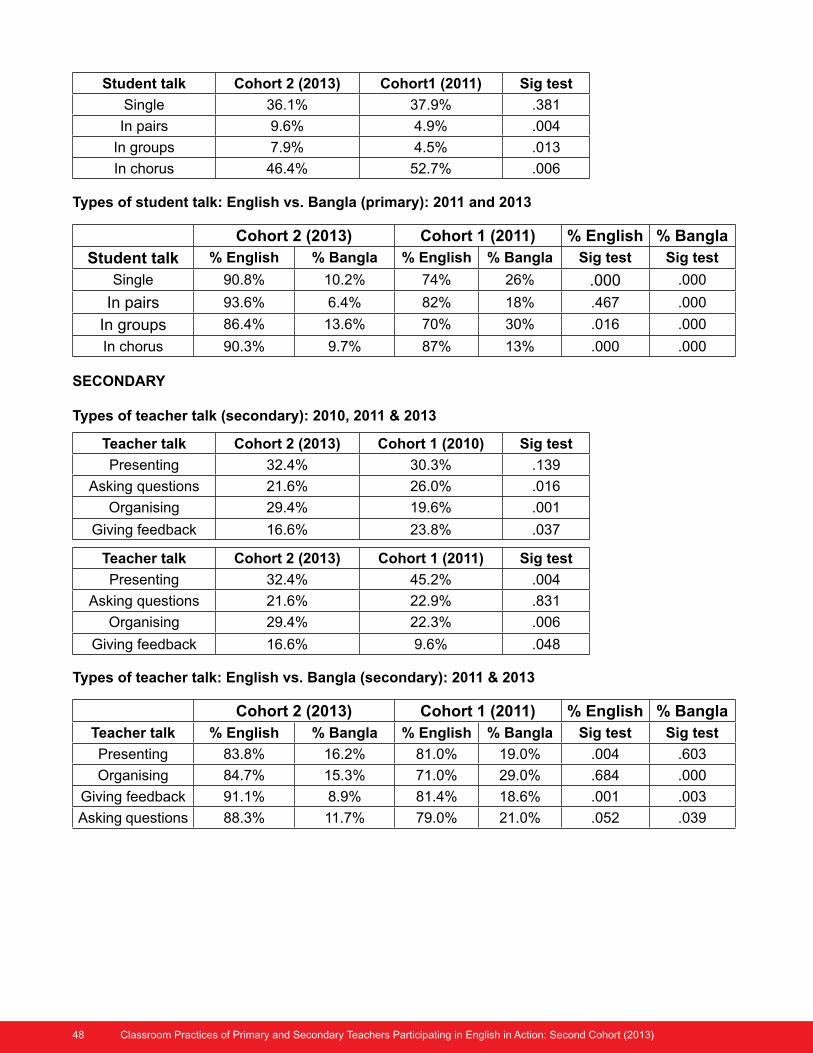
48 Classroom Practices of Primary and Secondary Teachers Participating in English in Action: Second Cohort (2013)
Teacher talk Cohort 2 (2013) Cohort 1 (2010) Sig test
Presenting 32.4% 30.3% .139
Asking questions 21.6% 26.0% .016
Organising 29.4% 19.6% .001
Giving feedback 16.6% 23.8% .037
Teacher talk Cohort 2 (2013) Cohort 1 (2011) Sig test
Presenting 32.4% 45.2% .004
Asking questions 21.6% 22.9% .831
Organising 29.4% 22.3% .006
Giving feedback 16.6% 9.6% .048
Cohort 2 (2013) Cohort 1 (2011) % English % BanglaTeacher talk % English % Bangla % English % Bangla Sig test Sig test
Presenting 83.8% 16.2% 81.0% 19.0% .004 .603
Organising 84.7% 15.3% 71.0% 29.0% .684 .000
Giving feedback 91.1% 8.9% 81.4% 18.6% .001 .003
Asking questions 88.3% 11.7% 79.0% 21.0% .052 .039
Cohort 2 (2013) Cohort 1 (2011) % English % Bangla
Student talk % English % Bangla % English % Bangla Sig test Sig test
Single 90.8% 10.2% 74% 26% .000 .000
In pairs 93.6% 6.4% 82% 18% .467 .000
In groups 86.4% 13.6% 70% 30% .016 .000
In chorus 90.3% 9.7% 87% 13% .000 .000
Types of teacher talk: English vs. Bangla (secondary): 2011 & 2013
Student talk Cohort 2 (2013) Cohort1 (2011) Sig test
Single 36.1% 37.9% .381
In pairs 9.6% 4.9% .004
In groups 7.9% 4.5% .013
In chorus 46.4% 52.7% .006
Types of student talk: English vs. Bangla (primary): 2011 and 2013
SECONDARY
Types of teacher talk (secondary): 2010, 2011 & 2013
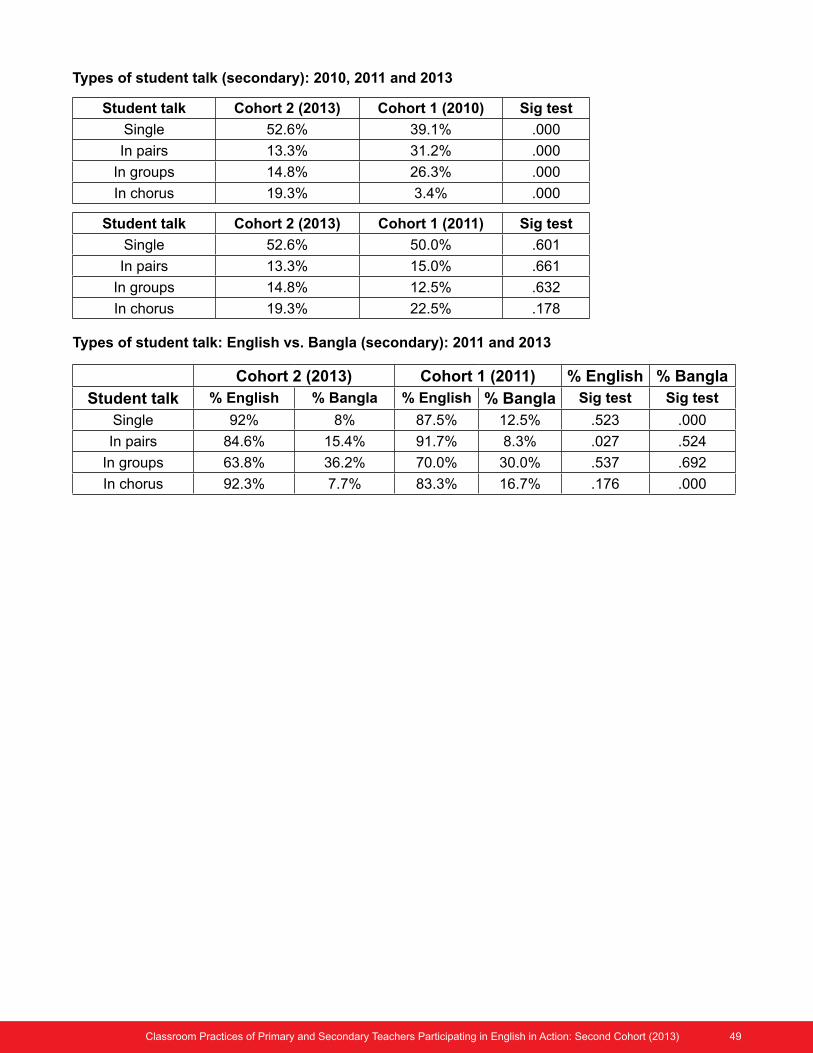
Classroom Practices of Primary and Secondary Teachers Participating in English in Action: Second Cohort (2013) 49
Student talk Cohort 2 (2013) Cohort 1 (2010) Sig test
Single 52.6% 39.1% .000
In pairs 13.3% 31.2% .000
In groups 14.8% 26.3% .000
In chorus 19.3% 3.4% .000
Student talk Cohort 2 (2013) Cohort 1 (2011) Sig test
Single 52.6% 50.0% .601
In pairs 13.3% 15.0% .661
In groups 14.8% 12.5% .632
In chorus 19.3% 22.5% .178
Types of student talk (secondary): 2010, 2011 and 2013
Cohort 2 (2013) Cohort 1 (2011) % English % Bangla
Student talk % English % Bangla % English % Bangla Sig test Sig test
Single 92% 8% 87.5% 12.5% .523 .000
In pairs 84.6% 15.4% 91.7% 8.3% .027 .524
In groups 63.8% 36.2% 70.0% 30.0% .537 .692
In chorus 92.3% 7.7% 83.3% 16.7% .176 .000
Types of student talk: English vs. Bangla (secondary): 2011 and 2013
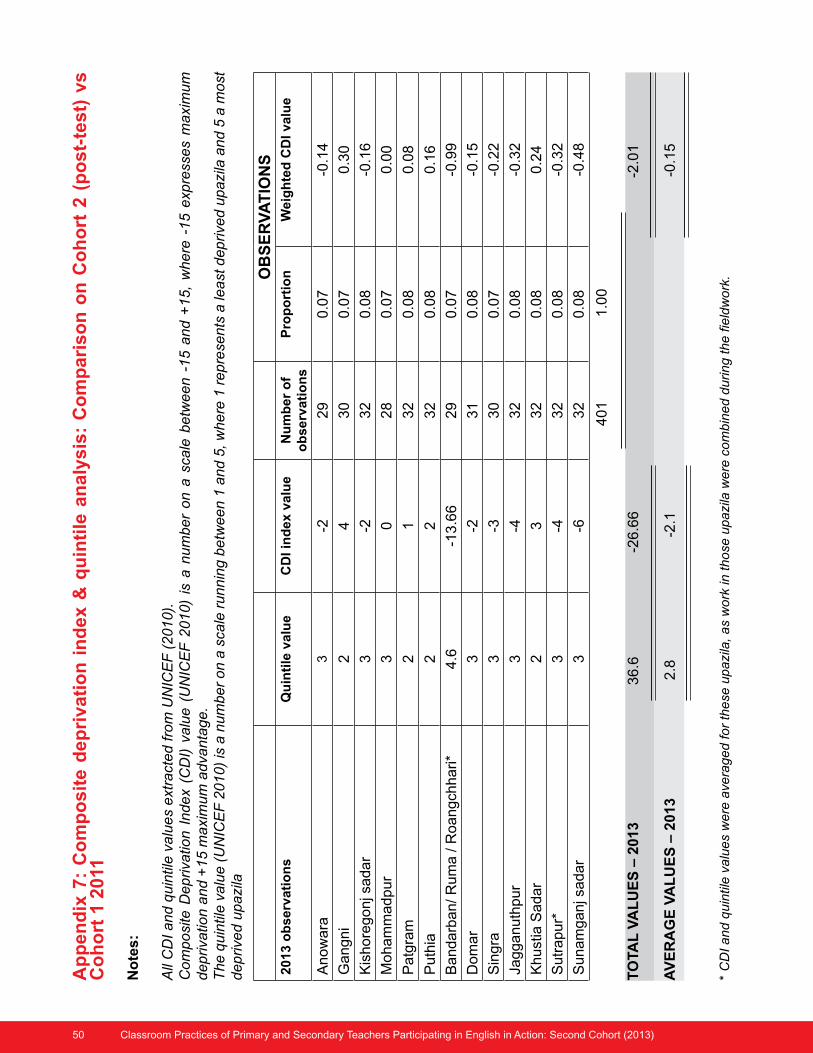
50 Classroom Practices of Primary and Secondary Teachers Participating in English in Action: Second Cohort (2013)
Ap
pen
dix
7:
Co
mp
osi
te d
epri
vati
on
in
dex
& q
uin
tile
an
alys
is:
Co
mp
aris
on
on
Co
ho
rt 2
(p
ost
-tes
t) v
s C
oh
ort
1 2
011
No
tes:
A
ll C
DI and q
uin
tile v
alu
es
ext
ract
ed fro
m U
NIC
EF
(2010).
Com
posi
te D
ep
riva
tion I
ndex
(CD
I) v
alu
e (
UN
ICE
F 2
010)
is a
num
ber
on a
sca
le b
etw
een -
15
an
d +
15
, w
he
re -
15
exp
ress
es
ma
xim
um
d
epriva
tion a
nd +
15 m
axi
mum
adva
nta
ge
.T
he q
uin
tile v
alu
e (
UN
ICE
F 2
010)
is a
num
ber
on a
sca
le r
unnin
g b
etw
een 1
and 5
, where
1 r
epre
sen
ts a
lea
st d
ep
rive
d u
pa
zila
an
d 5
a m
ost
d
eprive
d u
pazi
la
OB
SE
RV
AT
ION
S20
13 o
bse
rvat
ion
sQ
uin
tile
val
ue
CD
I in
dex
val
ue
Nu
mb
er o
f o
bse
rvat
ion
sP
rop
ort
ion
Wei
gh
ted
CD
I val
ue
Anow
ara
3-2
29
0.0
7-0
.14
Gangni
24
30
0.0
70
.30
Kis
hore
gonj s
adar
3-2
32
0.0
8-0
.16
Moham
madpu
r3
028
0.0
70
.00
Patg
ram
21
32
0.0
80
.08
Puth
ia2
232
0.0
80
.16
Bandarb
an/ R
um
a / R
oangch
hari*
4.6
-13.6
629
0.0
7-0
.99
Dom
ar
3-2
31
0.0
8-0
.15
Sin
gra
3-3
30
0.0
7-0
.22
Jagganuth
pur
3-4
32
0.0
8-0
.32
Khust
ia S
adar
23
32
0.0
80
.24
Sutr
apur*
3-4
32
0.0
8-0
.32
Sunam
ganj s
adar
3-6
32
0.0
8-0
.48
TO
TAL
VA
LU
ES
– 2
013
36.6
-
26.6
6
-
2.0
1
AV
ER
AG
E V
AL
UE
S –
201
3
2
.8
-
2.1
-
0.1
5
* C
DI and q
uin
tile v
alu
es
were
ave
raged for
these
upazi
la, as
work
in those
upazi
la w
ere
com
bin
ed d
urin
g t
he f
ield
work
.
401
1
.00
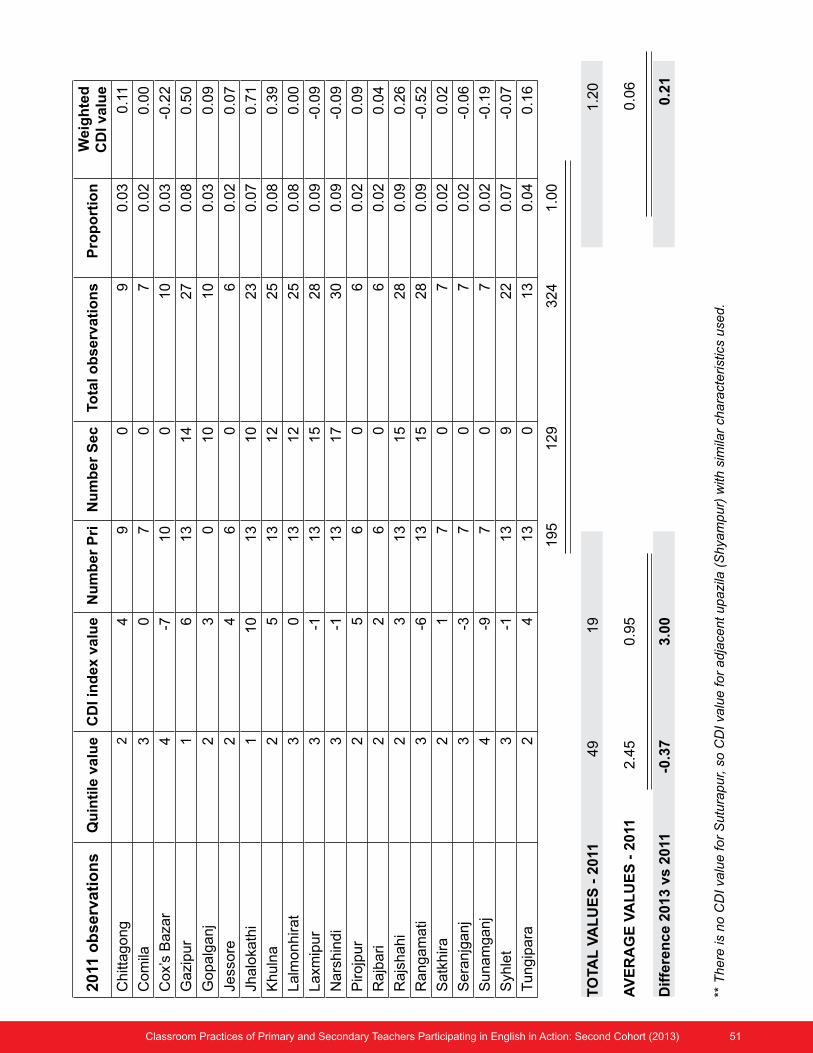
Classroom Practices of Primary and Secondary Teachers Participating in English in Action: Second Cohort (2013) 51
2011
ob
serv
atio
ns
Qu
inti
le v
alu
eC
DI i
nd
ex v
alu
eN
um
ber
Pri
Nu
mb
er S
ecTo
tal o
bse
rvat
ion
sP
rop
ort
ion
Wei
gh
ted
C
DI v
alu
e
Ch
ittagong
24
90
90
.03
0.1
1
Co
mila
30
70
70
.02
0.0
0
Co
x’s
Baza
r4
-710
01
00
.03
-0.2
2
Ga
zipur
16
13
14
27
0.0
80
.50
Go
palg
anj
23
010
10
0.0
30
.09
Jess
ore
24
60
60
.02
0.0
7
Jha
loka
thi
110
13
10
23
0.0
70
.71
Kh
uln
a2
513
12
25
0.0
80
.39
La
lmonhirat
30
13
12
25
0.0
80
.00
La
xmip
ur
3-1
13
15
28
0.0
9-0
.09
Na
rshin
di
3-1
13
17
30
0.0
9-0
.09
Pirojp
ur
25
60
60
.02
0.0
9
Ra
jbari
22
60
60
.02
0.0
4
Ra
jshahi
23
13
15
28
0.0
90
.26
Ra
ngam
ati
3-6
13
15
28
0.0
9-0
.52
Sa
tkhira
21
70
70
.02
0.0
2
Se
ranjg
anj
3-3
70
70
.02
-0.0
6
Su
nam
ganj
4-9
70
70
.02
-0.1
9
Syh
let
3-1
13
92
20
.07
-0.0
7
Tu
ngip
ara
24
13
01
30
.04
0.1
6
TO
TAL
VA
LU
ES
- 2
011
49
19
1
.20
AV
ER
AG
E V
AL
UE
S -
201
1 2
.45
0.9
5
0
.06
Dif
fere
nce
201
3 vs
201
1
-0.
37
3.0
0
0.
21
** T
here
is n
o C
DI va
lue for
Sutu
rapur,
so C
DI va
lue for
adja
cent upazi
la (
Shya
mpur)
with
sim
ilar
chara
cterist
ics
use
d.
195
129
32
4
1
.00