Classroom Observation Of Children With Adhd And Their ...
87
University of Central Florida University of Central Florida STARS STARS Electronic Theses and Dissertations, 2004-2019 2006 Classroom Observation Of Children With Adhd And Their Peers: A Classroom Observation Of Children With Adhd And Their Peers: A Meta-analytic Review Meta-analytic Review Michael Kofler University of Central Florida Part of the Psychology Commons Find similar works at: https://stars.library.ucf.edu/etd University of Central Florida Libraries http://library.ucf.edu This Masters Thesis (Open Access) is brought to you for free and open access by STARS. It has been accepted for inclusion in Electronic Theses and Dissertations, 2004-2019 by an authorized administrator of STARS. For more information, please contact [email protected]. STARS Citation STARS Citation Kofler, Michael, "Classroom Observation Of Children With Adhd And Their Peers: A Meta-analytic Review" (2006). Electronic Theses and Dissertations, 2004-2019. 4464. https://stars.library.ucf.edu/etd/4464
Transcript of Classroom Observation Of Children With Adhd And Their ...
University of Central Florida University of Central Florida
STARS STARS
Electronic Theses and Dissertations, 2004-2019
2006
Classroom Observation Of Children With Adhd And Their Peers: A Classroom Observation Of Children With Adhd And Their Peers: A
Meta-analytic Review Meta-analytic Review
Michael Kofler University of Central Florida
Part of the Psychology Commons
Find similar works at: https://stars.library.ucf.edu/etd
University of Central Florida Libraries http://library.ucf.edu
This Masters Thesis (Open Access) is brought to you for free and open access by STARS. It has been accepted for
inclusion in Electronic Theses and Dissertations, 2004-2019 by an authorized administrator of STARS. For more
information, please contact [email protected].
STARS Citation STARS Citation Kofler, Michael, "Classroom Observation Of Children With Adhd And Their Peers: A Meta-analytic Review" (2006). Electronic Theses and Dissertations, 2004-2019. 4464. https://stars.library.ucf.edu/etd/4464
CLASSROOM OBSERVATION OF CHILDREN WITH ADHD AND THEIR PEERS:
A META-ANALYTIC REVIEW
by
MICHAEL J. KOFLER B.S. Tulane University, 2000
A thesis submitted in partial fulfillment of the requirements for the degree of Master of Science in the Department of Psychology
in the College of Arts and Sciences at the University of Central Florida
Orlando, Florida
Spring Term 2006

© 2006 Michael J. Kofler
ii

ABSTRACT
Meta-analysis of 23 between-group direct observation studies of children with ADHD
and typically developing peers indicates significant deficiencies in children with ADHD's ability
to pay attention in classroom settings. Comparison with 59 single case design studies of children
with ADHD suggests generalizability of between-group comparisons. Weighted regression
analysis determined that several methodological differences – sample characteristics, diagnostic
procedures, and observational coding schema – have significant effects on observed levels of
attentive behavior in the classroom. Best case estimation indicates that after accounting for these
factors, children with ADHD are on-task approximately 65% of the time compared to 85% for
their classroom peers. Children with ADHD were also more variable in their attentive behavior
across studies. Implications for conceptual models of ADHD are discussed.
iii
TABLE OF CONTENTS
LIST OF FIGURES ....................................................................................................................... vi
LIST OF TABLES........................................................................................................................ vii
LIST OF ACRONYMS/ABBREVIATIONS.............................................................................. viii
CHAPTER ONE: INTRODUCTION............................................................................................. 1
The Need for a Meta-Analytic Approach ................................................................................... 4
Sample Characteristics............................................................................................................ 6
Diagnostics Methods............................................................................................................... 6
Classroom variables ................................................................................................................ 7
Observation methods .............................................................................................................. 8
CHAPTER TWO: METHODOLOGY......................................................................................... 10
Literature Searches.................................................................................................................... 10
Inclusion and Exclusion Criteria............................................................................................... 11
Coding of Moderators ............................................................................................................... 12
Sample................................................................................................................................... 12
Diagnostics............................................................................................................................ 12
Classroom variables .............................................................................................................. 14
Observation variables............................................................................................................ 14
Computation of Effect Sizes ..................................................................................................... 16
Hedges' g............................................................................................................................... 16
Multiple effect sizes.............................................................................................................. 17
Nonsignificant results ........................................................................................................... 17
iv

Data Analysis ............................................................................................................................ 18
CHAPTER THREE: RESULTS................................................................................................... 21
Tier I: Moderator-independent attentional differences ............................................................. 21
Publication Bias: The File Drawer Problem ......................................................................... 21
Off-task Comparisons ........................................................................................................... 21
Effect sizes ............................................................................................................................ 22
Tier II: Moderators of obtained effect size ............................................................................... 22
Fixed Effects Model.............................................................................................................. 22
Sample................................................................................................................................... 23
Diagnostics............................................................................................................................ 24
Classroom type...................................................................................................................... 25
Observation Variables........................................................................................................... 25
Tier III: Best Case Estimation and Original Metric.................................................................. 27
Best Case Estimation ............................................................................................................ 27
Power Analysis for Future Studies ....................................................................................... 27
Original Metric...................................................................................................................... 28
Tier IV: Single Case Design Studies ........................................................................................ 28
Mean Differences.................................................................................................................. 28
Effect Size Comparisons....................................................................................................... 29
Moderator Comparison ......................................................................................................... 29
CHAPTER FOUR: CONCLUSION............................................................................................. 45
LIST OF REFERENCES.............................................................................................................. 57
v
LIST OF FIGURES
Figure 1: Original Metric Differences Between Observed Classroom Attention Of Children With Adhd And Control
Children Based On Best Case Estimation After Controlling For Methodological Differences Among Studies.
...........................................................................................................................................................................43
vi
LIST OF TABLES
Table 1: Demographic And Methodological Variables ...............................................................................................30
Table 2: Mean Off-Task Rates, Standard Difference Scores, And Effect Sizes In Children With Adhd ....................33
Table 3: Stem And Leaf Display Of 23 Hedges G Effect Sizes ..................................................................................35
Table 4: Inverse Variance Weighted Regression Results ............................................................................................36
Table 5: Predicted And Obtained Effect Sizes For Single Case Design Studies .........................................................37
Table 6: Between Group And Single Case Design Study Moderator Variable Differences........................................38
Table 7: Single Case Design Studies: Demographic And Methodological Variables .................................................39
vii
LIST OF ACRONYMS/ABBREVIATIONS
ADHD Attention-Deficit/Hyperactivity Disorder
BG Between Group
CD Conduct Disorder
CPT Continuous Performance Task
DSM-IV Diagnostic and Statistical Manual of Mental Disorders,
Fourth Edition
ES Effect Size
LD Learning Disabilities
ODD Oppositional Defiant Disorder
SCD Single Case Design
viii
CHAPTER ONE: INTRODUCTION
Attention-Deficit/Hyperactivity Disorder (ADHD) is a chronic and disabling condition
that affects an estimated three to seven percent of school-age children (APA, 2000; Francis,
1993). Inattention in the classroom is associated with several negative outcomes: These children
are academically more likely to receive lower grades and standardized test scores (Zentall,
1993), be placed in special education classrooms, have comorbid learning disabilities, and repeat
a grade level compared to their typically developing peers (Faraone et al., 1993). More than half
of all children with ADHD fail at least one grade level by adolescence (Barkley et al., 1990), and
23 percent of children with ADHD fail to finish high school (Mannuzza et al., 1993). Early
academic difficulties are predictive of later academic problems (Fergusson & Horwood, 1995;
Rapport, Scanlan, & Denney, 1999), and longitudinal outcome studies of ADHD indicate that
adults diagnosed with ADHD as children are less likely to attend college, and more likely to
have unstable marriages, lower mean SES scores, and conduct problems compared to peers of
similar intelligence (Mannuzza et al., 1993).
Environmental demands impact the expression of ADHD-related symptoms (Rapport,
Chung, Shore, Denney, & Isaacs, 2000). Children with ADHD are indistinguishable from their
peers in some environments (e.g., during recess and non-academically related work periods), but
exhibit marked behavioral differences when encountering particular structured situational
demands (Porrino et al., 1983; Whalen et al., 1978). They pay attention less often during
academic instruction (Abikoff, Gittelman-Klein, & Klein, 1977), complete academic work
inconsistently (Barkley, DuPaul, & McMurray, 1990), and shift from one activity to another at
home more frequently compared with peers (DuPaul & Stoner, 2004). Situations involving novel
1
tasks (Power, 1992; Zentall & Meyer, 1987) and/or frequent reinforcement (Douglas & Parry,
1983; Pelham, Milich, & Walker, 1986) are associated with improved behavior and performance
in children with ADHD.
Laboratory studies employing rigorous experimental paradigms such as the Continuous
Performance Task (CPT) often, yet not always, report performance differences between children
with ADHD and typically developing children (Chung, Rapport, & Denney, 2005). The highly
controlled nature of the laboratory setting allows hypotheses to be tested regarding the
underlying processes of ADHD. However, such situational demands may evoke attentional
processes that differ from those required in the natural environment (Barkley, 1991).
Ecological validity concerns necessitate the investigation of more naturalistic procedures
for characterizing behavior, such as behavioral rating scales and direct observations by
independent researchers. Ratings scales are cost- and time-efficient measures capable of
capturing overall behavioral functioning. They provide a quantitative metric of the frequency and
severity of behavior, yet remain dependent upon subjective judgments and are vulnerable to
response bias, misinterpretation of questions, and over/underestimation of behavior due to
intensity/immediacy effects (Kazdin, 1997; Rutter & Graham, 1968). In contrast, direct
observations can provide more objective information by utilizing independent, well-trained
observers and specific, operationalized behavioral definitions (Kazdin, 1997). Observational
coding schemes offer decreased threats to validity in comparison with other methods. Unlike
global rating scales of behavior, observation codes are not subject to halo effects or rater
expectation bias (Abikoff et al., 2002; Harris & Lahey, 1982; Kent, O'Leary, Diament, & Dietz,
1974). Systematic and clearly defined behavior codes also may offer improved criterion validity
(Abikoff et al., 1977). Observation coding schemes are able to differentiate between typically
2
developing children and children with ADHD, suggesting diagnostic validity (Luk, 1985;
Pelham, Fabiano, & Massetti, 2005; Platzman et al., 1992). Classroom observation methods are
more likely than laboratory methods to report significant attentional differences between children
with ADHD and their peers (Platzman et al., 1992). However, sensitivity and specificity have not
been sufficiently established to allow diagnosis based solely on an observation code, or any other
single indicator (Abikoff et al., 2002; APA, 2000; Luk, 1985). Shortcomings of direct
observation methods include increased time and labor commitments as well as a lack of
agreement on behavioral definitions and standardized observation techniques.
Attentional problems are a core feature of ADHD, defined behaviorally in the DSM-IV
by characteristics such as distractibility, organizational problems, daydreaming, and frequent
shifting from one unfinished task to another (APA, 2000). Definitions of attention in the
literature refer to preferential selection and processing of sensory information – inattention is
inferred by frequent shifts in activity, and behaviors that are not task-related (Bear, Connors, &
Paradiso, 2001; Platman et al., 1992). In direct observation studies, attention is most often
operationalized as on-task behavior (e.g., Abikoff et al., 2002; DuPaul & Rapport, 1993).
Definitions invariably involve the child physically looking at the teacher or seat work, but vary
considerably in the duration of consecutive focus needed to code the child as on- or off-task.
This operationalization is limited by the need for observable behavior, and it is noted that it is
possible to pay attention to auditory stimuli without visually focusing, just as the direction of
one's eyes may not indicate task attention (e.g., daydreaming). The former may be more relevant
in studies observing children during teacher-led lectures, whereas the latter may influence results
of studies observing children during structured seat work. In laboratory settings, on-task data has
also been used to characterize vigilance (e.g., omission errors in CPT studies; Chung et al.,
3
2005). In a natural classroom setting, however, vigilance is only one of myriad factors
influencing a child's ability to pay attention or remain on-task (DuPaul & Stoner, 2004; Whalen
et al., 1978). In addition, behavioral observations of children with ADHD performing a CPT task
are more highly correlated with direct observations of classroom on-task behavior than CPT
performance (Schatz, Ballantyne, & Trauner, 2001).
The Need for a Meta-Analytic Approach
Attentional problems in the classroom are quintessential symptoms of children with
ADHD, and are often the catalyst for clinical referrals (Pelham, Fabiano, & Massetti, 2005). A
meta-analytic review provides not only documentation of this phenomenon across studies, but
unequivocal quantification of the magnitude of these attentional difficulties compared to
typically developing children. It is an accepted tenet of attention-deficit/hyperactivity disorder
(ADHD) that affected children are off-task more frequently and/or for longer durations than their
peers. However, the magnitude of this difference varies considerably across studies. Two
previous review articles have found that the overwhelming majority of direct observation studies
report significant differences between children with ADHD and their peers (Luk, 1985; Platzman
et al., 1992). Both reviews described classroom and laboratory observation studies and found that
most studies reported significant differences between the attentive behaviors of ADHD and
normal children. Luk (1985) concluded that differences in task demands and classroom situations
influenced behavioral differences between hyperactive and comparison children, but noted that
both the specific factors and their relative effects on behavior remain unknown. Platzman and
colleagues (1992) used difference-of-proportion tests to examine whether levels of a particular
variable are more or less likely to result in significant between-group differences. They
4

concluded that significant between-group differences were more likely to occur using classroom
rather than laboratory observation, however, diagnostic source (i.e., parent, teacher, or physician
report) was unrelated to the number of studies reporting significant differences. Both reviews
noted the significant variability among behavioral coding schemes, participant age, and study
setting (Luk, 1985; Platzman et al., 1992). The reviews, however, were primarily descriptive in
nature and failed to quantify between-study differences or analyze potential moderator variable
effects on observed differences in attention between children with ADHD and typically
developing controls. Box score literature reviews (e.g., comparing the number of studies finding
versus failing to find significant group differences) do not consider study power, and results may
therefore inaccurately reflect the data (see Howard, Maxwell, & Fleming, 2000 for details and
specific examples of this phenomenon). Moderating variables warrant scrutiny because of their
potential to change the nature of dependent-independent variable relationships, with implications
for theory development, refinement, and refutation (Holmbeck, 1997).
The present meta-analysis of published and unpublished studies examines both the
magnitude and variability of observed differences in classroom attention (on-task behavior)
between children with ADHD and their peers using standardized effect size estimates. The
potential moderating relationship of sample characteristics, diagnostic methods, classroom
variables, and observational schema on the magnitude of observed attentional differences in the
classroom are discussed below and analyzed to determine whether the variability between effect
size estimates exceeds levels expected based on study-level sampling error.
5

Sample Characteristics
Despite the restricted range related to the limited number of female subjects in most
studies, gender differences in ADHD prevalence rates and theoretical differences in symptom
manifestation necessitated the inclusion of this variable in moderator analysis (Barkley, 1990).
Gender has been found to predict DSM-IV diagnostic subtype in most but not all studies of
children with ADHD, with females more likely to exhibit inattentive symptoms and males more
likely to display hyperactive behavior (Abikoff et al., 2002; Biederman & Faraone, 2004; Graetz,
Sawyer, & Baghurst, 2005; Newcorn et al., 2001; Seidman, Biederman, & Monuteaux, 2005;
Weiss, Worling, & Wasdell, 2003; Yang, Jong, & Chung, 2004). Cognitive differences have also
been found between girls and boys diagnosed with ADHD (e.g., Carlson, Lahey, & Neeper,
1986; Douglas, 1988). A recent large-scale study of nonreferred boys and girls, however, found
no gender differences on any variables of interest. These results suggest that some earlier
findings may be the result of referral bias rather than true gender differences in the expression of
ADHD symptoms (Biederman et al., 2005). Previous meta-analytic reviews of children with
physical disabilities, autism, and dyslexia have reported that matching on gender, age, and other
demographic variables significantly influences outcome measures (Lavigne & Faier-Routman,
1992; Mottron, 2004; van Ijzendoorn & Bus, 1994).
Diagnostic Methods
Comprehensive clinical interviews, including structured/semi-structured interviews and
data from multiple informants, are the gold standard for ADHD diagnosis, whereas rating scales
provide a time- and cost-efficient method of identifying children whose behaviors are similar to
those of children meeting formal diagnostic criteria (McClellan & Werry, 2000; Pelham,
Fabiano, & Massetti, 2005; Rutter & Graham, 1968). Defining samples based solely on a referral
6

appears to be the least face valid method of grouping, considering the myriad of disorders and
conditions featuring attention and behavioral problems as core or secondary features (APA,
2000). Extant research suggests that significant correlations exist between rating scale cutoff
scores and semi-structured clinical interview diagnoses, as well as between parent and teacher
rating scale scores (Biederman, Keenan, & Faraone, 1990; Hodges, 1993; McGrath, Handwerk,
Armstrong, Lucas, & Friman, 2004). However, significant unexplained variability exists between
both diagnostic tools and informants. For example, McGrath and colleagues (2004) reported
correlations of .72 and .55 between symptom endorsement on the Diagnostic Interview Schedule
for Children – Fourth Edition (DISC-IV; Schaffer, Fisher, Lucas, Dulcan, & Schwab-Stone,
2000) and Conners parent and teacher rating scales (Conners, Parker, Sitarenios, & Epstein,
1998), respectively. This finding suggests that between 48% and 70% of the variability in
symptom endorsement on the semi-structured clinical interview is not accounted for by Conners
rating scale data. The correlation between parent and teacher ratings is often reported to be
somewhat lower than these values, highlighting the importance of considering informant source
in the diagnostic process (e.g., McGrath et al., 2004).
Classroom variables
Situational variables have been found to affect hyperactive symptomatology in
classroom (Barkley, Copeland, & Sivage, 1980; Beck, Kotkin, & Swanson, 1999; Pelham,
Wheeler, & Chronis, 1998; Rapport, Murphy, & Bailey, 1982; Zentall, 1980) and other settings
(e.g., Luk, 1985; Sleator & Ullmann, 1981). In addition, the specific academic task may have
significant effects on the activity level and task attention of children with ADHD (e.g., Whalen et
al., 1978; Zentall & Meyer, 1987).
7
Observation methods
Coding. The complexity of the coding scheme represents a trade-off between the amount
of data collected and the potential for information processing limitations that may decrease data
accuracy (Markman & Notarius, 1987). Coding fewer behaviors during live sessions is
associated with improved reliability and interobserver agreement, and fewer recording errors
(Dorsey, Nelson, & Hayes, 1986; Harris & Lahey, 1982). Smith, Madsen, and Cipani (1981)
found no differences between continuous recording, interval recording, and recording by incident
on measured reliability or observed rate of behavior. The interval type used by Smith and
colleagues, however, did not correspond to any used by studies in the current analysis, whereas
the continuous and by incident types descriptively matched. Other studies suggest improved
reliability with the momentary (by incidence) compared to whole or partial intervals (Ary &
Suen, 1983; Bramlett & Barnett, 1993), and others support the use of predefined intervals
(Mehm & Knutson, 1987).
Duration. The influence of observation duration in the available literature is mixed.
Observation duration is significantly related to variables of interest in some (Leaper, Anderson,
& Sanders, 1998; Sahni, Schulze, & Stefanski, 1995) but not all (Gertz, Stilson, & Gynther,
1959; Rowley, 1978) studies in other areas. A previous meta-analytic review of expressive
behavior failed to find outcome differences based on duration of observation (Ambady &
Rosenthal, 1992), however, to our knowledge no studies of children with ADHD have directly
examined the influence of observation duration on recorded behavior. Studies examining the
time needed for reliable observational data, as measured by criterion codes and session
intercorrelations, differ in their conclusions regarding the total number of minutes and days
necessary. Some conclude generally that more observations are better, without specifying
8
minimum within- and between-day durations (Barton & Ascione, 1984; Leaper et al., 1998);
others specify a minimum of five day, 20-minute sessions (Doll & Elliott, 1994) or 30-minute
observations for three days (McKevitt & Elliott, 2005); and some fail to find an effect of
observation duration on outcomes (Rowley, 1978). Both the population of interest and the
frequency of target behavior likely influence the total observation duration needed for a reliable
and valid sampling of behavior (Haynes, 2001). The behavior of children with ADHD has been
described as consistently inconsistent, suggesting that longer observation periods may better
capture the attentional processes of these children (e.g., Rapport et al., 1982).
Observational variables, including the type and quantity of behaviors measured (Lorber,
2004; Mezulis, Abramson, Hyde, & Hankin, 2004); and subject sampling, including diagnostic
assessment method and informant, age, and gender, significantly moderate effect size estimates
in most (Bogg & Roberts, 2004; Connell & Goodman, 2002; Sergerstrom & Miller, 2004) but
not all (Lavigne & Faier-Routman, 1992) previous meta-analytic reviews in other areas.
Previous empirical studies support the influence of methodological variables, however,
the relative impact of these variables for understanding classroom attentional differences in
children with ADHD and typically developing children remains unknown (Luk, 1985).
Significant moderating variables of these children’s classroom attention will be used to predict
the overall mean effect size that would be expected if all direct observation studies employed the
most rigorous methodology (Lipsey & Wilson, 2001). These metrics facilitate conclusions
concerning overall differences in classroom attention between children with ADHD and their
peers under ideal observation conditions.
9

CHAPTER TWO: METHODOLOGY
Literature Searches
A three-tier literature search was conducted using PsycInfo, PsycArticles, ERIC,
Dissertation Abstracts International, and Social Science Citation Index. Search terms included
permutations of the ADHD diagnostic label (ADHD, ADD, attention deficit, hyperactivity,
hyperkinesis, minimal brain dysfunction/damage, MBD), class*, observ*, behav*, school, direct,
attention, and on/off-task, where asterisks serve as wildcards (e.g., observ* will return studies
with the word observation, observations, observer, etc.). Separate searches were conducted to
find rating scale validation studies (additional search terms: rat*, reliab*, valid*, scale develop*)
and single case design studies (additional search terms: functional analysis, case study, single
subject). Searches were conducted with and without an ADHD search term included. Searches
were conducted independently by two researchers (MJK and RMA), and repeated until no new
studies were located. To further expand the initial study base, table of contents searches of the
following journals likely to publish classroom observation studies of children with ADHD were
undertaken: Journal of Applied Behavior Analysis, Behavior Modification, Behavior Research
and Therapy, Behavior Therapy, Journal of School Psychology, School Psychology Review, and
Journal of Attention Disorders. After the initial searches, studies cited by articles meeting
inclusion criteria were examined (Tier II backward search), and a forward search (Tier III) was
conducted using the Social Science Citation Index to locate studies citing those meeting
inclusion criteria. These procedures generated 509 dissertations, peer-reviewed studies, and
unpublished manuscripts written since 1962.
10

Inclusion and Exclusion Criteria
Inclusion/exclusion criteria were applied after the computerized searches were
completed. They were not entered as search delimiters to avoid missing studies due to database
misclassification. Inclusion and exclusion criteria are described below, with the number of
studies omitted for each criterion in parentheses. The following served as inclusion criteria for
the review: (a) an independent direct observation of children exhibiting inattentive, hyperactive,
and/or impulsive behavior in an elementary classroom setting (204); (b) between six and 12
years of age (24); (c) on- or off-task frequency or duration data reported, or statistics reported in
between group studies from which effect size can be estimated (94); and (d) low average or
higher estimated intelligence (16). Exclusion criteria included: (a) comorbidity with other mental
health disorders beyond Learning Disabilities (LD), Oppositional Defiant Disorder (ODD), or
Conduct Disorder (CD) (11); (b) stimulant or psychotropic medication taken during observation,
or no pretreatment baseline condition (74); and (c) repeat data (e.g., study published in journal
and as book chapter; follow-up longitudinal study (4). Single case design studies were included
if any subject(s) for which individual data was reported met inclusion criteria. Studies reporting
only placebo (i.e., no medication-free baseline) conditions were excluded based on research
demonstrating significant differences in functioning between baseline and placebo conditions in
children with ADHD (e.g., Rapport, Denney, DuPaul, & Gardner, 1994). Twenty-three studies
published from 1969 to 2004 met these search criteria and included a typically developing
comparison group1. An additional 59 single case design studies published between 1962 and
2005 met the above criteria.
1 Special thanks to Carmen Himmerich for translating Lauth & Mackowiak (2004) from German.
11
Coding of Moderators
Demographic and methodological variables are shown in Table 1 and described below.
Categorical variables were coded chronologically in the order listed below, such that higher
values are associated with an addition to the variable in question (e.g., adding matched controls,
diagnostic tools, observation time).
Sample
Total N. Sample size was used when both adjusting inflated effect sizes (i.e., Hedges' g
correction) and weighting effect size contribution to analyses (i.e., inverse variance weights).
Sample size was not coded as a moderator because further analysis would violate the variable
independence assumption (Lipsey & Wilson, 2001).
Percent male. The proportion of male subjects was coded as (a) predominately or all
male, or (b) 10% or more females, based on a previous meta-analytic review of predominately
male samples (Mezulis et al., 2004).
Matching. Three matching variables were coded. Gender, age/grade, and classroom were
each divided into two groups based on whether or not the researchers matched on each variable.
Diagnostics
Method. Diagnostic method was coded as: (a) referral for behavior problems with no
further diagnostics; (b) single informant rating scale (i.e., parent or teacher); (c) multiple
informant rating scales (i.e., parent and teacher); or (d) structured or semi-structured clinical
interview. All but one study using a diagnostic structured/semi-structured clinical interview also
included rating scales from multiple informants – the exception included a parent, but not a
teacher rating scale (Roberts, 1990). All but four studies used at least one Conners (Conners et
12
al., 1998) or Achenbach (i.e., Child Behavior Checklist/Teacher Report Form; Achenbach &
Rescorla, 2001) rating scale. The four exceptions were all published before 1978.
Moniker. Diagnostic label was coded as (a) behavioral problem children; (b) hyperactive;
or (c) ADD-H/ADHD. ADD-H and ADHD groups were combined due to research suggesting
that children diagnosed as ADD-H based on the DSM-III typically meet DSM-IV ADHD
Combined Type criteria (APA, 1987/2000; August & Garfinkel, 1993; Garfinkel & Amrami,
1992). Skansgaard and Burns (1998) reported separate results for DSM-IV Combined and
Inattentive Types. The Combined Type data were used to match the subtype used in other
included studies. The sole study not to specifically exclude children only meeting inattentive
criteria was Atkins, Pelham, and Licht (1985), whose nonhyperactive subjects represent less than
20% of his total sample2. As expected, diagnostic moniker was significantly correlated with year
of publication (r = .83). Inspection of the data reveals that only two studies (Book & Skeen,
1987; Roberts, 1990) fail to adhere to the following pattern: Studies published between 1969 and
1975 referred to their experimental group as Behavior Problem Children, research published
between 1977 and 1980 referred to them as Hyperactive, journal articles from 1984 to 1993 used
the ADD-H label, and studies from 1997 to 2004 use the current ADHD moniker. A correlation
between year of publication and DSM version was not computed because only nine of the 23
studies explicitly reported the DSM version used. Publication year was not included in moderator
analysis due to redundancy with diagnostic moniker (see footnote in results section).
2 Diagnostic subtypes are used in the DSM-III and DSM-IV, but not the DSM-III-R
13
Classroom variables
Type. Studies were coded into two categories: (a) normal classroom environments with
the child's regular teacher and classmates; and (b) simulated classrooms in research settings.
Activities. The classroom activity was reported to be seat work (12), or a combination of
seat work and teacher lecture (8) in 20 of the 23 studies, with three studies not reporting. The
specific activity in which the children were engaged (e.g., structured vs. unstructured academic
tasks; math vs. language arts) was reported in only two studies, precluding inclusion as a
moderator.
Observation variables
Total duration. Observation duration was coded as (a) one to 10 minutes per observation
session; (b) 11 to 20 minutes; or (c) 21 or more minutes.
Intervals. Within-observation intervals refer to the period of time spent observing before
coding the behaviors of interest. Observation interval was coded as (a) one to 10 seconds of
observation; (b) 11 or more seconds prior to coding, or (c) by incidence. The later category
includes studies that coded each behavior as it changed rather than subdividing the total
observation period into intervals.
Days of observation. Days of observation were coded as (a) one or two days of data
recording; (b) three or four days of direct observation per subject, or (c) five or more days. For
studies reporting a range of observation days, the minimum number of days for any subject was
used.
Number of behaviors coded. The number of behaviors simultaneously coded by study
observers was coded to retain groups of approximately equal size: (a) one to six, (b) 7-12, (c) 13-
20, or (d) more than 21 behaviors.
14
Number of observers. The total number of observers collecting data for a study was not
reported in nine of the 23 studies (39.1%), precluding inclusion in weighted regression analysis
requiring listwise deletion of missing data (i.e., including this variable would have decreased by
eight the number of studies analyzed, thus severely decreasing power and generalizability). This
variable will be analyzed using the analog to ANOVA technique to determine any systematic
relationship between the number of observers and obtained effect size.
Definition of off-task. Definition of off-task behavior refers to the minimum duration a
child must be off-task to be coded as such. This category was coded as (a) partial interval, where
time equal to less than a defined observational interval (as defined above) must pass before a
child is coded on-/off-task (e.g., DuPaul & Rapport, 1993, define 15-s coding intervals, during
which a child must be off-task for two or more consecutive seconds to be coded off-task for that
interval); (b) whole interval, where the subject must be off-task the entire interval, or; (c) per
incident, for studies coding each behavior change as it occurs. If a study coded children as on-
task only when they were engaged appropriately during the entire interval, the definition of off-
task was coded as partial – logically if the child were off-task at any point during an interval, he
would not have been coded as on-task.
Observation method. Observation method was coded dichotomously. The alternating
category includes studies observing ADHD and control children on each day in a multiple
subsequent pattern. For example, the Classroom Observation Code used by Abikoff and
colleagues (1977, 1980, 1984, 1985, & 2002) requires a four-minute observation of an ADHD
child followed by four minutes observing a comparison child, repeated until 16 minutes of data is
collected for each child. The continuous category includes studies observing one child for the
15
full duration reported. The total number of days and minutes each child is observed using either
method is equal.
Computation of Effect Sizes
Hedges' g
Hedges’ g (1982) effect sizes were calculated to estimate the magnitude of differences in
observed attention between children with ADHD and control children in classroom settings.
Hedges' g provides a correction to the standardized mean difference effect size to correct for the
upward bias of studies with small sample size. Conceptually, an effect size is the amount of
difference in standard deviation units between comparison groups (Lipsey & Wilson, 2001). An
effect size of 1.0 indicates that the experimental group on average scored one standard deviation
higher than the comparison group on the outcome in question. Effect sizes (ES) are categorized
as small (ES ≤ 0.30), medium (ES ≈ 0.50), and large (ES ≥ 0.67) effects. These values are based
on an analysis of over 300 published meta-analyses, and are used in lieu of those originally
proposed by Cohen (1977). Means, standard deviations, and sample sizes were used to compute
Hedges’ g for 17 studies (77%). An additional four studies (18%) provided sample size and p- or
t-values needed for estimation, and one effect size was calculated using between-group
difference and pooled standard deviation (Solanto et al., 2001). DuPaul, Ervin, Hook, and
McGoey (1998) reported individual means for subjects, which were used for the calculation of
group means and standard deviations. The Comprehensive Meta-Analysis software package was
used to calculate effect sizes. Mean effect sizes were weighted by their inverse variance weight
(w) during subsequent analyses to correct for imprecision associated with larger standard error,
such that each study contributes in proportion to its sample size (Lipsey & Wilson, 2001).
16
Multiple effect sizes
Three studies reported data sufficient to calculate multiple effect sizes. Only one effect
size was used for each study to meet the independence assumption (Lipsey & Wilson, 2001).
Abikoff et al. (2002) reported separate descriptive statistics for males and females (N = 806 and
198, respectively), which were pooled based on recommendations by Lipsey and Wilson (2001).
Zentall (1980) provided data for both off-task frequency and duration. Duration data were used
to match the data format reported in the majority of studies. Jacob, O'Leary, and Rosenblad
(1978) provided data for both formal and informal classroom settings. The formal classroom data
was chosen because it consisted of teacher-led assignments typical of a normal classroom setting.
Nonsignificant results
Shecket and Shecket (1976) did not provide data sufficient to calculate effect size, but
reported no significant between-group differences. An effect size of 0.00 was adopted for this
study to minimize Type I error consistent with recommendations addressing the file drawer
problem (i.e., publication bias favoring large, statistically significant effects; Rosenthal, 1995).
This method is conservative in nature and may artificially decrease effect size estimates.
Excluding such studies, however, may result in artificially small p-values and larger effect size
estimates. The fail-safe N was computed to determine the potential bias of unpublished studies.
This procedure estimates the number of studies with a 0.0 effect size that would be needed to
decrease the overall mean effect size such that its confidence interval contained 0.0 (i.e., overall
no significant differences between study groups). A rank correlation test was also used to further
analyze the potential effects of publication bias (described below; Lipsey & Wilson, 2001).
17

Data Analysis
A four-tier data analytic strategy was adopted. In the first tier, Hedges’ g effect sizes
were calculated for the variable off-task in each study. Studies reporting on-task percentages
were converted to off-task using the formula 100 – on-task %. Studies reporting number of
intervals on-/off-task were converted to percentage off-task by dividing by the total number of
intervals. An initial overall mean effect size was computed for fixed effects and tested for
homogeneity using the Q statistic to determine whether the amount of variance between studies
could be attributed to random, study-level error variance (Lipsey & Wilson, 2001). A significant
Q rejects the assumption of homogeneity and requires further analysis.
Inverse variance weights (wi = 1/SE2) were calculated for each effect size in the second
tier. These values cause studies with larger sample sizes, and hence less sampling error, to be
weighted more heavily than studies with smaller sample sizes and larger standard errors. A fixed
effects weighted regression approach using SPSS for Windows 12.0 was adopted3. This approach
assumes that additional variance is systematically related to measured study variables. It
provides two measures of overall fit: QR, which reflects variance accounted for by the regression
model (p degrees of freedom, where p equals the number of predictors); and QE, variance
unaccounted for by either the model or random, study-level sampling error (k – p – 1 degrees of
freedom, where k equals the number of studies). Both statistics are distributed as chi-square.
3 Note: the QB and QW analog to ANOVA technique reported in many meta-
analytic reviews was not used for primary analyses because it inflates Type I error when used
with several moderator variables – see Lipsey & Wilson, 2001 for discussion of this problem.
18

Corrected B-weight standard error for each moderator variable was calculated and each variable
was tested against the z-distribution (Lipsey & Wilson, 2001).
In the third tier, a modified regression equation using the significant moderators from tier
two was created to estimate the mean effect size that would likely have been obtained had all
studies employed the best case combination of moderator variables found to significantly
influence study results. The regression equation is solved by selecting the value of each
moderator corresponding to empirically validated best practice (Lipsey & Wilson, 2001). To
further explicate the results, original metric scores were calculated for each group to examine the
difference in frequency of off-task behavior between children with ADHD and typically
developing controls by adding the product of the overall weighted mean effect size and the
control group standard deviation to the overall weighted mean of the control groups (Lipsey &
Wilson, 2001). This procedure is similar to computing standard difference scores for raw data –
it translates the effect size onto the control group distribution (e.g., Losier, McGrath, & Klein,
1996). Power analysis was conducted using GPower (Faul & Erdfelder, 1992) to determine the
minimum number of subjects future studies will likely need to detect between-group differences
in classroom attention given the best case effect size. Power analysis was used not as a
theoretically suspect a posteriori analysis (i.e., there is no chance of a Type II error if obtained
results are significant; Cohen, 1992), but as a first step for future research of the classroom
attention of children with ADHD.
In the final tier, the 59 single case/case study design studies were analyzed and compared
to the 23 between-group studies to determine the generalizability of the results obtained from the
above procedures. Demographic and methodological variables and ADHD off-task rates for
single case design studies are shown in Table 7. Three analyses were completed. Weighted
19

means for both groups of studies were compared using a t-test, power analysis, and area under
the curve calculations. The Jacobson and Truax (1991) model of clinical significance informed
this analysis, and computations were repeated after accounting for differences in the number of
studies in each group. The second analysis involved the calculation of effect sizes for the six
studies including a typically developing contrast group. Effect sizes could not be calculated for
the vast majority (56 of 61) of these studies because they did not include a normal control group.
In all six cases, peer group sample size was unreported and set equal to the number of children
with ADHD to provide rough estimates of effect size. Obtained effect sizes were compared to the
effect sizes predicted by the regression equation obtained in the between-group analysis. The
third analysis compared between-group and single case studies using a series of ANOVAs for
each of the significant moderators found in the between-group analyses. Bonferroni corrections
for multiple comparisons were employed.
20
CHAPTER THREE: RESULTS
Tier I: Moderator-independent attentional differences
Publication Bias: The File Drawer Problem
A Fail-safe N analysis was computed to determine the likelihood that missing studies
would significantly influence the obtained mean effect sizes (Lipsey & Wilson, 2001; Rosenthal,
1991). Results indicate that an unlikely 1,829 studies would be needed to reduce the confidence
interval of the mean effect size to include zero (i.e., result in no significant differences between
off-task rates of children with ADHD and typically developing children in the classroom). A
rank correlation test (Begg & Mazumdar, 1994) for publication bias was non-significant,
Kendall's tau b = 0.155, p = 0.15. The Trim and Fill procedure suggests that zero studies are
missing from the analysis based on expected symmetry when plotting effect sizes by the inverse
of their standard errors (Duval & Tweedie, 2000). Collectively, these analyses suggest that the
effect of publication bias is minimal in the current meta-analysis.
Off-task Comparisons
Off-task rates are shown in Table 2. Children with ADHD were off-task an average of
28.15% across studies (range = 5.11% to 83.0%), compared with 14.96% (range = 0.78% to
70%) for control children for the 20 studies reporting this data. All but two studies reported
significant between-group differences (Cunningham & Siegel, 1987; Shecket & Shecket, 1976).
At the group level, children with ADHD were more variable than control children across studies.
The mean standard deviation across studies was significantly greater for ADHD groups than
control groups, t(16) = 4.76, p < .0005.
21

Effect sizes
Effect sizes (ES), standard error of effect size (SEES), and standard difference scores
(SDS) are shown in Table 2. Mean weighted effect size for the 23 studies was 0.71 (95% CI =
0.62-0.79) with a range of 0.00 to 2.23. This result corresponds to a large effect based on Lipsey
and Wilson (2001) criteria. The overall test of homogeneity suggests that there is more variance
among the effect sizes than would be predicted by study-level error alone (Q = 119.81, p <
.0005). A stem and leaf representation of the distribution of effect sizes is shown in Table 3.
Tier II: Moderators of obtained effect size
Fixed Effects Model
Analysis of moderator variables was conducted on 15 studies reporting data for all
variables of interest. An ANOVA was conducted to determine whether there were systematic
differences between studies reporting all data and studies with missing data. Results indicate no
significant differences for effect size (F = 0.66, p = .43) or any moderator variables except
classroom matching (F = 7.34, p = .013) and diagnostic method (F = 9.05, p = .007). Classroom
matching, but not diagnostic method, was no longer significant after correcting for the number of
comparisons. Studies with missing diagnostic data include all four studies diagnosing based
solely on a referral for behavior problems, and two of the seven (29%) studies using single
informant rating scales. When the behavior problem code was eliminated, no significant
differences remained (F = 0.351, p = .56). Diagnostic method was therefore retained in the
model, with the code for referral deleted.
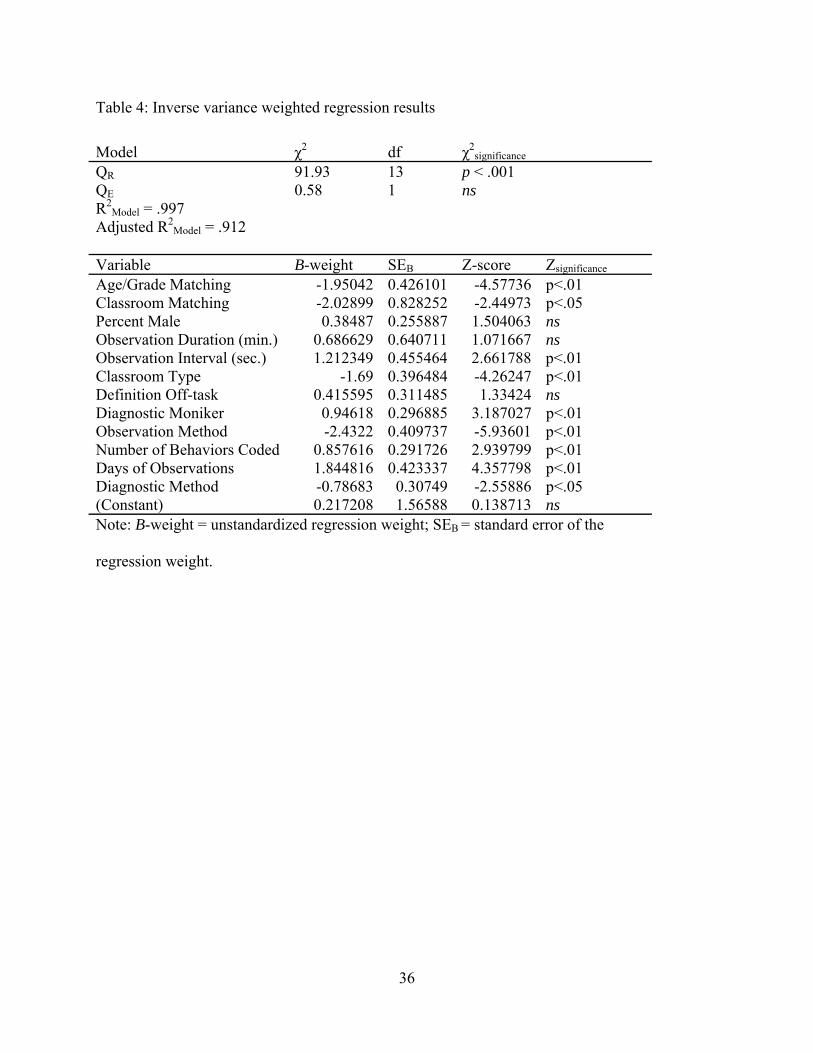
A fixed effects weighted regression model was adopted to examine the influence of
potential moderator variables on the observed variability in effect sizes. Results of the fixed
22

effects weighted regression reveal that the moderator variables described below predicted a large
amount of the variance in effect sizes (adjusted R2 = .91; QR = 91.93, p < .001; QE = 0.58, p =
ns). QR is analogous to the F-test for the χ2 distribution, wherein a significant QR indicates that
the model predicts significant variability in the effect sizes (Lipsey & Wilson, 2001). A
nonsignificant QE indicates that only subject-level sampling error remains across effect sizes
after accounting for variability explained by the model (Lipsey & Wilson, 2001). The influence
of each study variable is described below.
Sample
Total N. Sample size was reported in all 23 studies, and ranged from 16 to 1004 children,
with a median of 56 children. Sample size was used in the weighting of effect sizes and was
therefore not analyzed further.
Percent Male. Gender was reported in 20 of 23 studies, with males representing 84.6%
(range = 33% to 100%) of all subjects. The proportion of male to female subjects was not a
significant moderator in the regression analysis (z = 1.50, ns).
Matching. ADHD and control children were matched on two or more variables in 14 of
the 23 studies (61%). One study matched only on age (Werry & Quay, 1969), and seven studies
did not report matching on any variables. Fourteen (61%) studies matched based on sex, seven
(30%) based on age, 10 (44%) by grade in school, and seven (30%) by classroom. Age/grade (z
= -4.58, p < .01) and classroom matching (z = -2.45, p < .01) were both significant predictors of
effect size in the regression. Matching on these variables was associated with smaller effect
sizes. Gender matching was not used in the final regression due to lack of variability (see above).
An analog to ANOVA was conducted to determine the potential influence of gender matching on
23

obtained effect sizes (Lipsey & Wilson, 2001). Results reveal that gender matching did not
account for significant differences in effect sizes (QB = 2.90, p = .09; QW = 19.22, p = .57).
Mean Age. Mean age (8.36 years, range of means = 7.2 to 9.6 years) was reported for
both ADHD and control groups in 20 of the 23 studies (87%). Age mean was not analyzed as a
moderator due to the restricted range across studies.
Diagnostics
Method. Four general methods were used to diagnose subjects, including formal semi-
structured diagnostic interviews (26%), multiple informant rating scales (i.e., parent and teacher;
22%), single informant rating scales (teacher only, 26%; parent only, 4%) and referral from
teacher (13%) or pediatrician (4%) without subsequent reported rating scales/clinical interviews.
One study did not report diagnostic method (Werry & Quay, 1969). Of the five studies using
diagnostic clinical interviews with the parent, four (80%) also used rating scales from multiple
informants, and one added a parent rating scale. Rating scales were used in a majority of studies
(N=17; 74%) to select sample participants. Diagnostic method significantly predicted effect size
in the model (z = -2.43, p < .05), with more stringent diagnostic procedures associated with
smaller effect sizes.
Moniker. The ADHD/ADDH moniker was used in eight of 23 (35%) studies, 12 of 23
(52%) studies used the term hyperactive or hyperkinetic, and two studies described their sample
as behavioral problem children (9%). Diagnostic moniker significantly predicted effect size (z =
3.19, p < .01) after eliminating the behavior problem code due to missing data (see above), with
24
studies using children with ADDH/ADHD reporting larger effect sizes than studies of
hyperactive children4.
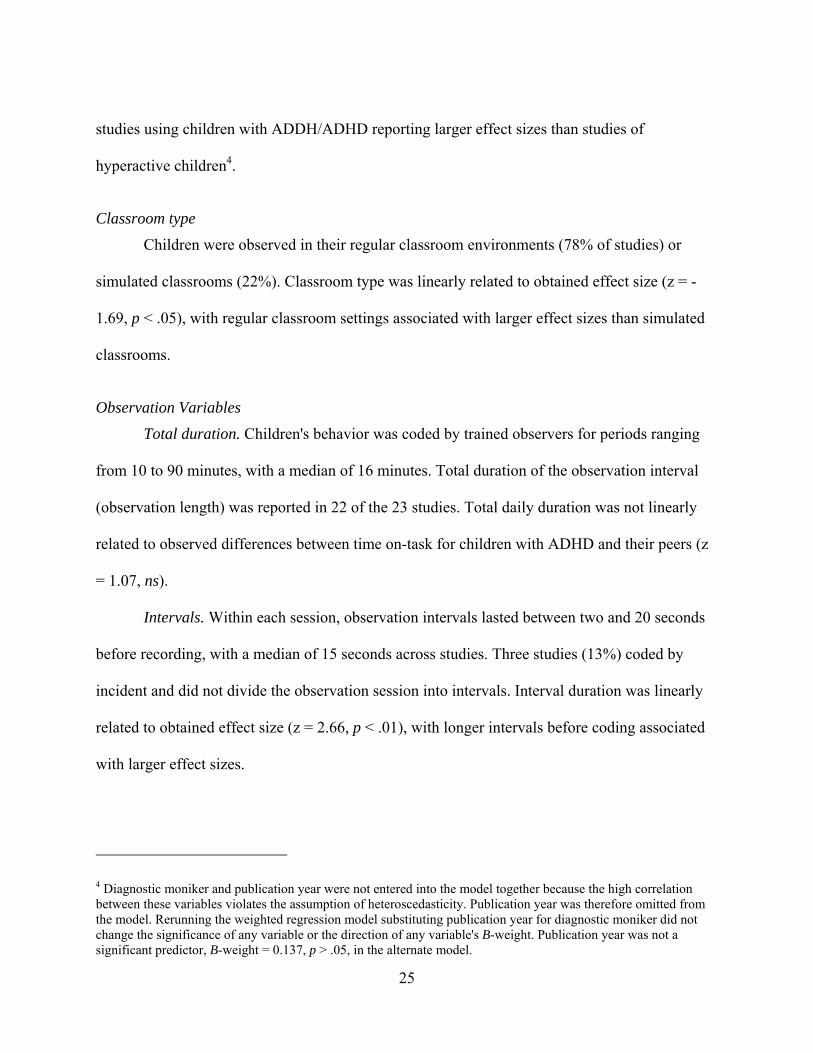
Classroom type
Children were observed in their regular classroom environments (78% of studies) or
simulated classrooms (22%). Classroom type was linearly related to obtained effect size (z = -
1.69, p < .05), with regular classroom settings associated with larger effect sizes than simulated
classrooms.
Observation Variables
Total duration. Children's behavior was coded by trained observers for periods ranging
from 10 to 90 minutes, with a median of 16 minutes. Total duration of the observation interval
(observation length) was reported in 22 of the 23 studies. Total daily duration was not linearly
related to observed differences between time on-task for children with ADHD and their peers (z
= 1.07, ns).
Intervals. Within each session, observation intervals lasted between two and 20 seconds
before recording, with a median of 15 seconds across studies. Three studies (13%) coded by
incident and did not divide the observation session into intervals. Interval duration was linearly
related to obtained effect size (z = 2.66, p < .01), with longer intervals before coding associated
with larger effect sizes.
4 Diagnostic moniker and publication year were not entered into the model together because the high correlation between these variables violates the assumption of heteroscedasticity. Publication year was therefore omitted from the model. Rerunning the weighted regression model substituting publication year for diagnostic moniker did not change the significance of any variable or the direction of any variable's B-weight. Publication year was not a significant predictor, B-weight = 0.137, p > .05, in the alternate model.
25
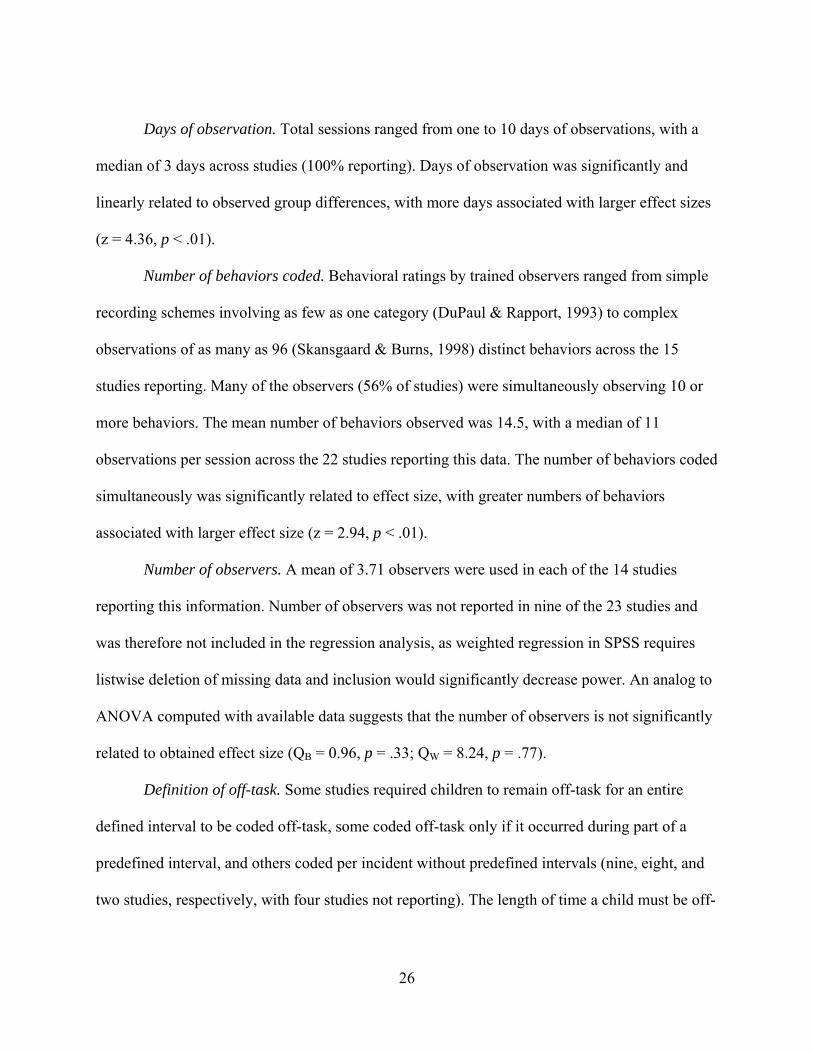
Days of observation. Total sessions ranged from one to 10 days of observations, with a
median of 3 days across studies (100% reporting). Days of observation was significantly and
linearly related to observed group differences, with more days associated with larger effect sizes
(z = 4.36, p < .01).
Number of behaviors coded. Behavioral ratings by trained observers ranged from simple
recording schemes involving as few as one category (DuPaul & Rapport, 1993) to complex
observations of as many as 96 (Skansgaard & Burns, 1998) distinct behaviors across the 15
studies reporting. Many of the observers (56% of studies) were simultaneously observing 10 or
more behaviors. The mean number of behaviors observed was 14.5, with a median of 11
observations per session across the 22 studies reporting this data. The number of behaviors coded
simultaneously was significantly related to effect size, with greater numbers of behaviors
associated with larger effect size (z = 2.94, p < .01).
Number of observers. A mean of 3.71 observers were used in each of the 14 studies
reporting this information. Number of observers was not reported in nine of the 23 studies and
was therefore not included in the regression analysis, as weighted regression in SPSS requires
listwise deletion of missing data and inclusion would significantly decrease power. An analog to
ANOVA computed with available data suggests that the number of observers is not significantly
related to obtained effect size (QB = 0.96, p = .33; QW = 8.24, p = .77).
Definition of off-task. Some studies required children to remain off-task for an entire
defined interval to be coded off-task, some coded off-task only if it occurred during part of a
predefined interval, and others coded per incident without predefined intervals (nine, eight, and
two studies, respectively, with four studies not reporting). The length of time a child must be off-
26

task to be coded as such was not significantly related to obtained effect size differences between
children with and without ADHD (z = 1.33, ns)
Observation method. Eight studies used a continuous observation schema, whereas 14
alternated coding between experimental and control children within the same observation period.
One study did not report observation method. Observation method predicted the magnitude of
obtained effects, with continuous observation associated with smaller effect sizes (z = -5.94, p <
.01).
Tier III: Best Case Estimation and Original Metric
Best Case Estimation
Values corresponding to age/grade and classroom matching, regular classroom settings,
longer observation intervals, use of the ADHD moniker based on semi-structured clinical
interviews and multiple informants, fewer behaviors simultaneously coded, continuous
observation schemes, and greater total days of observation were selected based on best practice
for each significant predictor in the regression equation (Lipsey & Wilson, 2001). Solving the
regression equation using these values and corresponding B-weights (Table 4) suggests that an
effect size of 1.40 would be expected on average for studies employing this combination of
observational and diagnostic methodology, sample and classroom characteristics.
Power Analysis for Future Studies
GPower (Faul & Erdfelder, 1992) was used to determine the minimum sample size
needed by future researchers to detect significant between-group differences in observed
classroom attention of children with ADHD compared to their peers. With the best case effect
27
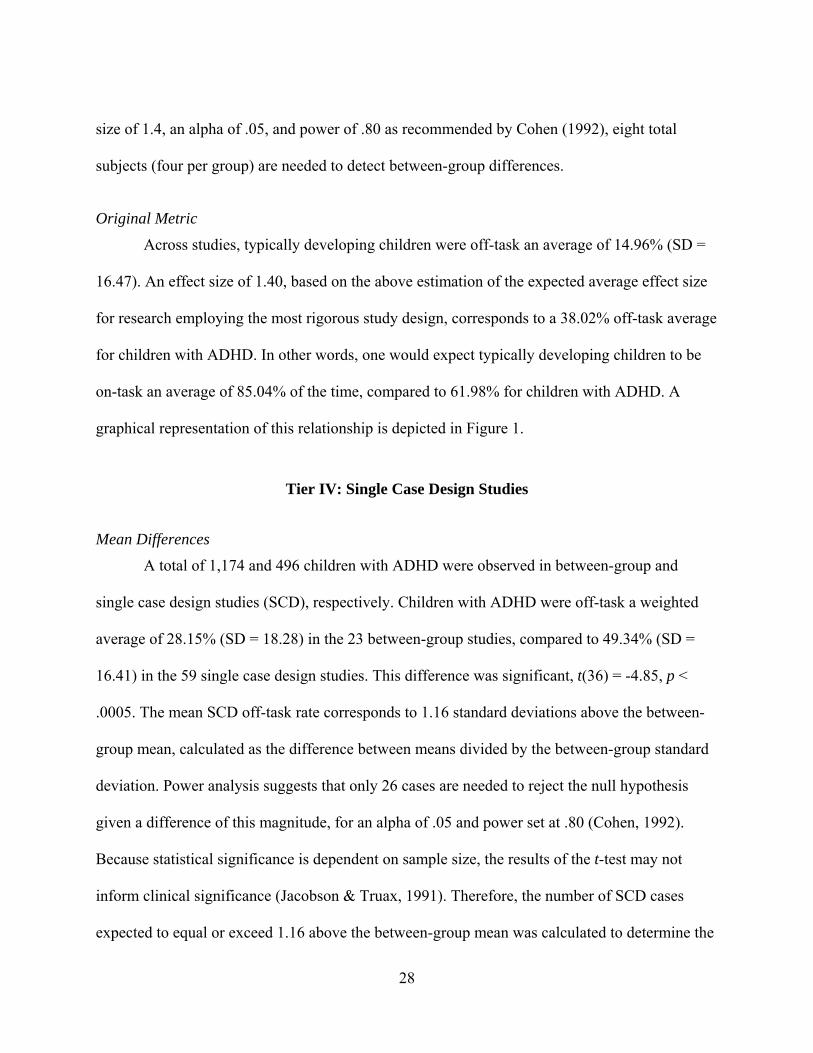
size of 1.4, an alpha of .05, and power of .80 as recommended by Cohen (1992), eight total
subjects (four per group) are needed to detect between-group differences.
Original Metric
Across studies, typically developing children were off-task an average of 14.96% (SD =
16.47). An effect size of 1.40, based on the above estimation of the expected average effect size
for research employing the most rigorous study design, corresponds to a 38.02% off-task average
for children with ADHD. In other words, one would expect typically developing children to be
on-task an average of 85.04% of the time, compared to 61.98% for children with ADHD. A
graphical representation of this relationship is depicted in Figure 1.
Tier IV: Single Case Design Studies
Mean Differences
A total of 1,174 and 496 children with ADHD were observed in between-group and
single case design studies (SCD), respectively. Children with ADHD were off-task a weighted
average of 28.15% (SD = 18.28) in the 23 between-group studies, compared to 49.34% (SD =
16.41) in the 59 single case design studies. This difference was significant, t(36) = -4.85, p <
.0005. The mean SCD off-task rate corresponds to 1.16 standard deviations above the between-
group mean, calculated as the difference between means divided by the between-group standard
deviation. Power analysis suggests that only 26 cases are needed to reject the null hypothesis
given a difference of this magnitude, for an alpha of .05 and power set at .80 (Cohen, 1992).
Because statistical significance is dependent on sample size, the results of the t-test may not
inform clinical significance (Jacobson & Truax, 1991). Therefore, the number of SCD cases
expected to equal or exceed 1.16 above the between-group mean was calculated to determine the
28

29
likelihood that the SCD studies come from a different population than the between-group studies.
With an average between-group sample size of 51.04, and a normal distribution assumed, one
would expect 6.28 subjects to meet or exceed 1.16 standard deviations above the mean,
calculated as 51.04 times the area under curve (AUC = .1230). Multiplying the average number
of SCD subjects by the area at or beyond the SCD mean (AUC = .5000; 8.13 x 0.5 = 4.08)
suggests that fewer subjects than expected actually score at or above 1.16 SD above the between-
group mean.
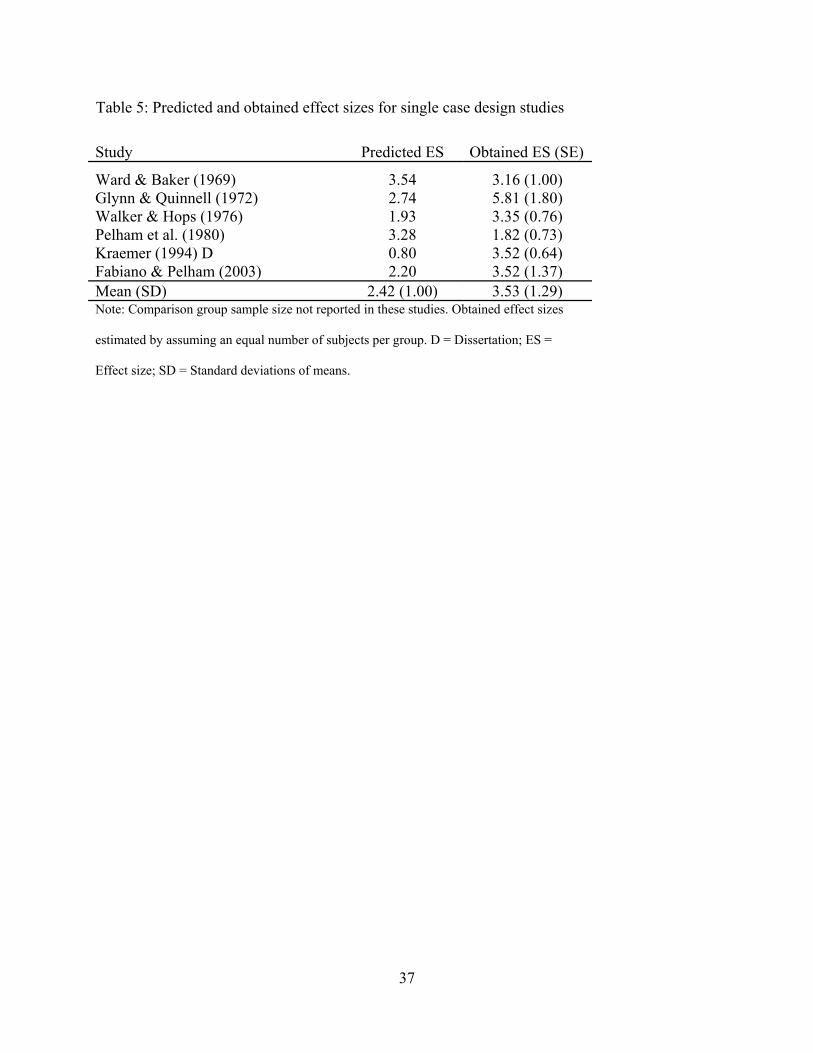
Effect Size Comparisons
Obtained and predicted effect sizes for the six SCD studies are displayed in Table 5.
Obtained effect sizes (M = 3.53, SD = 1.29) did not differ significantly from effect sizes
predicted by the regression equation, t(9) = 1.67, p = .117, ns. It is noted that the small number of
studies analyzed may have influenced the failure to find statistically significant differences.
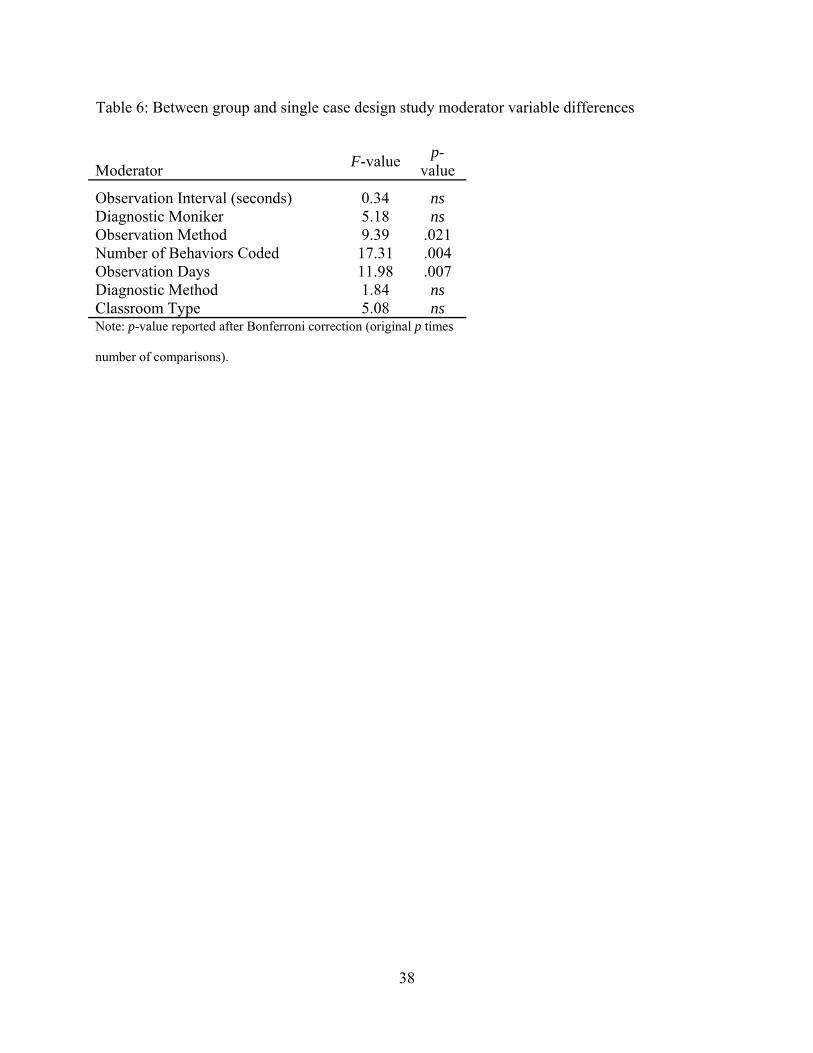
Moderator Comparison
Seven Bonferroni-corrected ANOVAs were conducted to analyze potential differences
between between-group and SCD studies. Results are shown in Table 6. The studies differed on
three of the variables found in Tier II to significantly influence observed differences between
children with ADHD and typically developing children. In the Tier II regression equation,
observation method is associated with smaller effect sizes, whereas the number of behaviors
coded and number of observation days predicted larger magnitude differences.
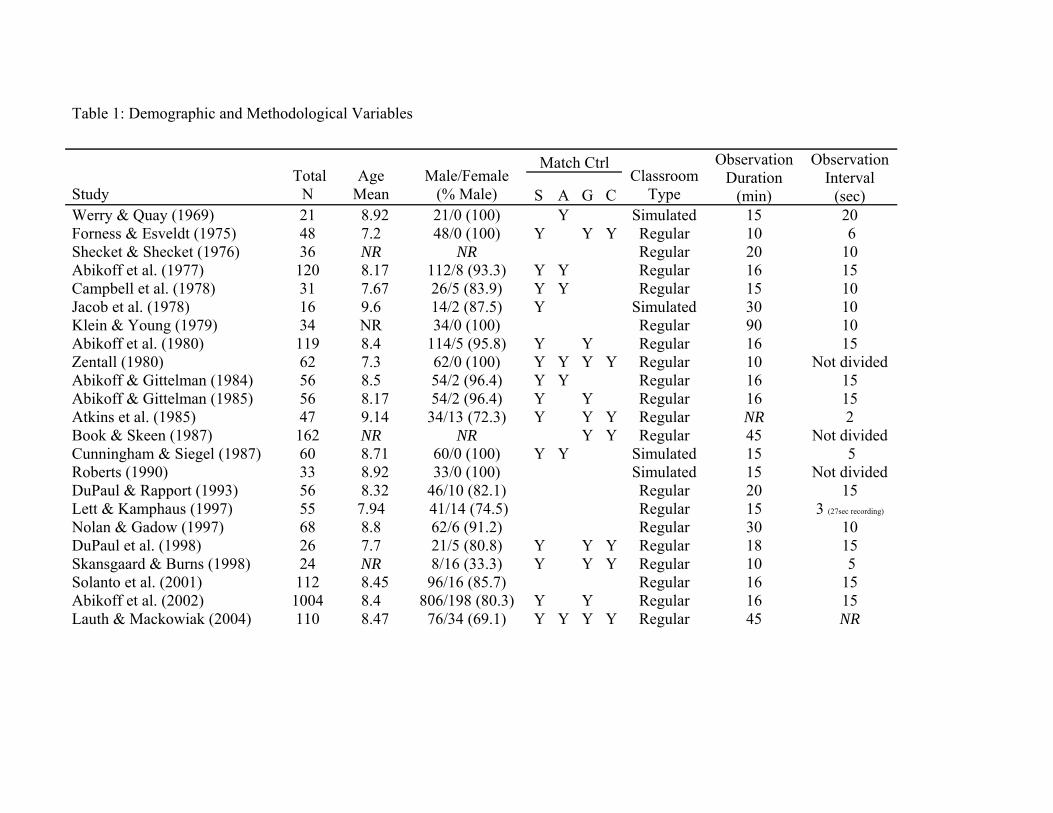
Table 1: Demographic and Methodological Variables
Match Ctrl
Study Total
N Age
Mean Male/Female
(% Male) S A G C Classroom
Type
Observation Duration
(min)
Observation Interval
(sec)Werry & Quay (1969) 21 8.92 21/0 (100) Y Simulated 15 20 Forness & Esveldt (1975) 48 7.2 48/0 (100)
Y Y Y
Regular 10 6
Shecket & Shecket (1976) 36 NR
NR Regular 20 10Abikoff et al. (1977) 120 8.17 112/8 (93.3) Y Y Regular 16 15 Campbell et al. (1978) 31 7.67 26/5 (83.9) Y Y Regular 15 10 Jacob et al. (1978) 16 9.6 14/2 (87.5) Y Simulated
30 10
Klein & Young (1979) 34 NR 34/0 (100) Regular 90 10Abikoff et al. (1980) 119 8.4 114/5 (95.8) Y Y Regular 16 15 Zentall (1980) 62 7.3 62/0 (100) Y Y Y Y Regular 10 Not dividedAbikoff & Gittelman (1984) 56 8.5 54/2 (96.4) Y Y Regular 16 15 Abikoff & Gittelman (1985) 56 8.17 54/2 (96.4) Y Y Regular 16 15 Atkins et al. (1985) 47 9.14 34/13 (72.3) Y Y Y Regular NR 2 Book & Skeen (1987) 162 NR NR Y Y Regular 45 Not dividedCunningham & Siegel (1987) 60 8.71 60/0 (100) Y Y Simulated 15 5 Roberts (1990) 33 8.92 33/0 (100) Simulated 15 Not divided
DuPaul & Rapport (1993) 56 8.32 46/10 (82.1) Regular 20 15Lett & Kamphaus (1997) 55 7.94 41/14 (74.5) Regular 15 3 (27sec recording)
Nolan & Gadow (1997) 68 8.8 62/6 (91.2) Regular 30 10DuPaul et al. (1998) 26 7.7 21/5 (80.8) Y Y Y Regular 18 15 Skansgaard & Burns (1998) 24 NR 8/16 (33.3) Y Y Y
Regular 10 5
Solanto et al. (2001) 112 8.45 96/16 (85.7) Regular 16 15Abikoff et al. (2002) 1004 8.4 806/198 (80.3) Y Y Regular 16 15 Lauth & Mackowiak (2004) 110 8.47 76/34 (69.1) Y Y Y Y Regular 45 NR
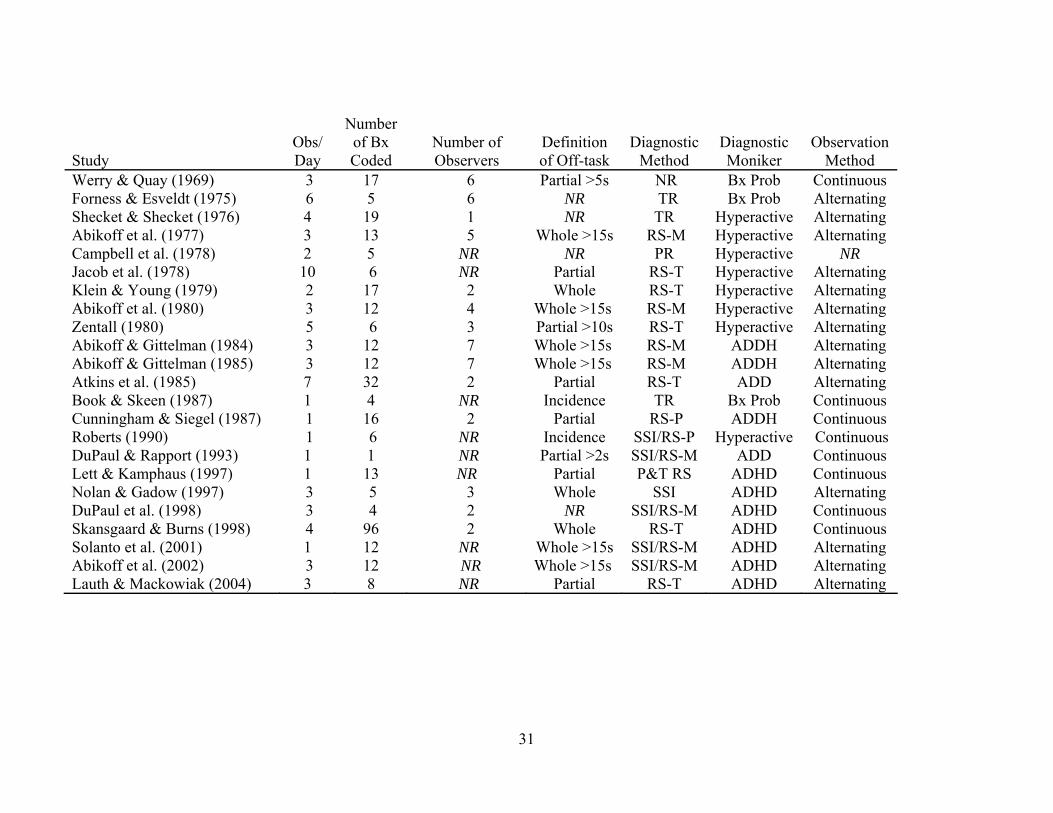
Study
Obs/Day
Number of Bx Coded
Number of Observers
Definition of Off-task
Diagnostic Method
Diagnostic Moniker
Observation Method
Werry & Quay (1969) 3 17 6 Partial >5s NR Bx Prob Continuous Forness & Esveldt (1975) 6 5 6 NR TR Bx Prob Alternating Shecket & Shecket (1976) 4 19 1 NR TR
Hyperactive AlternatingAbikoff et al. (1977) 3 13 5 Whole >15s RS-M Hyperactive Alternating
Campbell et al. (1978) 2 5 NR NR PR Hyperactive NR Jacob et al. (1978) 10 6 NR Partial RS-T Hyperactive AlternatingKlein & Young (1979) 2 17 2 Whole RS-T Hyperactive AlternatingAbikoff et al. (1980) 3 12 4 Whole >15s RS-M Hyperactive Alternating Zentall (1980) 5 6 3 Partial >10s RS-T Hyperactive AlternatingAbikoff & Gittelman (1984) 3 12 7 Whole >15s RS-M ADDH Alternating Abikoff & Gittelman (1985) 3 12 7 Whole >15s RS-M ADDH Alternating Atkins et al. (1985) 7 32 2 Partial RS-T ADD AlternatingBook & Skeen (1987) 1 4 NR Incidence TR Bx Prob ContinuousCunningham & Siegel (1987) 1 16 2 Partial RS-P ADDH Continuous Roberts (1990) 1 6 NR Incidence SSI/RS-P Hyperactive ContinuousDuPaul & Rapport (1993) 1 1 NR Partial >2s SSI/RS-M ADD Continuous Lett & Kamphaus (1997) 1 13 NR Partial P&T RS ADHD ContinuousNolan & Gadow (1997) 3 5 3 Whole SSI ADHD Alternating DuPaul et al. (1998) 3 4 2 NR SSI/RS-M ADHD ContinuousSkansgaard & Burns (1998) 4 96 2 Whole RS-T ADHD Continuous Solanto et al. (2001) 1 12 NR Whole >15s SSI/RS-M ADHD Alternating Abikoff et al. (2002) 3 12 NR Whole >15s SSI/RS-M ADHD Alternating Lauth & Mackowiak (2004) 3 8 NR Partial RS-T ADHD Alternating
31
Notes. A = Age; Alternating = abab or similar method; Bx Prob = Referred for behavioral problems/hyperactivity; C = Classroom; Continuous =
Observing one child exclusively for entire observation period; Definition of Off-task = Proportion of interval needed to be coded off task; F = Females; G
= Grade; M = Multiple informants; No of Bx Coded = Number of behaviors coded; NR = Not reported; Obs/Day = Number of observation days;
Observation Duration = Minutes of observation; Observation Interval = Seconds before recording; P = Parent rating scale Only; PR = Pediatrician referral;
RS = Rating scale(s); S = Sex; SSI = Semi-structured interview; T = Teacher rating scale only; TR = Teacher Referral.
32
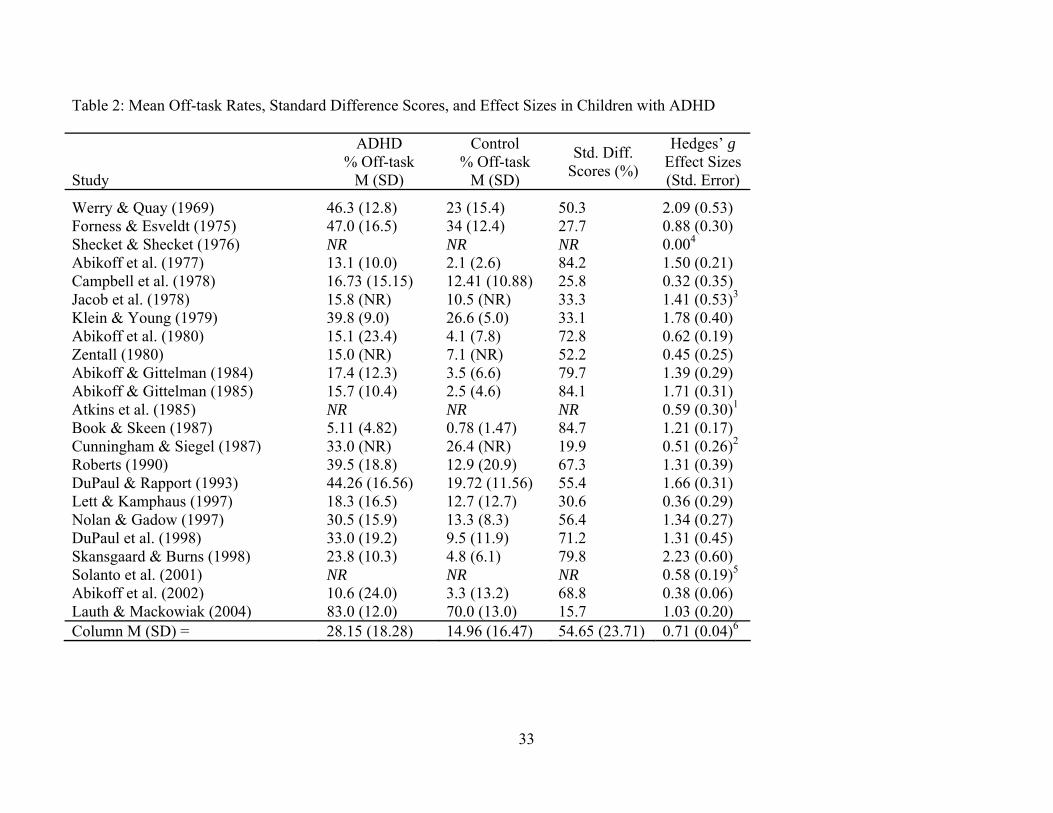
Table 2: Mean Off-task Rates, Standard Difference Scores, and Effect Sizes in Children with ADHD
Study
ADHD % Off-task
M (SD)
Control % Off-task
M (SD)
Std. Diff. Scores (%)
Hedges’ g Effect Sizes (Std. Error)
Werry & Quay (1969) 46.3 (12.8) 23 (15.4) 50.3 2.09 (0.53) Forness & Esveldt (1975) 47.0 (16.5)
34 (12.4) 27.7 0.88 (0.30)
Shecket & Shecket (1976) NR NR
NR 0.004
Abikoff et al. (1977) 13.1 (10.0) 2.1 (2.6) 84.2 1.50 (0.21) Campbell et al. (1978) 16.73 (15.15) 12.41 (10.88) 25.8 0.32 (0.35) Jacob et al. (1978) 15.8 (NR) 10.5 (NR) 33.3 1.41 (0.53)3
Klein & Young (1979) 39.8 (9.0) 26.6 (5.0) 33.1 1.78 (0.40) Abikoff et al. (1980) 15.1 (23.4) 4.1 (7.8) 72.8 0.62 (0.19) Zentall (1980) 15.0 (NR) 7.1 (NR) 52.2 0.45 (0.25) Abikoff & Gittelman (1984) 17.4 (12.3) 3.5 (6.6) 79.7 1.39 (0.29) Abikoff & Gittelman (1985) 15.7 (10.4)
2.5 (4.6) 84.1 1.71 (0.31)
Atkins et al. (1985) NR NR NR 0.59 (0.30)1
Book & Skeen (1987) 5.11 (4.82) 0.78 (1.47) 84.7 1.21 (0.17) Cunningham & Siegel (1987) 33.0 (NR) 26.4 (NR) 19.9 0.51 (0.26)2
Roberts (1990) 39.5 (18.8) 12.9 (20.9) 67.3 1.31 (0.39) DuPaul & Rapport (1993) 44.26 (16.56) 19.72 (11.56) 55.4 1.66 (0.31) Lett & Kamphaus (1997) 18.3 (16.5) 12.7 (12.7) 30.6 0.36 (0.29) Nolan & Gadow (1997) 30.5 (15.9) 13.3 (8.3) 56.4 1.34 (0.27) DuPaul et al. (1998) 33.0 (19.2) 9.5 (11.9) 71.2 1.31 (0.45) Skansgaard & Burns (1998) 23.8 (10.3)
4.8 (6.1) 79.8 2.23 (0.60)
Solanto et al. (2001) NR NR NR 0.58 (0.19)5
Abikoff et al. (2002) 10.6 (24.0) 3.3 (13.2) 68.8 0.38 (0.06) Lauth & Mackowiak (2004) 83.0 (12.0) 70.0 (13.0) 15.7 1.03 (0.20) Column M (SD) = 28.15 (18.28) 14.96 (16.47) 54.65 (23.71) 0.71 (0.04)6
33
34
Notes: 1Effect size calculated using N = 47, t = 2.01; 2Effect size calculated using N = 60, p = .052;
3Effect size calculated using N = 16, p = .01; 4Effect size set at zero – insufficient data to calculate effect size of
nonsignificant differences; 5Effect size calculated using differences in means (.007), common SD (.12), and N = 112;
6Standard error of effect sizes; SD = Mean of standard deviations for included studies.

Table 3: Stem and Leaf Display of 23 Hedges g Effect Sizes
Stem Leaf 2.2 2.1
2.0 1.9 1.8 1.7 1.6 1.5 1.4 1.3 1.2 1.1 1.0 0.9 0.8 0.7 0.6 0.5 0.4 0.3 0.2 0.1 0.0
3 9 1, 8 6 0 1 1, 1, 4, 9 1 3 8 2 1, 8, 9 5 2, 6, 8 0
Note: A stem-and-leaf plot of classroom attentional differences. Effect
sizes are arranged by place value such that digits in the left column
represent the stem, while digits in the right columns represent the leaf.
For example, the effect sizes of .32, .36, and .38 are represented as .3 in
the left column, and 2, 6, and 8 in the right columns, respectively.
36
Table 4: Inverse variance weighted regression results
Model χ2 df χ2significance
QR 91.93 13 p < .001 QE 0.58 1 ns R2
Model = .997 Adjusted R2
Model = .912 Variable B-weight SEB Z-score Zsignificance
Age/Grade Matching -1.95042 0.426101 -4.57736 p<.01 Classroom Matching -2.02899 0.828252 -2.44973 p<.05 Percent Male 0.38487 0.255887 1.504063 ns Observation Duration (min.) 0.686629 0.640711 1.071667 ns Observation Interval (sec.) 1.212349 0.455464 2.661788 p<.01 Classroom Type -1.69 0.396484 -4.26247 p<.01 Definition Off-task 0.415595 0.311485 1.33424 ns Diagnostic Moniker 0.94618 0.296885 3.187027 p<.01 Observation Method -2.4322 0.409737 -5.93601 p<.01 Number of Behaviors Coded 0.857616 0.291726 2.939799 p<.01 Days of Observations 1.844816 0.423337 4.357798 p<.01 Diagnostic Method -0.78683 0.30749 -2.55886 p<.05 (Constant) 0.217208 1.56588 0.138713 ns Note: B-weight = unstandardized regression weight; SEB = standard error of the
regression weight.
37
Table 5: Predicted and obtained effect sizes for single case design studies
Study Predicted ES Obtained ES (SE)
Ward & Baker (1969) 3.54 3.16 (1.00) Glynn & Quinnell (1972) 2.74 5.81 (1.80) Walker & Hops (1976) 1.93 3.35 (0.76) Pelham et al. (1980) 3.28 1.82 (0.73) Kraemer (1994) D 0.80 3.52 (0.64) Fabiano & Pelham (2003) 2.20 3.52 (1.37) Mean (SD) 2.42 (1.00) 3.53 (1.29) Note: Comparison group sample size not reported in these studies. Obtained effect sizes
estimated by assuming an equal number of subjects per group. D = Dissertation; ES =
Effect size; SD = Standard deviations of means.
38
Table 6: Between group and single case design study moderator variable differences
Moderator F-value p-value
Observation Interval (seconds) 0.34 ns Diagnostic Moniker 5.18 ns Observation Method 9.39 .021 Number of Behaviors Coded 17.31 .004 Observation Days 11.98 .007 Diagnostic Method 1.84 ns Classroom Type 5.08 ns Note: p-value reported after Bonferroni correction (original p times
number of comparisons).

Table 7: Single Case Design Studies: Demographic and Methodological Variables
Study Total
N1 Age
Mean Male/Female
(% Male) Classroom
Type
Observation Duration
(min)
Observation Interval
(sec)
ADHD % Off-task
M (SD) Quay et al. (1967) 5 7.52 100% Regular 12.5 10 62% (NR)2
Hall et al. (1968) 6 NR 67%
Regular 30 10 60.33% (15.17) Ward & Baker (1969) 8 NR 75% Regular 15 20 74%
Buckley & Walker (1971) 44 NR 88.6% Regular 6 15 55% (NR) Glynn & Quinnell (1971) 6 NR NR Regular 35 10 53.67% (3.79)Axelrod et al. (1972) 1 NR 100% Regular 120 (2hrs)
120 (2 min)
40% (NR)2
Glynn & Thomas (1974) 9 NR 89% Regular 50 10 51.4%McCullough et al. (1974) 1 6 100% Regular 120 (2 hrs)
900 (15 min)
70.4% (8.17)2
Walker et al. (1976) 10 NR 90% Regular 12 15 64% (NR) Walker & Hops (1976) 24 NR 71% Regular 9 6 72.4% (5.85) Hay et al. (1977) 10 NR 100% Regular 10 10 46.30% (12.76)
Marholin & Steinman (1977) 8 NR 50% Regular 15 10 67%Walker (1977) D 12 NR 83.3% Regular 16 30 38.33% (10.96)Epstein & Goss (1978) 1 10 100% Regular 30 Momentary
75% (NR)
O’Leary & Pelham (1978) 7 8.67 NR Regular 15 10 53.38% (30.40)Rose (1978) 2 8 0% Regular 30 NR 25% (13.36)2 Loney et al. (1979) 24 NR 100% Regular NR NR 39% (NR) Friedling & O'Leary (1979) 4 7.58 87.5% Regular 10 15 44% (4.1%)Barkley et al. (1980) 6 8.35 100% Simulated 10 15 50.25% (9.18)2 Cameron & Robinson (1980) 3 7.8 66.7% Regular (SE) 25 10 43.31% (14.97)Pelham et al. (1980) 8 8.3 87.5% Regular 15 10 43% Rapport et al. (1980) 2 7.5 50% Regular 60 25 70.8% (12.27)2 Eastman & Rasbury (1981) 11 NR NR Regular 15 10 33.0% (11.00)Hallahan et al. (1981) 3 10.3 100% Regular (SE) 20 2 74.07% (7.13)2
Krause (1981) D 1 7 100% Regular 20 10 27%Roberts & Nelson (1981) 3 NR 100% Regular 30 10 41.53% (NA)Gettinger (1982) 8 7.9 50% Regular (SE) 30 10 82.1% (11.3)Hallahan et al. (1982) 1 8 100% Regular (SE) 20 4 54.38% (11.71)2
Lloyd et al. (1982) 3 9.33 66.7% Regular (SE) NR 2 48.93% (28.03)2
39

Study Total
N1 Age
Mean Male/Female
(% Male) Classroom
Type
Observation Duration
(min)
Observation Interval
(sec)
ADHD % Off-task
M (SD) Rapport et al. (1982) 2 7.5 100% Regular 20 10 58.5% (8.19)2 Rhode et al. (1983) 6 8.7 NA Regular
15 10 61.83% (10.65)Shepp & Jensen (1983) 1 7 100% Regular (SE) 60 10 38.0% (2.83)2 Rooney et al. (1984) 4 NR 50% Regular 20 2 86.95% (11.99)2
Rosen et al. (1984) 23 NR 73.9% Regular (SE) 30 10 20.26% (NR) Rapport et al. (1985) 12 NR 100% Regular 20 10 47% (NR)2 Burlton-Bennet et al. (1987) 1 6 100% Regular 30 10 74% (NR) Rapport et al. (1987) 42 8.5 88.1% Regular 20 15 46.5% (18.80)Walker (1989) D 6 NR 100% Regular 20 15 71.25% (9.01)Szymula (1990) D 8 NR 75% Regular 30 10 37.04% (NR) Bloomquist et al. (1991) 13 8.81 69.23% Regular 10 10 49.4% (10.0)
DuPaul et al. (1992) 1 7 100% Regular (SE) 15 30 58.5% (NR) Paniagua (1992) 1 10 100% Regular 10 30 88.6% (12.19)2 DuPaul & Henningson (1993) 1 7 100% Regular NR NR 61% Kraemer (1994) D 12 8.33 NR Regular 10 20 52.00% (8.88)Rapport et al. (1994) 76 8.51 86.8% Regular 20 15 44% (NR)2 Kelley & McCain (1995) 3 7.0 67% Simulated 45 15 53.67% Turner (1996) D 6 8.99 33.3% Regular 10 10 46% (NR)2 Matheson (1997) D 3 10 100% Regular 15 30 66% (range: 44-90%)
Sams (1999) D 4 NR 100% Regular 20 10 38% (NR)2 Cloward (2000) D 8 NR 63% Regular 10 6 26.16% (7.18)Swenson et al. (2000) 1 12 100% Regular (SE) 60 NA 41.33% (NR) Roberts et al. (2001) 3 NR 100% Regular 15 15 70.67% (NR) Northup & Gulley (2001) 1 NR NR Regular 5 10 10% (NR) Austin (2003) D 1 8.33 100% Regular 20 15 56% (NR) Fabiano & Pelham (2003) 1 9.92 100% Regular 50 1 33.22% (9.82) Lorah (2003) D 3 9.25 100% Regular 15 15 27% (NR)
Dobrinski (2004) D 4 8 75% Regular 20 10 56.38% (15.48) Trolinder et al. (2004) 2 2 50% Regular 20 10 47.15% (14.24)Clarfield & Stoner (2005) 1 7 100% Regular 10 15 49% (NR)
40
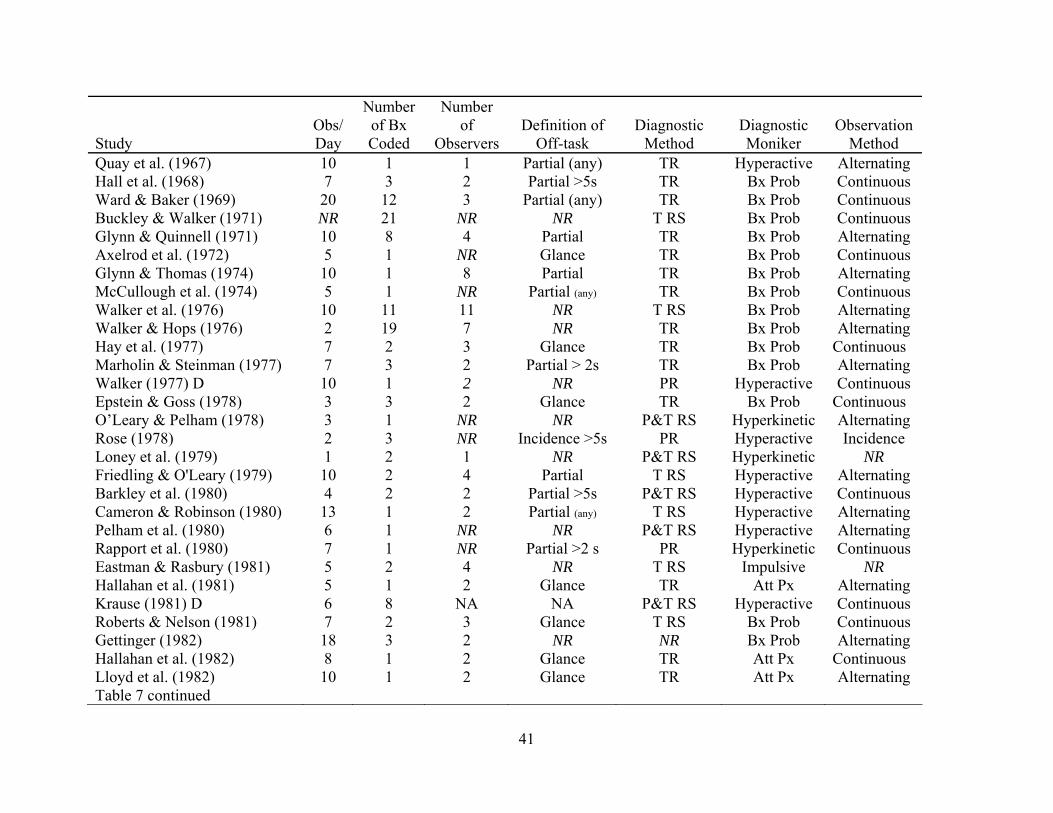
Study
Obs/Day
Number of Bx Coded
Number of
Observers Definition of
Off-task Diagnostic
Method Diagnostic Moniker
Observation Method
Quay et al. (1967) 10 1 1 Partial (any) TR Hyperactive AlternatingHall et al. (1968) 7 3 2 Partial >5s TR Bx Prob Continuous Ward & Baker (1969) 20 12 3 Partial (any) TR Bx Prob Continuous Buckley & Walker (1971) NR 21 NR NR T RS Bx Prob Continuous Glynn & Quinnell (1971) 10 8 4 Partial TR Bx Prob Alternating Axelrod et al. (1972) 5 1 NR Glance TR
Bx Prob ContinuousGlynn & Thomas (1974) 10 1 8 Partial TR Bx Prob Alternating McCullough et al. (1974) 5 1 NR Partial (any) TR Bx Prob ContinuousWalker et al. (1976) 10 11 11 NR T RS Bx Prob Alternating Walker & Hops (1976) 2 19 7 NR TR Bx Prob AlternatingHay et al. (1977) 7 2 3 Glance TR Bx Prob ContinuousMarholin & Steinman (1977) 7 3 2 Partial > 2s TR Bx Prob Alternating Walker (1977) D 10 1 2 NR PR Hyperactive ContinuousEpstein & Goss (1978) 3 3 2 Glance TR Bx Prob ContinuousO’Leary & Pelham (1978) 3 1 NR NR P&T RS Hyperkinetic Alternating Rose (1978) 2 3 NR Incidence >5s PR Hyperactive Incidence Loney et al. (1979) 1 2 1 NR P&T RS
Hyperkinetic NR
Friedling & O'Leary (1979) 10 2 4 Partial T RS Hyperactive AlternatingBarkley et al. (1980) 4 2 2 Partial >5s P&T RS Hyperactive ContinuousCameron & Robinson (1980) 13 1 2 Partial (any) T RS Hyperactive Alternating Pelham et al. (1980) 6 1 NR NR P&T RS Hyperactive Alternating Rapport et al. (1980) 7 1 NR Partial >2 s PR Hyperkinetic Continuous Eastman & Rasbury (1981) 5 2 4 NR T RS Impulsive
NR
Hallahan et al. (1981) 5 1 2 Glance TR Att Px AlternatingKrause (1981) D 6 8 NA NA P&T RS Hyperactive Continuous Roberts & Nelson (1981) 7 2 3 Glance T RS Bx Prob Continuous Gettinger (1982) 18 3 2 NR NR Bx Prob Alternating Hallahan et al. (1982) 8 1 2 Glance TR Att Px Continuous
Lloyd et al. (1982) 10 1 2 Glance TR Att Px AlternatingTable 7 continued
41
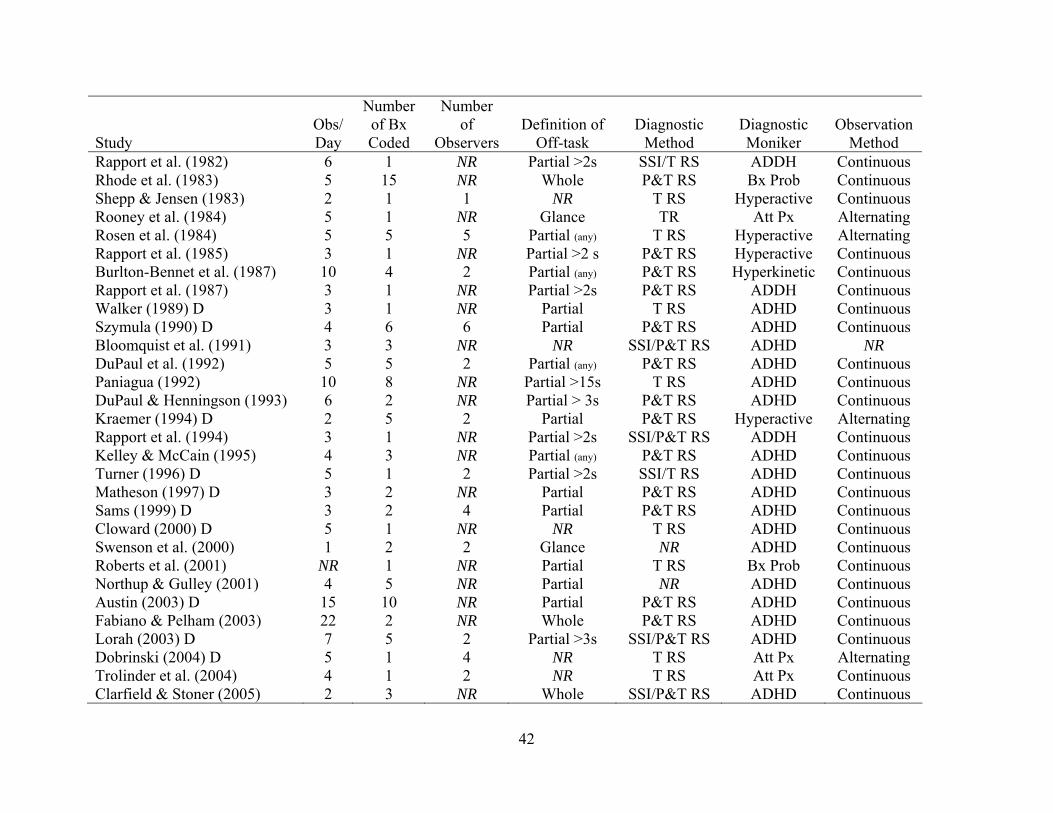
Study
Obs/Day
Number of Bx Coded
Number of
Observers Definition of
Off-task Diagnostic
Method Diagnostic Moniker
Observation Method
Rapport et al. (1982) 6 1 NR Partial >2s SSI/T RS ADDH Continuous Rhode et al. (1983) 5 15 NR Whole P&T RS Bx Prob Continuous Shepp & Jensen (1983) 2 1 1 NR T RS Hyperactive
Continuous
Rooney et al. (1984) 5 1 NR Glance TR
Att Px AlternatingRosen et al. (1984) 5 5 5 Partial (any) T RS Hyperactive Alternating Rapport et al. (1985) 3 1 NR Partial >2 s
P&T RS Hyperactive Continuous
Burlton-Bennet et al. (1987) 10 4 2 Partial (any) P&T RS Hyperkinetic Continuous Rapport et al. (1987) 3 1 NR Partial >2s P&T RS
ADDH Continuous
Walker (1989) D 3 1 NR Partial T RS ADHD ContinuousSzymula (1990) D 4 6 6 Partial P&T RS ADHD Continuous Bloomquist et al. (1991) 3 3 NR NR SSI/P&T RS ADHD NR DuPaul et al. (1992) 5 5 2 Partial (any) P&T RS ADHD Continuous Paniagua (1992) 10 8 NR Partial >15s T RS ADHD Continuous DuPaul & Henningson (1993) 6 2 NR Partial > 3s P&T RS ADHD Continuous Kraemer (1994) D 2 5 2 Partial P&T RS Hyperactive Alternating Rapport et al. (1994) 3 1 NR Partial >2s SSI/P&T RS ADDH Continuous Kelley & McCain (1995) 4 3 NR Partial (any) P&T RS ADHD Continuous Turner (1996) D 5 1 2 Partial >2s SSI/T RS
ADHD Continuous
Matheson (1997) D 3 2 NR Partial P&T RS ADHD ContinuousSams (1999) D 3 2 4 Partial P&T RS ADHD Continuous Cloward (2000) D 5 1 NR NR T RS ADHD Continuous Swenson et al. (2000) 1 2 2 Glance NR ADHD ContinuousRoberts et al. (2001) NR 1 NR Partial T RS Bx Prob Continuous Northup & Gulley (2001) 4 5 NR Partial NR ADHD ContinuousAustin (2003) D 15 10 NR Partial P&T RS ADHD ContinuousFabiano & Pelham (2003) 22 2 NR Whole P&T RS ADHD ContinuousLorah (2003) D 7 5 2 Partial >3s SSI/P&T RS ADHD Continuous Dobrinski (2004) D 5 1 4 NR T RS Att Px Alternating Trolinder et al. (2004) 4 1 2 NR T RS Att Px Continuous Clarfield & Stoner (2005) 2 3 NR Whole SSI/P&T RS ADHD Continuous
42

43
Notes. 1 Sample size reported as total number subjects whom met inclusion criteria for the current study and for whom data was
reported; 2 Mean and/or SD estimated from graph; A, Age; Bx Prob, Referred for behavioral problems/hyperactivity; C,
Classroom; Continuous, Observing one child exclusively for entire observation period; Definition of Off-task, Proportion of
interval needed to be coded off task; F, Females; G, Grade; Glance, Observers looked briefly at child and coded on/off-task for
that instant; M, Multiple informants; No of Bx Coded, Number of behaviors coded; NR, Not reported; Obs/Day, Number of
observation days; Observation Duration, Minutes of observation; Observation Interval, Seconds before recording; Observation
Method (Alternating, abab or similar method; P, Parent rating scale Only; PR, Pediatrician referral; RS, Rating scale(s); S, Sex;
SE, Special education classroom; SSI, Semi-structured interview; T, Teacher rating scale only; TR, Teacher Referral.

Normal Controls
62% 85%
ADHD Children
X +1 SD-1 SD
Average Percent On-task
Figure 1: Original metric differences between observed classroom attention of children with
ADHD and control children based on best case estimation after controlling for methodological
differences among studies.
44
CHAPTER FOUR: CONCLUSION
Direct observations of children with ADHD and their peers in classroom settings indicate
significant deficiencies in their ability to pay attention, and these differences are apparent
regardless of most methodological differences across studies. Children with ADHD were also
more variable in their attentive behavior, as indicated by significantly larger standard deviations
across studies for ADHD compared to control groups. The current meta-analysis quantified and
examined standardized effect size estimates of these differences, and found significant
heterogeneity across studies that could not be explained by study-level sampling error. A
weighted regression analysis of potential moderators determined that several factors, both
methodological and subject-specific, have significant effects on the observed levels of attentive
behavior in the classroom. Methodological differences, including sample characteristics,
diagnostic issues, and observational coding schema, accounted for a large percentage of between-
study variability such that no systematic variability remained across studies (adjusted R2 = .91).
An overall mean weighted effect size of 0.71 was found before considering the impact of
methodological variables. The significant heterogeneity among the 23 studies, however, suggests
that this mean may not be the best indicator of actual differences between children with ADHD
and control children. A best case estimation obtained by solving the significant moderator
regression equation using values corresponding to best practice suggests that the actual
standardized mean difference between the ability of children with and without ADHD to pay
attention in the classroom is likely closer to 1.40. Original metric analysis of this finding suggests
that across studies, typically developing children are off-task approximately 15% of observation
periods compared to 38% for children with ADHD. Stated differently, children with ADHD are
able to focus their attention in classroom settings approximately 62% of the time, compared with
45

an 85% on-task average for typically developing children. Power analysis based on Cohen’s
(1992) recommendations suggests that only four subjects per group are needed to detect an effect
of this magnitude.
Only two between-group studies failed to find significant differences in the classroom
attentive behavior of children with ADHD and typically developing children. Cunningham and
Siegel (1987), which approached significance at p =.052, utilized a design in which each ADHD
child was paired with a typically developing child, and these dyads worked together for the
duration of the study. The ADHD-Typically Developing child interaction may have contributed to
the failure to find a significant difference in attention between the groups. The finding of no
significant on-task differences in Shecket and Shecket (1976) may have been influenced by their
decision to code only one of 19 possible behaviors during each observation interval. For example,
a child coded as “Appropriate Talk with Teacher” would not have been coded as “Attending”
during that same interval, potentially decreasing substantially the base rate of the attending
category. It is unknown whether a re-analysis combining all codes consisting of on-task behavior
would have resulted in significant between-group differences. No studies reported children with
ADHD as being more attentive than control children.
Regression analysis revealed that sampling variables, diagnostic practices, and
observational methods influence obtained results and must be considered when designing or
implementing a direct observation system for children with ADHD and their peers. The impact of
these moderators is exemplified by the best case approximation: Subject matching, more rigorous
diagnostics, and longer observation of fewer behaviors were associated with an average effect
size of 1.40 (Note: the mean across studies without controlling for methodology was 0.71).
46
Single case design (SCD) studies generally corroborate the between-group findings,
although SCD studies were more likely than between-group studies to include children with
ADHD that were off-task more than half of observed intervals. This difference does not appear to
be clinically significant, however, and may be accounted for by several factors (Jacobson and
Truax, 1991). Based on area under the curve analysis, the larger off-task rates in the small-n SCD
studies can be predicted by the between-group distribution. The average between-group
distribution predicts that approximately six subjects per study will score beyond the SCD mean,
whereas on average only about 4 SCD subjects per study actually meet or exceed this value. No
significant differences were found between effect sizes predicted by the between-group regression
equation and obtained effect sizes for the six SCD studies with a typically developing comparison
group, although obtained off-task rates were generally higher than predicted. The study types
differed on three moderators found to significantly influence observed differences between the
off-task rates of children with ADHD and their peers. Two of these moderators, number of
behaviors coded and days of observations, were associated with larger effect sizes, whereas
observation method was associated with smaller effect sizes. Selection bias may have also
influenced the observed, though clinically insignificant, trend towards larger effect sizes for SCD
studies. Single case designs, like case studies, often target children with the most extreme
behavior problems for intervention. Publication bias may have also favored studies of children
whom are more frequently off-task, as small-n designs have lower power and require larger effect
sizes for statistical significance. No statistically significant difference in off-task rate, however,
was found between published (M = 53.73, SD = 16.63) and unpublished (M = 45.1, SD = 15.35)
SCD and between-group studies, t(18) = 1.71, p = .104, ns.
47

Matching subjects based on age, grade, and classroom at school were associated with
relatively lower effect size estimates. Subject matching is designed to control for myriad
extraneous variables including developmental level and the cognitive and situational demands
placed on children in academic settings (Tabachnick & Fidell, 2001). The present findings
corroborate this general trend and suggest that matching for relevant characteristics may be an
important consideration when conducting classroom observation research. The larger effect sizes
associated with natural classroom settings compared to simulation classrooms may be related to
the myriad uncontrolled situational factors present in the former (Rapport, Timko, Kofler, Sims,
& DuPaul, under review). Simulated classrooms tend to include highly trained (e.g., special
education) teachers, multiple adult staff members, smaller class sizes (i.e., low student-teacher
ratio), occur during irregular times of the year (i.e., summer), and frequently involve robust
behavior management systems and highly structured daily routines (e.g., Pelham et al., 2000;
Solanto et al., 2001).
Studies using increasingly more rigorous diagnostic criteria (for both number of
informants/settings and addition of comprehensive diagnostic interviews) were associated with
smaller overall effect sizes. This finding highlights the need for comprehensive diagnosis of
research subjects and suggests that screening measures such as rating scale cut-off scores may be
insufficient for assigning children to ADHD and control groups in research studies (Barkley et al.,
1990). No behavioral cluster is pathognomonic to ADHD without considering onset, course, and
duration of symptomatology, and systematically ruling out other possible causes or factors
associated with impaired functioning. Structured clinical interviews provide improved sensitivity
and specificity compared to rating scales, which typically assess a rater's perception of a limited,
recent period of time (e.g., last 6 months; McClellan & Werry, 2000; Rutter & Graham, 1968).
48
Systematic differences in obtained effect sizes were also dependent on the diagnostic moniker
assigned to the experimental group (i.e., hyperactive versus ADHD/ADDH). Earlier studies of
hyperactive children tended to report moderately larger effect sizes compared to newer studies
diagnosing children as ADHD/ADDH. This finding may reflect the change from a monothetic
(DSM-III-R) to a polythetic (DSM-III; DSM-IV Combined Type) categorical diagnostic scheme,
wherein children with other disorders were more likely to meet diagnostic criteria using the
former system (August & Garfinkel, 1993). Children with ADHD may be more variable in their
behavioral responses than children carrying other psychiatric diagnoses (e.g., Barkley, 1991).
Samples containing subgroups of relatively more homogeneous groups of children – for example,
children with anxiety or conduct problems – will have less variability and therefore larger effect
sizes, as variability is the denominator in effect size formulae. More recent studies using gold
standard assessment procedures and polythetic criteria may provide purer, and thus more variable,
samples of children with ADHD. Inclusion of non-ADHD children may result in decreased
group-level variability.
Observation code idiosyncrasies also influence observed differences between the ability of
children with ADHD and typically developing controls to remain attentive in the classroom.
Longer observation intervals and a greater number of observation days were associated with
larger effect sizes, whereas the duration a child must remain off-task before (s)he is coded as such
did not predict between-group differences. The high frequency of off-task behavior in children
with ADHD may be responsible for the failure of the latter to incrementally influence effect size.
These findings are consistent with some (Ary & Suen, 1983; Bramlett & Barnett, 1993), but not
all (Mehm & Knutson, 1987; Smith, Madsen, & Cipani, 1981) observational research with
children. None of the previous research, however, included samples of children with ADHD. Both
49

within-subject and between-group studies of ADHD and typically developing control children
consistently reveal that children with ADHD are more variable in their ability to remain on-task in
classroom and laboratory settings (Barkley, 1991). Longer observation intervals and a greater
number of days are more likely to provide a valid, more reliable sampling of classroom attention.
Scrutiny of within-subject experimental designs reveals that children with ADHD may exhibit 1-2
days of moderate to high on-task behavior followed by highly variable or low on-task days (e.g.,
Rapport et al., 1982). Heyman and colleagues (2001) provide a simple statistical method based on
split-half reliability for determining the total observation duration necessary based on the
frequency of behaviors of interest (see their Appendix, pp. 119-120). This method first calculates
current reliability and then provides a formula to determine the number of minutes the
observation needs to be increased/decreased to obtain a desired reliability. Adjusting the formula
will also allow the experimenter to calculate the affect of varying observation intervals on overall
reliability.
Studies alternating observations between ADHD and control children reported larger
differences in the classroom attentional processes of ADHD and control children compared to
studies observing one child per observation session. This difference may be related to the
frequency of behavior observed. The present review suggests that children with ADHD are off-
task approximately 38% of observation periods compared to 15% for control children. Available
research indicates that observed differences may be dependent on incident frequency and coding
scheme (Harris & Lahey, 1982; Haynes, 2001). Labeling a behavior as frequent or infrequent,
however, is not based on accepted, standardized criteria. The attentive behavior of children with
ADHD appears to be dissimilar from their peers in the classroom primarily during structured
academic tasks (Porrino et al., 1983). Children with ADHD show a significantly different pattern
50
of attentive behavior over time during structured academic tasks compared to their peers, with the
former showing more frequent shifts from on- to off-task and off- to on-task states (Rapport et al.,
2005). Alternating between children within an observation session, although allowing for
collection of temporally similar peer data, increases the probability of omitting these frequent
shifts during coding (Harris & Lahey, 1982).
The number of behaviors coded simultaneously was linearly and positively related to the
magnitude of attentional differences between ADHD and control children. Each behavior coded
requires the coder to recall a specific, operational definition (e.g., Abikoff, 1977). Most (Jones,
Reed, & Patterson, 1974; Mash & McElwee, 1974; Taplin & Reid, 1973), but not all (Frame,
1979) studies report an inverse relationship between the number of behaviors coded
simultaneously and recording accuracy. The failure of Frame (1979) to find this relationship may
be related to overall low agreement scores and lack of a criterion-referenced comparison (Harris
& Lahey, 1982). The use of written or computerized coding sheets may help reduce these
cognitive demands due to cuing and the ability to reference definitions (Abikoff et al., 1977).
Increasing the number of behaviors coded also requires the observer to attend to different features
of the child's behavior (e.g., watching the child's head/eyes, feet, and hands, listening to
words/vocalizations). An interaction with the defined coding interval is also likely, with a higher
number of behavioral codes requiring more observation time. For example, recording 13
behaviors during a 15-second interval may be more reliable than coding them every five seconds.
Several caveats are in order. The restricted age range of reviewed studies did not allow for
examination of differences between younger and older elementary school children. Attention,
cognition, and activity level show significant developmental trends based on extant literature
(DuPaul & Stoner, 2004) and the current finding of systematic differences in observed classroom
51

attention when matching for age. We were also unable to determine the influence of specific
academic task or differences during structured compared to unstructured classroom activities,
because most studies either observed children across several tasks or did not report this
information. Extant studies show significant variability in the on-task behavior of children with
ADHD due to differences in classroom variables (e.g., Barkley et al., 1980; Flynn & Rapoport,
1976; Jacob et al., 1978; Whalen et al., 1978; Zentall, 1980), some of which may be associated
with level of cognitive demand and/or working memory (Denney, Rapport, & Chung, 2005).
Girls with ADHD were underrepresented in available studies, which may have influenced
the failure to find a relationship between gender and observed differences in classroom attention.
Gender differences in behavioral and cognitive symptom prevalence are documented in most, but
not all studies of children referred for ADHD, with girls tending to exhibit more inattentive and
fewer hyperactive symptoms than their male counterparts (Abikoff et al., 2002; Biederman &
Faraone, 2004; Carlson et al., 1986; Graetz et al., 2005; Seidman et al., 2005; Weiss et al., 2003;
Yang et al., 2004). Interobserver agreement, a form of reliability, was not assessed because of
discrepancies in reported metrics (e.g., percent agreement, phi coefficient, r correlation, and
kappa were reported in 6, 8, 5, and 3 between-group studies, respectively, with one study not
reporting) and because all studies reported values above 0.8 for their metric.
The presence of comorbid diagnoses was not assessed in the current study. None of the
reviewed studies included comorbid diagnoses beyond LD, ODD, or CD. The presence of
comorbid disruptive behavior disorders has been found to predict increased symptoms of
aggression, interference (e.g., interrupting class, talking out of turn), and inattention in the large
MTA study (Abikoff et al., 2002). Comorbid anxiety disorders have been hypothesized to inhibit
impulsive/hyperactive behaviors in children with ADHD (Quay, 1997), however, no effects on
52

any directly observed behaviors were found in the large-scale MTA study (Abikoff et al., 2002;
Newcorn et al., 2001). Only Roberts (1990) included a psychiatric comparison group (aggressive
children), limiting our ability to conclude that inattentive symptoms are pathognomonic to
ADHD, and not merely a byproduct of general psychopathology.
We did not examine potential interaction effects among the moderator variables. For
example, coding interval may interact with the number of behaviors coded, such that longer
intervals mediate detrimental effects of attempting to simultaneously code multiple behaviors.
Weighted regression analysis in SPSS 12.0, however, requires simultaneous entry of dependent
variables, thus precluding traditional methods for testing interaction effects (Tabachnick & Fidell,
2001). It is statistically unlikely that the addition of interaction terms or other potential
moderators would provide incremental benefit, considering the large amount of variance
explained by the current model.
Results of the meta-analytic review indicate that direct observation studies of
comprehensively diagnosed ADHD and control children in natural classroom settings that match
subjects based on age and classroom, collect data over several days while limiting the number of
target behaviors, and observe subjects consecutively for longer intervals, are likely to obtain
results consistent with the best case estimation reported here. The coding schema, however,
depends on the data needed. Researchers may wish to use more codes for investigational
purposes, whereas clinicians seeking to supplement interview and rating scale data may be
interested in only a few select behaviors. In the former case, it is recommended that researchers
use videotaped observations, which allow multiple viewings and limit the number of behaviors
that must be coded at one time. It is noted, however, that the between-group studies analyzed here
53

used live observations, therefore the incremental validity of videotaped sessions was not directly
assessed.
Studies of children with ADHD reveal robust deficiencies in their ability to maintain
attention in the classroom. Classroom observations, however, record only output – the child’s
observable behavior – informing us only of the existence of an underlying problem, not its cause
or nature. Problems sustaining attention may be a core deficit of ADHD, as conceptualized in the
current DSM (APA, 2000), or they may be secondary to other, more primary deficits.
Deficits in behavioral inhibition may lead to problems with sustained attention (Barkley,
1997). An inability to suppress prepotent responses to stimuli has been argued repeatedly based
on laboratory experiments such as the Stop Signal task. However, a recent meta-analysis found
that such differences between children with ADHD and typically developing children could be
accounted for by differences in primary reaction time, with children with ADHD reacting slower
and more variably than their peers (Alderson, Rapport, Kofler, & Timko, under review).
Problems with one or more aspects of working memory may account for attentional
deficits seen in children with ADHD (see Rapport, Chung, Shore, & Isaacs, 2001 for a theoretical
overview). Preliminary evidence suggests robust deficiencies in the ability of children with
ADHD to recall short lists of phonological and short groups of visual-spatial stimuli for more than
a few seconds, compared to both typically developing peers and individuals with other psychiatric
diagnoses (Rapport, Timko, Kofler, & Alderson, 2005). Inattention and motor activity increase
linearly for all children as cognitive demands on working memory increase, although children
with ADHD exhibit a disproportional increase compared to both typically developing children
and children diagnosed with other psychiatric disorders (e.g., depression, anxiety). These rates of
change are similar across phonological and visual-spatial working memory tasks (Rapport et al.,
54
2005). Classroom studies suggest that children with ADHD are significantly more hyperactive
than their peers during in-seat classroom activities, but not during recess or other nonacademic
periods (e.g., Porrino et al., 1984). It is theoretically possible that children’s movement serves a
functional purpose such as maintaining or enhancing arousal to sustain attention and/or stimulate
working memory. Inchoate neurophysiological evidence supports this theory – areas of the
prefrontal cortex, but not the motor loop, are consistently implicated in fMRI studies of ADHD
(Castellanos, 2001; Diamond, 2000). Abnormalities in motor loop (i.e., basal ganglia and
associated areas) functioning would suggest that hyperactivity is ubiquitous in ADHD, however,
findings of primarily prefrontal abnormalities point to problems with arousal, working memory,
and the planning of behavior.
None of the reviewed studies examined the effect of time or attention by time interactions
in children with ADHD, with or without a typically developing comparison group. The failure to
examine time effects in classroom studies of attention severely limits our understanding
concerning possible underlying mechanisms and processes responsible for the attentional
difficulties associated with ADHD (e.g., whether they reflect a more general deficit in attentional
mechanisms or particular deficiencies in the ability to maintain attentional focus over time).
Specialty statistical processes, including growth mixture modeling and wavelet analyses, will
allow researchers to characterize both inter- and intra-individual changes in attention over time.
These analyses from the signal processing literature allow researchers to group participants based
on temporal patterns and analyze patterns in frequency and amplitude of behavior at the level of
the individual (Castellanos et al., 2005).
The current meta-analysis provides unequivocal evidence for the existence of classroom
attention deficits in children with ADHD. It also establishes the magnitude of these problems
55

compared to their peers, providing estimates of the classroom attentional capabilities of both
developmentally typical children and those diagnosed with ADHD. It is clear that children with
ADHD exhibit marked deficiencies in their classroom attentional ability, and the current study
provides substantial support for the inclusion of inattention as a core and pervasive symptom of
ADHD in the DSM-IV (APA, 2000) model. Currently, no single rating scale or diagnostic tool
possesses adequate positive and negative predictive power to accurately diagnose ADHD.
Inchoate research suggests that variables including seatwork completion/accuracy and verbally
intrusive behaviors may discriminate ADHD/non-ADHD children better than independent
observations of on-task behavior (see Pelham et al., 2005 for a review). It is unknown, however,
whether the use of the best case methods and standard differences in attention across all studies
presented here will allow improved diagnostic accuracy and predictive power.
56
LIST OF REFERENCES
Studies preceded by an asterisk were included in the between-groups meta-analysis
Studies preceded by a ^ were included in the SCD analyses
*Abikoff, H., & Gittelman, R. (1984). Does behavior therapy normalize the classroom
behavior of hyperactive children? Archives of General Psychiatry, 41, 449-454.
*Abikoff, H., & Gittelman, R. (1985). The normalizing effects of methylphenidate on the
classroom behavior of ADDH children. Journal of Abnormal Child Psychology, 13, 33-
44.
*Abikoff, H., Gittelman-Klein, R., & Klein, R. (1977). Validation of a classroom observation
code for hyperactive children. Journal of Counseling and Clinical Psychology, 45, 772-
783.
*Abikoff, H., Gittelman, R., & Klein, R. (1980). Classroom observation code for hyperactive
children: A replication of validity. Journal of Counseling and Clinical Psychology, 5, 555-
565.
*Abikoff, H.B., Jensen, P.S., Arnold, L.L., Hoza, B., Hechtmen, L., Pollack, S., et al. (2002).
Observed classroom behavior of children with ADHD: Relationship to gender and
comorbidity. Journal of Abnormal Child Psychology, 30, 349-359.
Achenbach, T. M., & Rescorla, L. A. (2001). Manual for the ASEBA School-Age
Forms & Profiles. Burlington, VT: University of Vermont Research Center for Children,
Youth, & Families.
Alderson, R.M., Rapport, M.D., Kofler, M.J., & Timko, T.M. (under review). Attention-
Deficit/Hyperactivity Disorder and Behavioral Inhibition: A Meta-Analytic Review of the
Stop-Signal Paradigm.
57

Ambady, N., & Rosenthal, R. (1992). Thin slices of expressive behavior as predictors of
interpersonal consequences: A meta-analysis. Psychological Bulletin, 111, 256-274.
American Psychiatric Association (1987). Diagnostic and Statistical Manual of Mental Disorders,
Third Edition, Revised (DSM-III-R). Washington, DC: American Psychiatric Association.
American Psychiatric Association (2000). Diagnostic and Statistical Manual of Mental Disorders,
Fourth Edition, Text Revision (DSM-IV-TR). Washington, DC: American Psychiatric
Association.
Ary, D., & Suen, H. K. (1983). The use of momentary time sampling to assess both frequency and
duration of behavior. Journal of Behavioral Assessment, 5, 143-150.
*Atkins, M. S., Pelham, W. E., & Licht, M. H. (1985). A comparison of objective measures and
teacher ratings of attention deficit disorder. Journal of Abnormal Child Psychology, 13,
155-167.
August, G. J., & Garfinkel, B. D. (1993). The nosology of attention-deficit hyperactivity disorder.
Journal of the American Academy of Child and Adolescent Psychiatry, 32, 155-165.
^Austin, H. M. (2003). Use of self-management techniques for the treatment of students
diagnosed with ADHD: An empirical investigation of the self-regulation of behavior.
Dissertation Abstracts International: Section B: The Sciences & Engineering, 64(6-B),
2904.
^Axelrod, S., Hall, R., & Maxwell, A. (1972). Use of peer attention to increase study behavior.
Behavior Therapy, 3, 349-351.
Barkley, R. A. (1990). Attention-deficit hyperactivity disorder: A handbook for diagnosis and
treatment. New York, NY, US: Guilford Press.
58
Barkley, R.A. (1991). The ecological validity of laboratory and analogue assessment methods of
ADHD symptoms. Journal of Abnormal Child Psychology, 19, 149-178.
^Barkley, R. A., Copeland, A. P., & Sivage, C. (1980). A self-control classroom for hyperactive
children. Journal of Autism and Developmental Disorders, 10, 75-89.
Barkley, R.A, DuPaul, G.J., & McMurray, M.B. (1990). Comprehensive evaluation of attention
deficit disorder with and without hyperactivity as defined by research criteria. Journal of
Consulting & Clinical Psychology, 58, 775-789.
Barton, E. J., & Ascione, F. R. (1984). Direct observation. In T. Ollendick & M. Hersen (Eds.),
Child behavioral assessment: Principles and procedures (pp. 166-194). New York:
Pergamon Press.
Bear, M. F., Connors, B. W., & Paradiso, M. A. (2001). Neuroscience: Exploring the brain (2nd
ed.). Maryland: Lippincott.
Beck, R. J., Kotkin, R. A., & Swanson, J. M. (1999). Stability of situational non-compliance in
ADHD children in two school classroom settings. Journal of Attention Disorders, 3, 5-12.
Begg, C. B., & Mazumdar, M. (1994). Operating characteristics of a bank correlation test for
publication bias. Biometrics, 50, 1088-1101.
Biederman, J., & Faraone, S. V. (2004). The Massachusetts General Hospital studies of gender
influences on attention-deficit/hyperactivity disorder in youths and relatives. Psychiatric
Clinics of North America, 27, 225-232.
Biederman, J., Keenen, K., & Faraone, S. (1990). Parent-based diagnosis of attention-deficit
disorder predicts a diagnosis based on teacher reports. Journal of the American Academy
of Child and Adolescent Psychiatry, 29, 698-701.
59

^Bloomquist, M. I., August, G. J., & Ostrander, R. (1991). Effects of school-based cognitive-
behavioral intervention for ADHD children. Journal of Abnormal Child Psychology, 19,
591-605.
Bogg, T., & Roberts, B. W. (2004). Conscientiousness and health-related behaviors: A meta-
analysis of the leading behavioral contributors to mortality. Psychological Bulletin, 130,
887-919.
*Book, R. M., & Skeen, J. A. (1987). Behavioral observations of disruptive behaviors with
referred and nonreferred elementary school children. Psychology in the Schools, 24, 399-
405.
Bramlett, R. K., & Barnett, D. W. (1993). The development of a direct observation code for use in
preschool settings. School Psychology Review, 22, 49-62.
^Buckley, N. K., & Walker, H. M. (1971). Free operant teacher attention to deviant child behavior
after treatment in a special class. Psychology in the Schools, 8, 275-284.
^Burlton-Bennet, J. A., & Robinson, V. (1987). A single subject evaluation of the K-P diet for
hyperkinesis. Journal of Learning Disabilities, 20, 331-335, 346.
^Cameron, M. I., & Robinson, V. M. J. (1980). Effects of cognitive training on academic and on-
task behavior of hyperactive children. Journal of Abnormal Child Psychology, 8, 405-419.
*Campbell, S. B., Schleifer, M., & Weiss, G. (1978). Continuities in maternal reports and child
behaviors over time in hyperactive and comparison groups. Journal of Abnormal Child
Psychology, 6, 33-45.
Carlson, C. L., Lahey, B. B., & Neeper, R. (1986). Direct assessment of the cognitive correlates of
attention deficit disorders with and without hyperactivity. Journal of Psychopathology and
Behavioral Assessment, 8, 69-86.
60
Castellanos, F.X. (2001). Neuroimaging studies of ADHD. In: M.V. Solanto & A.F.T. Arnsten
(Eds.), Stimulant drugs and ADHD: Basic and clinical neuroscience (pp. 243-258).
London: Oxford University Press.
Castellanos, F. X., Sonuga-Barke, E. J., Scheres, A., Di Martino, A., Hyde, C., & Walters, J. R.
(2005). Varieties of attention-deficit/hyperactivity disorder-related intra-individual
variability. Biological Psychiatry, 57, 1416-1423.
Chung, K. M., Rapport, M. D., & Denney, C. B. (2005, June). Vigilance and ADHD: A meta-
analytic review. Paper presented at the annual meeting of the International Society for
Research in Child and Adolescent Psychopathology, New York.
^Clarfield, J., & Stoner, G. (2005). Research Brief: The Effects of Computerized Reading
Instruction on the Academic Performance of Students Identified with ADHD. School
Psychology Review, 34, 246-254.
Cloward, R. D. (2002). Self-monitoring increases time-on-task of Attention Deficit Hyperactivity
disordered students in the regular classroom. Dissertation Abstracts International Section
A: Humanities & Social Sciences, 64(5-A), 1524.
Cohen, J. (1992). A power primer. Psychological Bulletin, 112, 155-159.
Cohen, J. (1977). Statistical power analysis for the behavioral sciences (revised edition).
New York: Academic Press.
Cohen, N. J., Sullivan, J., Minde, K., Novak, C., & Helwig, C. (1981). Evaluation of the relative
effectiveness of methylphenidate and cognitive behavior modification in the treatment of
kindergarten-aged hyperactive children. Journal of Abnormal Child Psychology, 9, 43-54.
61
Connell, A. M., & Goodman, S. H. (2002). The association between psychopathology in fathers
versus mothers and children's internalizing and externalizing behavior problems: A meta-
analysis. Psychological Bulletin, 128, 746-773.
Conners, C.K., Parker, J.D.A., Sitarenios, G., & Epstein, J.N. (1998). The Revised Conners'
Parent Rating Scale (CPRS-R): Factor structure, reliability, and criterion validity. Journal
of Abnormal Child Psychology, 26, 257-268.
*Cunningham, C.E., & Siegel, L.S. (1987). Peer interactions of normal and attention-deficit-
disordered boys during free-play, cooperative task, and simulated classroom situations.
Journal of Abnormal Child Psychology, 15, 247-268.
Denney, C. B., Rapport, M. D., & Chung, K. M. (2005). Interactions of task and subject variables
among continuous performance tests. Journal of Child Psychology and Psychiatry, 46,
420-435.
Diamond, A. (2000). Close interrelation of motor development and cognitive development and
of the cerebellum and prefrontal cortex. Child Development, 71, 44-56.
^Dobrinski, D. E. (2004). The effects of behavior-specific praise used as a delayed directive on
the on-task behavior of elementary students. Dissertations Abstracts International, 65,
1247.
Doll, B., & Elliott, S. N. (1994). Representativeness of observed preschool social behaviors: How
many data are enough? Journal of Early Intervention, 18, 227-238.
Dorsey, B. L., Nelson, R. O., & Hayes, S. (1986). The effects of code complexity and of
behavioral frequency on observer accuracy and interobserver agreement. Behavioral
Assessment, 8, 349-363.
62
Douglas, V. I. (1988). Cognitive deficits in children with Attention Deficit Disorder with
Hyperactivity. In L.M. Bloomingdale and J. Sergeant (Eds.), Attention Deficit Disorder:
Criteria, Cognition, Intervention (pp. 65-82). Pergamon Press: New York.
Douglas, V.I., & Parry, P.A, (1983). Effects of reward on delayed reaction time task performance
of hyperactive children. Journal of Abnormal Child Psychology, 11, 313-326.
*DuPaul, G.J., Ervin, R.A., Hook, C.L., & McGoey, K. E. (1998). Peer tutoring for children with
attention deficit hyperactivity disorder: Effects on classroom behavior and academic
performance. Journal of Applied Behavior Analysis, 31, 579-595.
^DuPaul, G. J., Guevremont, D. C., & Barkley, R. A. (1992). Behavioral treatment of attention-
deficit hyperactivity disorder in the classroom: The use of the attention training system.
Behavior Modification, Vol 16(2), 204-225.
^DuPaul, G. J. & Henningson, P. (1993). Peer tutoring effects on the classroom performance of
children with attention deficit hyperactivity disorder. School Psychology Review, 22, 134-
143.
*DuPaul, G. J., & Rapport, M. D. (1993). Does methylphenidate normalize the classroom
performance of children with attention deficit disorder? Journal of the American Academy
of Child and Adolescent Psychiatry, 32, 190-198.
DuPaul, G.J., & Stoner, G.D. (2004). ADHD in the schools: Assessment and intervention
strategies (2nd ed.). Guilford Press: New York.
^Eastman, B. G., & Rasbury, W. C. (1981). Cognitive self-instruction for the control of impulsive
classroom behavior. Ensuring the treatment package. Journal of Abnormal Child
Psychology, 9, 381-387.
63
^Epstein, R. & Goss, C. (1978). A self-control precedure for the maintenance of nondisruptive
behavior in an elementary school child. Behavior Therapy, 9, 109-117.
^Fabiano, G, A., & Pelham, W. E. (2003). Improving the effectiveness of behavioral classroom
interventions for attention-deficit/hyperactivity disorder: A case study. Journal of
Emotional & Behavioral Disorders, 11, 124-130.
Faul, F. & Erdfelder, E. (1992). GPOWER: A priori, post-hoc, and compromise power analyses
for MS-DOS [computer programme]. Bonn, FRG: Bonn University, Dep. of Psychology.
Flynn, N. M., & Rapoport, J. L. (1976). Hyperactivity in open and traditional classroom
environments. Journal of Special Education, 10, 285-290.
*Forness, S.R., & Esveldt, K.C. (1975). Classroom observation of children with learning and
behavioral problems. Journal of Learning Disabilities, 8, 382-385.
Frame, R. (1979). Inter-observer agreement as a function of the number of behaviors recorded
simultaneously. The Psychological Record, 29, 287-296.
^Friedling, C. & O'Leary, S. G. (1979). Effects of self-instructional training on second and third
grade hyperactive children: A failure to replicate. Journal of Applied Behavior Analysis,
12, 211-219.
Fergusson, D. M., & Horwood, L. J. (1995). Early disruptive behavior, IQ, and later school
achievement and delinquent behavior. Journal of Abnormal Child Psychology, 23, 183-
199.
Garfinkel, B. D., & Amrami, K. K. (1992). A perspective on the attention-deficit disorders.
Hospital and Community Psychiatry, 43, 445-448.
Gertz, B., Stilson, D. W., & Gynther, M. D. (1959). Reliability of the HAS as a function of length
of observation and level of adjustment. Journal of Clinical Psychology, 15, 36-39.
64
^Gettinger, M. (1982). Improving classroom behaviors and achievement of learning disabled
children using direct instruction. School Psychology Review, 11, 329-336.
^Glynn, E. L., & Thomas, J. D. (1974). Effect of cueing on self-control of classroom behavior.
Journal of Applied Behavior Analysis, 7, 299-306.
^Glynn, E. L., & Quinnell, J. Y. (1971). Modification of non-task behaviour in the classroom
through contingent teacher remarks. New Zealand Journal of Educational Studies, 6, 137-
150.
Graetz, B. W., Sawyer, M. G., & Baghurst, P. (2005). Gender differences among children with
DSM-IV ADHD in Australia. Journal of the American Academy of Child & Adolescent
Psychiatry, 44, 159-168.
^Hall, R. V., Lund, D., & Jackson, D. (1968). Effects of teacher attention on study behavior.
Journal of Applied Behavior Analysis, 1, 1-12.
^Hallahan, D. P., Lloyd, J. W., & Kneedler, R. D. (1982). A comparison of the effects of self-
versus teacher-assessment of on-task behavior. Behavior Therapy, 13, 715-723.
^Hallahan, D. P., Marshall, K. J., & Lloyd, J. W. (1981). Self-recording during group instruction:
Effects on attention to task. Learning Disability Quarterly, 4, 407-413.
Harris, F. C., & Lahey, B. B. (1982). Recording system bias in direct observational methodology:
A review and critical analysis of factors causing inaccurate coding behavior. Clinical
Psychology Review, 2, 539-556.
^Hay, W. M., Rudin Hay, L., & Nelson, R. O. (1977). Direct and collateral changes in on-task and
academic behavior resulting from on-task versus academic contingencies. Behavior
Therapy, 8, 431-441.
65
Haynes, S. N. (2001). Clinical applications of analogue behavioral observation: Dimensions of
psychometric evaluation. Psychological Assessment, 13, 73-85.
Hedges, L. (1982). Estimation of effect sizes from a series of independent experiments.
Psychological Bulletin, 92. 490-499.
Heyman, R. E., Chaudhry, B. R., Treboux, D., Crowell, J., Lord, C., Vivian, D., & Waters, E. B.
(2001). How much observational data is enough? An empirical test using marital
interaction coding. Behavior Therapy, 32, 107-122.
Hodges, K. (1993). Structured interviews for assessing children. Journal of Child Psychology and
Psychiatry, 34, 49-68.
Holmbeck, G. N. (1997). Toward terminological, conceptual, and statistical clarity in the study of
mediators and moderators: Examples from the child-clinical and pediatric literatures.
Journal of Consulting and Clinical Psychology, 65, 599-610.
Howard, G. S., Maxwell, S. E., & Fleming, K. J. (2000). The proof of the pudding: An illustration
of the relative strengths of null hypothesis, meta-analysis, and Bayesian analysis.
Psychological Methods, 5, 315-332.
*Jacob, R. G., O’Leary, K.D., & Rosenblad, C. (1978). Formal and informal classroom settings:
Effects on hyperactivity. Journal of Abnormal Child Psychology, 6, 47-59.
Jacobson, N. S., & Truax, P. (1991). Clinical significance: A statistical approach to defining
meaningful change in psychotherapy research. Journal of Consulting and Clinical
Psychology, 59, 12-19.
Jones, R. R., Reed, J. B., & Patterson, G. R. (1974). Naturalistic observations in clinical
assessment. In P. McReynolds (Ed.), Advances in psychological assessment (3rd ed.). San
Francisco: Jossey-Bass.
66

Kazdin, A.E. (1997). Research design in clinical psychology (3rd ed.). Needham Heights: Allyn
& Bacon.
^Kelley, M. L., & McCain, A. P. (1995). Promoting academic performance in inattentive
children: The relative efficacy of school-home notes with and without response cost.
Behavior Modification, 19, 357-375.
Kent, R. N., O'Leary, K. D., Diament, C., & Dietz, A. (1974). Expectation biases in observational
evaluation of therapeutic change. Journal of Consulting and Clinical Psychology, 42, 774-
780.
*Klein, A.R., & Young, R.D. (1979). Hyperactive boys in their classroom: Assessment of teacher
and peer perceptions, interactions, and classroom behaviors. Journal of Abnormal Child
Psychology, 7, 425-442.
^Kraemer, E. S. (1994). Effectiveness of a home-school note procedure for increasing appropriate
classroom behaviors exhibited by children diagnosed with attention-deficit hyperactivity
disorder. Dissertation Abstracts International Section A: Humanities & Social Sciences,
55(11-A), 3454.
^Krause, L. A. (1981). The treatment of hyperactivity: A comparison of behavioral and drug
therapy. Dissertation Abstracts International, 42(7-A), 3107.
*Lauth, G. W., & Mackowiak, K. (2004). Diagnostik Unterrichtsverhalten von kindern mit
aufmerksamkeitsdefizit-/hyperaktivitätsstörungen [Classroom behavior among children
with attention-deficit/hyperactivity disorder]. Kindheit und Entwicklung, 13, 158-166.
Lavigne, J. V., & Faier-Routman, J. (1992). Psychological adjustment to pediatric disorders: A
meta-analytic review. Journal of Pediatric Psychology, 17, 133-157.
67
Leaper, C., Anderson, K. J., & Sanders, P. (1998). Moderators of gender effects on parents' talk to
their children: A meta-analysis. Developmental Psychology, 34, 3-27.
Lipsey, M. W., & Wilson, D. B. (2001). Practical Meta-Analysis. California: Sage.
^Lloyd, J. W., Hallahan, D. P., Kosiewicz, M. M., & Kneedler, R. D. (1982). Reactive effects of
self-assessment and self-recording on attention to task and academic productivity.
Learning Disability Quarterly, 5(3), 216-227.
^Loney, J., Weissenburger, F. E., Woolson, R. F., & Lichty, E. C. (1979). Comparing
psychological and pharmacological treatments for hyperkinetic boys and their classmates.
Journal of Abnormal Child Psychology, 7, 133-143.
^Lorah, K. S. (2003). Effects of peer tutoring on the reading performance and classroom behavior
of students with Attention Deficit Hyperactivity Disorder. Dissertation Abstracts
International Section A: Humanities & Social Sciences, 64(4-A), 1208.
Lorber, M. F. (2004). Psychophysiology of aggression, psychopathy, and conduct problems: A
meta-analysis. Psychological Bulletin, 130, 531-552.
Losier, B. J., McGrath, P. J., & Klein, R. M. (1996). Error patterns on the continuous performance
test in non-medicated and medicated samples of children with and without ADHD: A
meta-analytic review. Journal of Child Psychology & Psychiatry, 37, 971-987.
Luk, S. (1985). Direct observation studies of hyperactive behavior. Journal of the American
Academy of Child Psychiatry, 24, 338-344.
^Marholin, D., & Steinman, W. M. (1977). Stimulus control in the classroom as a function of the
behavior reinforced. Journal of Applied Behavior Analysis, 10, 465-478.
68
Markman, H. J., & Notarius, C. I. (1987). Coding marital and family interaction: Current status.
In T. Jacobs (Ed.), Family Interaction and Psychopathology: Theories, Methods, and
Findings (pp. 329-390). Plenum Press: New York.
Mash, E. J., & McElwee, J. D. (1974). Situational effects on observer accuracy: Behavior
predictability, prior experience, and complexity of coding categories. Child Development,
45, 367-377.
^Matheson, C. (1997). The effects of classwide peer tutoring on the academic achievement and
classroom deportment of children with attention deficit hyperactivity disorder.
Dissertation Abstracts International Section A: Humanities & Social Sciences, 58(7-A),
2533.
McClellan, J. M., & Werry, J. S. (2000). Research psychiatric diagnostic interviews for children
and adolescents. Journal of the American Academy of Child and Adolescent Psychiatry,
39, 19-27.
^McCullough, J., Cornell, J., McDaniel, M., & Mueller, R. (1974). Utilization of the simultaneous
treatment design to improve student behavior in a first grade classroom. Journal of
Consulting and Clinical Psychology, 42, 288-292.
McGrath, A. M., Handwerk, M. L., Armstrong, K. J., Lucas, C. P., & Friman, P. C. (2004). The
validity of the ADHD section of the Diagnostic Interview Schedule for Children. Behavior
Modification, 28, 349-374.
McKevitt, B. C., & Elliott, S. N. (2005). Observations and ratings of preschool children's social
behavior: Issues of representativeness and validity. Psychology in the Schools, 42, 13-26.
69

Mehm, J. G., & Knutson, J. F. (1987). A comparison of event and interval strategies for
observational data analysis and assessments of observer agreement. Behavioral
Assessment, 9, 151-167.
Mezulis, A. H., Abramson, L. Y., Hyde, J. S., & Hankin, B. L. (2004). Is there a universal
positivity bias in attributions? A meta-analytic review of individual, developmental, and
cultural differences in the self-serving attributional bias. Psychological Bulletin, 130, 711-
747.
Mottron, L. (2004). Matching strategies in cognitive research with individuals with high-
functioning autism: Current practices, instrument biases, and recommendations. Journal of
Autism and Developmental Disorders, 34, 19-27.
Newcorn, J. H., Halperin, J. M., Arnold, L. E., Abikoff, H. B., Arnold, E. L., Cantwell, D. P., et
al. (2001). Symptom profiles in children with ADHD: Effects of comorbidity and gender.
Journal of the American Academy of Child and Adolescent Psychiatry, 40, 137-146.
*Nolan, E.E., & Gadow, K.D. (1997). Children with ADHD and Tic Disorder and their
classmates: Behavioral normalization with Methylphenidate. Journal of the American
Academy of Child and Adolescent Psychiatry, 36, 597-604.
^Northup, J. & Gulley, V. (2001). Some contributions of functional analysis to the assessment of
behaviors associated with attention deficit hyperactivity disorder and the effects of
stimulant medication. School Psychology Review, 30(2), 227-238.
^O'Leary, S. G., & Pelham, W. E., Jr. (1978). Behavior therapy and withdrawal of stimulant
medication in hyperactive children. Pediatrics, 61, 211-216.
^Paniagua, F. A. (1992). Verbal-nonverbal correspondence training with ADHD children.
Behavior Modification, 16, 226-252.
70
Pelham, W. E., Fabiano, G. A., & Massetti, G. M. (2005). Evidence-based assessment of attnetion
deficit hyperactivity disorder in children and adolescents. Journal of Clinical Child and
Adolescent Psychology, 34, 449-476.
Pelham, W. E., Gnagy, E. M., Greiner, A. R., Hoza, B., Hinshaw, S. P., Swanson, J. M., et al.
(2000). Behavioral versus behavioral and pharmacological treatment in ADHD children
attending a summer treatment program. Journal of Abnormal Child Psychology, 28, 507-
525.
^Pelham, W. E., Schnedler, R. W., Bologna, N. C., & Contreras, J. A. (1980). Behavioral and
stimulant treatment of hyperactive children: A therapy study with methylphenidate probes
in a within-subject design. Journal of Applied Behavior Analysis, 13, 221-236.
Pelham, W.E., Milich, R., & Walker. J.L. (1986). Effects of continuous and partial reinforcement
and methylphenidate on learning in children with attention deficit disorder. Journal of
Abnormal Psychology, 95, 319-325.
Pelham, W. E., Wheeler, T., & Chronis, A. (1998). Empirically supported psychosocial treatments
for attention deficit hyperactivity disorder. Journal of Clinical Child Psychology, 27, 190-
205.
Platzman, K. A., Stoy, M. R., Brown, R. T., Coles, C. D., Smith, I. E., & Falek, A. (1992). A
review of observational methods in attention deficit hyperactivity disorder (ADHD):
Implications for diagnosis. Psychology Quarterly, 7, 155-177.
Porrino, L. J., Rapoport, J. L., Behar, D., Sceery, W., Ismond, D. R., & Bunney Jr., W. E. (1983).
A naturalistic assessment of the motor activity of hyperactive boys: I. Comparison with
normal controls. Archives of General Psychiatry, 40, 681-687.
71

Power, T.J. (1992). Contextual factors in vigilance testing of children with ADHD. Journal of
Abnormal Child Psychology, 20, 579-593.
Quay, H. C. (1997). Inhibition and attention deficit hyperactivity disorder. Journal of Child
Psychology, 25, 7-13.
^Quay, H. C., Sprague, R. L., Werry, J. S., & McQueen, M. M. (1967). Conditioning visual
orientation of conduct problem children in the classroom. Journal of Experimental Child
Psychology, 5, 512-517.
Rapport, M.D., Chung, K.M., Shore, G., Denney, C.B., & Issacs, P. (2000). Upgrading the
science and technology of assessment and diagnosis: Laboratory and clinic-based
assessment of children with ADHD. Journal of Clinical Child Psychology, 29, 555-568.
^Rapport, M. D., Denney, C. B., DuPaul, G. J., & Gardner, M. J. (1994). Attention deficit
disorder and methylphenidate: Normalization rates, clinical effectiveness, and response
prediction in 76 children. Journal of the American Academy of Child and Adolescent
Psychiatry, 33, 882-893.
^Rapport, M. D., Jones, J. T., DuPaul, G. J., Kelly, K. L., Gardner, M. J., Tucker, S. B., & Shea,
M. S. (1987). Attention deficit disorder and methylphenidate: Group and single-subject
analyses of dose effects on attention in clinic and classroom settings. Journal of Clinical
Child Psychology, 16, 329-338.
^Rapport, M. D., Murphy, A., & Bailey, J. S. (1982). Ritalin vs. response cost in the control of
hyperactive children: A within-subject comparison. Journal of Applied Behavior Analysis,
15, 205-216.
^Rapport, M. D., Murphy, A., & Bailey, J. S. (1980). The effects of a response cost treatment
tactic on hyperactive children. Journal of School Psychology, 1, 98-111.
72
Rapport, M. D., Scanlan, S. W., & Denney, C. B. (1999). Attention-deficit/hyperactivity disorder
and scholastic achievement: A model of dual developmental pathways. Journal of Child
Psychology and Psychiatry, 40, 1169-1183.
^Rapport, M. D., Stoner, G., DuPaul, G. J., Birmingham, B. K., & Tucker, S. (1985).
Methylphenidate in hyperactive children: Differential effects of dose on academic,
learning, and social behavior. Journal of Abnormal Child Psychology, 13, 227-243.
Rapport, M.D., Timko, T.M., Kofler, M.J., & Alderson, R. M. (2005, August). Hyperactivity: A
core deficit or byproduct of working memory deficiency? In M.D. Rapport (Chair),
Attentional Processes in ADHD: Findings from Laboratory and Field Investigations.
Symposium conducted at the American Psychological Association Annual Conference.
Washington, DC.
Rapport, M. D., Timko Jr., T., Kofler, M. J., Sims, V., & DuPaul, G. J. (under review). Attention
processes in ADHD: Observations from the classroom.
^Rhode, G., Morgan, D., & Young, K. (1983). Generalization and maintenance of treatment gains
of behaviorally handicapped students from resource rooms to regular classrooms using
self-evaluation procedures. Journal of Applied Behavior Analysis, 16, 171-188.
*Roberts, M.A. (1990). A behavioral observation method for differentiating hyperactive and
aggressive boys. Journal of Abnormal Child Psychology, 18, 131-142.
^Roberts, M. L., Marshall, J., & Nelson, J. R. (2001). Curriculum-based assessment procedures
embedded within functional behavioral assessments: Identifying escape-motivated
behaviors in a general education classroom. School Psychology Review, 30(2), 264-277.
^Roberts, R. N., & Nelson, R. O. (1981). The effects of self-monitoring on children's classroom
behavior. Child Behavior Therapy, 3, 105-120.
73
^Rooney, K., Hallahan, D. P., & Lloyd, J. W. (1984). Self-recording of attention by learning
disabled students in the regular classroom. Journal of Learning Disabilities, 17, 360-364.
^Rose, T. (1978). The functional relationship between artificial food colors and hyperactivity.
Journal of Applied Behavior Analysis, 11, 439-446.
^Rosen, L. A., O'Leary, S. G., Joyce, S. A., Conway, G., & Pfiffner, L. J. (1984). The importance
of prudent negative consequences for maintaining the appropriate behavior of hyperactive
students. Journal of Abnormal Child Psychology, 12, 581-604.
Rosenthal, R. (1995). Writing meta-analytic reviews. Psychological Bulletin, 118, 183-192.
Rosenthal, R. (1991). Meta-analytic procedures for social research. Thousand Oaks, CA: Sage.
Rowley, G. (1978). The relationship of reliability in classroom research to the amount of
observation: An extension of the Spearman-Brown formula. Journal of Educational
Measurement, 15, 165-180.
Rutter, M., & Graham, P. (1968). The reliability and validity of the psychiatric assessment of the
child: II. Interview with the parent. British Journal of Psychiatry, 114, 581-592.
Sahni, R., Schulze, K. F., & Stefanski, M. (1995). Methodological issues in coding sleep states in
immature infants. Developmental Psychology, 28, 85-101.
^Sams, S. E. (1999). The effects of functional intervention on the behavior of four students
labeled ADHD. Dissertation Abstracts International Section A: Humanities & Social
Sciences, Vol 60(4-A), 1081.
Schachar, R., Sandberg, S., & Rutter, M. (1986). Agreement between teachers' ratings and
observations of hyperactivity, inattentiveness, and defiance. Journal of Abnormal Child
Psychology, 14, 331-345.
74
Schatz, A.M., Ballantyne, A. O., & Trauner, D. A. (2001). Sensitivity and specificity of a
computerized test of attention in the diagnosis of ADHD. Assessment, 8, 357-365.
Seidman, L. J., Biederman, J., & Monuteaux, M. C. (2005). Impact of gender and age on
executive functioning: Do girls and boys with and without attention deficit hyperactivity
disorder differ neuropsychologically in preteen and teenage years? Developmental
Neuropsychology, 27, 79-105.
Sergerstrom, S. C., & Miller, G. E. (2004). Psychological stress and the human immune system: A
meta-analytic study of 30 years of inquiry. Psychological Bulletin, 130, 601-630.
Shaffer, D., Fisher, P., Lucas, C. P., Dulcan, M. K., & Schwab-Stone, M. E. (2000). NIMH
Diagnostic Interview Schedule for Children Version IV (NIMH DISC-IV): Description,
differences from previous versions, and reliability of some common diagnoses. Journal of
the American Academy of Child and Adolescent Psychiatry, 39, 28-38.
*Shecket, S. M., & Shecket, W. C. (1976). Behaviors of children referred by classroom teachers
as hyperactive. Washington State University (ERIC Document Reproduction Service No.
ED 129-440).
^Shepp, M. S., & Jensen, B. F. (1983). A comparison of the treatment effects of an operant
strategy, a cognitive strategy, and a combined approach with a hyperactive boy. School
Psychology Review, 12, 199-204.
*Skansgaard, E.P., & Burns, G.L. (1998). Comparison of DSM-IV ADHD combined and
predominantly inattention types: Correspondence between teacher ratings and direct
observations of inattentive, hyperactivity/impulsivity, slow cognitive tempo, oppositional
defiant, and overt conduct disorder symptoms. Child and Family Behavior Therapy, 20, 1-
14.
75
Sleator, E. K., & Ullmann, R. K. (1981). Can the physician diagnose hyperactivity in the office?
Pediatrics, 67, 13-17.
Smith, J. B., Madsen, C. H., & Cipani, E. C. (1981). The effects of observational session on
length, method of recording, and frequency of teacher behavior on reliability and accuracy
of observational data. Behavior Therapy, 12, 565-569.
*Solanto, M. V., Abikoff, H., Sonuga-Barke, E., Schachar, R., Logan, G. D., Wigal, T.,
Hechtman, L., Hinshaw, S., & Turkel, E. (2001). The ecological validity of delay aversion
and response inhibition as measures of impulsivity in AD/HD: A supplement to the NIMH
multimodal treatment study of AD/HD. Journal of Abnormal Child Psychology, 29, 215-
228.
^Swenson, N., Lolich, E., & Williams, R. L. (2000). The effects of structured free-time on request
compliance and on-task behavior of a preadolescent with ADHD. Child & Family
Behavior Therapy, Vol 22, 51-59.
^Szymula, G. J. (1990). The effects of parent administered self-instructional training with ADHD
children. Dissertations Abstracts International, 52(2), 1085. (University Microfilms No.
9105335)
Tabachnick, B. G., & Fidell, L. S. (2001). Using Multivariate Statistics (4th ed.). Needham
Heights, MA: Allyn & Bacon.
Taplin, P. S., & Reid, J. B. (1973). Effects of instructional set and experimenter influence on
behavior reliability. Child Development, 44, 547-554.
^Trolinder, D. M., Choi, H., & Proctor, T. B. (2004). Use of delayed praise as a directive and its
effectiveness on on-task behavior. Journal of Applied School Psychology, 20, 61-83.
76
^Turner, B. L. (1996). Effects of response cost, bibliotherapy and academic tutoring on attentional
behavior, achievement, work productivity, accuracy, and self-esteem in children with
Attention Deficit Hyperactivity Disorder. Dissertation Abstracts International Section A:
Humanities & Social Sciences, 57(5-A), 1973.
van Ijzendoorn, M. H., & Bus, A. G. (1994). Meta-analytic confirmation of the nonword reading
deficit in developmental dyslexia. Reading Research Quarterly, 29, 266-275.
^Walker, B. C. (1977). The relative effects of painting and gross-motor activities on the intrinsic
locus-of-control of hyperactivity in learning disabled elementary school pupils.
Dissertation Abstracts International, 38, 4743.
^Walker, C. J. (1990). Self-modeling and stress inoculation training in attention-deficit
hyperactivity disorder children. Dissertation Abstracts International, 51, 2638B.
(University Microfilms No. 9026685).
^Walker, H. M., & Hops, H. (1976). Use of normative peer data as a standard for evaluating
classroom treatment effects. Journal of Applied Behavior Analysis, 9, 159-168.
^Walker, H. M., Hops, H., & Fiegenbaum, E. (1976). Deviant classroom behavior as a function of
combinations of social and token reinforcement and cost contingency. Behavior Therapy,
7, 76-88.
^Ward, M. & Baker, B. (1968). Reinforcement therapy in the classroom. Journal of Applied
Behavior Analysis, 1, 323-328.
*Werry, J.S., & Quay, H.C. (1969). Observing the classroom behavior of elementary school
children. Exceptional Children, 35, 461-470.
Weiss, M. D., Worling, D. E., & Wasdell, M. B. (2003). A chart review of the inattentive and
combined types of ADHD. Journal of Attention Disorders, 7, 1-9.
77
Whalen, C.K., Collins, B.E., Henker, B., Alkus, S.R., Adams, D., & Stapp, J. (1978). Behavior
observations of hyperactive children and methylphenidate (Ritalin) effects in
systematically structured classroom environments: Now you see them, now you don’t.
Journal of Pediatric Psychology, 3, 177-187.
Yang, P., Jong, Y., & Chung, L. (2004). Gender differences in a clinic referred sample of
Taiwanese attention-deficit/hyperactivity disorder children. Psychiatry & Clinical
Neurosciences, 58, 619-623.
*Zentall, S.S. (1980). Behavioral comparisons of hyperactive and normally active children in
natural settings. Journal of Abnormal Child Psychology, 8, 93-109.
Zentall, S.S., & Meyer, M.J. (1987). Self-regulation of stimulation for ADD-H children during
reading and vigilance task performance. Journal of Abnormal Child Psychology, 15, 519-
536.
78