Classification of Data from Icelandic Financial Statements
52
CLASSIFICATION OF DATA FROM ICELANDIC FINANCIAL STATEMENTS May 2014 Carsten Petersen, Róbert Gunnarsson, Sigurrós Soffía Kristinsdóttir Bachelor of Science in Computer Science
Transcript of Classification of Data from Icelandic Financial Statements

CLASSIFICATION OF DATA FROMICELANDIC FINANCIAL
STATEMENTS
May 2014Carsten Petersen, Róbert Gunnarsson, Sigurrós
Soffía KristinsdóttirBachelor of Science in Computer Science


CLASSIFICATION OF DATA FROMICELANDIC FINANCIAL STATEMENTS
Carsten Petersen, Róbert Gunnarsson, Sigurrós Soffía Kristinsdóttir
Bachelor of Science
Computer Science
May 2014
School of Computer Science
Reykjavík University
B.Sc. PROJECT REPORT


Classification of Data from Icelandic Financial Statements
by
Carsten Petersen, Róbert Gunnarsson, Sigurrós Soffía Kristinsdóttir
Project report submitted to the School of Computer Scienceat Reykjavík University in partial fulfillment of
the requirements for the degree ofBachelor of Science in Computer Science
May 2014
Project Report Committee:
Hlynur Sigurþórsson, Supervisor
Stefán Freyr StefánssonExaminer

CopyrightCarsten Petersen, Róbert Gunnarsson, Sigurrós Soffía Kristinsdóttir
May 2014

Classification of Data from Icelandic Financial Statements
Carsten Petersen, Róbert Gunnarsson, Sigurrós Soffía Kristinsdóttir
May 2014
Abstract
Financial reports tell the financial story of a company, it is valuable informa-tion for anyone who might be interested in investing in these companies. InIceland these reports are only available in PDF format and they only followa loosely defined structure. Kóði is a company that would like to be able toextract and work with the data contained in these reports. In this report welook at the feasibility of using machine learning techniques to extract andclassify data from Icelandic financial reports.

iv

v
Acknowledgements
We would like to thank our advisor Hlynur Sigurþórsson for all the assistance with IceNLPand LATEX, his positive disposition and helping us see that 70, 000 slides is sometimes toomuch. We would also like to thank Kóði for this challenging project and of course thegreat accommodations, candy and beer.

vi

vii
Contents
List of Figures ix
List of Tables x
1 Introduction 1
2 Financial Statements 3
3 Machine Learning 53.1 Supervised Learning . . . . . . . . . . . . . . . . . . . . . . . . . . . . 53.2 WEKA . . . . . . . . . . . . . . . . . . . . . . . . . . . . . . . . . . . 73.3 Algorithms . . . . . . . . . . . . . . . . . . . . . . . . . . . . . . . . . 7
4 Data 94.1 Data Classes . . . . . . . . . . . . . . . . . . . . . . . . . . . . . . . . . 104.2 Attributes . . . . . . . . . . . . . . . . . . . . . . . . . . . . . . . . . . 104.3 Text Analysis . . . . . . . . . . . . . . . . . . . . . . . . . . . . . . . . 11
4.3.1 Balance Sheet . . . . . . . . . . . . . . . . . . . . . . . . . . . . 114.3.2 Income Statement . . . . . . . . . . . . . . . . . . . . . . . . . . 114.3.3 Cash Flow Statement . . . . . . . . . . . . . . . . . . . . . . . . 11
4.4 Attribute Reduction . . . . . . . . . . . . . . . . . . . . . . . . . . . . . 114.5 Simplification of Attributes . . . . . . . . . . . . . . . . . . . . . . . . . 124.6 IceNLP . . . . . . . . . . . . . . . . . . . . . . . . . . . . . . . . . . . 12
5 Methodology 17
6 Results 19
7 Conclusion 277.1 Limitations . . . . . . . . . . . . . . . . . . . . . . . . . . . . . . . . . 28

viii
8 Appendix 29
ix
List of Figures
4.1 Attribute evaluation. . . . . . . . . . . . . . . . . . . . . . . . . . . . . 144.2 Reduction of values in nominal attributes. . . . . . . . . . . . . . . . . . 15
6.1 Results from Random Forest and J48 using different attribute sets. . . . . 236.2 The size of the decision trees produced by the J48 algorithm using differ-
ent attribute sets. . . . . . . . . . . . . . . . . . . . . . . . . . . . . . . 246.3 Comparison of the different type of classifiers that were trained using the
stemmed attribute set with reduced attributes. . . . . . . . . . . . . . . . 256.4 Confusion matrices for the Random Forest classifiers showing the true
positive rate for each classifier. . . . . . . . . . . . . . . . . . . . . . . . 26

x
xi
List of Tables
6.1 Balance Sheet: Evaluation on Test Set for J48 . . . . . . . . . . . . . . . 206.2 Income Statement: Evaluation on Test Set for J48 . . . . . . . . . . . . . 206.3 Cash Flow: Evaluation on Test Set for J48 . . . . . . . . . . . . . . . . . 206.4 Balance Sheet: Evaluation on Test Set for J48 with AdaBoost . . . . . . . 206.5 Income Statement: Evaluation on Test Set for J48 with AdaBoost . . . . . 216.6 Cash Flow: Evaluation on Test Set for J48 with AdaBoost . . . . . . . . . 216.7 Balance Sheet: Evaluation on Test Set for Random Forest . . . . . . . . . 216.8 Income Statement: Evaluation on Test Set for Random Forest . . . . . . . 216.9 Cash Flow: Evaluation on Test Set for Random Forest . . . . . . . . . . . 226.10 Balance Sheet: Evaluation on Test Set for Random Forest with AdaBoost 226.11 Income Statement: Evaluation on Test Set for Random Forest with Ad-
aBoost . . . . . . . . . . . . . . . . . . . . . . . . . . . . . . . . . . . . 226.12 Cash Flow: Evaluation on Test Set for Random Forest with AdaBoost . . 22
8.1 Balance Sheet - Classes . . . . . . . . . . . . . . . . . . . . . . . . . . . 298.2 Income Statement - Classes . . . . . . . . . . . . . . . . . . . . . . . . . 308.3 Cash Flow - Classes . . . . . . . . . . . . . . . . . . . . . . . . . . . . . 308.4 Attributes . . . . . . . . . . . . . . . . . . . . . . . . . . . . . . . . . . 318.5 Balance Sheet - 10 Most Used Words . . . . . . . . . . . . . . . . . . . 328.6 Cash Flow - 10 Most Used Words . . . . . . . . . . . . . . . . . . . . . 328.7 Income Statement - 10 Most Used Words . . . . . . . . . . . . . . . . . 32

xii

1
Chapter 1
Introduction
This report describes the final project “Classification of Data from Icelandic FinancialReports”, this project was conducted in the spring of 2014 as a BSc final in the school ofComputer Science at Reykjavík University. The project was conducted in collaborationwith Kóði ehf 1 and revolves around extracting key data from financial reports in order topresent them online.
Every year companies have to prepare a financial report in the form of a PDF file forthe RSK2 (Directorate of Internal Revenue), from there anyone can access these reports.The information in financial reports should give a good representation of a company’sstanding, making them a valuable asset in assessing said company. For this reason finan-cial companies and investors would like to be able to access this data in a format otherthan PDF, some format where they can look only at key numbers either for comparisonbetween companies or for evaluating a company’s standing over a span of years. Theproblem with this is that financial statements follow only a loosely defined format, whichmeans that they are not easily computer readable.
There are some solutions to this, one is XBRL (eXtensible Business Reporting Language)which is used by the U.S. Federal Deposit Insurance Corporation [3] as well as elsewhereabroad, but as of today the financial reports available to the public here in Iceland arenot in this format. Another solution would be data entry, hire a person to type the datainto a database, but that is expensive and time consuming. Brute force coding wouldperhaps work, but it presents some problems such as the code would have to be updatedconstantly due to changes in the reports, the code would have to be able to deduce whatdata is what from non-standardized text labels since the text used is entirely dependent on
1 http://kodi.com2 https://www.rsk.is/

2 Classification of Data from Icelandic Financial Statements
the accountant who writes the report. Another way is to write code that can learn fromthe data and make inferences based on past reports, or machine learning.
In this project we decided to see if machine learning was a feasible option for extractingthis data. We started out with about 1.000 financial reports which were supplied by Kóðiand we used predefined well known machine learning algorithms. We expected to be ableto extract at least 70% of the data from the three main statements in the reports. Ourresults showed that we could extract about 90% of the data making machine learning areal option when it comes to reading and extracting data from financial statements.
This report is structured as follows in Section 2, we briefly describe Icelandic financialstatement. In Section 3 we will briefly explain machine learning and WEKA the tool weused to classify our data set. In Section 4 we talk about our data and preprocessing. InSection 5 we talk about our methods. In Section 6 we go through our results. In Section7 we discuss our conclusion and limitations.

3
Chapter 2
Financial Statements
A financial statement or financial report is a formal record of financial activities of a busi-ness, an individual, or organizations over a specific accounting period. The accountingperiod can apply to any time span such as the end of the year, quarter, or month. Financialstatements for businesses usually include: income statement, balance sheet and cash flowstatement.
The income statement is divided into two parts. First, the operating and second, the non-operating sections. The items in the operating section are information about revenues(what the business has earned over a period e.g. sales revenue, dividend income etc.)and expenses (the cost incurred by the business over a period e.g. salaries and wages,depreciation, rental charges, etc.) that are based on regular business operations. The non-operating items are not directly tied to business operating activities. It also shows thenet profit or loss arrived by deducting expenses from income over a specific accountingperiod.
The balance sheet is divided into three elements: assets, liabilities and equity at a specificpoint in time. Assets include things like cash, inventory, plant and machinery, somethingthat business owns or controls. Assets are either current or fixed. Current assets are assetsthat will be consumed within one year. Fixed assets are those assets that are expectedto keep providing benefit for more than a year. Liabilities include things like creditors,bank loans or something a business owes to someone. Current liabilities are debts payablewithin one year, while long-term liabilities are debts payable over a longer period. Equityis what the business owes to its owners. This corresponds to the amount of capital thatremains in the business after its assets are used to pay off its outstanding liabilities. Equitytherefore represents the difference between the assets and liabilities. The balance sheet
4 Classification of Data from Icelandic Financial Statements
must follow the formula in (2.1).
Assets = Liabilities + Shareholders’ Equity (2.1)
The cash flow statement shows a listing of the cash inflow and outflow of the business. Thecash movements can be broken down into three segments: Operating activities, Investingactivities and Financing activities. Operating activities are the cash a business brings infrom ongoing, regular business activities, such as manufacturing and selling goods orproviding services. Investing activities are the cash flow from the purchase and sale ofassets other than inventories. Financing activities are the cash flow generated or spenton raising and repaying share capital and debt together with the payments of interest anddividends.

5
Chapter 3
Machine Learning
Due to variety in the financial statements we decided to try using machine learning tech-niques to extract the key numbers present in the statements. Machine learning algorithmswork by finding patterns in data and to making predictions based on those patterns.
A system that makes use of machine learning should be able to learn the structure of thesestatements making it so that the system designers do not have to foresee and providesolutions for all possible future situations. A machine learning algorithm creates a modelusing training data. This model can then be used to make predictions in the future and gainknowledge from the data. Machine learning is closely related to the theory of statistics,the core task being to make an inference from a sample [1]. The task of computer sciencein machine learning is twofold: First, in training, we need efficient algorithms to solvethe optimization problem, as well as to store and process the massive amount of data wehave. Second, once a model is learned, its representation and algorithmic solution forinference needs to be efficient as well [1]. Machine learning can be divided into a fewdifferent categories depending on the type of learning, in our project we used supervisedlearning.
3.1 Supervised Learning
Supervised learners take in the input and desired output and learn the mapping from theinput to the output. The resulting model can then be used again for some unseen input andthe model will output which class it believes the data belongs to. The input attributes aresomething we decided on, we also had to decide on the possible classes that the data couldbe mapped to. One of the most important factors in creating a model is the attributes used.

6 Classification of Data from Icelandic Financial Statements
If you have many independent attributes that each correlate well with the class, learning iseasy. On the other hand, if the class is a very complex function of the attributes, you maynot be able to learn it. Often, the raw data is not in a form that is amenable to learning,but you can construct attributes from it that are. This is typically where most of the effortin a machine learning project goes [2]. In our project slight changes in the attributes hada great effect on both the accuracy and the complexity of the learned model regardless ofthe algorithm we used.
Things that we had to be aware of when we were creating our classifiers were over fittingand noise. Noise is any unwanted anomaly in the data [1], as a result the class may be dif-ficult to learn. In our data noise could have been caused by human error such as instancesincorrectly classified, error in the extraction of the attributes from the PDF’s (missing dig-its, random spaces in words etc.), attributes that we did not take into account that affectsour data. Over fitting is when the data we have is not sufficient to completely determinethe correct classifier, it is one of the most common problems in machine learning [2]. Asan example this would be when the learned model is 100% correct on the training dataand only 50% correct on the test data, when in fact it could have been 75% accurate onboth. In our case we tried to avoid over fitting our data by earmarking the financial reportsas either testing or training. This way data from inside one financial statement could notbe present in both the training and the test sets. All our results are based on the test setsas they contain data that the model has not previously seen and should give us the mostaccurate results given our data.
After over fitting the biggest problem in machine learning is the curse of dimensionality.We, however, were only able to extract up to 15 different attributes so that was not a bigconcern for us. We did run an attribute evaluation algorithm on our data to try to removeattributes that were insignificant or even detrimental when trying to determine the correctclass.
There are three main limiting resources in supervised learning, time, memory and train-ing data [2]. The biggest bottleneck in our project was time, it took us a lot of time togo through and classify all of our data. We were in the end not able to go through allthe financial statements we had and had to stop manually classifying due to time restric-tions.

Carsten Petersen, Róbert Gunnarsson, Sigurrós Soffía Kristinsdóttir 7
3.2 WEKA
In our project we used WEKA (Waikato environment for knowledge analysis) to createour classifiers. WEKA is an open-source Java application produced by the University ofWaikato in New Zealand. WEKA has a collection of over 100 algorithms for classifica-tion, 75 for data pre-processing and 25 to assist with attribute selection [4]. There is aninterface that can be run directly on the dataset or the WEKA library which can be usedin Java code. For our purposes we used the WEKA interface to connect with the Postgresdatabase at Kóði and saved our datasets into Attribute-Relation File Format (ARFF) files,which are the files read by WEKA, in case we needed to run them again. Then we ran thechosen algorithms on our training and test sets through the interface.
3.3 Algorithms
The algorithms we chose to test on our datasets were the J48 decision tree and RandomForest. We also tried boosting them using AdaBoost.
One of the simplest models for classification are decision trees. A decision tree is com-posed of internal decision nodes and terminal nodes. Each decision node implements atest function with discrete outcomes labeling the branches. Given an input, at each node,a test is applied and one of its branches is taken depending on the outcome. The processstarts at the root and is repeated recursively until a leaf node is hit, at which point thevalue written in the leaf constitutes the output or the class [1]. The WEKA algorithm weused to create our decision tree is called J48 and is a slightly modified version of the C45algorithm [6]. We used the J48 algorithm with pruning. This means that the algorithmgrows a decision tree and then cuts of parts from the bottom of the tree, this is done toavoid over fitting.
Random Forest is closely related to decision trees, it is an ensemble algorithm that worksby constructing a multitude of decision trees [9]. Random Forest operates by outputtingthe class that is most often output by the individual decision trees.
AdaBoost is also a form of an ensemble algorithm. It combines a series of learned classi-fiers, in our case J48 or Random Forest, with the aim of creating an improved compositeclassifier. In AdaBoost, weights are assigned to each training sample. A series of clas-sifiers is learned. After one classifier is learned, the weights are updated to allow thesubsequent classifier to pay more attention to the misclassification error of the previous
8 Classification of Data from Icelandic Financial Statements
classifier. The final boosted classifier then combines the votes of each individual classifier,where the initial weight of each classifiers vote is a function of its accuracy [5].

9
Chapter 4
Data
One of the problems we had to solve was how to transform our raw data into a formatwhich we could then feed into our algorithm and classify. First we had to decide whatit was that we needed to classify and group that data into classes that could be learned.Once that was done we needed to find descriptive attributes for those classes.
Our data is in the form of PDF files, some were text files and others were scanned. Thesehad been generated using different software so extracting the relevant information wastricky. In our project we decided to omit any scanned files and only concentrate on textfiles in Icelandic. We tried a few different libraries which extract text from PDF’s andin the end we decided on iTextSharp, which seemed to give us the most consistent re-sults.
First we needed to extract the data from the front page of the report. The front page is notreally a part of the financial report, it is generated by RSK and contains such informationas the company id number, name, year of report, list of managers, list of accountants,list of subsidiaries, and a list of shareholders. Getting this data was relatively easy sinceit was standardized and in the same format for all the reports. We wrote code that readthrough the front page, extracted the data and saved it to the database.
Second we needed to extract each type of statement from the report. In most cases therewas a heading stating the name of the statement which would could use to identify thetype of statement. This was not always the case so we generated some keywords welooked for as well as looking for the location of the statements in the table of contents.This allowed us to almost always extract the right statements form the report. There werehowever exceptions, in very few instances we could not extract the desired statement oreven got the wrong one, but this was an exception.

10 Classification of Data from Icelandic Financial Statements
4.1 Data Classes
Before we could start extracting any information from each individual statement weneeded to decide on what it was we wanted to extract. We only cared about the keynumbers, these were numbers that should be present in most statements. Our classes rep-resent these key numbers, however these are not the only data we extracted so we created“sub” classifiers to group together any numbers that were broken down further. Otherclassifiers we had, in order to separate the key numbers from unimportant data was, date,note and other. The other approach would have been to try to find these in the files andnot create instances for them, but we believe we would face similar problems doing thatas if we tried to use the brute force technique to extract the key numbers, which is whywe want our classification model to be able to separate these from the important data forus.
Our chosen classifiers can be seen in the appendix, balance sheet in Table (8.1) cash flowin Table (8.3) and the income statement in Table (8.2)
4.2 Attributes
Once the text from the required statements was saved into the database we were able tostart extracting data from them. We extracted this data in the form of attributes. We wereunsure of what attributes would be necessary so our approach was to extract as manyattributes as we could think of. It would be easier to omit any unnecessary attributes thanit would have been to go back and extract new ones. We extracted the same attributesfrom each type of statement.
We extracted all the attributes and saved each instance as a record in our database, in threedifferent tables, one per statement type. Once all our data was saved into the databasewe manually went through all our records and assigned them one of our predeterminedclasses.
Our chosen attributes can be seen in the appendix in Table (8.4)
This then became our ‘raw dataset’.

Carsten Petersen, Róbert Gunnarsson, Sigurrós Soffía Kristinsdóttir 11
4.3 Text Analysis
Since we are working with documents that contain a lot of text we decided to do sometext analysis on them in order to better understand our data.
4.3.1 Balance Sheet
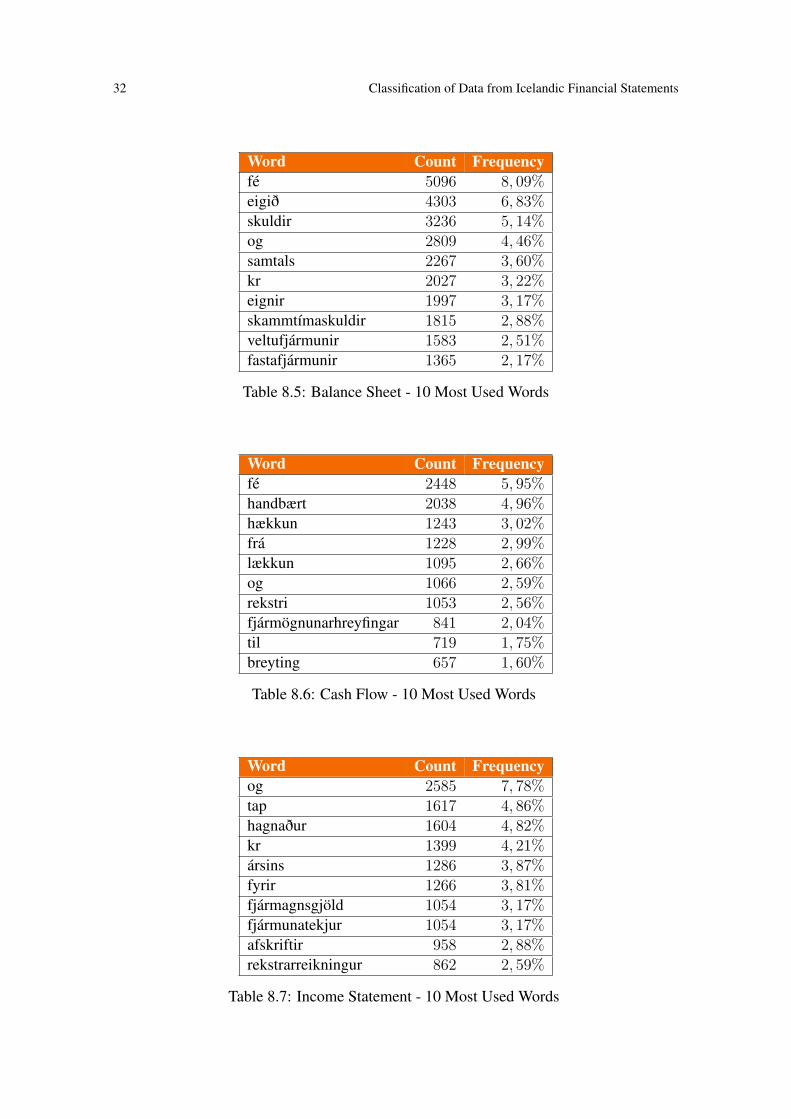
In total we had 959 balance sheets in Icelandic. When we counted the number of wordsthat appear in all those sheets we got 62.937 words or 65, 7 words per statement on aver-age. Out of those words there were 1.376 distinct words, or 2, 19%. Following is a list ofthe top ten words that appear in the balance sheet.
4.3.2 Income Statement
In total we had 900 income statements in Icelandic. When we counted the number ofwords that appear in all those sheets we got 33.241 words or 37 words per statement onaverage. Out of those words there were 1.181 distinct words, or 3, 55%. Following is alist of the top ten words that appear in the income statements.
4.3.3 Cash Flow Statement
In total we had 718 cash flow statements in Icelandic. When we counted the number ofwords that appear in all those sheets we got 41.130 words or 42 words per statement onaverage. Out of those words there were 981 distinct words, or about 2, 39%. Following isa list of the top ten words that appear in the cash flow statements.
Notice that the balance sheet and the cash flow have a similar percentage of distinct wordswhereas the income statement has a higher percentage of distinct words.
4.4 Attribute Reduction
In order to try to get better results we tried to reduce our attributes. We evaluated theattributes using WEKA with the GainRatioAttributeEval algorithm which evaluates theworth of an attribute by measuring the gain ratio with respect to the class.
12 Classification of Data from Icelandic Financial Statements
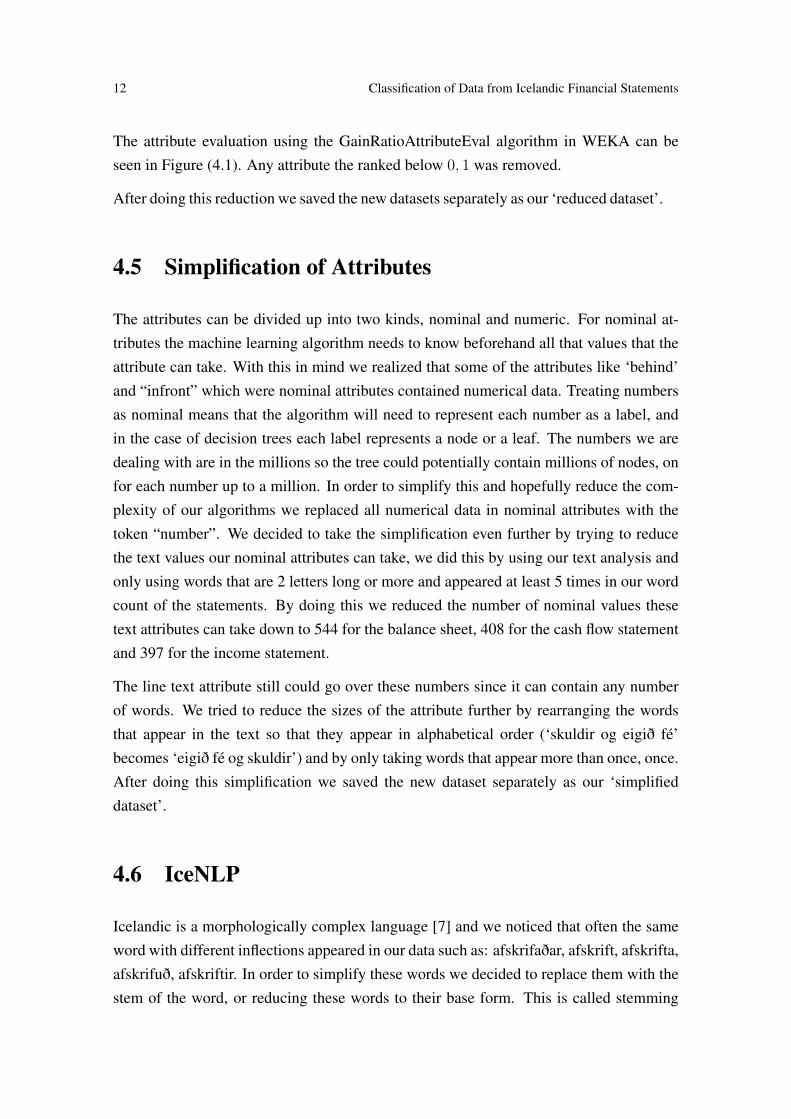
The attribute evaluation using the GainRatioAttributeEval algorithm in WEKA can beseen in Figure (4.1). Any attribute the ranked below 0, 1 was removed.
After doing this reduction we saved the new datasets separately as our ‘reduced dataset’.
4.5 Simplification of Attributes
The attributes can be divided up into two kinds, nominal and numeric. For nominal at-tributes the machine learning algorithm needs to know beforehand all that values that theattribute can take. With this in mind we realized that some of the attributes like ‘behind’and “infront” which were nominal attributes contained numerical data. Treating numbersas nominal means that the algorithm will need to represent each number as a label, andin the case of decision trees each label represents a node or a leaf. The numbers we aredealing with are in the millions so the tree could potentially contain millions of nodes, onfor each number up to a million. In order to simplify this and hopefully reduce the com-plexity of our algorithms we replaced all numerical data in nominal attributes with thetoken “number”. We decided to take the simplification even further by trying to reducethe text values our nominal attributes can take, we did this by using our text analysis andonly using words that are 2 letters long or more and appeared at least 5 times in our wordcount of the statements. By doing this we reduced the number of nominal values thesetext attributes can take down to 544 for the balance sheet, 408 for the cash flow statementand 397 for the income statement.
The line text attribute still could go over these numbers since it can contain any numberof words. We tried to reduce the sizes of the attribute further by rearranging the wordsthat appear in the text so that they appear in alphabetical order (‘skuldir og eigið fé’becomes ‘eigið fé og skuldir’) and by only taking words that appear more than once, once.After doing this simplification we saved the new dataset separately as our ‘simplifieddataset’.
4.6 IceNLP
Icelandic is a morphologically complex language [7] and we noticed that often the sameword with different inflections appeared in our data such as: afskrifaðar, afskrift, afskrifta,afskrifuð, afskriftir. In order to simplify these words we decided to replace them with thestem of the word, or reducing these words to their base form. This is called stemming

Carsten Petersen, Róbert Gunnarsson, Sigurrós Soffía Kristinsdóttir 13
and is a part of natural language processing. For this we used IceNLP1 which is an opensource Natural Language Processing (NLP) toolkit for analyzing and processing Icelandictext. The toolkit is implemented in Java. After stemming the nominal attributes we savedthe new dataset as our ‘Stemmed dataset’.
The reduction of possible distinct values for the nominal attributes after our simplificationprocess can be seen in figures Figure (4.2)
1 http://icenlp.sourceforge.net/

14 Classification of Data from Icelandic Financial Statements
(a) Balance Sheet
(b) Income Statement
(c) Cash Flow
Figure 4.1: Attribute evaluation.

Carsten Petersen, Róbert Gunnarsson, Sigurrós Soffía Kristinsdóttir 15
(a) Balance Sheet
(b) Income Statement
(c) Cash Flow
Figure 4.2: Reduction of values in nominal attributes.

16

17
Chapter 5
Methodology
In order to create our classification models we needed to upload our dataset of attributesand classes into WEKA in the form of ARFF files.
We split all of our datasets into training and test and saved them in ARFF format. Wehad already earmarked about 68% of our financial reports as training and the rest as test,these were chosen at random. All the data that was taken from each financial report wententirely into the training set or the test set.
We had to manually go over and classify all the instances we extracted from our dataand out of the 1000 financial reports we had, we were able to classify 256 balancesheets, 175 cash flow statements and 220 income statement, the limiting factor beingman hours.
The training and test sets were split was as follows
• Balance sheet: 175 for training and 81 for testing
• Income statement: 150 for training and 70 for testing
• Cash flow: 137 for training and 63 for testing
We trained classifiers using four different sets of attributes so we had to save trainingand test sets for each version of attributes, for each type of statement. Our four versionsof attributes were the raw attributes as we extracted them straight from the PDF’s, rawattributes with a reduced attribute set, simplified attributes with all the attributes, simpli-fied attributes with a reduced attribute set and the simplified stemmed attributes with thereduced set.
Once we had all of our ARFF files we loaded our training sets into WEKA and trainedclassifiers using the J48 algorithm and Random Forest. We tested the classifiers with our

18 Classification of Data from Icelandic Financial Statements
test sets and recorded the results from each attribute set which can be seen in the resultsection of this paper. We also trained classifiers using AdaBoost on Random Forest andJ48 on just the stemmed attribute set. The setting we changed on the J48 algorithm wasthe confidence factor, we set it to 0, 35 which means there is slightly less pruning than thedefault 0, 25. In the Random Forest we only changed the number of trees used, we used25 since increasing it further did not seem to improve the results. We then recorded theresults that we got when we ran the resulting classifiers on our reserved test sets.
We used the same random seed, mainly the value 1, for all the models so the results couldbe easily reproduced with the same datasets.

19
Chapter 6
Results
The summary of our results using the stemmed and simplified dataset with the reducedattributes can be seen in Table (6.1), Table (6.2), Table (6.3), Table (6.4), Table (6.5), Table (6.6) , Table (6.7), Table (6.8), Table (6.9), Table (6.10), Table (6.11) and Ta-ble (6.12).
In Figure (6.1) we can see the evolution of the J48 and Random Forest classifiers as theattributes are changed. Starting with the raw dataset using all the attributes, then theraw dataset with the reduced attributes, the simplified dataset with all the attributes, thesimplified dataset with the reduced attributes and finally the stemmed, simplified datasetwith the reduced attributes.
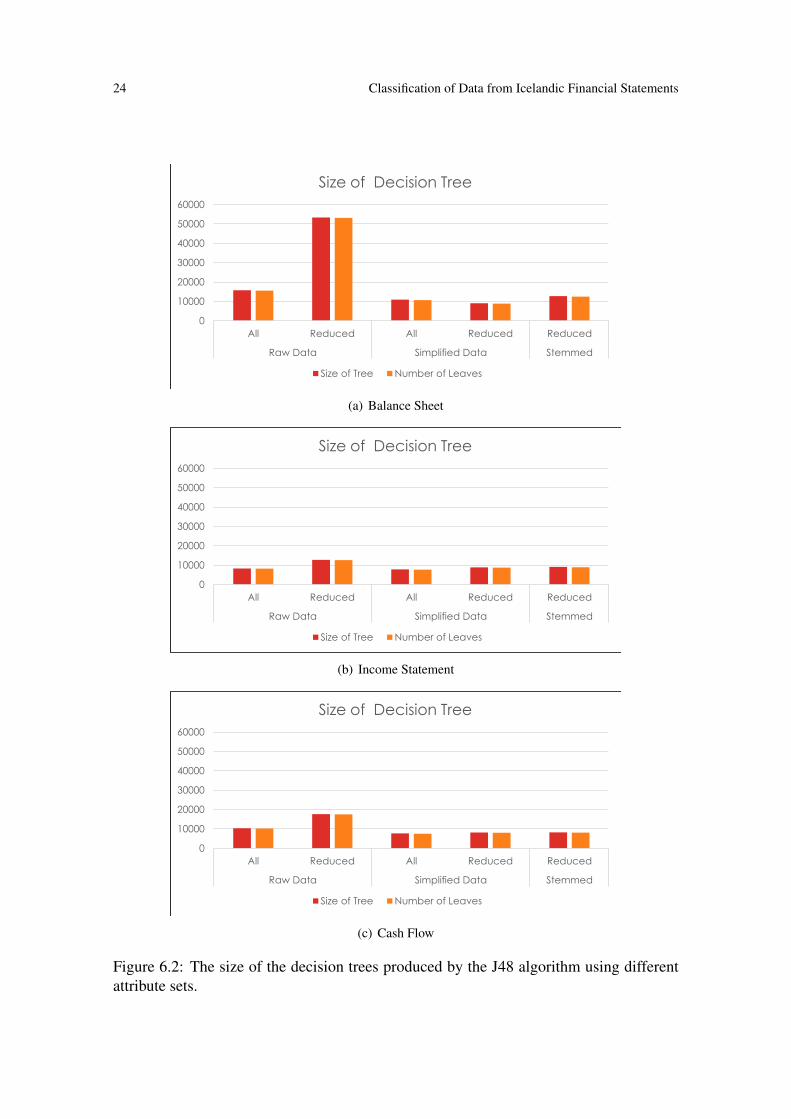
In Figure (6.2) we see the size of the J48 decision tree for the classifiers as the attributeschange in correspondence to Figure (6.1).
In Figure (6.3) we see a comparison of all the different types of classification algorithms.The results are from the stemmed, simplified dataset with the reduced attributes.
The confusion matrices for the Random Forest classifier can be seen in Figure (6.4). Thematrices show the breakdown of how the classifier classified each instance in comparisonto the actual class.
All percentages in the following figures and tables represent the true positive rate.

20 Classification of Data from Icelandic Financial Statements
SummaryCorrectly Classified Instances 3439 92, 3717%Incorrectly Classified Instances 284 7, 6283 %Kappa statistic 0, 9136Mean absolute error 0, 0117Root mean squared error 0, 0933Relative absolute error 9, 916%Root relative squared error 38, 4662%Total Number of Instances 3723
Table 6.1: Balance Sheet: Evaluation on Test Set for J48
SummaryCorrectly Classified Instances 1430 86, 6142%Incorrectly Classified Instances 221 13, 3858 %Kappa statistic 0, 8536Mean absolute error 0, 0166Root mean squared error 0, 1099Relative absolute error 16, 3271%Root relative squared error 48, 67206%Total Number of Instances 1651
Table 6.2: Income Statement: Evaluation on Test Set for J48
SummaryCorrectly Classified Instances 1935 93, 2081%Incorrectly Classified Instances 141 6, 7919 %Kappa statistic 0, 9253Mean absolute error 0, 0181Root mean squared error 0, 0898Relative absolute error 13, 905%Root relative squared error 35, 1847%Total Number of Instances 2076
Table 6.3: Cash Flow: Evaluation on Test Set for J48
SummaryCorrectly Classified Instances 3465 93, 0701%Incorrectly Classified Instances 258 7, 6283 %Kappa statistic 0, 9215Mean absolute error 0, 0093Root mean squared error 0, 0911Relative absolute error 7, 8925%Root relative squared error 37, 5215%Total Number of Instances 3723
Table 6.4: Balance Sheet: Evaluation on Test Set for J48 with AdaBoost

Carsten Petersen, Róbert Gunnarsson, Sigurrós Soffía Kristinsdóttir 21
SummaryCorrectly Classified Instances 1425 87, 9467%Incorrectly Classified Instances 199 12, 0533 %Kappa statistic 0, 8682Mean absolute error 0, 0136Root mean squared error 0, 1128Relative absolute error 13, 395%Root relative squared error 49, 9607%Total Number of Instances 1651
Table 6.5: Income Statement: Evaluation on Test Set for J48 with AdaBoost
SummaryCorrectly Classified Instances 1927 92, 8227%Incorrectly Classified Instances 149 7, 1773 %Kappa statistic 0, 9211Mean absolute error 0, 0109Root mean squared error 0, 0942Relative absolute error 8, 3466%Root relative squared error 36, 9419%Total Number of Instances 2076
Table 6.6: Cash Flow: Evaluation on Test Set for J48 with AdaBoost
SummaryCorrectly Classified Instances 3496 93, 9028%Incorrectly Classified Instances 227 6, 0972 %Kappa statistic 0, 9309Mean absolute error 0, 0155Root mean squared error 0, 0817Relative absolute error 13, 1485%Root relative squared error 33, 6798%Total Number of Instances 3723
Table 6.7: Balance Sheet: Evaluation on Test Set for Random Forest
SummaryCorrectly Classified Instances 1463 88, 613%Incorrectly Classified Instances 188 11, 387 %Kappa statistic 0, 8755Mean absolute error 0, 0209Root mean squared error 0, 1011Relative absolute error 20, 5605%Root relative squared error 44, 7726%Total Number of Instances 1651
Table 6.8: Income Statement: Evaluation on Test Set for Random Forest

22 Classification of Data from Icelandic Financial Statements
SummaryCorrectly Classified Instances 1935 93, 2081%Incorrectly Classified Instances 141 6, 791 %Kappa statistic 0, 9253Mean absolute error 0, 0181Root mean squared error 0, 0898Relative absolute error 13, 905%Root relative squared error 35, 1847%Total Number of Instances 2076
Table 6.9: Cash Flow: Evaluation on Test Set for Random Forest
SummaryCorrectly Classified Instances 3498 93, 9565%Incorrectly Classified Instances 225 6, 0435 %Kappa statistic 0, 9315Mean absolute error 0, 008Root mean squared error 0, 0869Relative absolute error 6, 8123%Root relative squared error 35, 7991%Total Number of Instances 3723
Table 6.10: Balance Sheet: Evaluation on Test Set for Random Forest with AdaBoost
SummaryCorrectly Classified Instances 1457 88, 2495%Incorrectly Classified Instances 194 11, 7505 %Kappa statistic 0, 8715Mean absolute error 0, 0131Root mean squared error 0, 1111Relative absolute error 12, 8688%Root relative squared error 49, 2217%Total Number of Instances 1651
Table 6.11: Income Statement: Evaluation on Test Set for Random Forest with AdaBoost
SummaryCorrectly Classified Instances 1939 93, 4008%Incorrectly Classified Instances 137 6, 5992 %Kappa statistic 0, 9275Mean absolute error 0, 0095Root mean squared error 0, 093Relative absolute error 7, 2739%Root relative squared error 36, 4598%Total Number of Instances 2076
Table 6.12: Cash Flow: Evaluation on Test Set for Random Forest with AdaBoost

Carsten Petersen, Róbert Gunnarsson, Sigurrós Soffía Kristinsdóttir 23
(a) Balance Sheet
(b) Income Statement
(c) Cash Flow
Figure 6.1: Results from Random Forest and J48 using different attribute sets.
24 Classification of Data from Icelandic Financial Statements
(a) Balance Sheet
(b) Income Statement
(c) Cash Flow
Figure 6.2: The size of the decision trees produced by the J48 algorithm using differentattribute sets.

Carsten Petersen, Róbert Gunnarsson, Sigurrós Soffía Kristinsdóttir 25
(a) Balance Sheet
(b) Income Statement
(c) Cash Flow
Figure 6.3: Comparison of the different type of classifiers that were trained using thestemmed attribute set with reduced attributes.

26 Classification of Data from Icelandic Financial Statements
(a) Balance Sheet
(b) Income Statement
(c) Cash Flow
Figure 6.4: Confusion matrices for the Random Forest classifiers showing the true positiverate for each classifier.

27
Chapter 7
Conclusion
From these result we see that about 90% of the classes are correctly classified. Thatmeans that on average about 90% of the data from with in a financial report is correctlyclassified and if you only look at the classes containing key data then the results areslightly higher (see Figure 6.4). These results are better than we expected and indicate thatthese techniques can be implemented and used to classify data from Icelandic financialstatements in conjunction with some error checks on the results to pick out the 10% thatwas wrongly classified. In the test where we used the raw data with the reduced amountof attributes we notice that the accuracy goes down and the size of the resulting decisiontree increases, and dramatically so for the balance sheet. When the decision tree wasfurther analyzed we saw that the algorithm heavily utilized the accountant attribute indetermining the correct class. This attribute was not included in the reduced attribute set.This suggest that the construction of the financial statements is largely influenced by theaccountant company or accountant who did them. In light of this we think it would beuseful to create separate classification models for each major accountant company here inIceland.
As the attributes were simplified the size of the resulting decision tree was greatly reducedand the accuracy went up. This is exactly what we would want, accuracy going up andcomplexity going down. It can also be seen that changing the attributes had more effecton the final results than which classifier we used. From this we conclude that if we wantto improve we need to concentrate on adjusting our attributes. If we continue on with thisproject then this would be one of the main things we would be concentrating on to achievemore accurate results.
While going through the data we noticed that there were some constraints in the data,especially the balance sheet, which in order to improve our results we could try to utilize

28 Classification of Data from Icelandic Financial Statements
by either implementing them into the algorithm or grouping the data before classificationby treating them as a constraint satisfaction problem (CSP) [8]. If we could split the bal-ance sheet up into three parts using the CSP (assets, stockholders equity and liabilities,and other) then we could make 2 different classifiers one for assets and one for stock-holders equity and liabilities reducing the complexity of the final model and improvingaccuracy. The stemming did not appear to make any improvements on the results and onthe contrary they seemed to get worse by a fraction of a percent, perhaps the inflection ofthe words does indicate something about the class. It would be interesting to try furthernatural language processing with IceNLP, such as removing connectives like ’og’ fromour text attributes.
7.1 Limitations
There were some limitations in our data, the biggest being the size of our training set.
Other limitations were that about 25% of the financial reports were done by the accountantcompany KPMG, most of the companies were from the same industry, and although wehad 256 financial reports we only had financial reports from 45 different companies overa period of 4-14 years.

29
Chapter 8
Appendix
Class Descriptiontotal_assets The sum of all the assetsfixed_assets Total fixed assetscurrent_assets Total current assetssub_assets A more detailed listing of assets
sub_stock_eqStockholders equity that has been detailed fur-ther
total_stock_eqTotal stockholders equity, or funds contributedby the owners plus the retained earnings (losses)
commitmentsFuture capital expenditures that a company hascommitted to spend on long-term assets over aperiod of time
non_current_liab Long term obligationscurrent_liabilites Obligations due within one yearsub_liabilities Liabilities that have been detailed further
total_liabilitiesTotal of all the liabilities, both long term andshort term
total_stock_eq_liabThe total of both the liabilities and the stock-holders equity
date Date could be year or a day of month
noteA number referencing a note further down in thedocument
other Anything that does not fit any of our classifiers
Table 8.1: Balance Sheet - Classes

30 Classification of Data from Icelandic Financial Statements
Class Descriptionsub_revenue Business revenue sale of good/servicesrevenue Net sale of good or servicesgross_profit Profit before depreciationsub_operating_expence Cost of manufacturing good/servicesdeprecation Cost of a tangible asset over its useful lifeop_expense Net cost of manufacturing good/servicesop_profit Earning before interest and tax (EBIT)sub_capital_cost Funding cost for financing a businesscapital_cost Net funding cost for financing a businessprofit_before_tax Earning before taxincome_tax Tax that the government impose on businesssub_other_rev_exp Miscellaneous revenues or expensesother_rev_exp Net other revenues or expensesnet_profit Total earningdate Date could be year or a day of month
noteA number referencing a note further down in thedocument
other Anything that does not fit any of our classifiers
Table 8.2: Income Statement - Classes
Class Descriptionsub_turnover_op Detailed listing of turnoverturnover_op Net cash flow from business operating activitiessub_cash_op Detailed listing of cash from operationcash_op Net cash from operation
sub_investingDetailed cash flow from sale/investing of busi-ness assets
investingNet cash flow from sale/investing of businessassets
sub_financing Detailed cash flow from financing activitiesfinancing Net cash flow from financing activitiesprofit_loss Net Increases/decreases in cash flowcash_start Cash at the start of yearcash_end Cash at the end of yeardate Date could be year or a day of month
noteA number referencing a note further down in thedocument
other Anything that does not fit any of our classifiers
Table 8.3: Cash Flow - Classes

Carsten Petersen, Róbert Gunnarsson, Sigurrós Soffía Kristinsdóttir 31
Attributes Description
file_nameThe filename of the financial statement that theinstance was taken from
id_number The id number of the company
yearThe year of the financial statement that the in-stance was taken from
amount The amount or numeric value of the instance
Line_noThe line number in the statement where saidamount appeared
Column_noThe column number where the amount ap-peared
Line_textThe text that appeared in the same line as theamount
first_wordThe first word that appears in the same line asthe amount
last_wordThe last word that appears in the same line asthe amount
infront What appears in right in front of the amountbehind What appears right behind the amount
currencyWhat type of currency is used in the financialreport
accountantThe id number of the accounting company thatdid the reports, or if there wasn’t a companylisted then the id number of the accountant
headingThe heading of the section that the amount ap-pears in
doc_locThe location of the amount in the document asa percentage. (current line number/total linenumbers)
groupWhat type of financial report we are dealingwith, there are 3 kinds. (0-regular report,1-subsidiaries, 2-regular report with subsidiaries)
Table 8.4: Attributes
32 Classification of Data from Icelandic Financial Statements
Word Count Frequencyfé 5096 8, 09%eigið 4303 6, 83%skuldir 3236 5, 14%og 2809 4, 46%samtals 2267 3, 60%kr 2027 3, 22%eignir 1997 3, 17%skammtímaskuldir 1815 2, 88%veltufjármunir 1583 2, 51%fastafjármunir 1365 2, 17%
Table 8.5: Balance Sheet - 10 Most Used Words
Word Count Frequencyfé 2448 5, 95%handbært 2038 4, 96%hækkun 1243 3, 02%frá 1228 2, 99%lækkun 1095 2, 66%og 1066 2, 59%rekstri 1053 2, 56%fjármögnunarhreyfingar 841 2, 04%til 719 1, 75%breyting 657 1, 60%
Table 8.6: Cash Flow - 10 Most Used Words
Word Count Frequencyog 2585 7, 78%tap 1617 4, 86%hagnaður 1604 4, 82%kr 1399 4, 21%ársins 1286 3, 87%fyrir 1266 3, 81%fjármagnsgjöld 1054 3, 17%fjármunatekjur 1054 3, 17%afskriftir 958 2, 88%rekstrarreikningur 862 2, 59%
Table 8.7: Income Statement - 10 Most Used Words

33
Bibliography
[1] Ethem Alpaydin. Introduction to machine learning. Adaptive Computation and Ma-chine learning. MIT Press, 2004.
[2] Pedro Domingos. A few useful things to know about machine learning. Communica-
tions of the ACM, 55(10):78–87, October 2012.
[3] Federal Financial Institutions Examination Council (FFIEC). Improved business pro-cess through xbrl: A use case for business reporting. 2006.
[4] Mark Hall, Eibe Frank, Geoffrey Holmes, Bernhard Pfahringer, Peter Reutemann,and Ian H. Witten. The weka data mining software: an update. SIGKDD Explor.
Newsl., 11(1):10–18, 2009.
[5] Jiawei Han, Micheline Kamber, and Jian Pei. Data mining concepts and techniques,third edition, 2012.
[6] Péter Hegedüs, Tibor Bakota, László Illés, Gergely Ladányi, Rudolf Ferenc, and Ti-bor Gyimóthy. Source code metrics and maintainability: A case study. In Tai-HoonKim, Hojjat Adeli, Haeng-Kon Kim, Heau-Jo Kang, Kyung Jung Kim, Kiumi Aking-behin, and Byeong Ho Kang, editors, FGIT-ASEA/DRBC/EL, volume 257 of Com-
munications in Computer and Information Science, pages 272–284. Springer, 2011.
[7] Hrafn Loftsson and Eiríkur Rögnvaldsson. Icenlp: a natural language processingtoolkit for icelandic., 2007.
[8] Stuart J. Russell and Peter Norvig. Artificial Intelligence: A Modern Approach (2nd
Edition). Prentice Hall, December 2002.
[9] Stephanie Shih. Random forests for classification trees and categorical dependentvariables: an informal quick start r guide. 2011.

34


School of Computer ScienceReykjavík UniversityMenntavegi 1101 Reykjavík, IcelandTel. +354 599 6200Fax +354 599 6201www.reykjavikuniversity.isISSN 1670-8539