Classification of five kinds of moss plants with the use of ...
16
Spectroscopy 25 (2011) 271–285 271 DOI 10.3233/SPE-2011-0518 IOS Press Classification of five kinds of moss plants with the use of Fourier transform infrared spectroscopy and chemometrics Tao Hu a,b,∗ , Wen-Ying Jin c and Cun-Gui Cheng d a Faculty of Life Science and Chemical Engineering, Huaiyin Institute of Technology, Huaian, China b National Special Superfine Powder Engineering Center, Nanjing University of Science and Technology, Nanjing, China c Department of Computer Science and Engineering, Yiwu Industrial and Commercial College, Yiwu, China d College of Chemistry and Life Science, Zhejiang Normal University, Jinhua, China Abstract. Fourier transform infrared spectroscopy (FT-IR) with Horizontal Attenuated Total Reflectance (HATR) techniques is used to obtain the FT-IR spectra of five kinds of mosses, such as Ptychomitrium dentatum (Mitt.) Jaeg., Ptychomitrium polyphylloides (C. Muell.) Par., Ptychomitrium sinense (Mitt.) Jaeg., Macromitrium syntrichophyllum Ther. Etp. Vard., and Macromitrium ferriei Card. Sz Ther. Based on the comparison of the above mosses in the FT-IR spectra, the region ranging from 4000 to 650 cm −1 was selected as the characteristic spectra for analysis. Principal component analysis (PCA) and cluster analysis are considered to identify the five moss species. Because they belong to the homogeneous plants, and have similar chemical components and close FT-IR spectroscopy, PCA and cluster analysis can only give a rough result of classification among the five moss species, Fourier self-deconvolution (FSD) and discrete wavelet transform (DWT) methods are used to enhance the differences between them. We use these methods for further study. Results show that it is an excellent method to use FT-IR spectroscopy combined with FSD and DWT to classify the different species in the same family. FT-IR spectroscopy combined with chemometrics, such as FSD and DWT, can be used as an effective tool in systematic research of bryophytes. Keywords: Moss, horizontal attenuated total reflectance Fourier transform infrared spectroscopy, principle component analysis, cluster analysis, Fourier self-deconvolution, discrete wavelet transform, classification 1. Introduction Mosses are small, soft, non-vascular plants and typically 1–10 cm tall. They commonly grow close together in clumps or mats in damp or shady locations. They have no flowers or seeds, and their wiry stems are covered with simple leaves. At certain times, mosses produce spore capsules which may appear as beak-like capsules borne aloft on thin stalks. Mosses are one of the important kinds of higher plants and quite a few kinds of mosses are used as medicinal plants in Asia. However, due to a large number of species, small habitus and few identi- fying characteristics of mosses, how to identify them effectively and quickly is deserving of research. * Corresponding author: Tao Hu, Faculty of Life Science and Chemical Engineering, Huaiyin Institute of Technology, Huaian 223003, China. Tel.: +86 517 8359 1044; E-mail: [email protected]. 0712-4813/11/$27.50 © 2011 – IOS Press and the authors. All rights reserved
Transcript of Classification of five kinds of moss plants with the use of ...
Spectroscopy 25 (2011) 271–285 271DOI 10.3233/SPE-2011-0518IOS Press
Classification of five kinds of moss plantswith the use of Fourier transform infraredspectroscopy and chemometrics
Tao Hu a,b,∗, Wen-Ying Jin c and Cun-Gui Cheng d
a Faculty of Life Science and Chemical Engineering, Huaiyin Institute of Technology, Huaian, Chinab National Special Superfine Powder Engineering Center, Nanjing University of Science andTechnology, Nanjing, Chinac Department of Computer Science and Engineering, Yiwu Industrial and Commercial College, Yiwu,Chinad College of Chemistry and Life Science, Zhejiang Normal University, Jinhua, China
Abstract. Fourier transform infrared spectroscopy (FT-IR) with Horizontal Attenuated Total Reflectance (HATR) techniquesis used to obtain the FT-IR spectra of five kinds of mosses, such as Ptychomitrium dentatum (Mitt.) Jaeg., Ptychomitriumpolyphylloides (C. Muell.) Par., Ptychomitrium sinense (Mitt.) Jaeg., Macromitrium syntrichophyllum Ther. Etp. Vard., andMacromitrium ferriei Card. Sz Ther. Based on the comparison of the above mosses in the FT-IR spectra, the region rangingfrom 4000 to 650 cm−1 was selected as the characteristic spectra for analysis. Principal component analysis (PCA) and clusteranalysis are considered to identify the five moss species. Because they belong to the homogeneous plants, and have similarchemical components and close FT-IR spectroscopy, PCA and cluster analysis can only give a rough result of classificationamong the five moss species, Fourier self-deconvolution (FSD) and discrete wavelet transform (DWT) methods are used toenhance the differences between them. We use these methods for further study. Results show that it is an excellent method touse FT-IR spectroscopy combined with FSD and DWT to classify the different species in the same family. FT-IR spectroscopycombined with chemometrics, such as FSD and DWT, can be used as an effective tool in systematic research of bryophytes.
Keywords: Moss, horizontal attenuated total reflectance Fourier transform infrared spectroscopy, principle component analysis,cluster analysis, Fourier self-deconvolution, discrete wavelet transform, classification
1. Introduction
Mosses are small, soft, non-vascular plants and typically 1–10 cm tall. They commonly grow closetogether in clumps or mats in damp or shady locations. They have no flowers or seeds, and their wirystems are covered with simple leaves. At certain times, mosses produce spore capsules which may appearas beak-like capsules borne aloft on thin stalks.
Mosses are one of the important kinds of higher plants and quite a few kinds of mosses are usedas medicinal plants in Asia. However, due to a large number of species, small habitus and few identi-fying characteristics of mosses, how to identify them effectively and quickly is deserving of research.
*Corresponding author: Tao Hu, Faculty of Life Science and Chemical Engineering, Huaiyin Institute of Technology, Huaian223003, China. Tel.: +86 517 8359 1044; E-mail: [email protected].
0712-4813/11/$27.50 © 2011 – IOS Press and the authors. All rights reserved
272 T. Hu et al. / Classification of five kinds of moss plants with the use of FT-IR spectroscopy and chemometrics
At present, testing department of traditional Chinese medicines uses methods to identify traditional Chi-nese medicines, such as morphological and histological identification, source identification, microscopicidentification and physical and chemical identification. Many modern analytical approaches are also ap-plied to the identification of Chinese herbal medicines, for instance, thin layer chromatography, gas chro-matography, high performance liquid chromatography and UV spectra and infrared spectrum, etc. [13].
Fourier transform infrared spectroscopy (FT-IR) is an original spectroscopic technique for investigat-ing the functional groups of the chemical components [1,11], and it has been widely used for the identifi-cation, quality control and manufacturing process supervision of traditional Chinese medicines in recentyears [3,5,9,10,14]. However, single FT-IR spectra analysis can not be quickly and accurately appliedin the analysis and identification of complex systems like traditional Chinese medicines. Chemometricmethods combined with FT-IR spectroscopy can make up the defects in single FT-IR spectra analysis[2,4,6–8,15]. So we choose FT-IR spectra with several chemometric methods to discriminate differentplants of the same family.
Wavelet transform (WT) is an efficient tool for signal analysis, such as de-noising, data compres-sion and pattern recognition. In the aspect of pattern recognition, it is well known as a good tool forfeature extraction. WT is defined as the translation and dilation of a function, so it can enhance thelocation features of a signal and has multi-resolution capacity with different dilations and shifts. Inmulti-resolution analysis, the wavelet function under different scales results in different frequencies.Therefore, the wavelet coefficient can be viewed as the characteristics of the signals. A few features canreflect the major information of the spectra after WT and it makes the judgments intuitive and concise.
In this paper, the classification among five kinds of moss species, namely Ptychomitrium denta-tum (Mitt.) Jaeg., Ptychomitrium polyphylloides (C. Muell.) Par., Ptychomitrium sinense (Mitt.) Jaeg.,Macromitrium syntrichophyllum Ther. Etp. Vard. and Macromitrium ferriei Card. Sz Ther., was emphati-cally studied. We used FT-IR spectrometer with horizontal attenuated total reflectance (HATR) techniqueto obtain the FT-IR spectra. Principal component analysis (PCA) and cluster analysis were then appliedto the spectra data set obtained in order to identify clusters of mosses, and discrete wavelet transform(DWT) and Fourier self-deconvolution (FSD) were used to extract the feature vectors and enhance thedifferences among the plants for classification.
2. Discrete wavelet transform
In numerical analysis and functional analysis, DWT is a wavelet transform that the wavelets are dis-cretely sampled. As with other wavelet transforms, a key advantage it has over Fourier transforms is tem-poral resolution: it captures both frequency and location information. Based on this advantage, DWT hasa huge number of applications in science, engineering, mathematics and computer science. Most notably,it is used for signal coding to represent a discrete signal in a more redundant form, often as a precondi-tioning for data compression. DWT is originated from the discretization of continuous wavelet transform(CWT) and the common discretization is dyadic. The CWT of a function or signal, for example, can bedefined as
Wf (a, b) =1√a
∫ ∞
− ∞f (t)Ψ∗
(t − b
a
)dt,
T. Hu et al. / Classification of five kinds of moss plants with the use of FT-IR spectroscopy and chemometrics 273
where Ψ∗(t) denotes the mother wavelet function. The parameters a named as scale parameter andb named as translation parameter are respectively used to control the dilation and position of the motherfunction.
After the dyadic discretization, the function of DWT is accordingly expressed as
Wdwt(j, k) =1√2j
∫ ∞
− ∞f (t)Ψ∗
(t − 2jk
2j
)dt,
where a and b are replaced by 2j and 2jk. An efficient way to implement this scheme using filters wasdeveloped in 1989 by Mallat. The original signal f (t) passes through two complementary filters andemerges as low frequency and high frequency signals. The decomposition process can be iterated, withsuccessive approximations being decomposed in tum, so that a signal can be broken down into manylower-resolution components [12].
3. Experimental section
3.1. Materials and preparation
The five kinds of moss plants were Ptychomitrium dentatum (Mitt.) Jaeg., Ptychomitrium polyphyl-loides (C. Muell.) Par., Ptychomitrium sinense (Mitt.) Jaeg., Macromitrium syntrichophyllum Ther. Etp.Vard. and Macromitrium ferriei Card. Sz Ther (Table 1). The plant materials were collected from Beishanand campus of Zhejiang Normal University in Jinhua, Zhejiang Province, China (29◦13′N, 119◦35′E)and Leshan in Leshan, Sichuan Province, China (29◦40′N, 103◦27′E) in May 2008. All sample plantswere similar in terms of environmental conditions and population sizes. To remove the spectral interfer-ence from water absorption bands, all samples were dried at 55◦C for 72 h. All samples were groundinto fine powder in an agate mortar respectively, and sieved by 200 meshes (75 µm).
3.2. Spectral measurements
The FT-IR spectra were collected at a resolution of 2 cm−1 with 32 scans using a Thermo Electron(Madison, WI, USA) Nexus 6700 FT-IR spectrometer with a room temperature deuterated triglycinesulfate (DTGS) detector, and with a single-bounce HATR (Ge) accessory. 8.0 mg of powdered sampleswas respectively placed directly about 3.14 mm2 on the center of the Ge crystal of the HATR accessoryfor measurement. To ensure good contact with the Ge crystal surface, all powder samples were pressedagainst it using a pressure tower to give the same mechanical pressure on all the samples. All the obtainedspectra were auto-baseline corrected. No other sample preparation was required. Each species of allsamples were measured and the averaged spectrum was used for further analysis.
Table 1
Moss plant samples
Families Genera SpeciesPtychomitriaceae Ptychomitrium Fueror. Ptychomitrium sinense (Mitt.) Jaeg.
Ptychomitrium dentatum (Mitt.) Jaeg.Ptychomitrium polyphylloides (C. Muell.) Par.
Orthotrichaceae Macromibiuma Macromibiuma ferriei Card. Sz Ther.Macromitrium syntrichophyllum Ther. Etp. Vard.
274 T. Hu et al. / Classification of five kinds of moss plants with the use of FT-IR spectroscopy and chemometrics
3.3. Data analysis
The FT-IR spectra of samples were obtained by measurement. The absorption values from differentwave bands were based on the characters of the absorption value. The absorption values from differentwave bands based on the characters of the absorption value were obtained by copying data method.Matlab 7.0 software was used for wavelet transformation. Daubechies wavelet, which possesses betterexploration ability for signal singularity, is acted as analysis wavelet. Fourier self-deconvolution andone-dimension discrete wavelet transform were taken to different samples.
4. Results and discussion
4.1. FT-IR analysis
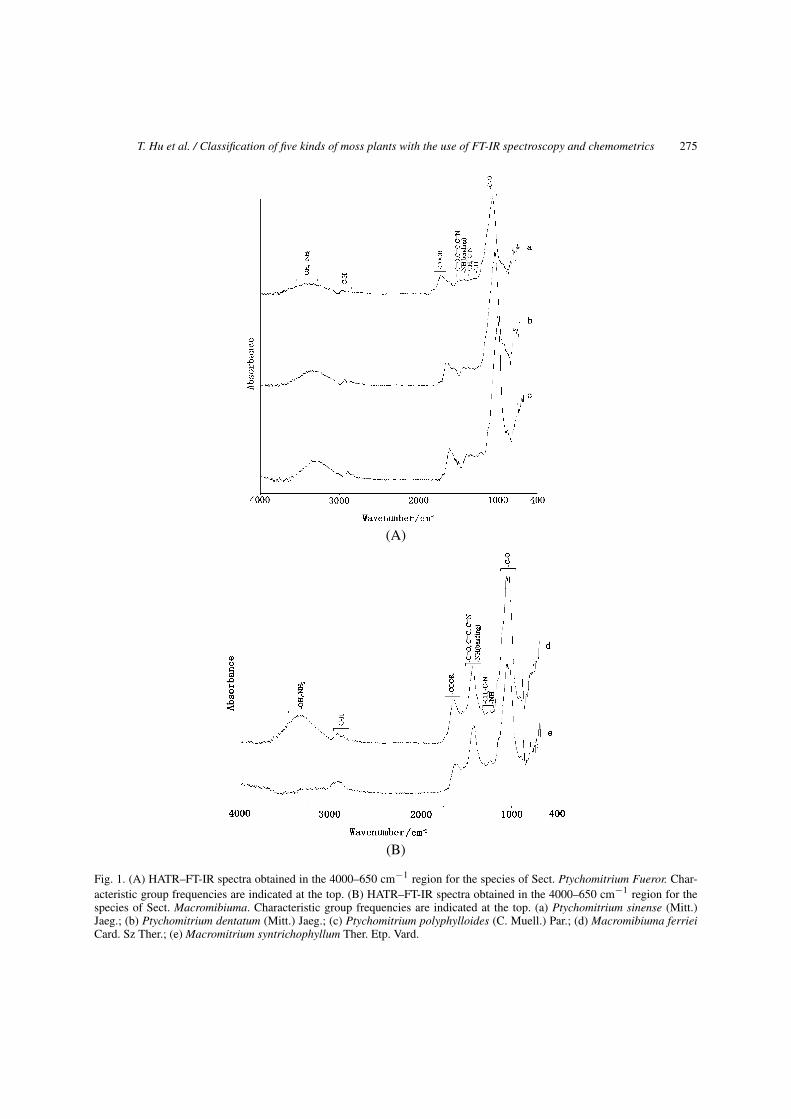
The feasibility of obtaining for the chemical information from plants was investigated via FT-IR spec-trometry. Typical IR spectra obtained from five kinds of plants Ptychomitrium sinense (Mitt.) Jaeg.,Ptychomitrium dentatum (Mitt.) Jaeg., Ptychomitrium polyphylloides (C. Muell.) Par., Macromibiumaferriei Card. Sz Ther. and Macromitrium syntrichophyllum Ther. Etp. Vard. were shown in Fig. 1.
Because FT-IR spectra can offer useful information which represents many different functional groupsof biomacromolecule, the comprehensive information of fibrin, hemicellulose, protein, carbohydrate,nucleic acid and lipid in the gametocyte is obtained from the spectra. From the Fig. 1, absorption bands inthe range of 4000–900 cm−1 are due to functional groups, and the band assignments are labeled in Fig. 1.Absorption bands located around 3400 cm−1 correspond to O–H and N–H stretching vibrations thatmainly occur from proteins and carbohydrates. The bands around 3000 cm−1 represent C–H stretchingvibrations that are mainly caused by lipids and carbohydrates. Absorption raised from C–H bendingmodes is located around 1200–1500 cm−1 but overlaps with other absorption bands within this region.Three protein absorption bands located around 1680 (C=O), 1550 (N–H) and 1250 (C–N) cm−1 areassigned as amide I, II and III bands, respectively. Absorption bands around 1745 cm−1 correspondto an isolated carbonyl group (COOR), indicating ester-containing compounds are commonly found inmembrane lipid and cell wall pectin. Absorption bands in the area between 1200 and 650 cm−1, referredas the fingerprint region, are due to intra-molecular phenomena. The fingerprint region is specific foreach species. Chemometrics is applied to the above absorption bands. The observed absorption bandsconcern with low molecular weight carbohydrates, specifically to polyols and monosaccharides.
Although some complex quantitative and qualitative differences between the species analyzed areobserved, specific differences are essentially unrecognizable by the naked eyes and readily illustratedthe need to employ multivariate statistical techniques for the analysis of FT-IR data. We chose principalcomponent analysis (PCA) and cluster analysis (CLA) as the research methods to analyze the absorptionbands. Because the main absorption peaks of chemical compositions in bryophytes range from 4000 to650 cm−1, this area is the main object to analysis in this paper.
4.2. Chemotaxonomic distinction with cluster analysis
From Fig. 2, we can obtain a closer inspection of quantitative difference, but such complicated spectrareadily illustrate the need to use multivariate statistical techniques in the analysis of FT-IR data. There-fore, the first multivariate analysis we chose is cluster analysis, which is used to investigate a perspicuous
T. Hu et al. / Classification of five kinds of moss plants with the use of FT-IR spectroscopy and chemometrics 275
(A)
(B)
Fig. 1. (A) HATR–FT-IR spectra obtained in the 4000–650 cm−1 region for the species of Sect. Ptychomitrium Fueror. Char-acteristic group frequencies are indicated at the top. (B) HATR–FT-IR spectra obtained in the 4000–650 cm−1 region for thespecies of Sect. Macromibiuma. Characteristic group frequencies are indicated at the top. (a) Ptychomitrium sinense (Mitt.)Jaeg.; (b) Ptychomitrium dentatum (Mitt.) Jaeg.; (c) Ptychomitrium polyphylloides (C. Muell.) Par.; (d) Macromibiuma ferrieiCard. Sz Ther.; (e) Macromitrium syntrichophyllum Ther. Etp. Vard.
276 T. Hu et al. / Classification of five kinds of moss plants with the use of FT-IR spectroscopy and chemometrics
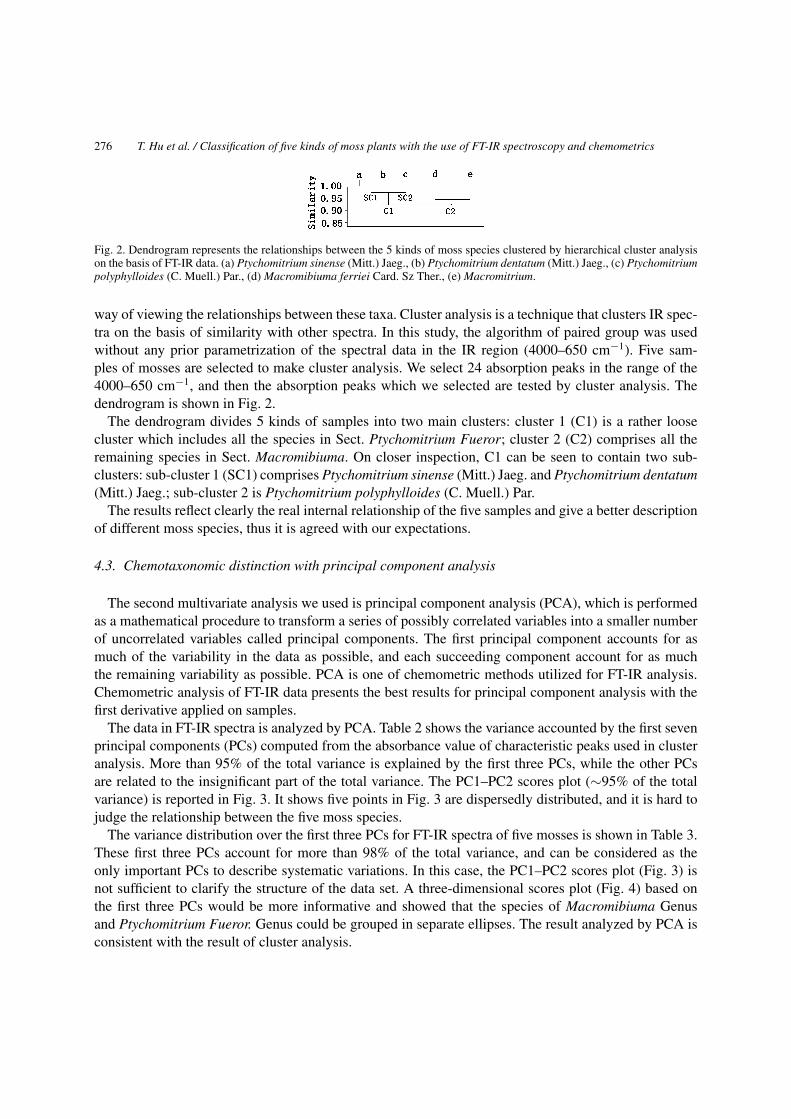
Fig. 2. Dendrogram represents the relationships between the 5 kinds of moss species clustered by hierarchical cluster analysison the basis of FT-IR data. (a) Ptychomitrium sinense (Mitt.) Jaeg., (b) Ptychomitrium dentatum (Mitt.) Jaeg., (c) Ptychomitriumpolyphylloides (C. Muell.) Par., (d) Macromibiuma ferriei Card. Sz Ther., (e) Macromitrium.
way of viewing the relationships between these taxa. Cluster analysis is a technique that clusters IR spec-tra on the basis of similarity with other spectra. In this study, the algorithm of paired group was usedwithout any prior parametrization of the spectral data in the IR region (4000–650 cm−1). Five sam-ples of mosses are selected to make cluster analysis. We select 24 absorption peaks in the range of the4000–650 cm−1, and then the absorption peaks which we selected are tested by cluster analysis. Thedendrogram is shown in Fig. 2.
The dendrogram divides 5 kinds of samples into two main clusters: cluster 1 (C1) is a rather loosecluster which includes all the species in Sect. Ptychomitrium Fueror; cluster 2 (C2) comprises all theremaining species in Sect. Macromibiuma. On closer inspection, C1 can be seen to contain two sub-clusters: sub-cluster 1 (SC1) comprises Ptychomitrium sinense (Mitt.) Jaeg. and Ptychomitrium dentatum(Mitt.) Jaeg.; sub-cluster 2 is Ptychomitrium polyphylloides (C. Muell.) Par.
The results reflect clearly the real internal relationship of the five samples and give a better descriptionof different moss species, thus it is agreed with our expectations.
4.3. Chemotaxonomic distinction with principal component analysis
The second multivariate analysis we used is principal component analysis (PCA), which is performedas a mathematical procedure to transform a series of possibly correlated variables into a smaller numberof uncorrelated variables called principal components. The first principal component accounts for asmuch of the variability in the data as possible, and each succeeding component account for as muchthe remaining variability as possible. PCA is one of chemometric methods utilized for FT-IR analysis.Chemometric analysis of FT-IR data presents the best results for principal component analysis with thefirst derivative applied on samples.
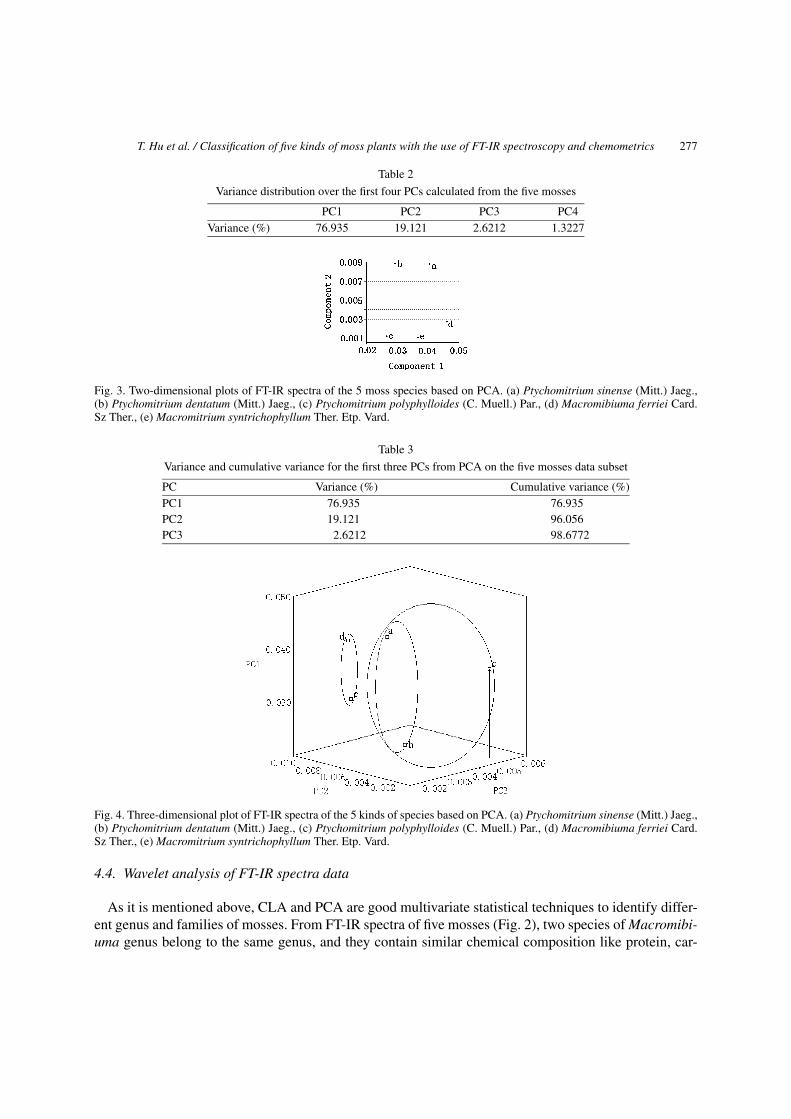
The data in FT-IR spectra is analyzed by PCA. Table 2 shows the variance accounted by the first sevenprincipal components (PCs) computed from the absorbance value of characteristic peaks used in clusteranalysis. More than 95% of the total variance is explained by the first three PCs, while the other PCsare related to the insignificant part of the total variance. The PC1–PC2 scores plot (∼95% of the totalvariance) is reported in Fig. 3. It shows five points in Fig. 3 are dispersedly distributed, and it is hard tojudge the relationship between the five moss species.
The variance distribution over the first three PCs for FT-IR spectra of five mosses is shown in Table 3.These first three PCs account for more than 98% of the total variance, and can be considered as theonly important PCs to describe systematic variations. In this case, the PC1–PC2 scores plot (Fig. 3) isnot sufficient to clarify the structure of the data set. A three-dimensional scores plot (Fig. 4) based onthe first three PCs would be more informative and showed that the species of Macromibiuma Genusand Ptychomitrium Fueror. Genus could be grouped in separate ellipses. The result analyzed by PCA isconsistent with the result of cluster analysis.
T. Hu et al. / Classification of five kinds of moss plants with the use of FT-IR spectroscopy and chemometrics 277
Table 2
Variance distribution over the first four PCs calculated from the five mosses
PC1 PC2 PC3 PC4Variance (%) 76.935 19.121 2.6212 1.3227
Fig. 3. Two-dimensional plots of FT-IR spectra of the 5 moss species based on PCA. (a) Ptychomitrium sinense (Mitt.) Jaeg.,(b) Ptychomitrium dentatum (Mitt.) Jaeg., (c) Ptychomitrium polyphylloides (C. Muell.) Par., (d) Macromibiuma ferriei Card.Sz Ther., (e) Macromitrium syntrichophyllum Ther. Etp. Vard.
Table 3
Variance and cumulative variance for the first three PCs from PCA on the five mosses data subset
PC Variance (%) Cumulative variance (%)PC1 76.935 76.935PC2 19.121 96.056PC3 2.6212 98.6772
Fig. 4. Three-dimensional plot of FT-IR spectra of the 5 kinds of species based on PCA. (a) Ptychomitrium sinense (Mitt.) Jaeg.,(b) Ptychomitrium dentatum (Mitt.) Jaeg., (c) Ptychomitrium polyphylloides (C. Muell.) Par., (d) Macromibiuma ferriei Card.Sz Ther., (e) Macromitrium syntrichophyllum Ther. Etp. Vard.
4.4. Wavelet analysis of FT-IR spectra data
As it is mentioned above, CLA and PCA are good multivariate statistical techniques to identify differ-ent genus and families of mosses. From FT-IR spectra of five mosses (Fig. 2), two species of Macromibi-uma genus belong to the same genus, and they contain similar chemical composition like protein, car-
278 T. Hu et al. / Classification of five kinds of moss plants with the use of FT-IR spectroscopy and chemometrics
bohydrate and plant hormones β-sitosterol, etc., whose IR absorption is quite similar, including threespecies of Ptychomitrium Fueror. Genus also scarcely differ from each other in their appearance. TheFT-IR spectra from the different plants have very close absorbance values at the same wave number.The spectra similarity of the same genus makes it difficult to distinguish between them, so FSD andDWT were used to extract their features for further classification in our study. Generally, the region of3600–2800 and 1800–650 cm−1 can provide higher information of spectra. The former region includesthe O–H and N–H stretching bands and the characterization is not obvious, while the latter region calledthe fingerprint region contains more molecular structural information. Therefore, we scaled the FT-IRspectra data to the same range (1800–650 cm−1) for FSD and DWT analysis.
4.5. The classification of Sect. Ptychomitrium Fueror. and Sect. Macromibiuma
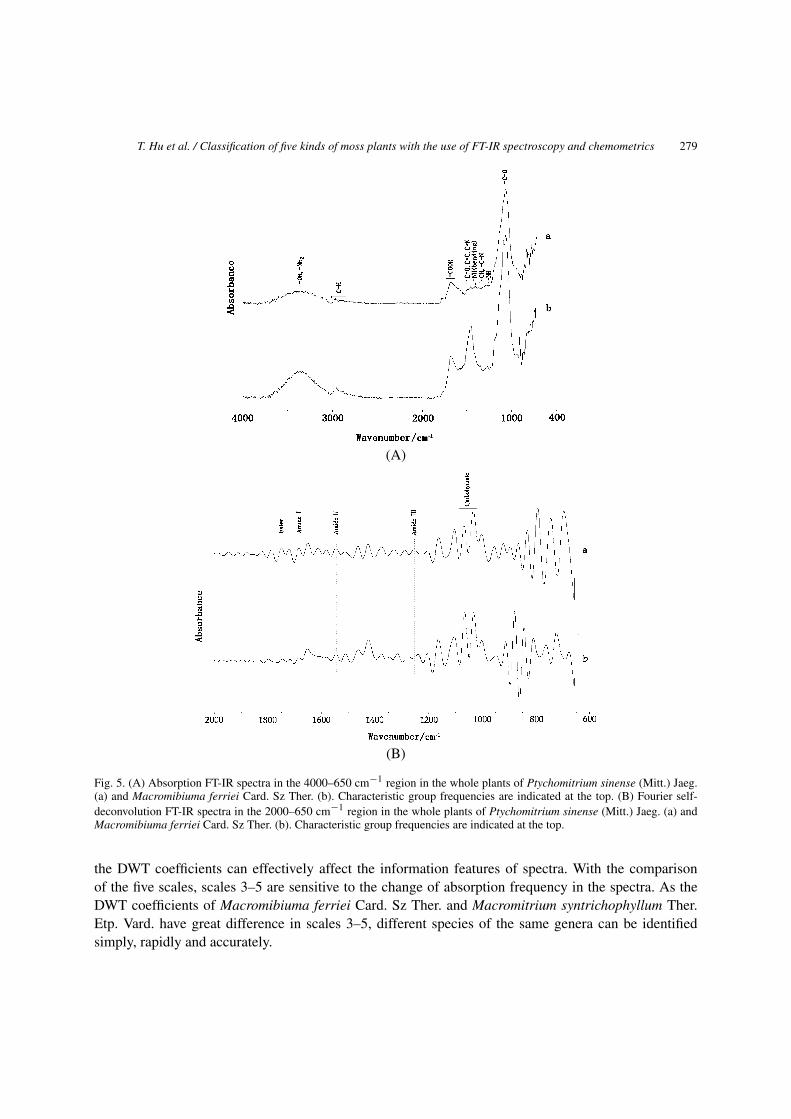
According to the plant taxonomy of mosses, Sect. Ptychomitrium Fueror. and Sect. Macromibiumabelong to different families. In order to further identify them, FSD is used to deal with the FT-IR spectra.In this section, Ptychomitrium sinense (Mitt.) Jaeg. and Macromibiuma ferriei Card. Sz Ther. are selectedto represent each genera, and their FT-IR spectra and FT-IR-FSD spectra are shown in Fig. 5. The 2000–1650 cm−1 region includes the fingerprint region, which contains more molecule structural information.Thus the 2000–650 cm−1 region are used to extract the spectral features.
As shown in Fig. 5(A), several absorption regions are identified, and the band assignments are labeled.The functional groups represented by the absorptions are illustrated in the above chapter. In the originalFT-IR spectra (Fig. 5(A)), there are a few differences between the two species. In order to enhancethe differences between Sect. Ptychomitrium Fueror. and Sect. Macromibiuma, FSD is used to dealwith the FT-IR spectra. The result is shown in Fig. 5(B). From Fig. 5(B), the waveforms of the twospecies have been changed a lot. In the same resolution degree, Ptychomitrium sinense (Mitt.) Jaeg. (a)has some difference from Macromibiuma ferriei Card. Sz Ther. (b), the wave peaks of ester, amide Iand II in Ptychomitrium sinense (Mitt.) Jaeg. and Macromibiuma ferriei Card. Sz Ther., which are quitecorrespondent. The amide III bands at 1250 cm−1 were found in Ptychomitrium sinense (Mitt.) Jaeg.,but not in Macromibiuma ferriei Card. Sz Ther. and the shape of absorption bands and the intensity ofabsorption peaks in the fingerprint region, which are different. Therefore, Fourier self-deconvolution canbe applied to identify different genera simply, rapidly and accurately.
4.6. The classification of species in Sect. Macromibiuma
The FSD was used to enhance the differences between different plants of different genera, and ob-tained satisfying results. So we applied this method to the study of species in the same genera. Figure 6shows the results.
Regrettably, the results did not come up to our expectations. In the Fig. 6, as they belong to the samegenus, and they contain similar chemical composition like protein, carbohydrate and plant hormonesβ-sitosterol, etc., their IR absorption is quite similar. The FT-IR spectra from different plants have veryclose absorbance values at the same wave number. The spectra similarity of the same genus makesit difficult to distinguish among them even the FT-IR spectra were transformed by FSD, so discretewavelet transform (DWT) was used to extract their features for further classification.
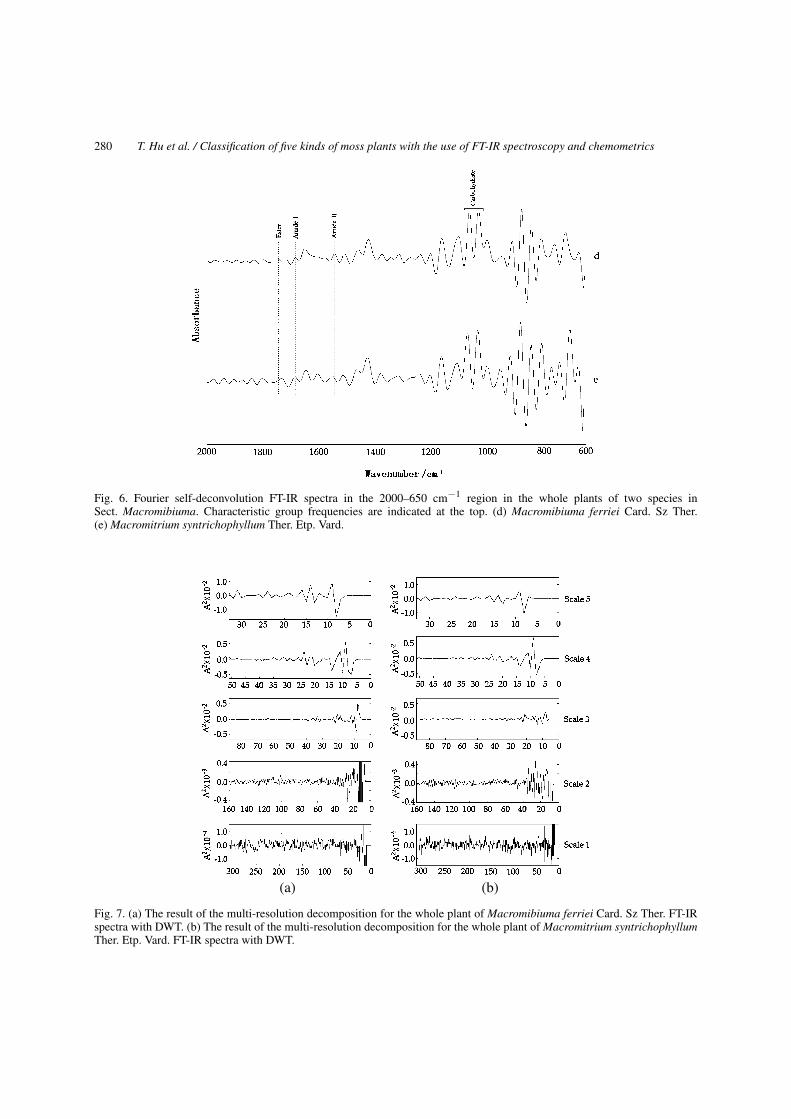
Figure 7 displayed the DWT coefficients of complete stool of Macromibiuma ferriei Card. Sz Ther. andMacromitrium syntrichophyllum Ther. Etp. Vard. We make 5-level wavelet decomposition to deal withthe FT-IR spectra data. Scale 1–5 in Fig. 7 indicates detailed information after decomposition. In Fig. 7,
T. Hu et al. / Classification of five kinds of moss plants with the use of FT-IR spectroscopy and chemometrics 279
(A)
(B)
Fig. 5. (A) Absorption FT-IR spectra in the 4000–650 cm−1 region in the whole plants of Ptychomitrium sinense (Mitt.) Jaeg.(a) and Macromibiuma ferriei Card. Sz Ther. (b). Characteristic group frequencies are indicated at the top. (B) Fourier self-deconvolution FT-IR spectra in the 2000–650 cm−1 region in the whole plants of Ptychomitrium sinense (Mitt.) Jaeg. (a) andMacromibiuma ferriei Card. Sz Ther. (b). Characteristic group frequencies are indicated at the top.
the DWT coefficients can effectively affect the information features of spectra. With the comparisonof the five scales, scales 3–5 are sensitive to the change of absorption frequency in the spectra. As theDWT coefficients of Macromibiuma ferriei Card. Sz Ther. and Macromitrium syntrichophyllum Ther.Etp. Vard. have great difference in scales 3–5, different species of the same genera can be identifiedsimply, rapidly and accurately.
280 T. Hu et al. / Classification of five kinds of moss plants with the use of FT-IR spectroscopy and chemometrics
Fig. 6. Fourier self-deconvolution FT-IR spectra in the 2000–650 cm−1 region in the whole plants of two species inSect. Macromibiuma. Characteristic group frequencies are indicated at the top. (d) Macromibiuma ferriei Card. Sz Ther.(e) Macromitrium syntrichophyllum Ther. Etp. Vard.
(a) (b)
Fig. 7. (a) The result of the multi-resolution decomposition for the whole plant of Macromibiuma ferriei Card. Sz Ther. FT-IRspectra with DWT. (b) The result of the multi-resolution decomposition for the whole plant of Macromitrium syntrichophyllumTher. Etp. Vard. FT-IR spectra with DWT.

T. Hu et al. / Classification of five kinds of moss plants with the use of FT-IR spectroscopy and chemometrics 281
4.7. The classification of species in Sect. Ptychomitrium Fueror.
The same techniques, namely FSD and DWT, are also applied to the classification of Pty-chomitrium sinense (Mitt.) Jaeg., Ptychomitrium dentatum (Mitt.) Jaeg. and Ptychomitrium polyphyl-loides (C. Muell.) Par. The spectra after the treatment of FSD are shown in Fig. 8. As shown in Fig. 8,all the FT-IR spectra are transformed by FSD to enhance the differences between the whole plants ofPtychomitrium sinense (Mitt.) Jaeg., Ptychomitrium dentatum (Mitt.) Jaeg. and Ptychomitrium poly-phylloides (C. Muell.) Par. It is noted that the FSD spectra of Ptychomitrium sinense (Mitt.) Jaeg. andPtychomitrium dentatum (Mitt.) Jaeg. have close absorbance and it is difficult to distinguish them. Com-pared with the FSD spectra, the amide I exists in Ptychomitrium sinense (Mitt.) Jaeg. and Ptychomitriumdentatum (Mitt.) Jaeg., but not in Ptychomitrium polyphylloides (C. Muell.) Par., or in Macromibiumaferriei Card. Sz Ther., and it is correspondingly easy to make a distinction between Ptychomitriumpolyphylloides (C. Muell.) Par. and the others. The difference between Ptychomitrium sinense (Mitt.)
Fig. 8. Fourier self-deconvolution FT-IR spectra in the 2000–650 cm−1 region in the whole plants of three species in Sect. Pty-chomitrium Fueror. Characteristic group frequencies are indicated at the top. (a) Ptychomitrium sinense (Mitt.) Jaeg. (b) Pty-chomitrium dentatum (Mitt.) Jaeg. (c) Ptychomitrium polyphylloides (C. Muell.) Par.
282 T. Hu et al. / Classification of five kinds of moss plants with the use of FT-IR spectroscopy and chemometrics
(a) (b)
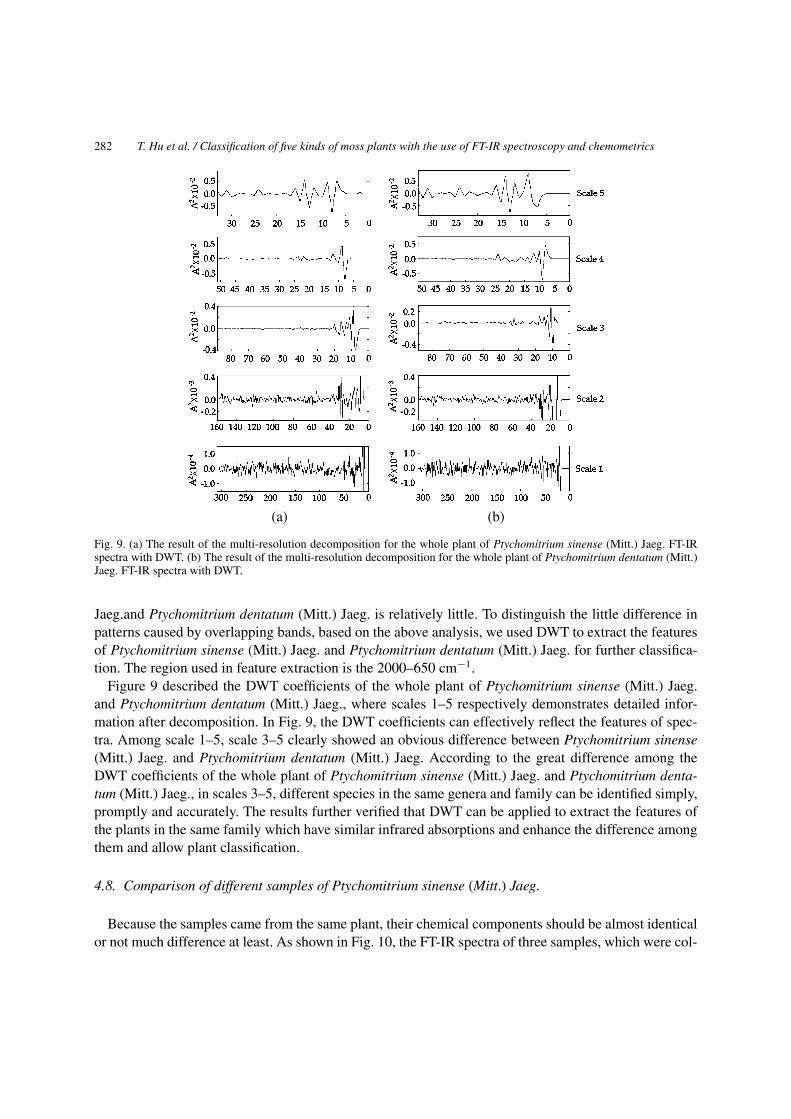
Fig. 9. (a) The result of the multi-resolution decomposition for the whole plant of Ptychomitrium sinense (Mitt.) Jaeg. FT-IRspectra with DWT. (b) The result of the multi-resolution decomposition for the whole plant of Ptychomitrium dentatum (Mitt.)Jaeg. FT-IR spectra with DWT.
Jaeg.and Ptychomitrium dentatum (Mitt.) Jaeg. is relatively little. To distinguish the little difference inpatterns caused by overlapping bands, based on the above analysis, we used DWT to extract the featuresof Ptychomitrium sinense (Mitt.) Jaeg. and Ptychomitrium dentatum (Mitt.) Jaeg. for further classifica-tion. The region used in feature extraction is the 2000–650 cm−1.
Figure 9 described the DWT coefficients of the whole plant of Ptychomitrium sinense (Mitt.) Jaeg.and Ptychomitrium dentatum (Mitt.) Jaeg., where scales 1–5 respectively demonstrates detailed infor-mation after decomposition. In Fig. 9, the DWT coefficients can effectively reflect the features of spec-tra. Among scale 1–5, scale 3–5 clearly showed an obvious difference between Ptychomitrium sinense(Mitt.) Jaeg. and Ptychomitrium dentatum (Mitt.) Jaeg. According to the great difference among theDWT coefficients of the whole plant of Ptychomitrium sinense (Mitt.) Jaeg. and Ptychomitrium denta-tum (Mitt.) Jaeg., in scales 3–5, different species in the same genera and family can be identified simply,promptly and accurately. The results further verified that DWT can be applied to extract the features ofthe plants in the same family which have similar infrared absorptions and enhance the difference amongthem and allow plant classification.
4.8. Comparison of different samples of Ptychomitrium sinense (Mitt.) Jaeg.
Because the samples came from the same plant, their chemical components should be almost identicalor not much difference at least. As shown in Fig. 10, the FT-IR spectra of three samples, which were col-
T. Hu et al. / Classification of five kinds of moss plants with the use of FT-IR spectroscopy and chemometrics 283
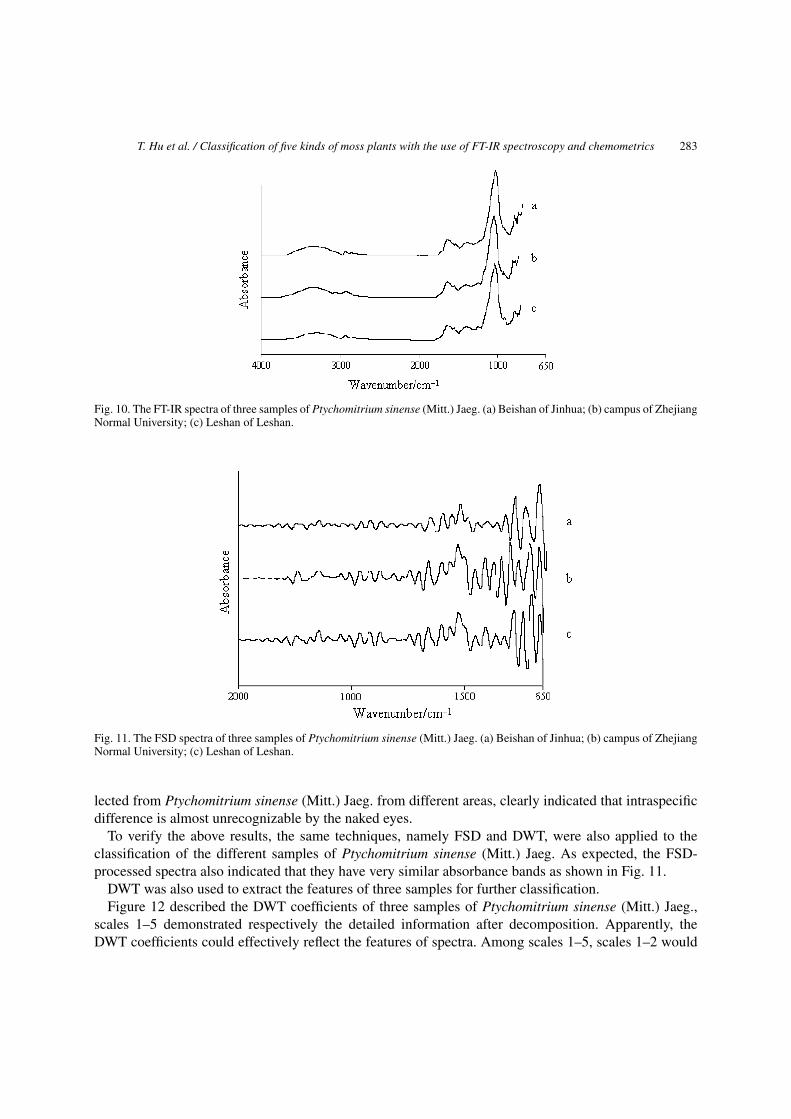
Fig. 10. The FT-IR spectra of three samples of Ptychomitrium sinense (Mitt.) Jaeg. (a) Beishan of Jinhua; (b) campus of ZhejiangNormal University; (c) Leshan of Leshan.
Fig. 11. The FSD spectra of three samples of Ptychomitrium sinense (Mitt.) Jaeg. (a) Beishan of Jinhua; (b) campus of ZhejiangNormal University; (c) Leshan of Leshan.
lected from Ptychomitrium sinense (Mitt.) Jaeg. from different areas, clearly indicated that intraspecificdifference is almost unrecognizable by the naked eyes.
To verify the above results, the same techniques, namely FSD and DWT, were also applied to theclassification of the different samples of Ptychomitrium sinense (Mitt.) Jaeg. As expected, the FSD-processed spectra also indicated that they have very similar absorbance bands as shown in Fig. 11.
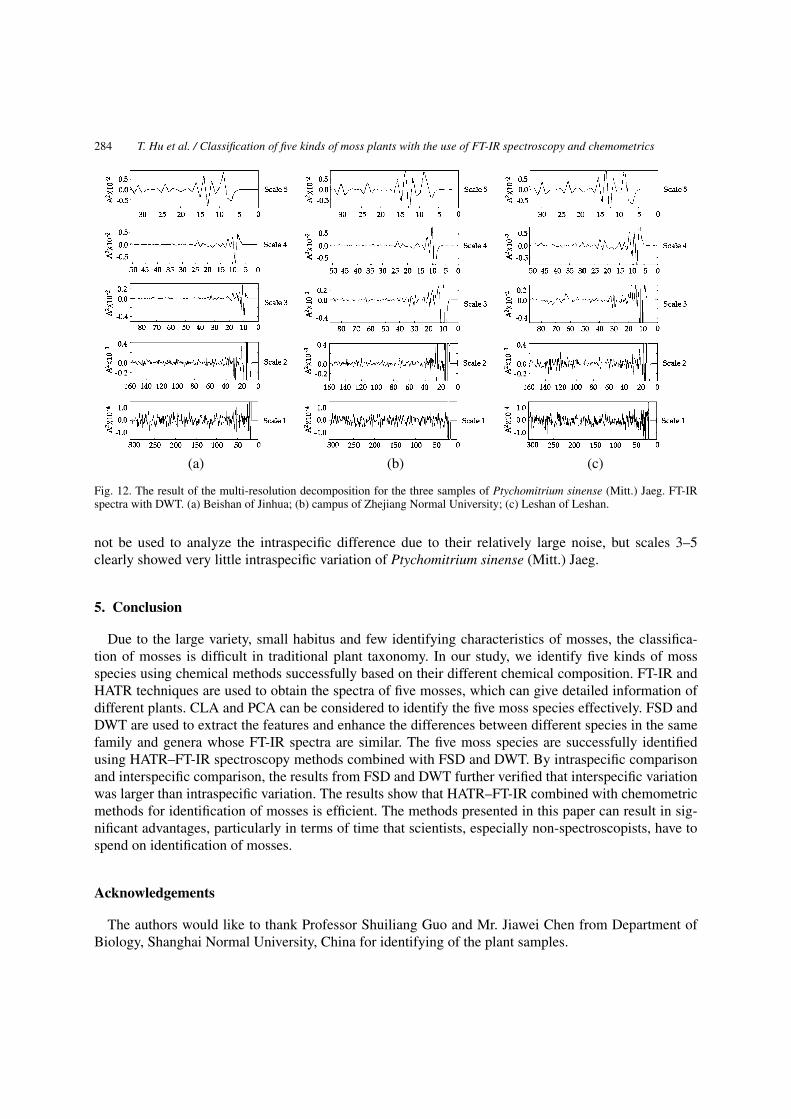
DWT was also used to extract the features of three samples for further classification.Figure 12 described the DWT coefficients of three samples of Ptychomitrium sinense (Mitt.) Jaeg.,
scales 1–5 demonstrated respectively the detailed information after decomposition. Apparently, theDWT coefficients could effectively reflect the features of spectra. Among scales 1–5, scales 1–2 would
284 T. Hu et al. / Classification of five kinds of moss plants with the use of FT-IR spectroscopy and chemometrics
(a) (b) (c)
Fig. 12. The result of the multi-resolution decomposition for the three samples of Ptychomitrium sinense (Mitt.) Jaeg. FT-IRspectra with DWT. (a) Beishan of Jinhua; (b) campus of Zhejiang Normal University; (c) Leshan of Leshan.
not be used to analyze the intraspecific difference due to their relatively large noise, but scales 3–5clearly showed very little intraspecific variation of Ptychomitrium sinense (Mitt.) Jaeg.
5. Conclusion
Due to the large variety, small habitus and few identifying characteristics of mosses, the classifica-tion of mosses is difficult in traditional plant taxonomy. In our study, we identify five kinds of mossspecies using chemical methods successfully based on their different chemical composition. FT-IR andHATR techniques are used to obtain the spectra of five mosses, which can give detailed information ofdifferent plants. CLA and PCA can be considered to identify the five moss species effectively. FSD andDWT are used to extract the features and enhance the differences between different species in the samefamily and genera whose FT-IR spectra are similar. The five moss species are successfully identifiedusing HATR–FT-IR spectroscopy methods combined with FSD and DWT. By intraspecific comparisonand interspecific comparison, the results from FSD and DWT further verified that interspecific variationwas larger than intraspecific variation. The results show that HATR–FT-IR combined with chemometricmethods for identification of mosses is efficient. The methods presented in this paper can result in sig-nificant advantages, particularly in terms of time that scientists, especially non-spectroscopists, have tospend on identification of mosses.
Acknowledgements
The authors would like to thank Professor Shuiliang Guo and Mr. Jiawei Chen from Department ofBiology, Shanghai Normal University, China for identifying of the plant samples.
T. Hu et al. / Classification of five kinds of moss plants with the use of FT-IR spectroscopy and chemometrics 285
References
[1] K.L.A. Chan and S.G. Kazarian, Appl. Spectrosc. 62 (2008), 1095–1101.[2] C.G. Cheng, J. Liu, W.Q. Cao, R.W. Zheng, H. Wang and C.J. Zhang, Vib. Spectrosc. 54 (2010), 50–55.[3] C.G. Cheng, J. Liu, H. Wang and W. Xiong, Appl. Spectrosc. Rev. 45 (2010), 165–178.[4] C.G. Cheng, J. Liu, C.J. Zhang, M.Z. Cai, H. Wang and W. Xiong, Appl. Spectrosc. Rev. 45 (2010), 148–164.[5] C.G. Cheng, Y.M. Ruan and B.L. Li, Spectrosc. Spect. Anal. 24 (2004), 1355–1358.[6] C.G. Cheng, Y.M. Tian and W.Y. Jin, Spectroscopy – Int. J. 22 (2008), 397–404.[7] C.G. Cheng, X.H. Wu and S.Q. Wang, Chin. J. Anal. Chem. 32 (2004), 1529–1531.[8] C.G. Cheng, W. Xiong and W.Y. Jin, Chin. J. Anal. Chem. 37 (2009), 676–680.[9] Q.H. Hong, C.G. Cheng, Z.F. Cheng and D.T. Li, Spectrosc. Spect. Anal. 27 (2007), 283–286.
[10] H.F. Lv, J.B. Shen, X.Y. Lin and J.L. Fu, Taxon 57 (2008), 1274–1288.[11] Z. Movasaghi, S. Rehman and I. ur Rehman, Appl. Spectrosc. Rev. 43 (2008), 134–179.[12] S. Prabhakar, A.R. Mohanty and A.S. Sekhar, Tribol. Int. 35 (2002), 793–800.[13] The Pharmacopoeia Committee of the People’s Republic of China, Chinese Pharmacopoeia, Vol. 1, Chemical Industrial
Publishing House, Beijing, 2010.[14] Y. Tuo, P. Huang, Y. Ke, S.L. Fan, Q.Y. Lu, B. Xin and Z.Y. Wang, Appl. Spectrosc. 64 (2010), 268–274.[15] C.J. Zhang and C.G. Cheng, Spectroscopy – Int. J. 22 (2008), 371–386.

Submit your manuscripts athttp://www.hindawi.com
Hindawi Publishing Corporationhttp://www.hindawi.com Volume 2014
Inorganic ChemistryInternational Journal of
Hindawi Publishing Corporation http://www.hindawi.com Volume 2014
International Journal ofPhotoenergy
Hindawi Publishing Corporationhttp://www.hindawi.com Volume 2014
Carbohydrate Chemistry
International Journal of
Hindawi Publishing Corporationhttp://www.hindawi.com Volume 2014
Journal of
Chemistry
Hindawi Publishing Corporationhttp://www.hindawi.com Volume 2014
Advances in
Physical Chemistry
Hindawi Publishing Corporationhttp://www.hindawi.com
Analytical Methods in Chemistry
Journal of
Volume 2014
Bioinorganic Chemistry and ApplicationsHindawi Publishing Corporationhttp://www.hindawi.com Volume 2014
SpectroscopyInternational Journal of
Hindawi Publishing Corporationhttp://www.hindawi.com Volume 2014
The Scientific World JournalHindawi Publishing Corporation http://www.hindawi.com Volume 2014
Medicinal ChemistryInternational Journal of
Hindawi Publishing Corporationhttp://www.hindawi.com Volume 2014
Chromatography Research International
Hindawi Publishing Corporationhttp://www.hindawi.com Volume 2014
Applied ChemistryJournal of
Hindawi Publishing Corporationhttp://www.hindawi.com Volume 2014
Hindawi Publishing Corporationhttp://www.hindawi.com Volume 2014
Theoretical ChemistryJournal of
Hindawi Publishing Corporationhttp://www.hindawi.com Volume 2014
Journal of
Spectroscopy
Analytical ChemistryInternational Journal of
Hindawi Publishing Corporationhttp://www.hindawi.com Volume 2014
Journal of
Hindawi Publishing Corporationhttp://www.hindawi.com Volume 2014
Quantum Chemistry
Hindawi Publishing Corporationhttp://www.hindawi.com Volume 2014
Organic Chemistry International
ElectrochemistryInternational Journal of
Hindawi Publishing Corporation http://www.hindawi.com Volume 2014
Hindawi Publishing Corporationhttp://www.hindawi.com Volume 2014
CatalystsJournal of