Classical Radiobiology and Normal Tissue Complication...
52
Classical Radiobiology and Normal Tissue Complication Analysis Kamil M. Yenice, PhD University of Chicago XV. Ulusal Medikal Fizik Kongresi, Trabzon
Transcript of Classical Radiobiology and Normal Tissue Complication...
Classical Radiobiology and Normal Tissue Complication Analysis
Kamil M. Yenice, PhD
University of Chicago
XV. Ulusal Medikal Fizik Kongresi, Trabzon

From energy transfer to final biological damage
Scattered photon
Radiation enters system
Primary interaction event
Interaction with:Biological molecule Water
Water radicals and other molecular species
Biological repopulation from surviving cells
Excitation and Ionization
Damage to important biological molecules
Fixation of damage
Enzymatic repair of molecular damage
Damage to other importantbiological molecules of interest
DiffusionDiffusion
Chemical restitution and repair
Physics(10-16 s)
Chemistry(up to 10-3 s)
Biochemistry, minutes
Biology, hours
Energy transfer(~ Dose)
Biological/chemical/biochemicaleffects
Time
A. Vitkin, PhD (Univ. of Toronto)

Overview
• Review of Classical Radiobiology
– Fractionation – 4Rs
– Cell survival curves and modeling
• Multi-target model
• Linear quadratic (LQ) model
• BED Concept
• NTCP
Kamil M. Yenice, PhD

Rationale For Fractionation: 4Rs
• Repair
(few hours)
• Redistribution
(few hours)
• Reoxygenation
(hours to few days)
• Repopulation
(5-7 weeks)
Radiosensitivity
Withers HR (1975), Adv Radiat Biol5: 241-7Kamil M. Yenice, PhD

Radiation Induced DNA Damage
• Radiation generates highly reactive oxygen species from water molecules. They are short lived and rapidly interact with biomolecules in cells.
• The clusters of ionizations occurring at the end of electron tracks, if happened within a few base pairs of DNA are very important in causing DNA damage
Kamil M. Yenice, PhD
Types of Damage
• Lethal – irreversible, irreparable, leads to cell death (loss of reproductive capacity)
• Sub-lethal (SLD*) – can be repaired within hours unless additional SLD occurs (such as a second dose of radiation); represents shoulder on cell survival curve.
• Potentially Lethal Damage – can be modified by the post-irradiation environment
*Repair of SLD spares late responding normal tissue preferentially
Kamil M. Yenice, PhD

Reoxygenation
• Increases tumor damage, no effect in normal tissues
Oxygen “fixes” the damage (making it permanent)
Extends the lifetime of free radicals
Fractionation allows O2 to diffuse into the usually hypoxic center of an expanding tumor during the interval between fractions, and thus enables more tumor killing during subsequent treatment
Kamil M. Yenice, PhD

Repopulation
• Acute responding normal tissue– Prolonging treatment time spares acute responding
normal tissue
– As treatment time is reduced, acute responding tissue becomes dose-limiting
• Late responding normal tissue– Prolonging overall treatment time beyond 6 weeks
has little effect, but prolonging time to retreatment my increase tissue tolerance
• Danger of tumor population
Kamil M. Yenice, PhD

Redistribution
• Cells exhibit differential radiation sensitivity while in different phase of the cell cycle
• After an initial fraction of dose the cells at a resistant phase may survive but then proceed in time eventually to the sensitive phases
• Increases acute and tumor damage, no effect on late responding normal tissue
Kamil M. Yenice, PhD

Experiments of Warren Sinclair: Survival curves during cell cycle
M > G2 > G1 > early S > Late S for sensitivityMost radiosensitive: G2 and MMammalian cell cycle times: 10-20 hrs (G1 – most variable)
Kamil M. Yenice, PhD
Meaning of survival-how to quantify damage?
MEANING of SURVIVAL
for differential cells,loss of a specific function
for proliferating cells,loss of ability to divide
infinitely
for a tumor to be eradicated, it is only necessary to destroyits proliferating capacity
in general, we need an average ~ 100 Gy to destroy cellfunction but ~ 2 Gy or less to destroy proliferating capacitydependence on oxygen, repair, cell kinetics (the 4R’s)

Cell Survival Curves
• Biological effect can be quantified as a function of radiation dose
• Target-cell hypothesis
– There exist within each cell critical targets, which when hit by ionizing radiation in a random fashion may lead to consequential loss of cellular reproductive integrity
Kamil M. Yenice, PhD
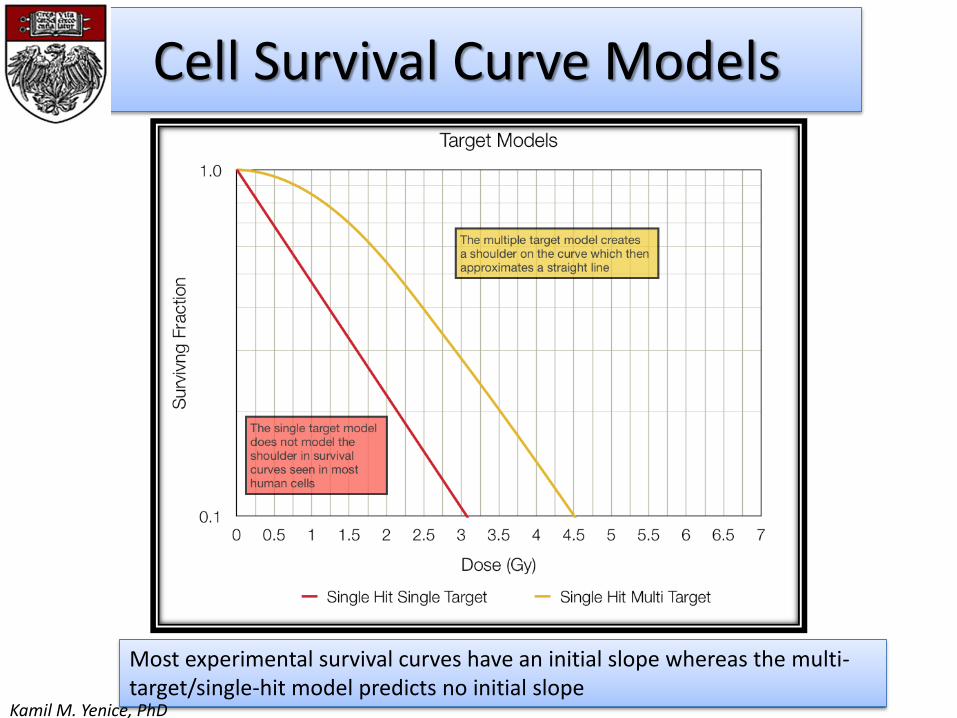
Cell Survival Curve Models
Most experimental survival curves have an initial slope whereas the multi-target/single-hit model predicts no initial slope
Kamil M. Yenice, PhD
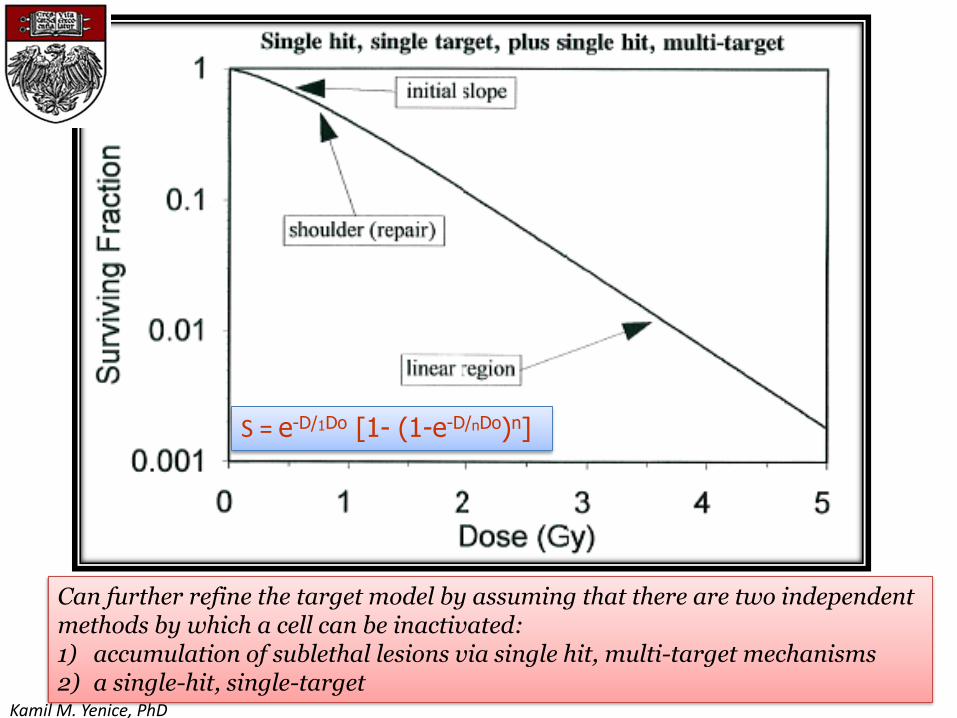
Single hit, single target plus single hit, multitarget survival curve, with
1D0 =2.5 Gy, nD0 =1.0 Gy, and n=2. Note the negative initial slope.
Can further refine the target model by assuming that there are two independentmethods by which a cell can be inactivated:1) accumulation of sublethal lesions via single hit, multi-target mechanisms2) a single-hit, single-target
S = e-D/1Do [1- (1-e-D/nDo)n]
Kamil M. Yenice, PhD
Linear Quadratic Model
• Lea and Catchside (1942): “Radiation-induced chromosome aberrations in …..”
• Originally called the “Theory of Dual Radiation Action” by Kellerer and Rossi in describing high vs. low LET radiation (1972)
• Cell kill contributions from linear and quadratic terms - Fits the shoulder very well
• DNA double strand breaks incorporated as mechanism of cell inactivation
Kamil M. Yenice, PhD
The Linear Quadratic Model
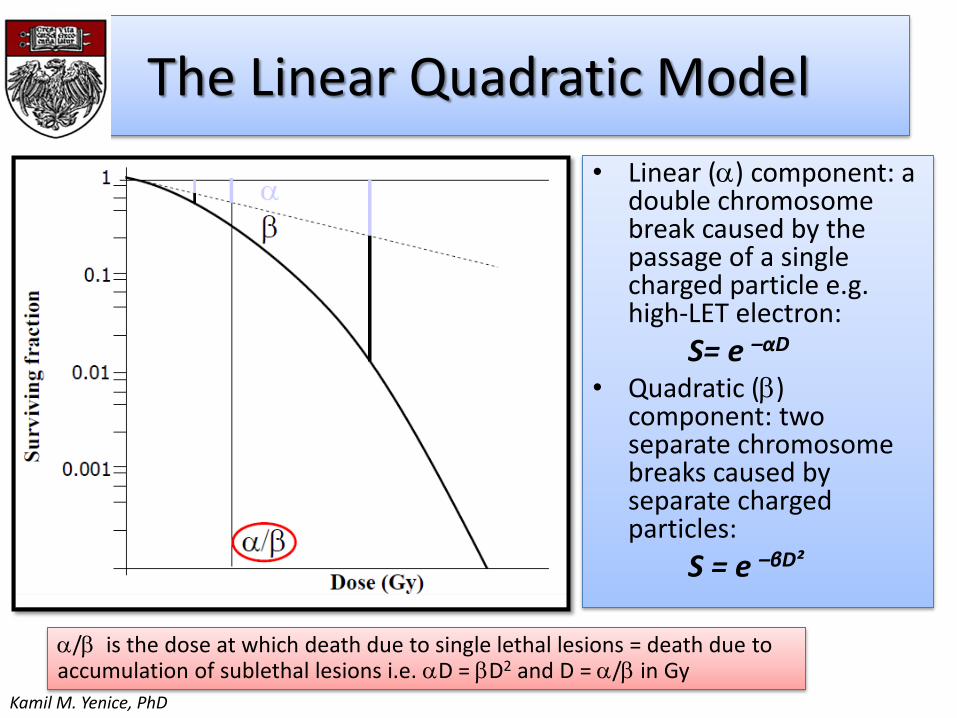
• Linear (a) component: a double chromosome break caused by the passage of a single charged particle e.g. high-LET electron:
S= e –αD
• Quadratic (b) component: two separate chromosome breaks caused by separate charged particles:
S = e –βD²
a/b is the dose at which death due to single lethal lesions = death due toaccumulation of sublethal lesions i.e. aD = bD2 and D = a/b in Gy
Kamil M. Yenice, PhD
Kamil M. Yenice, PhD

Response to Radiation
• The slope of an isoeffect curve changes with size of dose per fraction depending on tissue type (Thames et al IJROBP 8: 219, 1982)
• Acute responding tissues have flatter curves than do late responding tissues
• ab measures the sensitivity of tumor or tissue to fractionation i.e. it predicts how total dose for a given effect will change when you change the size of dose fraction
Reciprocal
total dose
for an isoeffect
Dose per fraction
Intercept = a
Slope = b
Douglas and Fowler Rad Res 66:401, 1976
Showed and easy way to arrive at an ab ratio
Kamil M. Yenice, PhD
Sensitivity of Tissue to Dose Fractionation: abratio
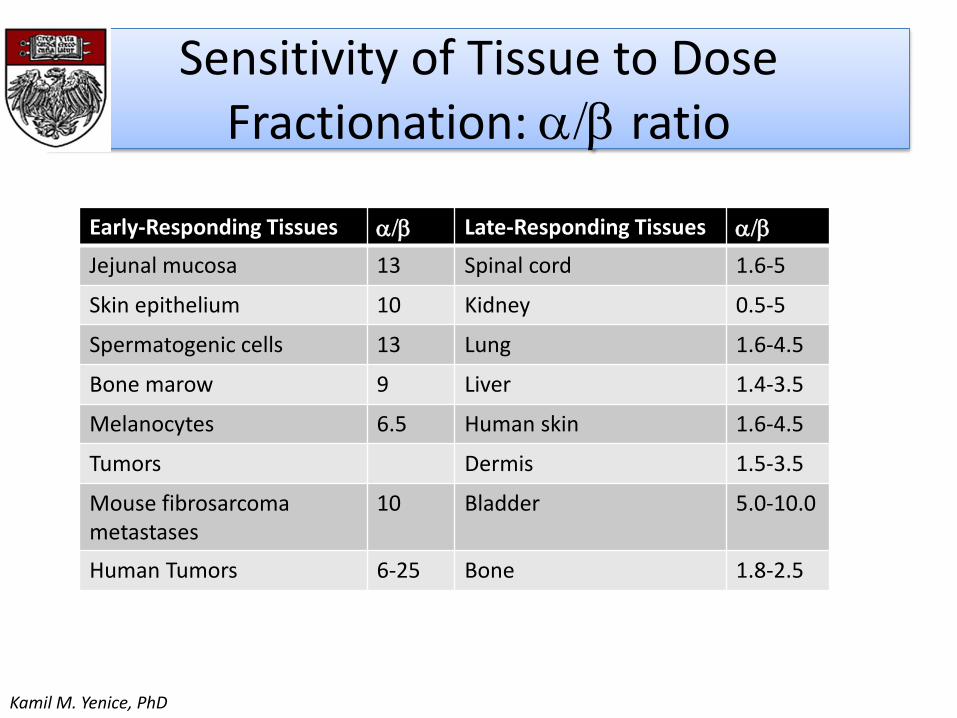
Early-Responding Tissues ab Late-Responding Tissues ab
Jejunal mucosa 13 Spinal cord 1.6-5
Skin epithelium 10 Kidney 0.5-5
Spermatogenic cells 13 Lung 1.6-4.5
Bone marow 9 Liver 1.4-3.5
Melanocytes 6.5 Human skin 1.6-4.5
Tumors Dermis 1.5-3.5
Mouse fibrosarcomametastases
10 Bladder 5.0-10.0
Human Tumors 6-25 Bone 1.8-2.5
Kamil M. Yenice, PhD

Response to Fractionation Varies With Tissue
16128400
.01
.1
1
Dose (Gy)
S.F.
Late Responding
Tissues - ab= 2Gy
Acute Responding
Tissues ab= 10Gy
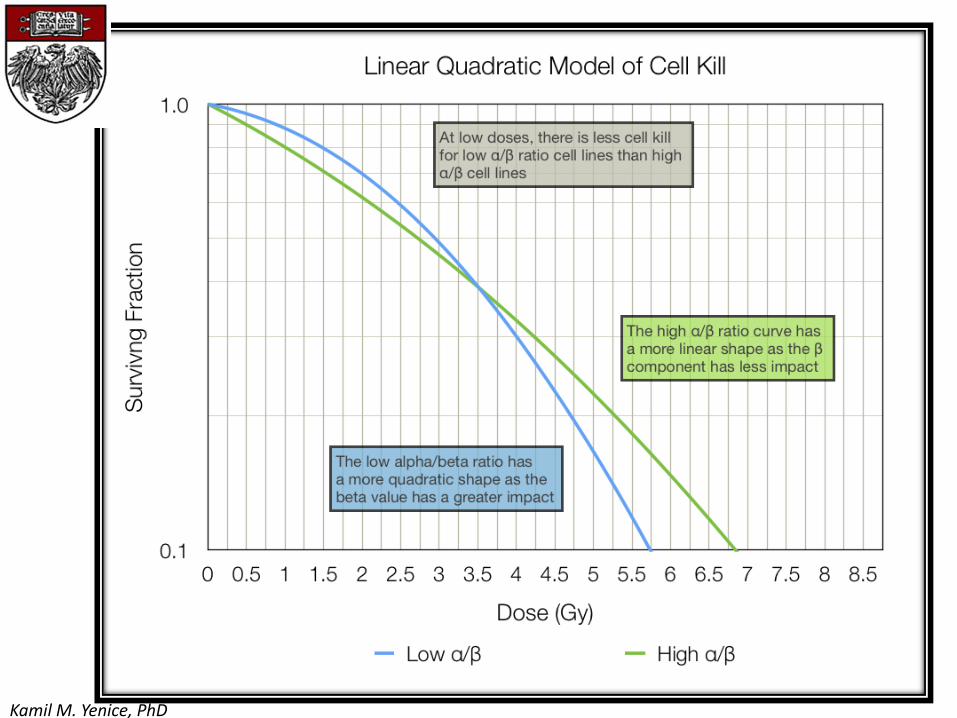
a/b is high (>6Gy) when survival
curve is almost exponential and low
(1-4Gy) when shoulder is wide
2016128400.01
.1
1
Dose (Gy)
S.F.
Single Dose
Late Effects
ab= 2Gy
Single Dose
Acute Effects
ab= 10Gy
Fractionated
Late Effects
Fractionated
Acute Effects
If α⁄β ratio of tumor is the same or less than that of the critical normal tissue, then a
larger dose per fraction (hypofractionation) is preferred, i.e., prostate cancer, breast
cancer
If α⁄β ratio of tumor is high (often 10 or greater) and > α⁄β ratio of normal tissue (often <
5) a lower dose per fraction (hyperfractionation) is preferred, i.e., squamous. Ca. H&N
Kamil M. Yenice, PhD
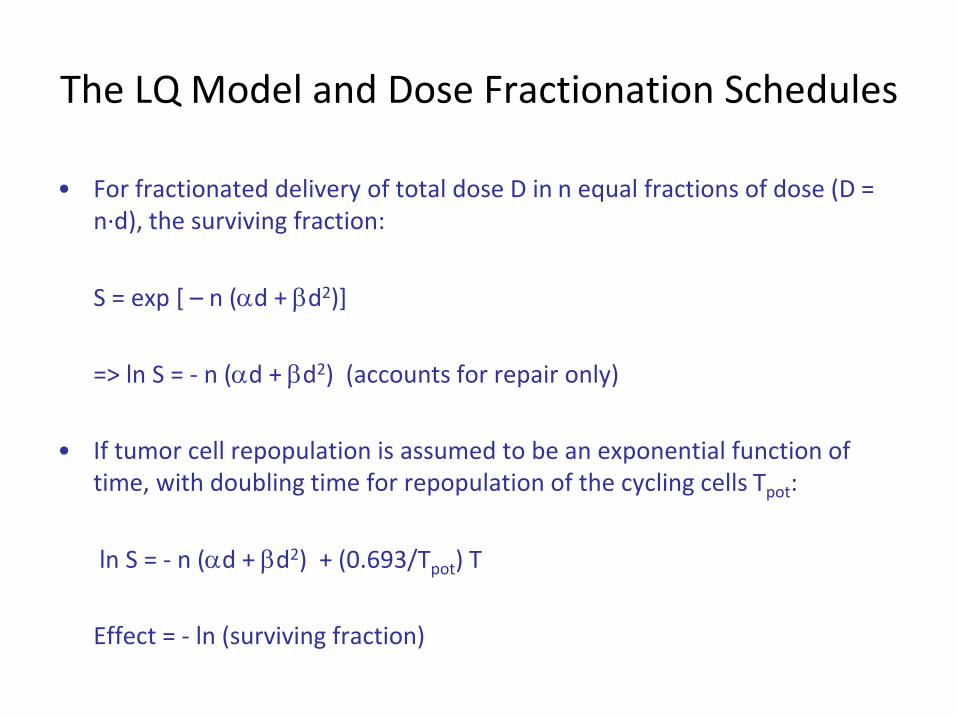
The LQ Model and Dose Fractionation Schedules
• For fractionated delivery of total dose D in n equal fractions of dose (D = n∙d), the surviving fraction:
S = exp [ – n (ad + bd2)]
=> ln S = - n (ad + bd2) (accounts for repair only)
• If tumor cell repopulation is assumed to be an exponential function of time, with doubling time for repopulation of the cycling cells Tpot:
ln S = - n (ad + bd2) + (0.693/Tpot) T
Effect = - ln (surviving fraction)

The LQ Model and Dose Fractionation Schedules
ln S aBED nd 1d
a b
0.693T
aTpot
a and Tpot vary considerably from patient to patient. A genericrepopulation parameter (k) is more useful. Typically, k varies from 0.1 Gyto 0.6 Gy for slowly growing and rapidly repopulating tumors, respectively
Biologically equivalent dose (BED):
)(1 kTTkd
dnBED
ba
Tk = kick-in time; k =0 for T < Tk

The LQ Model and Dose Fractionation Schedules
where n1 an d1 are number of fractions and fractional dose for schedule 1, and similarly for schedule 2.
Two treatment schedules have the same biological effect provided:
)(1)(1 2211 kk TTkd
dnTTkd
dn
baba

Biologically Effective Dose (BED)
Biologically Effective Dose
Total dose
RelativeEffectiveness
S.F. = e-E = e-(aD+bD2)
E = nd(a + bd)
E/a = nd(1+d/ab)
35 x 2Gy = B.E.D.of 84Gy10 and 117Gy3
NOTE: 3 x 15Gy = B.E.D.of 113Gy10 and 270Gy3Normalized total dose2Gy
= BED/RE
= BED/1.2 for ab of 10Gy
= BED/1.67 for abof 3Gy
Equivalent to 162 Gy in 2Gy Fx -unrealistic!(Fowler et al IJROBP 60: 1241, 2004)

What total dose (D) to give if the dose/fx (d) is changed
New OldDnew (dnew + ab) = Dold (dold +ab)
So, for late responding tissue, what total dose in 1.5Gy fractions is equivalent to 66Gy in 2Gy fractions?
Dnew (1.5+2) = 66 (2 + 2)
Dnew = 75.4Gy
NB: Small differences in ab for late responding tissues can make a big difference in estimated D!
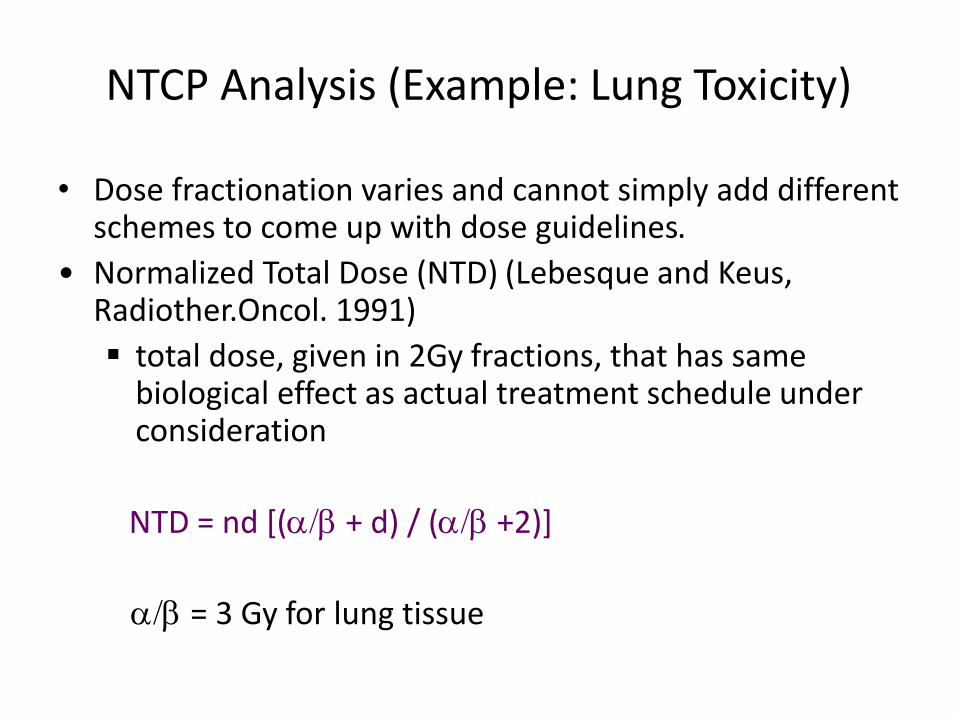
NTCP Analysis (Example: Lung Toxicity)
• Dose fractionation varies and cannot simply add different schemes to come up with dose guidelines.
• Normalized Total Dose (NTD) (Lebesque and Keus, Radiother.Oncol. 1991)
total dose, given in 2Gy fractions, that has same biological effect as actual treatment schedule under consideration
NTD = nd [(ab + d) / (ab +2)]
ab= 3 Gy for lung tissue
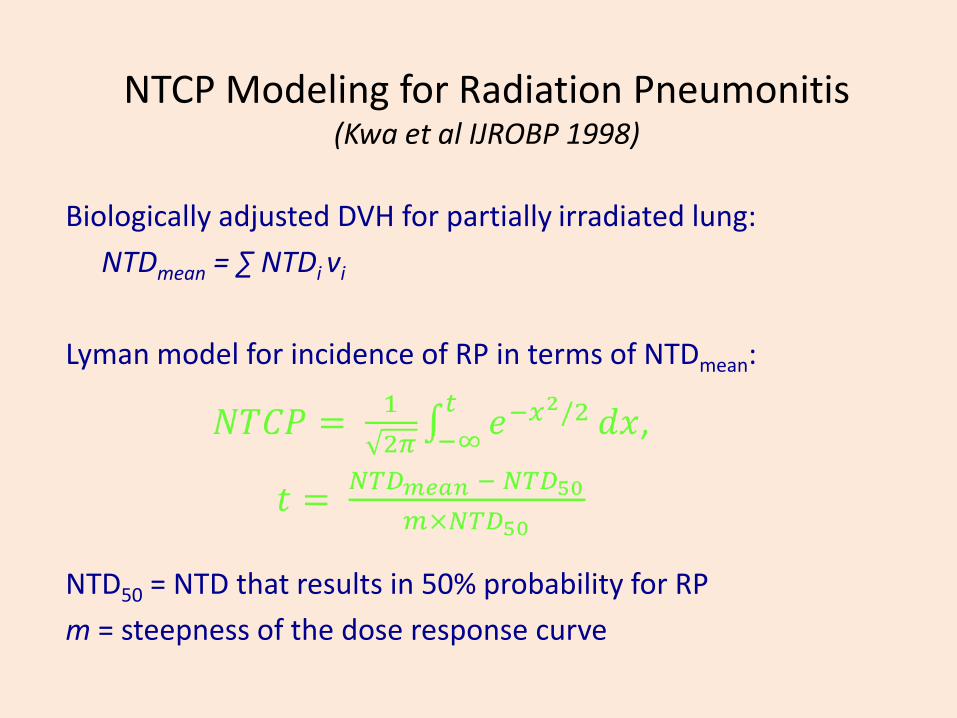
NTCP Modeling for Radiation Pneumonitis (Kwa et al IJROBP 1998)
Biologically adjusted DVH for partially irradiated lung:
NTDmean = ∑ NTDi vi
Lyman model for incidence of RP in terms of NTDmean:
NTD50 = NTD that results in 50% probability for RP
m = steepness of the dose response curve

Maximum Likelihood Fit of NTCP Model to Data

Maximum Likelihood Fit Results
0,0
0,1
0,2
0,3
0,4
0,5
0,6
0,7
0,8
0,9
1,0
0 5 10 15 20 25 30
NTC
P
Mean NTD (Gy)
NTCP vs. Mean NTD
Confidence intervals calculated by profile maximum likelihood method
--- MLE fit- - 68% CI

Summary
• LQ model is useful in the fractional dose regime of 1-8 Gy
• It provides a simple and operational mechanistic model
• Explains the clinical data in terms of classical radiobiological concepts
• NTCP/TCP models provides more reasonable tools for design of appropriate treatment schedules
Kamil M. Yenice, PhD
Radiobiology of SBRT/SRS
Kamil M. Yenice, PhD
University of Chicago
XV. Ulusal Medikal Fizik Kongresi, Trabzon
Current issues
• What is the biological basis of potent hypofractionation used in SRS and SBRT?
• Does LQ model work at high doses?
• What effect does occur increasingly at higher doses per fraction?
• Are “4Rs” of radiobiology still relevant to SRS/SBRT regimens?
Kamil M. Yenice, PhD
Fractionation Schemes
• Conventional– Daily dose: 1.8 – 2 Gy– Total Dose: 40 – 70 Gy– increase dose to the tumor while PRESERVING NORMAL TISSUE FUNCTION
• Hypofractionation– Dose per fraction > 2.2 Gy (3-6 Gy)– Reduced total number of fractions (10-15)– Rationale: tumor has low ab ratio and there is no therapeutic advantage to
be gained with respect to late complications
• Extreme Hypofractionation/SRS/Ablative– Daily dose: 10-30 Gy– Number of fractions: 1-5 – Overwhelm tumor repair capacity – Causes “late” effects that may be intolerable
Kamil M. Yenice, PhD

Comparisons between the effectsof different dose-fractionation schemes.
Total dose delivered in an infinite number of infinitesimally small dose fractions that has the same biologic effect as the dose-fractionation scheme in question.
Kamil M. Yenice, PhD

Predictions of Mathematical Modeling
Brown et al 2010 IJROBP: V 78, pp 323-327
Fowler et al 2004 IJROBP V60, pp1241-1256
Both studies suggested: if cell population is assumed to be mixed (20% hypoxic) and no reoxygenationoccurs, then currently used dose fractionations (SBRT) are not sufficient to control tumor!
Kamil M. Yenice, PhD

SRS: Clinical OutcomeTrigeminal Neuralgia
AVM Radiosurgery
Acoustic Neuroma
Kamil M. Yenice, PhD
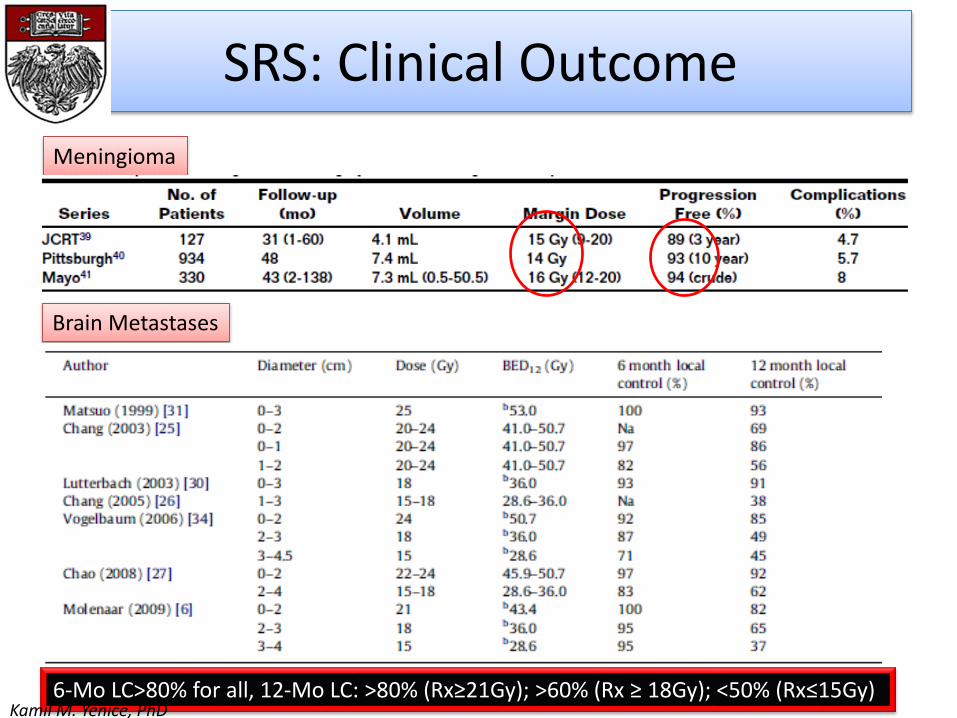
SRS: Clinical Outcome
Meningioma
Brain Metastases
6-Mo LC>80% for all, 12-Mo LC: >80% (Rx≥21Gy); >60% (Rx ≥ 18Gy); <50% (Rx≤15Gy)Kamil M. Yenice, PhD

SBRT: Clinical Outcome
Phase II trials of SBRT in early stage lung cancer
Phase II trials of SBRT for liver metastases
Kamil M. Yenice, PhD
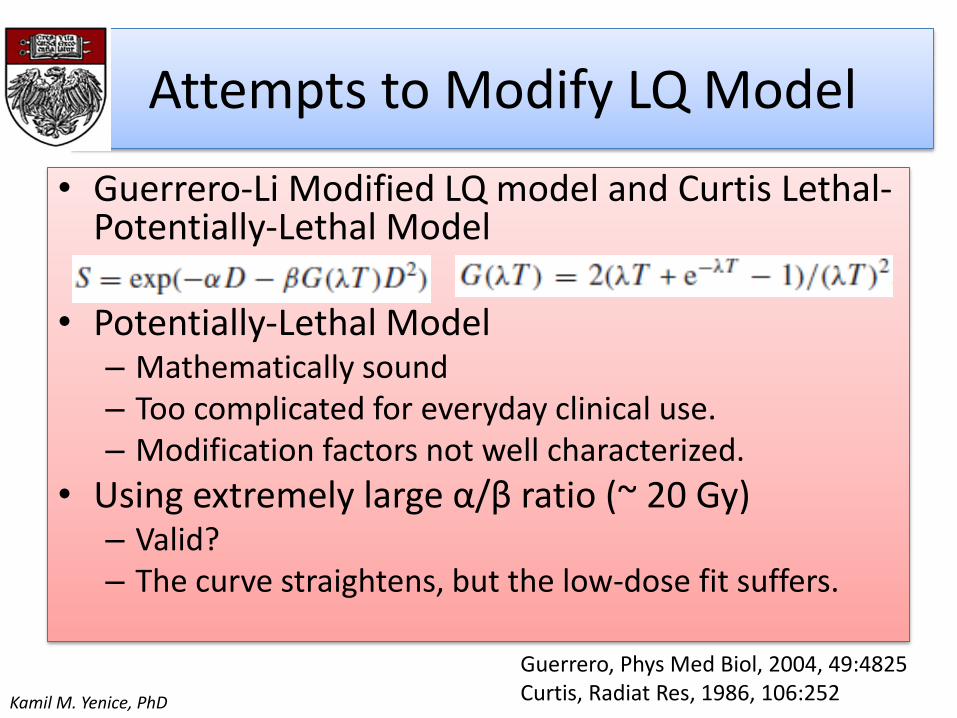
Attempts to Modify LQ Model
• Guerrero-Li Modified LQ model and Curtis Lethal-Potentially-Lethal Model
• Potentially-Lethal Model– Mathematically sound– Too complicated for everyday clinical use.– Modification factors not well characterized.
• Using extremely large α/β ratio (~ 20 Gy)– Valid?– The curve straightens, but the low-dose fit suffers.
Guerrero, Phys Med Biol, 2004, 49:4825Curtis, Radiat Res, 1986, 106:252Kamil M. Yenice, PhD

Universal Survival Curve
• Combine the LQ model with multi-target model at high dose
Universal Survival Curve(Park et al IJROBP, Volume 70, Number 3, 2008)
Kamil M. Yenice, PhD
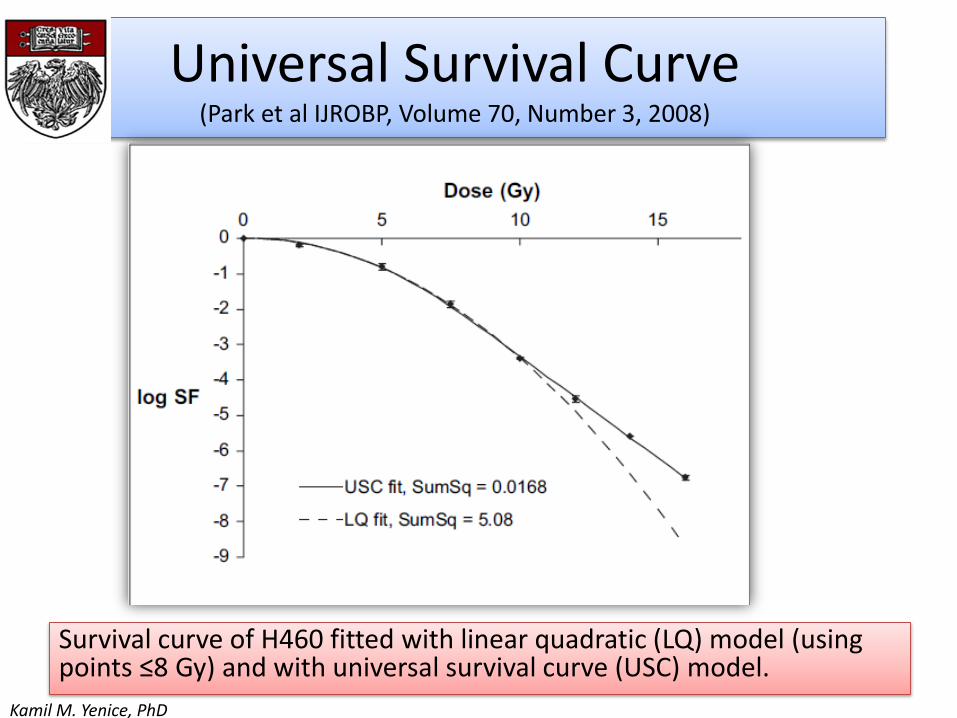
Universal Survival Curve(Park et al IJROBP, Volume 70, Number 3, 2008)
Survival curve of H460 fitted with linear quadratic (LQ) model (using points ≤8 Gy) and with universal survival curve (USC) model.
Kamil M. Yenice, PhD
Kamil M. Yenice, PhD

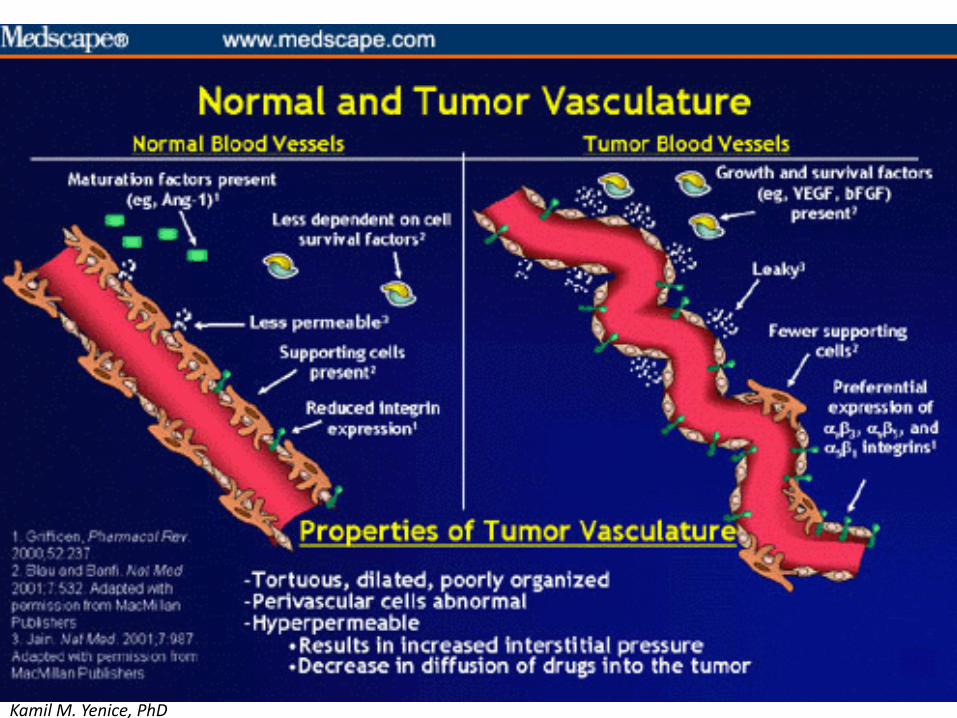
• vasculature associated with tumors is not normal
– The blood vessels in a tumor bed, generally speaking, are tortuous, dilated, and poorly organized
– The surrounding pericytes are abnormal. They tend to be hyperpermeable and leaky
Kamil M. Yenice, PhD

Vascular effects occur at high doses
2 Gy0 Gy
5 Gy 10 Gy
30 Gy 60 Gy
• Functional intravascularVolume
• Walker 256 tumors (s.c.)grown in legs ofSprague-Dawley rats
• Single dose radiation
Park HJ et al. Radiat Res 2012;177:311–27Kamil M. Yenice, PhD
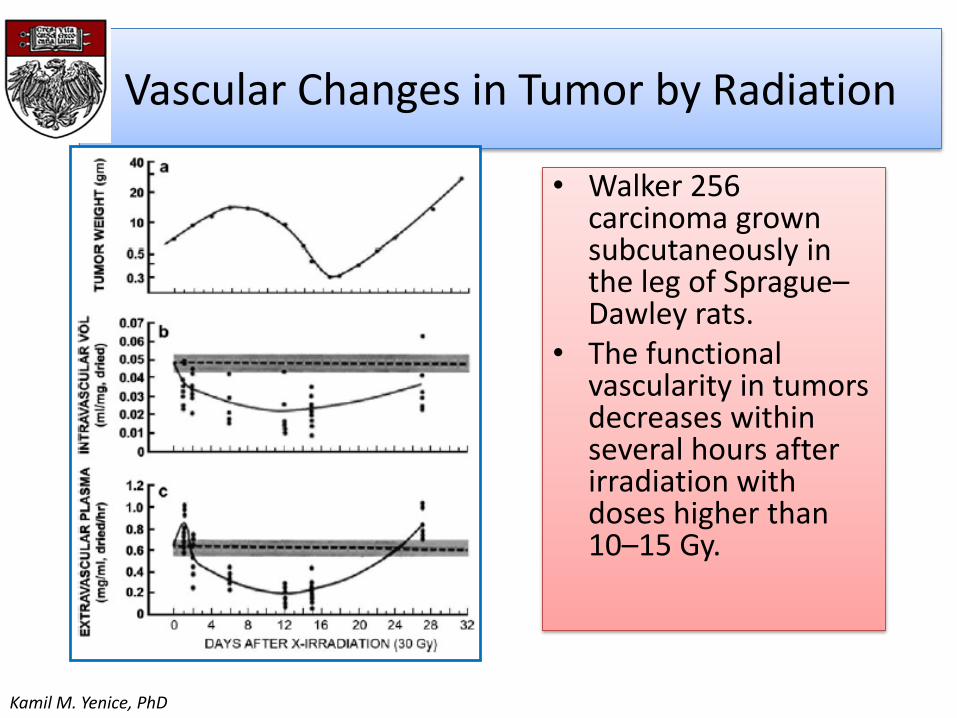
Vascular Changes in Tumor by Radiation
• Walker 256 carcinoma grown subcutaneously in the leg of Sprague–Dawley rats.
• The functional vascularity in tumors decreases within several hours after irradiation with doses higher than 10–15 Gy.
Kamil M. Yenice, PhD
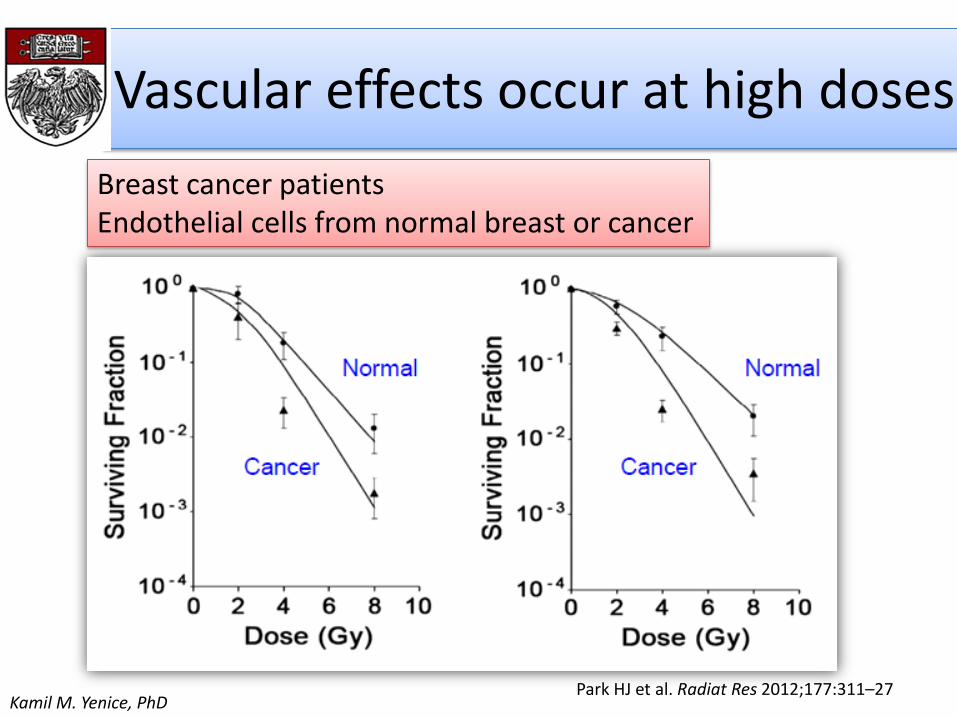
Vascular effects occur at high doses
Park HJ et al. Radiat Res 2012;177:311–27
Breast cancer patients Endothelial cells from normal breast or cancer
Kamil M. Yenice, PhD
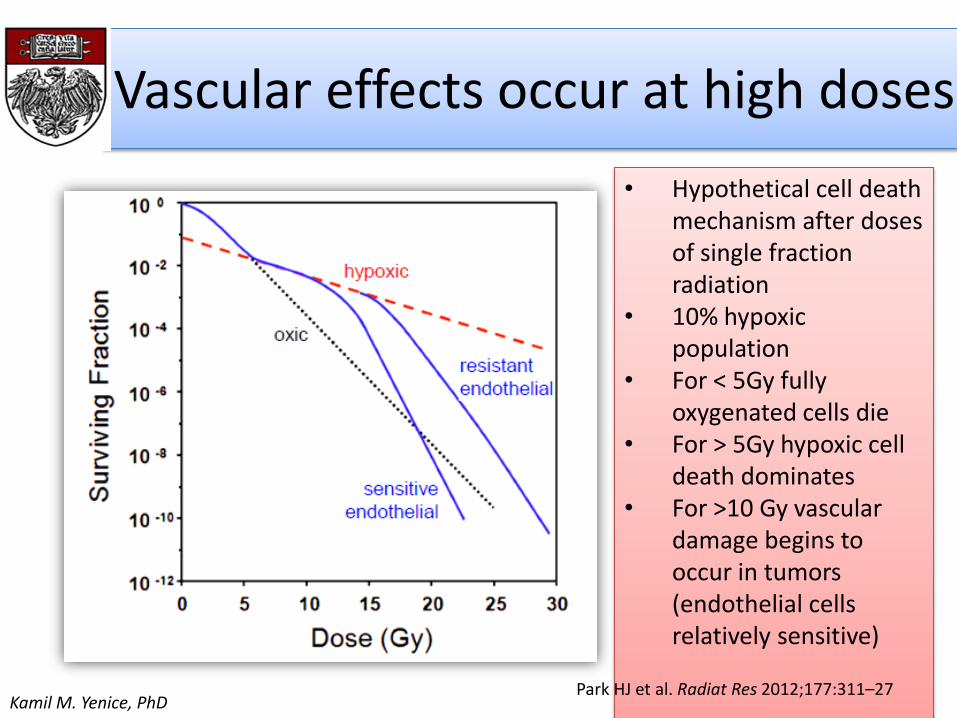
Vascular effects occur at high doses
• Hypothetical cell death mechanism after doses of single fraction radiation
• 10% hypoxic population
• For < 5Gy fully oxygenated cells die
• For > 5Gy hypoxic cell death dominates
• For >10 Gy vascular damage begins to occur in tumors (endothelial cells relatively sensitive)
Park HJ et al. Radiat Res 2012;177:311–27Kamil M. Yenice, PhD

Endothelial cell apoptosis at high doses
Kolesnick R & Fuks Z. Oncogene 2003;22:5587–906
HYPOTHESIS: Ceramide mediated Endothelial Apoptosis causes indirect cell kill at >10Gy!

The Role of Cancer Stem Cells
Cancer Cell 11, 69–82, January 2007Kamil M. Yenice, PhD
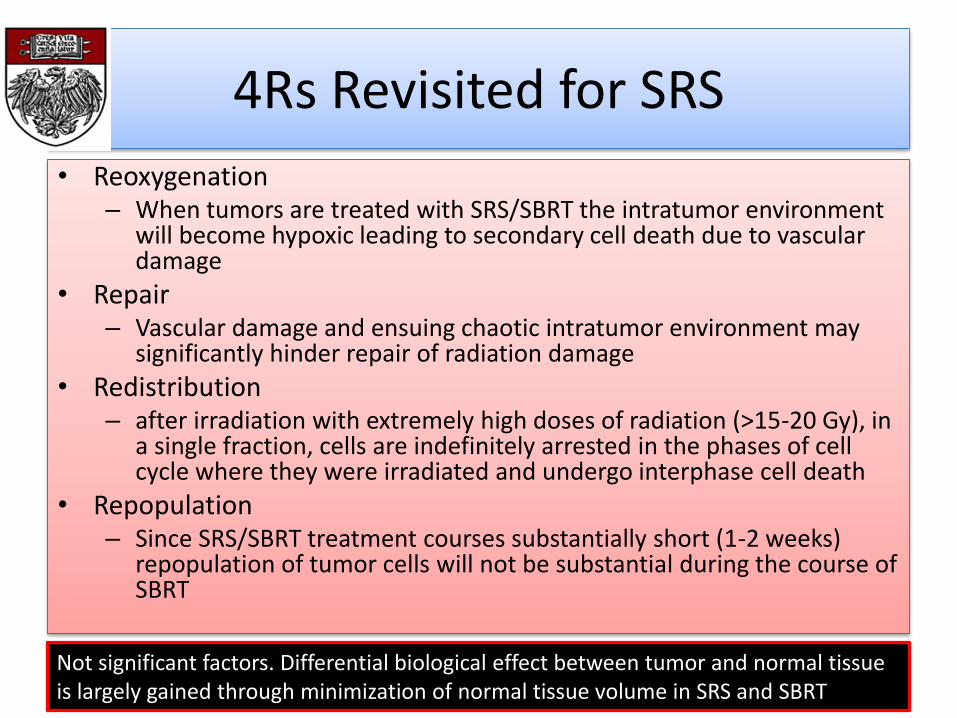
4Rs Revisited for SRS
• Reoxygenation– When tumors are treated with SRS/SBRT the intratumor environment
will become hypoxic leading to secondary cell death due to vascular damage
• Repair– Vascular damage and ensuing chaotic intratumor environment may
significantly hinder repair of radiation damage
• Redistribution– after irradiation with extremely high doses of radiation (>15-20 Gy), in
a single fraction, cells are indefinitely arrested in the phases of cell cycle where they were irradiated and undergo interphase cell death
• Repopulation– Since SRS/SBRT treatment courses substantially short (1-2 weeks)
repopulation of tumor cells will not be substantial during the course of SBRT
Not significant factors. Differential biological effect between tumor and normal tissue is largely gained through minimization of normal tissue volume in SRS and SBRT

Summary
• The LQ model cannot describe the response to very high doses because the predicted radiosensitivity would be too great
• Vascular effects occurs increasingly at higher doses per fraction• Extreme hypofractionated RT (SBRT/SABR) seems to be capable of
overcoming hypoxic radioprotection through mechanisms other than directly killing tumor cells via DNA damage.
• An important mechanism for cell inactivation has been *hypothesized* to be ceramide-mediated endothelial cell apoptosis which becomes important at doses >10 Gy
• A truly mechanistic radiobiological model for SRS/SBRT is currently lacking. The correct dosages for SS/SBRT should be chosen based on clinical experience and prospective trials that balance treatment efficacy against normal tissue toxicity
Kamil M. Yenice, PhD

Perspectives
Physicist
Oncologist/Biologist
Kamil M. Yenice, PhD