
Classical And Ab Initio Qm/mm Simulations Of Bacterial Enzymes · Wayne State University Wayne...
139
Wayne State University Wayne State University Dissertations 1-1-2015 Classical And Ab Initio Qm/mm Simulations Of Bacterial Enzymes Sajeewa Walimuni Dewage Wayne State University, Follow this and additional works at: hp://digitalcommons.wayne.edu/oa_dissertations Part of the Physical Chemistry Commons is Open Access Dissertation is brought to you for free and open access by DigitalCommons@WayneState. It has been accepted for inclusion in Wayne State University Dissertations by an authorized administrator of DigitalCommons@WayneState. Recommended Citation Walimuni Dewage, Sajeewa, "Classical And Ab Initio Qm/mm Simulations Of Bacterial Enzymes" (2015). Wayne State University Dissertations. Paper 1173.
Transcript of Classical And Ab Initio Qm/mm Simulations Of Bacterial Enzymes · Wayne State University Wayne...
Wayne State University
Wayne State University Dissertations
1-1-2015
Classical And Ab Initio Qm/mm Simulations OfBacterial EnzymesSajeewa Walimuni DewageWayne State University,
Follow this and additional works at: http://digitalcommons.wayne.edu/oa_dissertations
Part of the Physical Chemistry Commons
This Open Access Dissertation is brought to you for free and open access by DigitalCommons@WayneState. It has been accepted for inclusion inWayne State University Dissertations by an authorized administrator of DigitalCommons@WayneState.
Recommended CitationWalimuni Dewage, Sajeewa, "Classical And Ab Initio Qm/mm Simulations Of Bacterial Enzymes" (2015). Wayne State UniversityDissertations. Paper 1173.

CLASSICAL AND AB INITIO QM/MM SIMULATIONS OF BACTERIAL ENZYMES
by
SAJEEWA WALIMUNI DEWAGE
DISSERTATION
Submitted to the Graduate School
of Wayne State University,
Detroit, Michigan
in partial fulfillment of the requirements
for the degree of
DOCTOR OF PHILOSOPHY
2015
MAJOR: CHEMISTRY (Physical)
Approved by:
Advisor Date

© COPYRIGHT BY
SAJEEWA WALIMUNI DEWAGE
2015
All Rights Reserved

ii
DEDICATION
To my parents

iii
ACKNOWLEDGEMENTS
First of all I would like to thank my great advisor Professor Andres
Cisneros for his fatherly guidance, help and support throughout my stay in the
PhD program. I admire him both for his knowledge and humane qualities. I have
learned a lot from him both academically and otherwise.
I would like to thank Professor Tamara Hendrickson and Liangjun Zhao,
the wonderful collaborators with whom I have conducted most of my research. I
have learned a lot in terms of biochemistry through the collaborative work carried
out with them.
I am very much grateful to all other members in my committee, Professor
Bernhard Schlegel and Professor Jefrrey Potoff as well as all other collaborators,
Professor Oleg Tsodikov, Professor Juri Gelovani and Robin Bonomi.
All the current and former members of the Cisneros group are immensely
appreciated for the great friendship. My special thanks go to Dong Fang and
Rebecca Swett who have offered great help in carrying out my research.
All the members of the Schlegel group and Chernyak group are
appreciated for their friendship as well as participation in joint group meetings.
Finally and most importantly I would like to thank my parents and my sister
who have been a great inspiration for me in pushing me forward in times of
distress.

iv
TABLE OF CONTENTS
DEDICATION........................................................................................................ ii
ACKNOWLEDGEMENTS ................................................................................... iii
LIST OF TABLES .............................................................................................. viii
LIST OF FIGURES .............................................................................................. ix
CHAPTER 1 ......................................................................................................... 1
INTRODUCTION AND OVERVIEW ..................................................................... 1
1.1 GatCAB system ........................................................................................... 1
1.2 PPase system .............................................................................................. 4
1.3 HDACs ......................................................................................................... 6
1.4 Computational methods ............................................................................... 9
1.4.1 Molecular dynamics (MD) ...................................................................... 9
1.4.2 CAVER tunnel calculations ................................................................. 12
1.4.3 Umbrella sampling20 ............................................................................ 13
1.4.4 Weighted histogram analysis method (WHAM) ................................... 14
1.4.5 QM/MM hybrid method ........................................................................ 16
1.4.6 Molecular docking ............................................................................... 19
CHAPTER 2 ....................................................................................................... 22
ANALYSIS OF THE COMMUNICATION BETWEEN GATA AND GATB
SUBUNITS OF THE ENZYME GLUTAMINE-DEPENDENT
AMIDOTRANSFERASE (GATCAB) IN HELICOBACTER PYLORI (H. PYLORI)
............................................................................................................................ 22
2.1 Introduction ................................................................................................ 22

v
2.2 Experimental findings ................................................................................ 25
2.3 Computational methods and analyses ....................................................... 26
2.3.1 Molecular dynamics (MD) simulations ................................................. 26
2.3.2 Residue-wise correlation studies ......................................................... 27
2.3.3 Residue-wise root mean square deviation (RMSD) studies ................ 28
2.4 Results and discussion .............................................................................. 28
2.4.1 Residue-wise correlation studies ......................................................... 28
2.4.2 Residue-wise root mean square deviation (RMSD) studies ................ 34
2.5 Conclusions ............................................................................................... 40
CHAPTER 3 ....................................................................................................... 41
ANALYSIS OF D185(A) AS A PROBABLE CATALYTIC RESIDUE IN THE
AMMONIA DELIVERY MECHANISM OF HELICOBACTER PYLORI
GLUTAMINE-DEPENDENT AMIDOTRANSFERASE (GATCAB) ..................... 41
3.1 Introduction ................................................................................................ 41
3.2 Experimental findings ................................................................................ 42
3.3 Computational analyses ............................................................................ 43
3.3.1 MD simulations .................................................................................... 43
3.3.2 Residue-wise correlation analyses ...................................................... 44
3.3.3 pKa analyses ....................................................................................... 44
3.4 Results and discussion .............................................................................. 44
3.4.1 Residue-wise correlation analyses ...................................................... 44
3.4.1 pKa calculations ................................................................................... 46
3.5 Conclusions ............................................................................................... 47

vi
CHAPTER 4 ....................................................................................................... 49
COMPUTATIONAL ANALYSIS OF AMMONIA TRANSFER ALONG TWO
INTRA-MOLECULAR TUNNELS IN STAPHYLOCOCCUS AUREUS
GLUTAMINE-DEPENDENT AMIDOTRANSFERASE (GATCAB) ..................... 49
4.1 Introduction ................................................................................................ 49
4.2 Methods ..................................................................................................... 51
4.2.1 Molecular dynamics simulations on wild-type and mutant structures .. 51
4.2.2 CAVER analysis .................................................................................. 52
4.2.3 Umbrella sampling and WHAM calculations ........................................ 53
4.2.4 Energy decomposition analysis and adaptive Poisson-Boltzmann solver
calculations .................................................................................................. 56
4.3 Results and Discussion ............................................................................. 57
4.3.1 Probability of occurrence of tunnel1 and tunnel2 ................................ 57
4.3.2 Free energy profiles for ammonia transport along tunnel1 and tunnel2
..................................................................................................................... 59
4.4 Conclusions ............................................................................................... 74
CHAPTER 5 ....................................................................................................... 76
QUANTUM MECHANICAL/MOLECULAR MECHANICAL (QM/MM)
INVESTIGATION OF MYCOBACTERIUM TUBERCULOSIS INORGANIC
PYROPHOSPHATASE (PPASE) MECHANISM ................................................ 76
5.1 Introduction ................................................................................................ 76
5.2 Experimental findings ................................................................................ 78
5.3 Computational procedure .......................................................................... 80

vii
5.4 Results and discussion .............................................................................. 83
5.5 Conclusions ............................................................................................... 87
CHAPTER 6 ....................................................................................................... 89
COMPUTATIONAL ANALYSIS OF THE BINDING AFFINITY OF NOVEL
SUBSTRATES FOR HDAC CLASS IIA ENZYMES ........................................... 89
6.1 Introduction ................................................................................................ 89
6.2 Experimental findings ................................................................................ 90
6.3 Computational procedure .......................................................................... 91
6.4 Results and discussion .............................................................................. 92
6.5 Conclusions ............................................................................................... 94
REFERENCES ................................................................................................... 95
ABSTRACT ...................................................................................................... 122
AUTOBIOGRAPHY STATEMENT ................................................................... 125
viii
LIST OF TABLES
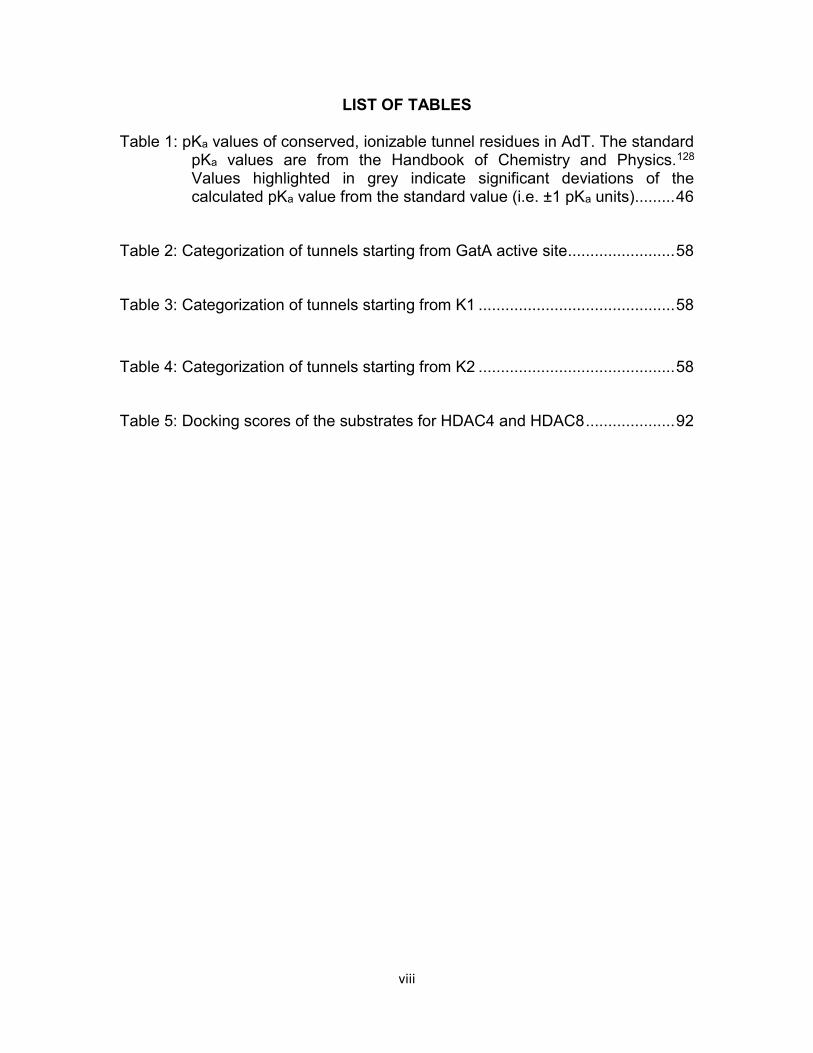
Table 1: pKa values of conserved, ionizable tunnel residues in AdT. The standard pKa values are from the Handbook of Chemistry and Physics.128 Values highlighted in grey indicate significant deviations of the calculated pKa value from the standard value (i.e. ±1 pKa units) ......... 46
Table 2: Categorization of tunnels starting from GatA active site........................ 58
Table 3: Categorization of tunnels starting from K1 ............................................ 58
Table 4: Categorization of tunnels starting from K2 ............................................ 58
Table 5: Docking scores of the substrates for HDAC4 and HDAC8 .................... 92
ix
LIST OF FIGURES
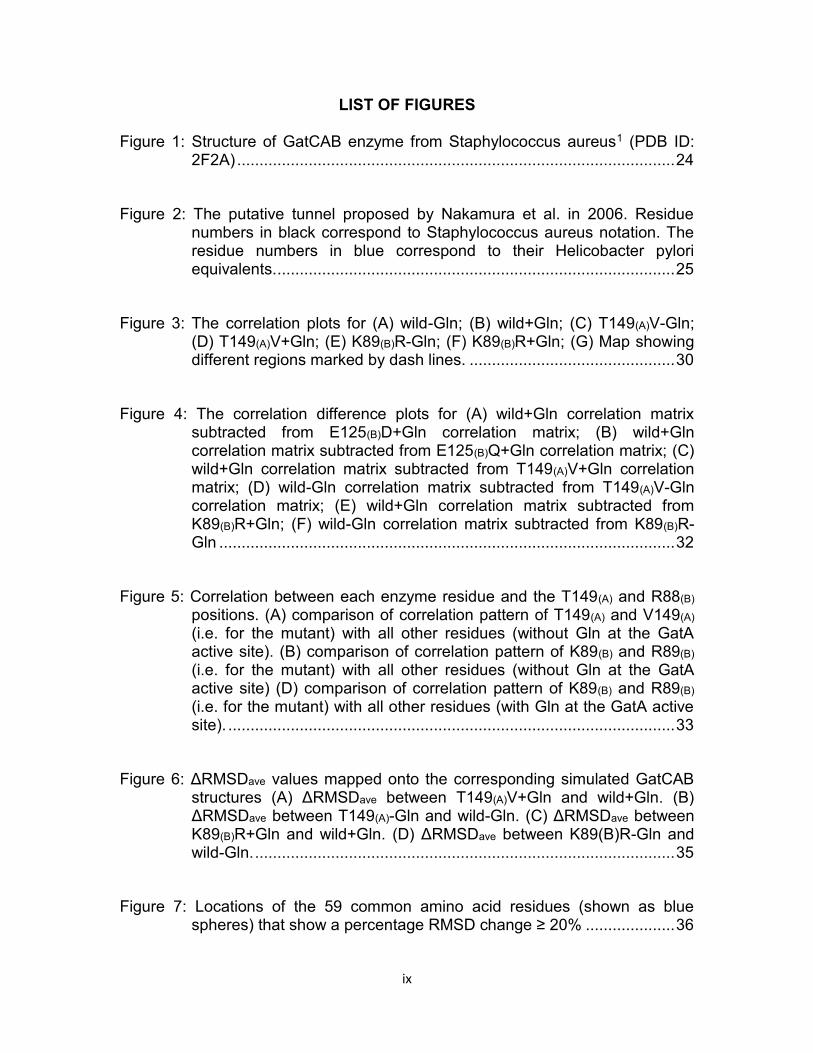
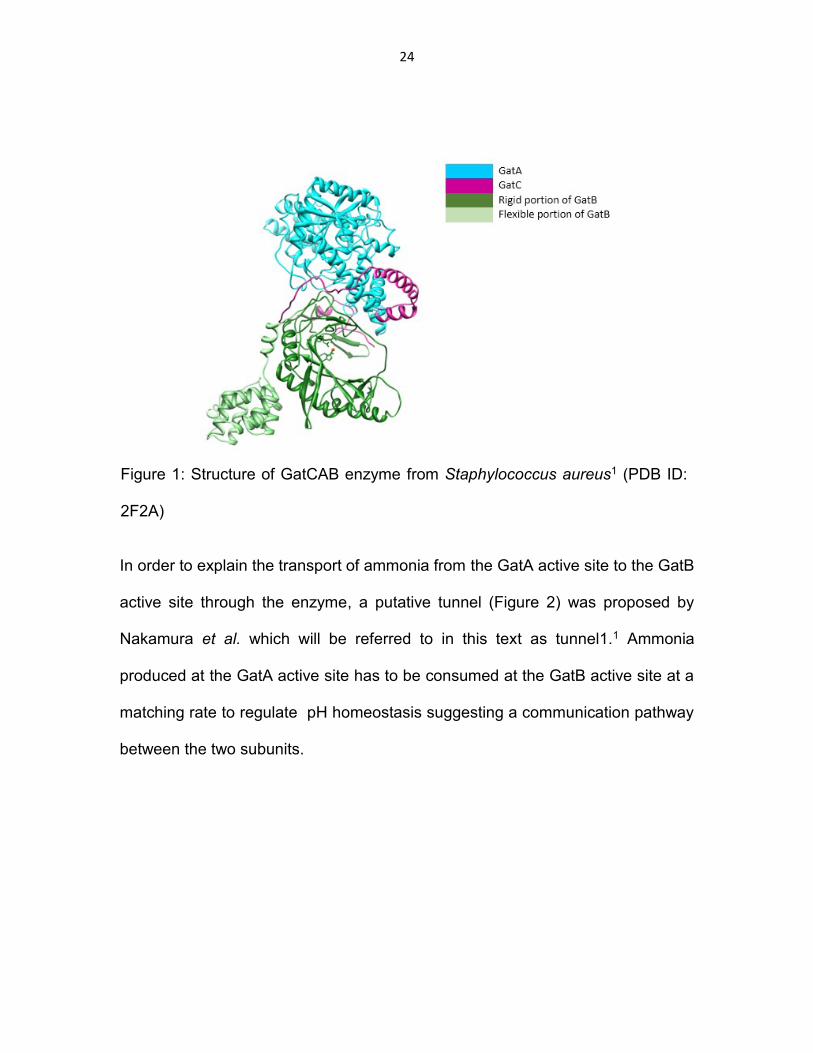
Figure 1: Structure of GatCAB enzyme from Staphylococcus aureus1 (PDB ID: 2F2A) .................................................................................................. 24
Figure 2: The putative tunnel proposed by Nakamura et al. in 2006. Residue numbers in black correspond to Staphylococcus aureus notation. The residue numbers in blue correspond to their Helicobacter pylori equivalents. ......................................................................................... 25
Figure 3: The correlation plots for (A) wild-Gln; (B) wild+Gln; (C) T149(A)V-Gln; (D) T149(A)V+Gln; (E) K89(B)R-Gln; (F) K89(B)R+Gln; (G) Map showing different regions marked by dash lines. .............................................. 30
Figure 4: The correlation difference plots for (A) wild+Gln correlation matrix subtracted from E125(B)D+Gln correlation matrix; (B) wild+Gln correlation matrix subtracted from E125(B)Q+Gln correlation matrix; (C) wild+Gln correlation matrix subtracted from T149(A)V+Gln correlation matrix; (D) wild-Gln correlation matrix subtracted from T149(A)V-Gln correlation matrix; (E) wild+Gln correlation matrix subtracted from K89(B)R+Gln; (F) wild-Gln correlation matrix subtracted from K89(B)R-Gln ...................................................................................................... 32
Figure 5: Correlation between each enzyme residue and the T149(A) and R88(B) positions. (A) comparison of correlation pattern of T149(A) and V149(A) (i.e. for the mutant) with all other residues (without Gln at the GatA active site). (B) comparison of correlation pattern of K89(B) and R89(B) (i.e. for the mutant) with all other residues (without Gln at the GatA active site) (D) comparison of correlation pattern of K89(B) and R89(B) (i.e. for the mutant) with all other residues (with Gln at the GatA active site). .................................................................................................... 33
Figure 6: ΔRMSDave values mapped onto the corresponding simulated GatCAB structures (A) ΔRMSDave between T149(A)V+Gln and wild+Gln. (B) ΔRMSDave between T149(A)-Gln and wild-Gln. (C) ΔRMSDave between K89(B)R+Gln and wild+Gln. (D) ΔRMSDave between K89(B)R-Gln and wild-Gln. .............................................................................................. 35
Figure 7: Locations of the 59 common amino acid residues (shown as blue spheres) that show a percentage RMSD change ≥ 20% .................... 36
x
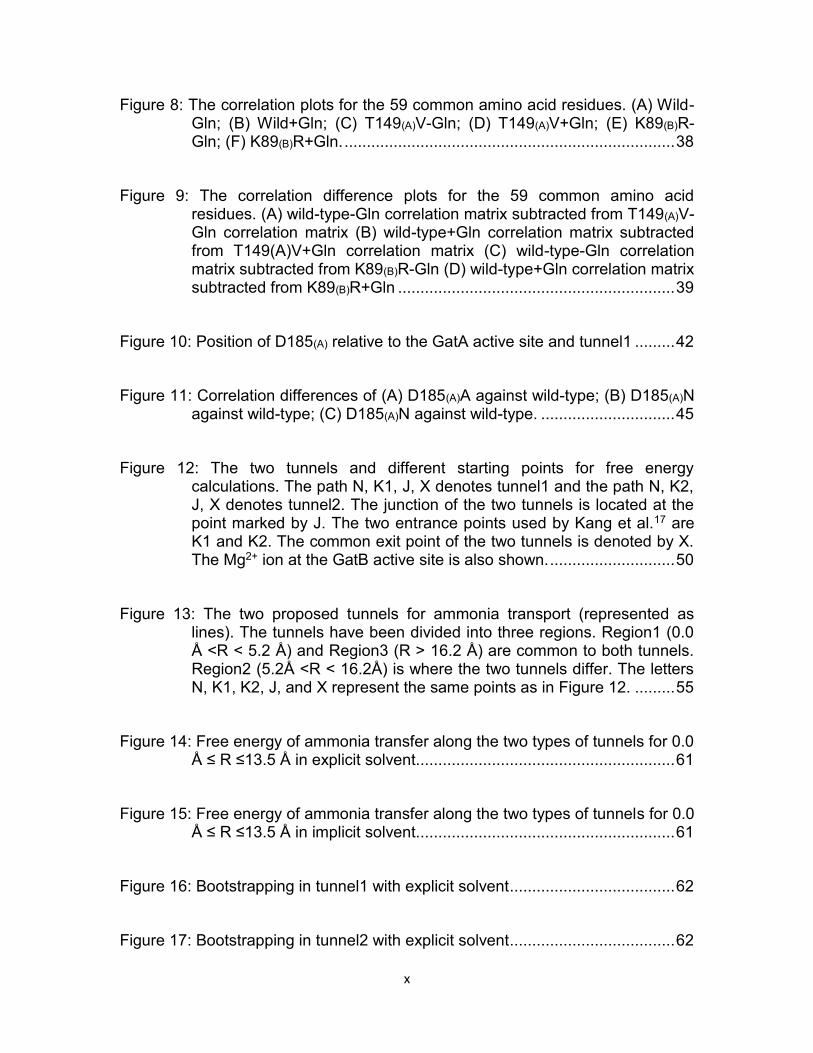
Figure 8: The correlation plots for the 59 common amino acid residues. (A) Wild-Gln; (B) Wild+Gln; (C) T149(A)V-Gln; (D) T149(A)V+Gln; (E) K89(B)R-Gln; (F) K89(B)R+Gln. .......................................................................... 38
Figure 9: The correlation difference plots for the 59 common amino acid residues. (A) wild-type-Gln correlation matrix subtracted from T149(A)V-Gln correlation matrix (B) wild-type+Gln correlation matrix subtracted from T149(A)V+Gln correlation matrix (C) wild-type-Gln correlation matrix subtracted from K89(B)R-Gln (D) wild-type+Gln correlation matrix subtracted from K89(B)R+Gln .............................................................. 39
Figure 10: Position of D185(A) relative to the GatA active site and tunnel1 ......... 42
Figure 11: Correlation differences of (A) D185(A)A against wild-type; (B) D185(A)N against wild-type; (C) D185(A)N against wild-type. .............................. 45
Figure 12: The two tunnels and different starting points for free energy calculations. The path N, K1, J, X denotes tunnel1 and the path N, K2, J, X denotes tunnel2. The junction of the two tunnels is located at the point marked by J. The two entrance points used by Kang et al.17 are K1 and K2. The common exit point of the two tunnels is denoted by X. The Mg2+ ion at the GatB active site is also shown. ............................ 50
Figure 13: The two proposed tunnels for ammonia transport (represented as lines). The tunnels have been divided into three regions. Region1 (0.0 Å <R < 5.2 Å) and Region3 (R > 16.2 Å) are common to both tunnels. Region2 (5.2Å <R < 16.2Å) is where the two tunnels differ. The letters N, K1, K2, J, and X represent the same points as in Figure 12. ......... 55
Figure 14: Free energy of ammonia transfer along the two types of tunnels for 0.0 Å ≤ R ≤13.5 Å in explicit solvent.......................................................... 61
Figure 15: Free energy of ammonia transfer along the two types of tunnels for 0.0 Å ≤ R ≤13.5 Å in implicit solvent.......................................................... 61
Figure 16: Bootstrapping in tunnel1 with explicit solvent ..................................... 62
Figure 17: Bootstrapping in tunnel2 with explicit solvent ..................................... 62

xi
Figure 18: Bootstrapping in tunnel1 with implicit solvent ..................................... 63
Figure 19: Bootstrapping in tunnel2 with implicit solvent ..................................... 63
Figure 20: EDA analysis for the explicit solvent simulations at R≈1.5 Å and R≈0.0 Å. Blue denotes interaction energies at R≈0.0 Å and orange indicates interaction energies at R≈1.5 Å. Interaction energies are given in kcal/mol. Only residues with interactions ≥ |1 kcal/mol| were considered. ......................................................................................... 65
Figure 21: APBS analysis using ammonia, and residues within 4 Å of ammonia at R≈1.5 Å. The color key has been defined in energy units of kBT/e (where ‘e’ is the charge of an electron). .............................................. 66
Figure 22: Ammonia in the hydrophilic environment in the region R≈6.0 Å inside tunnel1. ............................................................................................... 68
Figure 23: Explicit solvent EDA analysis at R≈6.0 Å in tunnel1 (showing the most prominent peaks) ................................................................................ 68
Figure 24: Ammonia in the hydrophilic environment in the region R≈6.0 Å inside tunnel2 ................................................................................................ 70
Figure 25: Explicit solvent EDA analysis at R≈6.0 Å in tunnel2 (showing the most prominent peaks) ................................................................................ 71
Figure 26: Ammonia in a hydrophobic environment in the region 6.5 Å ≤ R ≤ 8.5 Å inside tunnel2. ................................................................................. 71
Figure 27: Explicit solvent EDA analysis at R≈8.5 Å in tunnel2 (showing the most prominent peaks) ................................................................................ 72
Figure 28: Ammonia in a hydrophilic environment in the region 6.5 Å ≤ R ≤ 8.5 Å inside tunnel1. ..................................................................................... 74
xii
Figure 29: Mechanism for Family 1 PPase action proposed by Samygina et al. in 2007. ................................................................................................... 77
Figure 30: Mechanism proposed by Professor Tsodokov’s group to explain the observations. ...................................................................................... 79
Figure 31: Diagram showing the abc angle used in selecting candidate snapshots ............................................................................................................ 82
Figure 32: Comparison of experimental (A) and optimized reactant (B). The attacking water (Wc) is labeled as “catalytic water”. ............................ 84
Figure 33: Comparison of experimental (A) and optimized product (B). The PPi has been hydrolyzed by Wc breaking the phosphoanhydride bond. ... 84
Figure 34: The optimized transition state showing the proton being abstracted by D89 and the formation of hydroxyl anion which carries out the nucleophilic attack. ............................................................................. 87
Figure 35: Structures of the novel substrates to be used as HDAC class IIa specific radiotracers synthesized by Professor Gelovani’s group ....... 90

1
CHAPTER 1
INTRODUCTION AND OVERVIEW
Enzymes are catalysts that speed up reactions in biological systems. Without
enzymes, many chemical reactions would occur too slowly to sustain life. This
thesis describes various types of studies carried out on three enzyme systems:
glutamine-dependent amidotransferase (GatCAB), inorganic pyrophosphatase
(PPase), and histone deacetylases (HDACs). This chapter gives a brief
introduction to each enzyme system in terms of the various types of analyses
and the computational methods used to study the system. An overview of the
theoretical aspects of the computational methods that were used has been also
given at the end.
1.1 GatCAB system
The process of aminoacylation is vital in the accurate translation of the genetic
code into amino acids that form proteins. The aminoacylation reactions are
catalyzed by aminoacyl tRNA synthetase enzymes that are specific to a given
amino acid. In the case of glutamine, the corresponding enzyme that catalyzes
the aminoacylation is glutaminyl-tRNA synthetase (GlnRS). Many bacteria and all
archaea lack GlnRS enzyme. In these organisms, the aminoacylation of
glutamine happens in an indirect mechanism (the reactions involved are
described in Chapter 2, Scheme 1). A non-specific glutamyl-tRNA synthetase
converts the glutamine residue to Glu-tRNAGln.2-5 GatCAB, a heterotrimeric
enzyme composed of three subunits GatA, GatB, and GatC, is instrumental in
many bacteria for the conversion of Glu-tRNAGln into Gln-tRNAGln (Chapter 2,

2
scheme 1).6-10 The presence of Gln in the form of Gln-tRNAGln is essential for the
incorporation of Gln into bacterial proteins. As described in Chapter 2 (scheme
1), this conversion happens via three steps (reactions 2,3, and 4 in Chapter 2,
scheme 1). The first step of the conversion of Glu-tRNAGln into Gln-tRNAGln , is
the hydrolysis (reaction 2) of Gln at the GatA active site. This ammonia is utilized
at GatB active site for the conversion of ɣ-phospho-Glu-tRNAGln into Gln-
tRNAGln.7
GatCAB belongs to a family of enzymes known as glutamine-dependent
amidotransferases (GATs).11 As other enzymes in the GAT family,12 the above-
mentioned ammonia formed at the GatA active site is transported to the GatB
active site via an intramolecular ammonia tunnel.1 Intramolecular ammonia
tunnels in most GATs are lined with hydrophobic amino acid residues and are
poorly solvated.12-15 In contrast, the GatCAB ammonia tunnel is lined with many
hydrophilic amino acid residues and bound to these residues are many, ordered
solvent water molecules.1 Although as not hydrophilic as GatCAB ammonia
tunnel, another example of a hydrophilic ammonia tunnel is that of carbamate
phosphate synthetase (CPS). In CPS the occurrence of hydrophilic residues
lining the tunnel is occasional and the majority of the residues lining the tunnel
are hydrophobic.16
In light of the fact that the GatCAB ammonia tunnel is lined with
hydrophilic ammonia residues, Nakamura et al. proposed that ammonia
undergoes a series of protonation and deprotonation reactions as it traverses the
tunnel in which the hydrophilic amino acid residues act as corresponding general

3
acids and bases.1 Protonation would result in the formation of ammonium ion
(NH4+) and subsequent deprotonation would return it back to ammonia. Exiting
the tunnel at GatB active site would happen in the form of ammonia which would
combine with ɣ-phospho-Glu-tRNAGln to form Gln-tRNAGln.
In 2012, Kang et al. 17proposed a modification to the tunnel proposed in
2006 by Nakamura et al. (tunnel1).1 The intramolecular tunnel including this
modification is referred to in this thesis as tunnel2. As described in more detail in
Chapter 4, this modification introduces a new entrance point for the ammonia
near GatA active site form where it is released by glutaminase activity. The newly
suggested region to the tunnel is lined with hydrophobic amino acid residues in
contrast to the previously proposed tunnel (tunnel1).
Chapter 2 discusses experimental and computational evidence that
support the existence of a communication pathway between two subunits of the
Helicobacter pylori (H. pylori) GatCAB.18 Molecular dynamics (MD) simulations
were carried out to sample the configuration space of the GatCAB system.
Snapshots of the MD simulations were used to carry out two types of analyses:
average correlation difference analysis, and average RMSD difference analysis.
Chapter three delves more into the mechanism of transfer of ammonia
through the aforementioned intramolecular tunnel. This study involved the
analysis of the D185(A) residue of H.pylori GatCAB as a probable catalytic
residue in the ammonia delivery mechanism. Experimental evidence that
suggests the action of D185(A) as a catalytic acid/base in the transfer of
ammonia is discussed. As in Chapter 2, MD simulations and were used to
4
sample the configuration space of the mutants and the wild-type GatCAB. The
snapshots of the MD simulations were used to carry out average correlation
difference studies and pKa analyses.
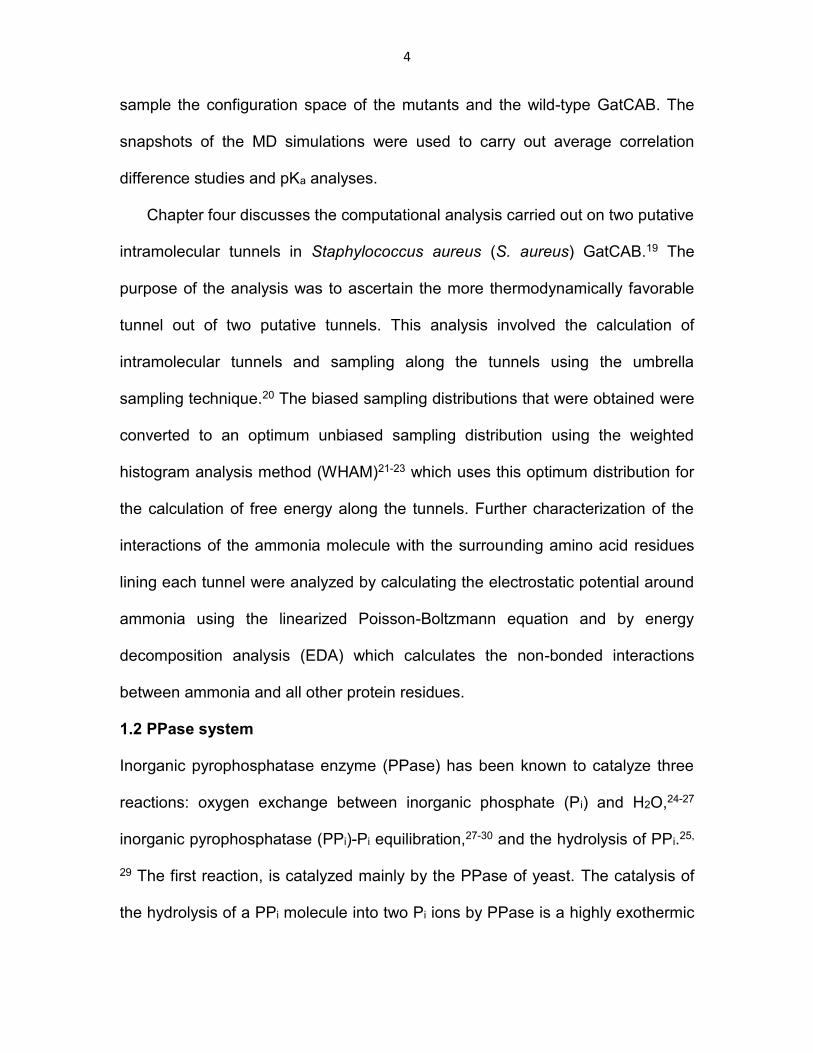
Chapter four discusses the computational analysis carried out on two putative
intramolecular tunnels in Staphylococcus aureus (S. aureus) GatCAB.19 The
purpose of the analysis was to ascertain the more thermodynamically favorable
tunnel out of two putative tunnels. This analysis involved the calculation of
intramolecular tunnels and sampling along the tunnels using the umbrella
sampling technique.20 The biased sampling distributions that were obtained were
converted to an optimum unbiased sampling distribution using the weighted
histogram analysis method (WHAM)21-23 which uses this optimum distribution for
the calculation of free energy along the tunnels. Further characterization of the
interactions of the ammonia molecule with the surrounding amino acid residues
lining each tunnel were analyzed by calculating the electrostatic potential around
ammonia using the linearized Poisson-Boltzmann equation and by energy
decomposition analysis (EDA) which calculates the non-bonded interactions
between ammonia and all other protein residues.
1.2 PPase system
Inorganic pyrophosphatase enzyme (PPase) has been known to catalyze three
reactions: oxygen exchange between inorganic phosphate (Pi) and H2O,24-27
inorganic pyrophosphatase (PPi)-Pi equilibration,27-30 and the hydrolysis of PPi.25,
29 The first reaction, is catalyzed mainly by the PPase of yeast. The catalysis of
the hydrolysis of a PPi molecule into two Pi ions by PPase is a highly exothermic

5
reaction. It is of utmost importance in biological systems as the energy released
can be used to drive kinetically unfavorable biological reactions to completion. It
is also important in removing the inhibitory effects on enzymes caused by PPi.31,
32 The action of PPase is essential for the survival of bacteria and fungi.33-35
PPase needs the presence of divalent metal cations at its active site to perform
catalysis. The relative efficiency of catalysis has been shown to vary with the
divalent metal cations as Mg2+ > Zn2+ > Co2+ > Mn2+.36, 37 In most Family 1
PPases, which is the type present in most eukaryotes, archaea and bacteria, the
active site is composed of 13 functionally important residues and three to four
Mg2+ cations.38-40 Family 2 PPases, which are present only in some bacteria,
archaea, and primitive eukaryotes,41-44 are mainly catalyzed by Mn2+ at the active
site. They are an order of magnitude higher in catalytic activity when compared to
Family 1 PPase activity.45 The catalytic action of PPase has been found to be
inhibited by Ca2+,30, 46-48 and F-.49-51 The precise mechanism of PPase action
remains uncertain. The study of the mechanism of PPase in bacteria is important
as it gives access to the structures of transition states the knowledge of which
can be utilized in the creation of potential drugs in the form of transition state
analogs.
As described in detail in Chapter 5, based on the studies of isolated
crystal structures of E. coli PPase, a mechanism was previously proposed to
describe the PPase catalyzed PPi hydrolysis.51 Although this mechanism
suggests nucleophilic attack by an activated water molecule (Wc) resulting in the
hydrolysis of the phosphoanhydride bond in PPi, such a water had not been seen

6
in any of the crystal structures isolated thus far. Chapter five presents a quantum
mechanical/molecular mechanical (QM/MM) study of the mechanism of PPase
action in Mycobacterium tuberculosis (M. tuberculosis) based on a set of novel
crystal structures in different stages of the reaction ranging from apo, to Pi bound
to PPi bound which contains a water molecule at the exact position predicted by
the previous mechanism in order to carry out a nucleophilic attack. MD
simulations were carried out to sample the configuration space of PPase. MD
snapshots in which a catalytic water (Wc) is properly oriented for hydrolysis, were
used for the QM/MM calculations. After optimizing the reactant and product
structures using the QM/MM method, the path between the optimized reactant
and the product structures was optimized using the quadratic string method
(QSM).52 The structure that corresponds to the highest point in the QSM
calculated path was utilized as the guess structure for transition state
optimization.
1.3 HDACs
Chromosomal DNA in eukaryotic cells is densely packed into structures known
as chromatin. Chromatin consists of DNA wound tightly around histone proteins.
The strength of attraction of DNA to the histone proteins is a key factor in
deciding the compactness of chromatin. More compact chromatin is more
transcriptionally silent when compared to less compact/relaxed chromatin. Tails
of histone proteins are mainly positively charged due lysine and arginine
residues. Acetylation of these residues by histone acetyltransferase enzymes
(HATs) lead to charge neutralization, and subsequent chromatin expansion53 that

7
provides greater accessibility of nucleosomal DNA for genetic transcription.54, 55
Histone deacetylase enzymes (HDACs) are a class of enzymes that catalyzes
the removal of acetyl groups from above-mentioned acetylated lysine and
arginine residues in histone proteins. This leads to increased positive charge that
results in stronger attraction between the histone proteins and the DNA
backbone that leads to more compact, transcriptionally silent chromatin. This
modification of gene expression without a change in DNA sequence is an ideal
example of epigenetic control.
Eighteen mammalian HDACs have been identified so far and have been
divided into four classes based on sequence similarity.56 Class I contains the
HDACs 1,2,3, and 8. HDAC’s in this class typically have a nuclear localization57
and are involved in the regulation of cellular proliferative activity.58 Class II
contains HDACs 4,5,6,7,9, and 10. Class II is further divided into Class IIa
(HDACs 4,5,7, and 9) and Class IIb (HDACs 6, and 10) with the primary
distinction being the central domain of class IIb containing a zinc finger motif
while class IIa contains a structural regulatory zinc binding domain.59 Class IIa
enzymes shuttle between nucleus and the cytoplasm while Class IIb enzymes
are mainly found in cytoplasm. With regard to the activity inside the brain Class
IIa HDACs are more important than Class IIb enzymes due to their increased
expression in the brain. With respect to other HDACs, Class IIa HDACs have
weak but measurable direct deacetylase activity and execute inhibition of gene
transcription via interaction with transcription factors like RUNX2.60, 61 Class III
HDACs are known as silent information regulators or sirtuins (SIRTs). In contrast

8
to HDACs of other classes, the SIRTs are NAD+ dependent in their catalytic
action. Currently, seven mammalian SIRTs have been identified (SIRT 1-7).62
Their localization in the cell is also varied among different SIRTs. In terms of
activity, SIRT 1 has been found to be more efficient in deacetylase action with
respect to SIRT 5 which shows weak deacetylase activity.63, 64 Some SIRTs like
SIRT4 and SIRT6 don’t show deacetylase activity at all and are mono-ADP-
ribosyl transferases.65, 66 HDAC Class IV contains HDAC 11. HDAC 11 is
normally expressed in brain and testis cells. HDAC11, is considered to be
separate from other classes due to its biological actions.67
Development of HDAC inhibitors have shown a lot of promise in therapy in
curing neurological diseases mediated by the epigenetic modifications catalyzed
HDACs. Analysis of the pharmacodynamic profiles of HDAC inhibitors is of great
help in studying the HDAC expression in vivo. One way of visualizing the HDAC
expression-activity is through non-invasive imaging techniques like positron
emission tomography (PET) scanning. Visualization of HDAC expression-activity
through PET scanning can be achieved by the use of radiolabeled substrates
that bind to HDAC active sites. Chapter six, describes a computational analysis
of the binding affinity of a set of novel substrates for HDAC Class lla enzymes.
These set of novel substrates are being experimentally tested as possible
radiotracers that help visualize the activity of HDAC Class IIa enzymes in vivo.
The substrates differ from each other depending on the number of fluorine
atoms. The study involves the docking of the substrates to HDAC4 and HDAC8
which are two members of the HDAC Class IIa enzymes. The purpose of the

9
docking is to identify the variation of the affinity of the substrates to HDAC4 and
HDAC8 and also to identify the underlying interactions that can be used to
describe mechanistic details of HDAC catalytic activity.
1.4 Computational methods
Given below is an overview of some of the computational methods that were
used in the research projects described in this thesis. They have been described
in the context in which they were used.
1.4.1 Molecular dynamics (MD)
Molecular mechanics is based on Newton’s equations of motion. It views the
atoms and the bonds between atoms as balls and springs respectively. This
picture of chemical systems may be adequate as long as the systems being
analyzed do not involve chemical reactions where insight at the electronic level is
required. The iterative application of molecular mechanics equations to sample
the configuration space of a system of interest is generally referred to as
molecular dynamics (MD). In the context of the research described in this text,
MD has been utilized as a means of sampling the configuration space of the
large enzyme systems that were described above.
There are several stages in setting up an MD simulation. A force field that
is parameterized for handling the type of system we are interested in has to be
chosen. A force field used in MD typically includes an equation for calculating the
energy of the system in terms of bond stretching, angle bending, torsional
(dihedral) energies, and non-bonded interaction energies, which include
10
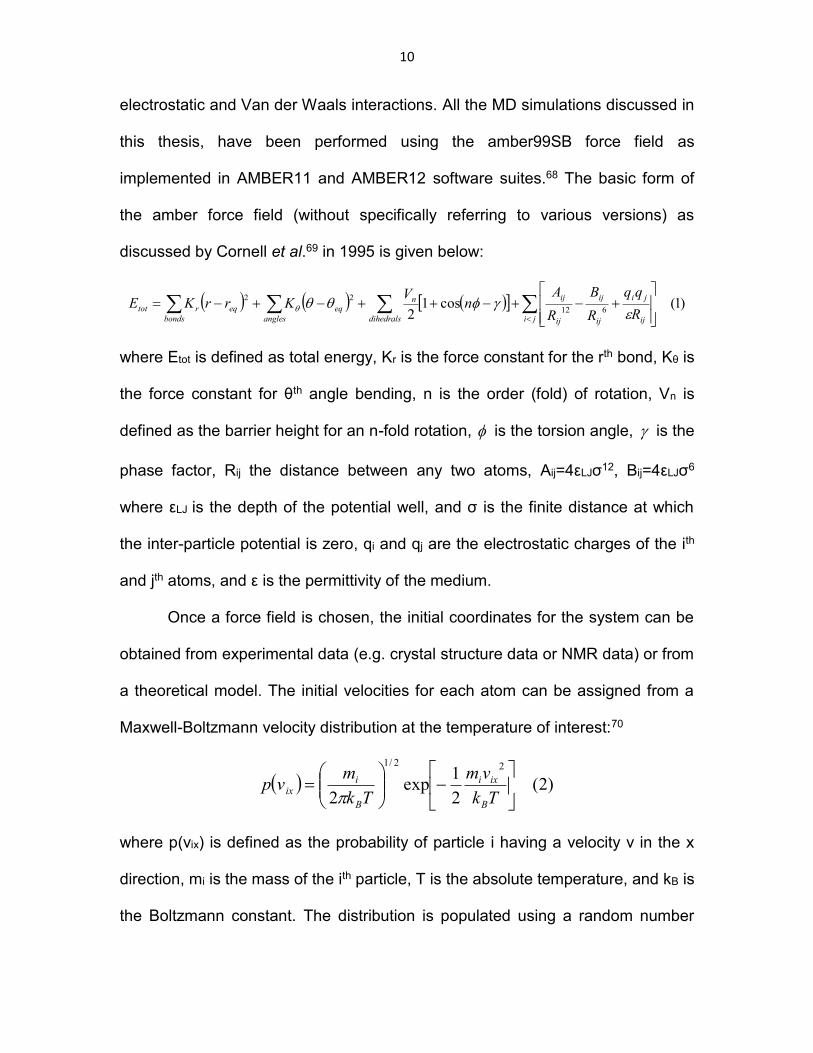
electrostatic and Van der Waals interactions. All the MD simulations discussed in
this thesis, have been performed using the amber99SB force field as
implemented in AMBER11 and AMBER12 software suites.68 The basic form of
the amber force field (without specifically referring to various versions) as
discussed by Cornell et al.69 in 1995 is given below:
)1(cos12 612
22
ji ij
ji
ij
ij
ij
ij
dihedrals
neq
angles
eq
bonds
rtotR
R
B
R
An
VKrrKE
where Etot is defined as total energy, Kr is the force constant for the rth bond, Kθ is
the force constant for θth angle bending, n is the order (fold) of rotation, Vn is
defined as the barrier height for an n-fold rotation, is the torsion angle, is the
phase factor, Rij the distance between any two atoms, Aij=4εLJσ12, Bij=4εLJσ6
where εLJ is the depth of the potential well, and σ is the finite distance at which
the inter-particle potential is zero, qi and qj are the electrostatic charges of the ith
and jth atoms, and ε is the permittivity of the medium.
Once a force field is chosen, the initial coordinates for the system can be
obtained from experimental data (e.g. crystal structure data or NMR data) or from
a theoretical model. The initial velocities for each atom can be assigned from a
Maxwell-Boltzmann velocity distribution at the temperature of interest:70
)2(2
1exp
2
22/1
Tk
vm
Tk
mvp
B
ixi
B
iix
where p(vix) is defined as the probability of particle i having a velocity v in the x
direction, mi is the mass of the ith particle, T is the absolute temperature, and kB is
the Boltzmann constant. The distribution is populated using a random number

11
generator that generates random numbers between 0 and 1 which are used as
input to create the probabilities between 0 and 1. It would be impossible to
calculate a continuous MD trajectory as that would involve an infinite number of
calculations. Therefore, for all practical purposes, the number of MD calculations
for a given MD simulation is defined using a time step (δt). At each time step an
iteration of MD calculations will be performed. The value of δt , is decided upon
according to the fastest motion of the system, because, if δt is bigger than the
fastest motion, that motion cannot be sampled properly using the simulation.
Usually the vibrational degrees of freedom of bonds involving hydrogen atoms
are restrained to achieve a bigger time step. In all our simulations, a δt of 1 fs
was used. With the initial coordinates (r(t)) and velocities (v(t)) at hand, the
forces for each atom are generated by calculating the negative gradient of the
force field (equation 1) for each atom. The corresponding accelerations (a(t)) are
obtained by dividing the force on each atom, by its mass. The new velocities and
coordinates can be calculated with a variety of integration methods. One popular
method is the velocity-Verlet algorithm (Swope et al. 1982)71. This method has
four steps:
1) Calculation of coordinates at (t+ δt)
r(t+ δt) = r(t) + δtv(t) + (1/2) δt2a(t)
where r(t+ δt) are the coordinates at (t+ δt)
2) Calculation of velocities at (t+ (1/2)δt)
v(t+ (1/2)δt) = v(t) + (1/2) δta(t)
where v(t+ (1/2)δt) are the velocities at (t+ (1/2)δt)

12
3) Calculation of new forces from the current positions, thus obtaining a(t+ δt)
4) Calculation of velocities at (t+ δt)
v(t+ δt) = v(t+ (1/2)δt) + (1/2) δta(t+ δt)
where v(t+ δt) are the velocities at (t+ δt)
The same set of calculations are performed for the next iterations as well until
satisfactory sampling of the configuration space is achieved. In place of the
velocity-Verlet method, other integration algorithms like, Verlet algorithm72,
leap-frog algorithm73, and Beeman algorithm74 can also be used.
1.4.2 CAVER tunnel calculations
The CAVER75 program/tool as implemented in the PyMOL76 visualization
package was used for the intramolecular tunnel calculations described in Chapter
4. This program creates a three dimensional grid of nodes. The protein in which
the intramolecular tunnels have to be calculated, is placed inside this grid. The
atoms of the protein are represented as hard spheres defined by Van der Waals
radii. The protein surface (“convex hull”) is approximated using Convex Quadratic
Approximation (CQA)77. All the nodes outside the convex hull are discarded and
not included in further calculations. Every node in the convex hull are tagged with
a “cost” calculated using the node dependent cost function C(x):
where rmax(x) is radius of the maximally inscribable sphere at node x, and ε is a
parameter that is given a value in cases where rmax(x) tends to zero, to avoid
singularities. Tagging the nodes by costs, creates a mathematical object known
as a vertex-weighted graph. Depending on the node specified as the starting
(3)
13
point of the tunnel calculation by the user, the vertex-weighted graph is traversed
using a modified version of Dijkstra’s algorithm78-80 to find the cheapest tunnels.
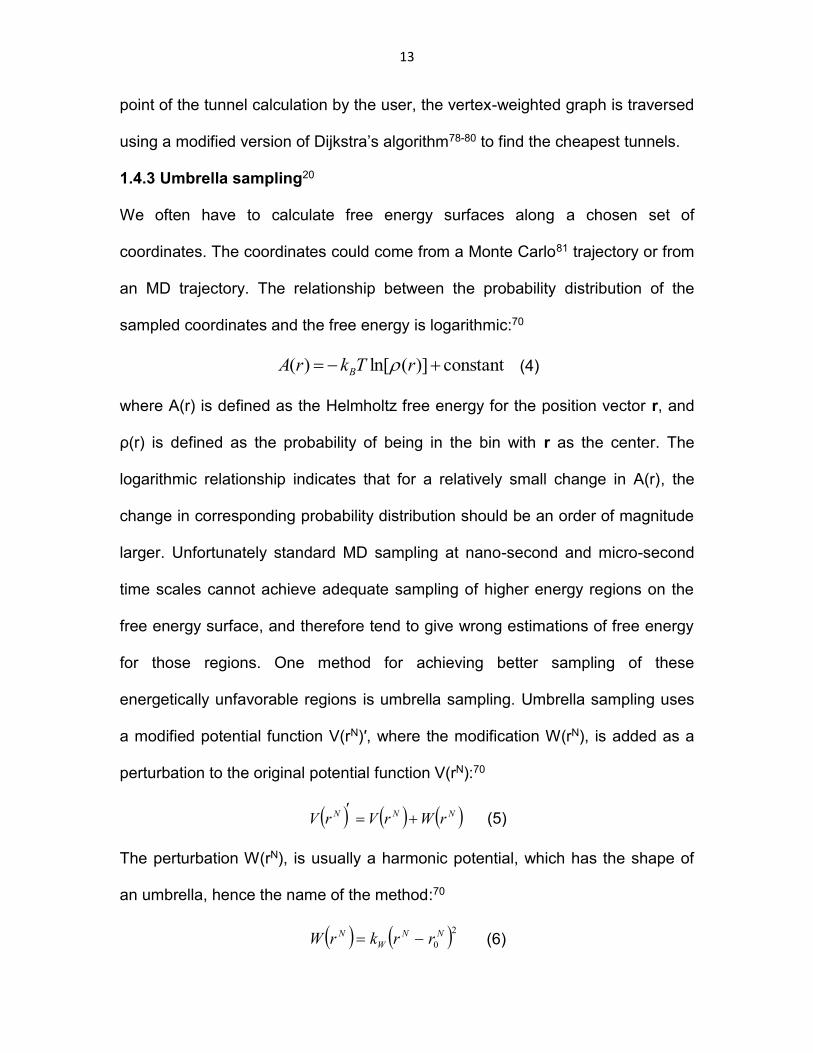
1.4.3 Umbrella sampling20
We often have to calculate free energy surfaces along a chosen set of
coordinates. The coordinates could come from a Monte Carlo81 trajectory or from
an MD trajectory. The relationship between the probability distribution of the
sampled coordinates and the free energy is logarithmic:70
constant)](ln[)( rTkrA B (4)
where A(r) is defined as the Helmholtz free energy for the position vector r, and
ρ(r) is defined as the probability of being in the bin with r as the center. The
logarithmic relationship indicates that for a relatively small change in A(r), the
change in corresponding probability distribution should be an order of magnitude
larger. Unfortunately standard MD sampling at nano-second and micro-second
time scales cannot achieve adequate sampling of higher energy regions on the
free energy surface, and therefore tend to give wrong estimations of free energy
for those regions. One method for achieving better sampling of these
energetically unfavorable regions is umbrella sampling. Umbrella sampling uses
a modified potential function V(rN)′, where the modification W(rN), is added as a
perturbation to the original potential function V(rN):70
NNN rWrVrV
(5)
The perturbation W(rN), is usually a harmonic potential, which has the shape of
an umbrella, hence the name of the method:70
20
NN
W
N rrkrW (6)

14
where kW is defined as the force constant corresponding to the biasing potential
W(rN) and Nr0 is the equilibrium configuration defined by the N coordinates in the
absence of the biasing potential. During umbrella sampling, configurations further
away from Nr0 , will be subject to a higher biasing potential than configurations
closer to it, thereby yielding a non-Boltzmann distribution. In 1977, Torrie and
Valleau showed that Boltzmann averages for properties can be extracted from
the non-Boltzmann distribution resulting from umbrella sampling:20, 70
WB
N
WB
NN
TkrW
TkrWrAA
exp
exp (7)
where angle brackets indicate average values, and the subscript W indicates that
the average is based on the biased probability distribution Nw rP .
As described in Chapter four, umbrella sampling was used to achieve
even sampling of the configuration space of the ammonia molecules that were
positioned along each intramolecular ammonia tunnel in GatCAB. Due to the
application of the biasing potential, the resulting sampling distribution is a biased
sampling distribution which had to be unbiased and optimized in order to be used
for further analyses.
1.4.4 Weighted histogram analysis method (WHAM)
The biased sampling distributions obtained using the umbrella sampling
technique described above, was converted into an optimum unbiased sampling
distribution using this method. This is done by solving the following two equations
self-consistently.
15
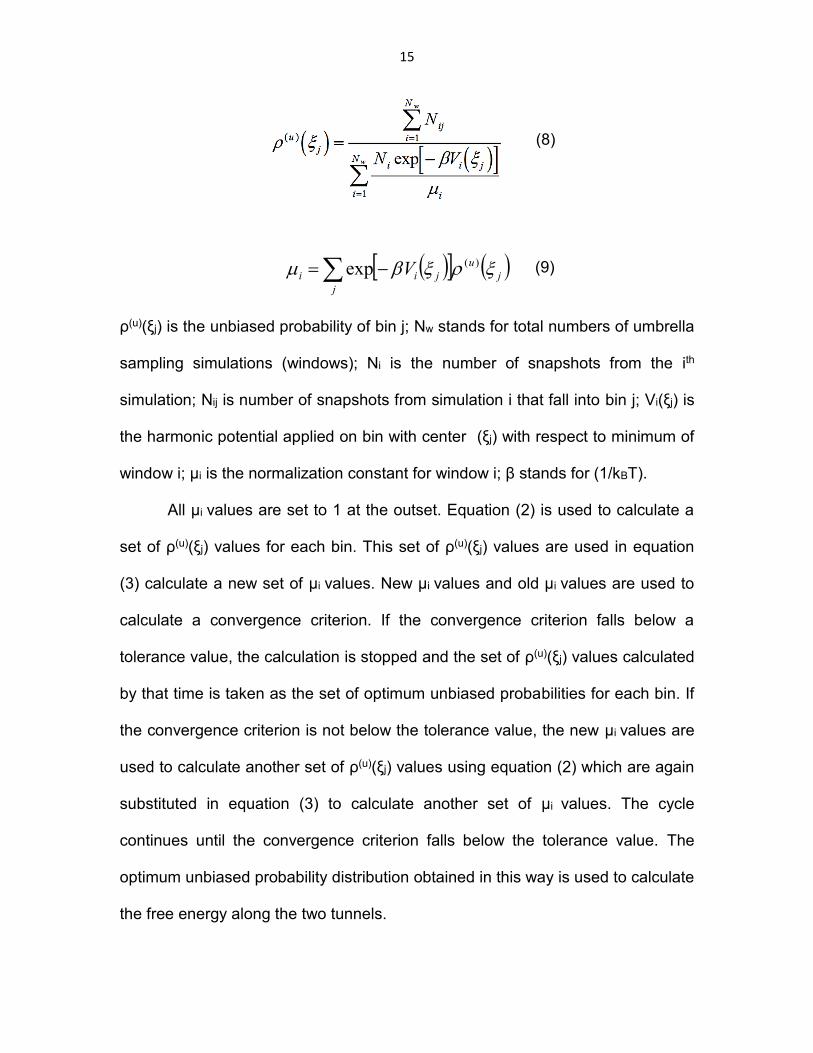
ρ(u)(ξj) is the unbiased probability of bin j; Nw stands for total numbers of umbrella
sampling simulations (windows); Ni is the number of snapshots from the ith
simulation; Nij is number of snapshots from simulation i that fall into bin j; Vi(ξj) is
the harmonic potential applied on bin with center (ξj) with respect to minimum of
window i; μi is the normalization constant for window i; β stands for (1/kBT).
All μi values are set to 1 at the outset. Equation (2) is used to calculate a
set of ρ(u)(ξj) values for each bin. This set of ρ(u)(ξj) values are used in equation
(3) calculate a new set of μi values. New μi values and old μi values are used to
calculate a convergence criterion. If the convergence criterion falls below a
tolerance value, the calculation is stopped and the set of ρ(u)(ξj) values calculated
by that time is taken as the set of optimum unbiased probabilities for each bin. If
the convergence criterion is not below the tolerance value, the new μi values are
used to calculate another set of ρ(u)(ξj) values using equation (2) which are again
substituted in equation (3) to calculate another set of μi values. The cycle
continues until the convergence criterion falls below the tolerance value. The
optimum unbiased probability distribution obtained in this way is used to calculate
the free energy along the two tunnels.
)3(exp )( j
j
u
jii V
(8)
(9)

16
1.4.5 QM/MM hybrid method
First introduced in 1976 by Warshel and Levitt,82 the QM/MM approach combines
the accuracy of quantum mechanics and the speed of molecular mechanics into
one. This method is specially used in analyzing chemical reactions that occur in
macroscopic systems like proteins and nucleic acids. This method has proved
highly successful and grabbed the attention of the scientific community in general
with the award of the 2013 Nobel Prize in chemistry for Arieh Warshel, Michael
Levitt, and Martin Karplus for their work involving QM/MM methods in the
development of multiscale models for chemical systems. In the QM/MM hybrid
method, the portion of the system that is involved in the chemical reaction of
interest, is included in the QM subsystem and is treated quantum mechanically
while the rest of the system is addressed using molecular mechanics. The QM
treatment of the reactive subsystem yields a more accurate picture at the
electronic level which is compulsory for the analysis of chemical reactions and to
divulge mechanistic information. For the rest of the system (MM subsystem), for
which the accuracy at the electronic level is not a requirement, a compromise in
accuracy has been made to gain an advantage in calculation speed by applying
the balls and springs picture of atoms and bonds used in molecular mechanics.
Many implementations of the QM/MM hybrid method use a two-zone (i.e. QM
and MM subsystems) approach as described above. In 1996 Morokuma et al.83
described a multi-layered approach for the QM/MM method, which is now widely
known as ONIOM. The two-zone implementation, leaves the user with only two

17
choices in dividing up the system in terms of the accuracy of the calculations
needed. ONIOM allows the user to divide the system into several layers allowing
each layer to be addressed with a different level of theory. The outermost layer is
usually treated by an MM force field. The level of theory increases when going
from the outer layers to the inner layers. In a typical example of ONIOM with
three layers, the innermost core might be treated with a B3LYP density functional
approach,84-87 the intermediate layer using Hartree-Fock method,88 and the
outermost layer with MM3.89
In the simpler two-zone implementation, the total energy ETOT of the
system is given by:70
MMQMMMQMTOT EEEE / (10)
where EQM is the energy of the QM subsystem, EMM is the energy of the MM
subsystem, and EQM/MM is the energy of interaction between the QM subsystem
and the MM subsystem. As explained by Karplus et al. in 1989,90 for the
calculation of the total energy ETOT of the system, an effective Hamiltonian effH ,
is defined which is a combination of the QM Hamiltonian QMH , MM Hamiltonian
MMH , and the QM/MM Hamiltonian MMQMH /ˆ . ETOT is calculated using the time-
independent Schrödinger equation:
MMTOTMeff RRrRRERRrH ,,,,,ˆ (11)
where the wavefunction is a function of the electronic coordinates r, that
parametrically depends on both QM nuclei positions R , and the MM atom
18
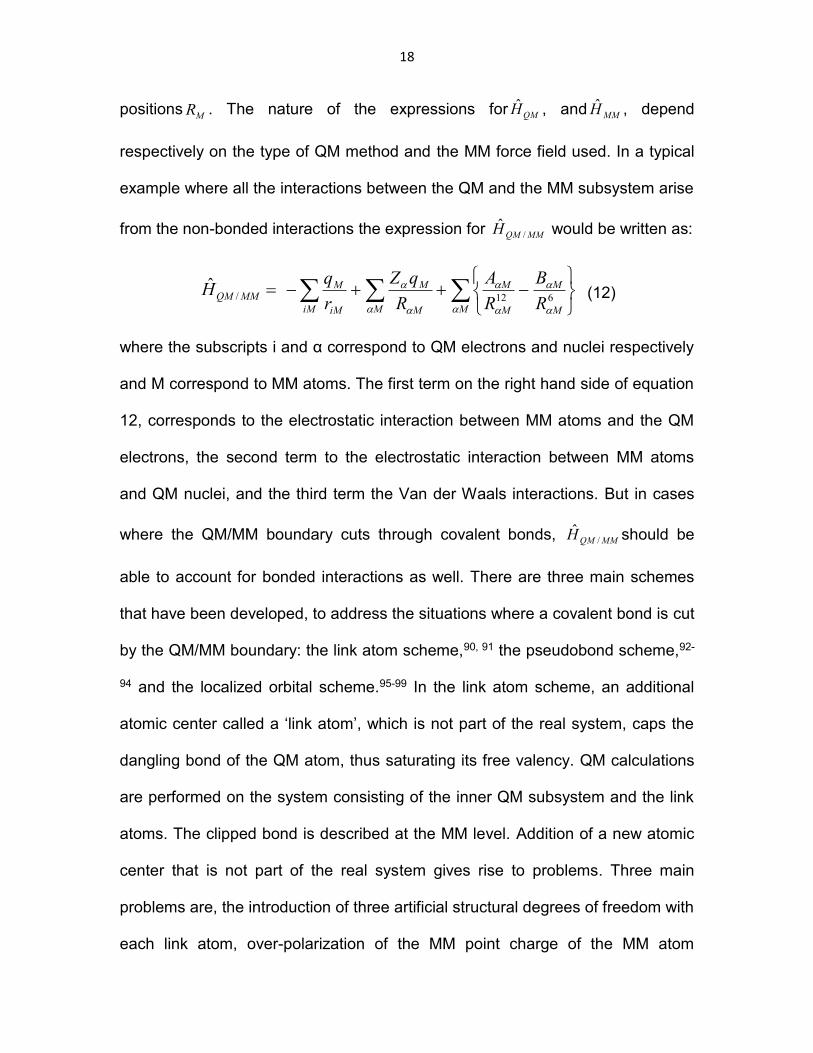
positionsMR . The nature of the expressions for QMH , and MMH , depend
respectively on the type of QM method and the MM force field used. In a typical
example where all the interactions between the QM and the MM subsystem arise
from the non-bonded interactions the expression for MMQMH /ˆ would be written as:
M M
M
M
M
M M
M
iM iM
MMMQM
R
B
R
A
R
qZ
r
qH
612/ˆ
(12)
where the subscripts i and α correspond to QM electrons and nuclei respectively
and M correspond to MM atoms. The first term on the right hand side of equation
12, corresponds to the electrostatic interaction between MM atoms and the QM
electrons, the second term to the electrostatic interaction between MM atoms
and QM nuclei, and the third term the Van der Waals interactions. But in cases
where the QM/MM boundary cuts through covalent bonds, MMQMH /ˆ should be
able to account for bonded interactions as well. There are three main schemes
that have been developed, to address the situations where a covalent bond is cut
by the QM/MM boundary: the link atom scheme,90, 91 the pseudobond scheme,92-
94 and the localized orbital scheme.95-99 In the link atom scheme, an additional
atomic center called a ‘link atom’, which is not part of the real system, caps the
dangling bond of the QM atom, thus saturating its free valency. QM calculations
are performed on the system consisting of the inner QM subsystem and the link
atoms. The clipped bond is described at the MM level. Addition of a new atomic
center that is not part of the real system gives rise to problems. Three main
problems are, the introduction of three artificial structural degrees of freedom with
each link atom, over-polarization of the MM point charge of the MM atom

19
involved in the clipped bond due to its close proximity to the QM electron density,
and chemical and electronic incompatibility of the link atom when compared to
the group/atom it replaces.
The pseudobond scheme tries to remove the problems associated with
the link atom scheme by replacing the MM atom of the clipped bond with a free-
valence boundary atom which has a parameterized effective core potential. The
effective core potential has been designed in such a way as to reproduce the
bond length, and electronic properties of the cut-bond. In the QM/MM
calculations discussed in this thesis, the pseudobond scheme has been adopted
to treat the covalent bonds that get severed by the QM/MM boundary.
The localized orbital scheme places frozen hybrid orbitals at the QM/MM
boundary to saturate the dangling bonds by capping the QM atoms involved in
the cut-bond.
As described in Chapter five of this text, the QM/MM hybrid method has
been used in analyzing the mechanism of PPase action in M. tuberculosis. The
reactive subsystem which encompasses the substrate, attacking water, etc. have
been included in the QM subsystem while rest of the system has been included
in the MM subsystem.
1.4.6 Molecular docking
Molecular docking is a process which finds dominant binding modes (poses) of a
ligand molecule (e.g. a drug molecule) to a target receptor molecule (e.g. an
enzyme) with the help of scoring functions that rank the binding modes
depending on the number/nature of favorable binding interactions between the
20
ligand and the receptor. Docking programs could be evaluated according to the
number of degrees of freedom they ignore when suggesting probable binding
modes. Earliest docking programs treated both the ligand and the receptor as
rigid molecules and searched only the six translational and rotational degrees of
freedom. The docking program DOCK in its earliest form,100 is such an example.
Since then docking programs have evolved to take into account the flexibility of
both the ligand and the active site of the receptor, when suggesting probable
poses. Modern docking programs adopt various approaches in tackling the
docking problem which is essentially a search for conformational degrees of
freedom of both the ligand and the receptor that give rise to stable ligand-
receptor complexes. Some of these approaches are, Monte Carlo method
combined with simulated annealing,101 genetic algorithms102-104, incremental
construction of the ligand105-107, and molecular dynamics of the ligand-receptor
complex.108, 109
Chapter six describes the use of molecular docking as a means of
calculating and comparing the binding affinity of a set of novel substrate (ligand)
molecules in binding to two members of the HDAC Class IIa enzymes: HDAC4
and HDAC8. The LeadIT program110 was used for all the docking calculations,
which implements a form of the FlexX algorithm.107 FlexX algorithm is an
incremental construction algorithm. It first creates interaction geometries and
interaction centers for all groups in the ligand and the receptor that can be
thought to have interactions. The ligand is fragmented by severing at all acyclic
single bonds. Base fragments are created using single fragments or

21
combinations of fragments. Base fragments are placed at the active site of the
receptor to achieve best overlap of interaction centers in both the ligand and the
receptor. The base fragments are built iteratively in agreement with the torsional
databases to construct the complete ligand.

22
CHAPTER 2
ANALYSIS OF THE COMMUNICATION BETWEEN GATA AND GATB
SUBUNITS OF THE ENZYME GLUTAMINE-DEPENDENT
AMIDOTRANSFERASE (GATCAB) IN HELICOBACTER PYLORI (H. PYLORI)
Reproduced in part with permission from Zhao, L., Dewage, S. W., Bell, M. J.,
Chang, K. M., Fatma, S., Joshi, N., Silva, G., Cisneros, G. A., and Hendrickson,
T. L. (2012) Biochemistry 51, 273-285. Copyright 2012, American Chemical
Society.
2.1 Introduction
Aminoacylation of tRNA involves the reaction of amino acids with specific tRNA
molecules to produce aminoacyl-tRNAs (aa-tRNAs).111 This process is catalyzed
by specific aminoacyl-tRNA synthetase enzymes (aaRSs). In eukaryotes like
humans, the aminoacylation of tRNAGln is catalyzed by glutaminyl-tRNA
synthetase (GlnRS) producing Gln-tRNAGln .112 In all archaea and most bacteria
GlnRS is not present.11, 12, 113 The absence of GlnRS should theoretically deprive
these organisms of making Gln-tRNAGln, thus making it impossible for most
bacteria to incorporate glutamine into their proteins. In these bacteria,
incorporation of glutamine into proteins is achieved by an indirect mechanism.113
In a first step, a non-specific enzyme called glutamyl-tRNA synthetase (GluRS)
catalyzes the misacylation of glutamate with tRNAGln producing Glu-tRNAGln
(reaction 1).6, 112, 114 This reaction is followed by conversion of the misacylated
tRNA to the correctly acylated tRNA.
23
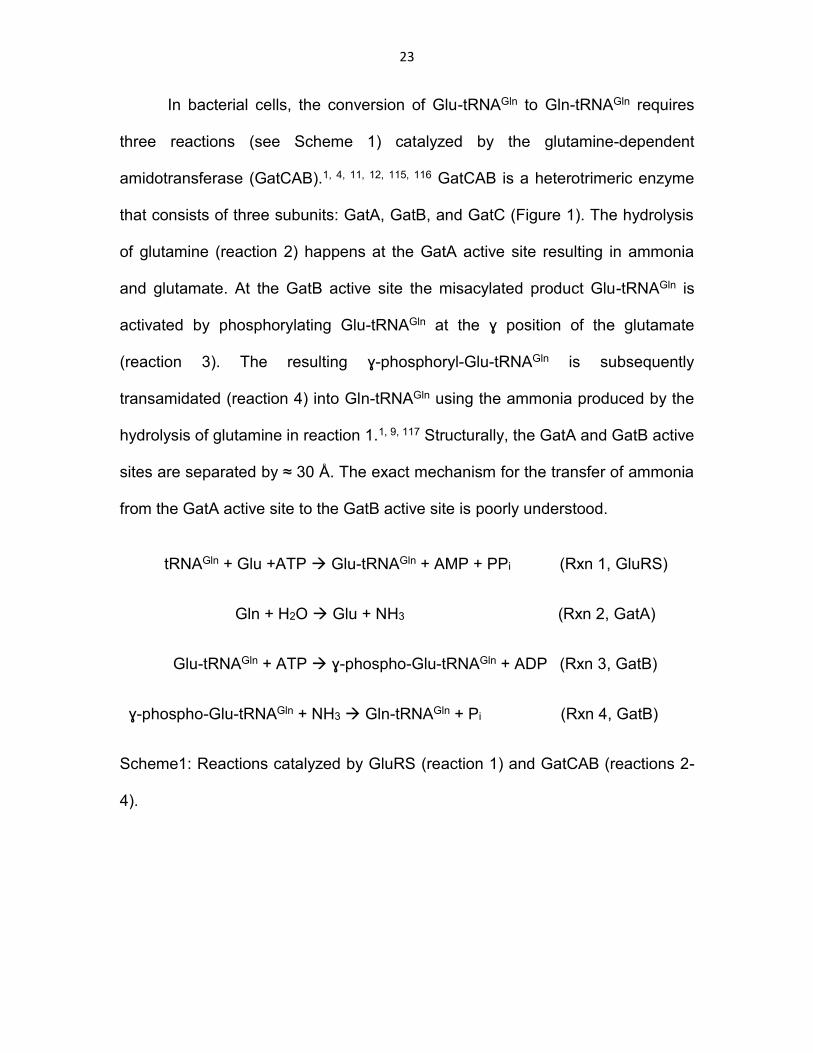
In bacterial cells, the conversion of Glu-tRNAGln to Gln-tRNAGln requires
three reactions (see Scheme 1) catalyzed by the glutamine-dependent
amidotransferase (GatCAB).1, 4, 11, 12, 115, 116 GatCAB is a heterotrimeric enzyme
that consists of three subunits: GatA, GatB, and GatC (Figure 1). The hydrolysis
of glutamine (reaction 2) happens at the GatA active site resulting in ammonia
and glutamate. At the GatB active site the misacylated product Glu-tRNAGln is
activated by phosphorylating Glu-tRNAGln at the ɣ position of the glutamate
(reaction 3). The resulting ɣ-phosphoryl-Glu-tRNAGln is subsequently
transamidated (reaction 4) into Gln-tRNAGln using the ammonia produced by the
hydrolysis of glutamine in reaction 1.1, 9, 117 Structurally, the GatA and GatB active
sites are separated by ≈ 30 Å. The exact mechanism for the transfer of ammonia
from the GatA active site to the GatB active site is poorly understood.
tRNAGln + Glu +ATP Glu-tRNAGln + AMP + PPi (Rxn 1, GluRS)
Gln + H2O Glu + NH3 (Rxn 2, GatA)
Glu-tRNAGln + ATP ɣ-phospho-Glu-tRNAGln + ADP (Rxn 3, GatB)
ɣ-phospho-Glu-tRNAGln + NH3 Gln-tRNAGln + Pi (Rxn 4, GatB)
Scheme1: Reactions catalyzed by GluRS (reaction 1) and GatCAB (reactions 2-
4).
24
In order to explain the transport of ammonia from the GatA active site to the GatB
active site through the enzyme, a putative tunnel (Figure 2) was proposed by
Nakamura et al. which will be referred to in this text as tunnel1.1 Ammonia
produced at the GatA active site has to be consumed at the GatB active site at a
matching rate to regulate pH homeostasis suggesting a communication pathway
between the two subunits.
Figure 1: Structure of GatCAB enzyme from Staphylococcus aureus1 (PDB ID:
2F2A)

25
2.2 Experimental findings
This study was performed in collaboration with Professor Hendrickson’s group at
the department of chemistry in Wayne State University. Prof. Hendrickson’s
group created mutants of 13 conserved amino acid residues lining tunnel1 in H.
pylori and measured the rates of the phosphorylation reaction (reaction 3 in
Scheme 1) at the GatB active site (shown in Figure 2). The highest changes in
these rates were found for T149(A)V and K89(B)R mutants, where the letters (A)
Figure 2: The putative tunnel proposed by Nakamura et al. in 2006. Residue
numbers in black correspond to Staphylococcus aureus notation. The residue
numbers in blue correspond to their Helicobacter pylori equivalents.
26
and (B) in subscript refer to chain names in GatCAB. The fact that a mutation at
the GatA active site and at the GatA-GatB interface results in a corresponding
change in the phosphorylation rate at the GatB active site suggested a
communication pathway between the GatA and GatB subunits as well as the
possibility of T149(A) and K89(B) playing major roles in that communication
pathway.
2.3 Computational methods and analyses
As there is no crystal structure information for the GatCAB enzyme in H. pylori,
the crystal structure of the GatCAB enzyme of Staphylococcus aureus
(S. aureus) (PDB ID:2F2A) was used for all the computational studies due to its
high sequence identity and similarity with H. pylori GatCAB. The mutations
T149(A)V and K89(B)R in H. pylori correspond to T175(A)V and K88(B)R in
S. aureus.
2.3.1 Molecular dynamics (MD) simulations
MD simulations were performed on eight systems: wild-type with (wild+Gln) and
without Gln (wild-Gln) at the GatA active site, T149(A)V with (T149(A)V+Gln) and
without Gln (T149(A)V-Gln) at the GatA active site, K89(B)R with (K89(B)R+Gln)
and without Gln (K89(B)R-Gln) at the GatA active site, E125(B)D with Gln at the
GatA active site (E125(B)D+Gln), and E125(B)Q with Gln at the GatA active site
(E125(B)Q+Gln) using the PMEMD program in AMBER11 software suite with the
amber99SB force field.68 The E125(B)D+Gln and E125(B)Q+Gln systems were
used as controls. The SHAKE algorithm was applied for bonds between heavy
atoms and hydrogen.118 All MD simulations were carried out with periodic

27
boundary conditions. The smooth particle Ewald method was used for calculating
long range interactions.119, 120 Systems were minimized using sander with 50
steps of steepest descent and 450 steps of conjugate gradient with a restraint of
500 kcal/mol/Å2 on the protein atoms. Neutralization of the systems was done by
adding Na+ ions using the xleap program in AMBER11. The neutralized systems
were solvated with TIP3P water in boxes of size 125 Å×96 Å×142 Å and were
minimized using sander as described above. Densities of the systems were
equilibrated at 1g/cm3 in the NPT ensemble with pressure being held constant by
anisotrophic pressure scaling. The systems were gradually heated to 300K under
constant volume conditions with a 500 kcal/mol/Å2 restraint on the protein atoms.
The restraints were gradually removed. Temperature was kept constant using a
Berendson thermostat.121 Non-restrained production MD was performed for 20 ns
for each system with snapshots saved each 1 ps.
2.3.2 Residue-wise correlation studies
Residue-wise correlations were calculated using the correl function of the
AMBER11 software suite using the trajectory files of the final 10 ns of each
simulation (Figure 3). To ascertain the effects of the mutations, correlation
differences were calculated for the mutants T149(A)V, K89(B)R with respect to the
wild-type (Figure 4). Correlation patterns of V149(A) (in T149(A)V mutant), R89(B)
(in K89(B)R mutant) with all the other protein residues were compared against the
patterns of T149(A) (wild-type), K89(B) (wild-type) with all the other protein
residues (Figure 5).
28
2.3.3 Residue-wise root mean square deviation (RMSD) studies
Average RMSD values for each residue were calculated for the mutants and the
wild-type structures with respect to the initial crystal structure, using the MD
snapshots of the final 10 ns in each MD simulation. The average RMSD value for
each wild-type amino acid residue was subtracted from the average RMSD value
of each corresponding residue in the mutant structures to find the RMSD
differences. These residue-wise RMSD differences were mapped onto the
mutant GatCAB structures to visualize the residues that show high geometrical
disturbance due to mutation (Figure 6). For each of the mutant structures, the
300 residues that showed highest percentage RMSD differences were selected.
From these groups of 300 residues, the amino-acid residues common to all the
mutant structures were selected and mapped onto the structure to visualize their
positions (Figure 7).
2.4 Results and discussion
2.4.1 Residue-wise correlation studies
Residue-wise correlation plots are shown below in Figure 3 followed by the
correlation difference plots in Figure 4. Correlations have been calculated for
wild-type GatCAB and the mutants T149(A)V, and K89(B)R with and without Gln at
the GatA active site.
Positive correlation values (values greater than zero) correspond to
movement of the two residues in the same direction whereas negative correlation
values (values less than zero) correspond to movement in opposite directions.
Correlation plots are divided into regions that correspond to protein subunits in
29
GatCAB as shown by the dashed lines on the correlation plots in Figure 3G. As
the correlation plots are symmetrical along the main diagonal, the regions labeled
as GatA to GatB and GatB to GatA represent the same correlations of GatA
residues with GatB resdues. Correlation values along the diagonal are the
highest as they represent correlations of residues with themselves.

30
Figure 3: The correlation plots for (A) wild-Gln; (B) wild+Gln; (C) T149(A)V-Gln;
(D) T149(A)V+Gln; (E) K89(B)R-Gln; (F) K89(B)R+Gln; (G) Map showing different
regions marked by dash lines.
31
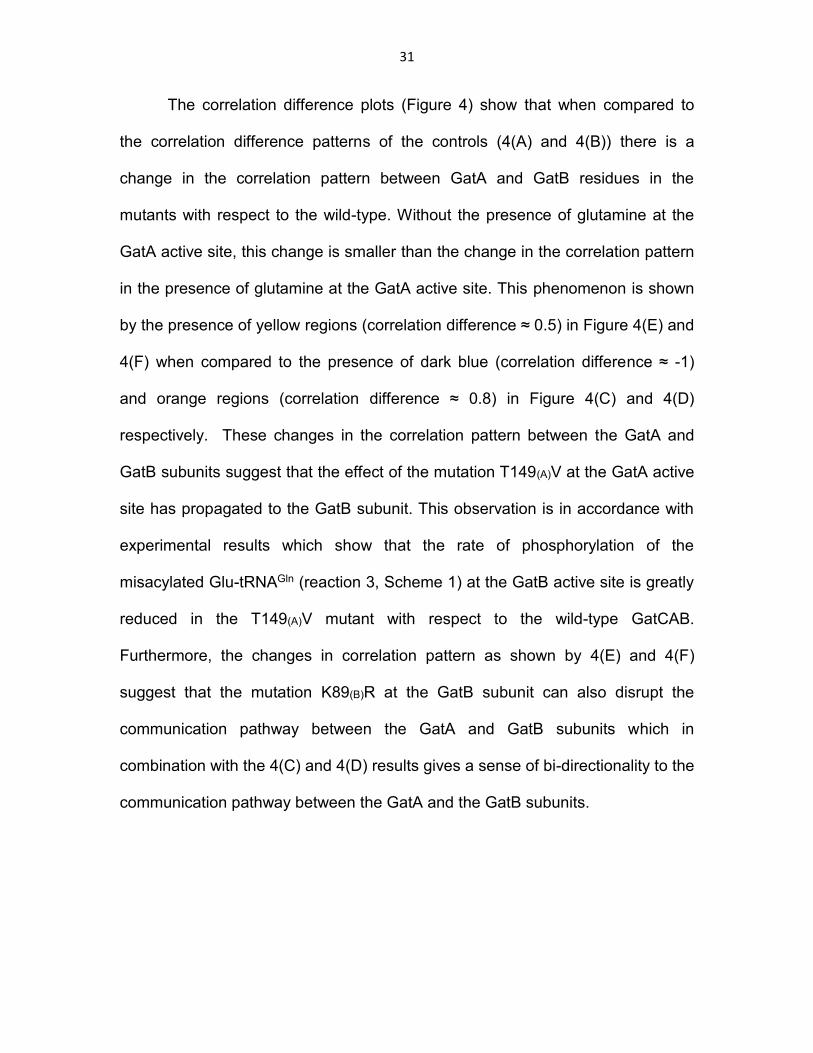
The correlation difference plots (Figure 4) show that when compared to
the correlation difference patterns of the controls (4(A) and 4(B)) there is a
change in the correlation pattern between GatA and GatB residues in the
mutants with respect to the wild-type. Without the presence of glutamine at the
GatA active site, this change is smaller than the change in the correlation pattern
in the presence of glutamine at the GatA active site. This phenomenon is shown
by the presence of yellow regions (correlation difference ≈ 0.5) in Figure 4(E) and
4(F) when compared to the presence of dark blue (correlation difference ≈ -1)
and orange regions (correlation difference ≈ 0.8) in Figure 4(C) and 4(D)
respectively. These changes in the correlation pattern between the GatA and
GatB subunits suggest that the effect of the mutation T149(A)V at the GatA active
site has propagated to the GatB subunit. This observation is in accordance with
experimental results which show that the rate of phosphorylation of the
misacylated Glu-tRNAGln (reaction 3, Scheme 1) at the GatB active site is greatly
reduced in the T149(A)V mutant with respect to the wild-type GatCAB.
Furthermore, the changes in correlation pattern as shown by 4(E) and 4(F)
suggest that the mutation K89(B)R at the GatB subunit can also disrupt the
communication pathway between the GatA and GatB subunits which in
combination with the 4(C) and 4(D) results gives a sense of bi-directionality to the
communication pathway between the GatA and the GatB subunits.

32
Figure 4: The correlation difference plots for (A) wild+Gln correlation matrix
subtracted from E125(B)D+Gln correlation matrix; (B) wild+Gln correlation matrix
subtracted from E125(B)Q+Gln correlation matrix; (C) wild+Gln correlation matrix
subtracted from T149(A)V+Gln correlation matrix; (D) wild-Gln correlation matrix
subtracted from T149(A)V-Gln correlation matrix; (E) wild+Gln correlation matrix
subtracted from K89(B)R+Gln; (F) wild-Gln correlation matrix subtracted from
K89(B)R-Gln
In Figure 5, the correlation patterns of the T149(A) and K89(B) positions (in
wild-type GatCAB) with the other residues in the protein are compared against
the correlation patterns of V149(A) (the corresponding position in the T149(A)V
mutant) and R89(B) (the corresponding position in the K89R mutant) with all the
other amino acid residues.
33
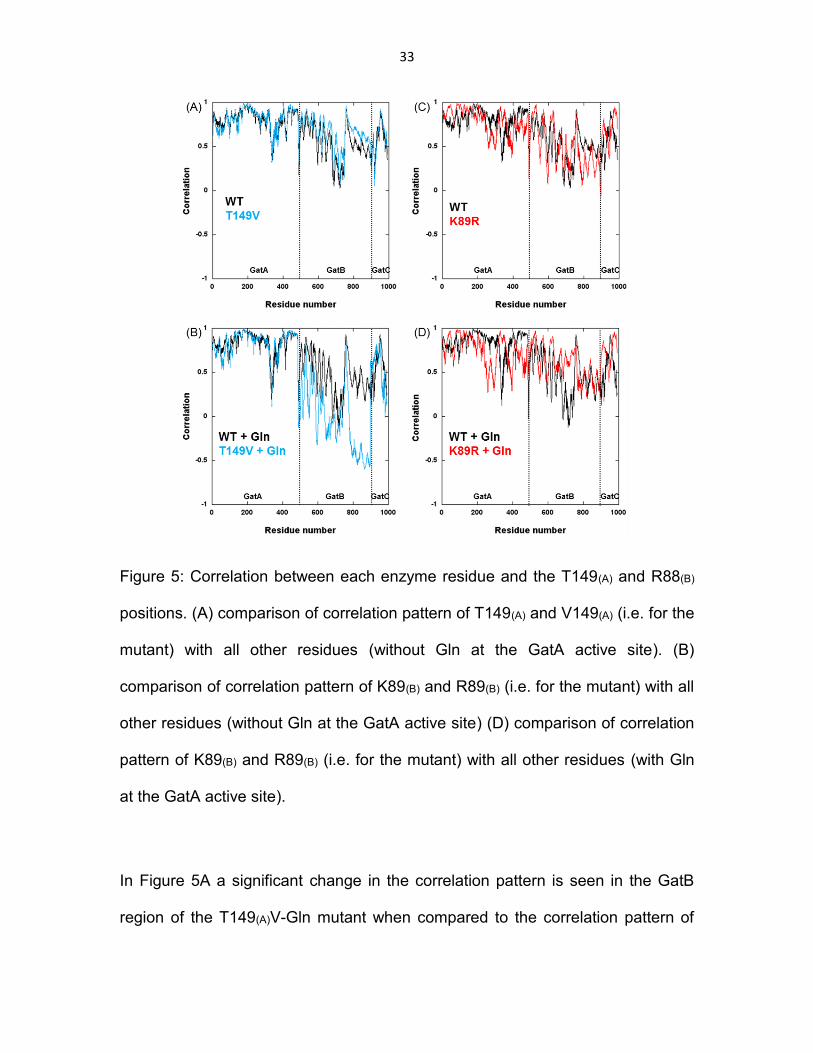
Figure 5: Correlation between each enzyme residue and the T149(A) and R88(B)
positions. (A) comparison of correlation pattern of T149(A) and V149(A) (i.e. for the
mutant) with all other residues (without Gln at the GatA active site). (B)
comparison of correlation pattern of K89(B) and R89(B) (i.e. for the mutant) with all
other residues (without Gln at the GatA active site) (D) comparison of correlation
pattern of K89(B) and R89(B) (i.e. for the mutant) with all other residues (with Gln
at the GatA active site).
In Figure 5A a significant change in the correlation pattern is seen in the GatB
region of the T149(A)V-Gln mutant when compared to the correlation pattern of
34
the wild-type. The mutation T149(A)V in the GatA active site has caused a change
in the correlation pattern in the GatB region. This observation further supports the
idea that a communication pathway exists between the GatA and GatB subunits.
This change in the correlation pattern is enhanced in the presence of Gln at the
GatA active site as shown in Figure 5B. The exact reason for this enhancement
is not clearly understood yet, although it suggests a controlled communication
pathway that is made more efficient by the presence of glutamine at the GatA
active site. In the case of the K89(B)R mutation there is a change in the
correlation pattern throughout all three subunits GatA, GatB, and GatC. K89(B)
residue is located at the interface of GatA and GatB subunits. The nature of the
change in correlation pattern suggests that the effect of the mutation at the
interface has propagated in the direction of GatA as well as GatB. This
observation further adds to the bi-directionality of the communication pathway
between the GatA and GatB subunits. Comparison of Figure 5(C) with 5(D)
shows again that the change in the correlation pattern is enhanced in the
presence of glutamine at the GatA active site.
2.4.2 Residue-wise root mean square deviation (RMSD) studies
Residue-wise RMSD values were calculated for the wild-type GatCAB and the
two mutants using the MD trajectories in the final 10 ns of the simulations. RMSD
differences were calculated by subtracting the residue-wise average RMSD
values of the wild-type, from those of the mutants as shown below.
ΔRMSDave = mutant RMSDave – WT RMSDave

35
These RMSD differences were mapped onto the structures to visualize the
residues with significant deviations. (Figure 6).
Figure 6: ΔRMSDave values mapped onto the corresponding simulated GatCAB
structures (A) ΔRMSDave between T149(A)V+Gln and wild+Gln. (B) ΔRMSDave
between T149(A)-Gln and wild-Gln. (C) ΔRMSDave between K89(B)R+Gln and
wild+Gln. (D) ΔRMSDave between K89(B)R-Gln and wild-Gln.
Higher deviations suggest larger structural perturbations due to the mutations
which would facilitate in identifying the amino acid residues involved in inter-
domain communication.
36
The percentage differences in RMSD values were calculated by dividing
ΔRMSDave by WT RMSDave. Analysis of these changes showed that in all four
mutant structures (i.e. T149(A)V+Gln, T149(A)-Gln, K89(B)R+Gln, and
K89(B)R+Gln) approximately 300 amino acid residues showed percentage
changes ≥ 20%. These four groups that showed higher percentage change in
RMSD, contained 59 amino acid residues that were common. This group of 59
amino acids were mapped onto the GatCAB structure to visualize their locations
(Figure 7).
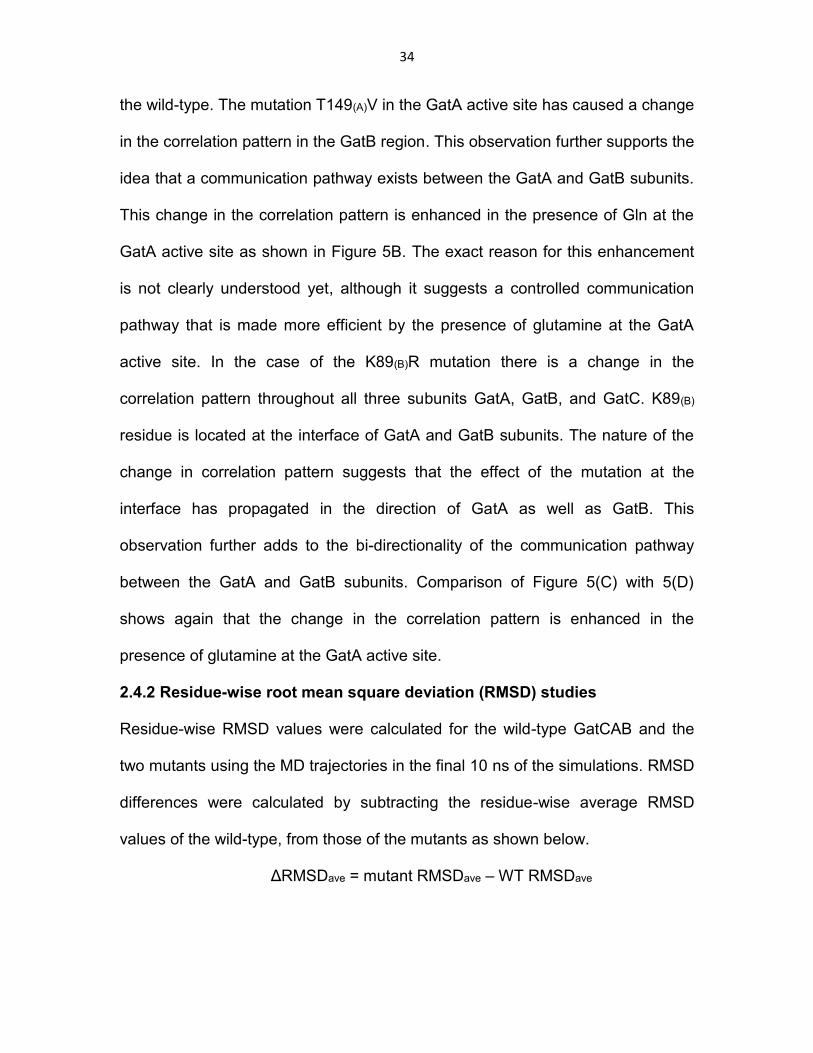
Figure 7: Locations of the 59 common amino acid residues (shown as blue
spheres) that show a percentage RMSD change ≥ 20%
The fact that these 59 residues are common to all four mutant structures
suggests that they may be involved in the communication pathway between the
GatA and GatB subunits. The 59 residues are mainly positioned around the two

37
active sites of GatA and GatB as well as between them. This positioning adds
further to the probability of them being candidates to the formation of a
communication pathway. Some residues out of this set belong to the GatC
subunit which indicates a possible involvement of GatC in communication.
Furthermore, contribution of these 59 residues to the inter-domain
communication suggests the existence of a common pattern of correlation in the
two mutants as well as in the wild-type GatCAB.
To check for a possible correlation pattern, a correlation analysis (Figure
8), as well as a correlation difference analysis (Figure 9), was carried out in the
same way as described in sections 2.3.2 and 2.4.1 for these 59 common
residues. As shown in Figure 10, the 59 residues in the mutants show low to
moderately high correlation differences with respect to the wild-type, which
further supports the fact that the correlation that exists between these 59
residues has been disrupted with respect to the wild-type, by the two mutations.
These results as a whole suggest the participation of these residues in an
extensive network of interactions that enable inter-domain communication
between GatA and GatB subunits.

38
Figure 8: The correlation plots for the 59 common amino acid residues. (A) Wild-
Gln; (B) Wild+Gln; (C) T149(A)V-Gln; (D) T149(A)V+Gln; (E) K89(B)R-Gln; (F)
K89(B)R+Gln.

39
Figure 9: The correlation difference plots for the 59 common amino acid
residues. (A) wild-type-Gln correlation matrix subtracted from T149(A)V-Gln
correlation matrix (B) wild-type+Gln correlation matrix subtracted from
T149(A)V+Gln correlation matrix (C) wild-type-Gln correlation matrix subtracted
from K89(B)R-Gln (D) wild-type+Gln correlation matrix subtracted from
K89(B)R+Gln
40
2.5 Conclusions
MD simulations have been performed on wild-type S.aureus GatCAB (PDB
ID:2F2A) and two mutants, T149(A)V and K89(B)R, to investigate the existence of
a possible communication pathway between the GatA and GatB subunits. MD
snapshots were subjected to residue-wise correlation analyses. The correlation
differences between the mutants and the wild-type GatCAB show that the
T149(A)V mutation at the GatA subunit significantly changes the correlation
pattern between the GatA and GatB subunits, which supports the existence of a
communication pathway between the GatA and GatB subunits. The changes in
the global correlation pattern of the K89(B) position due to K89(B)R mutation
suggest that the communication pathway is bidirectional. Average RMSD
difference analyses were able to identify 59 amino acid residues that are
common to both mutants that show significantly high changes in percentage
RMSD values which are probable candidates as constituent amino acids of the
communication pathway. The locations of this subset of residues being mainly
around and between the GatA and GatB active sites further adds to their ability to
connect the GatA and GatB subunits. The correlation difference plots of these 59
residues show low to moderately high correlation differences in the mutants with
respect to the wild-type, which further supports the fact that the correlation that
exists between these 59 residues has been disrupted, by the two mutations. This
evidence increases the likelihood of these group of residues being directly
involved in the inter-domain communication pathway.
41
CHAPTER 3
ANALYSIS OF D185(A) AS A PROBABLE CATALYTIC RESIDUE IN THE
AMMONIA DELIVERY MECHANISM OF HELICOBACTER PYLORI
GLUTAMINE-DEPENDENT AMIDOTRANSFERASE (GATCAB)
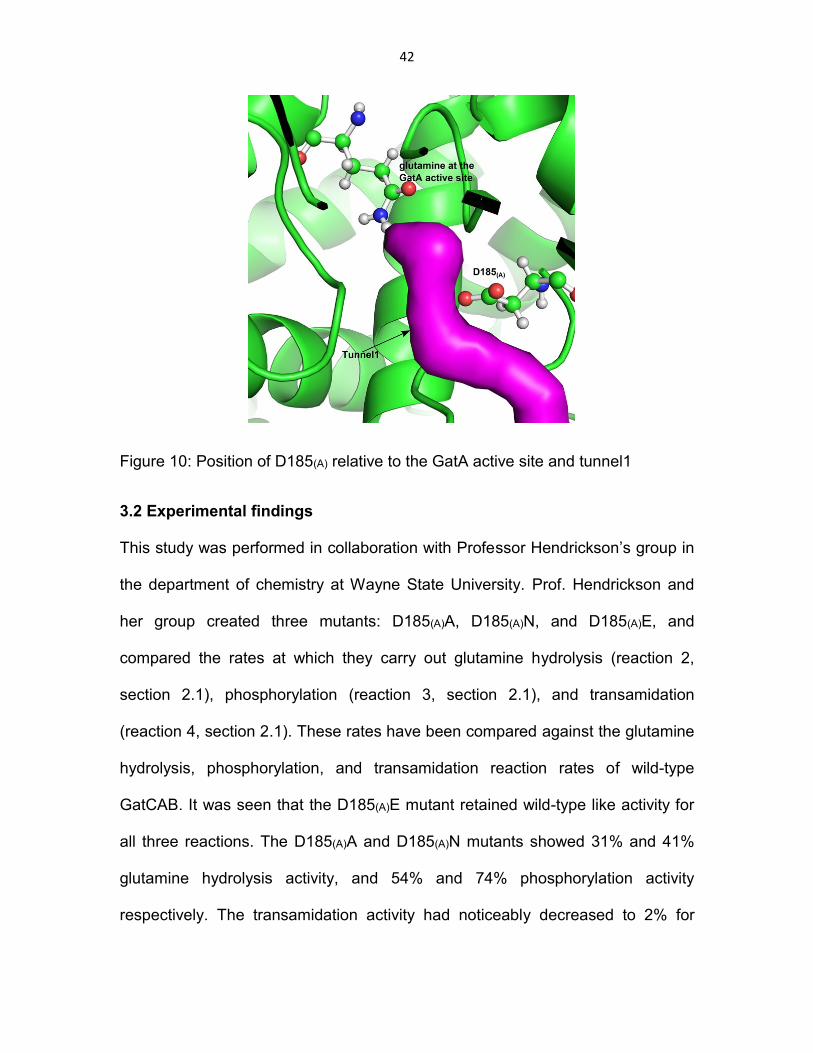
3.1 Introduction
As discussed in chapter 1, there is a putative intra-molecular tunnel to describe
the transport of ammonia from GatA active site to the GatB active site proposed
by Nakamura et al. in 2006 (tunnel1). Nakamura et al. further went on to show
that the tunnel connecting the GatA and GatB active sites was lined with many
hydrophilic amino acid residues as well as highly ordered water molecules.
Based on this evidence they proposed that the transfer of ammonia from GatA to
GatB through the intramolecular tunnel should occur via a series of
protonation/deprotonation reactions.1 This chapter describes an investigation into
the possibility of residue D185(A) acting as a catalytic acid/base in the
protonation/deprotonation of ammonia released at the GatA active site by
glutamine hydrolysis. D185(A) is located close to the GatA active site lining
tunnel1 (Figure 10).
42
Figure 10: Position of D185(A) relative to the GatA active site and tunnel1
3.2 Experimental findings
This study was performed in collaboration with Professor Hendrickson’s group in
the department of chemistry at Wayne State University. Prof. Hendrickson and
her group created three mutants: D185(A)A, D185(A)N, and D185(A)E, and
compared the rates at which they carry out glutamine hydrolysis (reaction 2,
section 2.1), phosphorylation (reaction 3, section 2.1), and transamidation
(reaction 4, section 2.1). These rates have been compared against the glutamine
hydrolysis, phosphorylation, and transamidation reaction rates of wild-type
GatCAB. It was seen that the D185(A)E mutant retained wild-type like activity for
all three reactions. The D185(A)A and D185(A)N mutants showed 31% and 41%
glutamine hydrolysis activity, and 54% and 74% phosphorylation activity
respectively. The transamidation activity had noticeably decreased to 2% for
43
D185(A)A and and 6% for D185(A)N. As previous studies have shown that the
rate-limiting step for GatCAB transamidation of misacylated tRNAs is either
ammonia migration through the tunnel or transamidation9, 117 (as opposed to
glutamine hydrolysis and/or phosphorylation), the reductions in rates of glutamine
hydrolysis and phosphorylation cannot account for the significant decrease in the
rate of transamidation. The only reasons that could describe the decrease in the
rate of transamidase activity are either the disruption of the communication
pathway between GatA and GatB subunits (which was proven to exist, as
described in chapter 2) or the disruption of ammonia migration through the tunnel
due to the loss of catalytic activity by the mutations at D185(A). To test the former,
computational analyses were carried out, the methods and results of which are
discussed below.
3.3 Computational analyses
3.3.1 MD simulations
All MD simulations were carried out using the S. aureus GatCAB as described in
chapter 2.3. The amino acid residue in S. aureus GatCAB enzyme that is
equivalent to the D185(A) in H. pylori is D211(A). MD simulations were carried out
for the wild-type GatCAB and the mutants D185(A)A, D185(A)N, and D185(A)E. The
crystal structure for S. aureus AdT (PDB ID: 2F2A) was taken from the Protein
Data Bank and hydrogenated using MolProbity.110, 122-124 All structures were
capped with acetyl and n-methyl acetamide, neutralized, and solvated with TIP3P
water in a rectangular box (approximate dimensions=125 Å × 96 Å ×142 Å) using
the tleap program of the AMBER11 software suite.68, 125 The systems were

44
minimized with 50 steps of steepest descent and 450 steps of conjugate gradient
followed by a density equilibration at 1 g/cm3 in the isothermal-isobaric (NPT)
ensemble and gradual heat up to 300 K in the canonical (NVT) ensemble over
250 ps. Subsequently, each system was simulated for 20 ns under periodic
boundary conditions in the NVT ensemble at 300 K keeping the temperature
constant using the Berendsen thermostat.121
3.3.2 Residue-wise correlation analyses
Correlation analyses were performed via the correl function in ptraj (a program
that processes MD trajectories in the AMBER11 software suite) to calculate the
correlation matrices of wild-type GatCAB and the mutants at the residue level
using the trajectory snapshots from the final 10 ns of each simulation. Correlation
differences were calculated by subtracting the wild-type correlation matrix from
that of each of the mutants.
3.3.3 pKa analyses
pKa calculations were carried out with the PropKa126, 127 software for all
conserved, ionizable tunnel residues in all three mutants and the wild-type
GatCAB using the snapshots obtained from the MD simulations.
3.4 Results and discussion
3.4.1 Residue-wise correlation analyses
The correlation difference plots (Figure 11) of the mutants against wild-type
GatCAB do not show significant differences in the correlation patterns. This
observation supports the hypothesis that the mutations D185(A)A and D185(A)N at
the D185(A) position didn’t disrupt the communication pathway between the GatA

45
and GatB active sites. This conclusion left us with the possibility that the
decrease of the transamidase activity at the GatB active site was due to the
disruption of ammonia migration through the tunnel caused by the D185(A)
mutations. As the D185(A)E mutant retained wild-type activity, it suggests that the
D185(A)A and D185(A)N mutations disrupted ammonia transport. This evidence
emphasizes the importance of the retention of the carboxylic acid side chain of
D185(A) for the acid/base catalytic activity, the loss of which prevents the required
protonation/deprotonation activity which subsequently leads to the disruption of
ammonia transport.
Figure 11: Correlation differences of (A) D185(A)A against wild-type; (B) D185(A)N
against wild-type; (C) D185(A)N against wild-type.
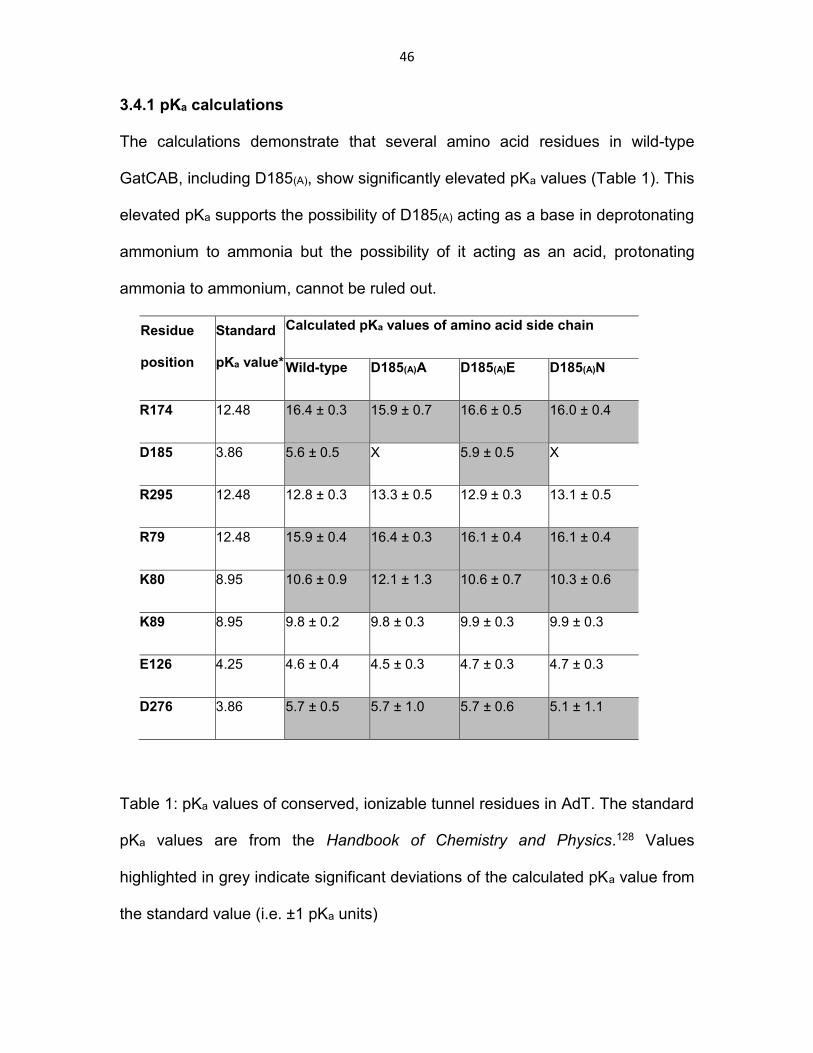
46
3.4.1 pKa calculations
The calculations demonstrate that several amino acid residues in wild-type
GatCAB, including D185(A), show significantly elevated pKa values (Table 1). This
elevated pKa supports the possibility of D185(A) acting as a base in deprotonating
ammonium to ammonia but the possibility of it acting as an acid, protonating
ammonia to ammonium, cannot be ruled out.
Table 1: pKa values of conserved, ionizable tunnel residues in AdT. The standard
pKa values are from the Handbook of Chemistry and Physics.128 Values
highlighted in grey indicate significant deviations of the calculated pKa value from
the standard value (i.e. ±1 pKa units)
Residue
position
Standard
pKa value*
Calculated pKa values of amino acid side chain
Wild-type D185(A)A D185(A)E D185(A)N
R174 12.48 16.4 ± 0.3 15.9 ± 0.7 16.6 ± 0.5 16.0 ± 0.4
D185 3.86 5.6 ± 0.5 X 5.9 ± 0.5 X
R295 12.48 12.8 ± 0.3 13.3 ± 0.5 12.9 ± 0.3 13.1 ± 0.5
R79 12.48 15.9 ± 0.4 16.4 ± 0.3 16.1 ± 0.4 16.1 ± 0.4
K80 8.95 10.6 ± 0.9 12.1 ± 1.3 10.6 ± 0.7 10.3 ± 0.6
K89 8.95 9.8 ± 0.2 9.8 ± 0.3 9.9 ± 0.3 9.9 ± 0.3
E126 4.25 4.6 ± 0.4 4.5 ± 0.3 4.7 ± 0.3 4.7 ± 0.3
D276 3.86 5.7 ± 0.5 5.7 ± 1.0 5.7 ± 0.6 5.1 ± 1.1

47
The evidence given above which suggests that D185(A) most probably acts as a
catalyitc base supports the protonation/deprotonation mechanism of ammonia
transport that was proposed by Nakamura et al. in 2006.
pKa calculations of the mutants show that there is no significant change
in the calculated pKa values of the ionizable side chains in the tunnel when
compared to the wild-type. This consistency suggests that there was no
disruption of the chemistry of the other tunnel residues due to mutation at the
D185(A) position.
3.5 Conclusions
MD simulations were performed on wild-type GatCAB and the mutants D185(A)A,
D185(A)N, and D185(A)E. Correlation difference analyses, and average pKa
calculations were performed using the snapshots of the MD trajectories.
Correlation difference analyses show that the mutations D185(A)A, D185(A)N, and
D185(A)E do not disrupt inter-domain communication between the GatA and GatB
subunits. This conclusion, combined with the experimental result that the
D185(A)E mutant retains wild-type enzyme activity, suggests that the decrease in
the transamidase activity at the GatB active site caused by the mutations is due
to disruption of ammonia migration through the tunnel. These results further
show that the retention of the carboxylic acid side chain of D185(A) is important.
The significant increase in the calculated pKa values of the wild-type D185(A)
(with respect to the free amino acid) indicates the possibility of D185(A) acting as
a catalytic base, converting ammonium ions to ammonia. To our knowledge, this
is the first instance of catalysis inside an intramolecular tunnels, in contrast to

48
other hydrophobic tunnels found in GATs as well as the partially hydrophilic
tunnel found in CPS. These experimental and computational results, supports the
previously proposed hypothesis that the transfer of ammonia through the
intramolecular tunnel in the GatCAB enzyme happens via a series of
protonation/deprotonation reactions.
49
CHAPTER 4
COMPUTATIONAL ANALYSIS OF AMMONIA TRANSFER ALONG TWO
INTRA-MOLECULAR TUNNELS IN STAPHYLOCOCCUS AUREUS
GLUTAMINE-DEPENDENT AMIDOTRANSFERASE (GATCAB)
Reprinted (adapted) with permission from Dewage, S.W. and G.A. Cisneros,
Computational Analysis of Ammonia Transfer Along Two Intramolecular Tunnels
in Staphylococcus aureus Glutamine-Dependent Amidotransferase (GatCAB). J
Phys Chem B, 2015. 119(9): p. 3669-77.
4.1 Introduction
Two putative intra-molecular tunnels (Figure 12) have been proposed to explain
the passage of ammonia from the GatA subunit to the GatB subunit. The first
tunnel, tunnel1, which was already discussed in chapter 2, was proposed by
Nakamura et al. based on their crystallographic structure.1 Subsequently, Kang
et al. proposed an alternative path (tunnel2), based on molecular dynamics (MD)
simulations.17 Tunnel2 was proposed to be the preferred path based on umbrella
sampling calculations. The potentials of mean force calculated for both paths
were obtained starting from two different points, labeled K1 and K2 in Figure 12,
and spanning 4 Å into each tunnel.17 This chapter presents the investigation of
the statistics, structure and energetics of passive ammonia transport through
both tunnels based on classical MD simulations. The details for the MD
simulations, calculation of tunnel probability starting at three different points
along the path, umbrella sampling/WHAM analysis for the energetics of ammonia
transport, and energy decomposition and APBS analyses are presented.

50
Subsequently, the analysis for ammonia transport along both tunnels is
presented, followed by concluding remarks.
Figure 12: The two tunnels and different starting points for free energy
calculations. The path N, K1, J, X denotes tunnel1 and the path N, K2, J, X
denotes tunnel2. The junction of the two tunnels is located at the point marked by
J. The two entrance points used by Kang et al.17 are K1 and K2. The common
exit point of the two tunnels is denoted by X. The Mg2+ ion at the GatB active site
is also shown.

51
4.2 Methods
This subsection discusses the computational procedures followed and the
subsequent analyses carried out, beginning with the molecular dynamics
simulations as described in Subsection 4.2.1 and the four types of analyses:
CAVER analysis, WHAM (Weighted histogram analysis method) analysis, energy
decomposition analysis (EDA), and the APBS (Adaptive Poisson-Boltzmann
solver) analysis described in Subsections 4.2.2, 4.2.3, and 4.2.4 respectively.
4.2.1 Molecular dynamics simulations on wild-type and mutant structures
Eight different systems were considered initially, which involved mutations to two
of the subunits. Since GatCAB is comprised of three subunits, each subunit is
denoted by a subscript. The eight systems include wild type with glutamine in the
GatA active site (Wild+Gln), wild type without glutamine in the GatA active site
(Wild-Gln), T175(A)V with glutamine in the GatA active site (T175(A)V+Gln),
T175(A)V without glutamine in the GatA active site (T175(A)V-Gln), K88(B)R with
glutamine in the GatA active site (K88(B)R+Gln), K88(B)R without glutamine in the
GatA active site (K88(B)R-Gln), E125(B)D with glutamine in the GatA active site
(E125(B)D+Gln), and E125(B)Q with glutamine in the GatA active site
(E125(B)Q+Gln). The mutants were selected based on our previous studies on
GatCAB.18
All MD simulations were performed using the PMEMD program of the
AMBER12 software suite with the ff99SB potential.68 The SHAKE algorithm was
applied to bonds between hydrogen and heavy atoms.118 Periodic boundary
conditions were used for the explicit solvent calculations. Long-range interactions
52
were accounted for by the smooth particle mesh Ewald (SPME) method.119, 120
Hydrogens were added to the crystal structure using MolProbity.123, 124 N termini
of the protein were capped with acetyl (ACE) groups and the C termini were
capped with N-methyl acetamide (NME) groups. Each system was neutralized by
adding Na+ ions (wild-type GatCAB, T175(A)V, K88(B)R, E125(B)D systems were
neutralized by adding 41 Na+ ions and the E125(B)Q system was neutralized by
adding 40 Na+ ions) and solvated in rectangular boxes of TIP3P water, with a 15
Å buffer (final dimensions approximately 125 Å × 96 Å × 142 Å), using the tleap
program of AMBER12. The total number of atoms in the final solvated,
neutralized wild-type GatCAB system was 183394. All systems were minimized
using sander with 50 steps of steepest descent and 450 steps of conjugate
gradient while keeping the protein and the substrates restrained with a force
constant of 500 kcal mol-1Å-2. The density for each system was equilibrated to 1 g
cm-3 in the NPT ensemble. The temperature of each system was increased to
300K in ten stages (20 ps at each stage) while keeping the protein and the
substrates restrained with a force constant of 500 kcal mol-1Å-2. Subsequently,
the restraints were gradually removed over 100 ps, followed by 20 ns of
unconstrained MD on all systems while keeping the temperature at 300 K using
the Berendsen thermostat121 in the canonical ensemble.
4.2.2 CAVER analysis
Thirty random snapshots were selected from the final 10 ns of each of the eight
trajectories resulting in the selection of 240 snapshots. Tunnels were calculated
using CAVER version 2.1.2,75 for each selected snapshot with K1, K2, and the
53
GatA active site (see Figure 12) as starting points. K1 was defined by residues
Asn81(A), Ala128(A), Val204(A), Ala205(A) , Phe206(A) . K2 comprises residues
Leu203(A), Ala205(A), Phe206(A) and Asp211(A). The GatA active site was defined
by residues Lys79(A), Ser154(A), Ser173(A), Thr175(A), and, Ser177(A). Tunnels
obtained from the calculation were categorized as either tunnel1 or tunnel2
based on whether they followed the N, K1, J, X or N, K2, J, X paths respectively.
Some tunnels could not be categorized as either tunnel1 or tunnel2 due to steric
constraints.
4.2.3 Umbrella sampling and WHAM calculations
The initial structure for the potential of mean force (PMF) calculations was
selected from a snapshot from the Wild+Gln simulation, which includes both
tunnels. The coordinate positions along the tunnels were obtained directly from
the CAVER 2.1.2 plugin in PyMOL using the default values. Geometry of the
ammonia molecule was optimized at MP2/6-31G* level and the RESP partial
charges -1.0749, 0.3583, 0.3583, 0.3583 were used for the N, H1, H2, and H3
atoms respectively. Once the coordinates for the tunnels were obtained,
ammonia molecules were positioned to achieve a spacing between adjacent
umbrella windows of 0.3 Å. A window spacing of 0.2 Å was used in some places
along the tunnels, considering the curvature, to achieve better sampling. Tunnel1
was populated with 63 ammonia molecules and tunnel2 was populated with 68
ammonia molecules. The umbrella sampling method20 was used to restrain the
positions for each ammonia at selected points along the tunnels. The distance,
R, between the nitrogen atom of each ammonia molecule and the γ carbon of the

54
glutamine bound in the GatA active site was chosen as the sampling dimension.
The position of the first ammonia (N) corresponds to R=5.0 Å. This initial position
was chosen due to its close proximity to the bound glutamine, the hydrolysis of
which releases ammonia. The distance R=5.0 Å at this point was set to R=0.0 Å
thus making it the reference point for the distance measurement. The PMFs for
all systems were calculated for the range 0.0 Å ≤ R ≤ 13.5 Å. This range involves
the section of the path where the PMF can be described by a 1D coordinate. The
remainder of the path (i.e. R > 13.5 Å) involves higher dimensional sections,
which will be investigated in the future. However, the section studied herein
seems to be sufficient to determine which tunnel is energetically favored (see
below).
A harmonic potential of 20 kcal mol-1Å-2 was applied to restrain the motion
of the ammonia molecule in each window. All umbrella sampling simulations
were performed using the PMEMD program of the AMBER12 package.68 Each
window was sampled for 1 ns. Sampling was done in both explicit solvent (TIP3P
water model)125 and implicit solvent (Generalized Born model).129 All simulations
were performed at 300K temperature using the Langevin thermostat.130 The two
tunnels have been divided into three regions as denoted in Figure 13. Regions 1
(0.0 Å< R < 5.2 Å) and 3 (R > 16.2Å) are common to both tunnels. Region 2
(5.2Å < R < 16.2Å) comprises the section where the tunnels differ.
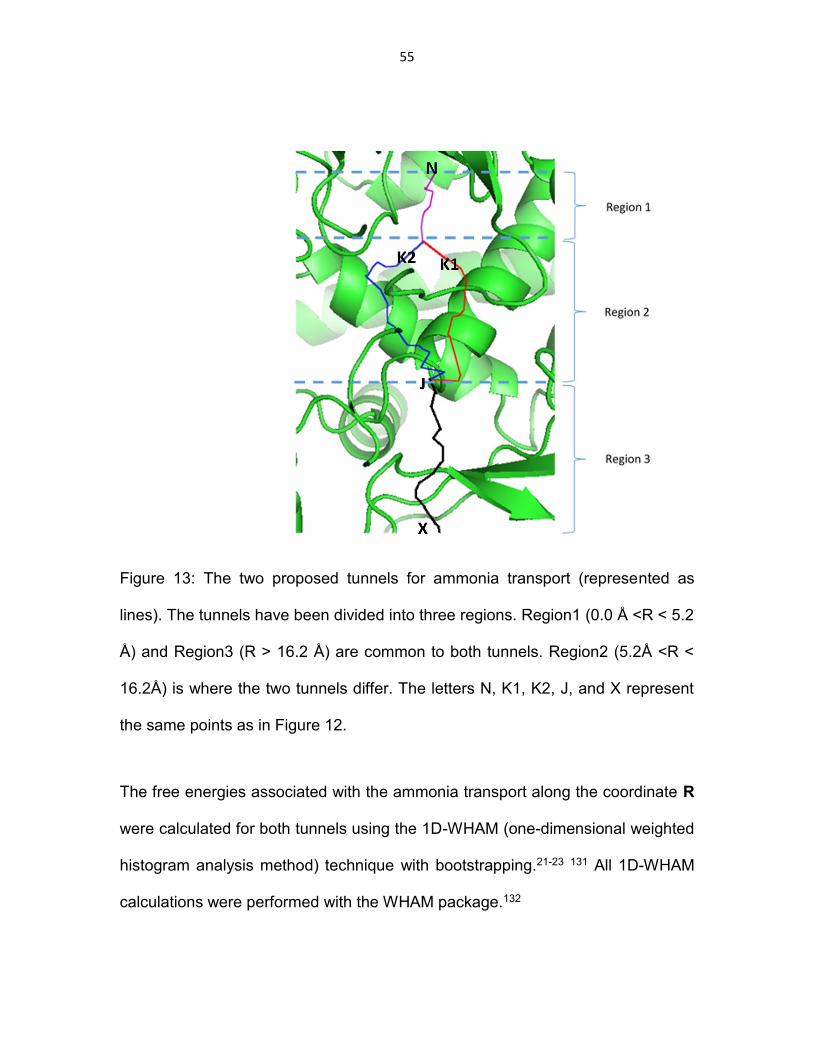
55
Figure 13: The two proposed tunnels for ammonia transport (represented as
lines). The tunnels have been divided into three regions. Region1 (0.0 Å <R < 5.2
Å) and Region3 (R > 16.2 Å) are common to both tunnels. Region2 (5.2Å <R <
16.2Å) is where the two tunnels differ. The letters N, K1, K2, J, and X represent
the same points as in Figure 12.
The free energies associated with the ammonia transport along the coordinate R
were calculated for both tunnels using the 1D-WHAM (one-dimensional weighted
histogram analysis method) technique with bootstrapping.21-23 131 All 1D-WHAM
calculations were performed with the WHAM package.132

56
4.2.4 Energy decomposition analysis and adaptive Poisson-Boltzmann
solver calculations
Energy decomposition analysis (EDA) was used to investigate the non-bonded
interactions of ammonia with individual residues at selected points along the
path. The average non-bonded interaction between a particular ammonia, and
every other residue, ΔEint, is approximated by
iint EE
where i represents an individual residue, ΔEi represents the non-bonded
interaction (electrostatic or Van der Waals) between residue i and the selected
ammonia (the interactions between the ammonia and waters or counter-ions are
not taken into account), and the broken brackets represent averages over the
ensemble obtained from the MD simulations. This analysis has been used
previously in QM/MM and classical simulations to investigate interactions
between individual residues and ligands or enzyme active sites.133-144 All
energies and energy differences were obtained with an in-house FORTRAN90
program. This program reads the saved snapshots from the MD simulations and
the corresponding AMBER parameter set to determine the required non-bonded
interactions using the above equation. The adaptive Poisson-Boltzmann solver
(APBS) plugin145 of the PyMOL76 software suite was used to visualize the
electrostatic surface around selected ammonia molecules and the surrounding
residues. This plugin uses a parallel focusing method to solve the Poisson-
Boltzmann equation in evaluating the electrostatic potential.
(13)
(1)

57
4.3 Results and Discussion
This section presents the results obtained from the MD and further analysis for
the passive ammonia transport along the two tunnels in GatCAB. In Subsection
4.3.1 the results of the CAVER analysis for selected MD snapshots to investigate
the prevalence of each tunnel along the trajectory are discussed. This is
followed by the presentation of the free energy profiles obtained from the
umbrella sampling and WHAM calculations in Subsection 4.3.2. This subsection
also presents the EDA and APBS analysis on different regions of the tunnels to
provide further insights on the characteristics of the calculated potentials of mean
force (PMFs).
4.3.1 Probability of occurrence of tunnel1 and tunnel2
CAVER analysis was carried out on thirty snapshots for each of the systems
studied as explained in Subsection 4.2.1. Based on the CAVER analysis, almost
25% of the tunnels correspond to tunnel2 compared to 5% occurrence of tunnel1
when the starting point of the tunnel calculation is the GatA active site (see
Table 2). This shows that tunnel2 has a higher probability of occurrence when
compared to tunnel1 based solely on steric constraints.
When the tunnel calculation is started from K2, which is a part of tunnel2,
45.42% of the tunnels fall under the tunnel2 category, compared to 3.75% for the
tunnel1 category (Table 4). In contrast, 15.42% of the tunnels correspond to
tunnel2 compared to 8.75% for tunnel1 when starting the calculation at K1 (Table
3). This shows that even when starting from a point in tunnel1, there is a higher
probability to switch back to tunnel2. There is almost no switching back to
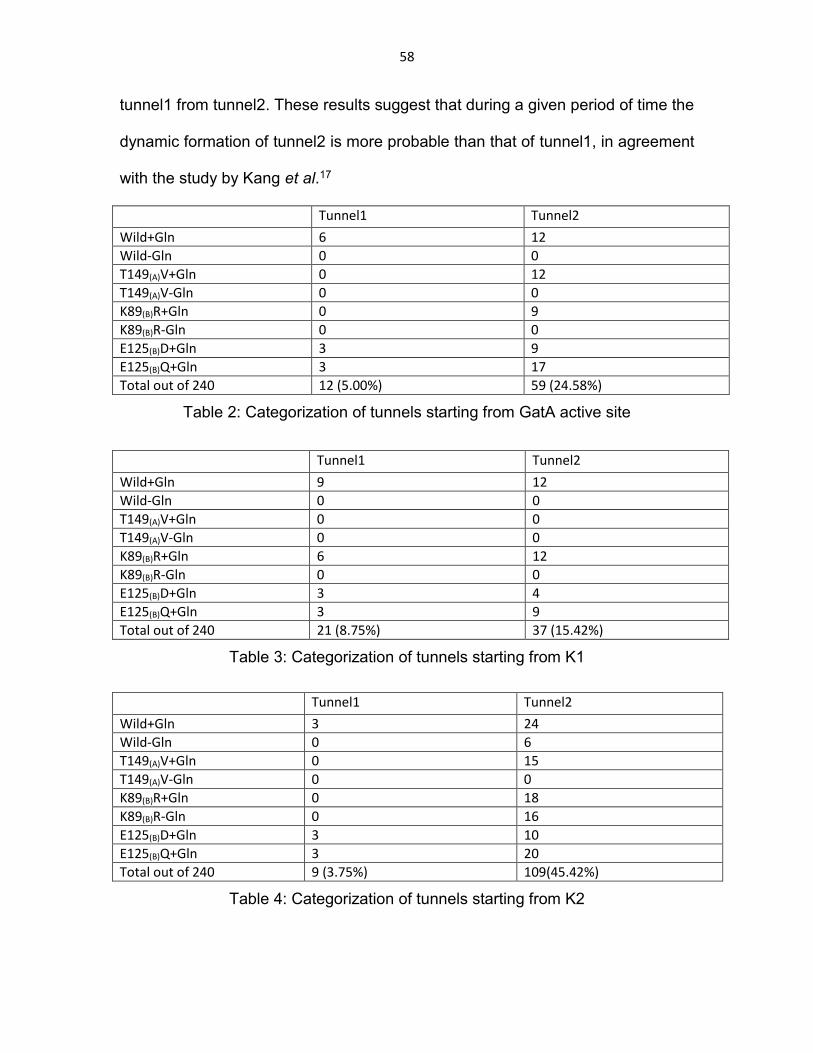
58
tunnel1 from tunnel2. These results suggest that during a given period of time the
dynamic formation of tunnel2 is more probable than that of tunnel1, in agreement
with the study by Kang et al.17
Tunnel1 Tunnel2
Wild+Gln 6 12
Wild-Gln 0 0
T149(A)V+Gln 0 12
T149(A)V-Gln 0 0
K89(B)R+Gln 0 9
K89(B)R-Gln 0 0
E125(B)D+Gln 3 9
E125(B)Q+Gln 3 17
Total out of 240 12 (5.00%) 59 (24.58%)
Table 2: Categorization of tunnels starting from GatA active site
Table 3: Categorization of tunnels starting from K1
Table 4: Categorization of tunnels starting from K2
Tunnel1 Tunnel2
Wild+Gln 9 12
Wild-Gln 0 0
T149(A)V+Gln 0 0
T149(A)V-Gln 0 0
K89(B)R+Gln 6 12
K89(B)R-Gln 0 0
E125(B)D+Gln 3 4
E125(B)Q+Gln 3 9
Total out of 240 21 (8.75%) 37 (15.42%)
Tunnel1 Tunnel2
Wild+Gln 3 24
Wild-Gln 0 6
T149(A)V+Gln 0 15
T149(A)V-Gln 0 0
K89(B)R+Gln 0 18
K89(B)R-Gln 0 16
E125(B)D+Gln 3 10
E125(B)Q+Gln 3 20
Total out of 240 9 (3.75%) 109(45.42%)
59
In contrast to the number of instances of tunnel1 and tunnel2 in Wild+Gln, there
is an overall decrease in the occurrence of both tunnels in T175(A)V, K88(B)R,
E125(B)D, and E125(B)Q mutants. The overall decrease in the tunnel formation for
the T175(A)V and K88(B)R mutants is in accordance with results from our previous
study18 on H. pylori GatCAB enzyme, which showed that the corresponding
mutants T149(A)V and K89(B)R have a marked decrease in the rate of
phosphorylation (Chapter 2, reaction 3) at the GatB active site.
The CAVER algorithm simplifies the substrate molecule (the whole
ammonia molecule) to a sphere. It also simplifies the protein atoms to spheres
whose magnitudes are governed by Van der Waals radii. The algorithm
determines the existence of the tunnel purely based on steric considerations and
it does not consider actual inter-molecular interactions. This steric nature of the
calculation prevents any insight into the energetics of transport along the tunnel.
Therefore, to gain further insight, umbrella sampling/WHAM calculations were
carried out as detailed below.
4.3.2 Free energy profiles for ammonia transport along tunnel1 and tunnel2
The PMFs for the transfer of ammonia in explicit versus implicit solvent are
shown in Figure 14 and Figure 15 respectively. It can be seen that the relative
shapes of free energy profiles for tunnel1 and tunnel2 look similar in both implicit
and explicit solvents. The region 0.0 Å ≤ R ≤ 5.2 Å (region 1 in Figure 13) is
common to both tunnel1 and tunnel2. As expected, the free energy profile of both
tunnels overlap in this region. The point at R=0.0 Å corresponds to point N
(Figure 13), which was the starting point of free energy calculations. Bootstrap

60
analyses40 (see Figures 16-19) were done to validate the reproducibility of the
data for each free energy calculation. To enable the comparison of all calculated
PMFs, all free energies were calculated relative to point R=2.5 Å (common to
both tunnel1 and tunnel2). For tunnel1, the calculated free energy barrier for
ammonia transfer is 3.64 kcal/mol in explicit solvent and 1.23 kcal/mol in implicit
solvent. For tunnel2, the calculated free energy barrier is to 7.98 kcal/mol in
explicit solvent and 2.93 kcal/mol in implicit solvent.
The previous study by Kang et al17 concluded that tunnel2 is preferred
over tunnel1. However, the free energy differences calculated in that study were
limited to a region spanning 4 Å along an imaginary Z axis that begins at the
initial position of ammonia, proceeds to both entrance points (given by K1 and K2
in our study), and connects the initial point with the Mg2+ ion at the GatB active
site. In our study, the two entrance points K1 and K2 correspond to R=6.1 Å
along tunnel1 and R=6.3 Å along tunnel2 respectively. We have studied the two
tunnels from R=0.0 Å to R=13.5 Å. Our study shows that, although there is a
slight preference for tunnel2 over tunnel1 at the entrance points of the two
tunnels (5.3 Å ≤ R ≤ 6.4 Å), as ammonia moves further along each tunnel, the
calculated relative free energy of transport for ammonia is significantly lower for
tunnel1.

61
Figure 14: Free energy of ammonia transfer along the two types of tunnels for 0.0
Å ≤ R ≤13.5 Å in explicit solvent.
Figure 15: Free energy of ammonia transfer along the two types of tunnels for 0.0
Å ≤ R ≤13.5 Å in implicit solvent.

62
Figure 16: Bootstrapping in tunnel1 with explicit solvent
Figure 17: Bootstrapping in tunnel2 with explicit solvent

63
Figure 18: Bootstrapping in tunnel1 with implicit solvent
Figure 19: Bootstrapping in tunnel2 with implicit solvent
64
A rise in free energy at the beginning of the PMF (R≈0.0 Å) is observed for the
explicit solvent simulations compared with the region around R≈1.5 Å. At the
beginning of the sampling coordinate, R≈0.0 Å, the ammonia molecule exhibits
large (attractive) electrostatic interactions with K79(A), A128(A), T175(A), and
D211(A) based on the EDA calculations as shown in Figure 20. The attraction
between ammonia and A128(A) at R≈0.0 Å, as observed by visualizing the
trajectory, is due to the formation of a hydrogen bond between the –NH hydrogen
atom of the peptide bond and the nitrogen atom in ammonia. Analysis of the MD
trajectories at R≈1.5 Å, shows that the ammonia moves towards a more polar
environment created by K79(A), and D211(A), compared to the environment
around R≈0.0 Å.
The ammonia molecule shows a significant attraction in both sections of
the PMF to K79(A), and D211(A) . However, at R≈1.5 Å, the attraction is larger than
that at R≈0.0 Å, leading to greater stabilization of the ammonia at R≈1.5 Å. This
greater attraction is due to ammonia getting trapped in the interspace between
K79(A), and D211(A) making hydrogen bonds with both of them as shown in Figure
21. The difference in the sum of electrostatic and Van der Waals interactions
between ammonia and the protein residues in the explicit solvent as calculated
by EDA results in approximately an 2.7 kcal/mol lowering in energy at R≈1.5 Å
with respect to R≈0.0 Å. This energy difference agrees with the free energy
difference of 3.1 kcal/mol calculated by WHAM as shown in the PMF plot in
Figure 14.
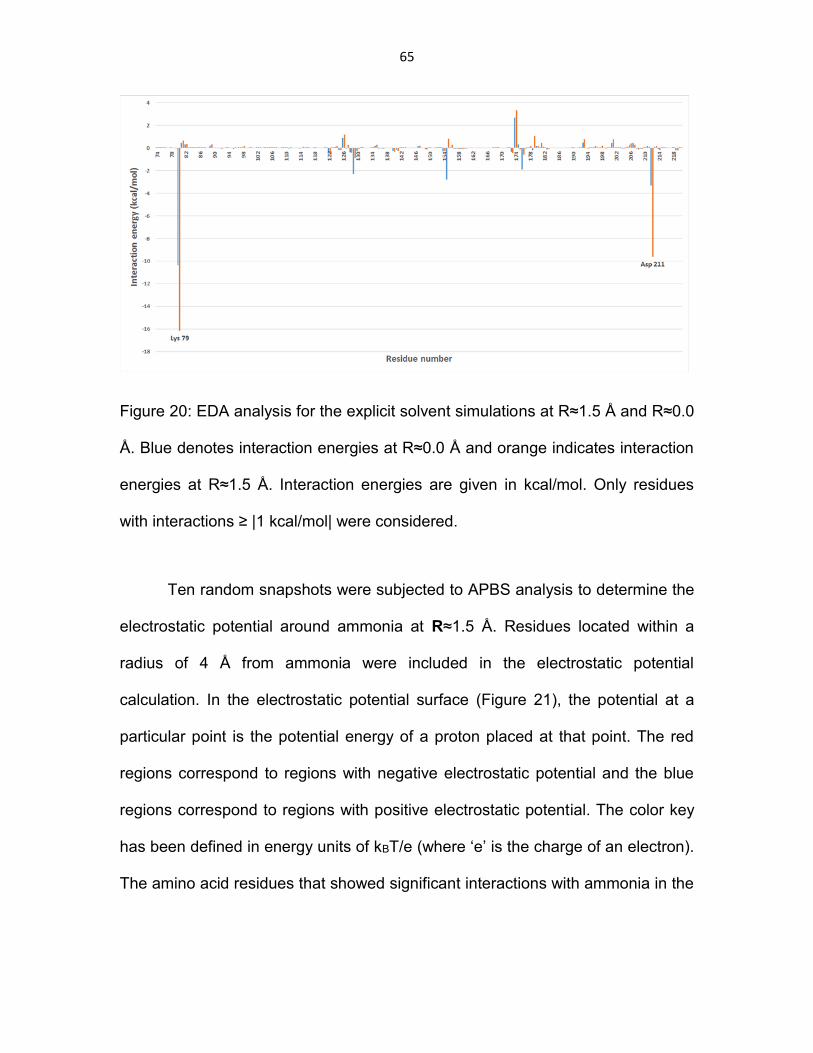
65
Figure 20: EDA analysis for the explicit solvent simulations at R≈1.5 Å and R≈0.0
Å. Blue denotes interaction energies at R≈0.0 Å and orange indicates interaction
energies at R≈1.5 Å. Interaction energies are given in kcal/mol. Only residues
with interactions ≥ |1 kcal/mol| were considered.
Ten random snapshots were subjected to APBS analysis to determine the
electrostatic potential around ammonia at R≈1.5 Å. Residues located within a
radius of 4 Å from ammonia were included in the electrostatic potential
calculation. In the electrostatic potential surface (Figure 21), the potential at a
particular point is the potential energy of a proton placed at that point. The red
regions correspond to regions with negative electrostatic potential and the blue
regions correspond to regions with positive electrostatic potential. The color key
has been defined in energy units of kBT/e (where ‘e’ is the charge of an electron).
The amino acid residues that showed significant interactions with ammonia in the
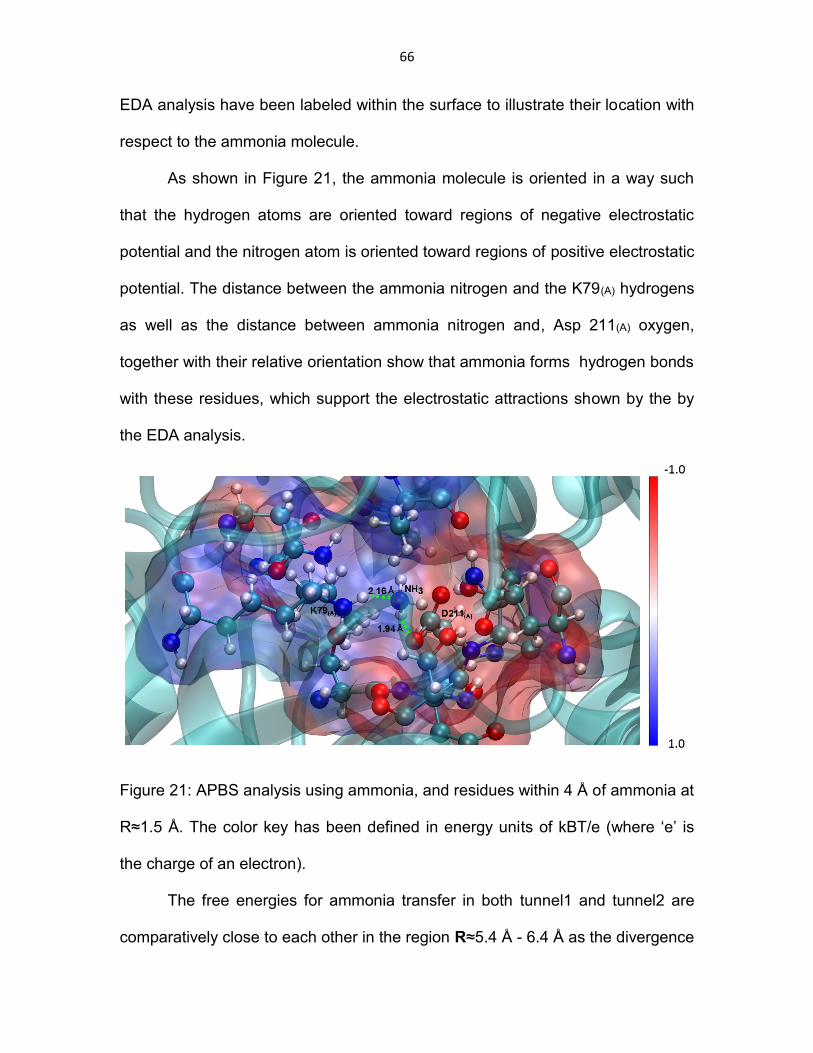
66
EDA analysis have been labeled within the surface to illustrate their location with
respect to the ammonia molecule.
As shown in Figure 21, the ammonia molecule is oriented in a way such
that the hydrogen atoms are oriented toward regions of negative electrostatic
potential and the nitrogen atom is oriented toward regions of positive electrostatic
potential. The distance between the ammonia nitrogen and the K79(A) hydrogens
as well as the distance between ammonia nitrogen and, Asp 211(A) oxygen,
together with their relative orientation show that ammonia forms hydrogen bonds
with these residues, which support the electrostatic attractions shown by the by
the EDA analysis.
Figure 21: APBS analysis using ammonia, and residues within 4 Å of ammonia at
R≈1.5 Å. The color key has been defined in energy units of kBT/e (where ‘e’ is
the charge of an electron).
The free energies for ammonia transfer in both tunnel1 and tunnel2 are
comparatively close to each other in the region R≈5.4 Å - 6.4 Å as the divergence

67
into two different tunnels from the branching point at R≈5.2 Å is minimal in this
region. Analysis of the MD trajectory for tunnel1 shows that, as the ammonia
molecule progresses from the hydrophilic 1.5 Å ≤ R ≤ 3.5 Å region to R≈6.0 Å, it
gets closer to a hydrophilic environment created by residues R200(A), A207(A),
D211(A) (Figure 22).
Other than the attractive interactions with R200(A) and D211(A) , the EDA
analysis at R≈6.0 Å (see Figure 23) also shows attractive interactions with
A207(A), which are mainly due to hydrogen bonding between the nitrogen atom of
ammonia and the –NH hydrogen of the peptide bond between A207(A) and
F206(A). The difference in the sum of electrostatic and Van der Waals interactions
between ammonia and all protein residues in the explicit solvent simulation
calculated by EDA between R≈1.5 Å and R≈6.0 Å (see Figure 23) is around 3.2
kcal/mol, in close agreement with the barrier of 3.6 kcal/mol. This result suggests
that the change in non-bonded interactions between the minimum (R≈1.5 Å) and
the highest energy region (R≈6.0 Å ) is mainly due to the reduction of attractive
non-bonded interactions in the section corresponding to R≈6.0 Å in comparison
with R≈1.5 Å. It should be noted that in the proposal of tunnel1 from the original
crystal structure, it was suggested that R200(A) and D211(A) could form hydrogen
bonds to an ammonia molecule at the same time. Based on our results, it is
observed that throughout the simulation, the hydrophilic side chains of R200(A)
and D211(A) are pointed away from each other. This orientation of the side-chains
diminishes the chances of entrapment of the ammonia molecule in the interspace
between R200(A) and D211(A).

68
Figure 22: Ammonia in the hydrophilic environment in the region R≈6.0 Å inside
tunnel1.
Figure 23: Explicit solvent EDA analysis at R≈6.0 Å in tunnel1 (showing the most
prominent peaks)

69
Immediately after the branching point in tunnel2, in the region R≈6.0 Å, ammonia
enters the hydrophilic environment created by residues K79(A) and D211(A)
(Figure 24). Existence of these attractive interactions are further confirmed by the
EDA analysis (see Figure 25). The difference in the sum of electrostatic and Van
der Waals interactions between ammonia and all protein residues in the explicit
solvent simulation as calculated by EDA gives a change in energy of ≈2.6
kcal/mol between R≈6.0 Å and R≈1.5 Å, which is in close agreement to the free
energy barrier of 3.2 kcal/mol increase at R≈6.0 Å calculated by WHAM. As
shown in Figure 24, the ammonia molecule is oriented in such a way that the
nitrogen atom of ammonia is pointed towards the hydrogen atoms of the –NH3+
group of K79(A) and the hydrogen atoms of ammonia are pointed towards the
oxygen atoms of the carboxyl group of D211(A) , which facilitate formation of
hydrogen bonding.

70
Figure 24: Ammonia in the hydrophilic environment in the region R≈6.0 Å inside
tunnel2

71
Figure 25: Explicit solvent EDA analysis at R≈6.0 Å in tunnel2 (showing the most
prominent peaks)
Figure 26: Ammonia in a hydrophobic environment in the region 6.5 Å ≤ R ≤ 8.5
Å inside tunnel2.

72
Figure 27: Explicit solvent EDA analysis at R≈8.5 Å in tunnel2 (showing the most
prominent peaks)
A sharp rise in free energy is observed in tunnel2 between R=6.5 Å and R=8.5Å.
This rise in free energy for tunnel2 can be attributed to the lack of attractive
interactions between ammonia and the surrounding residues with respect to the
attractive forces experienced in the R≈1.5 Å region. The only significant attractive
force experienced by ammonia, as shown by the EDA analysis (Figure 27) are
due to N81(A) and C91(A). Other than this, the ammonia molecule is in a relatively
hydrophobic region (Figure 26) created by V204(A), M124(A), and F127(A), when
compared to the hydrophilic region at R≈1.5 Å. The difference in the sum of
electrostatic and Van der Waals interactions between ammonia and all protein
residues in the explicit solvent system (as calculated by EDA) is around 7.5
kcal/mol for the region at R≈8.5 Å with respect to R≈1.5 Å, close to the calculated

73
free energy barrier of 8.0 kcal/mol at R≈8.5 Å calculated by WHAM (see Figure
14).
In contrast to the sharp rise in free energy in tunnel2 between R=6.5 Å
and R=8.5 Å the free energy for transport of ammonia in tunnel1 decreases
consistently between R=6.5 Å and R=8.5 Å. The stabilization of the ammonia in
tunnel1 in this section is mostly due to the electrostatic interactions experienced
by ammonia in the hydrophilic environment created by the residues R200(A),
S208(A), N320(A), and D274(B) (Figure 28). Moreover, R200(A), S208(A), and
D274(B) are conserved residues lining tunnel1 as noted by previous studies.1 The
orientation of ammonia and the measured distances show hydrogen bonding
interactions between ammonia and all of the above-mentioned residues. The
hydrophilic environment created by these polar residues also attracts water
molecules as seen in the trajectory snapshots (Figure 28). The presence of water
further adds to the attractive interactions experienced by ammonia through
hydrogen bonding.
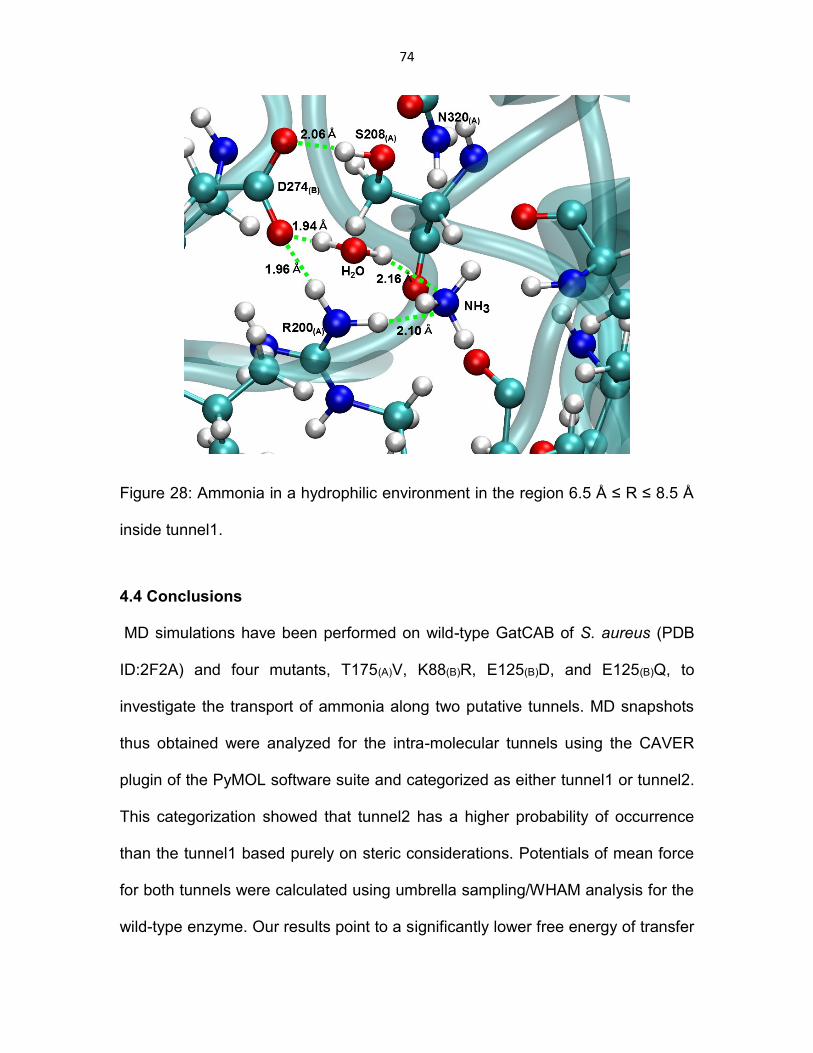
74
Figure 28: Ammonia in a hydrophilic environment in the region 6.5 Å ≤ R ≤ 8.5 Å
inside tunnel1.
4.4 Conclusions
MD simulations have been performed on wild-type GatCAB of S. aureus (PDB
ID:2F2A) and four mutants, T175(A)V, K88(B)R, E125(B)D, and E125(B)Q, to
investigate the transport of ammonia along two putative tunnels. MD snapshots
thus obtained were analyzed for the intra-molecular tunnels using the CAVER
plugin of the PyMOL software suite and categorized as either tunnel1 or tunnel2.
This categorization showed that tunnel2 has a higher probability of occurrence
than the tunnel1 based purely on steric considerations. Potentials of mean force
for both tunnels were calculated using umbrella sampling/WHAM analysis for the
wild-type enzyme. Our results point to a significantly lower free energy of transfer

75
of ammonia through tunnel1. EDA and APBS analyses were used to provide
further insight into the differences for ammonia transport between each tunnel.
The large increase in free energy observed in tunnel2 after the bifurcation
between both tunnels can be ascribed to a highly hydrophobic region around this
area. This is in contrast to the previous study by Kang et al., which determined
the free energy of transport for a small region after the entrance points to the two
tunnels. The present results cover approximately half of the distance for both
tunnels, which corresponds to the section of the path that can be described by a
one-dimensional coordinate. The remainder of the tunnel requires the use of
multi-dimensional WHAM analysis, and will be investigated in a future
contribution.

76
CHAPTER 5
QUANTUM MECHANICAL/MOLECULAR MECHANICAL (QM/MM)
INVESTIGATION OF MYCOBACTERIUM TUBERCULOSIS INORGANIC
PYROPHOSPHATASE (PPASE) MECHANISM
5.1 Introduction
PPase catalyzes the hydrolysis of an inorganic pyrophosphate (PPi) molecule
into two phosphate ions (Pi). The highly exothermic nature of this reaction is of
utmost importance in biological systems as the energy released can be used to
catalyze kinetically unfavorable biological reactions. The exact mechanism of
action for PPase has not been established yet. This, and the fact that PPase is
essential for the survival of many bacteria and fungi mark the importance of study
of the mechanism of action of PPase.
There are two main families of PPases: Family 1, and Family 2. Although
the PPases in the two families are not homologous in sequence or structure they
function via a similar mechanism.43 This chapter discusses a study of the
mechanism of action of M. tuberculosis PPase, a Family 1 PPase. As with all the
other Familiy 1 PPases, M. tuberculosis PPase requires divalent metal cations
for catalytic activity. The computational analysis described in this chapter has
been performed with three Mg2+ ions in the active site of M. tuberculosis PPase.
Previous biochemical and structural studies performed mostly with the
E. coli and S. cerevisiae PPase have led to a proposed mechanism of Family 1
PPases (Figure 29).51
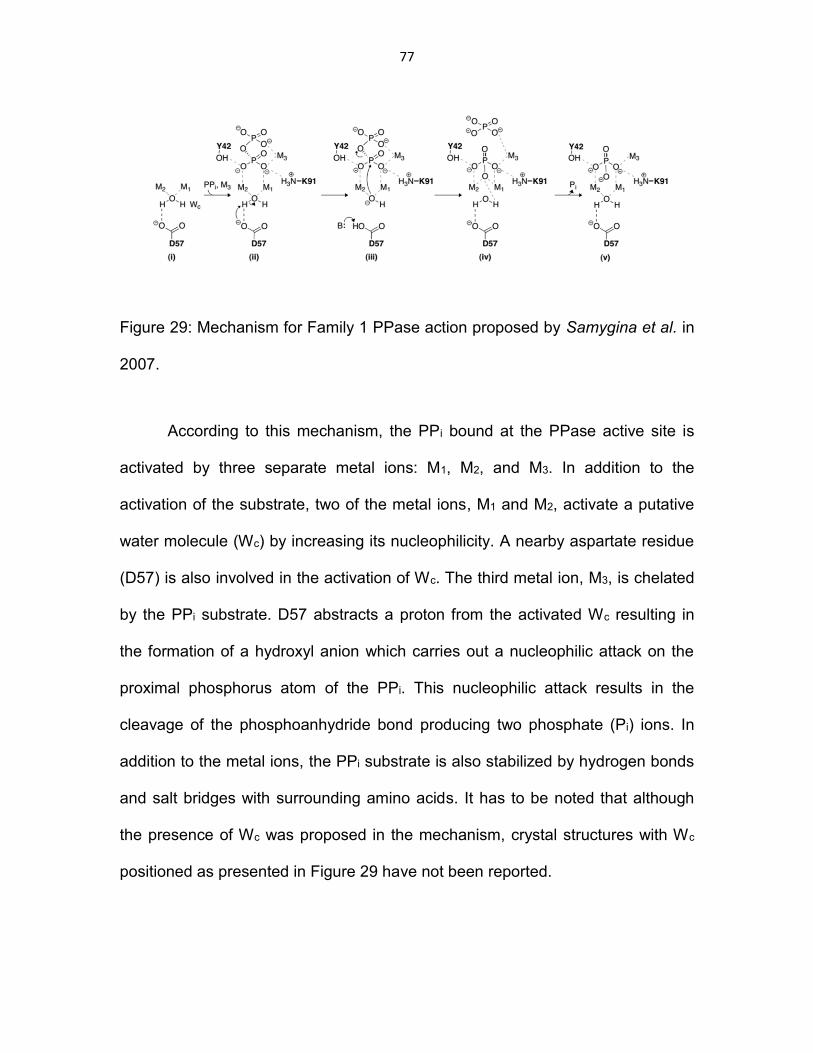
77
Figure 29: Mechanism for Family 1 PPase action proposed by Samygina et al. in
2007.
According to this mechanism, the PPi bound at the PPase active site is
activated by three separate metal ions: M1, M2, and M3. In addition to the
activation of the substrate, two of the metal ions, M1 and M2, activate a putative
water molecule (Wc) by increasing its nucleophilicity. A nearby aspartate residue
(D57) is also involved in the activation of Wc. The third metal ion, M3, is chelated
by the PPi substrate. D57 abstracts a proton from the activated Wc resulting in
the formation of a hydroxyl anion which carries out a nucleophilic attack on the
proximal phosphorus atom of the PPi. This nucleophilic attack results in the
cleavage of the phosphoanhydride bond producing two phosphate (Pi) ions. In
addition to the metal ions, the PPi substrate is also stabilized by hydrogen bonds
and salt bridges with surrounding amino acids. It has to be noted that although
the presence of Wc was proposed in the mechanism, crystal structures with Wc
positioned as presented in Figure 29 have not been reported.

78
5.2 Experimental findings
This study was carried out in collaboration with Professor Oleg Tsodikov’s group
at University of Kentucky. They have used Ca2+ ions in the crystallization solution
alongside Pi and PPase to support the backward reaction in which Pi ions react
with each other to form PPi ions. In this process, they were not only able to
capture PPi bound to PPase but also the predicted catalytic water molecule (Wc)
shown in Figure 29, in a precatalytic position. They were also able to isolate
crystal structures of PPase bound to Pi (the product of the forward reaction) and
for apo-PPase.
In the isolated crystal structures, Wc was found to be bridging two metal
ions and in close proximity to the surrounding amino acids D57 and D89. This
supports the existence of the structures (ii) and (iii) from the previously proposed
mechanism (Figure 29). Wc is not observed in the Pi-bound or apo-PPase which
suggests that Wc binds to PPase in concert with PPi and leaves the active site
with dissociation of the first Pi in contrary to the previously proposed mechanism,
which suggested that Wc was already bound to the active site of PPase before
PPi is bound.
It was observed that apo-PPase bound to Ca2+ contains only one metal
ion at the M1 position and apo-PPase bound to Mg2+ contains two metal ions at
the M1 and M3 positions, which suggests that M1 is a higher affinity site for a
divalent metal than M2 or M3. Furthermore, in the Pi bound PPase structure, it is
observed that the metal ion at the M2 position is shifted towards the Pi that is left
in the active site after hydrolysis. This remaining Pi is located at a position in

79
which the distal phosphorus of the PPi bound to PPase is observed. The shift of
the M2 metal ion and the relative position of the remaining Pi at the active site
suggests that the first Pi that leaves the active site involves the proximal
phosphorus in PPi, contrary to the previously suggested mechanism, in which the
Pi formed of the distal phosphorus atom of the bound PPi was proposed to leave
the active site first.
Based on the above observations Professor Tsodikov’s group has
proposed a new mechanism that is shown in schematic form in Figure 30.
Figure 30: Mechanism proposed by Professor Tsodokov’s group to explain the
observations.
According to the newly proposed mechanism (Figure 30), M3 binds to the active
site which is already bound to M1 likely in an equilibrium process. Binding of both
M1 and M3 facilitates the binding of PPi and M2 (which was proposed to bind in a
cooperative fashion). Then the binding of Wc occurs followed by deprotonation,
formation of the hydroxide anion and hydrolysis of the phosphoanhydride bond
giving rise to the two Pi ions. One of the Pi ions leaves the active site along with
the M3 cation. M2 shifts closer to the remaining Pi and subsequently leaves the
80
active site with the Pi restoring the initial state of the active site (with only M1
bound) to start a new catalytic cycle.
5.3 Computational procedure
We have used classical MD and hybrid QM/MM calculations to investigate the
hydrolysis of PPi. This step involves the abstraction of a proton from Wc by one of
the surrounding aspartate residues (D57 or D89) followed by a nucleophilic
attack on the proximal phosphorus atom of PPi by the resultant hydroxyl ion. This
nucleophilic attack leads to the cleavage of the phosphoanhydride bond (i.e. the
P-O-P bond in the PPi substrate).
The crystal structure of M. tuberculosis PPase bound to PPi, provided by
Prof. Tsodikov’s group, was used for initial MD simulations. This crystal structure
is a dimer of hexamers. For the computational analyses, only one hexamer was
used and out of the six corresponding active sites for the hexamer, one active
site was used for the QM calculations. The Ca2+ ions in the crystal structure were
replaced by Mg2+ ions. The system was hydrogenated using MolProbity and
neutralized by adding 51 K+ ions using the tleap program of the AMBER12
package.68, 123, 124 Initial MD simulations run with the neutralized system were
shown to be unstable. The ionic strength of the system was increased to 100 mM
by the addition of 102 K+ ions and 51 Cl- ions using tleap. The system was
solvated with TIP3P water with a 15 Å buffer in a final box size of approximately
150 Å×140 Å×147 Å. The total number of atoms in the system is 50396.

81
MD simulations were performed using the PMEMD program in the
AMBER12 software suite with the ff99SB force field.68 The SHAKE algorithm was
applied for bonds between heavy atoms and hydrogens.118 All MD simulations
were carried out under periodic boundary conditions. The smooth particle Ewald
method was used for calculating long range interactions.119, 120 Systems were
minimized using sander with 50 steps of steepest descent and 450 steps of
conjugate gradient with a restraint of 500 kcal/mol/Å2 on the protein atoms.
Densities of the systems were equilibrated at 1 g/cm3 in the NPT ensemble with
pressure being held constant by anisotrophic pressure scaling. The systems
were gradually heated to 300K under constant volume conditions with a 500
kcal/mol/Å2 restraint on the protein atoms. The restraints were gradually removed
and the temperature was kept constant using the Langevin thermostat.130 Non-
restrained production MD was performed for 20 ns for each system with
snapshots saved each 1 ps.
Twenty random snapshots were selected from the MD trajectory. These
snapshots were selected based on the relative orientation of the attacking water
toward PPi in the active site. Upon selection of these structures, the ten
snapshots for which the angle 𝒂��𝒄 (Figure 31) was closest to 180 degrees were
selected from the trajectory for QM/MM calculations.
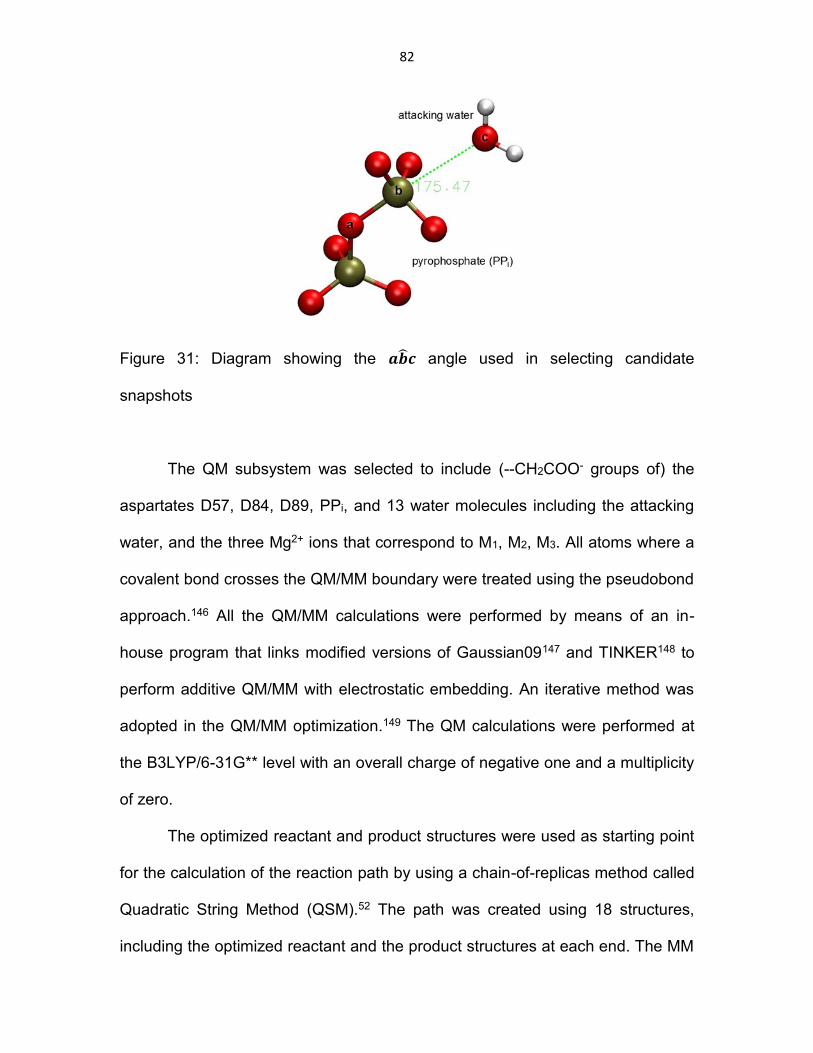
82
Figure 31: Diagram showing the 𝒂��𝒄 angle used in selecting candidate
snapshots
The QM subsystem was selected to include (--CH2COO- groups of) the
aspartates D57, D84, D89, PPi, and 13 water molecules including the attacking
water, and the three Mg2+ ions that correspond to M1, M2, M3. All atoms where a
covalent bond crosses the QM/MM boundary were treated using the pseudobond
approach.146 All the QM/MM calculations were performed by means of an in-
house program that links modified versions of Gaussian09147 and TINKER148 to
perform additive QM/MM with electrostatic embedding. An iterative method was
adopted in the QM/MM optimization.149 The QM calculations were performed at
the B3LYP/6-31G** level with an overall charge of negative one and a multiplicity
of zero.
The optimized reactant and product structures were used as starting point
for the calculation of the reaction path by using a chain-of-replicas method called
Quadratic String Method (QSM).52 The path was created using 18 structures,
including the optimized reactant and the product structures at each end. The MM

83
subsystem of the optimized reactant was used as the MM subsystem of each of
the 16 intermediate structures between the optimized reactant and the product.
The MM subsystems of the intermediate 16 structures were subjected to
constrained optimization.150 The constraints were gradually reduced after each
QM/MM optimization cycle. The individual QM/MM optimizations for each of the
16 structures were performed using the same in-house program that links
modified versions of Gaussian09 and TINKER, which was used for the QM
optimizations. The structure corresponding to the highest energy point in the
optimized path calculated using QSM was used as initial guess for the transition
state optimization. Transition state optimization was performed using the QST3
method.
5.4 Results and discussion
Initial calculations performed using the completely deprotonated form of PPi gave
rise to problems in product optimization, resulting in the dissociation of a nearby
metal-coordinated water and the protonation of one of the oxygen atoms in PPi
proximal to Wc. To prevent this dissociation of water, an oxygen in the Pi distal to
Wc was protonated. This new system has a charge of zero and a multiplicity of
zero and a total of 76 atoms in the QM subsystem.
The structures of the optimized reactant and the product are shown in
Figures 32 and 33 respectively. The experimental counterparts are also included
for comparison. The optimized reactant shows an overall backbone RMSD
deviation of 0.9 Å and an RMSD deviation of 0.6 Å for all atoms in the active site.

84
The optimized product shows an overall backbone RMSD deviation of 0.9 Å and
an RMSD deviation of 0.8 Å for all atoms in the active site.
Figure 32: Comparison of experimental (A) and optimized reactant (B). The
attacking water (Wc) is labeled as “catalytic water”.
Figure 33: Comparison of experimental (A) and optimized product (B). The PPi
has been hydrolyzed by Wc breaking the phosphoanhydride bond.
85
The relatively small RMSD deviations of the optimized reactant and product
structures show that the calculated structures have not been significantly
perturbed in comparison to the experimental structures. The optimized product
structure is 11.24 kcal/mol lower in energy with respect to the optimized reactant
structure.
The optimized transition state structure was characterized with a single
imaginary frequency of 240.8i cm-1. The visualization of the corresponding
vibration showed that the vibration is along the reaction coordinate that describes
the abstraction of the proton from Wc and the corresponding cleavage of the
phosphoanhydride bond. The calculated reaction barrier for the reaction is 6.6
kcal/mol. Although many theoretical studies have been carried out in the past
involving different types of phosphatases and hydrolysis of phosphates,150-156 to
our knowledge there haven’t been any theoretical studies carried out on
inorganic PPase action other than a DFT study involving a model system that
analyses the inorganic pyrophosphatase mechanism in E. coli.157 The authors of
this study reported a calculated barrier (for a cluster model with continuum
solvation) of ≈ 9 kcal/mol. This barrier is close to our calculated barrier of 6.6
kcal/mol, especially taking into account that the present results explicitly include
the entire enzyme and solvent in the calculation.
After replacing the three Ca2+ atoms in the active site and subjecting the
structure to MD and QM/MM optimization, a shift in the active site is observed. In
the optimized reactant structure (Figure 32B), the change in cations results in a

86
tighter active site as expected with closer distances between the aspartic acid
side-chains and the metals. For example, the distance between D57 and M1
changes from 2.52 Å to 2.08 Å. This tightening promotes a rearrangement of the
active site, which results in D89 no longer coordinating M3. In addition, the
attacking water is observed to form hydrogen bonds to both D89 and D57. The
hydrogen bond between the attacking water, Wc, and Asp89 is slightly stronger
than to D57 as observed by the distances (see Figure 32B).
The oxygen from D89 abstracts the proton from Wc, since it becomes both
basic and properly positioned with respect to Wc. In contrast, both oxygens of
D59 remain coordinated to divalent metal ions. Based on the minimum energy
path, the nucleophilic water transfers a proton to D89 to yield a hydroxyl anion
and almost concomitantly carries out the nucleophilic attack on the proximal P
atom of the PPi.

87
Figure 34: The optimized transition state showing the proton being abstracted by
D89 and the formation of hydroxyl anion which carries out the nucleophilic attack.
5.5 Conclusions
In this study we have analyzed the PPase reaction mechanism in M. tuberculosis
based on a novel set of crystal structures. One of these crystal structures
contained a previously predicted catalytic water molecule (Wc) that had not been
observed previously. Study of the characteristics of the novel structures has led
to the proposal of a new reaction mechanism of the PPase action in
M. tuberculosis.
Computational studies were carried out using the QM/MM hybrid method
to analyze the PPi hydrolysis step of the proposed mechanism. The presence of
Wc bridged by the divalent metal ions M1 and M2, along with its close proximity to
D57 and D89 yields evidence for the catalytic steps leading to species (ii) and (iii)
in Figure 29. As suggested by the experimental structures and supported by the
calculated reaction path, the bridged water with a decreased pKa can be readily
deprotonated by the nearby carboxyl group of Asp89, and the newly formed
hydroxide ion can then more readily attack the PPi. This is in contrast to the
previous studies that suggest the deprotonation of Wc is D57 rather than by D89.
Our studies show D89 is more suited for proton abstraction from Wc in terms of
orientation and the strength of attractive forces between Wc and carboxyl groups
of D57 and D89. However, since our calculations only take into consideration one
of 12 possible active sites, each of which has slightly different arrangements, our

88
simulations do not positively discard D57 as a possible general base. The
calculated reaction barrier for the central catalytic step is 6.6 kcal/mol.

89
CHAPTER 6
COMPUTATIONAL ANALYSIS OF THE BINDING AFFINITY OF NOVEL
SUBSTRATES FOR HDAC CLASS IIA ENZYMES
6.1 Introduction
Eukaryotic chromosomes exist in the form of densely packed structures known
as chromatin.158 Chromatin is composed of DNA molecules tightly wound around
histone proteins. The strength of attractive force between the DNA molecules
and the histone proteins, which results in relaxed or compact chromatin, has
been found to play a vital role in the expression of genes.159-162 Histone
deacetylases (HDACs) are a class of enzymes that catalyze the removal of
acetyl groups from ε-N-acetyl lysine amino acid residues in histone proteins.163-
165 This removal results in an increase in the positive charge of the histone
proteins which bind more tightly around the DNA backbone that is composed of
negatively charged phosphate groups leading to the formation of more compact
and transcriptionally silent chromatin.58, 59, 159 This form of control in gene
expression without an actual change in the nucleotide sequence is an ideal
example of epigenetics.164 Due to their ability to epigenetically regulate gene
expression, they have become important targets in areas like cancer therapy
where silencing of genes whose expression promotes cancer growth is
required.59, 163, 164, 166-170 Targeting HDACs in specific organs and tissues in vivo
can be greatly enhanced by the capability to visualize their activity. Therefore
there is a pressing need for the development of HDAC class-specific radiotracers

90
which would enable the non-invasive and repetitive imaging of HDAC activity
through techniques like PET imaging.
This chapter describes a computational study of the binding affinity of a
set of novel substrates that have been experimentally tested for the imaging of
HDAC class IIa enzymes.
6.2 Experimental findings
This study was carried out in collaboration with Professor Juri Gelovani’s group
at Wayne State University. They have synthesized a set of novel substrates:
6-(fluoroacetamido)-1-hexanoicanilide (FAHA), 6-(difluoroacetamido)-1-
hexanoicanilide (DFAHA), 6-(trifluoro acetamido)-1-hexanoicanilide (TFAHA), the
structures of which are shown in Figure 35. These substrates differ by the
number of fluorine atoms in the acetyl group.
Figure 35: Structures of the novel substrates to be used as HDAC class IIa
specific radiotracers synthesized by Professor Gelovani’s group

91
The above mentioned substrates have been made radioactive by labeling them
with radioactive fluorine [18F] thus giving rise to [18F]FAHA, [18F]DFAHA, and
[18F]TFAHA. They have been used as radiotracers in selected regions of rat
brains that are known to have higher HDAC class IIa activity. Subsequent
PET/CT scanning of these regions showed higher [18F]TFAHA–derived
radioactivity than [18F]DFAHA-derived radioactivity or [18F]FAHA-derived
radioactivity of the same regions. Quantitative analysis of the PET/CT scanning
images by AMIDE Software (Source Forge)171 has shown that the selectivity and
accumulation of the above radiotracers in regions that show HDAC class IIa
activity varies as TFAHA>DFAHA>FAHA. These experimental results suggest
that the relative affinities of the above radiotracers to HDAC class IIa enzymes
are as follows: TFAHA>DFAHA>FAHA.
6.3 Computational procedure
For in silico modeling purposes, the crystal structures of one member of the
HDAC class IIa (HDAC4) and one member of the HDAC class 1 (HDAC8), were
used. The crystal structures for HDAC4 (pdb id: 2VQJ)172 and HDAC8 (1T69)173
were downloaded from the pdb data bank.122 For HDAC8, the missing residues
1-13 and 85-90 were added using MODELLER.174 The residues 85-90 are
involved in the formation of a loop that is in close proximity to the inhibitor binding
region of HDAC8. Due to this potential importance, the loop formed by these
MODELLER-added residues was further refined using Chimera.175 The two
crystal structures were hydrogenated using MolProbity.123, 124 Docking
calculations were performed using the FlexX algorithm107 as implemented in the

92
LeadIT software package.110 For both HDAC8 and HDAC4, native ligands in the
crystal structure (namely SHH for HDAC8 and TFG for HDAC4) were used as
reference ligands for the docking calculations. A grid volume that covered amino
acids within 20 Å from each reference ligand was used. All the waters within the
grid volume were taken as freely rotatable and displaceable. Pharmacophore
rules based on the knowledge of ligand-receptor binding were used to guide the
ligands towards the binding site. For both HDAC8 and HDAC4 docking was
performed with the ligands FAHA, DFAHA, and TFAHA. Docking scores for the
best 20 poses were calculated.
6.4 Results and discussion
The calculated docking scores for the best docking poses are given in Table 5
below.
Compound Name Compound Structure HDAC 4 Score HDAC 8 Score
FAHA
-8 -20
DFAHA
-10 -20
TFAHA
-11 -17
Table 5: Docking scores of the substrates for HDAC4 and HDAC8
The docking scores shown for FAHA, DFAHA, and TFAHA do not follow the
trend in affinity predicted by the experiment. This trend is to be expected as
HDAC8 is not a class IIa enzyme. As described in 2013 by Lobera et al.,176 the

93
replacement of a key HDAC class I and HDAC class IIb tyrosine residue in the
active site by a histidine residue in HDAC class IIa enzymes changed their
catalytic activity and enables them to receive bulkier molecules at the active site
in comparison to other HDACs. So the decrease in binding affinity shown by
HDAC8 when going from DFAHA to TFAHA can be described as being due to its
increased inefficiency in accommodating bulkier molecules at its active site.
In the case of HDAC4 we see the same trend in the variation of binding
affinity of the substrates as seen in the experiment. Going from FAHA to TFAHA
increased the negative value of the docking score which is an indication of
increased affinity between the substrate and the corresponding HDAC active site.
As reported by Wu et al. in 2010,177 there are two previously suggested
mechanisms for class I/II/IV HDACs and HDLP. One of these mechanisms is a
general acid-base catalytic pair mechanism178 and the other one is a proton-
shuttle catalytic mechanism.179 In both these mechanisms, it can be seen that the
activation of the active site moieties, including the carbonyl carbon of the acetyl
group of the substrates and the Zn2+, play a vital role in catalysis. When going
from FAHA to TFAHA, each hydrogen in the methyl portion of the acetyl group
gets replaced by a fluorine atom. Fluorine being the most electronegative of all
the elements withdraws C-F bond electrons towards itself thus increasing the
electrophilicity of the carbonyl carbon in the acetyl group making the carbonyl
carbon more susceptible to nucleophilic attack. As predicted by the two
mechanisms stated above, this nucleophilic attack is carried out by a hydroxyl
anion that is formed by the abstraction of a proton from a water molecule by a

94
histidine residue in the HDAC4 active site. Furthermore, the presence of fluorine
in the vicinity of the Zn2+ ion polarizes the Zn2+ due to the electron withdrawing
nature of the fluorine. As a consequence, the strength of interaction between the
Zn2+ ion and the carbonyl oxygen of the acetyl group increases the
electrophilicity of the carbonyl carbon even more.
The above arguments account for the increase in affinity of the substrate
in the order FAHA<DFAHA<TFAHA for the HDAC4 active site.
6.5 Conclusions
We have performed docking studies on three novel substrates: FAHA, DFAHA,
and TFAHA that are currently being tested as potential radiotracers for imaging
HDAC class IIa enzyme activity. The pattern in the change of affinity for HDAC4
is the same as that obtained by the experiments. These combined experimental
and theoretical results have led to the conclusion that the affinity of the
substrates towards HDAC4 changes as FAHA<DFAHA<TFAHA. The trends in
affinity of the three compounds for HDAC8 don’t show the same pattern as
shown for HDAC4. This trend is to be expected as TFAHA, DFAHA, and FAHA
are meant to be specific for HDAC IIa enzymes whereas HDAC8 is a member of
HDAC class I enzymes.

95
REFERENCES
(1) Nakamura, A.; M. Yao; S. Chimnaronk; N. Sakai, and I. Tanaka, Ammonia
channel couples glutaminase with transamidase reactions in GatCAB.
Science, 2006. 312(5782): p. 1954-8.
(2) Nureki, O.; P. O'Donoghue; N. Watanabe; A. Ohmori; H. Oshikane; Y.
Araiso; K. Sheppard; D. Soll, and R. Ishitani, Structure of an archaeal non-
discriminating glutamyl-tRNA synthetase: a missing link in the evolution of
Gln-tRNAGln formation. Nucleic Acids Res, 2010. 38(20): p. 7286-97.
(3) Salazar, J.C.; I. Ahel; O. Orellana; D. Tumbula-Hansen; R. Krieger; L.
Daniels, and D. Söll, Coevolution of an aminoacyl-tRNA synthetase with
its tRNA substrates. Proceedings of the National Academy of Sciences of
the United States of America, 2003. 100(24): p. 13863-13868.
(4) Schulze, J.O.; A. Masoumi; D. Nickel; M. Jahn; D. Jahn; W.D. Schubert,
and D.W. Heinz, Crystal structure of a non-discriminating glutamyl-tRNA
synthetase. J Mol Biol, 2006. 361(5): p. 888-97.
(5) Skouloubris, S.; L. Ribas de Pouplana; H. De Reuse, and T.L.
Hendrickson, A noncognate aminoacyl-tRNA synthetase that may resolve
a missing link in protein evolution. Proc Natl Acad Sci U S A, 2003.
100(20): p. 11297-302.
(6) Cathopoulis, T.; P. Chuawong, and T.L. Hendrickson, Novel tRNA
aminoacylation mechanisms. Mol Biosyst, 2007. 3(6): p. 408-18.
(7) Curnow, A.W.; K.-w. Hong; R. Yuan; S.-i. Kim; O. Martins; W. Winkler;
T.M. Henkin, and D. Söll, Glu-tRNA(Gln) amidotransferase: A novel
96
heterotrimeric enzyme required for correct decoding of glutamine codons
during translation. Proceedings of the National Academy of Sciences of
the United States of America, 1997. 94(22): p. 11819-11826.
(8) Frechin, M.; B. Senger; M. Brayé; D. Kern; R.P. Martin, and H.D. Becker,
Yeast mitochondrial Gln-tRNA(Gln) is generated by a GatFAB-mediated
transamidation pathway involving Arc1p-controlled subcellular sorting of
cytosolic GluRS. Genes & Development, 2009. 23(9): p. 1119-1130.
(9) Sheppard, K.; P.M. Akochy; J.C. Salazar, and D. Soll, The Helicobacter
pylori amidotransferase GatCAB is equally efficient in glutamine-
dependent transamidation of Asp-tRNAAsn and Glu-tRNAGln. J Biol
Chem, 2007. 282(16): p. 11866-73.
(10) Tumbula, D.L.; H.D. Becker; C. Wei-zhong, and D. Soll, Domain-specific
recruitment of amide amino acids for protein synthesis. Nature, 2000.
407(6800): p. 106-10.
(11) Massiere, F. and M.A. Badet-Denisot, The mechanism of glutamine-
dependent amidotransferases. Cell Mol Life Sci, 1998. 54(3): p. 205-22.
(12) Raushel, F.M.; J.B. Thoden, and H.M. Holden, Enzymes with molecular
tunnels. Acc Chem Res, 2003. 36(7): p. 539-48.
(13) List, F.; M.C. Vega; A. Razeto; Michaela C. Häger; R. Sterner, and M.
Wilmanns, Catalysis Uncoupling in a Glutamine Amidotransferase
Bienzyme by Unblocking the Glutaminase Active Site. Chemistry &
Biology, 2012. 19(12): p. 1589-1599.
97
(14) Oliver, J.C.; R. Gudihal; J.W. Burgner; A.M. Pedley; A.T. Zwierko; V.J.
Davisson, and R.S. Linger, Conformational changes involving ammonia
tunnel formation and allosteric control in GMP synthetase. Archives of
Biochemistry and Biophysics, 2014. 545(0): p. 22-32.
(15) Weeks, A.; L. Lund, and F.M. Raushel, Tunneling of intermediates in
enzyme-catalyzed reactions. Current Opinion in Chemical Biology, 2006.
10(5): p. 465-472.
(16) Raushel, F.M.; J.B. Thoden, and H.M. Holden, The Amidotransferase
Family of Enzymes: Molecular Machines for the Production and Delivery
of Ammonia. Biochemistry, 1999. 38(25): p. 7891-7899.
(17) Kang, J.; S. Kuroyanagi; T. Akisada; Y. Hagiwara, and M. Tateno,
Unidirectional Mechanistic Valved Mechanisms for Ammonia Transport in
GatCAB. Journal of Chemical Theory and Computation, 2012. 8(2): p.
649-660.
(18) Zhao, L.; S.W. Dewage; M.J. Bell; K.M. Chang; S. Fatma; N. Joshi; G.
Silva; G.A. Cisneros, and T.L. Hendrickson, The kinase activity of the
Helicobacter pylori Asp-tRNA(Asn)/Glu-tRNA(Gln) amidotransferase is
sensitive to distal mutations in its putative ammonia tunnel. Biochemistry,
2012. 51(1): p. 273-85.
(19) Dewage, S.W. and G.A. Cisneros, Computational Analysis of Ammonia
Transfer Along Two Intramolecular Tunnels in Staphylococcus aureus
Glutamine-Dependent Amidotransferase (GatCAB). J Phys Chem B,
2015. 119(9): p. 3669-77.
98
(20) Torrie, G.M. and J.P. Valleau, Nonphysical sampling distributions in Monte
Carlo free-energy estimation: Umbrella sampling. Journal of
Computational Physics, 1977. 23(2): p. 187-199.
(21) Kumar, S.; J.M. Rosenberg; D. Bouzida; R.H. Swendsen, and P.A.
Kollman, THE weighted histogram analysis method for free-energy
calculations on biomolecules. I. The method. Journal of Computational
Chemistry, 1992. 13(8): p. 1011-1021.
(22) Kumar, S.; J.M. Rosenberg; D. Bouzida; R.H. Swendsen, and P.A.
Kollman, Multidimensional free-energy calculations using the weighted
histogram analysis method. Journal of Computational Chemistry, 1995.
16(11): p. 1339-1350.
(23) Roux, B., The calculation of the potential of mean force using computer
simulations. Computer Physics Communications, 1995. 91(1–3): p. 275-
282.
(24) Boyer, P.D.; A.B. Falcone, and W.H. Harrison, Reversal and mechanism
of oxidative phosphorylation. Nature, 1954. 174(4426): p. 401-2.
(25) Cohn, M., Phosphate-water exchange reaction catalyzed by inorganic
pyrophosphatase of yeast. J Biol Chem, 1958. 230(1): p. 369-79.
(26) Cohn, M., A study of oxidative phosphorylation with O18-labeled inorganic
phosphate. J Biol Chem, 1953. 201(2): p. 735-50.
(27) Janson, C.A.; C. Degani, and P.D. Boyer, The formation of enzyme-bound
and medium pyrophosphate and the molecular basis of the oxygen

99
exchange reaction of yeast inorganic pyrophosphatase. J Biol Chem,
1979. 254(10): p. 3743-9.
(28) Cooperman, B.S., [28] The mechanism of action of yeast inorganic
pyrophosphatase, in Methods in Enzymology, L.P. Daniel, Editor. 1982,
Academic Press. p. 526-548.
(29) Springs, B.; K.M. Welsh, and B.S. Cooperman, Thermodynamics, kinetics,
and mechanism in yeast inorganic pyrophosphatase catalysis of inorganic
pyrophosphate:inorganic phosphate equilibration. Biochemistry, 1981.
20(22): p. 6384-6391.
(30) Baykov, A.A.; T. Hyytia; S.E. Volk; V.N. Kasho; A.V. Vener; A. Goldman;
R. Lahti, and B.S. Cooperman, Catalysis by Escherichia coli Inorganic
Pyrophosphatase: pH and Mg2+ Dependence. Biochemistry, 1996.
35(15): p. 4655-4661.
(31) de Meis, L., Pyrophosphate of high and low energy. Contributions of pH,
Ca2+, Mg2+, and water to free energy of hydrolysis. J Biol Chem, 1984.
259(10): p. 6090-7.
(32) Kornberg, A., On the Metabolic Significance of Phosphorolytic and
Pyrophosphorolytic Reactions, in Horizons in Biochemistry, B.P. Michael
Kasha, Editor. 1962, Academic Press: New York. p. 251-264.
(33) Chen, J.; A. Brevet; M. Fromant; F. Lévêque; J.M. Schmitter; S. Blanquet,
and P. Plateau, Pyrophosphatase is essential for growth of Escherichia
coli. Journal of Bacteriology, 1990. 172(10): p. 5686-5689.

100
(34) Griffin, J.E.; J.D. Gawronski; M.A. Dejesus; T.R. Ioerger; B.J. Akerley, and
C.M. Sassetti, High-resolution phenotypic profiling defines genes essential
for mycobacterial growth and cholesterol catabolism. PLoS Pathog, 2011.
7(9): p. e1002251.
(35) Lundin, M.; H. Baltscheffsky, and H. Ronne, Yeast PPA2 gene encodes a
mitochondrial inorganic pyrophosphatase that is essential for
mitochondrial function. J Biol Chem, 1991. 266(19): p. 12168-72.
(36) Kunitz, M., Crystalline inorganic pyrophosphatase isolated from baker's
yeast. J Gen Physiol, 1952. 35(3): p. 423-50.
(37) Schlesinger, M.J. and M.J. Coon, Hydrolysis of nucleoside diand
triphosphates by crystalline preparations of yeast inorganic
pyrophosphatase. Biochim Biophys Acta, 1960. 41: p. 30-6.
(38) Heikinheimo, P.; V. Tuominen; A.K. Ahonen; A. Teplyakov; B.S.
Cooperman; A.A. Baykov; R. Lahti, and A. Goldman, Toward a quantum-
mechanical description of metal-assisted phosphoryl transfer in
pyrophosphatase. Proc Natl Acad Sci U S A, 2001. 98(6): p. 3121-6.
(39) Harutyunyan, E.H.; I.P. Kuranova; B.K. Vainshtein; W.E. Höhne; V.S.
Lamzin; Z. Dauter; A.V. Teplyakov, and K.S. Wilson, X-Ray Structure of
Yeast Inorganic Pyrophosphatase Complexed with Manganese and
Phosphate. European Journal of Biochemistry, 1996. 239(1): p. 220-228.
(40) Baykov, A.A.; B.S. Cooperman; A. Goldman, and R. Lahti, Cytoplasmic
Inorganic Pyrophosphatase, in Inorganic Polyphosphates, H. Schröder
and W.G. Müller, Editors. 1999, Springer Berlin Heidelberg. p. 127-150.
101
(41) Fabrichniy, I.P.; L. Lehtiö; A. Salminen; A.B. Zyryanov; A.A. Baykov; R.
Lahti, and A. Goldman, Structural Studies of Metal Ions in Family II
Pyrophosphatases: The Requirement for a Janus Ion†,‡. Biochemistry,
2004. 43(45): p. 14403-14411.
(42) Gajadeera, C.S.; X. Zhang; Y. Wei, and O.V. Tsodikov, Structure of
inorganic pyrophosphatase from Staphylococcus aureus reveals
conformational flexibility of the active site. Journal of Structural Biology,
2015. 189(2): p. 81-86.
(43) Merckel, M.C.; I.P. Fabrichniy; A. Salminen; N. Kalkkinen; A.A. Baykov; R.
Lahti, and A. Goldman, Crystal Structure of Streptococcus mutans
Pyrophosphatase: A New Fold for an Old Mechanism. Structure, 2001.
9(4): p. 289-297.
(44) Rantanen, M.K.; L. Lehtiö; L. Rajagopal; C.E. Rubens, and A. Goldman,
Structure of the Streptococcus agalactiae family II inorganic
pyrophosphatase at 2.80 Å resolution. Acta Crystallographica Section D,
2007. 63(6): p. 738-743.
(45) Shintani, T.; T. Uchiumi; T. Yonezawa; A. Salminen; A.A. Baykov; R.
Lahti, and A. Hachimori, Cloning and expression of a unique inorganic
pyrophosphatase from Bacillus subtilis: evidence for a new family of
enzymes. FEBS Letters, 1998. 439(3): p. 263-266.
(46) Davidson, A.M. and A.P. Halestrap, Inhibition of mitochondrial-matrix
inorganic pyrophosphatase by physiological [Ca2+], and its role in the
102
hormonal regulation of mitochondrial matrix volume. Biochemical Journal,
1989. 258(3): p. 817-821.
(47) Maeshima, M., H+-translocating inorganic pyrophosphatase of plant
vacuoles Inhibition by Ca2+, stabilization by Mg2+ and immunological
comparison with other inorganic pyrophosphatases. European Journal of
Biochemistry, 1991. 196(1): p. 11-17.
(48) Moe, O.A. and L.G. Butler, Yeast inorganic pyrophosphatase. 3. Kinetics
of Ca 2+ inhibition. J Biol Chem, 1972. 247(22): p. 7315-9.
(49) Baykov, A.A.; I.P. Fabrichniy; P. Pohjanjoki; A.B. Zyryanov, and R. Lahti,
Fluoride Effects along the Reaction Pathway of Pyrophosphatase:
Evidence for a Second Enzyme·Pyrophosphate Intermediate†.
Biochemistry, 2000. 39(39): p. 11939-11947.
(50) Pohjanjoki, P.; I.P. Fabrichniy; V.N. Kasho; B.S. Cooperman; A. Goldman;
A.A. Baykov, and R. Lahti, Probing essential water in yeast
pyrophosphatase by directed mutagenesis and fluoride inhibition
measurements. J Biol Chem, 2001. 276(1): p. 434-41.
(51) Samygina, V.R.; V.M. Moiseev; E.V. Rodina; N.N. Vorobyeva; A.N. Popov;
S.A. Kurilova; T.I. Nazarova; S.M. Avaeva, and H.D. Bartunik, Reversible
inhibition of Escherichia coli inorganic pyrophosphatase by fluoride:
trapped catalytic intermediates in cryo-crystallographic studies. J Mol Biol,
2007. 366(4): p. 1305-17.
103
(52) Burger, S.K. and W. Yang, Quadratic string method for determining the
minimum-energy path based on multiobjective optimization. J Chem Phys,
2006. 124(5): p. 054109.
(53) Allfrey, V.G.; R. Faulkner, and A.E. Mirsky, ACETYLATION AND
METHYLATION OF HISTONES AND THEIR POSSIBLE ROLE IN THE
REGULATION OF RNA SYNTHESIS. Proceedings of the National
Academy of Sciences, 1964. 51(5): p. 786-794.
(54) Lee, D.Y.; J.J. Hayes; D. Pruss, and A.P. Wolffe, A positive role for
histone acetylation in transcription factor access to nucleosomal DNA.
Cell, 1993. 72(1): p. 73-84.
(55) Vettese-Dadey, M.; P.A. Grant; T.R. Hebbes; C. Crane- Robinson; C.D.
Allis, and J.L. Workman, Acetylation of histone H4 plays a primary role in
enhancing transcription factor binding to nucleosomal DNA in vitro. The
EMBO Journal, 1996. 15(10): p. 2508-2518.
(56) Haberland, M.; R.L. Montgomery, and E.N. Olson, The many roles of
histone deacetylases in development and physiology: implications for
disease and therapy. Nature Reviews Genetics, 2009. 10: p. 32+.
(57) Park, J.-H.; Y. Jung; T.Y. Kim; S.G. Kim; H.-S. Jong; J.W. Lee; D.-K. Kim;
J.-S. Lee; N.K. Kim; T.-Y. Kim, et al., Class I Histone Deacetylase-
Selective Novel Synthetic Inhibitors Potently Inhibit Human Tumor
Proliferation. Clinical Cancer Research, 2004. 10(15): p. 5271-5281.

104
(58) de Ruijter, A.J.; A.H. van Gennip; H.N. Caron; S. Kemp, and A.B. van
Kuilenburg, Histone deacetylases (HDACs): characterization of the
classical HDAC family. Biochem J, 2003. 370(Pt 3): p. 737-49.
(59) Yang, X.-J. and S. Grégoire, Class II Histone Deacetylases: from
Sequence to Function, Regulation, and Clinical Implication. Molecular and
Cellular Biology, 2005. 25(8): p. 2873-2884.
(60) Arnold, M.A.; Y. Kim; M.P. Czubryt; D. Phan; J. McAnally; X. Qi; J.M.
Shelton; J.A. Richardson; R. Bassel-Duby, and E.N. Olson, MEF2C
Transcription Factor Controls Chondrocyte Hypertrophy and Bone
Development. Developmental Cell, 2007. 12(3): p. 377-389.
(61) Vega, R.B.; K. Matsuda; J. Oh; A.C. Barbosa; X. Yang; E. Meadows; J.
McAnally; C. Pomajzl; J.M. Shelton; J.A. Richardson, et al., Histone
Deacetylase 4 Controls Chondrocyte Hypertrophy during Skeletogenesis.
Cell, 2004. 119(4): p. 555-566.
(62) Michan, S. and D. Sinclair, Sirtuins in mammals: insights into their
biological function. Biochem J, 2007. 404(1): p. 1-13.
(63) Heltweg, B.; T. Gatbonton; A.D. Schuler; J. Posakony; H. Li; S. Goehle; R.
Kollipara; R.A. Depinho; Y. Gu; J.A. Simon, et al., Antitumor activity of a
small-molecule inhibitor of human silent information regulator 2 enzymes.
Cancer Res, 2006. 66(8): p. 4368-77.
(64) North, B.J.; B.L. Marshall; M.T. Borra; J.M. Denu, and E. Verdin, The
Human Sir2 Ortholog, SIRT2, Is an NAD+-Dependent Tubulin
Deacetylase. Molecular Cell, 2003. 11(2): p. 437-444.

105
(65) Haigis, M.C.; R. Mostoslavsky; K.M. Haigis; K. Fahie; D.C. Christodoulou;
Andrew J. Murphy; D.M. Valenzuela; G.D. Yancopoulos; M. Karow; G.
Blander, et al., SIRT4 Inhibits Glutamate Dehydrogenase and Opposes
the Effects of Calorie Restriction in Pancreatic β Cells. Cell, 2006. 126(5):
p. 941-954.
(66) Liszt, G.; E. Ford; M. Kurtev, and L. Guarente, Mouse Sir2 homolog SIRT6
is a nuclear ADP-ribosyltransferase. J Biol Chem, 2005. 280(22): p.
21313-20.
(67) Gao, L.; M.A. Cueto; F. Asselbergs, and P. Atadja, Cloning and functional
characterization of HDAC11, a novel member of the human histone
deacetylase family. J Biol Chem, 2002. 277(28): p. 25748-55.
(68) Case, D.A.; T.E. Cheatham, 3rd; T. Darden; H. Gohlke; R. Luo; K.M.
Merz, Jr.; A. Onufriev; C. Simmerling; B. Wang, and R.J. Woods, The
Amber biomolecular simulation programs. J Comput Chem, 2005. 26(16):
p. 1668-88.
(69) Cornell, W.D.; P. Cieplak; C.I. Bayly; I.R. Gould; K.M. Merz; D.M.
Ferguson; D.C. Spellmeyer; T. Fox; J.W. Caldwell, and P.A. Kollman, A
Second Generation Force Field for the Simulation of Proteins, Nucleic
Acids, and Organic Molecules. Journal of the American Chemical Society,
1995. 117(19): p. 5179-5197.
(70) Leach, A., Molecular Modelling: Principles and Applications (2nd Edition).
2001: Prentice Hall.

106
(71) Swope, W.C.; H.C. Andersen; P.H. Berens, and K.R. Wilson, A computer
simulation method for the calculation of equilibrium constants for the
formation of physical clusters of molecules: Application to small water
clusters. The Journal of Chemical Physics, 1982. 76(1): p. 637-649.
(72) Verlet, L., Computer "Experiments" on Classical Fluids. I.
Thermodynamical Properties of Lennard-Jones Molecules. Physical
Review, 1967. 159(1): p. 98-103.
(73) Hockney, R.W., POTENTIAL CALCULATION AND SOME
APPLICATIONS. Journal Name: Methods Comput. Phys. 9: 135-
211(1970).; Other Information: Orig. Receipt Date: 31-DEC-70, 1970: p.
Medium: X.
(74) Beeman, D., Some multistep methods for use in molecular dynamics
calculations. Journal of Computational Physics, 1976. 20(2): p. 130-139.
(75) Petrek, M.; M. Otyepka; P. Banas; P. Kosinova; J. Koca, and J.
Damborsky, CAVER: a new tool to explore routes from protein clefts,
pockets and cavities. BMC Bioinformatics, 2006. 7: p. 316.
(76) Schrödinger, L., The PyMOL Molecular Graphics System, Version 1.3r1.
2010.
(77) Rosen, J.B. and R.F. Marcia, Convex Quadratic Approximation. Comput.
Optim. Appl., 2004. 28(2): p. 173-184.
(78) Dijkstra, E.W., A note on two problems in connexion with graphs.
Numerische Mathematik, 1959. 1(1): p. 269-271.

107
(79) Misa, T.J. and P.L. Frana, An interview with Edsger W. Dijkstra. Commun.
ACM, 2010. 53(8): p. 41-47.
(80) Knuth, D.E., A generalization of Dijkstra's algorithm. Information
Processing Letters, 1977. 6(1): p. 1-5.
(81) Metropolis, N. and S. Ulam, The Monte Carlo Method. Journal of the
American Statistical Association, 1949. 44(247): p. 335-341.
(82) Warshel, A. and M. Levitt, Theoretical studies of enzymic reactions:
dielectric, electrostatic and steric stabilization of the carbonium ion in the
reaction of lysozyme. J Mol Biol, 1976. 103(2): p. 227-49.
(83) Svensson, M.; S. Humbel; R.D.J. Froese; T. Matsubara; S. Sieber, and K.
Morokuma, ONIOM: A Multilayered Integrated MO + MM Method for
Geometry Optimizations and Single Point Energy Predictions. A Test for
Diels−Alder Reactions and Pt(P(t-Bu)3)2 + H2 Oxidative Addition. The
Journal of Physical Chemistry, 1996. 100(50): p. 19357-19363.
(84) Becke, A.D., Density‐functional thermochemistry. III. The role of exact
exchange. The Journal of Chemical Physics, 1993. 98(7): p. 5648-5652.
(85) Gill, P.M.; B.G. Johnson; J.A. Pople, and M.J. Frisch, The performance of
the Becke—Lee—Yang—Parr (B—LYP) density functional theory with
various basis sets. Chemical Physics Letters, 1992. 197(4): p. 499-505.
(86) Parr, R.G. and R.G.P.W. Yang, Density-functional theory of atoms and
molecules. 1989: Oxford university press.
(87) Stephens, P.; F. Devlin; C. Chabalowski, and M.J. Frisch, Ab initio
calculation of vibrational absorption and circular dichroism spectra using
108
density functional force fields. The Journal of Physical Chemistry, 1994.
98(45): p. 11623-11627.
(88) Slater, J.C., A simplification of the Hartree-Fock method. Physical Review,
1951. 81(3): p. 385.
(89) Lii, J.H. and N.L. Allinger, Molecular mechanics. The MM3 force field for
hydrocarbons. 2. Vibrational frequencies and thermodynamics. Journal of
the American Chemical Society, 1989. 111(23): p. 8566-8575.
(90) Field, M.J.; P.A. Bash, and M. Karplus, A combined quantum mechanical
and molecular mechanical potential for molecular dynamics simulations.
Journal of Computational Chemistry, 1990. 11(6): p. 700-733.
(91) Singh, U.C. and P.A. Kollman, A combined ab initio quantum mechanical
and molecular mechanical method for carrying out simulations on complex
molecular systems: Applications to the CH3Cl + Cl− exchange reaction
and gas phase protonation of polyethers. Journal of Computational
Chemistry, 1986. 7(6): p. 718-730.
(92) Zhang, Y., Improved pseudobonds for combined ab initio quantum
mechanical/molecular mechanical methods. The Journal of chemical
physics, 2005. 122(2): p. 024114.
(93) Zhang, Y., Pseudobond ab initio QM/MM approach and its applications to
enzyme reactions. Theoretical Chemistry Accounts, 2006. 116(1-3): p. 43-
50.
109
(94) Zhang, Y.; T.-S. Lee, and W. Yang, A pseudobond approach to combining
quantum mechanical and molecular mechanical methods. The Journal of
chemical physics, 1999. 110(1): p. 46-54.
(95) Théry, V.; D. Rinaldi; J.L. Rivail; B. Maigret, and G.G. Ferenczy, Quantum
mechanical computations on very large molecular systems: The local self‐
consistent field method. Journal of computational chemistry, 1994. 15(3):
p. 269-282.
(96) Monard, G.; M. Loos; V. Théry; K. Baka, and J.L. Rivail, Hybrid classical
quantum force field for modeling very large molecules. International
journal of quantum chemistry, 1996. 58(2): p. 153-159.
(97) Assfeld, X. and J.-L. Rivail, Quantum chemical computations on parts of
large molecules: the ab initio local self consistent field method. Chemical
physics letters, 1996. 263(1): p. 100-106.
(98) Assfeld, X.; N. Ferre, and J.-L. Rivail. The Local Self-Consistent Field
Principles and Applications to Combined Quantum Mechanical-Molecular
Mechanical Computations on Biomacromolecular Systems. in ACS
Symposium Series. 1998. AMERICAN CHEMICAL SOCIETY.
(99) Ferré, N.; X. Assfeld, and J.L. Rivail, Specific force field parameters
determination for the hybrid ab initio QM/MM LSCF method. Journal of
computational chemistry, 2002. 23(6): p. 610-624.
(100) Kuntz, I.D.; J.M. Blaney; S.J. Oatley; R. Langridge, and T.E. Ferrin, A
geometric approach to macromolecule-ligand interactions. Journal of
molecular biology, 1982. 161(2): p. 269-288.

110
(101) Goodsell, D.S. and A.J. Olson, Automated docking of substrates to
proteins by simulated annealing. Proteins: Structure, Function, and
Bioinformatics, 1990. 8(3): p. 195-202.
(102) Jones, G.; P. Willett; R.C. Glen; A.R. Leach, and R. Taylor, Development
and validation of a genetic algorithm for flexible docking. Journal of
molecular biology, 1997. 267(3): p. 727-748.
(103) Judson, R.S.; E. Jaeger, and A.M. Treasurywala, A genetic algorithm
based method for docking flexible molecules. Journal of Molecular
Structure: THEOCHEM, 1994. 308: p. 191-206.
(104) Oshiro, C.M.; I.D. Kuntz, and J.S. Dixon, Flexible ligand docking using a
genetic algorithm. Journal of computer-aided molecular design, 1995.
9(2): p. 113-130.
(105) Leach, A.R. and I.D. Kuntz, Conformational analysis of flexible ligands in
macromolecular receptor sites. Journal of Computational Chemistry, 1992.
13(6): p. 730-748.
(106) Welch, W.; J. Ruppert, and A.N. Jain, Hammerhead: fast, fully automated
docking of flexible ligands to protein binding sites. Chemistry & biology,
1996. 3(6): p. 449-462.
(107) Rarey, M.; B. Kramer; T. Lengauer, and G. Klebe, A fast flexible docking
method using an incremental construction algorithm. J Mol Biol, 1996.
261(3): p. 470-89.

111
(108) Wang, T. and R.C. Wade, Implicit solvent models for flexible protein–
protein docking by molecular dynamics simulation. Proteins: Structure,
Function, and Bioinformatics, 2003. 50(1): p. 158-169.
(109) Moitessier, N.; C. Henry; B. Maigret, and Y. Chapleur, Combining
pharmacophore search, automated docking, and molecular dynamics
simulations as a novel strategy for flexible docking. Proof of concept:
Docking of arginine-glycine-aspartic acid-like compounds into the αvβ3
binding site. Journal of medicinal chemistry, 2004. 47(17): p. 4178-4187.
(110) LeadIT 2.1.7. BioSolveIT GmbH, An der Ziegelei 79, 53757 St. Augustin,
Germany.
(111) Crick, F.H., On protein synthesis. Symp Soc Exp Biol, 1958. 12: p. 138-63.
(112) Ibba, M. and D. Soll, Aminoacyl-tRNA synthesis. Annu Rev Biochem,
2000. 69: p. 617-50.
(113) Nakamura, A.; K. Sheppard; J. Yamane; M. Yao; D. Soll, and I. Tanaka,
Two distinct regions in Staphylococcus aureus GatCAB guarantee
accurate tRNA recognition. Nucleic Acids Res, 2010. 38(2): p. 672-82.
(114) Raczniak, G.; H.D. Becker; B. Min, and D. Soll, A single amidotransferase
forms asparaginyl-tRNA and glutaminyl-tRNA in Chlamydia trachomatis. J
Biol Chem, 2001. 276(49): p. 45862-7.
(115) Salazar, J.C.; I. Ahel; O. Orellana; D. Tumbula-Hansen; R. Krieger; L.
Daniels, and D. Soll, Coevolution of an aminoacyl-tRNA synthetase with
its tRNA substrates. Proc Natl Acad Sci U S A, 2003. 100(24): p. 13863-8.

112
(116) Wu, J.; W. Bu; K. Sheppard; M. Kitabatake; S.T. Kwon; D. Soll, and J.L.
Smith, Insights into tRNA-dependent amidotransferase evolution and
catalysis from the structure of the Aquifex aeolicus enzyme. J Mol Biol,
2009. 391(4): p. 703-16.
(117) Horiuchi, K.Y.; M.R. Harpel; L. Shen; Y. Luo; K.C. Rogers, and R.A.
Copeland, Mechanistic studies of reaction coupling in Glu-tRNAGln
amidotransferase. Biochemistry, 2001. 40(21): p. 6450-7.
(118) Ryckaert, J.-P.; G. Ciccotti, and H.J.C. Berendsen, Numerical integration
of the cartesian equations of motion of a system with constraints:
molecular dynamics of n-alkanes. Journal of Computational Physics,
1977. 23(3): p. 327-341.
(119) Essmann, U.; L. Perera; M.L. Berkowitz; T. Darden; H. Lee, and L.G.
Pedersen, A smooth particle mesh Ewald method. The Journal of
Chemical Physics, 1995. 103(19): p. 8577-8593.
(120) York, D.M.; T.A. Darden, and L.G. Pedersen, The effect of long‐range
electrostatic interactions in simulations of macromolecular crystals: A
comparison of the Ewald and truncated list methods. The Journal of
Chemical Physics, 1993. 99(10): p. 8345-8348.
(121) Berendsen, H.J.C.; J.P.M. Postma; W.F. van Gunsteren; A. DiNola, and
J.R. Haak, Molecular dynamics with coupling to an external bath. The
Journal of Chemical Physics, 1984. 81(8): p. 3684-3690.
(122) Bernstein, F.C.; T.F. Koetzle; G.J. Williams; E.F. Meyer, Jr.; M.D. Brice;
J.R. Rodgers; O. Kennard; T. Shimanouchi, and M. Tasumi, The Protein
113
Data Bank: a computer-based archival file for macromolecular structures.
Arch Biochem Biophys, 1978. 185(2): p. 584-91.
(123) Chen, V.B.; W.B. Arendall, 3rd; J.J. Headd; D.A. Keedy; R.M. Immormino;
G.J. Kapral; L.W. Murray; J.S. Richardson, and D.C. Richardson,
MolProbity: all-atom structure validation for macromolecular
crystallography. Acta Crystallogr D Biol Crystallogr, 2010. 66(Pt 1): p. 12-
21.
(124) Davis, I.W.; A. Leaver-Fay; V.B. Chen; J.N. Block; G.J. Kapral; X. Wang;
L.W. Murray; W.B. Arendall; J. Snoeyink; J.S. Richardson, et al.,
MolProbity: all-atom contacts and structure validation for proteins and
nucleic acids. Nucleic Acids Research, 2007. 35(suppl 2): p. W375-W383.
(125) Jorgensen, W.L.; J. Chandrasekhar; J.D. Madura; R.W. Impey, and M.L.
Klein, Comparison of simple potential functions for simulating liquid water.
The Journal of Chemical Physics, 1983. 79(2): p. 926-935.
(126) Olsson, M.H.M.; C.R. Søndergaard; M. Rostkowski, and J.H. Jensen,
PROPKA3: Consistent Treatment of Internal and Surface Residues in
Empirical pKa Predictions. Journal of Chemical Theory and Computation,
2011. 7(2): p. 525-537.
(127) Søndergaard, C.R.; M.H.M. Olsson; M. Rostkowski, and J.H. Jensen,
Improved Treatment of Ligands and Coupling Effects in Empirical
Calculation and Rationalization of pKa Values. Journal of Chemical
Theory and Computation, 2011. 7(7): p. 2284-2295.

114
(128) Holden, N. and D. Lide, CRC handbook of chemistry and physics. 1991,
CRC Press, Boca Raton, FL.
(129) Mongan, J.; C. Simmerling; J.A. McCammon; D.A. Case, and A. Onufriev,
Generalized Born model with a simple, robust molecular volume
correction. J Chem Theory Comput, 2007. 3(1): p. 156-169.
(130) Loncharich, R.J.; B.R. Brooks, and R.W. Pastor, Langevin dynamics of
peptides: the frictional dependence of isomerization rates of N-
acetylalanyl-N'-methylamide. Biopolymers, 1992. 32(5): p. 523-35.
(131) Efron, B., Bootstrap Methods: Another Look at the Jackknife. The Annals
of Statistics, 1979. 7(1): p. 1-26.
(132) Grossfield, A., "WHAM: the weighted histogram analysis method" Version
2.0.9 http://membrane.urmc.rochester.edu/content/wham.
(133) Elias, A. and G.A. Cisneros, Biomolecular Modelling and Simulations
Computational Study of Putative Residues Involved in DNA Synthesis
Fidelity Checking in Thermus aquaticus DNA Polymerase I. Advances in
protein chemistry and structural biology, 2014. 96: p. 39-75.
(134) Graham, S.E.; F. Syeda, and G.A. Cisneros, Computational Prediction of
Residues Involved in Fidelity Checking for DNA Synthesis in DNA
Polymerase I. Biochemistry, 2012. 51(12): p. 2569-2578.
(135) Cisneros, G.A.; H. Liu; Y. Zhang, and W. Yang, Ab initio QM/MM study
shows there is no general acid in the reaction catalyzed by 4-
oxalocrotonate tautomerase. J Am Chem Soc, 2003. 125(34): p. 10384-
93.
115
(136) Cisneros, G.A.; L. Perera; M. Garcia-Diaz; K. Bebenek; T.A. Kunkel, and
L.G. Pedersen, Catalytic mechanism of human DNA polymerase lambda
with Mg2+ and Mn2+ from ab initio quantum mechanical/molecular
mechanical studies. DNA Repair (Amst), 2008. 7(11): p. 1824-34.
(137) Cisneros, G.A.; L. Perera; R.M. Schaaper; L.C. Pedersen; R.E. London;
L.G. Pedersen, and T.A. Darden, Reaction mechanism of the epsilon
subunit of E. coli DNA polymerase III: insights into active site metal
coordination and catalytically significant residues. J Am Chem Soc, 2009.
131(4): p. 1550-6.
(138) Cisneros, G.A.; M. Wang; P. Silinski; M.C. Fitzgerald, and W. Yang, The
protein backbone makes important contributions to 4-oxalocrotonate
tautomerase enzyme catalysis: understanding from theory and
experiment. Biochemistry, 2004. 43(22): p. 6885-92.
(139) Cui, Q. and M. Karplus, Catalysis and specificity in enzymes: a study of
triosephosphate isomerase and comparison with methyl glyoxal synthase.
Adv Protein Chem, 2003. 66: p. 315-72.
(140) Li, G. and Q. Cui, What is so special about Arg 55 in the catalysis of
cyclophilin A? insights from hybrid QM/MM simulations. J Am Chem Soc,
2003. 125(49): p. 15028-38.
(141) Marti, S.; J. Andres; V. Moliner; E. Silla; I. Tunon, and J. Bertran,
Preorganization and reorganization as related factors in enzyme catalysis:
the chorismate mutase case. Chemistry, 2003. 9(4): p. 984-91.
116
(142) Senn, H.M.; D. O'Hagan, and W. Thiel, Insight into enzymatic C-F bond
formation from QM and QM/MM calculations. J Am Chem Soc, 2005.
127(39): p. 13643-55.
(143) Szefczyk, B.; F. Claeyssens; A.J. Mulholland, and W.A. Sokalski,
Quantum chemical analysis of reaction paths in chorismate mutase:
Conformational effects and electrostatic stabilization. International Journal
of Quantum Chemistry, 2007. 107(12): p. 2274-2285.
(144) Fang, D.; R.L. Lord, and G.A. Cisneros, Ab Initio QM/MM Calculations
Show an Intersystem Crossing in the Hydrogen Abstraction Step in
Dealkylation Catalyzed by AlkB. The Journal of Physical Chemistry B,
2013. 117(21): p. 6410-6420.
(145) Baker, N.A.; D. Sept; S. Joseph; M.J. Holst, and J.A. McCammon,
Electrostatics of nanosystems: application to microtubules and the
ribosome. Proc Natl Acad Sci U S A, 2001. 98(18): p. 10037-41.
(146) Parks, J.M.; H. Hu; A.J. Cohen, and W. Yang, A pseudobond
parametrization for improved electrostatics in quantum
mechanical/molecular mechanical simulations of enzymes. J Chem Phys,
2008. 129(15): p. 154106.
(147) Frisch, M.J.; G.W. Trucks; H.B. Schlegel; G.E. Scuseria; M.A. Robb; J.R.
Cheeseman; G. Scalmani; V. Barone; B. Mennucci; G.A. Petersson, et al.,
Gaussian 09. 2009, Gaussian, Inc.: Wallingford, CT, USA.
(148) Ponder, J.W., TINKER 4.2. 2008: Washington University in Saint Louis:
Saint Louis, MO.

117
(149) Zhang, Y.; H. Liu, and W. Yang, Free energy calculation on enzyme
reactions with an efficient iterative procedure to determine minimum
energy paths on a combined ab initio QM/MM potential energy surface.
The Journal of Chemical Physics, 2000. 112(8): p. 3483-3492.
(150) Andrés Cisneros, G. and W. Yang, Comparison Of Reaction Barriers In
Energy And Free Energy For Enzyme Catalysis, in Multi-scale Quantum
Models for Biocatalysis, D. York and T.-S. Lee, Editors. 2009, Springer
Netherlands. p. 57-78.
(151) Hou, G. and Q. Cui, QM/MM Analysis Suggests That Alkaline
Phosphatase (AP) and Nucleotide Pyrophosphatase/Phosphodiesterase
Slightly Tighten the Transition State for Phosphate Diester Hydrolysis
Relative to Solution: Implication for Catalytic Promiscuity in the AP
Superfamily. Journal of the American Chemical Society, 2011. 134(1): p.
229-246.
(152) Hou, G. and Q. Cui, Stabilization of Different Types of Transition States in
a Single Enzyme Active Site: QM/MM Analysis of Enzymes in the Alkaline
Phosphatase Superfamily. Journal of the American Chemical Society,
2013. 135(28): p. 10457-10469.
(153) Koivisto, P.; T. Duncan; T. Lindahl, and B. Sedgwick, Minimal Methylated
Substrate and Extended Substrate Range of Escherichia coli AlkB Protein,
a 1-Methyladenine-DNA Dioxygenase. Journal of Biological Chemistry,
2003. 278(45): p. 44348-44354.

118
(154) López-Canut, V.; M. Roca; J. Bertrán; V. Moliner, and I. Tuñón,
Theoretical Study of Phosphodiester Hydrolysis in Nucleotide
Pyrophosphatase/Phosphodiesterase. Environmental Effects on the
Reaction Mechanism. Journal of the American Chemical Society, 2010.
132(20): p. 6955-6963.
(155) Prasad, B.R.; N.V. Plotnikov, and A. Warshel, Addressing Open Questions
about Phosphate Hydrolysis Pathways by Careful Free Energy Mapping.
The Journal of Physical Chemistry B, 2012. 117(1): p. 153-163.
(156) Wong, K.-Y. and J. Gao, Insight into the phosphodiesterase mechanism
from combined QM/MM free energy simulations. FEBS Journal, 2011.
278(14): p. 2579-2595.
(157) Yang, L.; R.-Z. Liao; J.-G. Yu, and R.-Z. Liu, DFT Study on the
Mechanism of Escherichia coli Inorganic Pyrophosphatase. The Journal of
Physical Chemistry B, 2009. 113(18): p. 6505-6510.
(158) Alberts, B.; A. Johnson, and J.e.a. Lewis, Chromosomal DNA and Its
Packaging in the Chromatin Fiber
http://www.ncbi.nlm.nih.gov/books/NBK26834/, in Molecular Biology of the
Cell. 2002, Garland Science: New York.
(159) Verdone, L.; M. Caserta, and E. Di Mauro, Role of histone acetylation in
the control of gene expression. Biochem Cell Biol, 2005. 83(3): p. 344-53.
(160) Kadosh, D. and K. Struhl, Targeted Recruitment of the Sin3-Rpd3 Histone
Deacetylase Complex Generates a Highly Localized Domain of

119
Repressed Chromatin In Vivo. Molecular and Cellular Biology, 1998.
18(9): p. 5121-5127.
(161) Grunstein, M., Histone acetylation in chromatin structure and transcription.
Nature, 1997. 389(6649): p. 349-352.
(162) Pazin, M.J. and J.T. Kadonaga, What's Up and Down with Histone
Deacetylation and Transcription? Cell, 1997. 89(3): p. 325-328.
(163) Falkenberg, K.J. and R.W. Johnstone, Histone deacetylases and their
inhibitors in cancer, neurological diseases and immune disorders. Nat Rev
Drug Discov, 2014. 13(9): p. 673-691.
(164) Mai, A.; S. Massa; D. Rotili; I. Cerbara; S. Valente; R. Pezzi; S. Simeoni,
and R. Ragno, Histone deacetylation in epigenetics: An attractive target
for anticancer therapy. Medicinal Research Reviews, 2005. 25(3): p. 261-
309.
(165) Minucci, S. and P.G. Pelicci, Histone deacetylase inhibitors and the
promise of epigenetic (and more) treatments for cancer. Nat Rev Cancer,
2006. 6(1): p. 38-51.
(166) Witt, O.; H.E. Deubzer; T. Milde, and I. Oehme, HDAC family: What are
the cancer relevant targets? Cancer Letters, 2009. 277(1): p. 8-21.
(167) Noonan, E.J.; R.F. Place; D. Pookot; S. Basak; J.M. Whitson; H. Hirata; C.
Giardina, and R. Dahiya, miR-449a targets HDAC-1 and induces growth
arrest in prostate cancer. Oncogene, 2009. 28(14): p. 1714-1724.

120
(168) Khan, O. and N.B. La Thangue, HDAC inhibitors in cancer biology:
emerging mechanisms and clinical applications. Immunol Cell Biol, 2012.
90(1): p. 85-94.
(169) Dashwood, R.H.; M.C. Myzak, and E. Ho, Dietary HDAC inhibitors: time to
rethink weak ligands in cancer chemoprevention? Carcinogenesis, 2006.
27(2): p. 344-349.
(170) Mariadason, J.M., HDACs and HDAC inhibitors in colon cancer.
Epigenetics, 2008. 3(1): p. 28-37.
(171) Loening, A.M. and S.S. Gambhir, AMIDE: a completely free system for
medical imaging data analysis. The Journal of Nuclear Medicine, 2001.
42(5): p. 192.
(172) Bottomley, M.J.; P. Lo Surdo; P. Di Giovine; A. Cirillo; R. Scarpelli; F.
Ferrigno; P. Jones; P. Neddermann; R. De Francesco; C. Steinkuhler, et
al., Structural and functional analysis of the human HDAC4 catalytic
domain reveals a regulatory structural zinc-binding domain. J Biol Chem,
2008. 283(39): p. 26694-704.
(173) Somoza, J.R.; R.J. Skene; B.A. Katz; C. Mol; J.D. Ho; A.J. Jennings; C.
Luong; A. Arvai; J.J. Buggy; E. Chi, et al., Structural snapshots of human
HDAC8 provide insights into the class I histone deacetylases. Structure,
2004. 12(7): p. 1325-34.
(174) Sali, A. and T.L. Blundell, Comparative protein modelling by satisfaction of
spatial restraints. J Mol Biol, 1993. 234(3): p. 779-815.
121
(175) Pettersen, E.F.; T.D. Goddard; C.C. Huang; G.S. Couch; D.M. Greenblatt;
E.C. Meng, and T.E. Ferrin, UCSF Chimera--a visualization system for
exploratory research and analysis. J Comput Chem, 2004. 25(13): p.
1605-12.
(176) Lobera, M.; K.P. Madauss; D.T. Pohlhaus; Q.G. Wright; M. Trocha; D.R.
Schmidt; E. Baloglu; R.P. Trump; M.S. Head; G.A. Hofmann, et al.,
Selective class IIa histone deacetylase inhibition via a nonchelating zinc-
binding group. Nat Chem Biol, 2013. 9(5): p. 319-325.
(177) Wu, R.; S. Wang; N. Zhou; Z. Cao, and Y. Zhang, A Proton-Shuttle
Reaction Mechanism for Histone Deacetylase 8 and the Catalytic Role of
Metal Ions. Journal of the American Chemical Society, 2010. 132(27): p.
9471-9479.
(178) Finnin, M.S.; J.R. Donigian; A. Cohen; V.M. Richon; R.A. Rifkind; P.A.
Marks; R. Breslow, and N.P. Pavletich, Structures of a histone
deacetylase homologue bound to the TSA and SAHA inhibitors. Nature,
1999. 401(6749): p. 188-93.
(179) Corminboeuf, C.; P. Hu; M.E. Tuckerman, and Y. Zhang, Unexpected
deacetylation mechanism suggested by a density functional theory
QM/MM study of histone-deacetylase-like protein. J Am Chem Soc, 2006.
128(14): p. 4530-1.

122
ABSTRACT
CLASSICAL AND AB INITIO QM/MM SIMULATIONS OF BACTERIAL ENZYMES
by
SAJEEWA WALIMUNI DEWAGE
May 2015
Advisor: Professor Andres Cisneros
Major: Chemistry (Physical)
Degree: Doctor of Philosophy
This thesis describes analyses performed on three enzyme systems.
Chapter 2, 3, and 4 involve studies carried out on the GatCAB enzyme of H.
pylori and S. aureus. Since information at the electronic level was not required for
these studies, sampling of the configuration space carried out at the molecular
mechanics level was adequate. In Chapter 2, the snapshots sampled using MD
were used as input for average correlation difference calculations and average
RMSD difference calculations to ascertain the existence of a communication
pathway between two subunits of GatCAB. Experimental and computational
results obtained, suggest the existence of a communication pathway between the
GatA and GatB subunits of H. pylori GatCAB. In Chapter 3, the snapshots
sampled using MD were used as input for average correlation difference
calculations and pKa calculations to analyze the possibility of an amino acid
residue acting as a possible catalytic acid/base at the entrance of an
intramolecular tunnel that transfers ammonia from one active site to another.

123
Experimental results that compare glutaminase, kinase, and transamidase
activity for wild-type H. pylori GatCAB with the mutants D185(A)E, D185(A)A, and
D185(A)N as well as our computational results support the possibility of D185(A) in
H. pylori GatCAB acting as a catalytic acid/base in protonation/deprotonation of
ammonia. In Chapter 4, MD snapshots were used to calculate intramolecular
tunnels inside S. aureus GatCAB along which the free energy for the transfer of
ammonia was calculated using the WHAM method to identify the tunnel that was
thermodynamically more favorable. EDA and APBS analyses were utilized for
further characterization of the tunnels in terms of non-bonded interactions
between the ammonia molecule and the surrounding amino acids lining the
tunnel. The results of the free energy calculations using WHAM as well as the
energy differences calculated using EDA showed that tunnel1 (proposed in 2006
by Nakamura et al.) is thermodynamically more favorable for transfer of ammonia
compared to tunnel2 (proposed in 2012 by Kang et al.)
Chapter 5 discusses the inorganic pyrophosphatase (PPase) mechanism
in M. tuberculosis which requires information at the electronic level. The QM/MM
hybrid method was used in which the reactive moieties were included in the QM
subsystem to achieve accuracy at the electronic level while the rest of the system
was treated at the molecular mechanics level. Based on a set of newly isolated
crystal structures and the results of the QM/MM calculations, a new mechanism
for the PPase catalyzed PPi hydrolysis was proposed and an energy barrier of
6.6 kcal/mol was calculated at the B3LYP/6-31G(d,p) level of theory.
124
In Chapter 6, molecular docking was used to dock a set of novel
substrates that are being experimentally tested as potential radiotracers, onto
HDAC4 and HDAC8 enzymes to calculate/compare their relative binding
affinities. The trends in the increase in affinity, of the novel substrates for HDAC4
and HDAC8 active sites calculated by molecular docking, agreed with the
experimentally shown trends.
125
AUTOBIOGRAPHY STATEMENT
Sajeewa Walimuni Dewage
Education
2010-2015 Ph.D., Physical Chemistry
Department of Chemistry, Wayne State University
2005-2009 B.Sc., Chemistry
Department of Chemistry, University of Kelaniya, Sri Lanka
Honors and awards
Member of Phi Lambda Upsilon (PLU)
A. Paul and Carol C. Schaap Endowed Distinguished Graduate Student
Fellowship (2012-2013)
Publications
1. Dewage S.W., Cisneros G.A.,”Computational analysis of ammonia
transfer along two intramolecular tunnels in Staphylococcus aureus
glutamine-dependent amidotransferase (GatCAB)”, Journal of Physical
Chemistry B, 2015. 119(9): p. 3669-77.
2. Zhao L., Dewage S.W., Bell M.J., Chang K.-M., Fatma S., Joshi N.V.,
Silva G.N., Cisneros G.A., Hendrickson T.L., "The kinase activity of the
Helicobacter pylori Asp-tRNA /Glu-tRNA amidotransferase is sensitive to
distal mutations in its putative ammonia channel", Biochemistry, 51, 273-
285, 2012.
3. Zhao L., Dewage S.W., Cisneros G.A., Hendrickson T.L.,
“Characterization of D185 Ammonia Tunnel Mutations Reveals a Catalytic
Step in the Ammonia Delivery Mechanism of the Asp-tRNAAsn/Glu-
tRNAGln Amidotransferase (AdT)”, Biochemistry, (in revision) 2015
4. Robin Bonomi, Uday Mukhopadhyay, Sajeewa W. Dewage, Anjoy Majhi,
Aleksander Shavrin, Amer Najjar, Hsien-Hsien Yeh, Xin Lu, Tom Magner,
G. Andrés Cisneros, William P. Tong, Mian M. Alauddin, Juri G. Gelovani,
Nashaat Turkman “Development of Novel Histone Deacetylase Class IIa-
specific Substrate Radiotracers for PET imaging”, J. Mol. Pharm., (in
revision) 2015