Classic Case03 (1)
50
CLASSIC CASE 3 BRIGGS & STRATTON CORPORATION: COMPETING IN THE OUTDOOR POWER EQUIPMENT INDUSTRY Richard C. Hoffman Salisbury State University John E. Gamble University of South Alabama Edwin W. Arnold Auburn University at Montgomery Since introducing its first small aluminum engine in 1953, Briggs & Stratton had consistently led the industry in manufacturing small gasoline engines for outdoor power equipment such as lawn mowers, rotary tillers, snow throwers, and lawn vacuums (see Exhibit 1). During the 1980s, Briggs & Stratton, like many other U.S. manufacturing companies, found itself confronted with a new group of rivals—Japanese companies with the strategic intent of capturing the U.S. market. In 1994, Briggs & Stratton President and Chief Executive Officer Frederick P. Stratton observed: We began the 1980s as the world’s leading producer of small engines. We began the 1990s as the world’s leading producer. These two statements belie the intervening difficulties… Responding to reduced demand and a weakening yen, the four Japanese motorcycle manufacturers threw resources into an effort to conquer the small engine market. We recognized that we had to do a lot of things differently if we were to maintain our leadership position in the face of this threat. The combination of a stronger yen and the things we did stemmed the tide. The Japanese thrust has been parried, and the experience made us in many ways a stronger company. To maintain its leadership position, the company broadened its product line, reduced costs, improved quality, and invested in new plants and processes. One of the outcomes combating the Japanese invasion was a clearer vision of the firm’s strategy in a period characterized by strong competitive rivalry. As Stratton described it: We reaffirmed our traditional strategic direction, agreeing to commit major resources only to our traditional mass market core business and to serve other market segments with limited resources or in partnerships with other companies with appropriate capabilities. 1
-
Upload
wyenne-dela-cruz -
Category
Documents
-
view
34 -
download
9
Transcript of Classic Case03 (1)

CLASSIC CASE 3BRIGGS & STRATTON CORPORATION: COMPETING IN
THE OUTDOOR POWER EQUIPMENT INDUSTRY
Richard C. Hoffman
Salisbury State University
John E. Gamble
University of South Alabama
Edwin W. Arnold
Auburn University at Montgomery
Since introducing its first small aluminum engine in 1953, Briggs & Stratton had consistently led the industry in manufacturing small gasoline engines for outdoor power equipment such as lawn mowers, rotary tillers, snow throwers, and lawn vacuums (see Exhibit 1). During the 1980s, Briggs & Stratton, like many other U.S. manufacturing companies, found itself confronted with a new group of rivals—Japanese companies with the strategic intent of capturing the U.S. market. In 1994, Briggs & Stratton President and Chief Executive Officer Frederick P. Stratton observed:
We began the 1980s as the world’s leading producer of small engines. We began the 1990s as the world’s leading producer. These two statements belie the intervening difficulties…Responding to reduced demand and a weakening yen, the four Japanese motorcycle manufacturers threw resources into an effort to conquer the small engine market. We recognized that we had to do a lot of things differently if we were to maintain our leadership position in the face of this threat. The combination of a stronger yen and the things we did stemmed the tide. The Japanese thrust has been parried, and the experience made us in many ways a stronger company.
To maintain its leadership position, the company broadened its product line, reduced costs, improved quality, and invested in new plants and processes. One of the outcomes combating the Japanese invasion was a clearer vision of the firm’s strategy in a period characterized by strong competitive rivalry. As Stratton described it:
We reaffirmed our traditional strategic direction, agreeing to commit major resources only to our traditional mass market core business and to serve other market segments with limited resources or in partnerships with other companies with appropriate capabilities.
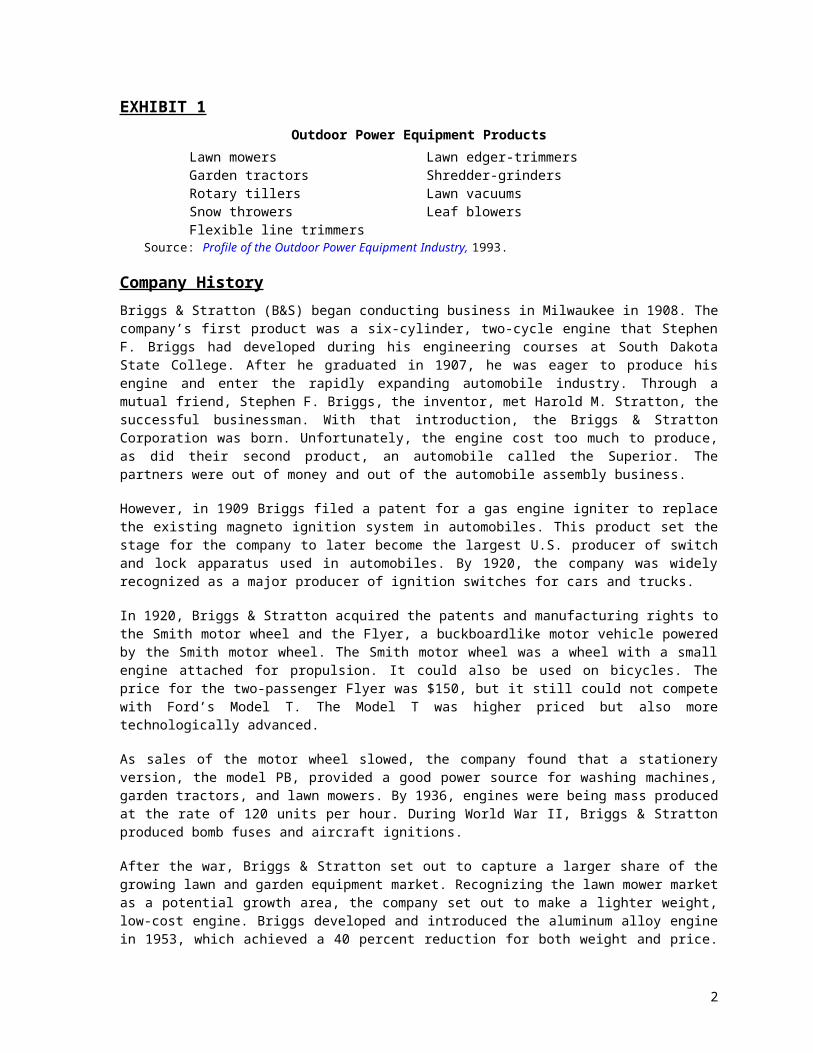
EXHIBIT 1
Outdoor Power Equipment Products
Lawn mowersGarden tractorsRotary tillersSnow throwersFlexible line trimmers
Lawn edger-trimmersShredder-grindersLawn vacuumsLeaf blowers
Source: Profile of the Outdoor Power Equipment Industry, 1993.
Company History
Briggs & Stratton (B&S) began conducting business in Milwaukee in 1908. The company’s first product was a six-cylinder, two-cycle engine that Stephen F. Briggs had developed during his engineering courses at South Dakota State College. After he graduated in 1907, he was eager to produce his engine and enter the rapidly
1
expanding automobile industry. Through a mutual friend, Stephen F. Briggs, the inventor, met Harold M. Stratton, the successful businessman. With that introduction, the Briggs & Stratton Corporation was born. Unfortunately, the engine cost too much to produce, as did their second product, an automobile called the Superior. The partners were out of money and out of the automobile assembly business.
However, in 1909 Briggs filed a patent for a gas engine igniter to replace the existing magneto ignition system in automobiles. This product set the stage for the company to later become the largest U.S. producer of switch and lock apparatus used in automobiles. By 1920, the company was widely recognized as a major producer of ignition switches for cars and trucks.
In 1920, Briggs & Stratton acquired the patents and manufacturing rights to the Smith motor wheel and the Flyer, a buckboardlike motor vehicle powered by the Smith motor wheel. The Smith motor wheel was a wheel with a small engine attached for propulsion. It could also be used on bicycles. The price for the two-passenger Flyer was $150, but it still could not compete with Ford’s Model T. The Model T was higher priced but also more technologically advanced.
As sales of the motor wheel slowed, the company found that a stationery version, the model PB, provided a good power source for washing machines, garden tractors, and lawn mowers. By 1936, engines were being mass produced at the rate of 120 units per hour. During World War II, Briggs & Stratton produced bomb fuses and aircraft ignitions.
After the war, Briggs & Stratton set out to capture a larger share of the growing lawn and garden equipment market. Recognizing the lawn mower market as a potential growth area, the company set out to make a lighter weight, low-cost engine. Briggs developed and introduced the aluminum alloy engine in 1953, which achieved a 40 percent reduction for both weight and price. The aluminum engine was a huge success, with initial demand outstripping supply. In response to demand, the company opened a new engine plant in Wauwatosa, Wisconsin, on an 85-acre site.
In November 1975, some 56 years after the motor wheel opened the way into the small engine business, the 100 millionth Briggs & Stratton engine came off the assembly line. In 1990, revenues reached $1 billion for the first time, and in 1995, B&S ranked 717th in sales on the Fortune 1000 list of the largest U.S. industrial and service corporations. Over 90 percent of the company’s revenues came from the sale of small gasoline-powered engines; the remainder came from selling ignition switches and locks for motor vehicles to the auto manufacturers. Exhibits 2–5 present the company’s recent financial performance.
EXHIBIT 2
Briggs & Stratton’s Corporation Income Statements, 1992–19941994 1993 1992
Net sales $1,285,517,000 $1,139,462,000 $1,041,828,000Cost of goods sold 1,018,977,000 926,861,000 867,780,000Gross profit on sales 266,540,000 212,601,000 174,048,000Engineering, selling, general, and administrative expenses
94,795,000 83,176,000 78,736,000
Income from operations 171,745,000 129,425,000 95,312,000Interest expense (8,997,000) (11,283,000) (11,246,000)Other income (expense), net 6,973,000 (3,737,000) (3,863,000) Income before provision for income taxes
169,721,000 114,405,000 80,203,000
Provision for income taxes 67,240,000 44,060,000 28,700,000 Net income before cumulative effect of accounting changes
102,481,000 70,345,000 51,503,000
2

Cumulative effect of accounting changes for: Postretirement health care, net of income taxes of $25,722,000
(40,232,000) — —
Postemployment benefits, net of income taxes of $430,000
(672,000) — —
Deferred income taxes 8,346,000 — —(32,558,000) — —
Net income $69,923,000 $70,345,000 $51,503,000Source: 1994 Company Annual Report.
EXHIBIT 3
Briggs & Stratton Corporation, Consolidated Balance Sheets, 1993 and 1994Assets July 3, 1994 June 27, 1993Current assets: Cash and cash equivalents
$221,101,000 $39,501,000
Short-term investments — 70,422,000 Receivables, less reserves of $1,678,000 and $754,000, respectively
122,597,000 124,981,000
Inventories: Finished products and parts
55,847,000 46,061,000
Work In process 27,078,000 25,320,000 Raw materials 2,745,000 2,684,000 Total inventories 85,670,000 74,065,000 Future income tax benefits
32,868,000 27,457,000
Prepaid expenses 20,548,000 16,537,000 Total current assets 482,784,000 352,963,000Prepaid pension cost 8,681,000 7,602,000
Plant and equipment: Land and land improvements
10,279,000 10,991,000
Buildings 111,966,000 114,066,000 Machinery and equipment
530,701,000 516,565,000
Construction in progress 16,647,000 16,498,000 Less: Accumulated depreciation and unamortized investment tax credit
383,703,000 362,578,000
Total plant and equipment, net
285,890,000 295,542,000
Total assets $777,355,000 $656,107,000Liabilities and Shareholders’ InvestmentCurrent liabilities: Accounts payable $56,364,000 $39,357,000 Foreign loans 21,323,000 15,927,000
3

Accrued liabilities: Wages and salaries 48,545,000 34,668,000 Warranty 29,800,000 28,318,000 Taxes, other than income taxes
6,772,000 6,003,000
Other 34,837,000 23,079,000 Total accrued liabilities 119,954,000 92,068,000 Federal and state income taxes
9,103,000 10,592,000
Total current liabilities 206,744,000 157,944,000Deferred income taxes 12,317,000 49,900,000Accrued employee benefits
15,423,000 13,305,000
Accrued postretirement health care obligation
64,079,000 —
Long-term debt 75,000,000 75,000,000Shareholders’ investment: Common stock—authorized 30,000,000 shares $.01 Par Value, issued and outstanding 14,463,500 shares in 1994 and 1993
145,000 145,000
Additional paid-in capital 42,358,000 42,883,000 Retained earnings 362,136,000 318,247,000 Cumulative translation adjustments
(847,000) (1,317,000)
Total shareholders’ investment
403,792,000 359,958,000
Total liabilities and shareholders’ investment
$777,355,000 $656,107,000
Source: 1994 Company Annual Report.
EXHIBIT 4
Briggs & Stratton’s Performance by Business Segment, 1990–1994
(in Thousands of Dollars)Year Ended June 30
1994 1993 1992 1991 1990
SalesEngines and parts
$1,197,744 $1,066,053 $967,802 $885,930 $931,638
Locks 87,773 73,409 74,026 64,817 71,219$1,285,517
$1,139,462
$1,041,828
$950,747 $1,022,857
Operating IncomeEngines and parts
$158,900 $128,079 $90,781 $61,081 $61,246
Locks 12,845 1,346 4,531 2,335 5,035$171,745 $129,425 $95,312 $63,416 $66,281
AssetsEngines and parts
$467,561 $458,369 $455,691 $432,345 $456,927
4

Locks 46,832 49,557 45,713 46,994 39,698Unallocated 262,962 148,181 112,449 77,452 38,415
$777,355 $656,107 $613,853 $556,791 $535,040Depreciation ExpenseEngines and parts
$40,605 $44,895 $38,808 $34,521 $38,080
Locks 2,345 2,327 2,305 1,926 1,809$42,950 $47,222 $41,113 $36,447 $39,889
Expenditures for Plant and EquipmentEngines and parts
$37,398 $34,251 $37,035 $28,760 $35,010
Locks 3,406 3,859 3,189 3,276 2,787$40,804 $38,110 $40,224 $32,036 $37,797
Source: 1994 Company Annual Report.
5

EXHIBIT 5
Briggs & Stratton’s Sales, Earnings, and Statistical Data, 1985–1994
(in Thousands of Dollars except per Share Data)For the Years Ended June 30
1994 1993 1992 1991 1990 1989 1988 1987 1986 1985Summary of OperationsNet sales $1,285,517 $1,139,462 $1,041,828 $950,747 $1,002,857 $876,379 $914,057 $784,665 $745,831 $717,773Gross profit on sales 266,540 212,601 174,048 132,431 132,438 59,629 115,113 111,618 124,408 111,248Provision for income taxes 67,240 44,060 28,700 16,500 18,290 (13,980) 12,950 18,950 27,850 28,990Net income 69,923 70,345 51,503 36,453 35,375 (20,032) 30,211 26,614 34,080 33,517Average number of shares of common stock outstanding
14,464 14,464 14,464 14,464 14,464 14,464 14,464 14,464 14,464 14,464
Per share of common stock: Net income 4.84 4.86 3.56 2.52 2.45 (1.39) 2.09 1.84 2.36 2.32 Cash dividends 1.80 1.70 1.60 1.60 1.60 1.60 1.60 1.60 1.60 1.60 Shareholders’ investment 27.92 24.89 21.60 19.69 18.76 17.92 20.97 20.48 20.29 19.59Other DataShareholders’ investment $403,792 $359,958 $312,404 $284,715 $271,383 $259,226 $303,305 $296,260 $293,517 $283,399Total assets 777,355 656,107 637,853 556,791 535,040 560,816 510,600 451,879 436,622 411,598Plant and equipment 669,593 658,120 643,433 632,488 606,863 580,184 513,700 470,586 427,672 390,657Plant and equipment net of reserves
285,890 295,542 309,698 320,364 326,288 330,198 295,573 273,903 248,347 230,240
Provision for depreciation 42,950 47,222 41,113 36,447 39,889 38,995 29,955 24,502 21,508 17,914Expenditures for plant and equipment
40,804 38,110 40,224 32,036 37,797 79,513 57,001 52,235 46,288 58,443
Working capital 276,040 195,019 137,008 105,298 84,082 63,757 63,372 77,281 93,854 92,522Current ratio 2.3 to 1 2.2 to 1 1.9 to 1 1.8 to 1 1.7 to 1 1.4 to 1 1.4 to 1 1.8 to 1 2.0 to 1 2.0 to 1Number of employees at year-end
8,628 7,950 7,799 7,242 7,994 7,316 9,827 8,611 8,299 8,203
Number of shareholders at year-end
6,228 6,651 7,118 7,943 8,466 9,222 6,923 7,206 7,924 8,959
Quoted market price: High 90¼ 68 5/8 54¾ 33¾ 34 34¾ 41 7/8 42 40¼ 31 1/8 Low
64 78
42 7¤8 32 7¤8 20 7¤8 24 7¤8 24 20¼ 31½ 25¾ 25½
Source: 1994 Company Annual Report.

OUTDOOR POWER EQUIPMENT INDUSTRY
In 1995, the outdoor power equipment (OPE) industry consisted of a diverse group of various-sized manufacturers of finished goods and components. The $7.5 billion industry had experienced considerable attrition and consolidation since the mid-1970s. The number of lawn mower manufacturers had declined from around 80 competitors in the mid-1970s to 25 major manufacturers of walk-behind lawn mowers and 15 manufacturers of garden tractors in 1995. The four largest companies accounted for nearly 70 percent of total outdoor power equipment production. The surviving OPE manufacturers were faced with consumers demanding value—higher quality products with greater horsepower at a relatively low price.
Outdoor power equipment manufacturing was not vertically integrated to any significant extent. Industry members manufactured components or assembled finished goods. Component manufacturers supplied one or more of the parts listed in Exhibit 6 to the OPE finished goods manufacturers. Most OPE manufacturers fabricated the metal housings and frames of the lawn mowers, garden tractors, snow throwers, and other outdoor power equipment and then assembled their products from the various parts supplied by the components manufacturers. The cost of components accounted for 47 percent of the value of all finished OPE shipments. Honda and Toro were the only power equipment manufacturers that had vertically integrated backward into components. Honda manufactured engines, housings, frames, and components at its Sweponsville, North Carolina, lawn mower assembly plant. Toro’s vertical integration resulted from its 1989 acquisition of Lawn-Boy from Outdoor Marine Corporation. Most Lawn-Boy models were equipped with the brand’s own two-cycle engines. Exhibit 7 presents industry-average costs and profit margins for outdoor power equipment manufacturers.
EXHIBIT 6
Components Used in the Assembly of Outdoor Power Equipment
1992, 1988, and 1983Percent of Total Value of Components Sold to OPE Finished Goods Assemblers
Component 1992 1988 1983Engines 50.6% 52.4% 58.0%Wheels 4.2 4.6 6.0Transmissions 8.9 7.6 9.0Blades 1.1 NA NABrakes/steering 1.0 NA NABelts 1.3 1.8 NATires 3.1 2.9 NAPlugs/filters 0.6 NA NAGrass-catching bags
1.4 1.2 2.0
Seats 1.3 1.4 NABatteries 1.4 1.4 2.0Decks 2.9 NA NAEngine parts 1.3 NA NAElectrical motor parts
1.2 NA NA
Pulleys 1.3 NA NATines and augers 0.6 NA NAFuel tanks 0.8 NA NACables and controls
1.6 NA NA
Other 15.4 26.7 23.0Total 100.0% 100.0% 100.0%
Source: Profile of the Outdoor Power Equipment Industry, 1993.

EXHIBIT 7
Costs and Profit Margins for Outdoor Power Equipment, 1992Cost Area PercentMaterials 9.6%Components 47.6Wages and benefits 18.3Transportation 1.7Advertising 2.8Selling and administration 9.2Other 7.5Total costs 96.7Net income before taxes 3.3 Total 100.0%
Source: Profile of the Outdoor Power Equipment Industry, 1993.
Distribution in the industry had undergone a major shift during the late 1980s and early 1990s. Traditionally, approximately 50 percent of outdoor power equipment produced by manufacturers was shipped to independent wholesalers who in turn distributed it to general merchandisers, home centers, lawn and garden stores, and other OPE retailers. By 1992, only 20 percent of OPE products on their way to market passed through wholesalers, 18 percent were handled by exporters, and the balance were shipped factory-direct to the retailer. At the retail level, home centers (Home Depot, Lowe’s), national merchandisers such as Sears, and discounters (Wal-Mart, Kmart, and Target) were gaining a larger share of the OPE market. The five largest retailers of OPE products accounted for nearly half of all walk-behind and riding mowers sold in the United States. Outdoor power equipment market share by retail channel is presented in Exhibit 8.
EXHIBIT 8
U.S. Outdoor Power Equipment Retail Distribution, 1995, 1992, and 1983Retail Outlet 1995 1992 1983Hardware stores 5.0% 6.3% 12.0%Home centers 12.0 8.7 3.0National merchandisers
30.0 27.2 22.0
Discount department stores
17.0 12.0 8.0
Lawn and garden stores
15.0 16.9 17.0
OPE/farm equipment stores
16.0 20.2 19.0
Other 5.0 8.7 19.0 Total 100.0% 100.0% 100.0%
Sources: Compiled by the case researchers from a number of sources, including interviews with company personnel; 1983 and 1992 data is based on information contained in the Profile of the Outdoor Power Equipment Industry, 1993.
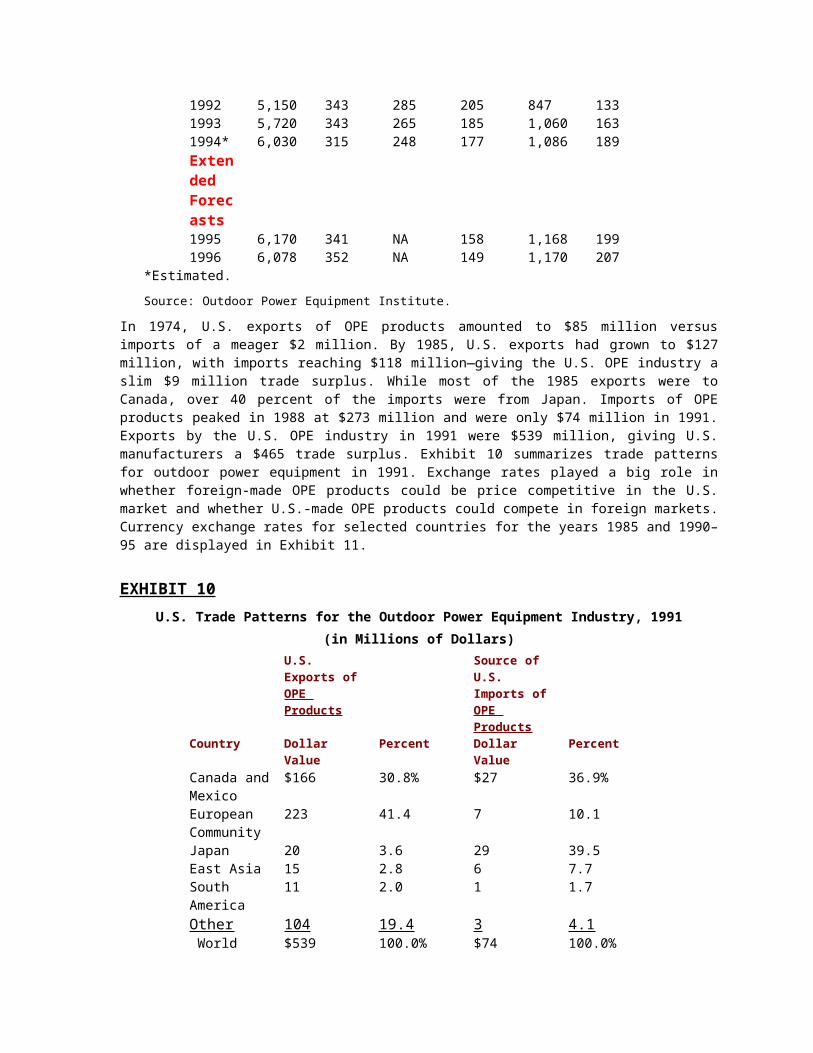
Retail sales of outdoor power equipment tended to vary with the ups and downs in housing starts and the general condition of the national economy. During the late 1970s, industry sales had grown rapidly, driven by the growth in new housing starts and the U.S. economy, allowing many components producers and OPE makers to prosper. Shipments of walk-behind rotary lawn mowers approached 6 million units in 1979 and then tumbled to 4.4 million in 1983 as a result of recessionary effects on the U.S. economy. As the economy improved, sales of walk-behind mowers improved to 5 million units throughout the late 1980s. Exhibit 9 provides shipments of outdoor power equipment by category for recent years and shipment forecasts for 1995 and 1996.
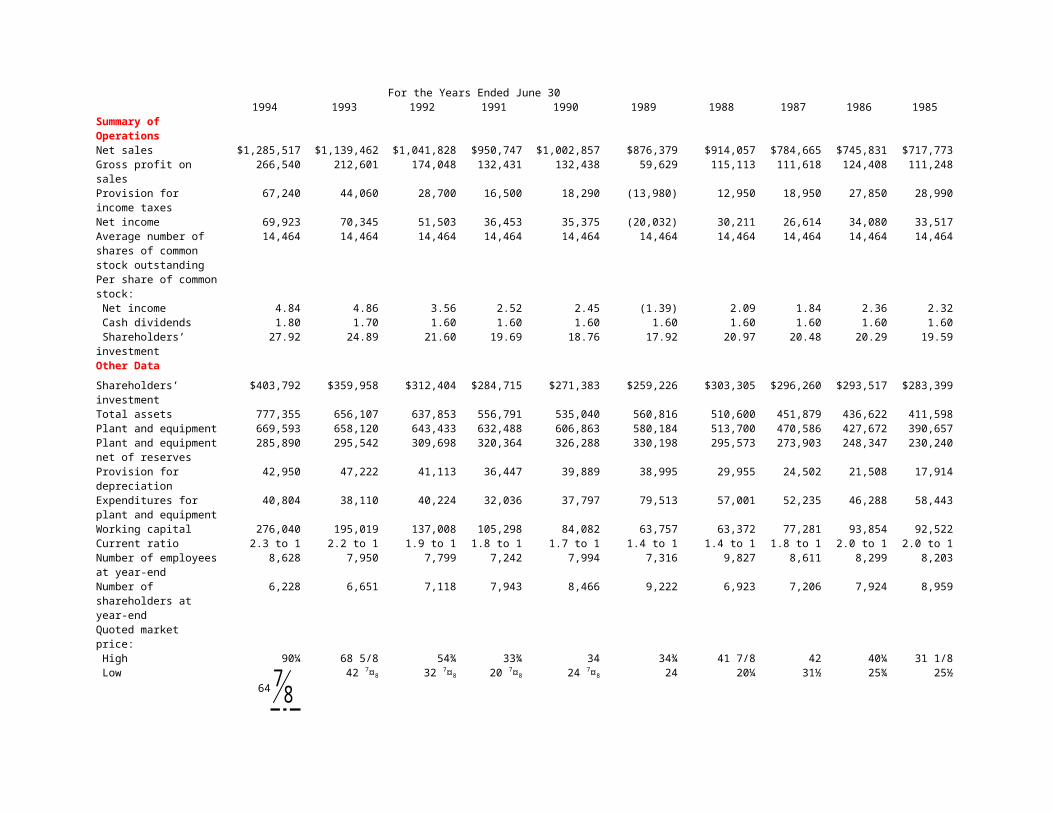
EXHIBIT 9
Shipments of Outdoor Power Equipment, 1985, 1990–1994,
with Forecasts for 1995–1996
(Units in Thousands)Equipment
Walk-Behind RidingYear Rotary
MowersRotary Tillers
Snow Throwers
Rear-Engine Mowers
Front-Engine Mowers
Garden Tractors
1985 5,015 430 258 322 479 1531990 5,700 300 355 247 885 1561991 5,350 296 285 209 840 1281992 5,150 343 285 205 847 1331993 5,720 343 265 185 1,060 1631994* 6,030 315 248 177 1,086 189Extended Forecasts1995 6,170 341 NA 158 1,168 1991996 6,078 352 NA 149 1,170 207
*Estimated.
Source: Outdoor Power Equipment Institute.
In 1974, U.S. exports of OPE products amounted to $85 million versus imports of a meager $2 million. By 1985, U.S. exports had grown to $127 million, with imports reaching $118 million—giving the U.S. OPE industry a slim $9 million trade surplus. While most of the 1985 exports were to Canada, over 40 percent of the imports were from Japan. Imports of OPE products peaked in 1988 at $273 million and were only $74 million in 1991. Exports by the U.S. OPE industry in 1991 were $539 million, giving U.S. manufacturers a $465 trade surplus. Exhibit 10 summarizes trade patterns for outdoor power equipment in 1991. Exchange rates played a big role in whether foreign-made OPE products could be price competitive in the U.S. market and whether U.S.-made OPE products could compete in foreign markets. Currency exchange rates for selected countries for the years 1985 and 1990–95 are displayed in Exhibit 11.
EXHIBIT 10
U.S. Trade Patterns for the Outdoor Power Equipment Industry, 1991
(in Millions of Dollars)U.S. Exports of OPE Products
Source of U.S. Imports of OPE Products
Country Dollar Value Percent Dollar Value PercentCanada and Mexico
$166 30.8% $27 36.9%
European Community
223 41.4 7 10.1
Japan 20 3.6 29 39.5East Asia 15 2.8 6 7.7South America
11 2.0 1 1.7
Other 104 19.4 3 4.1 World total $539 100.0% $74 100.0%
Source: Profile of the Outdoor Power Equipment Industry, 1993.
EXHIBIT 11
Currency Exchange Rates per U.S. Dollar, 1985, 1990–1995Currency 1995 1994 1993 1992 1991 1990 1985Canada (dollar)
1.35 1.31 1.29 1.21 1.15 1.17 1.32
Germany (mark)
1.38 1.74 1.61 1.51 1.49 1.68 3.15
Japan (yen) 84 112 111 127 135 145 251Mexico (peso)*
6.29 3.10 3.10 3,089 2,948 2,683 224
*The Mexican government has revalued the country’s currency a number of times during the 1980s and 1990s due to the currency’s devaluation against the U.S. dollar.
Source: The Wall Street Journal, various years.
Industry Regulation
Prior to 1982, manufacturers of OPE were not regulated by the Consumer Products Safety Commission (CPSC); compliance was voluntary. Voluntary standards were promulgated by the Outdoor Power Equipment Institute (OPEI) and had been supported by the industry trade association since the mid 1950s. The standards were primarily concerned with improved product performance and safety. Safety standards involved both the protection from thrown objects and noise level. About 90 percent of the industry’s products were in compliance with these voluntary standards. Products complying with the standards were affixed with a triangular OPEI seal.
A number of CPSC regulations went into effect in 1982. These standards called for increased safety restrictions for walk-behind power mowers, including shields to protect people from thrown objects, deflectors and drain holes to prevent ignition of spilled fuel, the deadman blade control system, and labeling requirements. Mowers built after July 1, 1982, had to have blades that stopped within three seconds after the operator released a deadman control at the handle of the mower. Meeting this standard involved either installing a blade brake or the addition of a rechargeable, battery-powered electric starter. The CPSC estimated that compliance with the deadman blade control system would cost approximately $35 per unit.
Many engine manufacturers, including Briggs & Stratton, had successfully developed technology to make manual starting much easier, with engines usually starting on the first or second pull. The lawn mower industry asked Congress to amend the safety standard to allow engine stop with manual restart as a third method of compliance with the blade control requirement. President Reagan signed the amendment despite the CPSC’s strong opposition. As of 1995, there were no federal regulations concerning riding mowers, and no additional regulation of walk-behind mowers had been initiated since 1982.
The industry also had to comply with the Magnuson-Moss Act of 1975 requiring that all products with a written warranty and costing the consumer $15 or more come with either a statement concerning the duration of the warranty or a limited warranty. The industry, from time to time, also faced state and local regulations concerning noise and pollution levels of outdoor power equipment.
Environmental regulations emanating from California and the U.S. Environmental Protection Agency (EPA) were of utmost concern to the industry. In 1994, the California Air Resources Board (CARB) and the EPA jointly proposed stringent national emission standards for small utility engines—those typically used in lawn mowers and other outdoor power equipment. Phase I EPA regulations enacted in 1994 required that all utility engines manufactured after August 1996 be modified to reduce the emissions of hydrocarbons and nitrogen oxides by 70 percent from 1990 levels. The California CARB regulations were effective January 1, 1995. The EPA and CARB cited ozone formation (smog) as the motivation for Phase I regulations. In 1995, the industry was involved with the EPA in “regulatory-negotiation” of Phase II regulations that, if implemented, would ultimately require utility engines to meet the same emission standards as automobiles. Phase II regulations also concerned evaporation and spillage from gasoline tanks and containers. Phase I regulations were expected to increase the cost of utility engines by $5 to $10 per engine. In 1993, the outdoor power equipment

industry incurred expenses of $10.6 million related to EPA requirements and expenses of $725,000 related to CPSC compliance.
Competition: Domestic
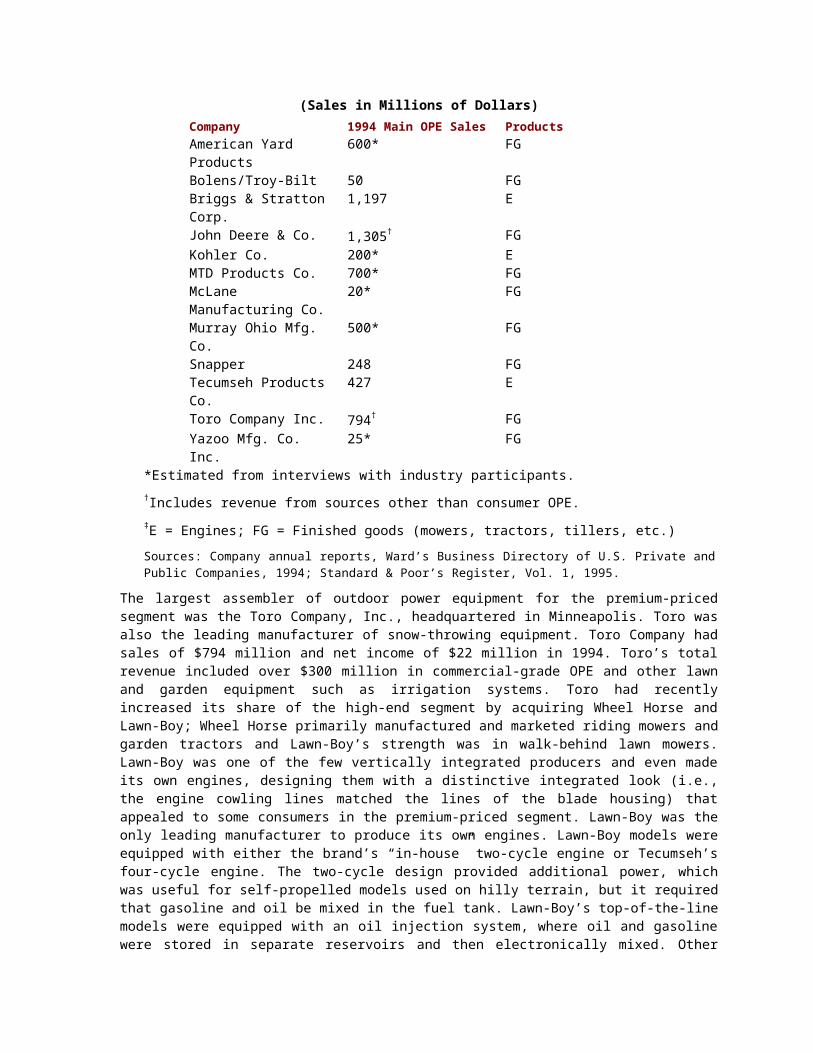
Competition in the OPE industry occurred mainly within two broad strategic groups—finished goods producers and components producers. The finished goods manufacturers represented the largest group of competitors. The major producers of premium-priced lawn mowers included Toro Company, Snapper, and John Deere and Company. MTD Products, Murray Ohio Manufacturing, and American Yard Products (AYP) were the chief producers of outdoor power equipment for the medium-priced and discount markets. The latter three firms also produced equipment for retailers selling OPE products under their own private label. Exhibit 12 shows the major domestic players in the OPE industry in the United States.
EXHIBIT 12
Selected U.S. Outdoor Power Equipment Manufacturers
(Sales in Millions of Dollars)Company 1994 Main OPE Sales ProductsAmerican Yard Products 600* FGBolens/Troy-Bilt 50 FGBriggs & Stratton Corp. 1,197 EJohn Deere & Co. 1,305† FGKohler Co. 200* EMTD Products Co. 700* FGMcLane Manufacturing Co.
20* FG
Murray Ohio Mfg. Co. 500* FGSnapper 248 FGTecumseh Products Co. 427 EToro Company Inc. 794† FGYazoo Mfg. Co. Inc. 25* FG
*Estimated from interviews with industry participants.
†Includes revenue from sources other than consumer OPE.
‡E = Engines; FG = Finished goods (mowers, tractors, tillers, etc.)
Sources: Company annual reports, Ward’s Business Directory of U.S. Private and Public Companies, 1994; Standard & Poor’s Register, Vol. 1, 1995.
The largest assembler of outdoor power equipment for the premium-priced segment was the Toro Company, Inc., headquartered in Minneapolis. Toro was also the leading manufacturer of snow-throwing equipment. Toro Company had sales of $794 million and net income of $22 million in 1994. Toro’s total revenue included over $300 million in commercial-grade OPE and other lawn and garden equipment such as irrigation systems. Toro had recently increased its share of the high-end segment by acquiring Wheel Horse and Lawn-Boy; Wheel Horse primarily manufactured and marketed riding mowers and garden tractors and Lawn-Boy’s strength was in walk-behind lawn mowers. Lawn-Boy was one of the few vertically integrated producers and even made its own engines, designing them with a distinctive integrated look (i.e., the engine cowling lines matched the lines of the blade housing) that appealed to some consumers in the premium-priced segment. Lawn-Boy was the only leading manufacturer to produce its own engines. Lawn-Boy models were equipped with either the brand’s “in-house” two-cycle engine or Tecumseh’s four-cycle engine. The two-cycle design provided additional power, which was useful for self-propelled models used on hilly terrain, but it required that gasoline and oil be mixed in the fuel tank. Lawn-Boy’s top-of-the-line models were equipped with an oil injection system, where oil and gasoline were stored in separate reservoirs and then electronically mixed. Other major engine manufacturers in the industry produced four-cycle engines that required no mixing of gasoline and oil. So far, Toro had not opted to use Lawn-Boy’s two-cycle engines on its Toro or Wheel Horse product lines.

The Snapper division of Actava Group, Inc., marketed a full line of premium-priced lawn mowers, tillers, and snow blowers. Snapper competed in North America and Europe and achieved sales of $248 million in 1994. Snapper emphasized after-the-sale service, and even though it had its own small sales force, it generally marketed through distributors to a network of independent lawn and garden stores. The company maintained large parts inventories and conducted factory service schools that dealers were required to attend once or twice each year.
Deere and Company, Inc., also produced top-of-the-line products. Deere’s garden tractors ranged from $2,000 to $10,000 and were considered by industry rivals to have “Mercedes-Benz” quality. Much of Deere’s OPE sales were in the farming segment. Deere’s OPE sales in 1994 amounted to approximately $1.3 billion. For several years, Deere had chosen B&S engines to power its mowers, but recently it had signed an agreement to purchase the majority of its garden tractor engines from Kawasaki. Kawasaki gained Deere’s business by supplying an engine with higher specifications and a lower price than the Briggs & Stratton engines previously used by John Deere. Deere had recently acquired the Jacobsen/Homelite division of Textron, Inc., which produced high-quality walk-behind lawn mowers, chain saws, blowers, and flexible line trimmers sold under the Homelite and Jacobsen brand names.
The producers of lower-priced mowers included the three largest U.S. lawn mower manufacturers—MTD, Murray, and AYP. MTD Products, Inc., of Valley City, Ohio, was closely held and had estimated sales of $700 million. MTD bought its engines from Briggs & Stratton and Tecumseh, manufactured the frames and housing, and assembled the units for sale. The company sold its products to private-label distributors and marketed nationally in the discount department stores and home centers under its MTD and Yardman brands. The company also marketed through lawn and garden stores under its newly acquired brands—Cub Cadet and White. MTD had the distinction of being the nation’s largest producer of walk-behind lawn mowers and Briggs & Stratton’s largest customer.
American Yard Products was the nation’s second-largest producer of lawn mowers, with estimated sales of $600 million. AYP, a subsidiary of Electrolux, was Sears’s primary supplier of Craftsman label walk-behind mowers, riding mowers, and garden tractors. The Craftsman brand accounted for approximately 25 percent of all lawn mower sales. AYP was also a private-label supplier to other discount chains and manufactured Poulan’s line of lawn mowers. AYP used Tecumseh and Briggs & Stratton engines on its equipment.
The Murray Ohio Manufacturing Co., owned by British conglomerate Tomkins PLC and located in Brentwood, Tennessee, was a major producer of both OPE and bicycles for the medium-priced and discount segments. The company produced a broad line of walk-behind mowers, riding mowers, and garden tractors marketed under its Murray brand. Murray was the primary supplier to Wal-Mart until 1995, when MTD acquired the contract to supply all walk-behind and riding mowers offered by the nation’s leading discounter. Murray had recently acquired Noma, a private-label manufacturer, to expand its capability to supply private-label buyers. Total corporate sales approximated $500 million in 1994. Murray, like its primary rivals MTD and AYP, sourced engines from both B&S and Tecumseh.
The single biggest cost component of lawn mowers was the engine. The three largest producers of mower engines were Briggs & Stratton, Tecumseh Products Co., and Kohler Company. Tecumseh was Briggs & Stratton’s chief domestic competitor in engines ranging from 3 to 20 horsepower and had actually strengthened its position in the industry as a result of price competition in the finished goods segment of the industry. Many OPE manufacturers such as MTD, AYP, and Murray had utilized multiple sourcing as a strategy to minimize components costs. Until retailers began to pressure for lower prices, most finished goods manufacturers found it more convenient to purchase all or most of their engines from a single source—usually Briggs & Stratton.
Tecumseh Products Company was the largest U.S. producer of refrigerator compressors and the second-largest producer of small, gasoline-powered engines. The company also produced gear assemblies and related transmission parts. In 1994, Tecumseh’s operating income on engine sales of $427 million (32 percent of total sales) was $41 million (32 percent of total operating income). The largest customers of Tecumseh engines were Toro Company and AYP. Tecumseh engines were used exclusively on Toro’s snow-throwing equipment

and on about 50 percent of Craftsman walk-behind mowers. Sears advertisements regularly touted the reliability of its Craftsman Eager-1 engines, which were all supplied by Tecumseh.
Kohler Company was privately held, had estimated sales of $1 billion, and employed 12,500 workers. The majority of the company’s revenues came as a result of its plumbing fixtures business. Kohler was a distant third in small engine sales, behind B&S and Tecumseh. Kohler’s engine business was strongest in segments requiring greater horsepower. Kohler engines were more commonly found on garden tractors and industrial products than on walk-behind mowers.
Competition: Foreign
Japan was the primary exporter of OPE products to the United States. The value of Japanese exports of lawn mowers and parts to the United States had increased from less than $3 million in 1978 to $36.1 million in 1985, representing 41 percent of the total value of OPE goods imported into the United States that year. As of 1992, Japanese imports still accounted for 40 percent of all outdoor power equipment imported into the United States. Most foreign imports of OPE products into the United States were high-quality walk-behind mowers and garden tractors. Garden tractors were imported as agricultural machinery and were exempted from paying U.S. tariffs. The three leading import brands of garden tractors were all Japanese: Kubota, Yanmar, and Satoh.
The Japanese small gasoline engine manufacturers—Honda, Yamaha, Kawasaki, and Suzuki—maintained their strongest foothold in the market for engines with industrial applications. Honda was widely acknowledged as the leading global supplier of industrial engines. In the lawn mower segment, Honda mowers were the only foreign brand that was a factor in the U.S. market. Competition from Japanese imports had become much less of a problem for U.S.-based manufacturers since the late 1980s because of the strong increases in the value of the yen against the dollar.
A softening of the motorcycle business in the 1980s had forced Japanese motorcycle manufacturers to look to other markets in order to maintain full use of their production facilities. All four Japanese motorcycle manufacturers (Honda, Kawasaki, Suzuki, and Yamaha) identified outdoor power products as appropriate new business opportunities.
Honda had stated publicly that it intended to become a leader in the powered products field and had transferred resources from its motorcycle division to its powered products division. In many respects, OPE products represented a natural business diversification for Honda because the company was founded in 1948 to produce small internal combustion engines. Honda’s production capacity for small utility engines was about 2.1 million units a year in 1995. The company sold its mowers in the United States through a network of 2,000 established OPE lawn and garden store dealer.
Honda’s U.S. Strategy
Honda had targeted the high end of the U.S. market for OPE products. Similar to Lawn-Boy, it manufactured both the lawn mower engine and the lawn mower body, which resulted in equipment having an integrated look. Honda engines were noted for their light weight and dependability. Professional users of OPE had casually dubbed Honda’s engines “Briggs-Hondas” because of their dependability. Heavy users often replaced worn-out Briggs & Stratton engines with Honda engines. Honda’s product strength was based on its extensive R&D expenditures and its speedy incorporation of cutting-edge technological developments. Honda marketed its products with the aid of extensive advertising and promotion and priced its products competitively, sometimes setting prices below the other premium-priced brands to gain market share. Honda had been extremely successful in both the U.S. motorcycle and automobile markets using similar strategies and possessed extensive resources to support similar efforts in the OPE market (see Exhibit 13).
EXHIBIT 13
Honda Motor Company: Financial Summary, 1985, 1990–1994
(in Millions of U.S. Dollars) 1994 1993 1992 1991 1990 1985Sales $39,927 $35,798 $33,370 $30,567 $27,070 $10,753Net income 619 220 307 540 572 532Assets 34,708 28,526 26,374 21,005 18,018 5,974Stockholders’ equity
$11,715 $9,447 $9,085 $7,736 $6,872 $2,806
Number of employees
92,800 91,300 90,900 85,500 79,200 50,609
Compiled from: “The Global 500,” Fortune, various years.
In 1994, Honda sold approximately 150,000 lawn mowers in the United States—up from 10,000 mowers in 1983. Honda also sold replacement engines compatible with many makes of mowers. Until 1984, Honda lawn mowers bound for the United States had been manufactured in Japan. When its level of U.S. sales made it economical to establish a production base in the United States, Honda built a $26 million manufacturing plant for engines and lawn mowers in Sweponsville, North Carolina. The plant produced all Honda lawn mowers offered in the global market. Honda produced approximately 175,000 mowers and 200,000 engines annually and employed 350 workers in its U.S. facility. Honda had exported over 225,000 lawn mowers and engines from its Sweponsville plant to 16 countries since 1986.
Honda’s products had been well received in the United States, drawing excellent ratings from consumer magazines. A list of Honda outdoor power equipment offered in the United States is provided in Exhibit 14. Comparisons with domestic models were generally quite favorable. The main disadvantages listed in a 1992 Consumer Reports review were difficulty of oil changes and the need to substitute blades when changing from bagging clippings to mulching. Honda mowers received high marks for convenience, performance, and safety. The starting controls were simple, easy to reach, and had an automatic choke that eliminated the need for a choke control on the throttle. The cutting performance of Honda mowers was usually rated excellent; they provided a level cut, even in tall heavy grass, and efficiently bagged clippings. Honda’s mowers met or exceeded safety standards, including a deadman clutch that stopped the blade one second after the control was released, well within the three-second requirement.
EXHIBIT 14
Honda Motor Company, U.S. Outdoor Power Equipment Product Line, 1995Product Number of ModelsLawn mowers 18Riding mowers 3Lawn tractors 3Multipurpose tractors 4Tillers 7Generators 26Snow blowers 6Commercial mowers 5Engines 69
Source: Honda Motor Company Fact Book.
THE BRIGGS & STRATTON CORPORATION
In 1995, Briggs & Stratton (B&S), headquartered in Wauwatosa, Wisconsin, was the world’s largest producer of both small, gas-powered engines used primarily for outdoor power equipment and ignition systems and locks used by the automobile industry. B&S had an estimated 75 percent of the small engine market in the United States and over 50 percent of the worldwide market. Engines and parts accounted for 93 percent of Briggs’s total revenues in 1994 (see Exhibit 15). The other 7 percent was from the sale of automotive lock and key sets through B&S Technologies. Both industries that the company competed in were characterized by strong rivalry. Briggs management decided to spin off the automobile ignition system and lock division to its

shareholders in 1995. A subsidiary corporation was to be established with shares distributed to B&S shareholders as a tax-free dividend.
EXHIBIT 15
Briggs & Stratton’s Sales of OEM and Air-Cooled Engines by End User, 1990–1994Engine Sales as a Percent of Total Revenues
End Uses 1994 1993 1992 1991 1990Lawn and garden equipment
85% 85% 86% 86% 86%
Industrial agricultural
15 15 14 14 14
All exports 21 25 21 21 23 Total engine sales
93% 92% 93% 93% 93%
Source: Company annual reports.
Eighty-five percent of Briggs’s engine sales were to manufacturers of lawn mowers and other outdoor power equipment (shredders-grinders, snow blowers, tillers, etc.). Approximately 15 percent of its engine sales were to manufacturers of construction and agricultural equipment. Briggs’s top three customers for small engines were MTD (18 percent of sales), Murray Ohio Manufacturing (12 percent of sales), and American Yard Products (12 percent of sales). Other large customers included Toro and Snapper.
In 1989, B&S’s engine sales declined 4 percent, and the firm recorded its first unprofitable year in over two decades. The next year, the firm returned to profitability and sales increased at an average annual rate of 3.1 percent between 1990 and 1994. The improved performance was due in part to lower interest rates, improved housing starts, and good weather. Management expected to maintain annual growth in revenues of 3 percent during the 1995–97 period.
International Activities
B&S estimated that 35 to 40 percent of its total engine business resulted from exports, either through the company’s direct sales or through the sales of U.S. OPE manufacturers who chose Briggs as a supplier. Frederick P. Stratton, the company’s CEO, observed:
The market for products powered by our engines is increasingly international. The flow of material around the world is truly amazing. For example, we know of cases where engines we ship to customers in Australia are mounted on equipment destined for Europe, and engines we ship to customers in Europe are mounted on equipment destined for the U.S.
B&S realized that simply defending its domestic market share was not sufficient and that, in the long run, new growth would come from increased sales abroad. During the past decade, B&S gradually expanded its presence in international markets. The company targeted its engines to Europe’s established lawn and garden equipment market and concentrated on providing engines for agricultural, marine, and light industrial applications to developing Asian nations. The primary competitors in the overseas markets included smaller local firms and eight Japanese competitors (Honda, Kawasaki, Suzuki, Yamaha, Fuji, Mitsubishi, Kubota, and Yanmar). Tecnamotor S.p.A. of Italy was a major European competitor and was owned by Tecumseh.
In major foreign markets sales were handled by direct customer contact, whereas in smaller markets independent sales representatives were used. B&S had established sales and service offices in Switzerland, Norway, United Arab Emirates, Australia, New Zealand, and China. Wholly owned distributed centers were located in Canada, the United Kingdom, France, Germany, the Netherlands, Australia, and New Zealand.

Briggs & Stratton had used strategic alliances to establish overseas manufacturing capabilities. The first of these was a 1986 joint venture with Daihatsu Motor Co. to produce V-twin (two cylinders) overhead valve engines for B&S’s Vanguard line (a premium engine line) in Osaka, Japan. This was a less expensive approach to broadening the product line than developing a new product on its own. In 1993, B&S signed a marketing agreement whereby Daihatsu would produce and market a new line of three-cylinder, water-cooled diesel and gasoline engines for the Vanguard line. Another joint venture existed with the Puling Machinery Works and the Yimin Machinery Plant in China to produce cast-iron engines for industrial/construction use in markets outside the United States. In 1992, B&S contracted with Mitsubishi Heavy Industries to supply a line of single-cylinder engines to add to B&S’s Vanguard line.
Products
B&S had the widest engine product line of the small engine manufacturers located throughout the world. Briggs’s most popular engines were air-cooled, four-cycle aluminum alloy engines that ran on straight gas (not mixed with oil) and ranged in size from 3 to 20 horsepower. Less than 5 percent of the company’s engines were of the older air-cooled, cast-iron design, but it still made cast-iron models ranging from 9 to 16 horsepower for selected OPE products sold mainly in foreign markets. B&S also produced air- and water-cooled diesel engines ranging from 3 to 28.5 horsepower. Walk-behind lawn mowers generally were equipped with a 3- to 5.5-HP engine.
Since 1984, B&S had launched four new styles of engines to respond to changing demand and to combat increased competition from Japan. The first of these new lines was the MAX series of 3.5- to 4-HP engines offering better styling, easier starting, and quiet/low maintenance performance. This new line represented the first major engine redesign since 1967. The Quantum line was introduced two years later. It also featured low-profile styling, improved durability, and improved operating convenience—Quantum engines had fewer parts and were assembled with the aid of robotic technology. In 1987, B&S launched the Vanguard line—overhead valve engines ranging from 8 to 18 horsepower and intended for the premium-priced OPE market and for industrial applications. Subsequent additions of larger engines to this line were made through strategic alliances with two Japanese manufacturers, Daihatsu and Mitsubishi. In 1993, the Diamond series of engines was introduced for commercial lawn and garden equipment. These engines ranged from 5.5 to 20 horsepower and had extended life features for durability and rugged power.
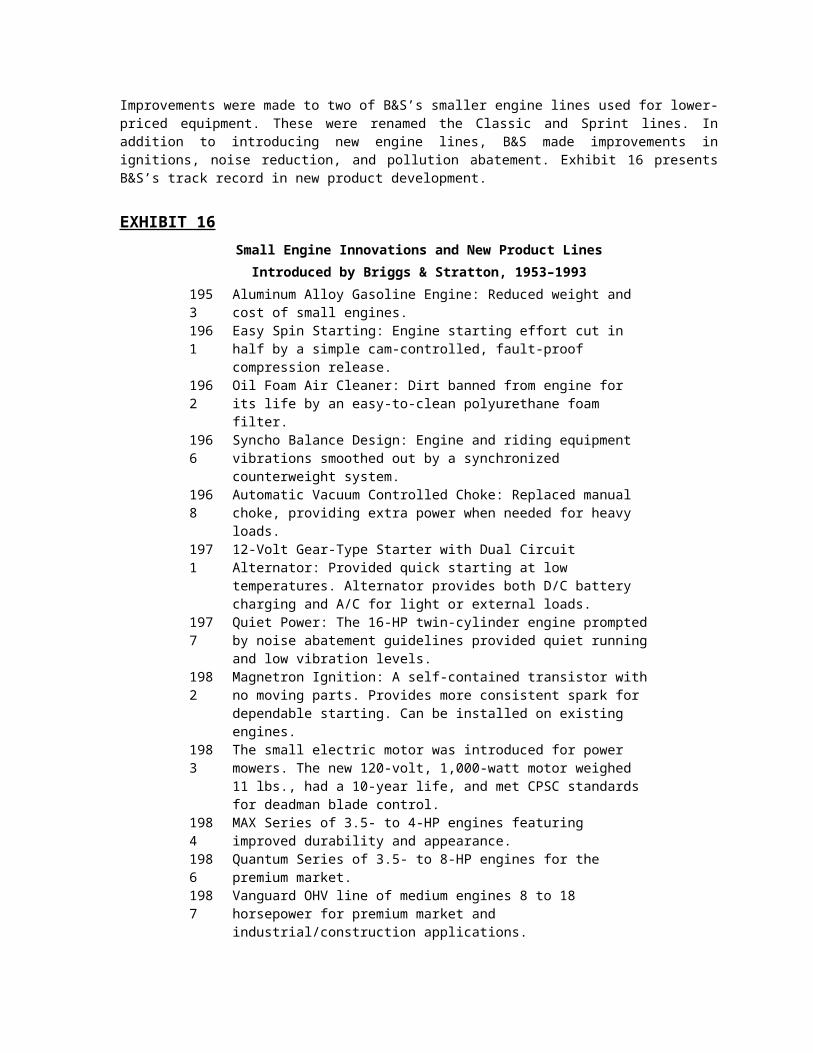
Improvements were made to two of B&S’s smaller engine lines used for lower-priced equipment. These were renamed the Classic and Sprint lines. In addition to introducing new engine lines, B&S made improvements in ignitions, noise reduction, and pollution abatement. Exhibit 16 presents B&S’s track record in new product development.
EXHIBIT 16
Small Engine Innovations and New Product Lines
Introduced by Briggs & Stratton, 1953–1993
1953 Aluminum Alloy Gasoline Engine: Reduced weight and cost of small engines.
1961 Easy Spin Starting: Engine starting effort cut in half by a simple cam-controlled, fault-proof compression release.
1962 Oil Foam Air Cleaner: Dirt banned from engine for its life by an easy-to-clean polyurethane foam filter.
1966 Syncho Balance Design: Engine and riding equipment vibrations smoothed out by a synchronized counterweight system.
1968 Automatic Vacuum Controlled Choke: Replaced manual choke, providing extra power when needed for heavy loads.
1971 12-Volt Gear-Type Starter with Dual Circuit Alternator: Provided quick starting at low temperatures. Alternator provides both D/C battery charging and A/C for light or external loads.
1977 Quiet Power: The 16-HP twin-cylinder engine prompted by noise abatement
guidelines provided quiet running and low vibration levels.1982 Magnetron Ignition: A self-contained transistor with no moving parts.
Provides more consistent spark for dependable starting. Can be installed on existing engines.
1983 The small electric motor was introduced for power mowers. The new 120-volt, 1,000-watt motor weighed 11 lbs., had a 10-year life, and met CPSC standards for deadman blade control.
1984 MAX Series of 3.5- to 4-HP engines featuring improved durability and appearance.
1986 Quantum Series of 3.5- to 8-HP engines for the premium market.1987 Vanguard OHV line of medium engines 8 to 18 horsepower for premium
market and industrial/construction applications.1993 Diamond Series of premium 5.5- to 20-HP engines for the commercial lawn
care market.Compiled from company pamphlets and annual reports.
Marketing and Promotion
For most of its history, B&S sold engines directly to OPE manufacturers, relying on its quality image and reputation to gain sales. This changed during the 80s when B&S assembled its first marketing staff to market engines to consumers and retailers of finished goods. B&S wanted consumers to ask for their engines by name when buying a lawn mower. The company began a television advertising campaign for the first time using the slogan “Briggs & Stratton: the power in power equipment.” Newer versions of these ads were still being aired in the 1990s during the spring season and were shown during sporting events. However, most of B&S’s advertising expenditures were devoted to paying for cooperative ads with dealers to promote OPE products equipped with B&S engines and to promote dealer-certified repair and maintenance services to owners of products with B&S engines. A 1992 survey indicated that B&S’s marketing efforts had been successful, as 72 percent of the surveyed customers specified Briggs & Stratton as the engine they preferred to power their lawn and garden equipment.
Distribution and Service
B&S sold about 70 percent of its engines via annually negotiated contracts with OPE manufacturers. To attract new customers and regain former customers lost to foreign rivals, B&S abandoned its long-standing policy of a single price for all buyers, regardless of quantity purchased or other conditions. The company now offered pricing incentives to its customers who ordered standardized engines, accepted delivery during the off season, or who committed early to specific delivery times during the peak season. However, B&S was committed to its long-standing policy of not integrating forward into the finished goods market and competing with the buyers of its engines.
The growing strength of discount chain retailers had resulted in greater pressure on the prices that OPE producers and parts suppliers could command. Large retailers buying in volume were bargaining hard for favorable prices from OPE producers. Frederick Stratton observed, “For some segments it significantly reduced the price premium our brand equity could command. This increased the importance of being a low-cost producer.” Briggs’s network of over 25,000 authorized service centers in North America and another 7,000 overseas made B&S engines attractive to OPE producers, since the large retailers did not offer outdoor power equipment repair or service.
Production
Manufacturing and assembly of outdoor power equipment was driven by the need to deliver new lawn mowers and tractors for retail sale in early spring and summer. As a result, demand from B&S’s customers was at its peak in winter and spring. Most engines were produced from December to March. Briggs & Stratton manufactured almost all of its components used in assembling engines, including aluminum and iron castings, carburetors, and ignitions. It purchased parts such as piston rings, spark plugs, valves, and smaller plastic and metal parts. Global sourcing was used for these purchases when economically feasible. Over the past few years, B&S had increased its use of recycled or recyclable material, especially steel and aluminum. Currently,
60 percent (by weight) of the firm’s engines was made from recycled materials. Recycled materials tended to be cheaper and contributed to lowering material costs.
Briggs & Stratton had begun to use materials requirement planning (MRP), an inventory reduction program (EOQ), and statistical process control in its new production facilities. The purpose of the MRP system was to provide the correct parts in the right quantities when they were needed in the manufacturing process. This system took advantage of information stored in a computer for timely response and scheduling. The goal of EOQ was to cut inventory in half while still meeting demand requirements. The statistical process control system was intended to detect any trend toward making bad parts before the parts were even produced. In addition, “quality centers” were created to ensure a constant flow of ideas from the bottom up on how to improve inventory and other production management activities.
Since 1985, Briggs had begun to move its plant operations out of Wisconsin. B&S management intended to cut production costs by building state-of-the-art facilities located in nonunion areas. The company’s first non-Wisconsin plant opened in 1986 in Murray, Kentucky. This fully automated plant produced the Classic and Sprint engine lines. In 1990, a new “focused factory” was opened in Poplar Bluff, Missouri, to produce the premium Quantum engine line. Both production processes and employee training at Poplar Bluff were specifically designed for this engine line to ensure the high quality demanded of premium-quality engines. B&S’s largest engine factory was still located in Wauwatosa, Wisconsin. Most other engine lines as well as single-cylinder, overhead-valve Vanguard engines were produced in Wisconsin. Two other Wisconsin factories produced engines and engine parts. Other B&S engines were produced in Asia at the plants of strategic allies in Japan and China. Two foundries in West Allis, Wisconsin, produced castings for B&S engines and also sold to outside customers.
At the end of 1994, B&S employed 8,628 employees, the highest number since 1988, when employment had peaked at 9,827. Productivity per employee improved over the years. In 1985, sales per employee averaged $87,500; by the end of 1994, sales per employee averaged $148,993. Despite this improvement, B&S management still believed that the company had a labor cost disadvantage relative to its foreign and domestic rivals. In 1994, Briggs & Stratton announced a major restructuring of manufacturing operations.
As part of its low-cost strategy, the company planned to construct three new U.S. plants at an estimated cost of $112 million. The new plant construction would result in the transfer of approximately 2,000 jobs from production facilities in Milwaukee, Wisconsin, to new facilities in Statesboro, Georgia, Auburn, Alabama, and a third southern site that had not yet been determined. The plan also provided for the expansion of the Kentucky and Missouri plants and the eventual closing of some of the Wisconsin plants. B&S management anticipated that the plant relocation strategy would result in annual cost savings of approximately $12 million—primarily due to reductions in labor expenses.
Frederick Stratton stated that the hourly compensation cost at the company’s Wisconsin manufacturing facilities placed it at a competitive disadvantage in regard to its ability to compete on price. B&S management estimated that its wage and benefit costs were 20 percent higher than its primary domestic rival, Tecumseh. The company had found that labor-related expenses in its new Poplar Bluff, Missouri, and Murray, Kentucky, plants were considerably lower than in the Milwaukee, Wisconsin, facility. The average wage and benefit cost in the two southern U.S. plants was approximately $11.00 per hour, whereas the hourly wage and benefit cost averaged $21.27 in Milwaukee. The Bureau of Labor Statistics estimated the 1993 U.S. average hourly compensation cost for the industry at $17.86. A contributing factor to the labor cost differential between Briggs & Stratton’s plants was the reluctance by the United Paperworkers International Union to agree to productivity improvement processes that had been successful in the southern facilities. Briggs & Stratton management intended to operate the new plants on a nonunion basis.
FUTURE OUTLOOK
The threat of competition from the Japanese had made Briggs & Stratton a much stronger company. The company responded to the challenge by introducing innovative new product lines, improving product quality, and lowering its relative cost position. In addition, the company was helped by a strong U.S. economy and a

strengthening Japanese yen. The economic conditions and the changes at B&S helped the company attract new customers and regain some old ones. Going into 1995, B&S had regained Toro’s business that had been lost to Suzuki, gotten Snapper to switch from Fuji back to B&S, and recaptured some of John Deere’s business. Frederick Stratton commented on the company’s success:
There are two ways to judge the health of a business: its current financial performance and its long-term strategic position. We believe that our recent good financial performance is to a great degree a result of strategic decisions made three to five years ago. We recognize that our financial performance three to five years from now will reflect the decisions we made in 1994.

TEACHING NOTE FOR CLASSIC CASE 3BRIGGS & STRATTON CORPORATION: COMPETING
IN THE OUTDOOR POWER EQUIPMENT INDUSTRY
John E. Gamble
Auburn University at Montgomery
Arthur A. Thompson
University of Alabama
OVERVIEW
This case describes the competitive structure of the outdoor power equipment industry (OPE) and the competitive position of Briggs & Stratton as the leading global supplier of small gasoline engines to makers of outdoor power equipment (lawn mowers, blowers, rotary tillers, snow throwers, and trimmers). As of 1995, a number of factors were altering the competitive landscape in both the components and finished goods segments of the OPE industry, including the consolidation and growing strength of OPE retailers, shifts in the importance of various channels of distribution, the consolidation and attrition of power equipment manufacturers, Honda’s opening of a large U.S. manufacturing facility to assemble engines and lawn mowers, and the efforts of Japan’s four motorcycle manufacturers (Honda, Kawasaki, Suzuki, and Yamaha) to conquer the world’s small engine market. To protect the leadership position it had enjoyed since the 1950s, Briggs & Stratton had to do a lot of things differently in the face of the industry changes and the Japanese threat. The case recounts the strategic response that B&S crafted and its situation going into 1995. The surprise, for some students, is that so far B&S has done a credible job of parrying the Japanese threat, thanks to some help from a rising Japanese yen. But, will B&S’s good fortunes continue?
An earlier version of this case, written in the late 1980s, was part of the case collections for the fifth and sixth editions and earned much acclaim for its teachability; we think you’ll find the new update just as compelling.
SUGGESTIONS FOR USING THE CASE
The Briggs & Stratton case is an excellent vehicle for drilling students in the use of the concepts and tools discussed in text chapters 3 and 4. There’s ample information in the case for students to
·1 Identify the industry’s economic characteristics.
·2 Do a five-forces analysis of competition among the manufacturers of small gasoline engines.
·3 Identify the driving forces in the industry.
·4 Identify key success factors.
·5 Evaluate industry attractiveness.
·6 Do a SWOT analysis (for B&S).
·7 Examine the industry value chain.
·8 Assess B&S’s competitive position.
·9 Critique B&S’s competitive strategy and recommend how to strengthen it.
B&S is pursuing a classic low-cost leadership strategy and has deliberately avoided integrating forward into the production of outdoor power equipment. Honda is pursuing a differentiation strategy complemented by

both vertical integration and related diversification (into products that utilize gasoline engine technology—automobiles, motorcycles, lawn mowers, portable generators, and boat engines). So there’s also great opportunity to discuss the relative power of the competitive strategies employed by industry participants and bring in the material covered in text chapters 5 and 6. We suggest positioning the case in the second half of your module on strategic analysis of single business enterprises, partly because of the slightly more complex industry and competitive analysis involved and partly because students will need to draw upon material from chapters 3-6 (including the sections on global competition in chapter 6). You’ll find this case does a good job of introducing students to the competitive challenges U.S. manufacturers face in going head-to-head against Japanese companies.
The case is well-suited for both written assignments and oral team presentations. Our suggested assignment questions are as follows:
1. As a consultant to Briggs & Stratton, Mr. Frederick Stratton has asked you to provide him with a full assessment of his company’s situation and your recommendations concerning the strategy B&S should pursue for the next several years. Specifically, he wants you to prepare a crisply-written 4-6 page report that includes a five-forces analysis of competition, identification of the industry’s driving forces and key success factors, an evaluation of the industry’s long-term attractiveness, a SWOT analysis, a diagnosis of the company’s financial situation, an identification of the strategic issues and problems which Briggs & Stratton’s management needs to address, and your recommendations regarding what strategic actions the company should take.
2. What is your assessment of Briggs & Stratton’s competitive position in the small gasoline engine market and how good a job has B&S management done in developing strategic responses to the competitive challenges posed by Honda, other Japanese engine manufacturers, and Tecumseh?
3. What strategic issues does Briggs & Stratton need to address going into 1995? What do you recommend B&S do in response to each of these issues? Please justify your answer with appropriate analysis and persuasive arguments.
ASSIGNMENT QUESTIONS
4. What are the strategically relevant economic and business characteristics of the outdoor power equipment industry?
5. What is competition like in the small gasoline engine business? What competitive forces are strongest? Weakest?
6. What driving forces are at work to alter the competitive landscape in the outdoor power equipment business as of 1995?
7. Is being a small gasoline engine manufacturer an attractive position to compete from in the outdoor power equipment business? What are the key factors for success?
8. What is your assessment of Briggs & Stratton’s strategic situation? What strengths, weaknesses, opportunities, and threats do you see?
9. What actions do you recommend that Briggs & Stratton take to ensure that the company remain the world leader in small gasoline engines on into the 21st century?
TEACHING OUTLINE AND ANALYSIS
10. What are the stand-out economic and business characteristics of the outdoor power equipment industry? What’s this industry like?
Given the different roles and positions of the gasoline engine producers, the makers of outdoor power equipment, and the retailers of outdoor power equipment, there’s some value in taking about 5-10 minutes of class time to paint a picture of what the industry is like. Several economic and business characteristics stand out:

·10 Industry size—$7.5 billion
·11 Stage in life cycle—mature
·12 Very subject to both seasonal and cyclical influences
·13 Competition is becoming more globalized
·14 Segmented by components manufacturers, finished goods manufacturers, retailers
·15 Components account for 47% of industry value chain
·16 Backward vertical integration into the production of engines has been attempted by only two OPE manufacturers—Honda and Lawn-Boy
·17 Honda is the only engine manufacturer that has attempted forward vertical integration into lawn mower assembly
·18 Attrition and consolidation of manufacturers of outdoor power equipment (from 80 competitors in 1970s to 25 makers of lawn mowers and 15 makers of garden tractors in 1995).
·19 A bigger fraction of OPE items is being sold in home centers, garden centers, and large retail chains (Wal-Mart, Sears, Home Depot, Lowe’s, etc.) which have greater bargaining leverage with manufacturers. The 5 largest retailers account for 50% of all OPE sales.
·20 Scale economies and experience curve effects are sizable, especially in making small gasoline engines.
·21 Engines are biggest cost item in OPE (see case Exhibit 6).
·22 Industry profit margins are thin (see case Exhibit 7).
11. What is competition like in the small gasoline engine business? Which competitive forces are strongest/weakest?
Because this case is focused on Briggs & Stratton—a maker of small gasoline engines, we think the five-forces model should have gasoline engine manufacturers in the center box, not the makers of OPE goods. (A five-forces model of competition among the makers of gasoline engines is different than a five-forces model of competition among the manufacturers of OPE because the suppliers, manufacturers, and buyers are not the same—see Figure 1).
If students really understand the OPE industry value chain, they are less likely to get confused in doing a sound analysis of this case from the perspective of Briggs & Stratton (which clearly is a supplier to the makers/assemblers of finished OPE products). You’ll probably need to stress this early on because many students are prone to do a five-forces analysis like item B in Figure 1, which lessens their understanding of the competitive pressures on Briggs & Stratton.
Figure 1 A Comparison of the Five-Forces Model for Gasoline Engine Manufacturers with the Five-Forces Model for OPE Manufacturers
A. Five-Forces Model for Small Gasoline Engines

Substitutes for Gasoline Engines
âSuppliers of Engine Parts
and Components
à
Rivalry Among
Manufacturers of Small Gasoline
Engines
ß
Makers of
OPE Goods
ßOPE
Retailers ß
Consumers of
OPE Products
áThreat of Entry into
Gasoline Engine Manufacture
B. Five-Forces Model of Competition Among OPE Producers
Substitutes for OPE Products
âSuppliers of
Engine and other
Components
àRivalry Among
OPE Producers and
Assemblers
ß OPE Retailers
ßConsumers
of OPE
Productsá
Threat of Entry into OPE
Manufacture
Competition from substitutes
·23 Not a strong competitive force; electric motors and two-cycle gasoline engines (like on chain saws, blowers, and trimmers) are not really acceptable substitutes for small gasoline engines. Electric-powered lawn mowers and other electric-powered OPE products do not appear to have a sizable market share—but improving technology (especially for battery-powered OPE products) and tougher environmental restrictions could, in later years, strengthen competition from substitutes.
Threat of entry
·24 Barriers are relatively high for start-up entry.
·25 Most likely entrants into U.S. market are foreign producers already in the business and looking to grow by capturing a portion of the U.S. market. The entry barriers for foreign firms are a function of (1) exchange rates, (2) ability to hurdle the barrier of name recognition (easy for Honda because its name is very well-known, but may be hard for other foreign producers), and (3) ability to create some basis for competing against B&S and others on their home ground.
Power of suppliers to the engine manufacturers
·26 A moderately strong competitive force since their components are essential, but there may be enough suppliers of each part/component that no one supplier has a big impact (data in case is not clear on this point).
Power of customers

·27 A very strong competitive force since there are comparatively small number of finished good manufacturers, all of whom purchase engines by the tens of thousands. Winning the contract to supply Toro or Snapper is a big factor in a company’s revenue stream, since a single customer may account for 5 to 35 percent of total sales.
·28 Customer leverage over engine suppliers is aided by the flat demand for engines and finished goods. Finished goods manufacturers may well prefer to multiple source engines—use different brands for different models to increase leverage and the threat of switching.
·29 However, customers may incur some switching costs in shifting engine suppliers because one manufacturer’s engine may not be readily substitutable for the engine of another manufacturer without incurring some product redesign costs and without encountering some problems with the inventorying of parts and with dealers having to service/repair several brands of engines.
Rivalry among the engine manufacturers
·30 Competition among rival engine producers is very strong, despite the fact that B&S is “The General Motors of small gasoline engines.” This is mainly because of the flat demand for OPE and thus the lack of growth in the market for small gasoline engines. A mature/stagnant market typically intensifies the battle for market share.
·31 The key weapons of competitive rivalry are
·32 price (finished goods manufacturers will naturally consider engines a big-ticket cost item and will shop around and bargain hard on price)
·33 easy-starting
·34 reliable performance and dependability (need for infrequent repairs)
·35 safety features
·36 engine-maker’s brand name recognition and image with consumers (Honda, B&S, and Sears Craftsman are probably the best-known names in small gasoline engines).
Conclusions: Far and away, the two strongest sources of competitive pressure are (1) the leverage of customers and their ability to switch over to the engines of rival manufacturers and (2) the competitive rivalry among the makers of small gasoline engines.
There’s some merit in taking a few minutes of class time to develop the picture of competition in the larger OPE industry because there is pretty fierce rivalry building among OPE manufacturers plus there’s growing bargaining power on the part of OPE retailers.
Rivalry among OPE manufacturers
The competitive rivalry among the sellers of OPE has intensified dramatically in the last ten years. The number of OPE finished goods producers has declined from approximately 80 in the 1970s to 25 manufacturers of walk-behind mowers in 1995; the top four producers account for approximately 70% of OPE production. To sustain their competitive positions, most manufacturers of OPE have pursued either low-cost or differentiation. Murray Ohio very likely lost its exclusive contract with Wal-Mart because its prices and costs were above industry-leader, MTD. Toro, Snapper, and Troy-Bilt have done a good job of differentiating their product line from the private-label OPE brands being marketed by chain retailers. Clearly, all OPE manufacturers would be on the lookout for opportunities to buy a high-quality gasoline engine at a lower price and would bargain aggressively with engine suppliers for better performance features, lower prices, and improved quality as avenues for (1) lowering their own costs and protecting their profit margins and (2) enhancing the differentiation of their products. Some might threaten to integrate backward into the manufacture of gasoline engines, but this is not likely to occur since none of the OPE producers use enough engines to make them in-house as cost effectively as they can purchase them from outside suppliers like B&S, Tecumseh, and the Japanese producers.
The growing bargaining power of OPE retailers
Retailers, such as Wal-Mart, Sears, and Home Depot, have significantly increased the price and cost pressures on the makers of outdoor power equipment. The five largest retailers of OPE products account for approximately 50% of all OPE sales. Large discounters, mass merchandisers, and home centers have considerable leverage in their negotiations with the OPE manufacturers because of the volume pulled through these channels.
Locally-owned hardware stores and garden centers are relatively weak bargainers since they typically have low sales volumes and stock only one brand; small retailers often serve as the local franchised dealer for a particular OPE brand. Because manufacturers want to attract and keep loyal dealers for their products, they often agree to grant an exclusive dealership to a retailer (or to several retailers if the local market is big enough to accommodate multiple dealers); this limits the ability of a retail dealer to switch to the brand of another manufacturer if that manufacturer already has a good local dealer.
Hence, while large retailers of OPE products have considerable leverage in bargaining terms and conditions with OPE manufacturers and may exert a credible threat to abandon stocking one manufacturer’s brand for another brand, small OP retailers are typically in a relatively weak bargaining position.
12. What driving forces are operating to change the competitive landscape of the OPE industry?
There are several driving forces acting to intensify competition in the OPE industry:
·37 The growing role of large retailers in retail distribution channels (as described above) is putting more pressure on OPE producers to be very price competitive—which, in turn, is putting pressure on OPE producers to find ways to drive costs out of their business and to be hard bargainers in purchasing engines and other components for the OPE products.
·38 Consolidation among the OPE manufacturers and assemblers is resulting in a smaller number of stronger and more visible industry participants.
·39 Growing consumer preferences for value-priced OPE products—that is, good quality products that can be bought at attractively low prices.
·40 More stringent regulations regarding safety, noise, and air pollution.
·41 The rising value of the Japanese yen—puts a damper on Japanese-produced OPE products being imported into the U.S. (because a stronger yen makes Japanese-made goods more expensive) and prompts the Japanese OPE manufacturers to consider locating plants in the U.S. to supply the U.S. market (as Honda did by constructing its N.C. plant). Will the other Japanese engine producers and OPE producers follow Honda’s lead? If they do, competitive pressure will surely intensify.
13. In light of the prevailing competitive pressures and driving forces, how attractive is the OPE industry from Briggs & Stratton’s perspective?
The answer here has to be “very attractive, but less so than in years past.” With over 90 percent of its revenues coming from the sale of small gasoline engines and engine parts, B&S’s future is strongly tied to continuing its industry leadership. In this sense, the industry is definitely “attractive” to B&S and it is out of the question for the company to consider abandoning or even de-emphasizing the industry. On the other hand, B&S’s profit prospects have to be getting dimmer. Price competition is heating up at the same time that quality competition is on the rise and that environmental and performance features are being looked at more closely. B&S probably has high labor costs and rivals seem capable of matching (or beating?) B&S on engine quality and engine performance. B&S has little choice but to “slug it out.”
As you bring out these points during the discussion, you can begin to compile a list on the blackboard summarizing the attractive factors and the unattractive factors.
Factors Which Make the OPE Industry Attractive to Briggs & Stratton
·42 It’s the company’s core business and livelihood.
·43 General lack of backward vertical integration among the finished product manufacturers (they depend heavily on key components made by others such as B&S).
·44 Moderately high barriers to entry into the manufacture of small gasoline engines (why would a lawnmower firm want to integrate backward into gasoline engine production?). Entry barriers include the scale economies associated with low-cost manufacture, the capital requirements of building a modern plant, possible experience curve effects in developing the skills and know-how to make a reliably performing gasoline engine, and the ready availability of gasoline engines from existing sources.
·45 A well-known supplier like B&S has a degree of bargaining leverage with end-product assembly firms because
·46 there are fewer suppliers of engines than there are finished goods manufacturers (plus B&S is a large, well-known company with an established brand name).
·47 there may be significant switching costs in changing engine brands (especially shifting from B&S engines to an “off-brand” or to a house/private-label brand made by a supplier with unproven capability).
·48 A low-cost producer of high-quality engines can win sales orders away from rivals.
Factors Which Make the OPE Industry Less Attractive
·49 Demand growth prospects are flat; there is little potential for selling many more lawn mowers in the U.S., although growth prospects elsewhere, are probably OK. About 75% of total market for lawn mowers is for replacement.
·50 Price competition among small gasoline manufacturers is likely to intensify.
·51 Loss of 1 or 2 major customers can really throw a wrench into sales and profits.
·52 Potentially higher costs to achieve regulatory compliance.
·53 What if the value of Japanese yen falls? There’s nothing attractive about having the company’s competitiveness held hostage to the exchange rate between the yen and the dollar.
·54 What if Suzuki, Kawasaki, or Yamaha decide to follow Honda’s lead and locate a plant in U.S. to make small gasoline engines?
14. How do Honda’s action and strategy affect Briggs & Stratton? What is Honda’s strategy in small gasoline engines and lawn mowers in the U.S. market?
It is essential to the consideration of B&S’s strategy that there be a clear understanding of Honda’s strategy and moves. Thus, somewhere on your overall blackboard plan you should have a spot to record the Honda strategy. The class discussion should bring out the following points:
·55 Honda has stated its intent to become a leader in the powered products field.
·56 Honda prefers to sell OPE products, not engines to power OPE products. However, Honda does have a strategic interest in selling Honda engines to replace worn-out B&S engines because this enhances the quality and desirability of the Honda engine in the mind of the user and could cause the user to switch to Honda-brand OPE products on future purchases. From data in the case, it appears that Honda sells about 25,000 engines as replacements in the U.S. (since it makes 200,000 engines annually and sells about 175,000 mowers in the U.S.).
·57 Honda has developed a broad line of OPE products—pumps, electric generators, outboard motors, garden tillers, lawnmowers, snow throwers, lawn tractors, and so on.
·58 Honda enjoys an excellent reputation with U.S. consumers and its name is more widely known (Honda is a “household word”) than is Briggs & Stratton insofar as consumers are concerned.
·59 Honda engines are very dependable, lightweight, technically advanced, and safe, and are supported by “heavy” R&D expenditures.
·60 Honda makes extensive use of advertising and promotion (employing a “pull” strategy through its network of established OPE distributors and retailers).
·61 The Honda strategy in lawnmowers/OPE has already been successful in the U.S. motorcycle and automobile markets.
·62 Honda prices its products competitively (though its products are not positioned on the low, budget-priced end of the market).
·63 Honda has considerable financial resources to support its strategy—its sales and profits dwarf those of Briggs & Stratton (see case Exhibits 5 and 13). For some financial performance statistics on Honda, see Table 1 of this teaching note. As you can see from Table 1, while Honda is big, its profitability has been quite mediocre during the 1990s. The company’s margins are razor thing. The rising value of the Japanese yen (which causes Honda products made in Japan and exported to foreign markets to be less price competitive) is partly responsible for its rather dismal (by U.S. standards) return on assets and return on equity.
Table 1 Honda’s Financial Performance 1985, 1990-1994
1994 1993 1992 1991 1990 1985
Net profit margin 1.6% 0.6% 0.9% 1.8% 2.1% 4.9%Return on assets 1.8% 0.8% 1.2% 2.6% 3.2% 8.9%Return on equity 5.3% 2.3% 3.4% 7.0% 8.3% 19.0%Sales per employee $430,000 $392,000 $367,000 $357,500 $342,000 $212,500Source: Calculated from case Exhibit 14
·64 Whereas B&S competes against Honda in small gasoline engines to some degree, Honda’s primary head-to-head competitors are other lawn mower makers and sellers (Toro, Snapper, Sears, Murray, MTD, and AYP).
·65 There’s every reason for Honda to push the Honda name and stress the dependability of its engines in media ads (B&S, of course, focuses the bulk of its sales/marketing efforts on winning orders from OPE producers and assemblers).
The key thing to get out in front of the class is that Honda’s primary competitive thrust is trying to beat out the U.S. makers of OPE products—Toro, Snapper, Sears, Murray and so on. It is really not attacking B&S head-on in small engines.
This point should lead to a pivotal question in the whole case: Where do the U.S. OPE makers stand in this battle? If Honda is really out after their market share, then whose engines do they want on their products? Why would they want to put Honda engines on their OPE products and then turn around and compete against Honda in the OPE market?
In our view, the long-term strategic interest of Toro, Snapper and other leading U.S. makers of OPE equipment (private label makers excepted) is to line up on the side of B&S, join forces with B&S to get the very best possible engine from B&S to go on their OPE products, and then, together, try to beat Honda.
15. Given the preceding analysis, what are the key success factors in the engine segment of the outdoor power equipment industry?

We see three stand-out KSFs here:
·66 Being able to achieve a competitive level of costs in producing engines.
·67 Making an engine that delivers good performance, is reliable, is durable, and starts easily.
·68 Earning a favorable reputation with consumers—consumers have got to be satisfied with the engine on an OPE product; otherwise they are likely to switch OPE brands on future purchases and the OPE manufacturer’s reputation will suffer.
16. What is your assessment of B&S’s strengths, weaknesses, opportunities, and threats?
Strengths
·69 Leader in engine segment of industry—75% market share in U.S. and 50% market share worldwide.
·70 Brand recognition among end-users (a recent survey indicated 72% of end-users preferred B&S engines to power their lawn & garden equipment).
·71 Long-term relationships with buyers (70% of engine sales were from negotiated contracts).
·72 Low-cost manufacturing skills—inventory reduction system, materials requirement planning.
·73 Efficient use of capital—EVA program.
·74 New low-cost plants located in southern U.S.
·75 Broad product line.
·76 Successful use of strategic alliances to broaden product line.
·77 Doesn’t plan to integrate forward into OPE assembly to compete against its present customers.
·78 Innovative new products—Quantum, Vanguard, and Diamond lines.
·79 High-quality products—use of quality circles, statistical process control.
·80 Broad network of service centers (25,000 in U.S. and 7,000 overseas).
·81 Market leader in automobile ignition systems and locks.
Weaknesses
·82 Current labor cost disadvantage with Japanese and Tecumseh.
·83 Poor relations with union—failure to agree to productivity improvement processes.
·84 Weak market share in industrial engine segment of industry.
·85 Weaker brand name recognition than Honda.
·86 Not vertically integrated forward (a weakness vis-à-vis Honda).
Opportunities
·87 Expand more internationally.
·88 Offer more industrial engines—only 15% of B&S engine sales are for industrial applications.
·89 Attempt to increase sales to customers who source their engines from several suppliers.
Threats

·90 Phase I and Phase II clean air regulations will drive up the cost of B&S engines and therefore drive up the price of low-end and medium-quality OPE—resulting in less of a price differential between B&S and Honda engines and finished goods using these engines.
·91 Success of Tecumseh and Japanese engine manufacturers depend on their winning orders to supply more OPE assemblers (this means taking market share away from B&S).
·92 Imports to U.S. from Japan have stabilized, but Honda has increased annual engine production in its Sweponsville, NC production facility from 10,000 units in 1983 to 200,000 units in 1995.
·93 Establishment of U.S. manufacturing bases by Suzuki, Yamaha, and Kawasaki.
17. What is your assessment of Briggs & Stratton’s financial condition and recent financial performance?
Tables 2 through 6 present an assortment of financial performance statistics for Briggs & Stratton—a percentage composition analysis of the company’s income statement, selected financial ratios, and compound average growth rates. These same calculations appear on the STRAT-TUTOR software for student analysis and interpretation. Inspection of these data, coupled with careful review of case Exhibit 2 through 5, yield the following assessment and diagnosis:
Table 2 Percent Composition of Briggs & Stratton’s Income Statements, 1992-1994
1994 1993 1992
Net sales 100.0% 100.0% 100.0%Cost of goods sold as a percent of net sales 79.3 81.3 83.3Gross profit margin 20.7 18.7 16.7Engineering, selling, general, and administrative expenses as a percent of net sales
7.4 7.3 7.6
Operating profit margin 13.3 11.4 9.1Interest expense as a percent of net sales 0.7 1.0 1.1Other income (expense) as a percent of net sales 0.5 (0.3) (0.4)Pre tax profit margin 13.2 10.0 7.7Net income as a percent of net sales (net profit margin) 5.4% 6.2% 4.9%Source: Calculated from case Exhibit 2.
Table 3 Selected Financial Performance Ratios for Briggs & Stratton, 1993-1994
1994 1993
Return on assets 9.0% 10.7%Return on shareholders’ equity 17.3% 19.5%Current ratio 2.34 2.23Long-term debt-to-assets ratio 0.096 0.114Long-term debt-to-equity ratio 0.186 0.208Times interest earned ratio 19.1 11.5Inventory turnover 23.0 24.7Fixed assets turnover 4.5 3.9Total assets turnover 1.65 1.74Source: Calculated from data in case Exhibits 2 and 3.
Table 4 Briggs & Stratton’s Performance by Business Segment, 1990-1994
1994 1993 1992 1991 1990
Operating income as a percent of sales revenues
Engines and parts 13.3% 12.0% 9.4% 6.9% 6.6%Locks 14.6 1.8 6.1 3.6 7.1
Operating income as a percent of assets*
Engine and parts 34.0% 27.9% 19.9% 14.1% 13.4%Locks 27.4 2.7 9.9 5.0 12.7
*Does not include unallocated assets—see case Exhibit 4.Source: Calculated from data in case Exhibit 4.
Table 5 Briggs & Stratton’s Growth Rate Performance, 1985-1994
Compound Average Growth Rate
1985-1994 1990-1994
Net sales 6.7% 6.4%Net income 8.5 18.6Net income per share of common stock 8.5 18.6Dividends per share of common stock 1.3 3.0Total assets 7.3 9.8Shareholders’ equity investment 4.0 10.4Source: Calculated from data in case Exhibit 5.

Table 6 10-Year Financial Performance Statistics for Briggs & Stratton, 1985-1994
1994 1993 1992 1991 1990 1989 1988 1987 1986 1985
Gross profit margin
20.7% 18.7% 16.7% 13.9% 13.2% 6.8% 12.6% 14.2% 16.7% 15.5%
Net profit margin 5.4% 6.2% 4.9% 3.8% 3.5% -2.3% 3.3% 3.4% 4.6% 4.7%Return on assets 9.0% 10.7% 8.1% 6.5% 6.6% -3.6% 5.9% 5.9% 7.8% 8.1%Return on equity 17.3% 19.5% 16.5% 12.8% 13.0% -7.7% 10.0% 9.0% 11.6% 11.8%Sales/employee (in thousands)
$149.0 $143.3 $133.6 $131.3 $125.5 $119.8 $93.0 $91.1 $89.9 $87.5
Dividend payout 37.2% 35.0% 44.9% 63.5% 65.3% 210% 76.6% 87.0% 67.8% 69.0%Source: Calculated from data in Case Exhibit 5.
·94 The company’s performance the last three years (1992-1994) have been the company’s strongest since 1985, an indication that the company’s actions to combat the threat from Japanese rivals and Tecumseh are having a bottom-line payoff.
·95 The company has a very strong balance sheet—very little long-term debt ($75 million), a low debt-assets ratio, a low debt-equity ratio, a strong times-interest-earned ratio.
·96 Revenue growth is moderate, averaging 6-7% annually since 1985.
·97 Since 1990, the company has generated ample internal cash flows to cover new capital expenditures (the provision for depreciation expense has exceeded capital investment each year of the 1990s—see case Exhibits 4 and 5). While this wasn’t the case during the last half of 1980s (see case Exhibit 5), the company’s relatively heavy capital investment program still did not result in a burdensome amount of long-term debt.
·98 Only recently has earnings per share grown to the point where management and the board of directors felt it was prudent to increase the dividend. The dividend remained at $1.60 per share from 1985 through 1992.
·99 During the 1990s, the engines and parts business segment has outperformed the ignition locks business (see case Exhibit 4 and Table 4). Lock sales and profits have been up and down, with 1994 being the best year of the 1990s for lock sales and profits.
·100The company’s profit margins have exhibited an upward trend during the 1990s.
·101Overall, the company’s financial condition seems sound and relatively stable. Its approach to financial management is conservative. The company has $221 million in cash and cash equivalents going into 1995, a substantial cash hoard with which to protect and strengthen its position as the world leader in small gasoline engines.
The SWOT analysis and the financial assessment both indicate that Briggs & Stratton is in a strong position to retain its leadership position in gasoline engines. Honda, while formidable, has important strategic interests outside OPE and lawn mowers and has little to gain by launching an aggressive assault on B&S’s position in the U.S.—its North Carolina plant is not big enough to take substantial market share away from B&S. Yet, B&S cannot afford to be complacent. The company, under Frederick Stratton’s leadership, has parried the Japanese threat to dominate the gasoline engine and OPE markets, but the long-term battle is by no means over.
18. What should Briggs & Stratton do now? How can its strategy be improved? What actions should the company take to solidify its ability to be the world leader in small gasoline engines on into the 21st century? What should the cornerstones of its 5-year strategic plan be?
Our thoughts as to what to consider and what to do are as follows:

·102Continue to emphasize low-cost manufacturing to prevent erosion of market share. B&S management should attempt to lower costs even further through careful examination of the company’s value chain. It is unlikely that costs can be eliminated from upstream value chains since B&S outsources very few engine components. Brigg’s management could utilize activity based costing (ABC) to identify and eliminate nonvalue adding executional cost drivers from the operations component of the company value chain. ABC could potentially disclose linkages between various components of the company value chain where costs in one segment of the chain could be reduced by restructuring processes in another segment of the chain.
·103B&S may have to consider movement into downstream value chains if competitive rivalry in the industry becomes more fierce. Many finished goods manufacturers have already eliminated costs associated with wholesalers in downstream chains both to reduce outbound logistics costs and to eliminate wholesaler profit margins. B&S has currently stated that it does not intend to integrate forward into finished goods assembly. It does not appear that B&S must break this vow at this time. However, forward vertical integration may be an option in the future.
·104B&S should attempt to increase market share in the industrial applications segment of industry. The current weak U.S. dollar could give Briggs an advantage in obtaining sales abroad.
·105Briggs & Stratton management should consider related diversification. Briggs & Stratton’s small engine business holds a dominant position in a mature industry. Opportunities for the company to increase shareholder value in this industry are limited. Shareholder value could be increased through the acquisition of businesses that could share costs along segments of the value chain or that could benefit from skills transfer where B&S has achieved core competencies. Both the engine business and the ignition and lock subsidiary have excellent cash flows that could be used to invest in new related businesses. A review of case Exhibit 3 indicates that in 1994, B&S has a cash balance of $221 million and long-term debt of only $75 million; case Exhibit 2 indicates that B&S earned almost $9 million from interest on cash balances. If projected capital spending in engines and locks continues to be less than annual depreciation charges, then the company has the financial resources to make an acquisition and expand into a related business. For instance, a rough estimate of Briggs & Stratton’s cash flow in 1994 can be developed as follows:
Net income in 1994 $69,923,000Less 1994 dividend payments to shareholders 26,035,200Plus 1994 depreciation expenses 42,950,000
$86,837,800Less 1994 capital expenditures for plant and equipment 40,804,000Cash available for other uses $46,033,800
19. What kind of performance can Briggs & Stratton expect over the next several years?
Students ought to be strongly encouraged to do financial projections whenever the case data permits. There’s enough information in the Briggs case to do some rough estimates of the company’s profit potential, given certain basic assumptions about revenue growth; the company’s gross profit margin; its engineering, selling, general, and administrative expenses; and its interest expenses. Below is a set of “what-if” projections that assumes 5% annual increases in revenue; a 20% gross profit margin; engineering, selling, general, and administrative expenses that average 7.50% of sales revenues, and continuing annual interest expenses of $10,000,000 as follows:
What-If Assumptions
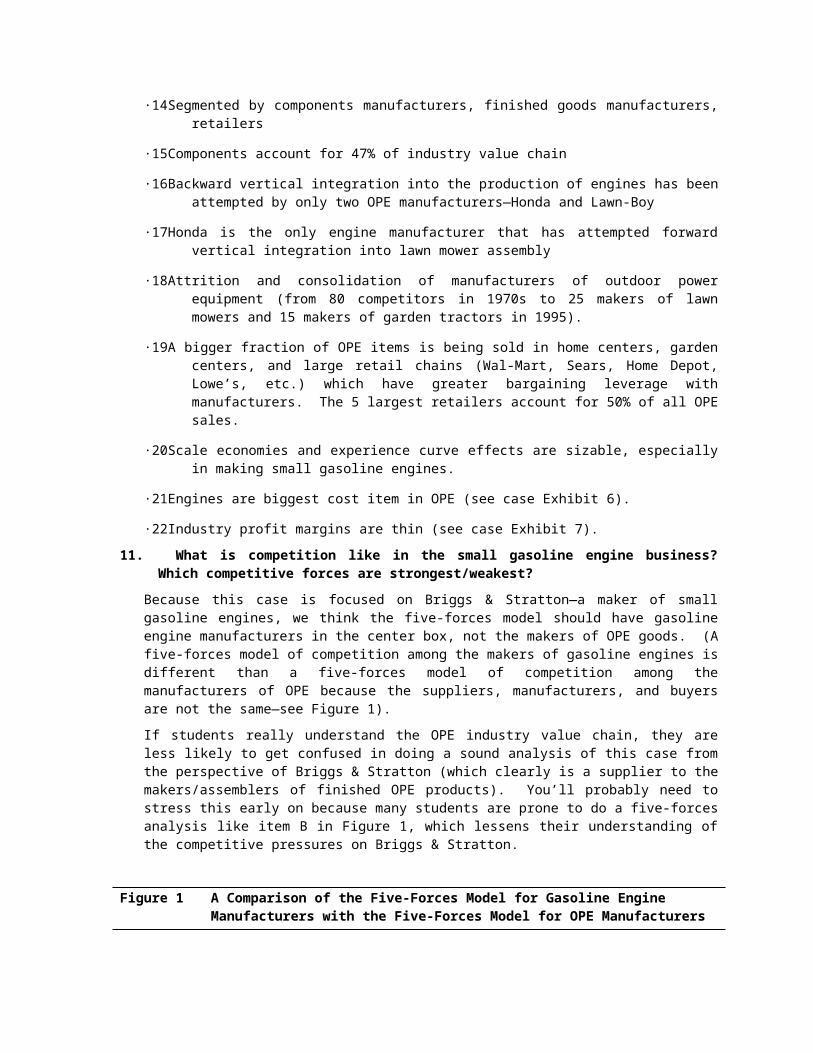
1995 1996 1997 1998 1999
Revenue Growth 5.00% 5.00% 5.00% 5.00% 5.00%Gross Profit Margin* 20.00% 20.00% 20.00% 20.00% 20.00%Engineering, Selling, General, and Administrative Expenses as a percent of Sales*
7.50% 7.50% 7.50% 7.50% 7.50%
Interest Expense (in thousands of $) $10,000 $10,000 $10,000 $10,000 $10,000*For historical percentages, see Table 2
Revenue and income projections based on these assumptions are presented in Table 7. A what-if model like this has been programmed on the STRAT-TUTOR case preparation exercise for students to use in developing their own projections. They may, of course, enter growth rates above or below 5%, try different gross margin percentages, different expense ratios for engineering, selling, general, and administrative expenses, and different levels of interest expenses. So their what-if projections can turn out differently than those in Table 7. The important thing, however, is for students to attempt making some projections and to realize that Briggs & Stratton’s future profit prospects are indeed very modest.
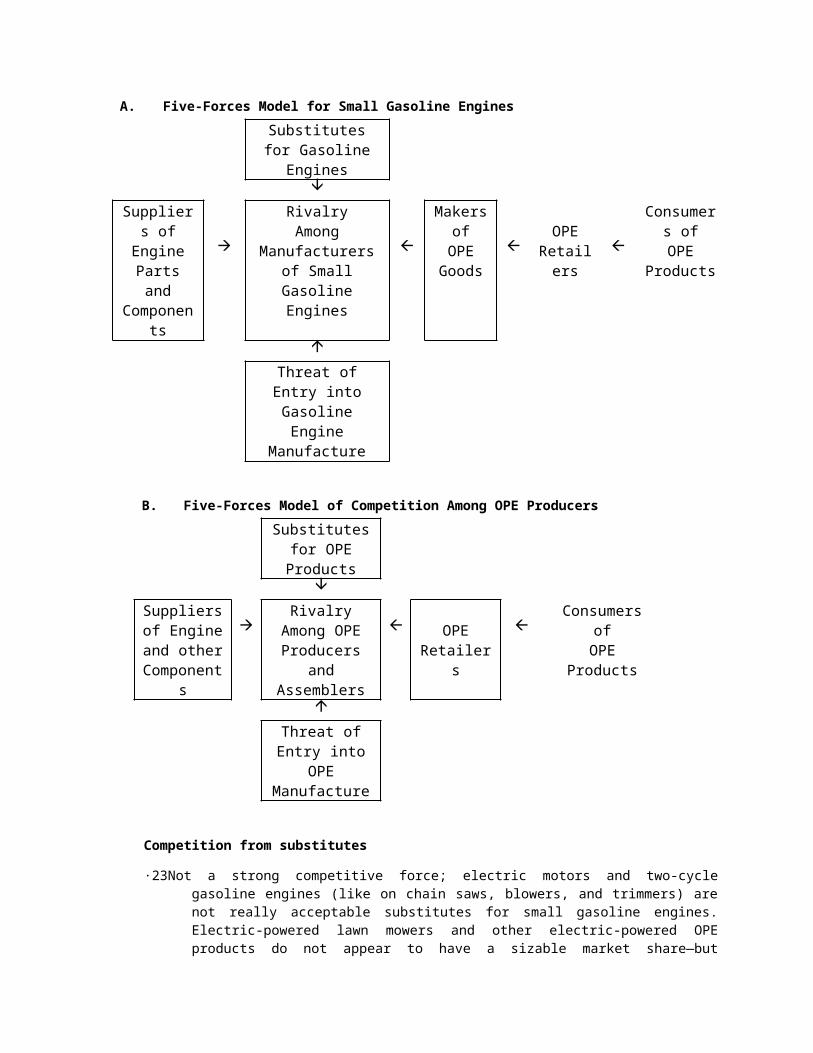
Table 7 Revenue and Income Projections for Briggs & Stratton Corporation,
1995-1999 (in thousands of dollars)
1995 1996 1997 1998 1999
Net Sales $1,349,793 $1,417,282 $1,488,147 $1,562,554 $1,640,682Cost of Goods 1,079,834 1,133,826 1,190,517 1,250,043 1,312,545Gross Profit on Sales 269,959 283,456 297,629 312,511 328,136Engineering, Selling, General and Administrative Expenses 101,234 106,296 111,611 117,192 123,051Income from Operations 168,724 177,160 186,018 195,319 205,085Interest Expense 10,000 10,000 10,000 10,000 10,000Income Before Taxes 158,724 167,160 176,018 185,319 195,085Income Taxes 55,553 58,506 61,606 64,862 68,280Net Income $103,171 $108,654 $114,412 $120,458 $126,805


![Classic 350 Owner Manual[1]](https://static.fdocuments.in/doc/165x107/547feb4f5806b5d15e8b4968/classic-350-owner-manual1.jpg)